
Submitted:
11 June 2025
Posted:
12 June 2025
You are already at the latest version
Abstract
Background/Objectives: Approved in 2015 for radioiodine-refractory differentiated thyroid carcinoma (RR-DTC), the multikinase inhibitor lenvatinib has demonstrated substantial efficacy; nevertheless, severe adverse effects, intrinsic resistance or development of acquired resistance often limits its use. A novel approach to potentially overcome therapy resistance of tumors is the administration of antibiotics that target mitochondrial metabolism. We therefore combined lenvatinib with the tetracycline-class antibiotics tigecycline and eravacycline in lenvatinib-resistant DTC cells and explored the underlying mechanism of action. Methods: Cell viability was quantified after treatment with either single agents or combination therapies consisting of lenvatinib with tigecycline or lenvatinib with eravacycline. Baseline oxidative metabolism and drug-induced changes in oxygen consumption rate were measured using the Seahorse XFe96 Analyzer. Three-dimensional spheroid cultures were used to better mimic the in vivo tumor milieu. Apoptosis was assessed by caspase-3/7 activity, and expression of apoptosis-related proteins was elucidated by immunoblotting. Results: Combining lenvatinib with tigecycline or eravacycline synergistically reduced the 2D and 3D cell viability of lenvatinib-resistant DTC cells. Both combination therapies markedly impaired mitochondrial respiration, accompanied by down-regulation of anti-apoptotic Bcl-2 family members, activation of caspase-3/7, and cleavage of Poly (ADP-ribose) polymerase (PARP), which are hallmarks of apoptosis. Conclusion: Our study provides evidence of the combination of lenvatinib with mitochondria-targeting antibiotics as a promising strategy to overcome resistance in DTC by impairing mitochondrial function and promoting apoptotic cell death.
Keywords:
DTC
; lenvatinib resistance
; multikinase inhibitor
; combinational treatment
; antibiotics
; mitochondrial impairment
; apoptosis
1. Introduction
Thyroid carcinoma (TC) is the most prevalent endocrine malignancy accounting for approximately 568,000 new cases and over 44,000 deaths worldwide, according to GLOBOCAN. The global incidence rate for TC is three times higher in women than in men [1]. The incidence of TC has increased markedly in recent decades, largely due to widespread use of sensitive imaging techniques, which have led to enhanced detection of asymptomatic and small tumors [2,3] Differentiated thyroid cancer (DTC), which arises from the follicular cells within the thyroid glands, is the most common subtype of TC. It accounts for approximately 90-95% of all TC and includes the papillary (PTC), follicular (FTC) and oncocytic (also known as Hürthle) [2,3]. Surgery is curative in most cases of well-differentiated TC and radioactive iodine (RAI) treatment after surgery improves overall survival in patients with high risk [2]. However, a subset of patients develops progressive disease that becomes refractory to RAI therapy. In this case, the multi-kinase inhibitor lenvatinib has been approved. Although lenvatinib exhibits favourable anti-tumor activity and extends progression-free survival, progressive disease is common. In addition, severe adverse effects frequently occur, often necessitating dose reductions or treatment breaks [4,5,6,7,8]. Given the limitations of current therapies, there is a need for novel, more efficient and better-tolerated treatment options for DTC patients.
There is growing evidence that changes in mitochondrial metabolism play a crucial role in the development and progression of various tumor entities. Mitochondrial reprogramming has been linked to uncontrolled cell proliferation, as cancer cells require more energy and building blocks than healthy cells [9]. Additionally, increased mitochondrial activity and oxidative phosphorylation (OXPHOS) have been associated with resistance to therapies like tyrosine kinase inhibitors (TKIs) [10,11]. Therefore, targeting mitochondrial function is considered a promising approach to overcome therapy resistance.
The endosymbiotic hypothesis suggests that mitochondria originated from ancestral bacteria. Therefore, several antibiotics affect these organelles by targeting mitochondrial components. Certain antibiotics, particularly tetracyclines, have been shown to disrupt mitochondrial function by inhibiting mitochondrial biogenesis and increasing reactive oxygen species (ROS) levels, leading to metabolic stress and anti-proliferative or pro-apoptotic effects [12,13,14]. Tigecycline, a representative of the tetracycline class, has demonstrated anti-cancer properties across various tumor entities by impairing cell proliferation, disrupting aerobic metabolism, inducing mitochondrial dysfunction and cell cycle arrest, and sensitizing cancer cells to chemotherapeutic agents [13,14]. Eravacycline, another synthetic tetracycline analogue, has been associated with a better toxicity profile compared to tigecycline, particularly regarding gastrointestinal side effects. Although its anti-cancer effect has not yet been investigated, the mitochondrial targeting potential and improved tolerability makes it an interesting candidate for combinational approaches in cancer therapy [15,16].
Combination therapies have gained increasing interest in oncology due to their potential to enhance therapeutic efficacy, overcome resistance and reduce drug-related adverse events by lowering the required doses. Given the limited efficacy of lenvatinib in advanced TC, novel treatment strategies are urgently needed [17]. Considering the role of mitochondria in tumor progression and drug resistance, we hypothesized that combining lenvatinib with mitochondrial targeting antibiotics such as tigecycline or eravacycline could potentiate anti-tumor effects and overcome presumed resistance mechanisms in DTC.
2. Materials and Methods
2.1. Cell Lines
K1, TPC-1, FTC-133 and Nthy-Ori 3.1 cells were obtained from Sigma-Aldrich (Missouri, USA), whereas TT2609-C02 cells were purchased from the German Collection of Microorganisms and Cell Cultures GmbH (DSMZ, Braunschweig, Germany). For the cultivation of K1 and FTC-133, DMEM w/o L-glutamine (Sigma-Aldrich, Missouri, USA) was used. For K1, media was supplemented with Ham’s F12 (Sigmal-Aldrich, Missouri, USA), MCDB 105 (Sigma-Aldrich, Missouri, USA), 2 mM L-glutamine (PAN Biotech GmbH, Aidenbach, Germany), 10% FCS (Sigma-Aldrich, Missouri, USA) and 1% Penicillin/Streptomycin (Pen/Strep, PAN Biotech GmbH, Aidenbach, USA). For FTC-133, DMEM was supplemented with Ham’s F12, 2 mM L-glutamine, 10% FCS and 1% Pen/Strep. TPC-1 and TT2609-C02 were cultivated in RPMI 1640 (PAN Biotech GmbH, Aidenbach, Germany). For TPC-1 cells, 10% FCS and 1% Pen/Strep was added, whereas for TT2609-C02 20% FCS, 1% Pen/Strep and 0.1% insulin-transferrin-selenite were supplemented. Nthy-Ori 3.1 were cultured in RPMI 1640 with sodium bicarbonate, supplemented with 2 mM L-glutamine, 10% FCS and 1% Pen/Strep. All cells were cultivated at 37°C with 5% CO2 and constant humidity. Before cell seeding, all culture flasks and multi-well plates (except for the Seahorse experiments) were coated with collagen G (0.001% in PBS, Sigma-Aldrich, Missouri, USA).
2.2. Compounds
Lenvatinib and tigecycline were obtained from Selleckchem (Houston, USA), whereas Eravacycline dihydrochloride was purchased from THP Medical Products (Vienna, Austria).
2.3. Cell Viability
Cell viability was determined using the Cell Counting Kit-8 (CCK8, Sigma-Aldrich, Missouri, USA). Cells were seeded in triplicates into a 96-well plate, stimulated 24 hours after seeding and incubated for 72 hours. For measurement, 5 µl of CCK8 reagent were added to each well containing 50 µl culture medium. After an incubation time of 2 hours, the metabolic activity was quantified via absorbance measurement at 450 nm on a Tecan Spark plate reader (Tecan, Grödig, Austria). Absorbance values were normalized to the mean absorbance of the untreated control (UTC). For IC50 determination, the equation log(agonist) vs. response – Variable slope (four parameters) in GraphPad prism 10.2.3 was used.
2.4. 3D Cell Culture Model
Cell viability of 3D spheroids was investigated using the CellTiter-Glo® 3D Cell Viability assay (CTG) from Promega (Wisconsin, USA) according to the manufacturer’s instructions. Cells were seeded in triplicates into a low-attachment 96-well U-bottom plate, centrifuged for 10 min at 350 g, stimulated 72 hours after seeding and incubated for 96 hours. For measurement, cells were equilibrated 30 min at RT, and 100 µl of CTG were added to each well containing 100 µl culture medium. The plate was shaken for 5 min at 450 rpm and further incubated for 25 min at RT in the dark. For quantification of the luminescence signal, the supernatant was transferred to a white 96-well plate and luminescence was recorded with an integration time of 10 ms on a Tecan Spark plate reader. Before CTG measurement, spheroid pictures were taken using an Olympus CKX53SF microscope (Vienna, Austria). Control values were set to 100%, whereas treated samples were normalized to the UTC.
2.5. Clonogenic Assay
For evaluation of long-term cell survival, cells were seeded into 6-well plates and treated with the respective compounds for 24 hours. After incubation, cells were trypsinized and re-seeded at a density of 5 x 10³ cells per well into a 6-well plate. After incubation for 5 days, attached cells were stained with crystal violet solution for 10 min at RT. After taking pictures with the ChemiDoc Imaging System of Bio-Rad (Hercules, USA), the dye was released by adding 500 µl SDS/EtOH dissolving buffer per well. Absorbance at 550 nm was measured with the Tecan Spark plate reader (Grödig, Austria). The mean value of the UTC was set to 100%. Samples were normalized to the UTC.
2.6. Caspase 3/7 Activity
For evaluation of apoptosis, the Promega Caspase-Glo® 3/7 Assay System was used. Briefly, cells were seeded in 96-well plates and stimulated 24 hours after seeding with mono- or combination therapy for 24, 48 and 72 hours. After an equilibration time of 20 min at RT, caspase substrate was added in a 1:1 ratio to each well and the plate was shaken for 2 min. After 30 min at RT, the luminescence signal was measured on a Tecan Spark plate reader, with an integration time of 10 ms. For normalization, the control mean was set to 1 and the treated samples were normalized to the UTC.
2.7. ATP Assay
For verification of the metabolic cell viability data, the Promega CellTiter-Glo® Cell Viability Assay was performed. Therefore, cells were seeded in 96-well plates, incubated 24 hours and stimulated for 24, 48 and 72 hours. CellTiter-Glo® Reagent was added to the cells according to the manufacturer’s protocol. Luminescence signal was recorded on a Tecan Spark plater reader with an integration time of 10 ms. Luminescence values were normalized to the mean luminescence signal of the UTC.
2.8. JC-10
For determination of the mitochondrial membrane potential, the mitochondrial membrane potential kit (JC-10) from Sigma-Aldrich (Missouri, USA) was used according to the manufacturer’s instructions. Briefly, cells were seeded, grown overnight and stimulated with mono- or combination therapy for 72 hours. JC-10 dye was diluted 1:100 in assay buffer A and 25 µl were pipetted into each well. After incubating for 60 min at 37°C in the dark, 25 µl/well of assay buffer B were added. Green fluorescence intensity was recorded at an excitation (ex) wavelength of 490 nm and an emission (em) wavelength of 525 nm. Red fluorescence was measured at ex = 540 nm and em = 590 nm with a Tecan Spark plate reader (Grödig, Austria). For calculation of the mitochondrial membrane potential, the following formula was used: (red fluorescence)/(green fluorescence). The mean control values were set to 100% and the treatments were normalized to the control.
2.9. Live Cell Imaging
Mitochondrial morphology was assessed using the MitoTracker Green FM from Invitrogen (Massachusetts, USA). Cells were seeded in ibidi-µslides (Ibidi GmbH, Martinsried, Germany) and grown overnight. After 72 hours of mono- and combination therapeutic stimulation, respectively, cells were washed with PBS and incubated at 37°C, protected from light, for 30 min with 200 µl/well MitoTracker Green FM (1:5,000). After another washing step with PBS, 200 µl/well of Hoechst 33342 (1:12,300, Thermo Scientific, Massachusetts, USA) were added per well. Cells were incubated for 5 min at RT in the dark, washed once with PBS, and 200 µl/well culture medium were pipetted into the slides. Images were obtained using a Zeiss LSM700 confocal microscope (Oberkochen, Germany) and image analysis was performed with the Zeiss Zen software.
2.10. Western Blot
Proteins were separated via SDS-PAGE, transferred to a nitrocellulose membrane and incubated with a primary antibody diluted in either 5% of BSA or 5% of milk powder in TBS-T overnight at 4°C: caspase 7 (1:1,000, 35,20 kDa), Bcl-xl (1:1,000, 30 kDa), Mcl-1 (1:1,000, 40 kDa), Bcl-2 (1:1,000, 28 kDa), PARP (1:1000, 116,89 kDa) and cleaved PARP (1:1,000, 89 kDa). Proteins were visualized using horseradish peroxidase (HRP) coupled secondary antibodies and ECL solution containing luminol. The following secondary antibodies diluted in 5% of BSA or milk powder in TBS-T were incubated with the membrane for 1 hour at RT: anti-rabbit IgG, HRP-linked and anti-mouse IgG, HRP-linked antibody (1:2,000) from Cell Signaling (Massachusetts, USA). Chemiluminescence was detected with the ChemiDoc Touch Imaging System (Bio-Rad, Munich, Germany) and the protein expression was quantified using stain-free technology and the Image Lab Software. For all quantifications, the protein expression was normalized to the respective protein load and to the mean control values.
2.11. Bioenergetic Measurements
For the metabolic characterization of DTC and non-tumorigenic cell lines, cells were seeded in XFe96/XF Pro cell culture microplates (Agilent Technologies, Santa Clara, US) with following densities: 10,000 (K1, TPC-1 and Nthy-Ori 3.1), 7,500 (FTC-133) and 15,000 (TT2609-C02) cells/well 24 hours prior to the analysis. For drug treatment determination, K1 cells were seeded at a density of 7,500 cells/well, incubated for 24 hours and treated with the drugs for 12 hours. On the day of the assay, cells were washed once and 180 µl/well assay medium (Seahorse XF RPMI) supplemented with 10 mM glucose, 1 mM sodium pyruvate and 2 mM glutamine were added. Cells were then incubated for 1 hour at 37°C in a non-CO2 incubator. For the XF Cell Mito Stress Test, basal oxygen consumption rates (OCR) were measured, followed by sequential injections of the ATP synthase inhibitor oligomycin (2.5 µM; port A), the uncoupling agent fluoro-carbonyl cyanide phenylhydrazone (FCCP, 1 µM; port B), and a combination of the complex I inhibitor rotenone (0.5 µM; port C) and the complex III inhibitor antimycin A (0.5 µM; port C) along with the nuclear stain Hoechst 33342 (2 µM; port C). For the XF Glycolytic Rate Assay, basal extracellular acidification rates (ECAR) were initially measured, followed by sequential injections of the rotenone (0.5 µM; port A) in combination with antimycin A (0.5 µM; port A), the hexokinase inhibitor 2-deoxy-D-glucose (2-DG, 50 mM; port B), and the nuclear stain Hoechst 33342 (2 µM; port C). After calibration of the Seahorse XFe96 Analyzer, the assay was performed according to the manufacturer’s instructions. For data normalization, measurements were normalized based on quantified cell numbers. Briefly, nuclei fluorescence images were acquired using the BioTek Lionheart FX Automated Microscope and cell counts were determined with the BioTek Gen5 Software. Data analysis was conducted using Wave software (version 2.6.4) and Seahorse Analytics (Agilent Technologies).
2.12. Statistics
All experiments described were conducted at least three times. The data are presented as mean ± SEM and were statistically evaluated using GraphPad Prism 10.2.3. Statistically relevant differences between the UTC and the treated samples were determined using one-way analysis of variance (ANOVA).
2.13. Assessment of Additive Effects and Synergism
To evaluate potential synergistic effects of combination treatments, an additive reference value was calculated based on the mean effects of the respective monotherapies. Specifically, the expected additive effect (EA) was defined as:
EA = Effect Mean (Monotherapy A) + Effect Mean (Monotherapy B)
This value represents the theoretical additive effect [18]. The measured effect of the combination therapy was then compared to this calculated threshold. If the observed combination effect exceeded the EA value, the effect was considered synergistic. To facilitate visual interpretation, the EA was indicated as a red line in the respective figures.
3. Results
3.1. DTC Cells Exert Heterogeneous Response to Lenvatinib and Mitochondria-Targeting Antibiotics
To investigate the therapeutic responsiveness of DTC cells, we first analyzed the dose response effect of lenvatinib, a multi-kinase inhibitor clinically used in advanced DTC, across two papillary (K1, TPC-1), two follicular DTC (FTC-133, TT2609-C02) and one non-malignant thyroid cell line (Nthy-Ori 3.1) after treatment for 72 h (Figure 1a). Based on the results of the cell viability assays, the cell lines displayed varying degrees of sensitivity to lenvatinib. TPC-1 cells showed the strongest response, with an IC50 of 19.00 µM. The FTC cell line TT2609-C02 exhibited reduced sensitivity with a notably higher IC50 of 79.43 µM. FTC-133 and K1 cells appeared resistant to lenvatinib, as their viability did not drop below 50% even at the highest concentration tested (100 µM). These findings underscore the heterogeneous response of DTC to lenvatinib.
Following the lenvatinib sensitivity profile, we evaluated the response of the DTC cell lines to the mitochondrial-targeting antibiotic tigecycline (Figure 1b). Tigecycline was chosen due to its well-established ability to inhibit mitochondrial protein synthesis in cancer cells [12]. After 72 h of treatment with different tigecycline concentrations, three cell lines responded similarly to tigecycline (IC50 K1: 11.00 µM, TPC-1: 12.07 µM, Nthy-Ori 3.1: 12.85 µM). TT2609-C02 cells were most sensitive to tigecycline (2.83 µM), while FTC-133 cells were largely unresponsive, as the cell viability did not drop below 50% at the highest concentration tested (100 µM).
After determining the IC50 for tigecycline, we tested eravacycline, a next generation synthetic tetracycline analogue with an improved toxicity profile (Figure 1c) [16]. In general, the cell lines exhibited higher IC50 values compared to tigecycline and a more heterogeneous sensitivity pattern (K1: 15.29 µM, TPC-1: 4.85 µM, TT2609-C02: 28.37 µM, Nthy-Ori 3.1: 10.23 µM). Again, FTC-133 cells were also resistant to eravacycline, indicating that this cell line did not respond to mitochondrial-targeting antibiotics.
3.2. DTC Cells Exhibit Distinct Baseline Profiles of Mitochondrial Respiration and Higher Rates of Glycolysis Compared to Non-Malignant Cells
In order to characterize the metabolism of DTC cells in comparison to non-malignant thyroid cells, we performed a series of real-time measurements of the oxygen consumption rate (OCR), indicating oxidative phosphorylation (OXPHOS) capacity, using the Seahorse XF Mito Stress test. Moreover, the glycolytic proton efflux rate (glycoPER), indicating glycolytic rate, was investigated using the Seahorse XF Glycolytic Rate assay. Papillary TPC-1 and follicular TT2609-C02 cells showed lower rates of basal respiration and ATP-linked respiration compared to non-malignant Nthy-Ori 3.1 cells (Figure 1f and 1h). The level of maximal respiration, an indicator of reserved respiratory capacity, was higher in K1 compared to Nthy-Ori 3.1 cells (Figure 1g). In FTC-133, the Mito Stress test revealed a higher proton leakage across the mitochondrial membrane and lower mitochondrial coupling efficiency compared to Nthy-Ori 3.1, indicating a dysfunction in mitochondrial respiration (Figure 1i and 1l). As expected, according to the Warburg effect, meaning that cancer cells produce energy via aerobic glycolysis rather than oxidative phosphorylation [19,20], basal glycolytic rates were higher in all DTC cells compared to non-malignant cells (Figure 1k). The same pattern, except for TPC-1 cells, was observed for the compensatory glycolysis, which reflects the cellular shift towards glycolysis to maintain energy production when mitochondrial ATP synthesis is impaired (Figure 1l). The OCR/ECAR ratio was higher in the Nthy-Ori 3.1 cells compared to all DTC cell lines, demonstrating a reliance on OXPHOS in thyroid cells and again indicating higher dependency on glycolysis of the DTC cells (Figure 1m). This observation was further supported by the energetic map, which showed that Nthy-Ori 3.1 cells are clustered in the upper left quadrant, characteristic for aerobic metabolism (Figure 1n). In contrast, TPC-1 and TT2609-C02 cells present a more glycolytic phenotype, as indicated by their location in the middle/lower right quadrant of the map. FTC-133 and K1 cells, located in the upper right corner of the map, present an energetic phenotpye that is characterized by utilizing both mitochondrial respiration and glycolysis for energy production.
3.3. Combination of Lenvatinib with Mitochondrial-Targeting Antibiotics Synergistically Reduces Tumor Cell Viability in Lenvatinib-Resistant DTC Cells
To further elucidate whether mitochondria-targeting antibiotics can enhance the lenvatinib sensitivity in treatment-resistant DTC cells, we selected one cell line (K1) that showed minimal response towards lenvatinib (Figure 1a), but moderate sensitivity to both antibiotics tigecycline (Figure 1b) and eravacycline (Figure 1c). Therefore, we focused on papillary K1 cells, to further investigate whether combinational treatments could sensitize cells to lenvatinib. The second lenvatinib-resistant follicular cell line FTC-133 (Figure 1a) was excluded from further combinational investigations due to its lack of response to antibiotic monotherapy (Figure 1b and 1c).
To assess whether antibiotics can sensitize K1 cells to lenvatinib, we performed combinational treatments using tigecycline (Figure 2, left side, marked in yellow) or eravacycline (Figure 2, right side, marked in orange) with lenvatinib. Cells were treated with both compounds as monotherapy and in combination. Synergy was defined as a combination effect that exceeded a theoretic value referred to as the “expected additive effect” (EA). The EA represents the estimated additive effect of the two monotherapies, and served as a threshold to define synergism. The EA was visualized as a red line in the bar charts (Figure 2a-f).
The combination of 50 µM lenvatinib and 6.25 µM tigecycline reduced 2D cell viability synergistically in K1 cells. While cell viability was not highly affected by the monotherapies, the combination led to a strong cytotoxic effect reducing cell viability to 35%, compared to untreated controls (UTC) (Figure 2a). Similarly, combining 50 µM lenvatinib with 10 µM eravacycline caused a synergistic reduction in cell viability to 25%, while monotherapies did not exhibit strong cytotoxic effects (Figure 2b). In both cases, the combination treatments clearly exceeded the EA, indicating a synergistic effect rather than an additive one.
To better mimic solid tumors in vivo, we also employed 3D cell cultures. In this model, cells grow as spheroids in contrast to a flat layer, allowing for more natural cell-cell contacts, the formation of a hypoxic environment and more realistic drug diffusion for the investigation of treatment effects [21]. Monotherapies showed limited efficacy in spheroids, with lenvatinib, tigecycline and eravacycline reducing spheroid viability by only ~ 20%, ~ 40% and ~ 25%, respectively, compared to the UTC (Figure 2c and 2d). In contrast, combination of lenvatinib and tigecycline reduced cell viability by 72%, therefore exceeding again the EA (Figure 2c). Similarly, the combination of lenvatinib and eravacycline led to a 85% reduction of the viable cell fraction, indicating a synergistic cell viability reducing effect (Figure 2d).
To assess the proliferative capacity of K1 cells after 24 h pre-treatment (either with monotherapies or the combinations), we additionally performed colony formation assays (Figure 2e and 2f). This approach reveals whether treated cells still have the capacity to form colonies and further proliferate once the treatment was terminated. While cells pre-treated with the monotherapies are still able to form colonies almost similar to controls, the combination treatment with lenvatinib and tigecycline reduced colony formation to 50% (Figure 2e). Similarly, the combination of lenvatinib with eravacycline reduced the colony formation to 35% compared to UTC (Figure 2f). In both cases, the effects of the combination treatments again exceeded the EA, indicating synergistic inhibition of the long-term proliferative potential.
3.4. Combinations of Lenvatinib and Antibiotics Affect Mitochondrial Function and Cellular Energy Metabolism in Lenvatinib-Resistant DTC Cells
As we demonstrated the synergistic cytotoxic effects of the combination of lenvatinib either with tigecycline or eravacycline, we investigated how mitochondrial function is affected by the treatments. To gain first insights into the impact of the combination treatment on mitochondrial function, intracellular ATP levels were quantified following 24, 48 and 72 h of treatment with lenvatinib, tigecycline or eravacycline alone or in combination. Tigecycline alone had only a minor impact on ATP levels across all time points (Figure 3a). Similarly, lenvatinib induced a slight reduction in ATP content, which was not significant in most cases (Figure 3a and Figure 4a). Contrary, eravacycline monotreatment caused a strong in ATP content at all measured time points (Figure 4a). Notably, a synergistic decline in ATP levels was only observed for the combination treatment of lenvatinib with tigecycline after 72 h treatment (Figure 3a).
To gain deeper insight into potential effects on mitochondria, the mitochondrial membrane potential (MMP) was analyzed with the JC-10 dye after 72 h treatment (Figure 3b and 4b). Lenvatinib-treated cells exhibited an increase in the MMP compared to controls. In contrast, treatment with tigecycline or eravacycline markedly decreased in the MMP, reflecting mitochondrial depolarization (Figure 4b). Notably, the combination treatments did not further enhance this effect, suggesting that the observed loss of intact MMP is primarily due to the antibiotics, rather than the combination of the substances.
Confocal microscopy imaging of the nuclei and mitochondria of K1 cells revealed distinct differences in the mitochondrial distribution and morphology after 72 h of treatment (Figure 3c and 4c). In control cells, mitochondria appeared less abundant and predominantly localized to one side of the nucleus. After lenvatinib treatment, mitochondria seemed to be more numerous, while mitochondria were still distributed only on one side of the nucleus. In contrast, K1 cells treated with tigecycline, eravacycline or their respective combinations with lenvatinib showed a uniform mitochondrial distribution, surrounding the whole nucleus. Additionally, the morphology of K1 cells treated with the combinations changed to a noticeable elongated cell shape.
To further investigate early mitochondrial alterations, bioenergetic measurements were assessed after 12 h of drug exposure using the XF Seahorse Analyzer (Figure 3d-n and Figure 4d-n). Basal and maximal respiration were markedly reduced following treatment with either tigecycline or eravacycline, while lenvatinib alone had only a moderate or no significant effect. Notably, the combination treatments did not further suppress respiration, suggesting that the observed mitochondrial inhibition was primarily driven by tigecycline or eravacycline alone (Figure 3f-g and Figure 4f-g). A similar pattern was observed for ATP-linked respiration, which was significantly decreased across all treatments (Figure 3h and Figure 4h). Lenvatinib treatment increased the proton leak by about 40%, which was reduced in cells treated with the antibiotics or the combination (Figure 3i and Figure 4i). Coupling Efficiency showed a slight but significant reduction upon lenvatinib treatment and in both combination conditions (Figure 3j and Figure 4j). Basal glycolysis remained unaffected by lenvatinib, tigecycline and the combination, whereas treatment with eravacycline as well as its combination with lenvatinib led to a significant reduction in glycolytic flux (Figure 3k and Figure 4k). Similarly, compensatory glycolysis was not altered by lenvatinib treatment, but was moderately decreased following exposure to both antibiotics and their respective combinations (Figure 3l and Figure 4l). Again, similar to the respiration parameters, the observed effects for the glycolytic flux appeared to be mainly driven by the antibiotics. The OCR/ECAR ratios were reduced following combinational treatments with lenvatinib and both antibiotics (Figure 3m and Figure 4m). The energy map revealed distinct metabolic shifts following treatment (Figure 3n and Figure 4n). Control cells were located in the upper right quadrant, indicating high metabolic activity. Lenvatinib-treated K1 cells showed a slight shift down, while tigecycline and the combination of lenvatinib and tigecycline treatment led to a more central position with reduced metabolic activity (Figure 3n). In contrast, cells treated with eravacycline or the lenvatinib-eravacycline combination shifted to the left (Figure 4n), indicating a clear decrease in glycolysis, while oxidative metabolism remained at moderate levels.
3.5. Lenvatinib Combinations with Antibiotics Trigger Enhanced Apoptotic Responses in Lenvatinib-Resistant DTC Cells
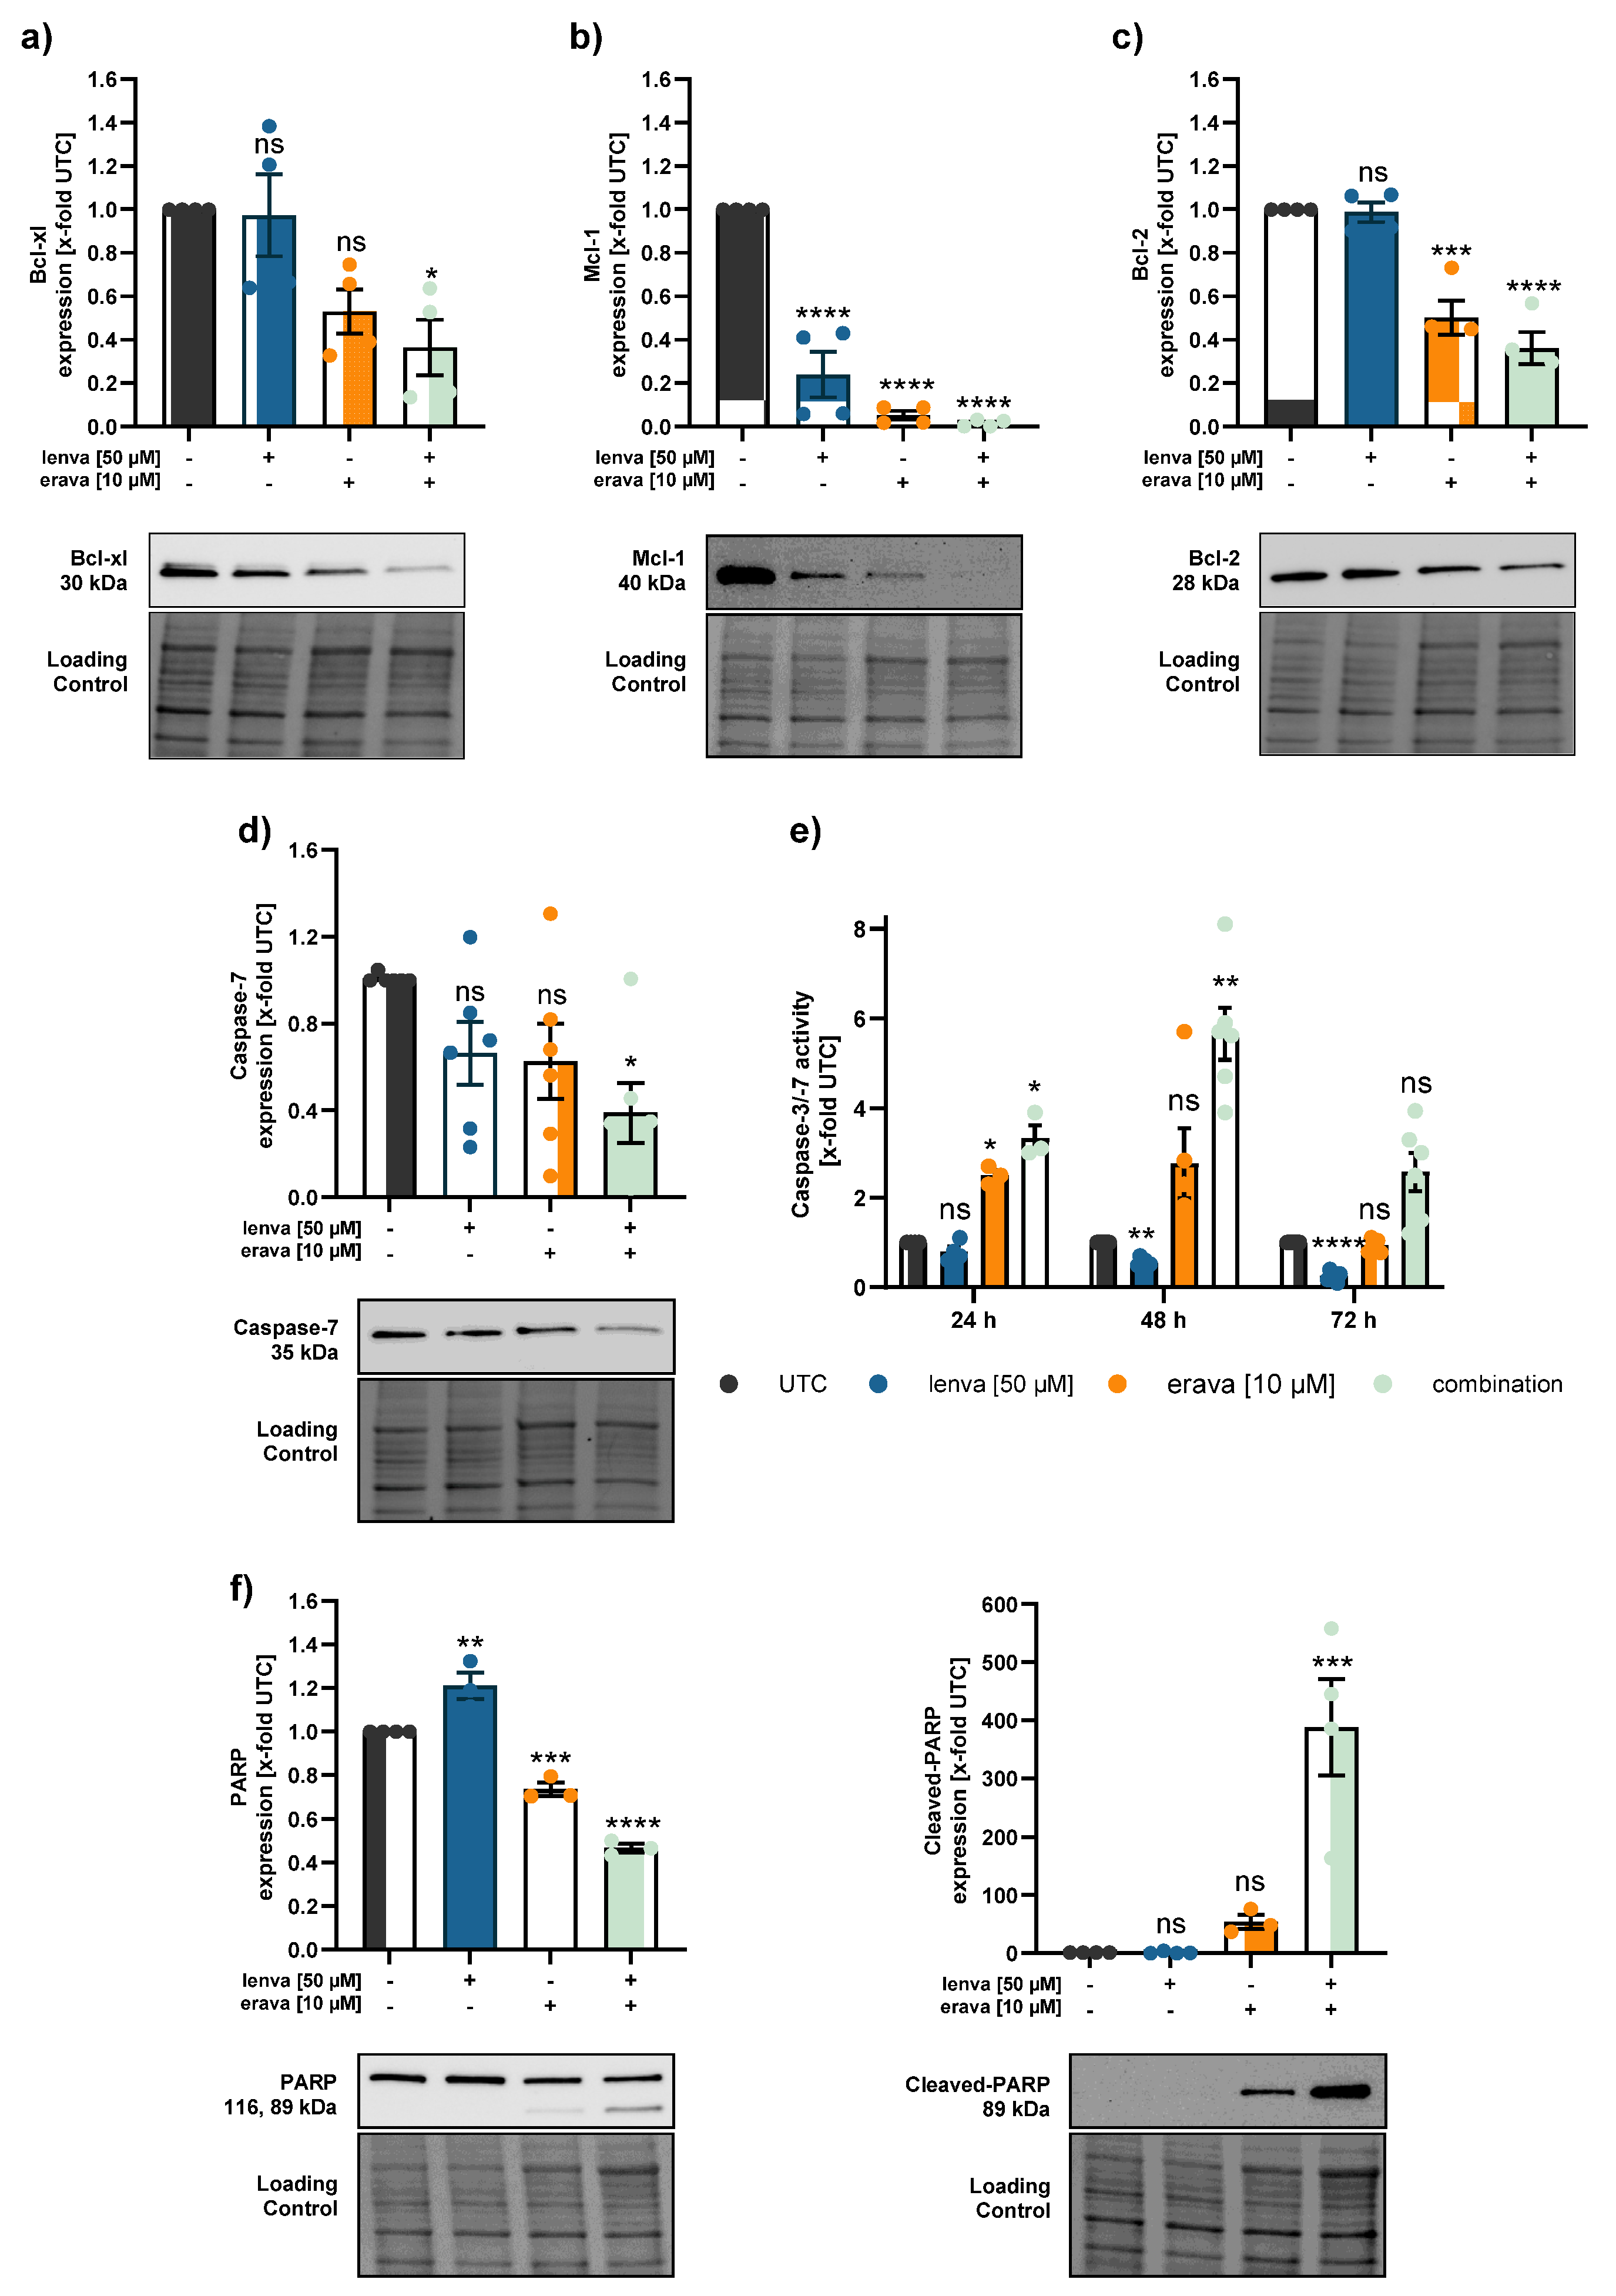
Given the observed synergistic decrease in cell viability and the overall reduction in mitochondrial function following combination treatments with lenvatinib and the antibiotics tigecycline or eravacycline, we next investigated whether these effects were associated with the induction of mitochondrial-mediated apoptosis. Therefore, we examined the expression of anti-apoptotic Bcl-2 family members, including Bcl-xl, Mcl-1 and Bcl-2 in the lenvatinib-resistant K1 cell line (Figure 5a-c and Figure 6a-c). These proteins are key regulators of the intrinsic apoptotic pathway, primarily acting at the mitochondria via inhibiting cytochrome c release and downstream caspase activation and therefore suppress apoptosis [22,23].
Protein expression analysis revealed a reduction in Bcl-xl expression upon combination treatment, while monotherapies had no (lenvatinib and tigecycline) or only a minor (eravacycline) effect (Figure 5a and Figure 6a). The strongest effect was observed in the Mcl-1 protein expression. Mcl-1 expression was consistently downregulated in all treatments, with the most pronounced effect in the combination treatments (Figure 5b and Figure 6b). Lenvatinib and tigecycline as monotreatment did not decrease the expression of the anti-apoptotic protein Bcl-2, similar to the combination of lenvatinib with tigecycline (Figure 5c). However, a marked reduction in Bcl-2 expression after eravacycline treatment was observed, which was further enhanced by the combination with lenvatinib (Figure 6c).
To further investigate whether the downregulation of anti-apoptotic proteins are linked to the activation of caspases, we assessed both, caspase-7 protein levels and caspase-3/7 enzymatic activity in lenvatinib-resistant K1 cells. While there were no significant changes in caspase-7 expression in the lenvatinib-eravacycline group, the expression of caspase-7 was markedly reduced after treatment with the combination of lenvatinib with tigecycline (Figure 5d and Figure 6d). When assessing caspase-3/7 activity over time, the highest increase was observed in both combination treatments. In the lenvatinib-tigecycline group, the highest activity peak was present at 48 h of drug exposure before slightly declining at 72 h (Figure 5e). A similar trend was visible in the lenvatinib-eravacycline group, where caspase-3/7 activity also reached its maximum at 48 h of treatment. Notably, at every time point measured, the combination treatment of lenvatinib with eravacycline induced the strongest caspase-3/7 activity (Figure 6e). To further validate caspase activation and the initiation of apoptosis, we assessed PARP cleavage as a downstream marker of caspase activation and an apoptosis inducer (Figure 5f and 6f). Despite only modest caspase-3/7 activity signal, a clear increase in cleaved PARP was noticed after treatment with both antibiotic agents alone. This effect became even more pronounced in cells treated with the combination therapies, suggesting an intense apoptotic response when lenvatinib was added (Figure 5f and Figure 6f). Together, these findings imply that while the antibiotics alone initiated apoptotic signalling, their combination with lenvatinib markedly enhanced this effect.
4. Discussion
Efficacious treatment options for radioiodine-refractory differentiated thyroid cancer (RR-DTC) remain limited, and disease progression is often inevitable. Although lenvatinib is currently the first-line treatment for RR-DTC, its clinical use is accompanied by severe side effects due to the high dosage required. Moreover, the development of resistance represents a major therapeutic challenge [4,5,6,7]. These aspects underscore the urgent need to develop novel therapeutic strategies to enhance treatment efficacy and improve both, prognosis and quality of life for patients.
In this context, metabolic reprogramming, one of the hallmarks of cancers, has gained attention due to its critical role in tumorigenesis. Beyond their role in energy production, mitochondria are involved in various cellular processes, including apoptosis, metabolic adaptation and cell cycle regulation [24]. In tumors, the functions of mitochondria are often dysregulated and there is evidence that altered mitochondria might be one regulator of therapy resistance making them attractive targets for therapeutic intervention [10,11,25]. Therefore, the aim of the present study was to investigate whether the combination of lenvatinib with mitochondria-targeting antibiotics could enhance treatment efficacy in DTC cells. Interestingly, although lenvatinib is the first-line treatment for RR-DTC, we observed a heterogeneous sensitivity profile across DTC cell lines, whereby two cell lines showed no response to lenvatinib. This lack of response in some DTC cell lines mirrors clinical observations, where a proportion of patients fails to benefit from lenvatinib treatment [5]. Our data align with previously reported variability in lenvatinib response across thyroid cancer models, where only two out of 11 cell lines exhibited a significant sensitivity to the drug, whereas in xenograft models, lenvatinib showed better anti-tumor effects [26]. Therefore, our data supports the need to enhance treatment efficacy, particularly in resistant cells.
Given the increasing interest in targeting mitochondria, we investigated two different tetracyclines in their ability to inhibit cell proliferation. Tigecycline, a known inhibitor of mitochondrial translation, has been previously shown to have anti-proliferative effects in various tumor entities, including sorafenib-resistant hepatocellular carcinoma cells [25]. Alongside tigecycline, we also tested eravacycline, a newer member of the tetracycline class of antibiotics with improved pharmacokinetic properties and structural modifications that may enhance mitochondrial targeting [27]. Both antibiotics exhibited a concentration-dependent reduction in cell viability across all cell lines tested. Previous studies show that the main effects of tigecycline on cancer cells are the inhibition of cell proliferation and mitochondrial function, whereby the IC50 on cancer cells range from 5.8 to 51.4 µM in diverse tumor entities [14]. Although data on eravacycline in cancer is still emerging, it is described that eravacycline significantly inhibited cancer cell proliferation in pancreatic ductal adenocarcinoma [28] and melanoma cells [29]. The study by Liu et al. demonstrates, that eravacycline inhibited tumor proliferation in melanoma cells with IC50 values of 1.48 µM to 6.47 µM. Interestingly, eravacycline exhibited higher IC50 values compared to tigecycline in our DTC cell lines, which might be explainable by the structural differences of the drugs [30]. Another study by Aminzadeh-Gohari et al. compared the effect of different antibiotics on the cell viability of melanoma cells, and similar to our data, they showed that tigecycline had a stronger anti-proliferative effect than doxycycline and azithromycin [13]. However, eravacycline generally shows a less adverse effect profile with better individual patient tolerability.
Since some of the DTC cell lines showed only limited sensitivity to either lenvatinib or the antibiotics, and mitochondria are known to contribute to therapy resistance, we further assessed the metabolic characteristics of the follicular and papillary DTC cell lines. In FTC-133, we observed significantly increased proton leakage across the mitochondrial membrane and reduced mitochondrial coupling efficiency compared to Nthy-Ori 3.1, indicating impaired mitochondrial respiration. This dysfunction may explain why FTC-133 do not respond to tigecycline or eravacycline. Interestingly, our findings indicate that DTC cells do not follow a uniform mitochondrial phenotype, as most analyzed parameters showed only minor differences between malignant and non-malignant cells. Despite these minor differences, it remains possible that DTC cells are more dependent on mitochondrial function under stress. This assumption is supported by findings that thyroid cancer cells can shift between aerobic glycolysis and OXPHOS depending on the tumor microenvironment [31]. Thus, targeting mitochondria with antibiotics may still represent a therapeutic strategy. In addition, it has to be mentioned that, to ensure comparability across cell lines, bioenergetic measurements were performed using a fixed FCCP concentration (1 µM). It might be possible that different cell lines require different FCCP concentrations to achieve maximal respiratory uncoupling.
In agreement with the Warburg effect, we showed that DTC cells possess elevated rates of glycolysis, while on the other hand non-malignant cells had a significantly higher OCR/ECAR ratio. This indicates that DTC cells exhibit an increased dependence on glucose metabolism through glycolysis, highlighting glucose metabolism as an attractive target for therapeutic strategies [32].
The main aspect of the present study was to elucidate whether combining lenvatinib with mitochondria-targeting antibiotics, such as tigecycline or eravacycline, could improve treatment efficacy in DTC cells. Indeed, our data show that both combinations – lenvatinib with tigecycline and lenvatinib with eravacycline – led to significantly reduced cell viability in 2D and 3D models compared to single treatments in lenvatinib-resistant K1 cells. Notably, in all cases, the combination treatments clearly exceeded the EA, indicating a synergistic effect rather than an additive one. Up to now, various preclinical studies have reported that tetracycline antibiotics can enhance sensitivity to chemotherapeutic drugs in various cancers [33,34,35,36]. A study by Wang et al. showed that combination of tigecycline and paclitaxel at sub-toxic concentrations significantly enhanced the efficacy of paclitaxel in DTC in vitro and in vivo [37]. Therefore, our results highlight the potential of combinational treatments, especially with antibiotics, to overcome intrinsic resistance in DTC.
Although the anti-cancer activities of tigecycline have been demonstrated in various cancers, there is no unifying mechanism of action for tigecycline across different tumor types and despite its structural similarity to tigecycline, the mechanism by which eravacycline affects cancer cells is still poorly understood. However, the majority of studies suggest that mitochondria are the predominant target of tigecycline, either through downregulation of mitochondrial protein synthesis and respiratory-chain complexes or by reducing mitochondrial mass [12,14,37,38]. Our results display that combinational treatment exerts effects on both mitochondrial respiration and glycolysis after 12 hours of treatment, indicating a general impairment in mitochondrial ATP production. The reduced ATP production may be linked to the loss of mitochondrial membrane potential (MMP) observed upon treatment. Notably, the pronounced reduction in OCR and ATP production observed in the combination treatments is largely attributed to the antibiotics. This is in agreement with a previous study indicating that chemotherapeutic agents have minimal impact on mitochondrial respiration in thyroid cancer cells, whereas tigecycline significantly impairs mitochondrial function via decreasing the MMP and mitochondrial respiration [37]. Liu et al. additionally reported that targeting mitochondria in multidrug-resistant tumors enhances the sensitivity of cells to chemotherapy, as mitochondrial targeting facilitated increased drug accumulation within resistant cancer cells [39].
Since mitochondria play a pivotal role in the regulation of apoptosis, we investigated whether the observed reduction in cell viability was associated with apoptotic mechanisms. When anti-apoptotic proteins are less abundant and pro-apoptotic Bcl-2 family members are dominant, the mitochondrial outer membrane starts to permeabilize. Executioner caspases (like caspase-3 and -7) cleave various cellular substrates, including PARP, which is widely recognized as a hallmark of apoptosis [23]. Our data show that members of the anti-apoptotic Bcl-2 family, including Bcl-xl, Mcl-1 and Bcl-2, were significantly downregulated following combinational treatment with lenvatinib and the respective antibiotics. In parallel, procaspase-7 protein levels were reduced, suggesting activation through cleavage, which was further supported by a significant increase in caspase-3/7 activity, particularly after 48 hours. While total-PARP levels remained largely unchanged, we observed a pronounced increase in cleaved-PARP, indicating the induction of apoptosis in response to the combination therapy. Our data is in line with other studies, which showed that the inhibition of mitochondria with tigecycline induced apoptosis via the intrinsic pathway, with activation of Bcl-2, release of cytochrome c, and cleavage of caspase-9/caspase-3/caspase-7 [14,40,41].
In summary, our study highlights that combining lenvatinib with mitochondria-targeting antibiotics represents a promising strategy to overcome resistance in DTC by impairing mitochondrial function and promoting apoptotic cell death.
Our study not only provides a promising proof-of-concept for overcoming lenvatinib resistance in DTC through combination with antibiotics, but also offering interesting new research questions. In vivo confirmation is required to validate the therapeutic potential and to evaluate how antibiotic treatment might alter the gut microbiota and potentially affect the efficacy of multikinase inhibitors. Therefore, clinical application may require careful evaluation of risks and consideration of co-administration of probiotics or prebiotics [35]. Nonetheless, our findings represent an important step towards the development of more effective treatment strategies for RR-DTC.
5. Conclusions
We conclude that tetracyclines can sensitize treatment-resistant thyroid cancer cells to lenvatinib. We further show that combination of lenvatinib with antibiotics induces mitochondrial dysfunction, ultimately leading to apoptosis in thyroid cancer cells.
Author Contributions
Conceptualization, C.P., J.P., P.H.-C., and C.A.; methodology, C.A., P.H.-C., J.P., C.P., B.K. and D.D.W.; validation, C.A., P.H.-C., J.P., D.D.W. and B.K.; formal analysis, C.A. and S.P.; investigation, C.A., P.H.-C., S.P., M.G.-M., G.S. and D.D.W.; resources, J.P., C.P. and B.K.; data curation, C.A., S.P., P.H.-C., G.S. and D.D.W.; writing—original draft preparation, C.A. and P.H.-C.; writing—review and editing, C.A., P.H.-C., J.P., C.P., G.R., T.K., D.D.W., B.K., G.S., S.P. and M.G.-M.; visualization, C.A.; supervision, P.H.-C., J.P. and C.P.; project administration, P.H.-C.; funding acquisition, J.P., C.P., D.D.W., B.K., C.A. and P.H.-C. All authors have read and agreed to the published version of the manuscript.
Funding
This research was funded by the PMU-FFF research (R-19/03/120), the Salzburger Krebshilfe Stipendium and the Salzburger Kinderkrebshilfe.
Institutional Review Board Statement
Not applicable.
Informed Consent Statement
Not applicable.
Data Availability Statement
All data supporting the findings are shown in the article, and further queries can be directed to the corresponding author upon request.
Conflicts of Interest
The authors declare no conflicts of interest.
Abbreviations
The following abbreviations are used in this manuscript:
| ATC | Anaplastic thyroid carcinoma |
| ATP | Adenosine triphosphate |
| Bcl-2 | B-cell lymphoma 2 |
| Bcl-xl | B-cell lymphoma-extra large |
| C.I. | Confidence interval |
| DTC | Differentiated thyroid carcinoma |
| EA | Expected additive effect |
| ECAR | Extracellular acidification rate |
| FCCP | Fluoro-carbonyl cyanide phenylhydrazone |
| FTC | Follicular thyroid carcinoma |
| glycoPER | Gloycolytic proton efflux rate |
| IC50 | Half-maximal inhibitory concentration |
| Mcl-1 | Myeloid cell leukemia-1 |
| MMP | Mitochondrial membrane potential |
| OCR | Oxygen consumption rate |
| OXPHOS | Oxidative phosphorylation |
| PARP | Poly (ADP-ribose) polymerase |
| PDTC | MMP |
| PTC | Papillary thyroid carcinoma |
| RAI | Radioactive iodine |
| ROS | Reactive oxygen species |
| RR-DTC | Radioiodine-refractory differentiated thyroid carcinoma |
| TC | Thyroid carcinoma |
| TKI | Tyrosine kinase inhibitor |
| UTC | Untreated control |
| 2-DG | 2-deoxyglucose |
References
- Sung, H., et al., Global Cancer Statistics 2020: GLOBOCAN Estimates of Incidence and Mortality Worldwide for 36 Cancers in 185 Countries. CA Cancer J Clin, 2021. 71(3): p. 209-249. [CrossRef]
- IARC World Cancer Reports, in World Cancer Report: Cancer research for cancer prevention, C.P. Wild, E. Weiderpass, and B.W. Stewart, Editors. 2020, International Agency for Research on Cancer © International Agency for Research on Cancer, 2020. For more information contact publications@iarc.who.int.: Lyon (FR).
- Boucai, L., M. Zafereo, and M.E. Cabanillas, Thyroid Cancer: A Review. Jama, 2024. 331(5): p. 425-435. [CrossRef]
- Zhang, L., et al., Molecular basis and targeted therapy in thyroid cancer: Progress and opportunities. Biochim Biophys Acta Rev Cancer, 2023. 1878(4): p. 188928. [CrossRef]
- Hamidi, S., et al., Lenvatinib Therapy for Advanced Thyroid Cancer: Real-Life Data on Safety, Efficacy, and Some Rare Side Effects. J Endocr Soc, 2022. 6(6): p. bvac048. [CrossRef]
- Fallahi, P., et al., Molecular targets of tyrosine kinase inhibitors in thyroid cancer. Seminars in Cancer Biology, 2022. 79: p. 180-196. [CrossRef]
- Motzer, R.J., et al., Lenvatinib dose, efficacy, and safety in the treatment of multiple malignancies. Expert Rev Anticancer Ther, 2022. 22(4): p. 383-400. [CrossRef]
- Hamidi, S., et al., Review article: new treatments for advanced differentiated thyroid cancers and potential mechanisms of drug resistance. Front Endocrinol (Lausanne), 2023. 14: p. 1176731. [CrossRef]
- Dabravolski, S.A., et al., The Role of Altered Mitochondrial Metabolism in Thyroid Cancer Development and Mitochondria-Targeted Thyroid Cancer Treatment. Int J Mol Sci, 2021. 23(1). [CrossRef]
- Wang, S.F., L.M. Tseng, and H.C. Lee, Role of mitochondrial alterations in human cancer progression and cancer immunity. J Biomed Sci, 2023. 30(1): p. 61. [CrossRef]
- Sharma, A., et al., Mitochondrial signaling pathways and their role in cancer drug resistance. Cell Signal, 2024. 122: p. 111329. [CrossRef]
- Aminzadeh-Gohari, S., et al., From old to new - Repurposing drugs to target mitochondrial energy metabolism in cancer. Semin Cell Dev Biol, 2020. 98: p. 211-223. [CrossRef]
- Aminzadeh-Gohari, S., et al., Targeting Mitochondria in Melanoma. Biomolecules, 2020. 10(10). [CrossRef]
- Dong, Z., et al., Biological Functions and Molecular Mechanisms of Antibiotic Tigecycline in the Treatment of Cancers. Int J Mol Sci, 2019. 20(14). [CrossRef]
- Kong, W., et al., Efficacy, safety, and tolerability of antimicrobial agents for complicated intra-abdominal infection: a systematic review and network meta-analysis. BMC Infect Dis, 2023. 23(1): p. 256. [CrossRef]
- Liu, J.J., et al., Efficacy and safety of eravacycline versus tigecycline for complicated intra-abdominal infections in the ICU: a multicenter, single-blind, parallel randomized controlled trial study protocol. Front Med (Lausanne), 2024. 11: p. 1496402. [CrossRef]
- Bo, W. and Y. Chen, Lenvatinib resistance mechanism and potential ways to conquer. Front Pharmacol, 2023. 14: p. 1153991. [CrossRef]
- Foucquier, J. and M. Guedj, Analysis of drug combinations: current methodological landscape. Pharmacol Res Perspect, 2015. 3(3): p. e00149. [CrossRef]
- Icard, P., et al., How the Warburg effect supports aggressiveness and drug resistance of cancer cells? Drug Resist Updat, 2018. 38: p. 1-11. [CrossRef]
- Martins Pinto, M., et al., The Warburg effect and mitochondrial oxidative phosphorylation: Friends or foes? Biochim Biophys Acta Bioenerg, 2023. 1864(1): p. 148931. [CrossRef]
- Ravi, M., et al., 3D cell culture systems: advantages and applications. J Cell Physiol, 2015. 230(1): p. 16-26. [CrossRef]
- Bertheloot, D., E. Latz, and B.S. Franklin, Necroptosis, pyroptosis and apoptosis: an intricate game of cell death. Cell Mol Immunol, 2021. 18(5): p. 1106-1121. [CrossRef]
- Carneiro, B.A. and W.S. El-Deiry, Targeting apoptosis in cancer therapy. Nat Rev Clin Oncol, 2020. 17(7): p. 395-417. [CrossRef]
- Zong, W.X., J.D. Rabinowitz, and E. White, Mitochondria and Cancer. Mol Cell, 2016. 61(5): p. 667-676. [CrossRef]
- Meßner, M., et al., Metabolic implication of tigecycline as an efficacious second-line treatment for sorafenib-resistant hepatocellular carcinoma. Faseb j, 2020. 34(9): p. 11860-11882. [CrossRef]
- Tohyama, O., et al., Antitumor activity of lenvatinib (e7080): an angiogenesis inhibitor that targets multiple receptor tyrosine kinases in preclinical human thyroid cancer models. J Thyroid Res, 2014. 2014: p. 638747. [CrossRef]
- Rusu, A. and E.L. Buta, The Development of Third-Generation Tetracycline Antibiotics and New Perspectives. Pharmaceutics, 2021. 13(12). [CrossRef]
- Jabarin, A., et al., Eravacycline, an antibacterial drug, repurposed for pancreatic cancer therapy: insights from a molecular-based deep learning model. Brief Bioinform, 2024. 25(3). [CrossRef]
- Liu, N., et al., Eravacycline improves the efficacy of anti-PD1 immunotherapy via AP1/CCL5 mediated M1 macrophage polarization in melanoma. Biomaterials, 2025. 314: p. 122815. [CrossRef]
- Kounatidis, D., et al., Third-Generation Tetracyclines: Current Knowledge and Therapeutic Potential. Biomolecules, 2024. 14(7). [CrossRef]
- Lee, J., et al., Mitochondrial Energy Metabolism and Thyroid Cancers. Endocrinol Metab (Seoul), 2015. 30(2): p. 117-23. [CrossRef]
- Coelho, R.G., et al., Differential glycolytic profile and Warburg effect in papillary thyroid carcinoma cell lines. Oncol Rep, 2016. 36(6): p. 3673-3681. [CrossRef]
- Ko, J.C., et al., Minocycline enhances mitomycin C-induced cytotoxicity through down-regulating ERK1/2-mediated Rad51 expression in human non-small cell lung cancer cells. Biochem Pharmacol, 2015. 97(3): p. 331-40. [CrossRef]
- Tan, J., et al., Antibiotic tigecycline enhances cisplatin activity against human hepatocellular carcinoma through inducing mitochondrial dysfunction and oxidative damage. Biochem Biophys Res Commun, 2017. 483(1): p. 17-23. [CrossRef]
- Nardo, G., P. Pantziarka, and M. Conti, Synergistic Potential of Antibiotics with Cancer Treatments. Cancers (Basel), 2024. 17(1). [CrossRef]
- Huang, H.C., et al., Mechanism-informed Repurposing of Minocycline Overcomes Resistance to Topoisomerase Inhibition for Peritoneal Carcinomatosis. Mol Cancer Ther, 2018. 17(2): p. 508-520. [CrossRef]
- Wang, Y., et al., Inhibition of mitochondrial respiration by tigecycline selectively targets thyroid carcinoma and increases chemosensitivity. Clin Exp Pharmacol Physiol, 2019. 46(10): p. 890-897. [CrossRef]
- Koch, D.T., et al., Tigecycline causes loss of cell viability mediated by mitochondrial OXPHOS and RAC1 in hepatocellular carcinoma cells. J Transl Med, 2023. 21(1): p. 876. [CrossRef]
- Liu, D., et al., Targeted disruption of mitochondria potently reverses multidrug resistance in cancer therapy. Br J Pharmacol, 2022. 179(13): p. 3346-3362. [CrossRef]
- Valipour, B., et al., Inhibition of mitochondria induces apoptosis and reduces telomere length and activity in acute myeloid leukemia stem cells. Cell Biochem Funct, 2023. 41(8): p. 1477-1487. [CrossRef]
- Jia, X., et al., Tigecycline targets nonsmall cell lung cancer through inhibition of mitochondrial function. Fundam Clin Pharmacol, 2016. 30(4): p. 297-306. [CrossRef]
Figure 1.
Baseline drug response and metabolic characterization of differentiated thyroid cancer (DTC) and non-malignant thyroid cell lines. (a-c) Cell viability of four DTC cell lines and one non-malignant thyroid cell line (Nthy-Ori 3.1) following treatment with (a) lenvatinib, (b) tigecycline, and (c) eravacycline for 72 h. Line charts show viability curves normalized to untreated controls (% UTC). IC50 values were determined with log(agonist) vs. response – Variable slope (four parameters) including 95% upper and lower confidence intervals (C.I.). (d) Representative kinetic profile of the Mito Stress test using oligomycin (Oligo, 2.5 µM), the uncoupling agent fluoro-carbonyl cyanide phenylhydrazone (FCCP, 1 µM), and a combination of rotenone/antimycin A followed by Hoechst 33342 injection for normalization (Rot/AA/Hoechst, 0.5 µM, 0.5 µM and 2 µM, respectively). (e) Representative profile of the Glycolytic Rate assay with injections of Rot/AA (0.5 µM each), 2-deoxyglucose (2-DG, 50 mM) and Hoechst (2 µM). (f-m) Quantification of key metabolic parameters from Seahorse analysis: (f) basal respiration, (g) maximal respiration, (h) ATP-linked respiration, (i) proton leak, (j) coupling efficiency, (k) basal glycolysis, (l) compensatory glycolysis, and (m) OCR/ECAR ratios. (n) Energy map visualizing metabolic phenotypes across cell lines. Significance refers to comparisons between DTC cell lines and the non-malignant Nthy-Ori 3.1 cell line. Data are shown as mean ± SEM for n≥3, whereas data for basal glycolysis and compensatory glycolysis are shown as mean ± SD for n=2. Statistical analysis was performed using one-way ANOVA followed by Dunnett’s multiple comparison test. Significance is indicated as *p < 0.05, **p < 0.01, ***p < 0.001, and ****p < 0.0001.
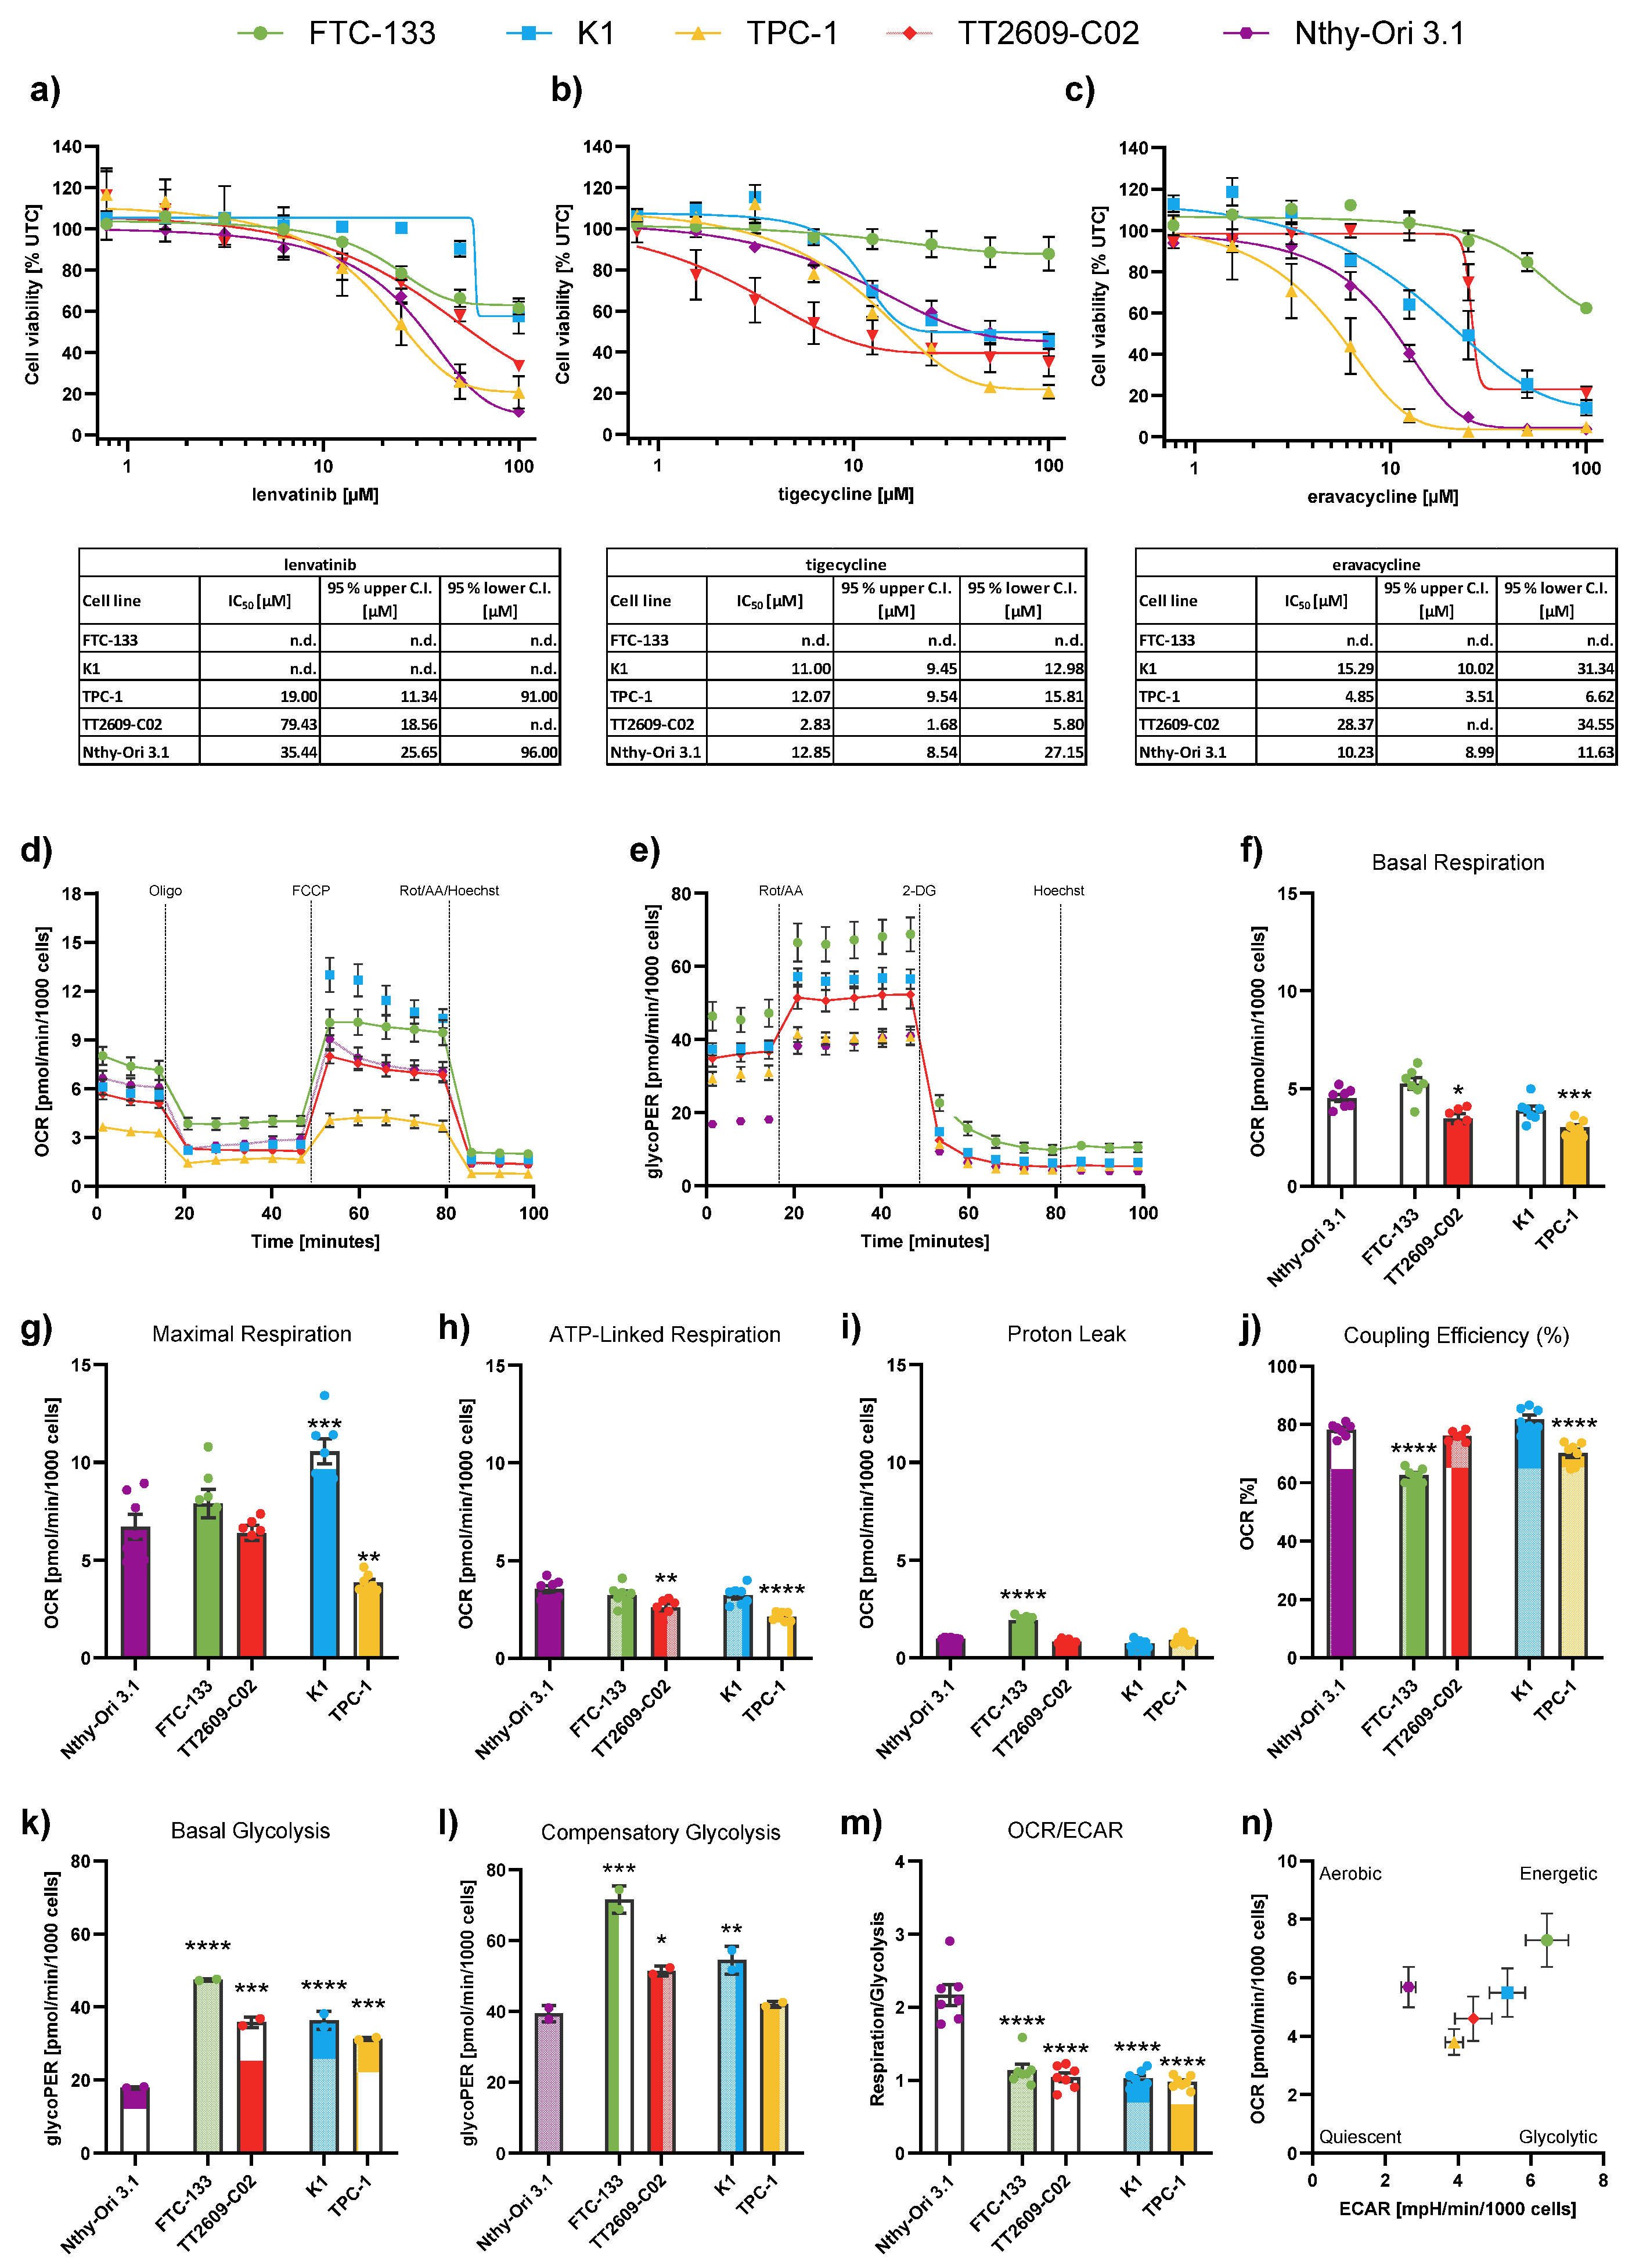
Figure 2.
Effects of combination treatments in the differentiated thyroid cancer (DTC) cell line K1. (a-b) 2D cell viability of K1 cells after 72 h treatment with lenvatinib (lenva, 50 µM), tigecycline (tige, 6.25 µM) or eravacycline (erava, 10 µM) and their respective combinations. (c-d) 3D spheroid viability of K1 cells following 96 h treatment with lenva (52 µM), tige (12.5 µM), erava (6.25 µM) and their respective combinations. Representative images of spheroids are shown; scale bar = 500 µm. (e-f) Colony formation assays after 24 h pre-treatment with lenva (50 µM), tige (9.375 µM), erava (10 µM) or combinations followed by re-seeding and 5 days of cultivation. Representative colony images are shown. The red dotted line indicates the expected additive effect (EA) in each graph and serves as a threshold for synergism. All data are normalized to the untreated controls (% UTC) and shown as mean ± SEM for n≥3; statistical analysis was performed using one-way ANOVA followed by Dunnett’s multiple comparison test. Significance is indicated as *p < 0.05, **p < 0.01, ***p < 0.001, and ****p < 0.0001 or not significant (ns).
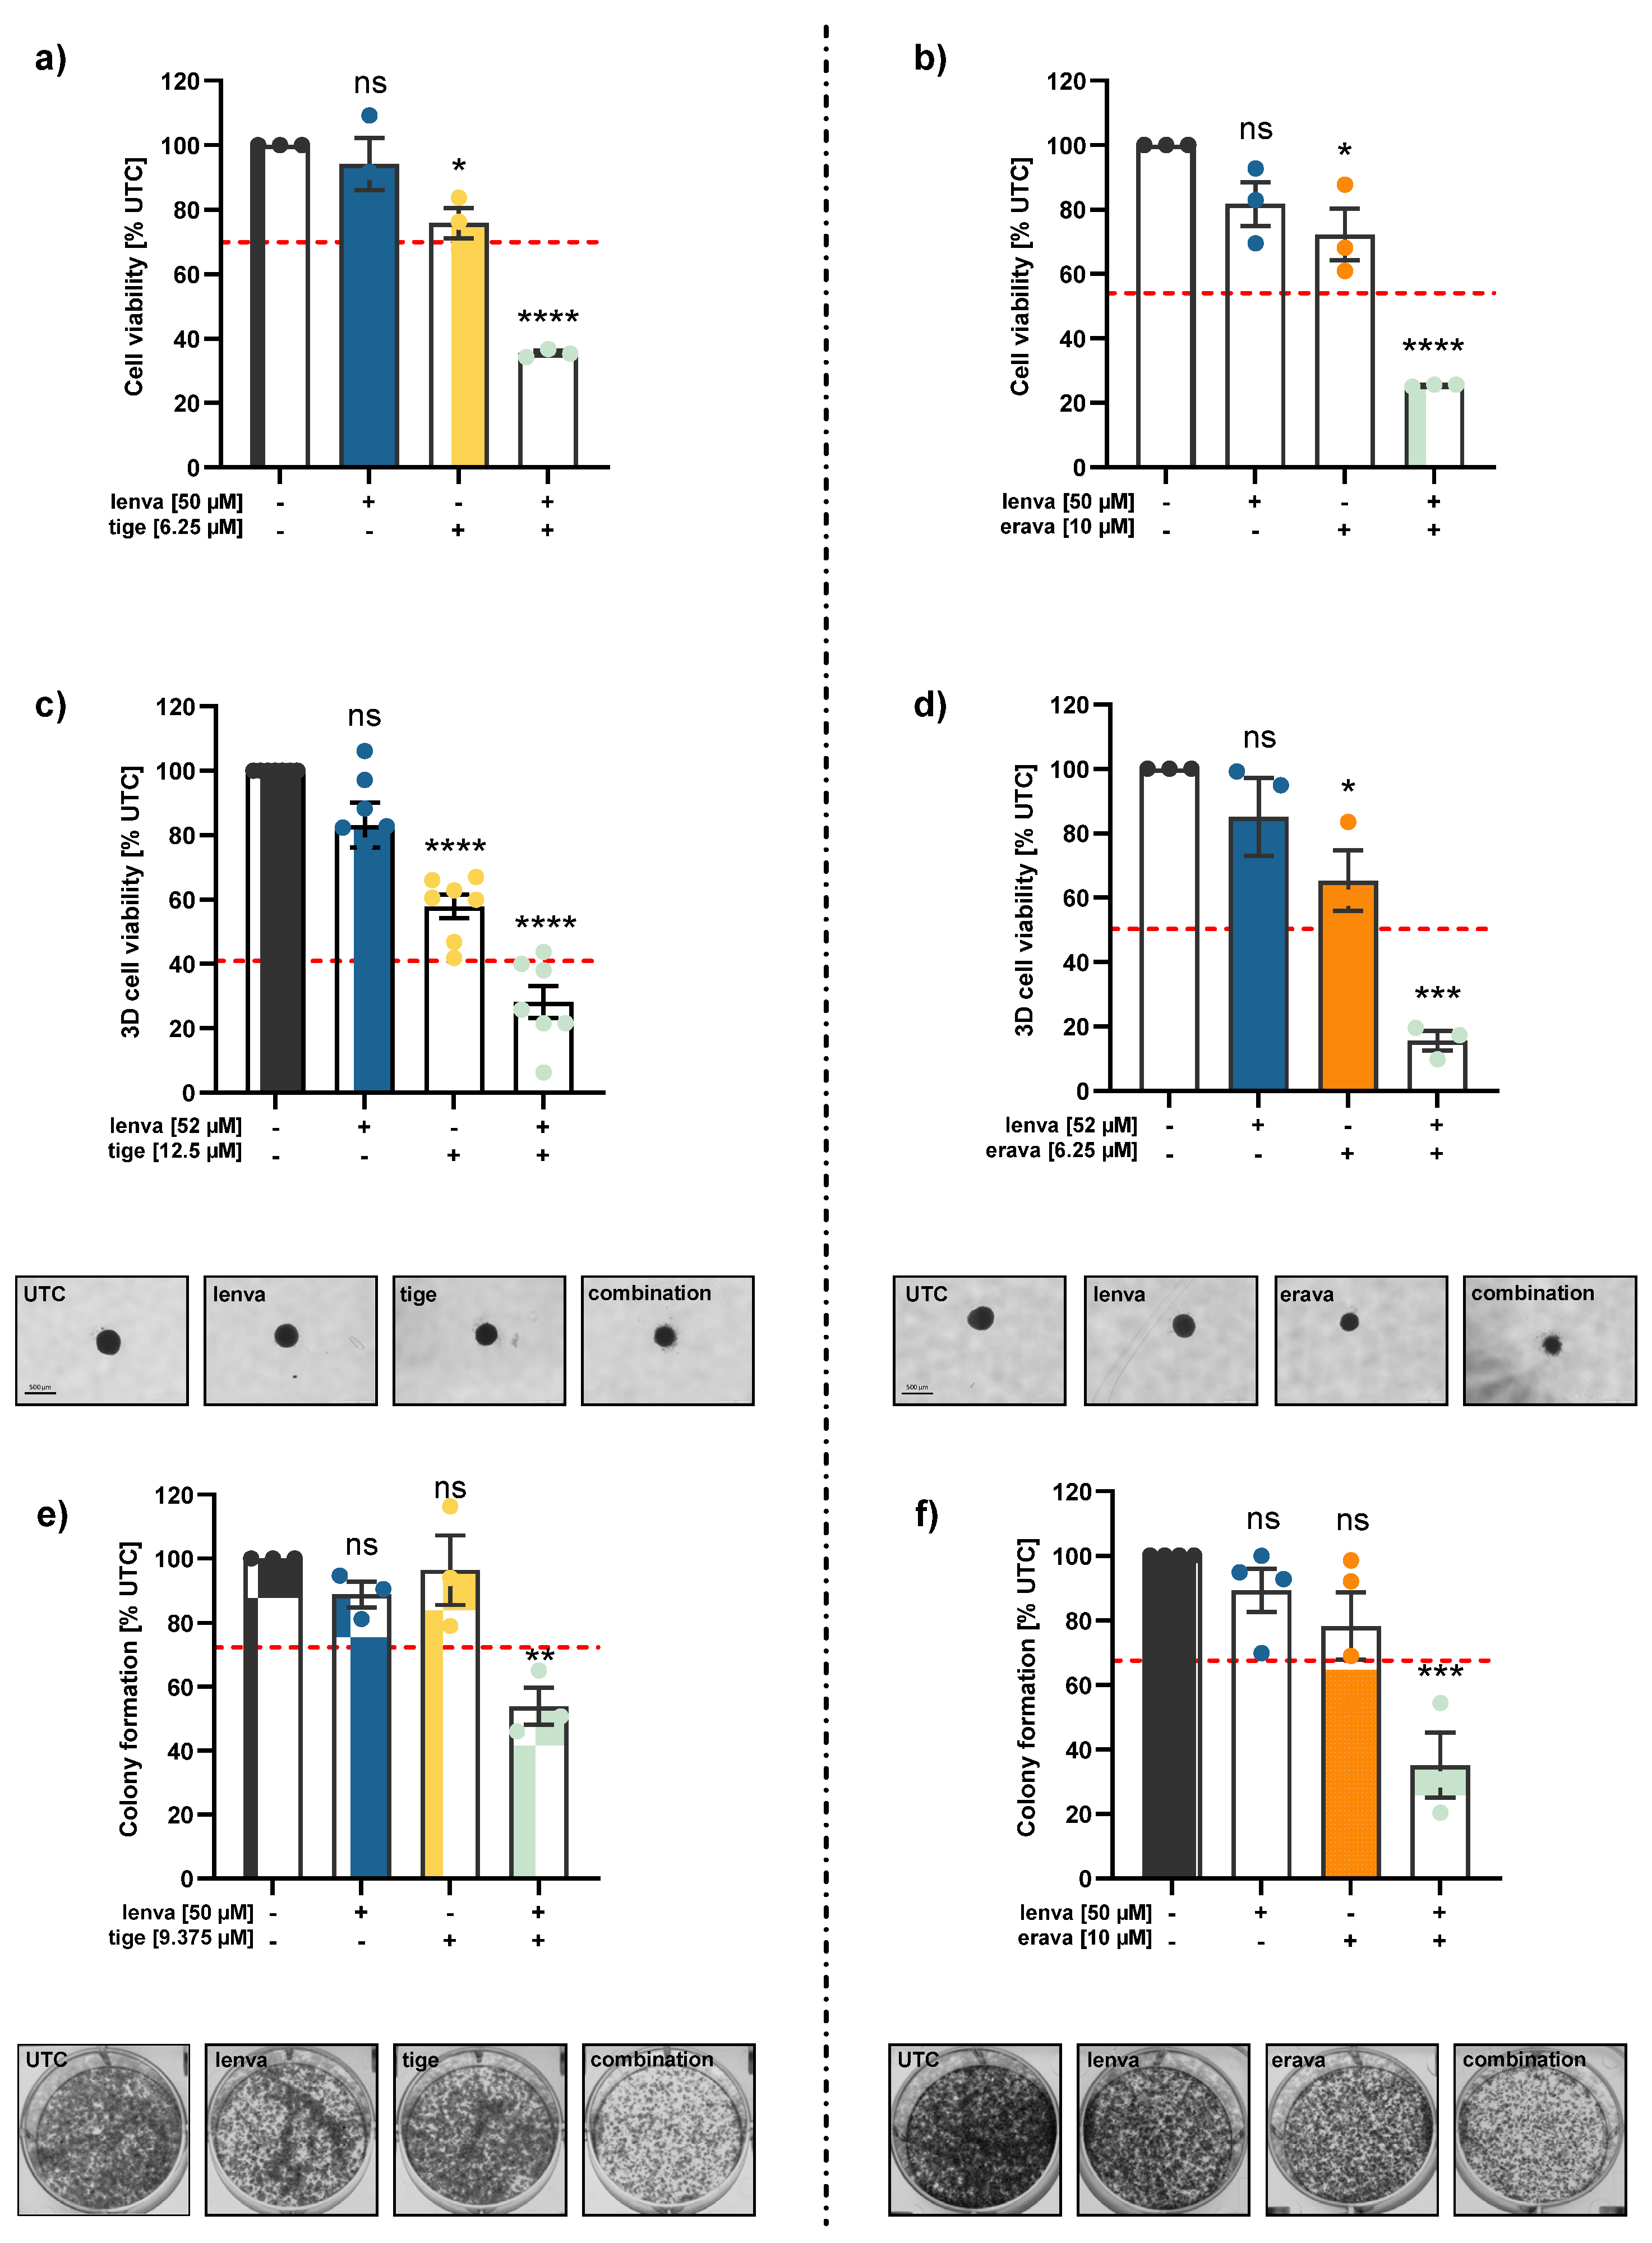
Figure 3.
Assessment of mitochondrial function and cellular metabolism in differentiated thyroid (DTC) K1 cancer cells after treatment with lenvatinib, tigecycline, and their combination. (a) ATP levels after 24, 48 and 72 h treatment with lenvatinib (lenva, 50 µM), tigecycline (tige, 6.25 µM), or their combination. (b) Mitochondrial membrane potential (MMP) after 72 h treatment measured by the JC-10 assay. (c) Confocal microscopy images after 72 h treatment showing nuclear staining (Hoechst 33342) and mitochondrial staining (MitoTracker Green), with a magnification of 40x (Zeiss LSM 700). (d) Representative line chart of the Seahorse XF Cell Mito Stress test using sequential injections of oligomycin (Oligo, 2.5 µM), the uncoupling agent fluoro-carbonyl cyanide phenylhydrazone (FCCP, 1 µM), and a combination of rotenone/antimycin A followed by Hoechst 33342 injection for normalization (Rot/AA/Hoechst, 0.5 µM, 0.5 µM and 2 µM, respectively). (e) Representative profile of the Glycolytic Rate assay with injections of Rot/AA (0.5 µM each), 2-deoxyglucose (2-DG, 50 mM) and Hoechst (2 µM). (f-m) Quantification of mitochondrial and glycolytic parameters after 12 h treatment: (f) basal respiration, (g) maximal respiration, (h) ATP-linked respiration, (i) proton leak, (j) coupling efficiency, (k) basal glycolysis, (l) compensatory glycolysis, and (m) OCR/ECAR ratios. (n) Energy map visualizing metabolic phenotypes. All data are normalized to the untreated controls (% UTC) and shown as mean ± SEM for n≥3; statistical analysis was performed using one-way ANOVA followed by Dunnett’s multiple comparison test. Significance is indicated as *p < 0.05, **p < 0.01, ***p < 0.001, and ****p < 0.0001 or not significant (ns).
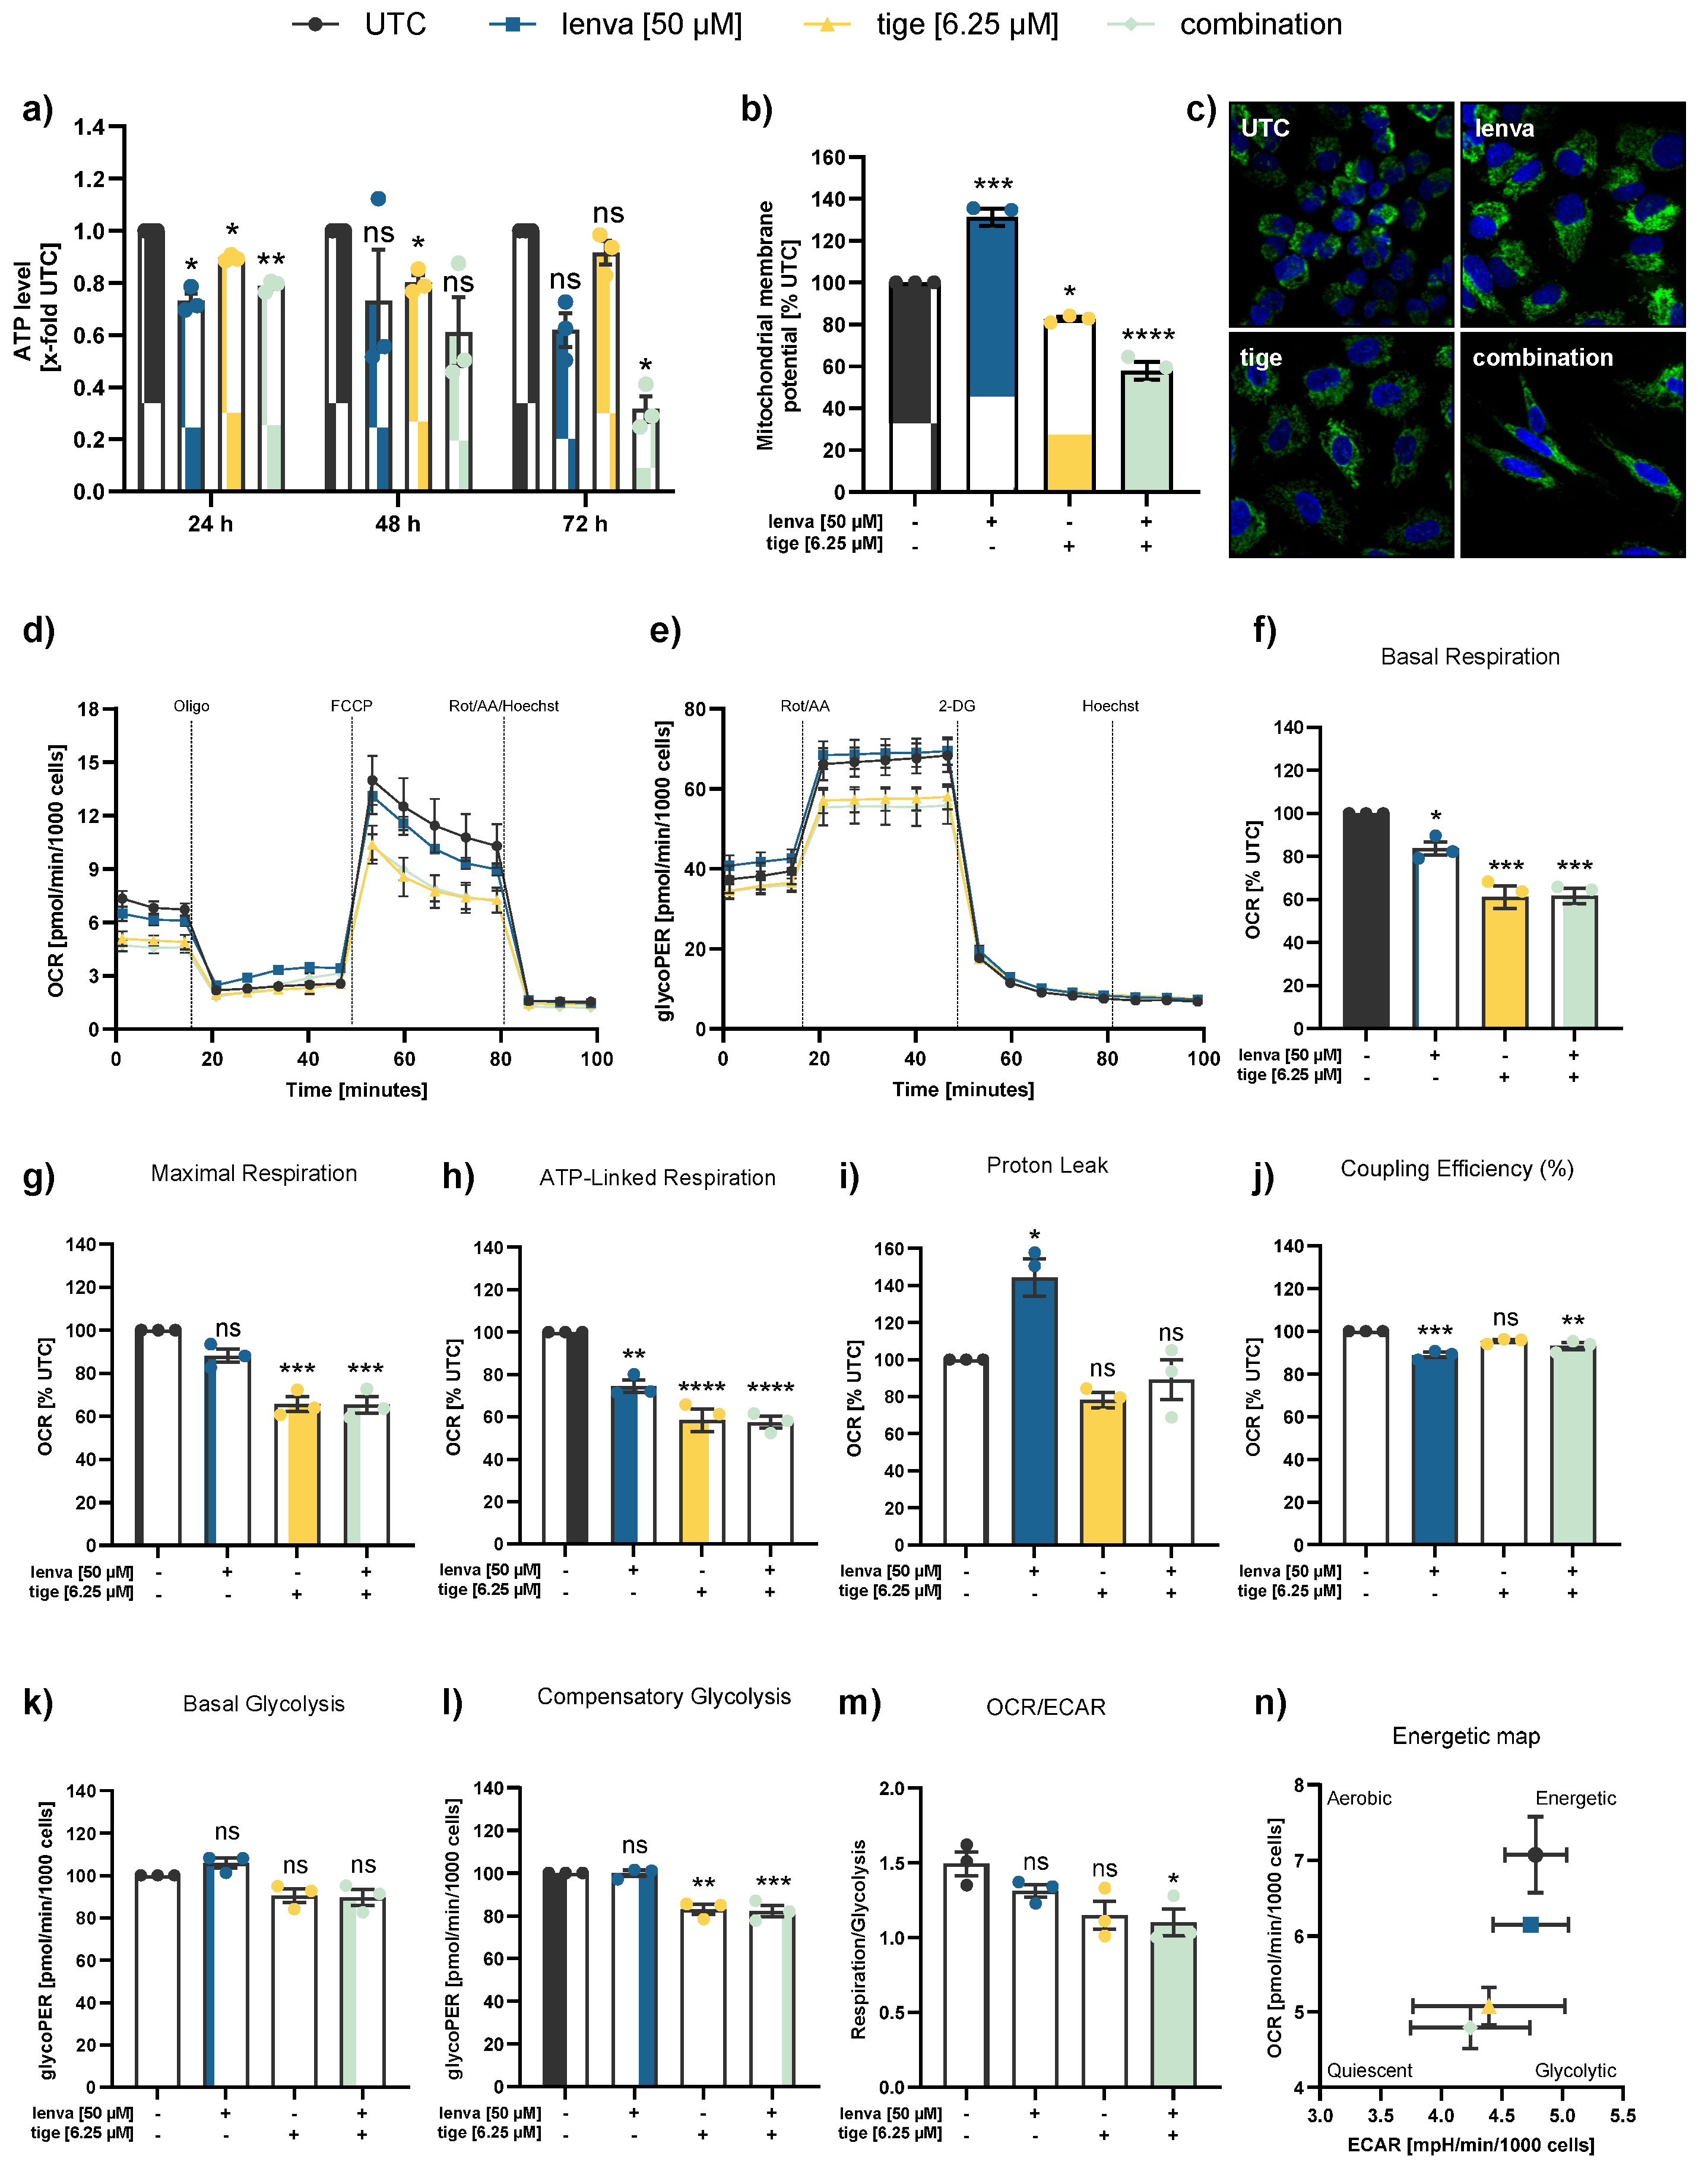
Figure 4.
Assessment of mitochondrial function and cellular metabolism in differentiated thyroid (DTC) K1 cancer cells after treatment with lenvatinib, eravacycline, and their combination. (a) ATP levels after 24, 48 and 72h treatment with lenvatinib (lenva, 50 µM), eravacycline (erava, 6.25 µM), or their combination. (b) Mitochondrial membrane potential (MMP) after 72 h treatment measured by JC-10 assay. (c) Confocal microscopy images after 72 h treatment showing nuclear staining (Hoechst 33342) and mitochondrial staining (MitoTracker Green), with a magnification of 40x (Zeiss LSM 700). (d) Representative line chart of the Seahorse XF Cell Mito Stress test using sequential injections of oligomycin (Oligo, 2.5 µM), the uncoupling agent fluoro-carbonyl cyanide phenylhydrazone (FCCP, 1 µM), and a combination of rotenone/antimycin A followed by Hoechst 33342 injection for normalization (Rot/AA/Hoechst, 0.5 µM, 0.5 µM and 2 µM, respectively). (e) Representative profile of the Glycolytic Rate assay with injections of Rot/AA (0.5 µM each), 2-deoxyglucose (2-DG, 50 mM) and Hoechst (2 µM). (f-m) Quantification of mitochondrial and glycolytic parameters after 12 h treatment: (f) basal respiration, (g) maximal respiration, (h) ATP-linked respiration, (i) proton leak, (j) coupling efficiency, (k) basal glycolysis, (l) compensatory glycolysis, and (m) OCR/ECAR ratios. (n) Energy map visualizing metabolic phenotypes. All data are normalized to the untreated controls (% UTC) and shown as mean ± SEM for n≥3; statistical analysis was performed using one-way ANOVA followed by Dunnett’s multiple comparison test. Significance is indicated as *p < 0.05, **p < 0.01, ***p < 0.001, and ****p < 0.0001 or not significant (ns).
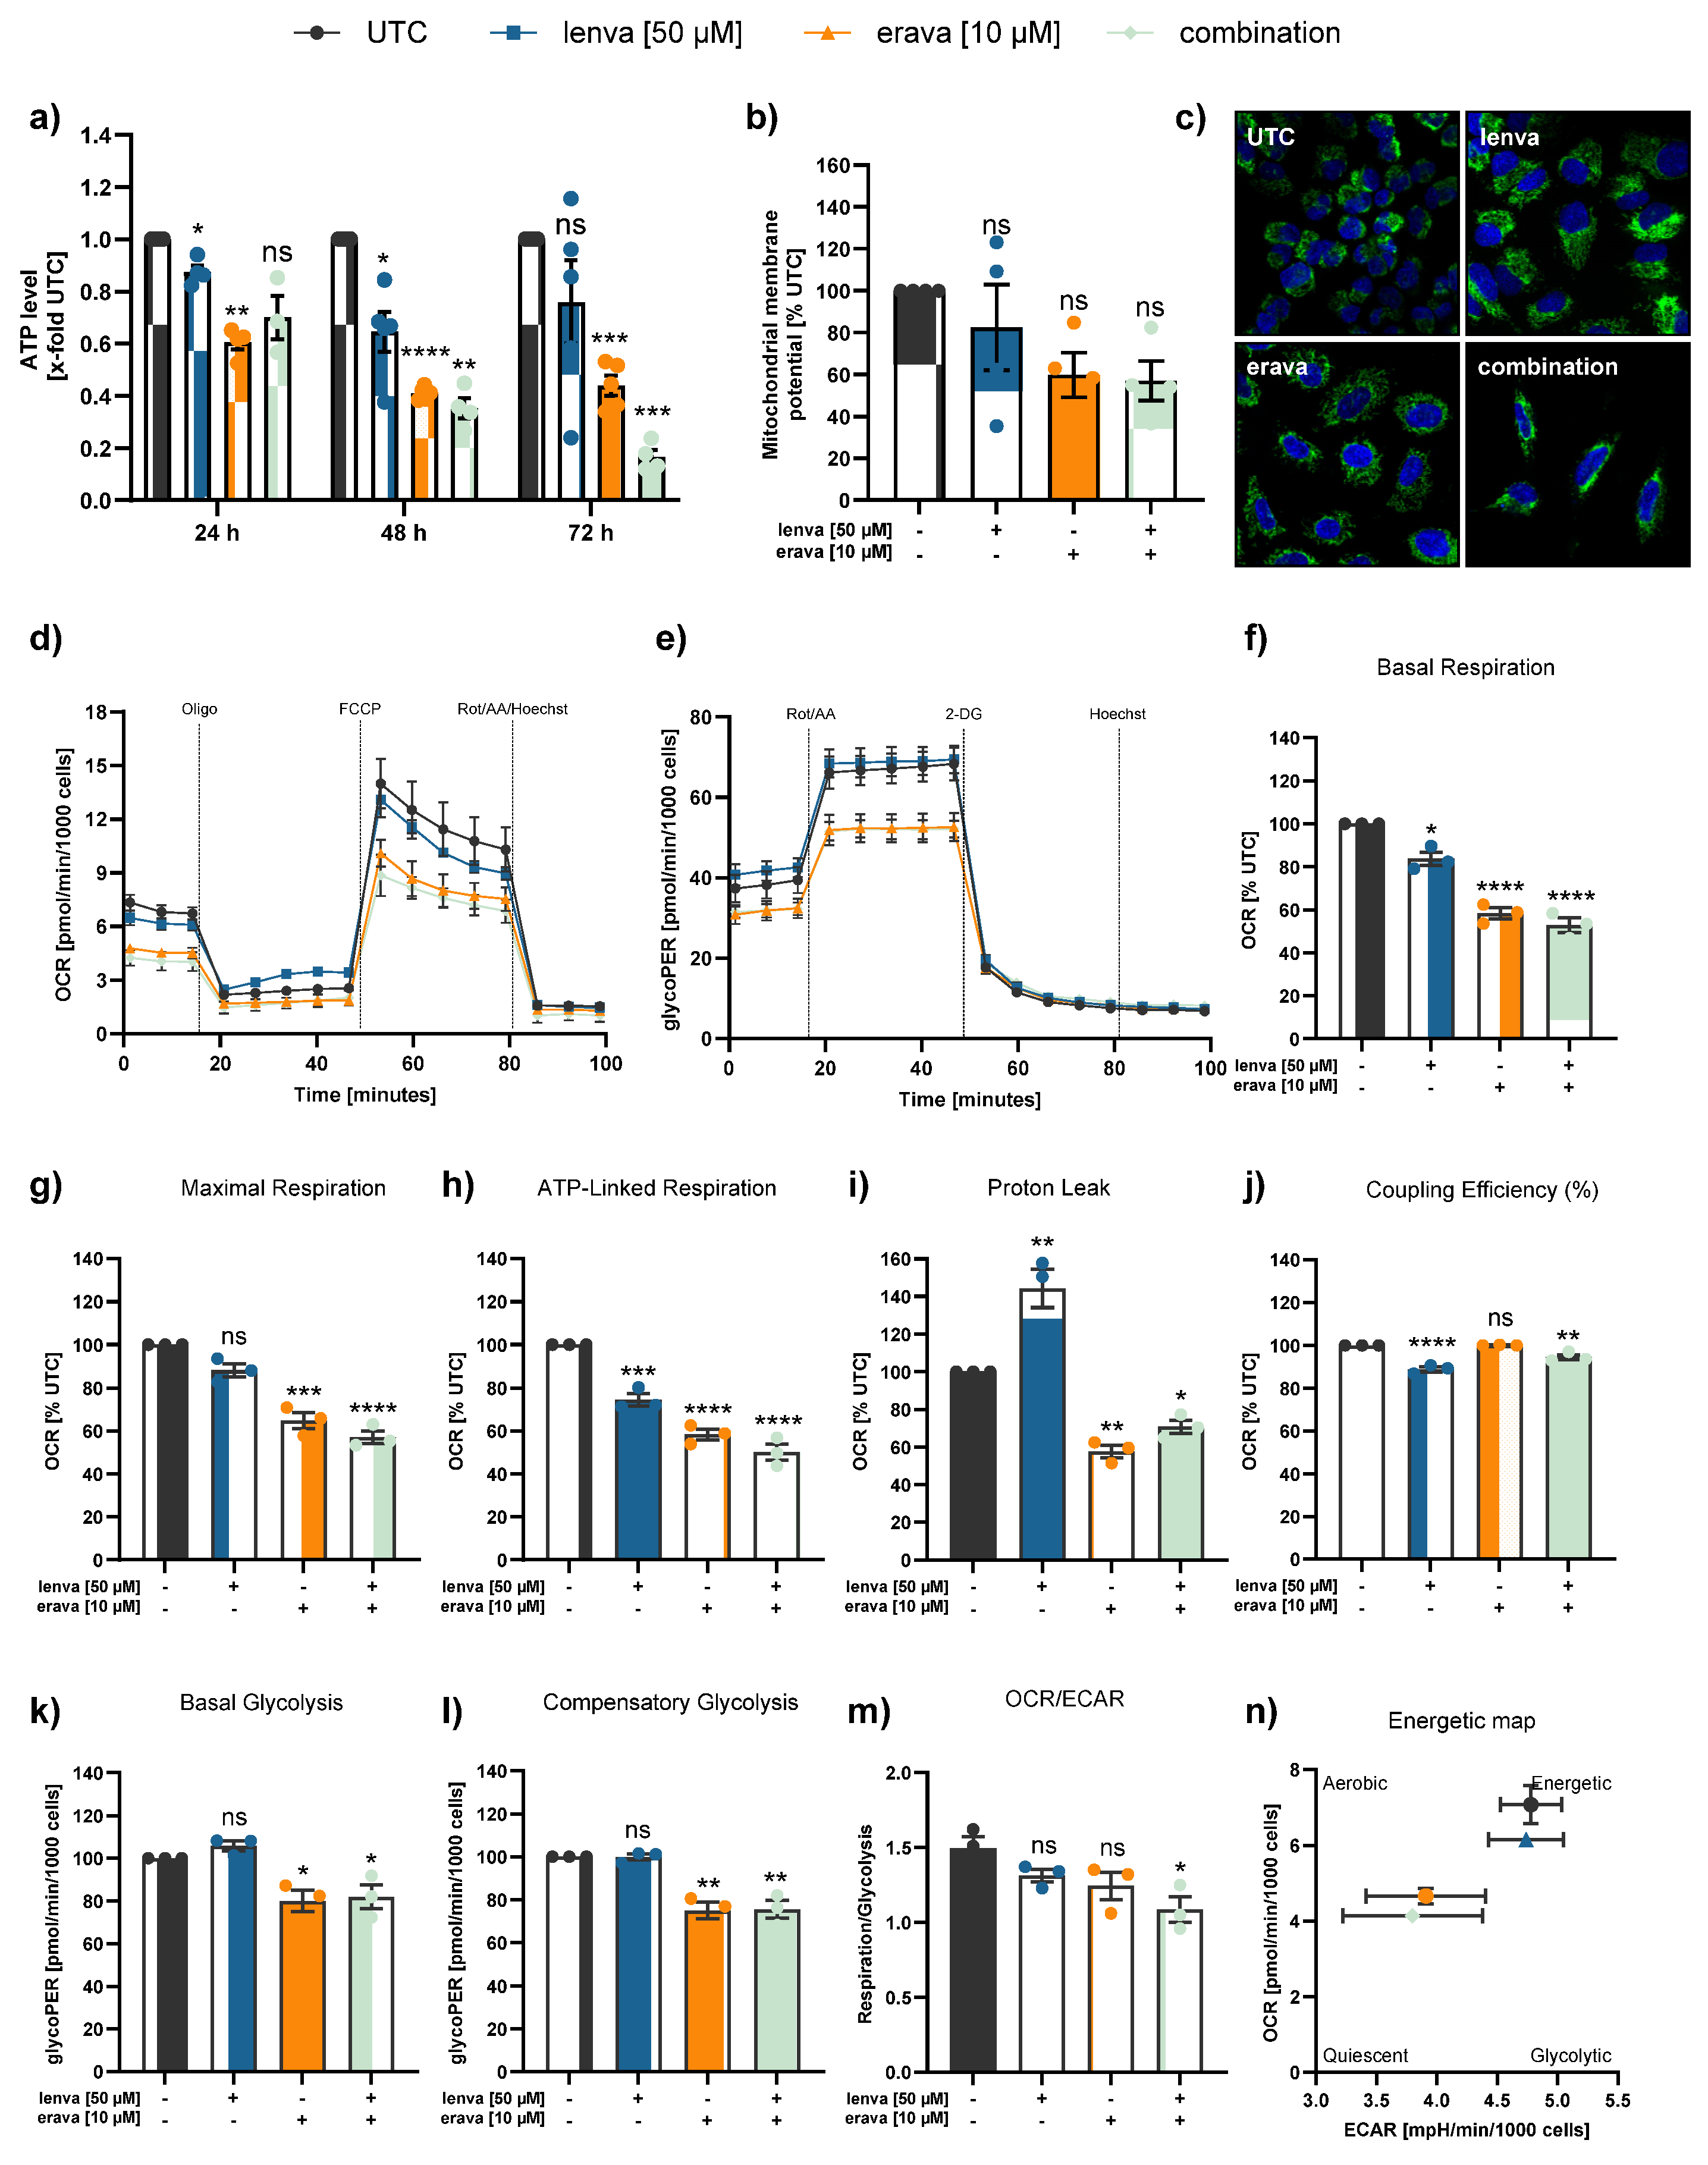
Figure 5.
Effect of lenvatinib and tigecycline combinational treatment on apoptosis related proteins and activity in differentiated thyroid (DTC) K1 cancer cells. Western blot analysis of (a) Bcl-xl, (b) Mcl-1, (c) Bcl-2, (d) Caspase-7, and (f) PARP and Cleaved-PARP in K1 cells after 24 h treatment with lenvatinib (50 µM), tigecycline (6.25 µM) or their combination. Protein expression was quantified via normalization to corresponding loading controls, which were further referred to untreated control cells (x-fold to untreated control = UTC). (e) Caspase-3/7 activity was measured in K1 cells after treatment with lenvatinib (50 µM), tigecycline (6.25 µM) or the combination of both for 24, 48 and 72 h. Luminescence values were normalized to the UTC (x-fold). Data are shown as mean ± SEM for n≥3; statistical analysis was performed using one-way ANOVA followed by Dunnett’s multiple comparison test. Significance is indicated as *p < 0.05, **p < 0.01, ***p < 0.001, and ****p < 0.0001 or not significant (ns).
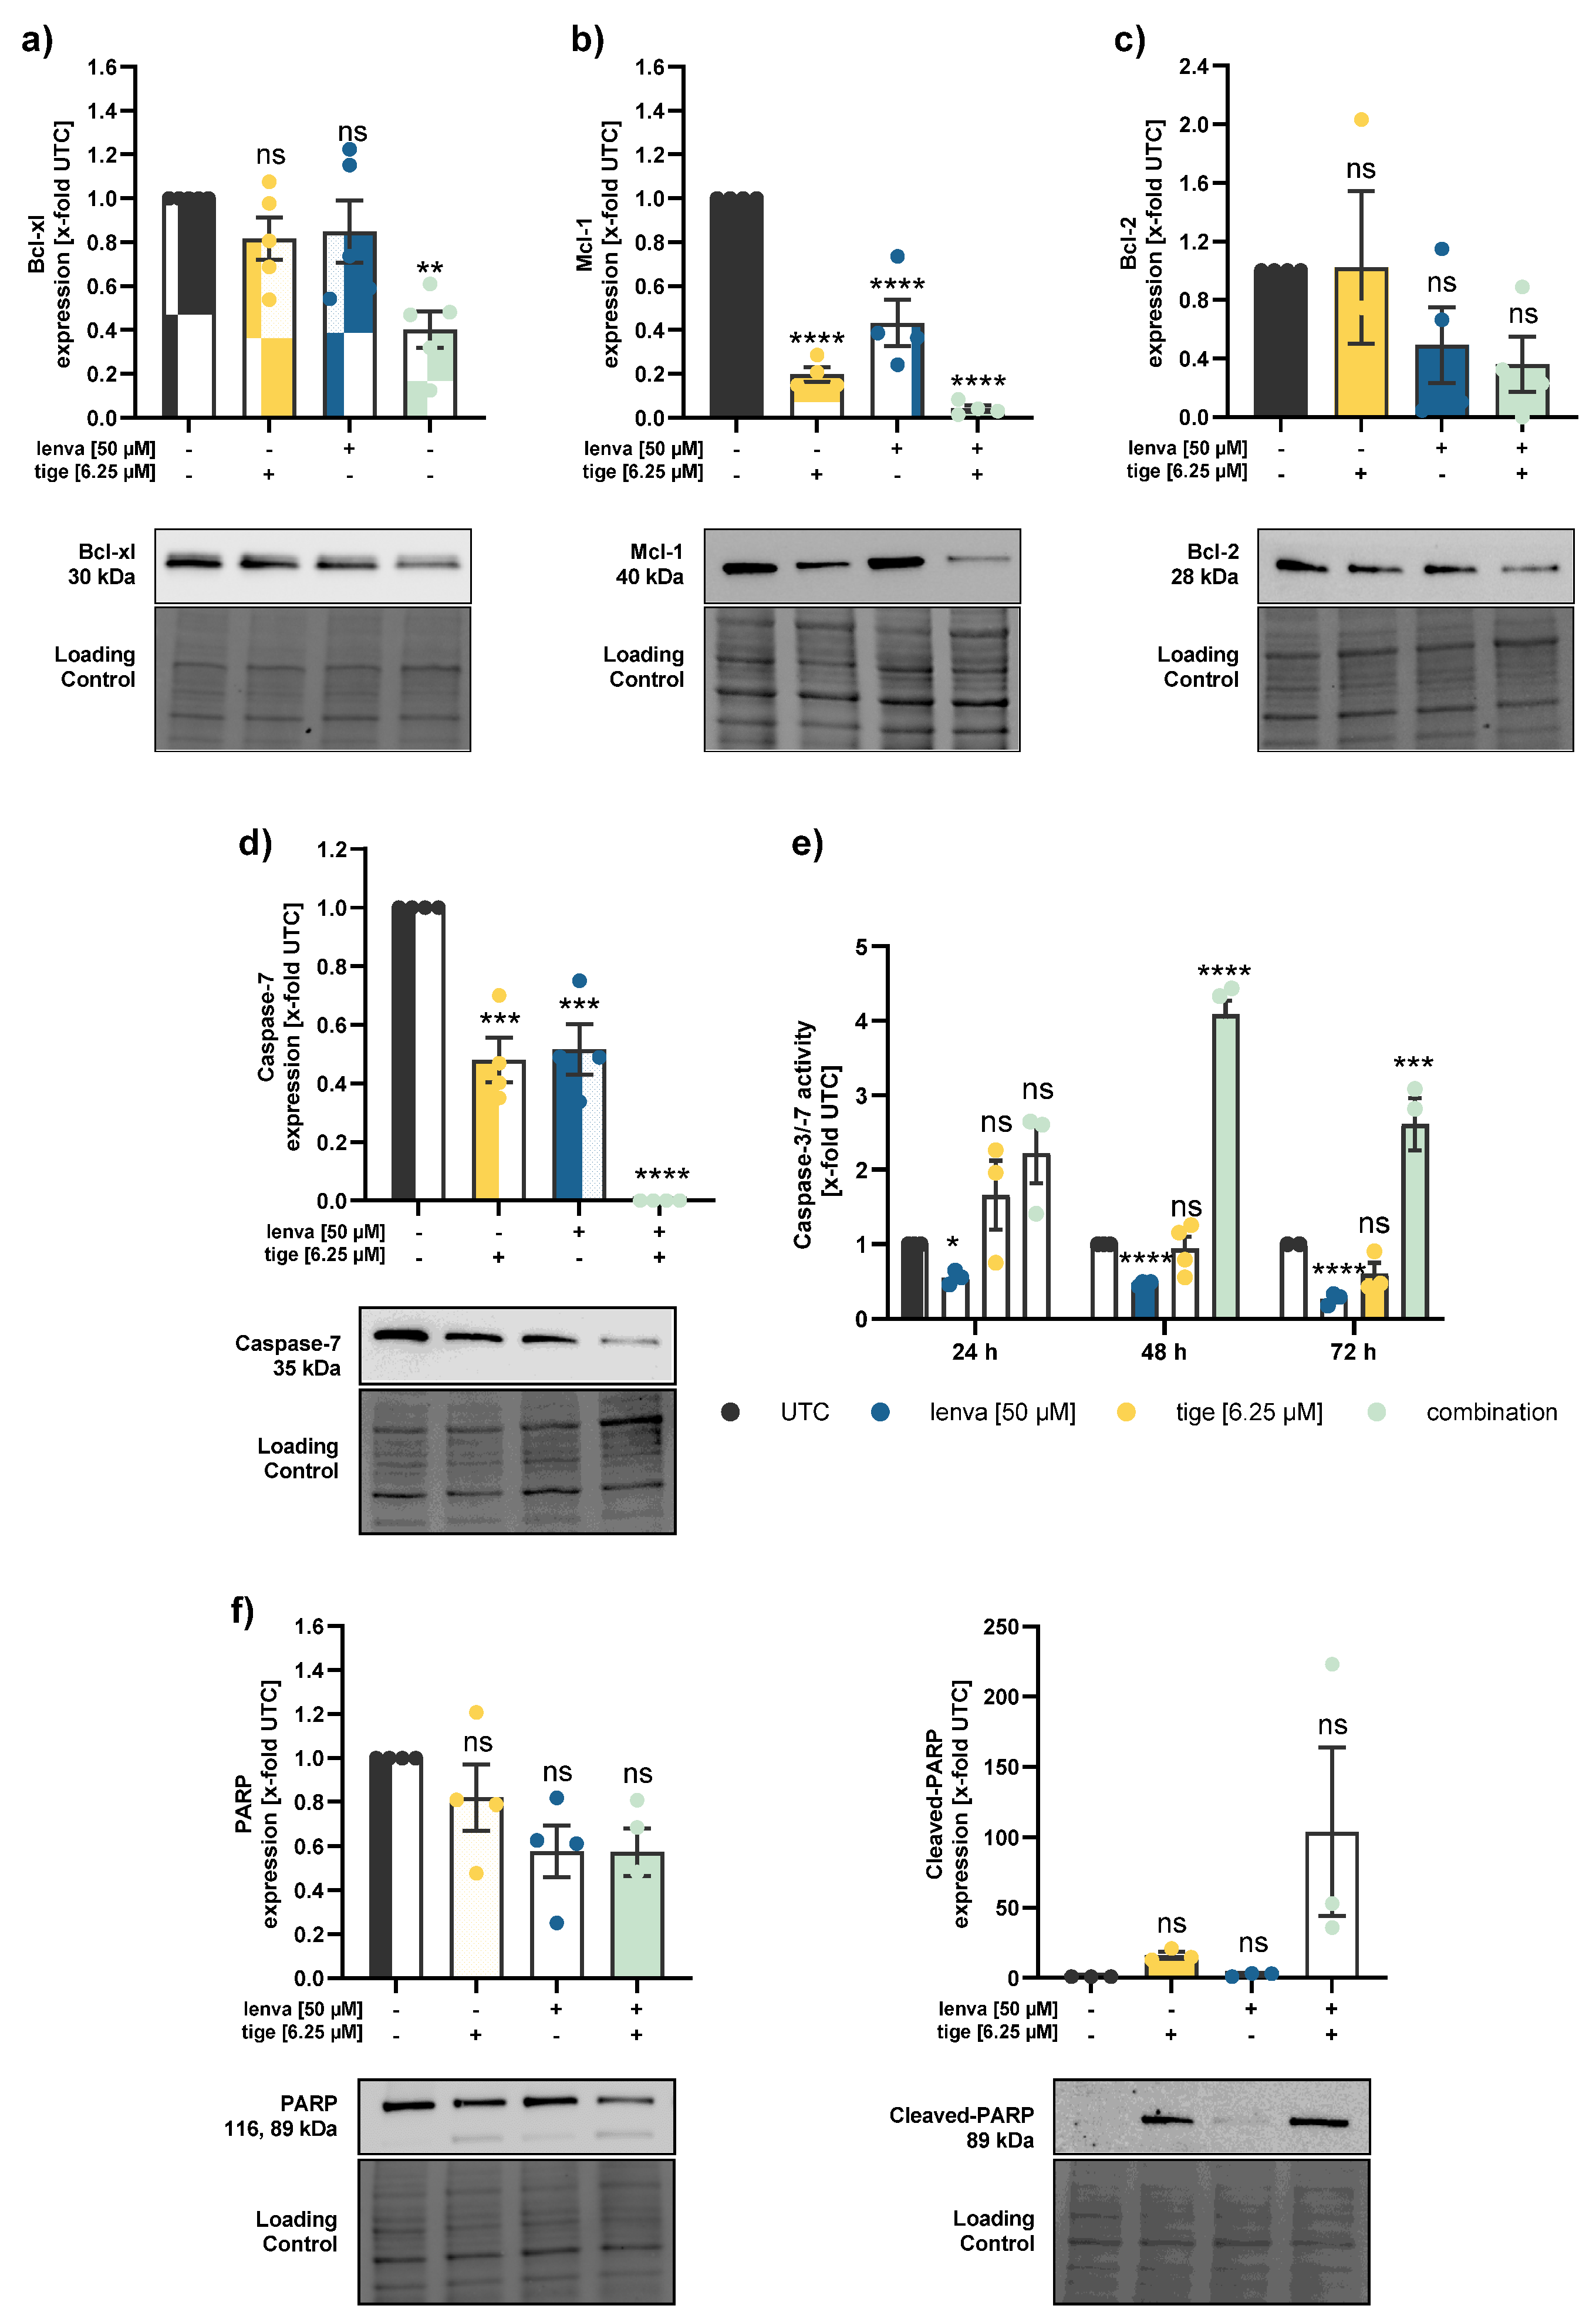
Figure 6.
Effect of lenvatinib and eravacycline combinational treatment on apoptosis related proteins and activity in differentiated thyroid (DTC) K1 cancer cells. Western blot analysis of (a) Bcl-xl, (b) Mcl-1, (c) Bcl-2, (d) Caspase-7, and (f) PARP and Cleaved-PARP in K1 cells after 24 h treatment with lenvatinib (50 µM), eravacycline (10 µM) or their combination. Protein expression was quantified via normalization to corresponding loading controls, which were further referred to untreated control cells (x-fold to untreated control = UTC). (e) Caspase-3/7 activity was measured in K1 cells after treatment with lenvatinib (50 µM), eravacycline (10 µM) or the combination of both for 24, 48 and 72 h. Luminescence values were normalized to UTC (x-fold). Data are shown as mean ± SEM for n≥3; statistical analysis was performed using one-way ANOVA followed by Dunnett’s multiple comparison test. Significance is indicated as *p < 0.05, **p < 0.01, ***p < 0.001, and ****p < 0.0001 or not significant (ns).
Disclaimer/Publisher’s Note: The statements, opinions and data contained in all publications are solely those of the individual author(s) and contributor(s) and not of MDPI and/or the editor(s). MDPI and/or the editor(s) disclaim responsibility for any injury to people or property resulting from any ideas, methods, instructions or products referred to in the content. |
© 2025 by the authors. Licensee MDPI, Basel, Switzerland. This article is an open access article distributed under the terms and conditions of the Creative Commons Attribution (CC BY) license (http://creativecommons.org/licenses/by/4.0/).
Copyright: This open access article is published under a Creative Commons CC BY 4.0 license, which permit the free download, distribution, and reuse, provided that the author and preprint are cited in any reuse.


