Submitted:
11 June 2025
Posted:
11 June 2025
You are already at the latest version
Abstract
To enable non-destructive evaluation of wood mechanical properties, this study proposes a backpropagation neural network (BP) optimized by an adaptive fractional-order particle swarm optimization algorithm (AFPSO), termed LK-BP-AFPSO. This model accurately predicts four key mechanical properties—longitudinal tensile strength (SPG), modulus of elasticity (MOE), bending strength (MOR), and longitudinal compressive strength (CSP)—by extracting limited physical features without damaging the wood structure. The proposed method demonstrates strong generalization and robustness across various Cunninghamia lanceolata types, including fast-growing (YKS), red-heart (CSH, XXH), and iron-heart (XXT) variants. A key challenge lies in effectively identifying informative features from indirect measurements. To address this, the Liang–Kleeman (L-K) information flow theory—a first-principle-based, efficient causality analysis method—is introduced. By quantifying causal influence through the coefficient of variation, L-K information flow enables effective feature ranking, which further enhances the model’s prediction accuracy and efficiency. This integrated framework offers a reliable solution for non-destructive mechanical property prediction of wood, contributing to intelligent assessment in forestry engineering.
Keywords:
Cunninghamia lanceolata
; Liang–Kleeman information flow
; causal influence
; adaptive particle swarm optimization
; non-destructive prediction
; backpropagation neural network
1. Introduction
Wood, as a green and renewable material, is widely used in construction, furniture, and structural engineering. Its mechanical properties directly determine the safety and reliability of its engineering application0. However, conventional methods for evaluating wood mechanical properties are often destructive, labor-intensive, and costly, making it difficult to conduct rapid, large-scale assessments. Therefore, developing an efficient and non-destructive evaluation (NDE) method for assessing the mechanical properties of wood holds significant practical value0.
In recent years, artificial intelligence (AI) technologies have been increasingly applied in materials science. Among them, the backpropagation neural network (BP) has shown great potential in property prediction due to its powerful nonlinear modeling capability0. However, traditional BP models often suffer from issues such as getting trapped in local minima and slow convergence, limiting their effectiveness in high-precision prediction tasks. To overcome these drawbacks, this study integrates an adaptive fractional-order particle swarm optimization algorithm (AFPSO) to optimize the parameters of the BP model, resulting in the LK-BP-AFPSO model. This optimization significantly enhances the model’s prediction accuracy and generalization capability.
Moreover, due to the heterogeneous and complex internal structure of wood, identifying the most influential variables from a limited set of physical features remains a critical challenge for accurate prediction0. To address this, the Liang–Kleeman (LK) information flow theory is introduced to compute the quantitative causal influence between multiple features and multiple target variables. Rooted in physical first principles, LK information flow offers an effective measure of causal strength with high computational efficiency. By embedding LK-based feature importance ranking into the LK-BP-AFPSO framework, the overall prediction performance is further improved.
This study focuses on four types of Cunninghamia lanceolata—fast-growing (YKS), red-heart (CSH and XXH), and iron-heart (XXT) to evaluate the effectiveness of the proposed method in predicting four mechanical properties: longitudinal tensile strength (SPG), modulus of elasticity in bending (MOE), bending strength (MOR), and longitudinal compressive strength (CSP). The input feature set includes basic wood density, air-dry shrinkage rates (radial, tangential, volumetric), and oven-dry shrinkage rates (radial, tangential, volumetric). Experimental results show that the proposed method achieves prediction accuracy up to 90%, demonstrating its feasibility for non-destructive evaluation of wood mechanical properties. These findings provide valuable insights for selecting high-quality timber and optimizing processing techniques, thereby extending the service life of functional wood and promoting sustainable development in the wood industry.
The main contributions of this paper are summarized as follows:
(1) A BP neural network model optimized using the adaptive fractional-order particle swarm optimization algorithm (AFPSO) is proposed, which significantly improves parameter optimization. This method enhances prediction accuracy, accelerates convergence, and avoids local optima—common limitations of traditional BP models.
(2) The LK information flow theory is innovatively applied to wood property prediction, enabling feature importance ranking based on causal influence. And it is proved that its influence on the prediction accuracy of the model is far better than principal component analysis (PCA).
(3) A unified evaluation framework is established for different Cunninghamia lanceolata types (YKS, CSH, XXH, XXT), and multiple intelligent optimization algorithms (AFPSO, PSO, GWO, WOA, FA, DE) are systematically compared within the BP framework. Results confirm that the proposed LK-BP-AFPSO model outperforms alternatives in both accuracy and stability across datasets, showing strong generalizability.
2. Related Works
The Liang-Kleeman (L-K) information flow technique has been widely adopted in causal analysis. Without requiring any prior knowledge, it quantitatively characterizes the causal effect between two time series by evaluating the amount of information transferred from one to the other within a unit time interval0. At present, this method is primarily applied in causal inference tasks. For example, literature0 investigated the causal relationship between the Atlantic Multidecadal Oscillation (AMO) and the North Atlantic sea surface heat flux using information flow theory, revealing that, over multidecadal scales, the information flow from AMO to heat flux was significantly stronger than in the opposite direction—demonstrating that AMO is the primary driver of sea surface heat flux anomalies and that the ocean plays a dominant role in ocean-atmosphere heat exchange. In another study, literature0 applied the information flow approach to analyze the causal relationship between precipitation and landslide-debris flow disasters, leading to improved prediction accuracy in high-risk areas. In literature0, the L-K information flow theory was used to construct a causal connectivity network for autism spectrum disorder, while literature00 detected causal relationships between solar radiation and ocean heat content across multiple temporal scales using multiscale L-K information flow.
Currently, there are three main approaches for analyzing correlations in wood properties: correlation-based methods, data-driven models, and multiscale causal modeling. In literature00, correlation-based techniques were employed to explore differences in physical and mechanical properties among various Eucalyptus and Chinese fir species. Deep learning methods have also been utilized literature0 combined a convolutional neural network (CNN) backbone with a recurrent neural network (RNN) to extract multiview features from images, significantly enhancing plant identification accuracy. In literature0, a deep learning model was developed to screen semiconductor energy storage materials with high bandgap prediction accuracy, achieving a considerable increase in computational speed. literature0 proposed a miRNA-disease association prediction algorithm based on graph convolutional networks and principal component analysis (GCNPCA). In literature0, classification and identification of rosewood species were performed using multimodal texture fusion, CNNs, and vessel element analysis, contributing to intelligent identification and expert systematization. In literature0, machine learning and interval evidence reasoning were applied to predict the mechanical properties of particleboard, supporting real-time monitoring and intelligent feedback in manufacturing processes.
In recent years, various machine learning and intelligent optimization strategies have been developed for nondestructive prediction of thermally modified wood. For instance, literature0 introduced a BP neural network optimized using a Tent-map-enhanced sparrow search algorithm (TSSA), improving convergence and prediction accuracy. Building on this, literature0 proposed a novel grey wolf optimization strategy (NAGGWO) by integrating chaotic parameter mapping (CPM), nonlinear control parameters, and adaptive grouping mechanisms to enhance the stability and search performance of BP networks. In literature0, support vector regression (SVR) models were used to predict MOE, MOR, and shear strength from wood color parameters following thermal treatment, with coefficients of determination reaching up to 0.903—demonstrating the potential of color-based nondestructive evaluation. In literature0, a linear regression model incorporating longitudinal natural frequency and structural parameters was developed, effectively improving the prediction accuracy of MOE and MOR in components with variable cross-sections. literature0 proposed a hybrid model integrating L-K information flow with tracheid morphological features to quantify the causal influence of microstructural traits on mechanical properties. literature0 combined Lamb wave propagation velocity with group velocity processing techniques to evaluate MOE and MOR under varying moisture content, validating its sensitivity to material condition and effectiveness in nondestructive testing. In literature0, CNNs were applied to extract anatomical features from cross-sectional images, and the incorporation of density information significantly improved prediction accuracy, underscoring the importance of combining structural and density data. In literature0, K-S tests were used to analyze the distribution of density and dynamic modulus of elasticity in fast-growing fir, and a shear analogy method was employed to predict the performance of CLT components—highlighting the beneficial effect of high-grade timber on structural strength.
Despite the significant advancements made in applying intelligent optimization algorithms (e.g., TSSA, GWO, IDBO) and machine learning techniques (e.g., SVR, CNN, BP neural networks) to the prediction of mechanical properties in thermally modified or other wood types—particularly in enhancing convergence speed, prediction accuracy, and feature extraction—this study offers the following unique contributions:
(1) From a model optimization perspective, we innovatively incorporate an Adaptive Fractional-Order Particle Swarm Optimization (AFPSO) algorithm to optimize the weights and thresholds of BP neural networks. This approach, leveraging a fractional-order update mechanism and dynamic inertia adjustment strategy, enhances the network's global search capability and robustness.
(2) To comprehensively validate model performance, we construct both a LK-BP-AFPSO model and a Multiple Linear Regression (MLR) baseline model, allowing comparison across nonlinear and linear paradigms.
(3) On the data front, we gather thermally treated Chinese fir samples (CSH2, YKS2, XXH2, XXT2) from various regions and treatment conditions, significantly improving the model’s generalizability and practical applicability.
(4) Lastly, the proposed hybrid framework integrates L-K information flow with the AFPSO algorithm, enabling interpretable modeling by quantifying the causal strength between wood physical attributes and mechanical performance. The causally relevant features are then used to guide AFPSO in optimizing neural network parameters, culminating in a high-efficiency predictive model with strong interpretability and robustness.
3. Related Theories
3.1. Liang-Kleeman Information Flow
Liang-Kleeman's theory of information flow is a quantitative approach to analyzing causality based on information entropy. It differs from traditional empirical and semi-empirical statistical models and is a strictly deduced quantitative causality theory from the first principle of physics. The transmission of information from one entity to another is considered the information flow. According to the zero-causality criterion, an information flow must exist behind a pair of causal relationships0. The L-K information flow method can quantitatively represent the causal relationship between two time series and by measuring the information transfer per unit of time between them. This assumes that there is no relevant a priori knowledge of the two time series and . However, the significance of L-K information flow exceeds its implied causality, propagation of uncertainty, and transfer of predictability. Its applications span across several fields, including neuroscience, finance, climate science, turbulence studies, network dynamics, and dynamical systems, particularly in the realm of synchronization0.
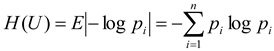
In a source, it is not the uncertainty of the occurrence of a particular individual symbol that is considered, but the average uncertainty of all possible occurrences of this source. If the source symbol has n values: ... ... , the corresponding probability is: ... ... , and the various symbol occurrences are independent of each other. At this point, the average uncertainty of the source should be the individual symbol uncertainty -log The statistical average (E), which can be called the information entropy, i.e.
Consider 2D autonomous systems
 where F=( , ), x = ( ) Ω.
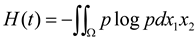
Suppose the sample space Ω is the direct product of Ω1 and Ω2. Let {x,t} be a stochastic process and x=() be the randomized process corresponding to (,) the random variable, p=p(,t) be the probability density distribution at t. The The joint information entropy of is formulated as:
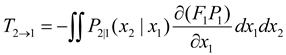
So, from to the information entropy transfer rate, i.e., the L-K information flow is:
If the random variable the n-dimensional vector obeys a stochastic dynamical system
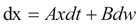 where A=(aij),B is a constant matrix representing random white noise and if its covariance matrix is (),then for any i,j=1,...... ,n,i≠j,from to the L-K information flow is
included among these
is the covariance matrix between and for two-dimensional variable,], is the variance of .
where A=(aij),B is a constant matrix representing random white noise and if its covariance matrix is (),then for any i,j=1,...... ,n,i≠j,from to the L-K information flow is
included among these
is the covariance matrix between and for two-dimensional variable,], is the variance of .
Definition 3.1 Causal effect (CE): For a causal pair If the increase/decrease of increase/decrease of the causal pair, i.e., the covariance is positive, then the causal effect of is positive, then the causal effect is positive; conversely, if the rise/fall of the rise/decline of the covariance leads to a rise/decline of the rise/fall of the causal effect leads to the rise/fall of the causal effect, i.e., the covariance is negative, then the causal effect of the causal effect is negative.
On the flip side, L-K information flow refers to the speed of the transfer of information entropy, while causal influence denotes the directionality of information entropy transfer for causal pairs. As a result, the intensity of causal association can be quantified using L-K information flow. However, the flow of L-K information for various causal pairs operates on different scales. Therefore, a large L-K information flow does not necessarily indicate a significant causal strength. Additionally, the degree of dispersion is unrelated to the scale of the flow. Thus, the degree of dispersion of the L-K information flow per unit time is a suitable quantitative metric for describing causal strength.
Definition 3.2 Coefficient of Variation (CV): CV is the ratio of the standard deviation of the original data to the mean of the original data. By calculating the coefficient of variation of the original data can eliminate the differences in the scale of measurement and the influence of the scale, and better describe the degree of dispersion of the variable. Its calculation formula is as equation (6):
 where denotes the standard deviation and AVG denotes the mean.
In this paper, we introduce the use of "CV" to denote the discrete degree of information flow from L-K. Subsequently, the magnitude of CV of the L-K information flow can describe the strength of causal influence. By calculating the coefficient of variation (CV) of L-K information flow from various physical properties to mechanical properties, we can arrive at different causal influence strengths between different physical and mechanical properties.
In summary, the guidelines for establishing causality in the L-K information flow are:
(i) The existence or non-existence of L-K information flow can establish the presence of a causal connection between variables; (ii)
(ii) The positive and negative indicators of the coefficient of variation of L-K information flow can establish the positivity or negativity of the causal impact between variables.
(iii) The intensity of causal influence can be quantitatively described by the magnitude of the absolute value of the coefficient of variation of the L-K information flow.
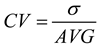
3.2. CDG Model
Causal Directed Graph (CDG) is a causal network graph composed of nodes and directed edges between them. It is a quantitative model which utilizes the lines connecting nodes to express causal relationships between variables in a system. The directed edges are assigned weighted values, which represent the intensity of causal influence between the variables. These values are also known as the coefficient of variation of the information flow. CDG is capable of encompassing large-scale potential information in the system. Below is a mathematical explanation of the CDG model.
Definition 3.3: CDG Model: The CDG model is a directed graph and a function which is a combination of = ( ). where:
(1) Directed graph consists of 4 parts = (, , and):
(A) set of nodes ;
(B) Branch collection ;
(C) Neighborhood associators "". (start node of a branch) and "": (the terminating node of the branch), which represent the start node and terminating node of each branch, respectively "" and termination node "". The start node and the termination node of a branch constitute a causal pair (CP:causal pair), denoted as CP=( , ).
(2) Functions : , is called the branch The symbols of (). If is positively causal, then =+, otherwise =. In the CDG model, positive causality is represented by a solid line and negative causality is represented by a dashed line.
There are three nodes in Figure 1 , the . , in the CDG model, the branch e = ( , ) has a sign determined by the ) is determined by the positivity and negativity of ). Since CV( > 0, so , the branch is represented in the CDG model by the solid line state of the branch; since CV( < 0, so , a dashed line is used in the CDG model to represent the branching The CDG model can also be used to represent the state of a branch by comparing and The branch can also be derived by comparing the magnitude of the absolute values of the coefficients of variation of the branch and the magnitude of the CE intensity between them.
3.3. LK-LK-BP-AFPSO Model
The proposed LK-LK-BP-AFPSO model integrates causal feature selection based on the LK information flow method, a backpropagation neural network (BP), and an adaptive fractional-order particle swarm optimization algorithm (AFPSO). This section provides the theoretical foundation and structural advantages of each component in the hybrid framework.
A. Backpropagation Neural Network (BP)
The BP neural network is a widely used multilayer feedforward network trained via the error backpropagation algorithm. It consists of an input layer, one or more hidden layers, and an output layer, with full connections between neurons in adjacent layers. The network is trained by minimizing the mean squared error (MSE) between the predicted and actual outputs using gradient descent. Despite its strong nonlinear approximation capability, the BP model suffers from several limitations, including slow convergence, sensitivity to initial weights, and a tendency to fall into local minima. These shortcomings often necessitate the use of optimization algorithms to enhance its stability and predictive accuracy.
B. Adaptive Fractional-Order Particle Swarm Optimization (AFPSO)
AFPSO is an improved variant of the traditional particle swarm optimization (PSO) algorithm that incorporates fractional calculus and adaptive mechanisms. Unlike classical PSO, which updates particles’ velocities and positions using integer-order difference equations, AFPSO adopts a fractional-order dynamic update strategy. This extension enhances memory effects and global search capabilities by accounting for the historical behavior of particles. Additionally, adaptive adjustment strategies for inertia weights and acceleration coefficients are introduced, allowing the algorithm to balance exploration and exploitation dynamically across iterations. AFPSO has demonstrated superior performance in optimizing complex, high-dimensional nonlinear functions and is particularly effective in fine-tuning the parameters of neural networks. Figure 2 describes the flow chart of AFPSO algorithm.
C. Hybrid Model Structure and Advantages
The LK-LK-BP-AFPSO model consists of three functional modules: (1) a causal feature modeling module based on the LK information flow theory, which quantitatively identifies and selects features with strong causal influence on the target variable, enhancing the interpretability and relevance of the input data; (2) a BP neural network for learning complex nonlinear mappings between input features and outputs; and (3) an AFPSO-based optimization module, which globally optimizes the weights and biases of the BP network to improve prediction accuracy and convergence stability. The basic architecture of the hybrid model is shown in Figure 3.
D. Model Performance Evaluation
This article evaluates the accuracy of the model using mean square error (MSE), root mean square error (RMSE), and mean absolute error (MAE). Their calculation methods are shown in formulas (7,8,9), where n represents the sample size, represents the true value, and represents the predicted value of the model. MSE, RMSE, and MAE are all non negative values, and a smaller value indicates a better model.
This integrated model offers several notable advantages:
(1) Causality-Driven Feature Selection**: By leveraging the LK information flow, the model emphasizes physically interpretable and causally relevant features, leading to more meaningful and robust predictions.
(2) Enhanced Global Optimization**: The AFPSO algorithm overcomes the limitations of traditional training methods by preventing local minima entrapment and adapting to dynamic optimization landscapes.
(3) Improved Accuracy and Convergence**: The synergy between AFPSO and BP enables faster convergence and higher prediction precision.
(4) High Generalizability**: The modular structure of the model supports easy adaptation to other tasks involving nonlinear system modeling and prediction.
In summary, the LK-LK-BP-AFPSO hybrid model combines the interpretability of causality-based feature modeling, the flexibility of neural networks, and the efficiency of adaptive global optimization. It is particularly suited for complex prediction tasks where both domain knowledge and data-driven insights are essential.
4. Experiment
4.1. Materials and Sample Preparation
Four varieties of Cunninghamia lanceolata (Chinese fir) were selected for this study: fast-growing Chinese fir (YKS), two types of red-heart Chinese fir (CSH and XXH), and iron-heart Chinese fir (XXT). The YKS specimens were harvested from Yangkou Town, Guangfeng District, Shangrao City, Jiangxi Province, with an average age of 53 years and a mean diameter at breast height (DBH) of 47.5 cm. The CSH and XXH samples were collected from Chenshanyuan, Liuyang City, Changsha, Hunan Province, with respective average ages of 51 and 50 years, and mean DBHs of 29.5 cm and 30.8 cm. The XXT samples originated from Xiaoxi, Jingning County, Lishui City, Zhejiang Province, exhibiting an average age of 53 years and a DBH of 28.6 cm. All wood specimens were prepared in accordance with the Chinese national standard GB/T 1927.2-2021, which specifies the procedures for physical and mechanical testing of wood. The fundamental properties of the selected fir types are presented in Table 1.
4.2. Wood Properties
Wood density is one of the most critical indicators of wood quality, as it is closely associated with various physical and mechanical properties. It directly influences key mechanical performance metrics such as bending strength, compressive strength, and tensile strength. Consequently, density serves as a fundamental criterion for evaluating both the physical-mechanical behavior and processing characteristics of wood. Shrinkage is another essential physical property, especially in the radial and tangential directions. Differences in shrinkage between these two directions are the primary cause of cracking and warping during the drying process. Mechanical properties reflect a material’s resistance to deformation under external forces and provide a scientific basis for the rational utilization of wood. In this study, four principal mechanical properties were investigated: longitudinal tensile strength, modulus of elasticity (MOE) in bending, modulus of rupture (MOR), and longitudinal compressive strength. Table 2 provides the abbreviations used for nine physical properties, including basic density; air-dry tangential, radial, volumetric, and differential shrinkage rates; and oven-dry tangential, radial, volumetric, and differential shrinkage rates. Table 3 lists the abbreviations for the four mechanical properties mentioned above.
4.3. Data Acquisition and Processing
Collect and calculate 9 physical and 4 mechanical properties of four Chinese fir trees, YKS, CSH, XXH, and XXT, at different times to form a dataset for this experiment. In terms of physical properties, wood basic density (WBD) was measured in accordance with GB/T 1927.5-2022; Air dry shrinkage of tangent (AST), radial air dry shrinkage of radial (ASR), air dry shrinkage of volume (ASV), tangential dry shrinkage of tangent (ABST), and radial total dry shrinkage (ABSR) The absolute dry shrinkage of volume (ABSV) shall be determined in accordance with GB/T 1927.6-2022 "Determination of Dry Shrinkage". The air dry shrinkage of tangent to radial (ASTA) and absolute dry shrinkage of tangent to radial (ABSTA) values are calculated using the formula (differential shrinkage=tangential shrinkage/radial shrinkage). In terms of mechanical properties, the bending strength (MOR) of wood is determined in accordance with GB/T1927.9-2022 "Determination of Bending Strength", and the modulus of elasticity (MOE) of wood is determined in accordance with GB/T1927.10-2022 "Determination of Bending Elastic Modulus", The shear strength parallel to grain (SPG) and compressive strength parallel to grain (CSP) indicators of wood were measured in accordance with GB/T1927.16-2022 "Determination of Shear Strength Parallel to Grain" and GB/T 1927.11-2022, respectively. Each sample was tested on the Amsler 4 t universal mechanical testing machine, and the effective number of samples for each indicator was greater than 30. Using Excel for data statistics, using SPSS software for standard deviation analysis, significance test analysis, and other data processing. Table 4 records the mean distribution of 13 physical and mechanical properties of these 4 types of Chinese fir trees.
4.4. Results and Analysis
In this study, correlation analysis was first conducted to quantify the relationships among the various physical and mechanical properties of Cunninghamia lanceolata. The resulting correlation coefficients are presented in Table 5.
As shown in Table 5, the correlation coefficients among different physical and mechanical properties do not exhibit significant variation. More importantly, different physical properties may share identical correlation coefficients with the same mechanical property. For example, both air-dry shrinkage of tangential (AST) and air-dry shrinkage of volume (ASV) show a correlation coefficient of 0.95 with shear strength parallel to grain (SPG), and 0.89 with compression strength parallel to grain (CSP). Additionally, a single physical property may have the same correlation with different mechanical properties—for instance, AST shows a coefficient of 0.95 with both SPG and modulus of rupture (MOR), and similarly, ASV has a coefficient of 0.95 with both SPG and MOR. These findings suggest that correlation analysis alone is insufficient for distinguishing between properties such as AST and ASV or SPG and MOR when exploring structure–property relationships in wood. Consequently, it limits the potential for targeted breeding of functional timber
To address this issue, the present study introduces a quantitative causality analysis based on the calculation of Liang-Kleeman (L-K) information flow within a linear stochastic dynamical system framework. A MATLAB program was developed to compute the L-K information flow values. The variation coefficients and mean values of L-K information flow were calculated from nine physical properties to four mechanical properties (i.e., SPG, MOE, MOR, CSP). Based on the analysis results, the corresponding Causality Directed Graphs (CDGs) were constructed, as shown in Figure 4 (a–d).
4.5. Validation and Discussion
It is well known that the backpropagation (BP) neural network possesses strong capabilities in handling highly nonlinear relationships, making it particularly suitable for predicting the mechanical properties of wood. However, conventional BP networks rely on gradient descent methods to update weights, which are prone to becoming trapped in local minima. This can result in unstable prediction accuracy or suboptimal model performance. Therefore, it is necessary to integrate BP neural networks with intelligent optimization algorithms—such as Particle Swarm Optimization (PSO), Whale Optimization Algorithm (WOA), Grey Wolf Optimizer (GWO), Firefly Algorithm (FA), and Differential Evolution (DE)—to identify more optimal initial weights and biases, thereby enhancing model accuracy.
Figure 5 compares the performance of BP neural networks optimized by different algorithms in predicting the modulus of elasticity (MOE). The results indicate that, among all tested combinations, the PSO-optimized BP network achieves the highest predictive performance across various tasks related to the mechanical properties of Chinese fir.
To further validate the potential application of L-K information flow in feature selection, we constructed a backpropagation neural network optimized by the Adaptive Fractional-order Particle Swarm Optimization (LK-BP-AFPSO) algorithm. The model was used to predict four mechanical properties (SPG, MOE, MOR, CSP) of different types of Chinese fir (CSH, YKS, XXH, XXT). The performance of the model was evaluated using the Mean Absolute Error (MAE), as shown in Figure 6.
As shown in Figure 6, the LK-BP-AFPSO model exhibits higher accuracy when predicting SPG, MOR, and CSP. However, it shows a larger MAE when predicting MOE, which is related to the normal distribution of MOE, as its mean value is relatively high. Additionally, the model's accuracy varies when predicting different tree species, with better performance observed for the fir species XXH and lower performance for the fir species XXT.
To demonstrate the advantages of the proposed model, we compared it with the Multiple Linear Regression (MLR) model0, as shown in Figure 7. It can be seen that the proposed model offers higher prediction accuracy.
To further compare the fitting performance between the LK-BP-AFPSO model and the MLR model across different datasets, we utilized scatter plots to visualize the predicted values versus the true values, as shown in Figure 8. As observed in Figure 9, the results further highlight the advantages of the LK-BP-AFPSO model.
The LK information flow theory ranks feature importance from the perspective of causal influence, and the feature selection results demonstrate more significant differences compared to the Principal Component Analysis (PCA) algorithm, thus better improving the model's predictive accuracy. A comparison of the impact of LK information flow and PCA on model performance is shown in Figure 9. As illustrated in Figure 10, the LK information flow significantly outperforms PCA in enhancing the model's predictive accuracy.
To further validate the advantages of the LK information flow theory as a feature selection algorithm, we applied it for feature dimensionality reduction and ranked feature importance based on causal influence. Ultimately, WBD, ASTA, ABST, and ABSR were selected as the input features for the model. Figure 10 presents a comparison of the model's predictive performance before and after dimensionality reduction.
The experimental results demonstrate that the LK-BP-AFPSO model further improves the accuracy of wood mechanical property predictions. Moreover, LK information flow, as a novel feature selection algorithm, shows significant potential in enhancing model prediction accuracy. Future research can explore its application prospects in improving model prediction efficiency and interpretability.
5. Conclusions
In this study, a BP neural network optimized by an adaptive fractional-order particle swarm optimization algorithm (LK-BP-AFPSO) was developed for the nondestructive prediction of wood mechanical properties. The Liang-Kleeman (LK) information flow method was introduced to enhance feature selection by quantifying causal relationships between input variables and target properties. The experimental results across multiple datasets of thermally modified Chinese fir demonstrated that the proposed LK-BP-AFPSO model outperformed traditional optimization algorithms such as PSO, WOA, and GWO in terms of MSE, RMSE, and MAE. The LK-based feature selection approach showed superior effectiveness over PCA and null importance in identifying key predictors, contributing to improved model accuracy. Moreover, the model achieved robust performance across four mechanical indicators—specific gravity (SPG), modulus of elasticity (MOE), modulus of rupture (MOR), and compressive strength parallel to grain (CSP)—exhibiting strong generalization across different sample sources. Overall, this work provides a reliable and interpretable approach for evaluating wood mechanical performance, with practical potential in forestry product assessment and quality control.
Author Contributions
All authors have read and agreed to the published version of the manuscript.
Data Availability Statement
The data presented in this study are available on request from the corresponding author. In addition, both sample sampling and data measurements follow GB / T1927-2022.
Acknowledgments
This work was supported in part by the National Natural Science Foundation of China under Grants Nos. 62072477, 61309027, 61702562 and 61702561, the Hunan Provincial Natural Science Foundation of China under Grants No.2018JJ3888, the Hunan Key Laboratory of Intelligent Logistics Technology 2019TP1015.
Conflicts of Interest
The authors declare no conflict of interest. The funders had no role in the design of the study; in the collection, analyses, or interpretation of data; in the writing of the manuscript; or in the decision to publish the results.
References
- Wang C., Yang Z., Wang X., et al. Recent Advances in the Functionalization of Wood Research. Forestry Engineering Journal 2019, 4, 9. [Google Scholar]
- Qing Y., Liao Y., Liu J., et al. Recent Advances in Wood-based Energy Storage Materials. Forestry Engineering Journal 2021, 6, 1–13. [Google Scholar] [CrossRef]
- Zhang R., Zhu Y. Predicting the Mechanical Properties of Heat-treated Woods Using Optimization-Algorithm-Based BPNN. Forests 2023, 14, 935. [Google Scholar]
- Zhang P., Shang X., Wu Z. Comparison of Physical and Mechanical Properties of Eucalyptus Wood. Journal of Northwest Forestry University 2020. [Google Scholar] [CrossRef]
- San L., X. Information Flow and Causality as Rigorous Notions Ab Initio. Physical Review E 2016, 94, 052201-1-28. [Google Scholar]
- Gong Z., Sun C., Li J., et al. Application of Information Flow Theory in the Causal Analysis of Atlantic Multi-decadal Oscillation's Physical Mechanism. Atmospheric Sciences 2019, 43, 1081–1094. [Google Scholar]
- Lu Y., Xie T., Xu H., et al. Causal Analysis of Rainfall Indicators and Landslide Debris Flow Based on Information Flow Theory. Journal of Natural Disasters 2019, 28, 196–201. [Google Scholar] [CrossRef]
- Tao Z., Jing C., Fali L., et al. Causal Network Connectivity Patterns in Autism Spectrum Disorder Based on the Liang-Kleeman Information Flow Theory. International Journal of Psychophysiology 2021, 168. [Google Scholar]
- Gang W., Chang Z., Min Z., et al. Author Correction: The Causality from Solar Irradiation to Ocean Heat Content Detected via Multi-scale Liang-Kleeman Information Flow. Scientific Reports 2021, 11. [Google Scholar]
- Climate Systems; Recent Findings from State Oceanic Administration Has Provided New Data on Climate Systems (The Causality from Solar Irradiation to Ocean Heat Content Detected via Multi-scale Liang-Kleeman Information Flow). Global Warming Focus 2020.
- Shang X., Zhang P., Luo J., et al. Study on the Physical and Mechanical Properties of Young Eucalyptus Wood. Journal of Northwest A&F University (Natural Science Edition) 2019, 47, 32–41. [Google Scholar] [CrossRef]
- Chen K., Liu H., Wang Z., et al. Study on the Differences in Physical and Mechanical Properties Between Clonal and Seedling Chinese Fir. Journal of Southwest Forestry University 2023. Available online: http://kns.cnki.net/kcms/detail/53.1218.s.20230630.1106.002.html.
- Liu X., Xu F., Sun Y., et al. Convolutional Recurrent Neural Networks for Observation-Centered Plant Identification. Journal of Electrical and Computer Engineering 2018. [Google Scholar]
- Zhilong W., Qingxun W., Yanqiang H., et al. Deep Learning for Ultra-fast and High Precision Screening of Energy Materials. Energy Storage Materials 2021. [Google Scholar]
- Jiwen L., Zhufang K., Lei D. GCNPCA: MiRNA-Disease Associations Prediction Algorithm Based on Graph Convolutional Neural Networks. IEEE/ACM Transactions on Computational Biology and Bioinformatics 2022. [Google Scholar]
- Yang, X. Research on Classification and Recognition Algorithms Based on the Microscopic Structure of Rosewood; Shandong Jianzhu University, 2022. [Google Scholar] [CrossRef]
- Yang, C. Research on the Construction of a Data-driven Performance Prediction Model for Particleboard; Northeast Forestry University, 2021. [Google Scholar] [CrossRef]
- Li N., Wang W. Prediction of Mechanical Properties of Thermally Modified Wood Based on TSSA-BP Model. Forests 2022, 13, 160. [Google Scholar] [CrossRef]
- Ma W., Wang W., Cao Y. Mechanical Properties of Wood Prediction Based on the NAGGWO-BP Neural Network. Forests 2022, 13, 1870. [Google Scholar] [CrossRef]
- Chen S., Wang J., Liu Y., et al. The Relationship Between Color and Mechanical Properties of Heat-treated Wood Predicted Based on Support Vector Machines Model. Holzforschung 2022, 76, 994–1002. [Google Scholar] [CrossRef]
- Osuna-Sequera C., Arriaga F., Llana D. F., et al. Predicting the Mechanical Properties of Timber from Existing Structures by the Longitudinal Vibration Method, Visual Grading, and Definition of the Nominal Cross-section. Wood Material Science & Engineering 2024, 19, 366–374. [Google Scholar]
- Huang J., Kuang Z., Ma J., et al. Performance Prediction Method Based on Liang-Kleeman Information Flow and Wood Tracheid Morphology. Materials Today Communications 2024, 39, 108620. [Google Scholar] [CrossRef]
- Fathi H., Nasir V., Kazemirad S. Prediction of the Mechanical Properties of Wood Using Guided Wave Propagation and Machine Learning. Construction and Building Materials 2020, 262, 120848. [Google Scholar] [CrossRef]
- Chen S., Shiina R., Nakai K., et al. Potential of Machine Learning Approaches for Predicting Mechanical Properties of Spruce Wood in the Transverse Direction. Journal of Wood Science 2023, 69, 22. [Google Scholar] [CrossRef]
- Yin T., He L., Huang Q., et al. Effect of Lamination Grade on Bending and Shear Properties of CLT Made from Fast-Growing Chinese Fir. Industrial Crops and Products 2024, 207, 117741. [Google Scholar] [CrossRef]
- Liang X., S. The Liang-Kleeman Information Flow: Theory and Applications. Entropy 2013, 15, 327–360. [Google Scholar] [CrossRef]
- San L., X. Information Flow and Causality as Rigorous Notions Ab Initio. Physical Review E 2016, 94, 052201-1-28. [Google Scholar]
- Elrhayam, Youssef, and Abderrahim El Bachiri. Study of the effect of heat temperature on the chemical changes and hygroscopicity of eucalyptus wood by FT-IR and prediction of mechanical properties by the MLR regression method. Spectrochimica Acta Part A: Molecular and Biomolecular Spectroscopy 2024, 321, 124576. [Google Scholar] [CrossRef]
Figure 1.
Simple CDG model.
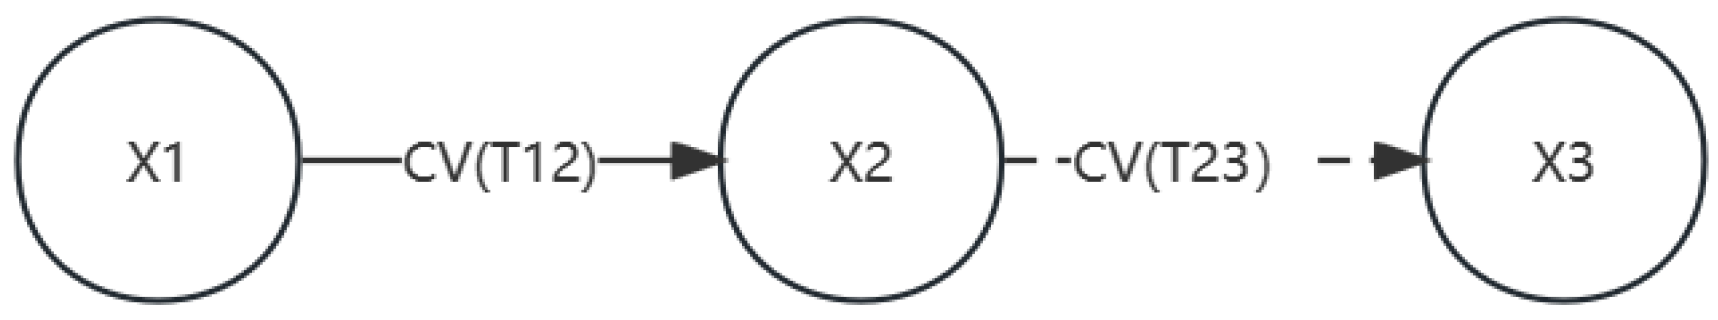
Figure 2.
The flowchart of AFPSO algorithm.
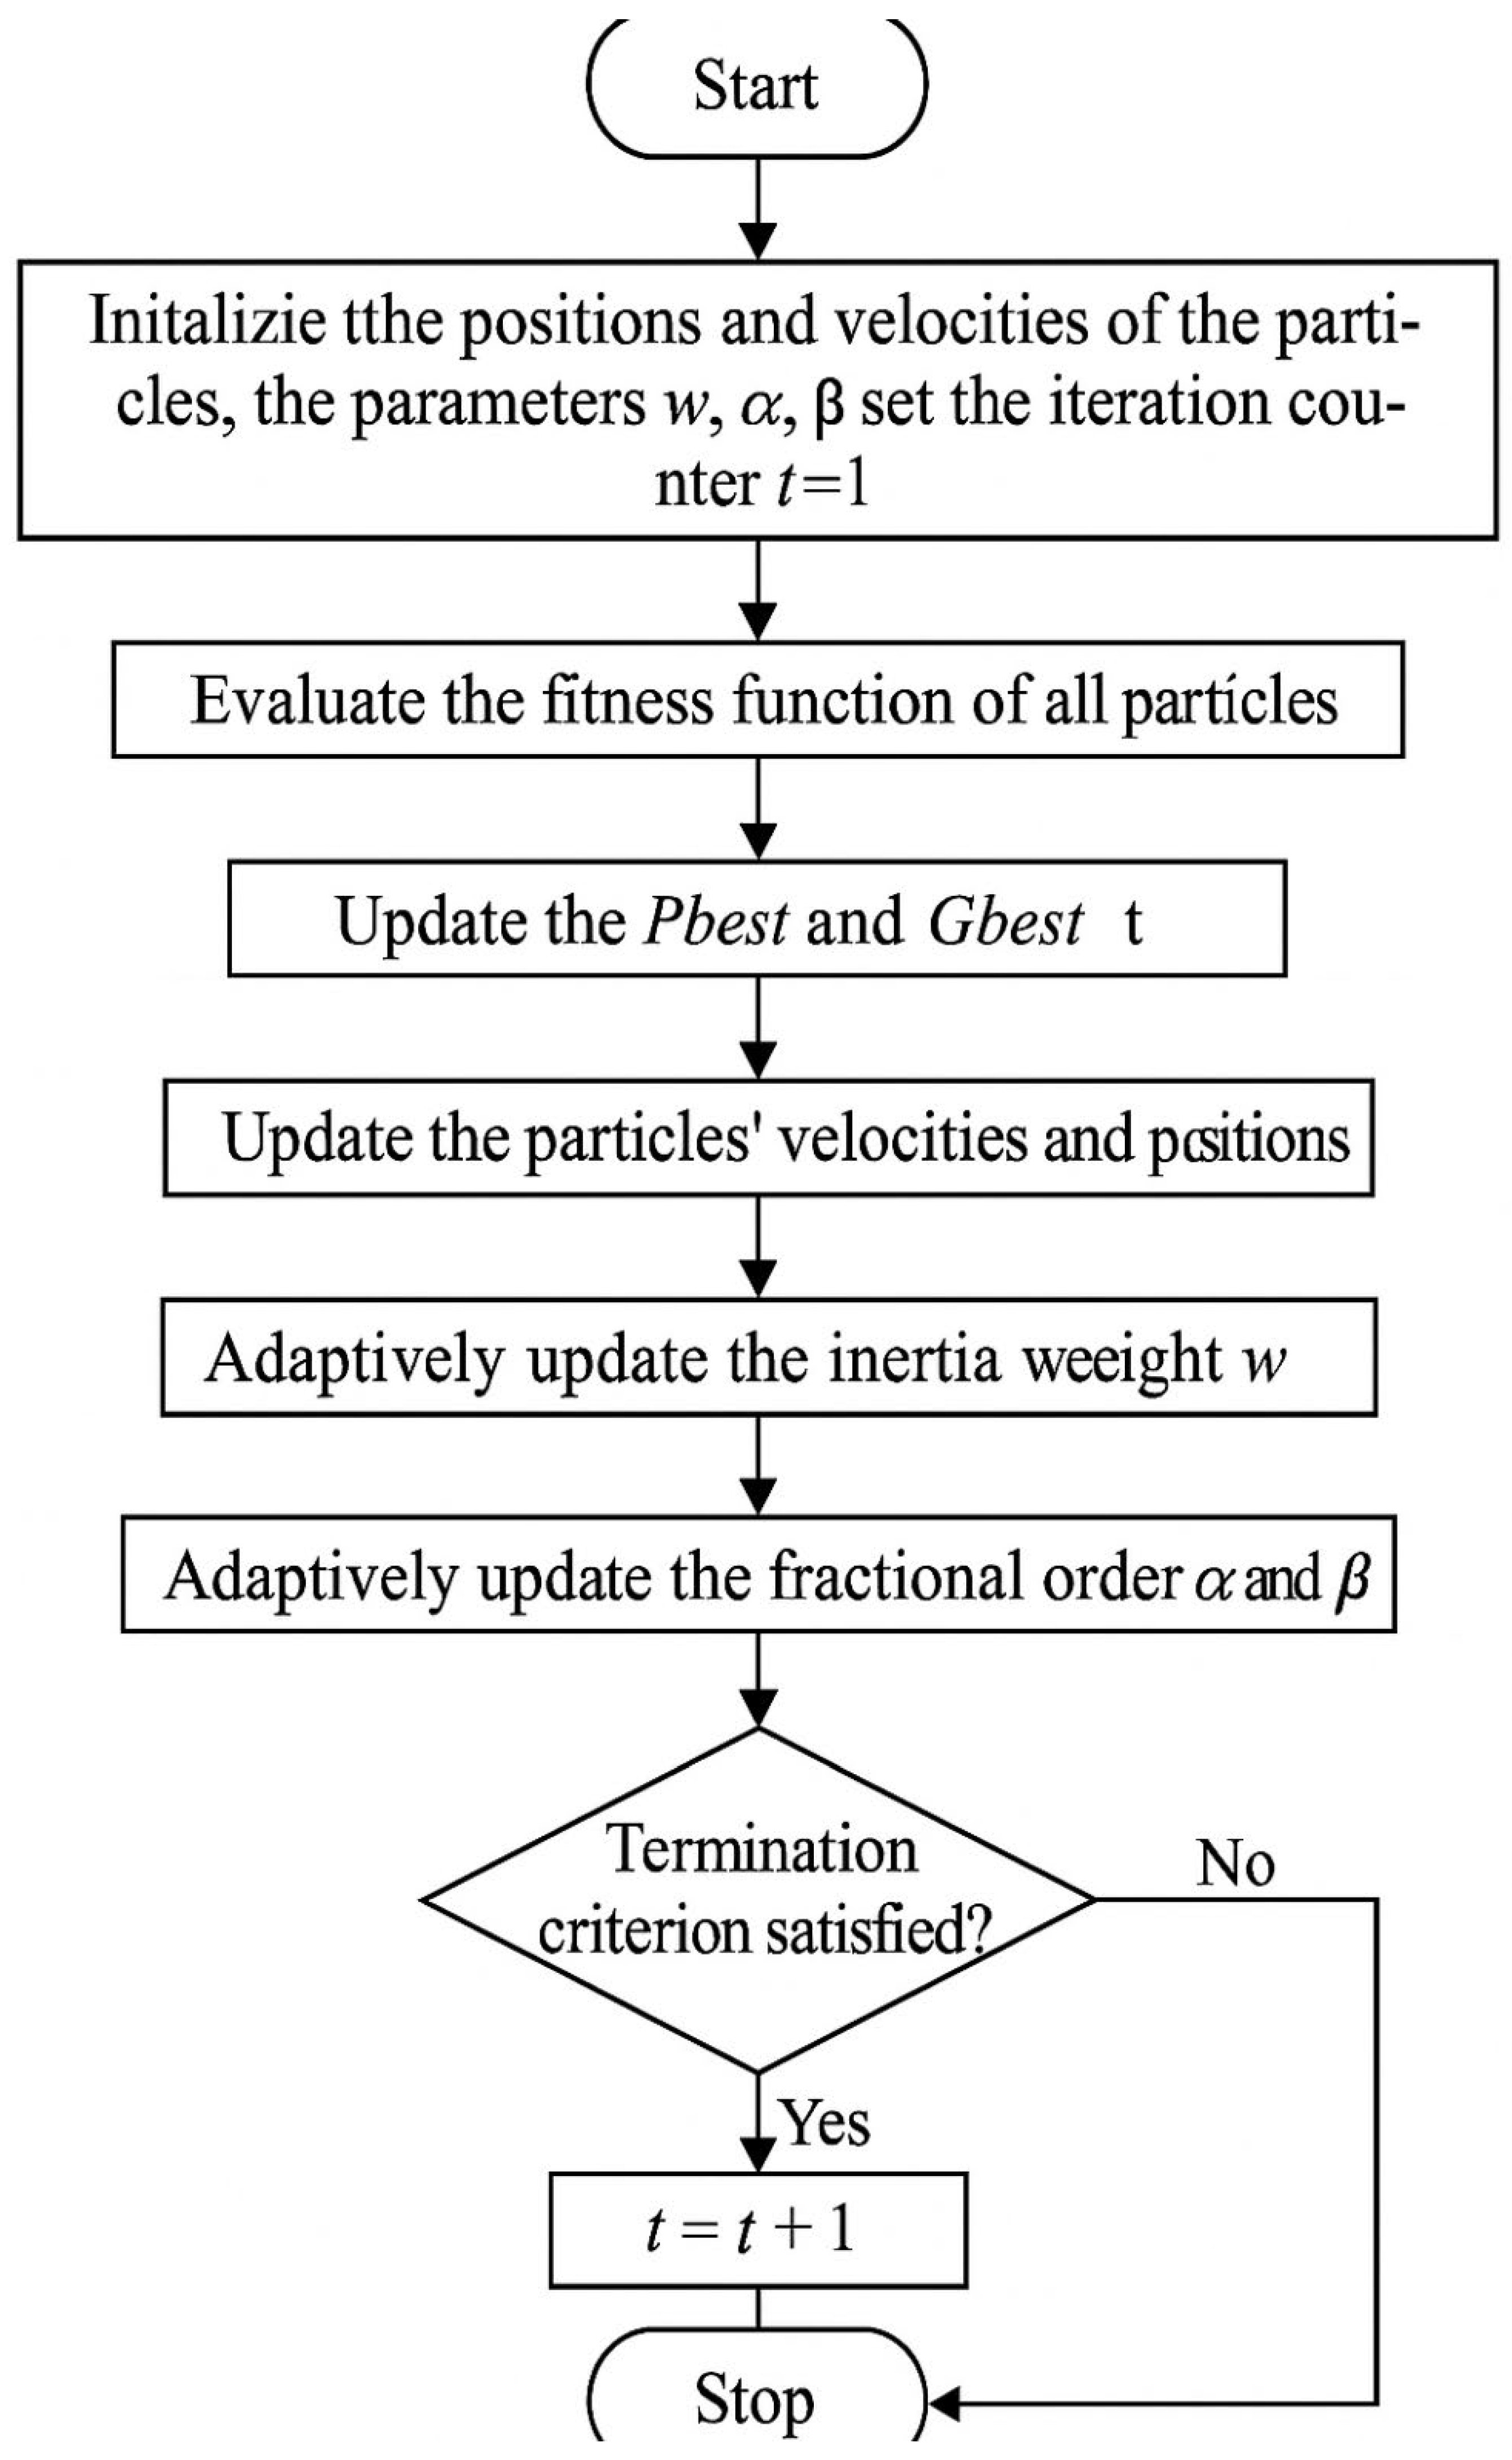
Figure 3.
.
Figure 4.
Property Mechanical Property Causal Directed Graphs (a, b, c, d respectively represent the causal directed graphs of different properties on SPG, MEB, BS, CSP).
Figure 4.
Property Mechanical Property Causal Directed Graphs (a, b, c, d respectively represent the causal directed graphs of different properties on SPG, MEB, BS, CSP).
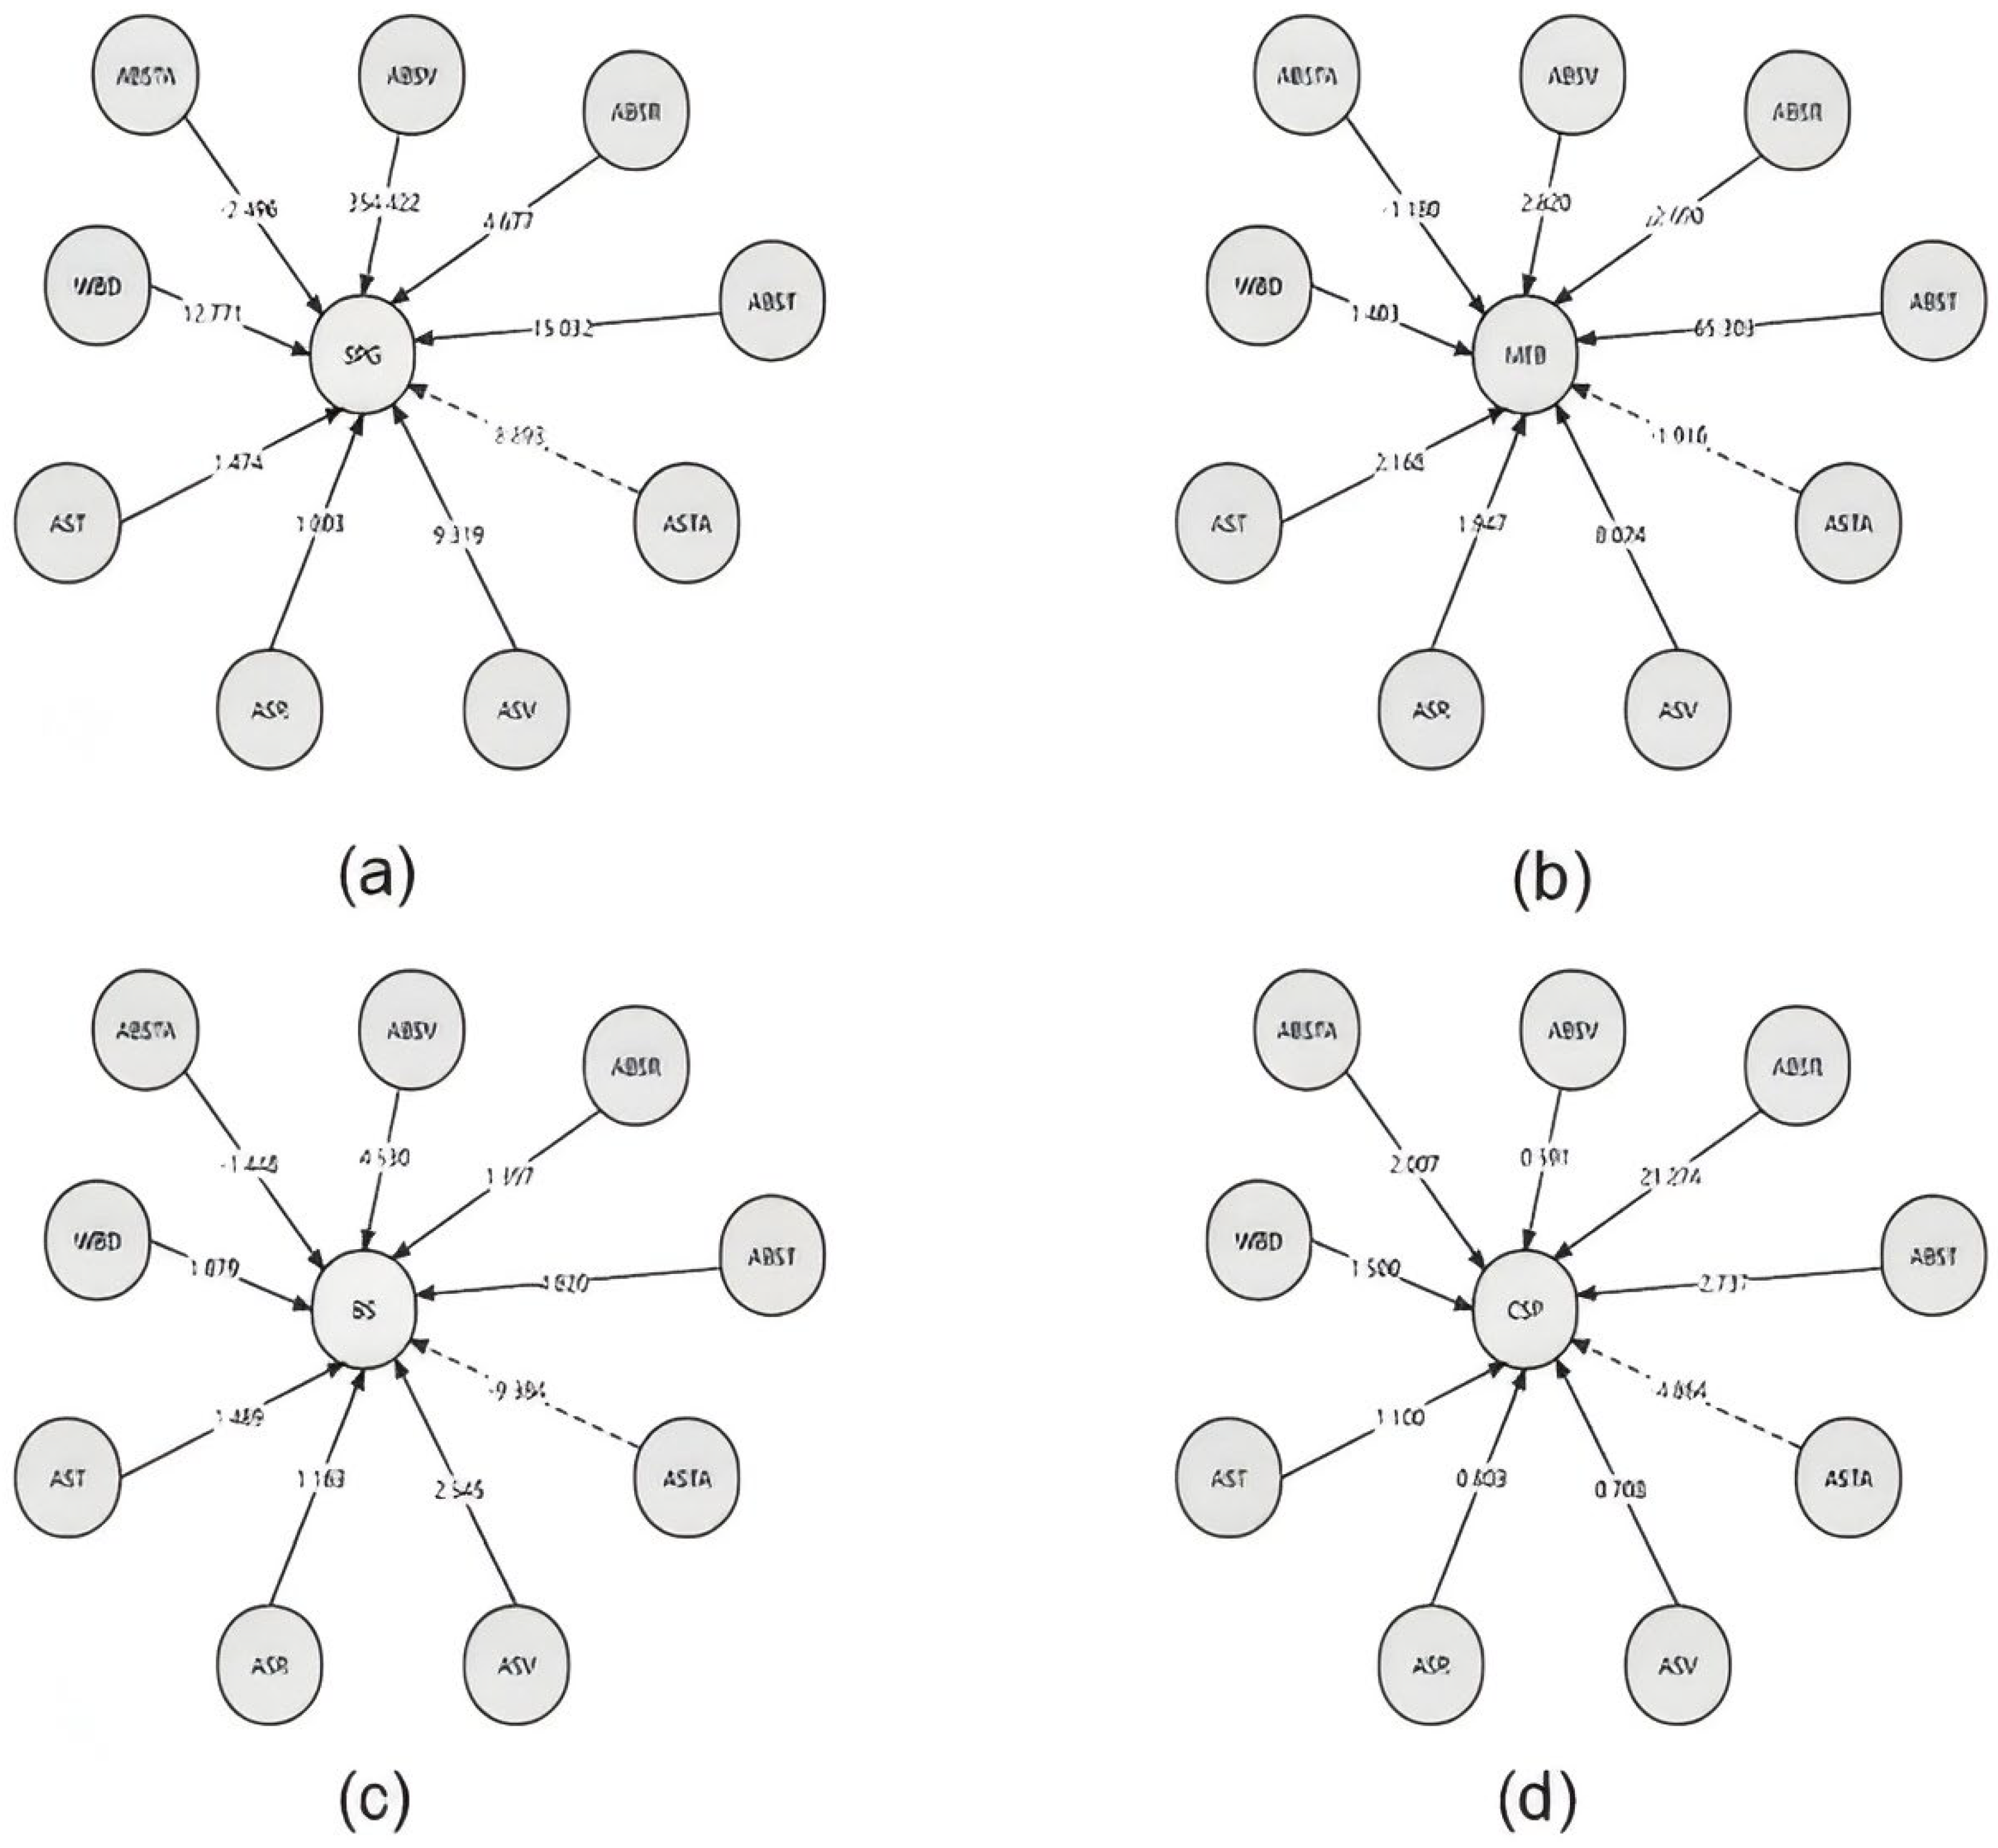
Figure 5.
Prediction performance of different optimization algorithms combined with BP network.
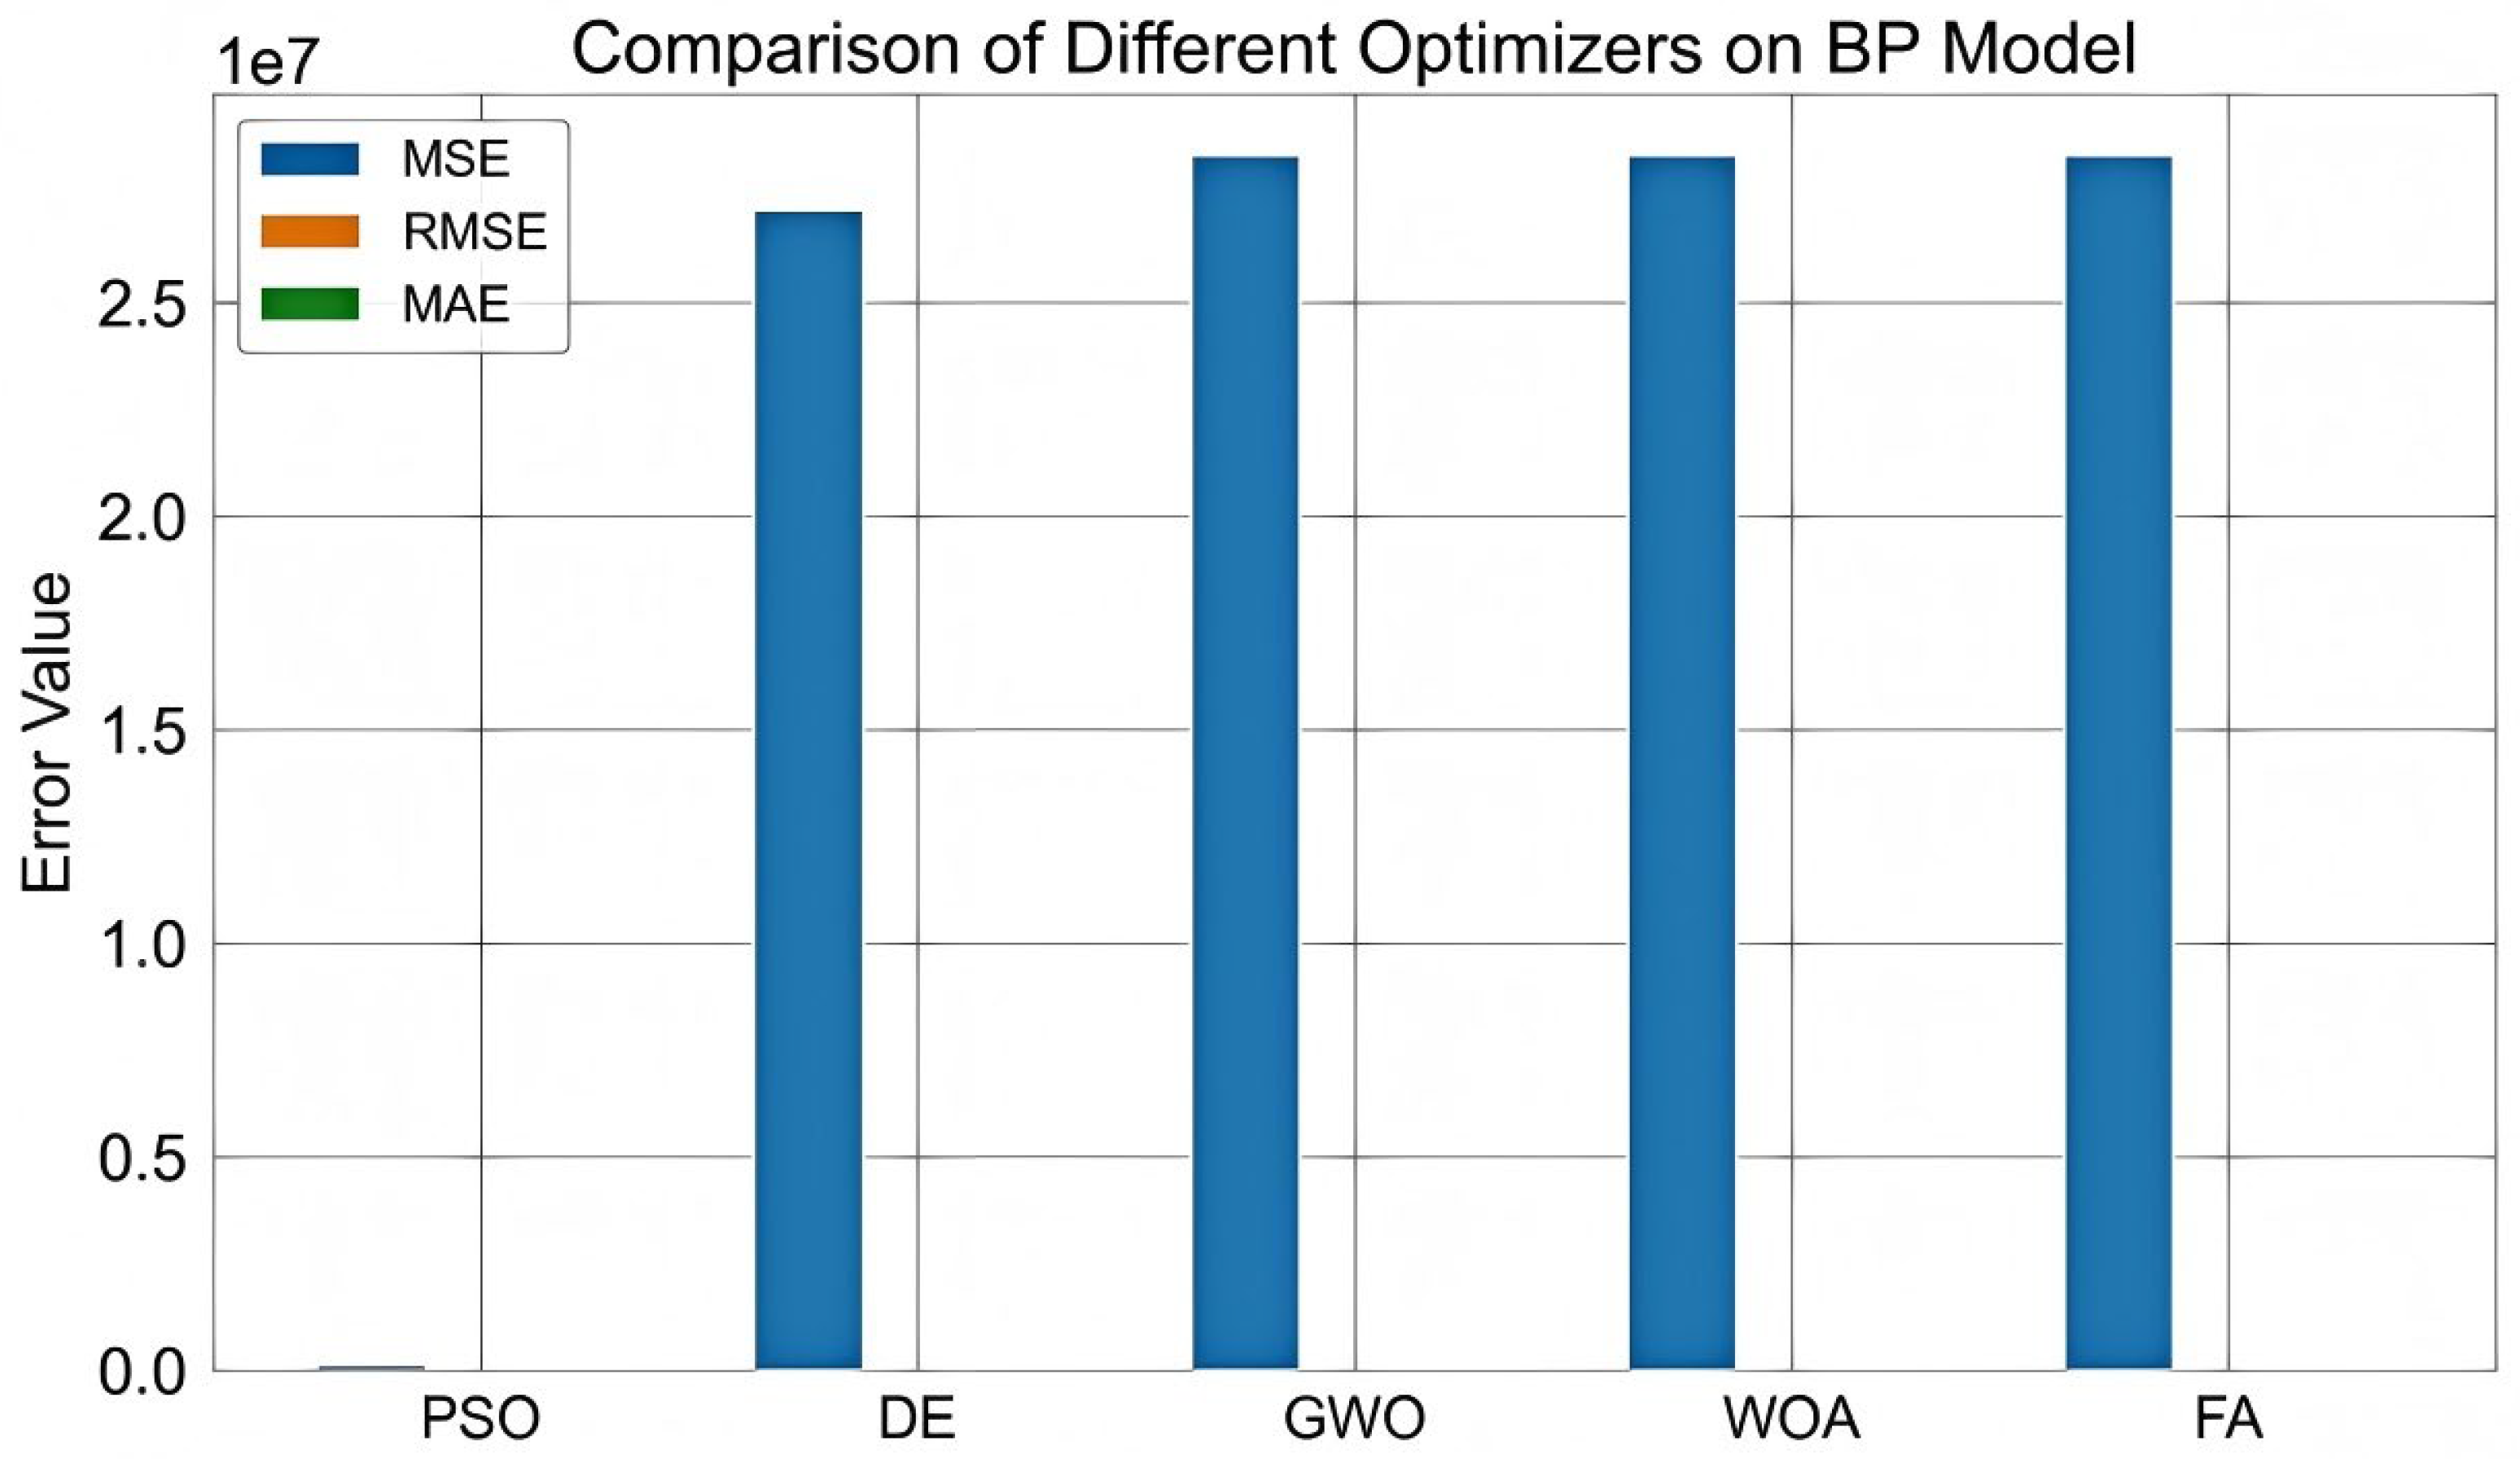
Figure 6.
Performance of different mechanical properties of Chinese fir predicted by LK-BP-AFPSO model.
Figure 6.
Performance of different mechanical properties of Chinese fir predicted by LK-BP-AFPSO model.
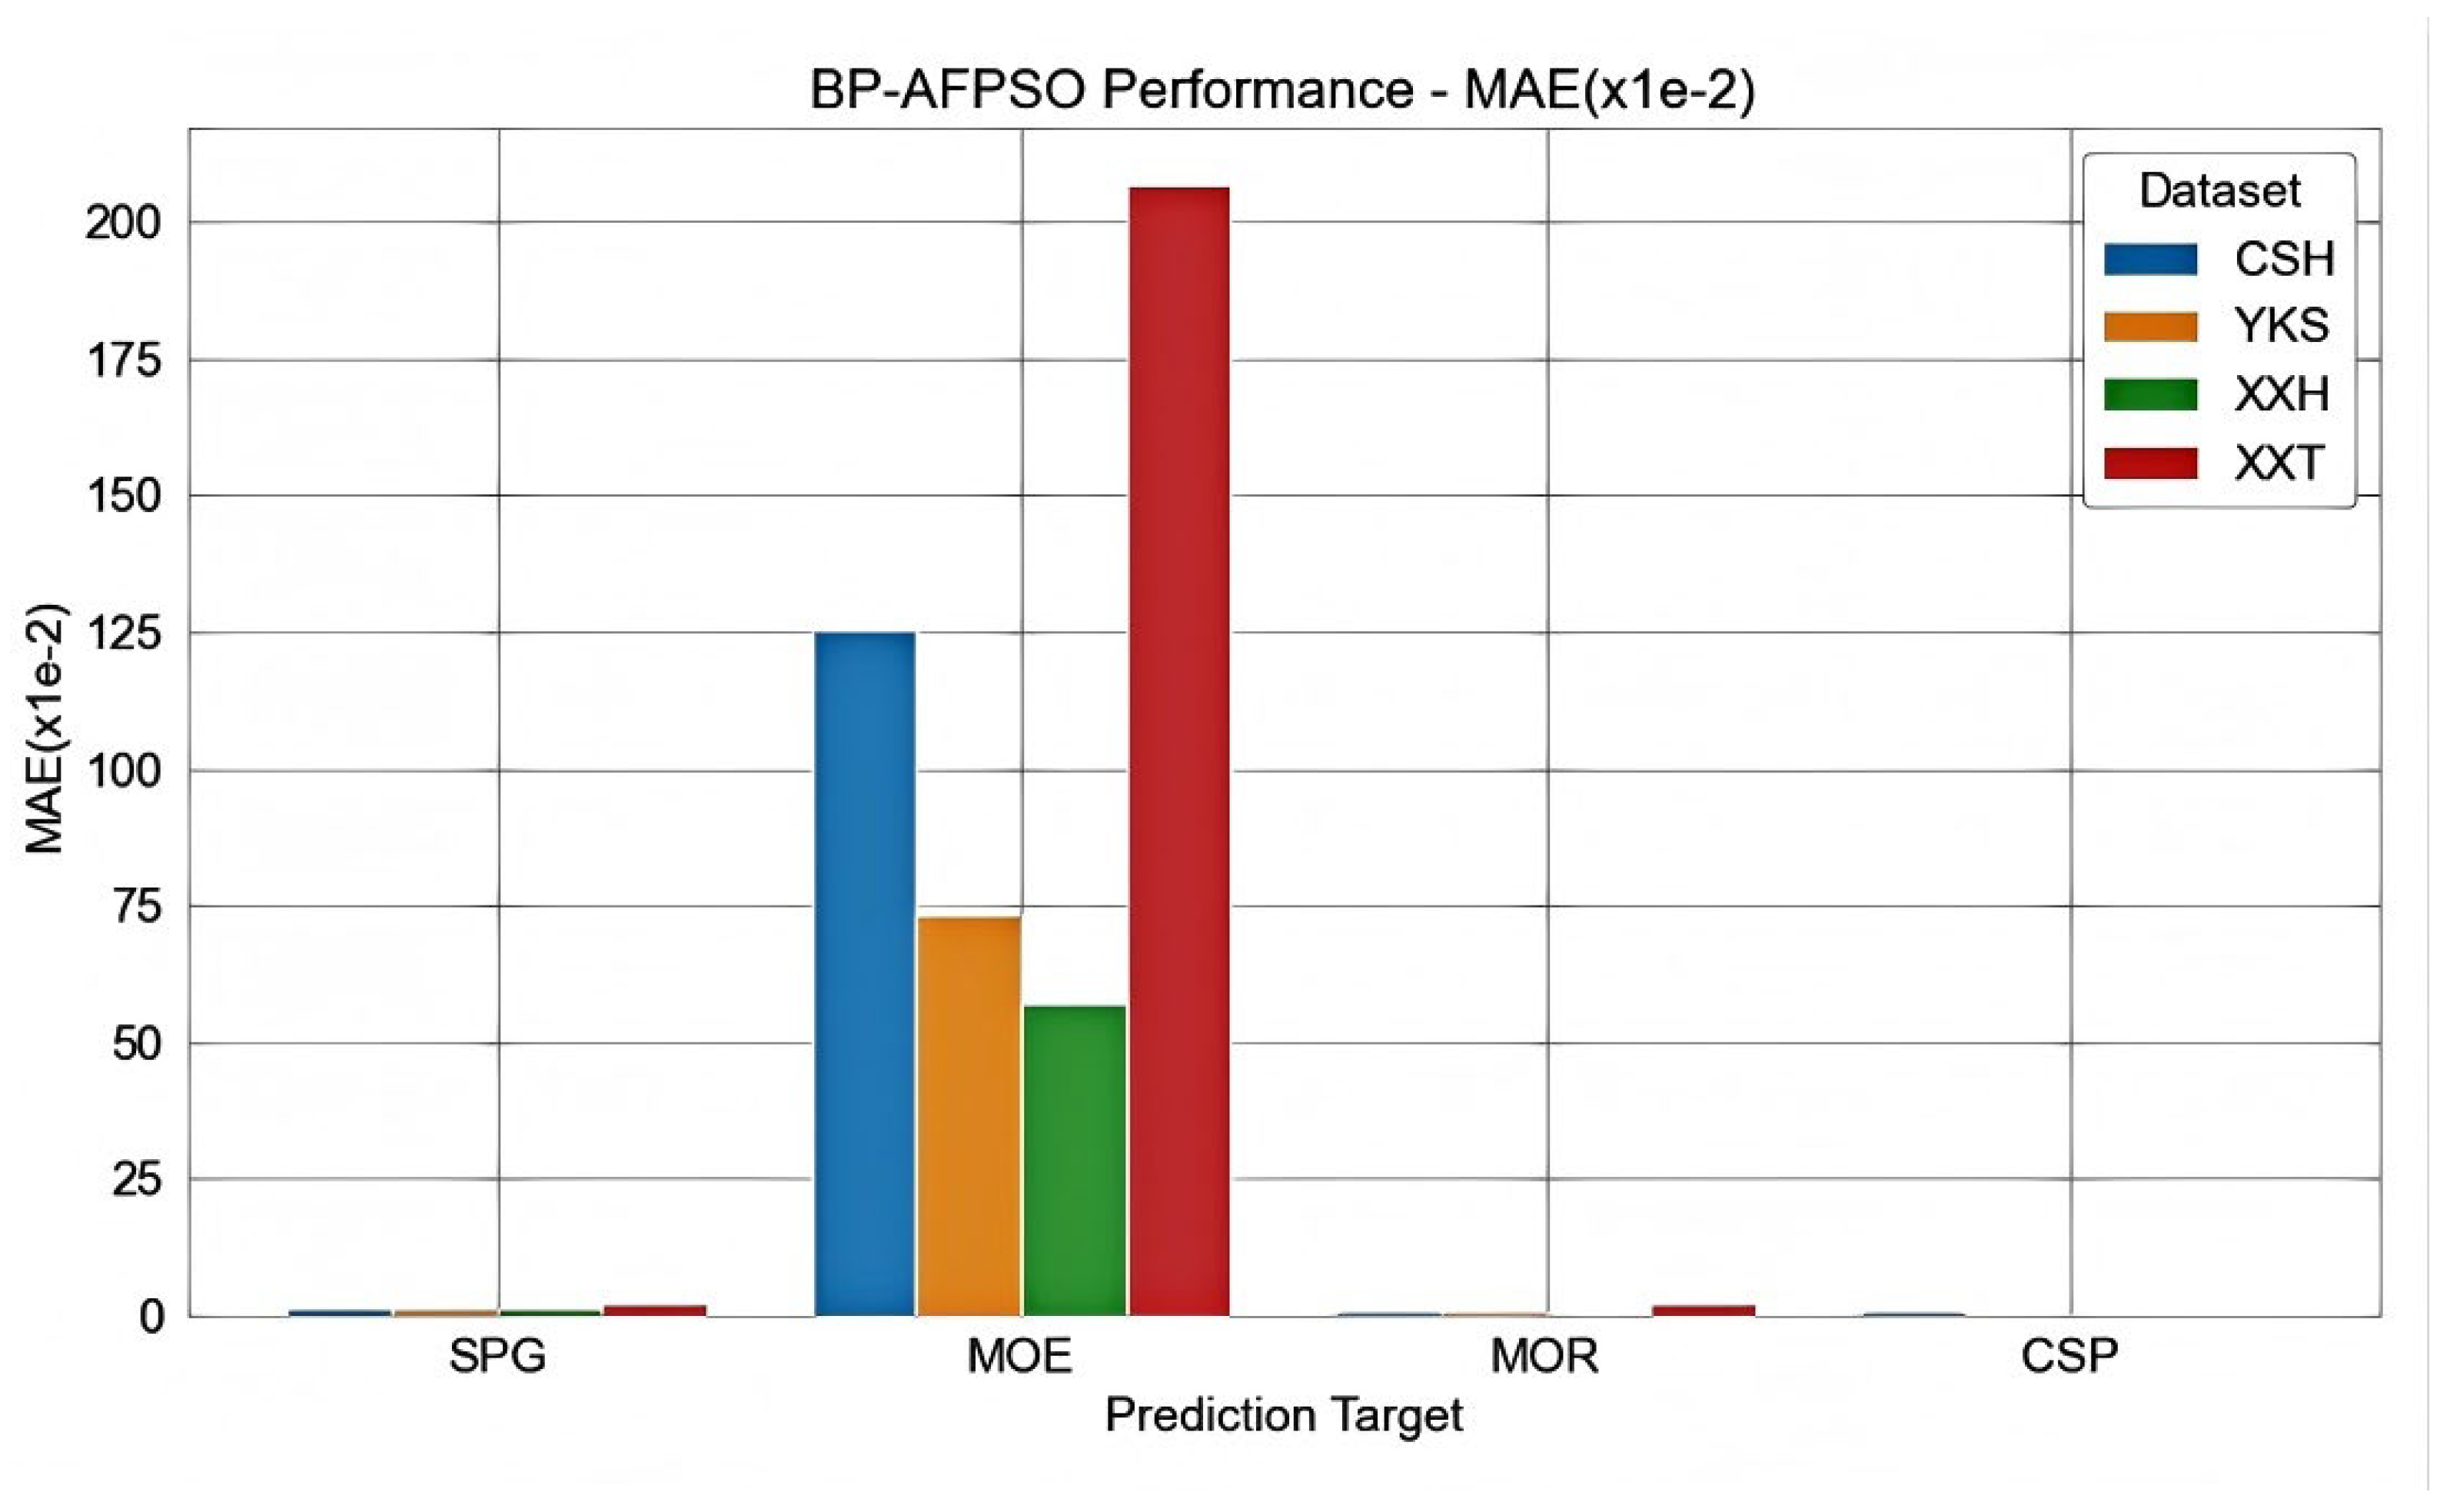
Figure 7.
Comparison of LK-BP-AFPSO and MLR model performance.
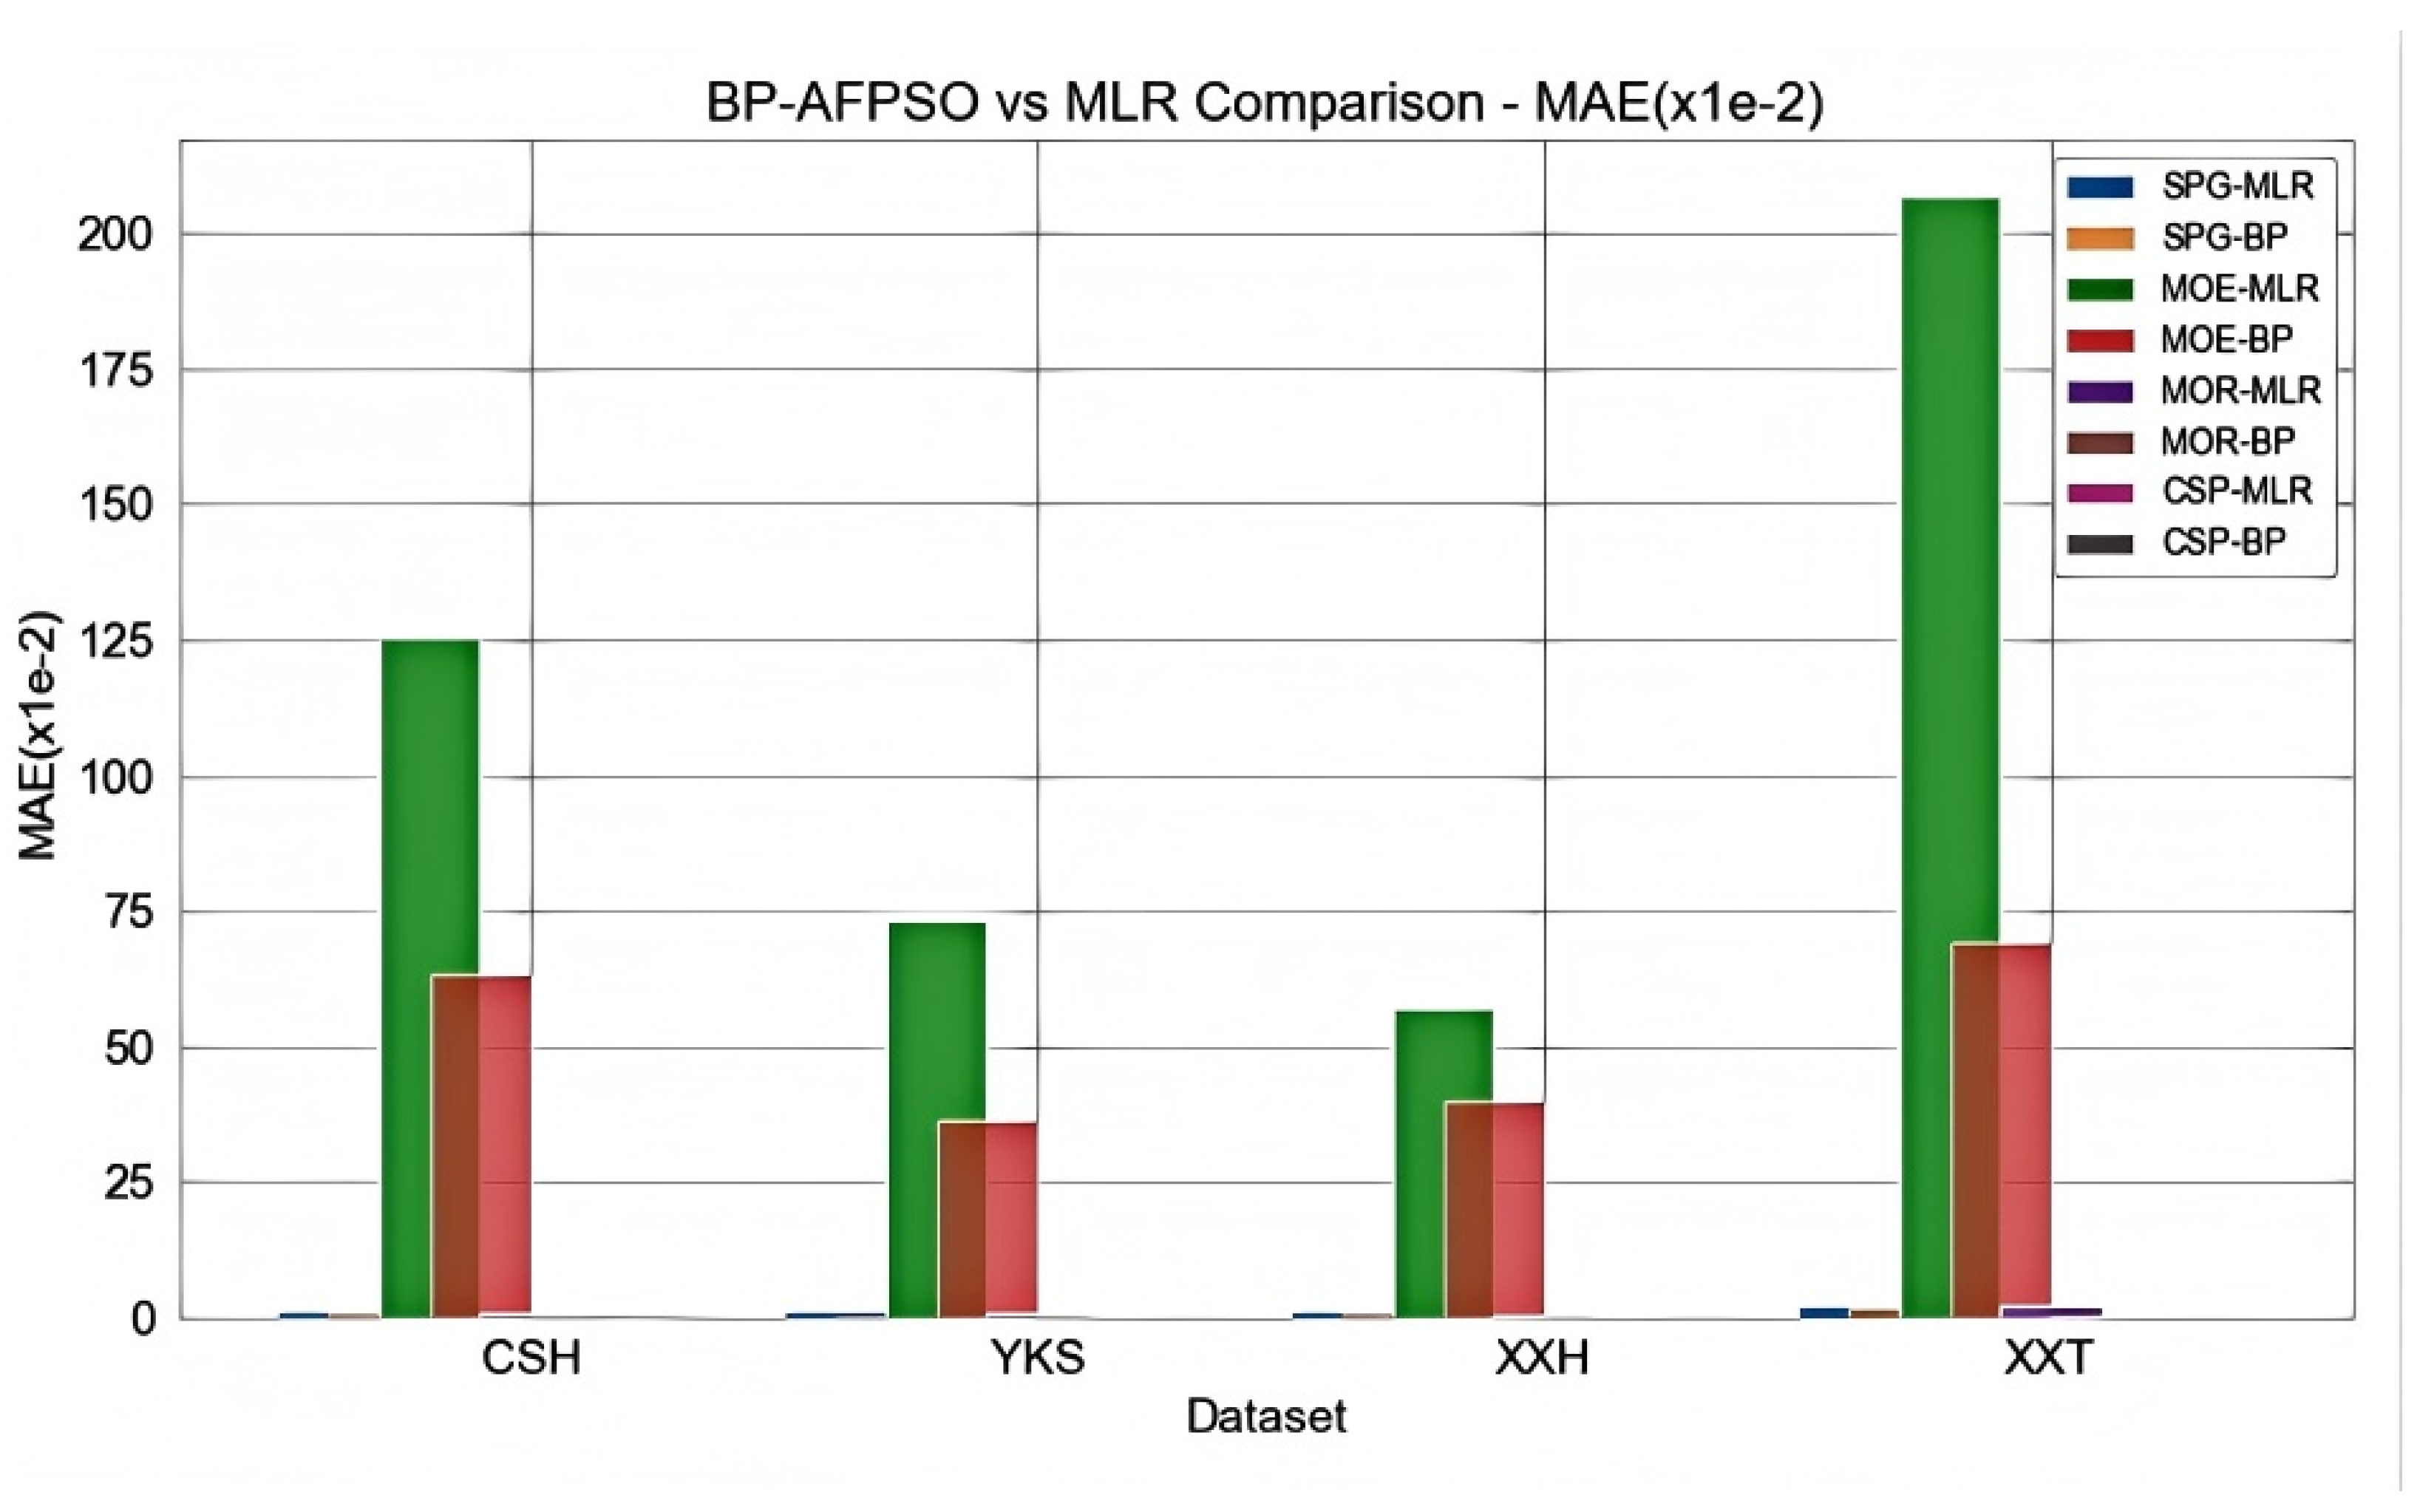
Figure 8.
Scatter plot comparing the performance of LK-BP-AFPSO model and MLR model.
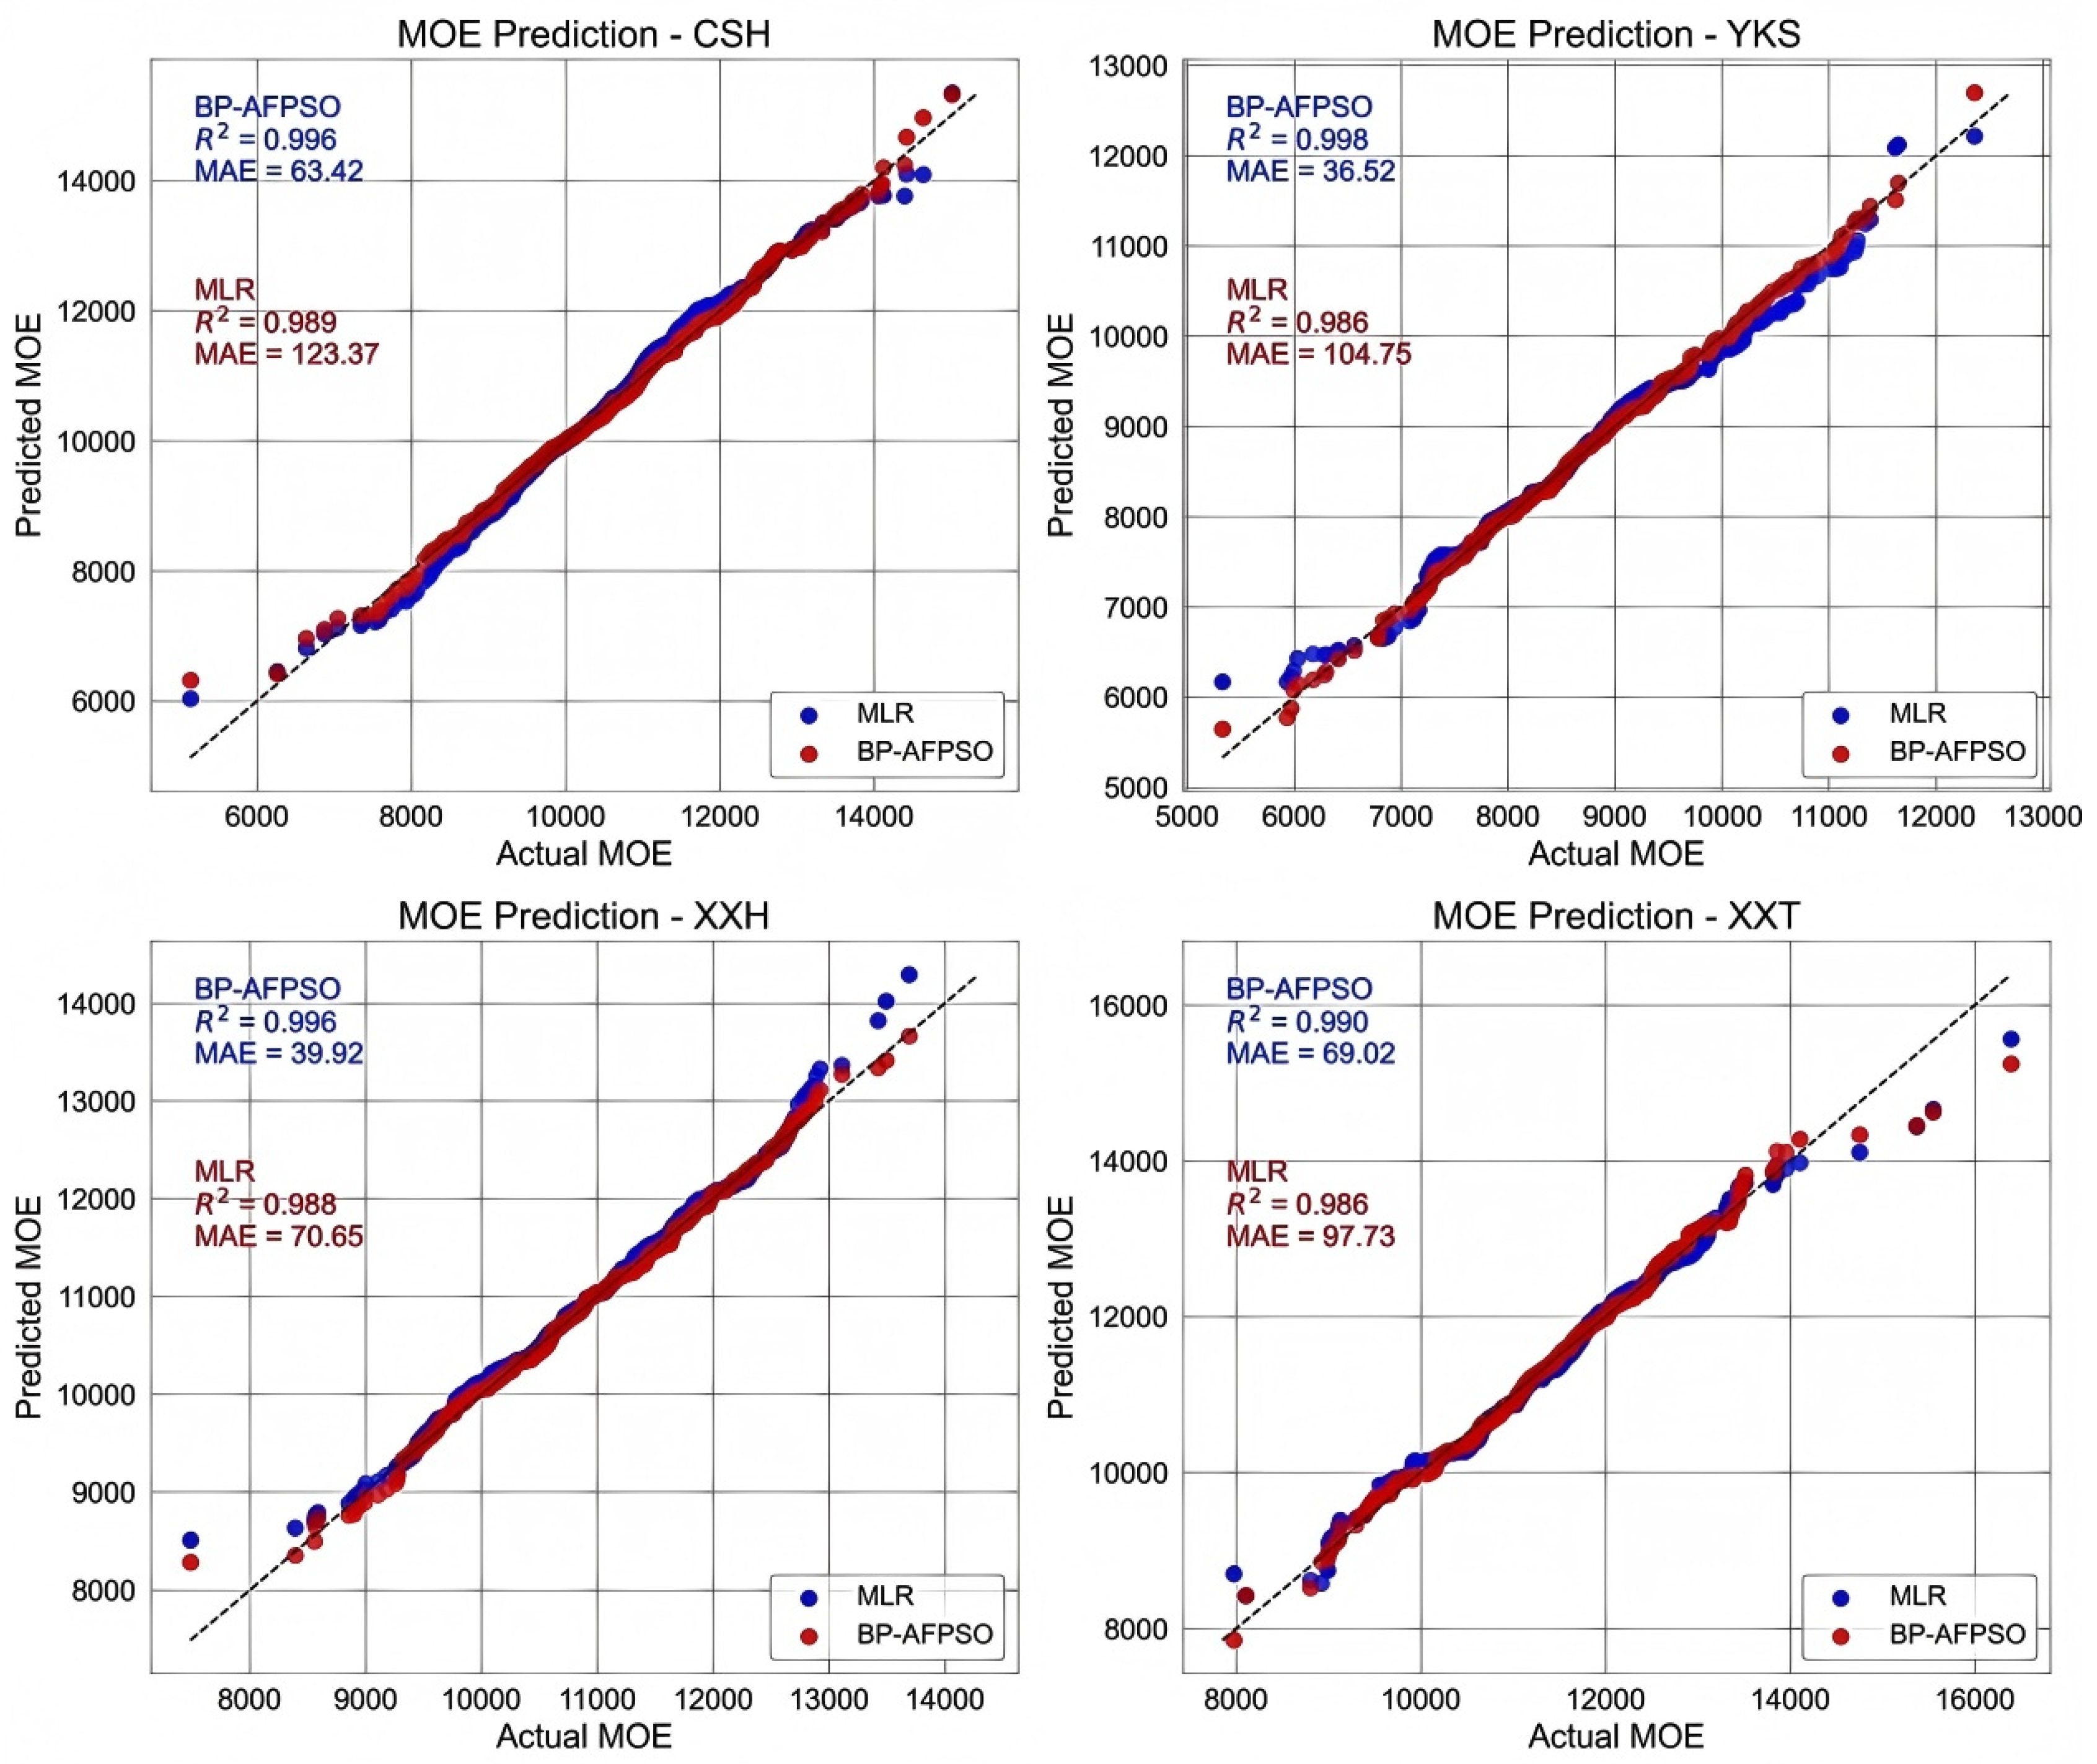
Figure 9.
Comparison results of LK information flow and PCA.

Figure 10.
Comparison of prediction performance of models before and after feature selection of LK information flow.
Figure 10.
Comparison of prediction performance of models before and after feature selection of LK information flow.
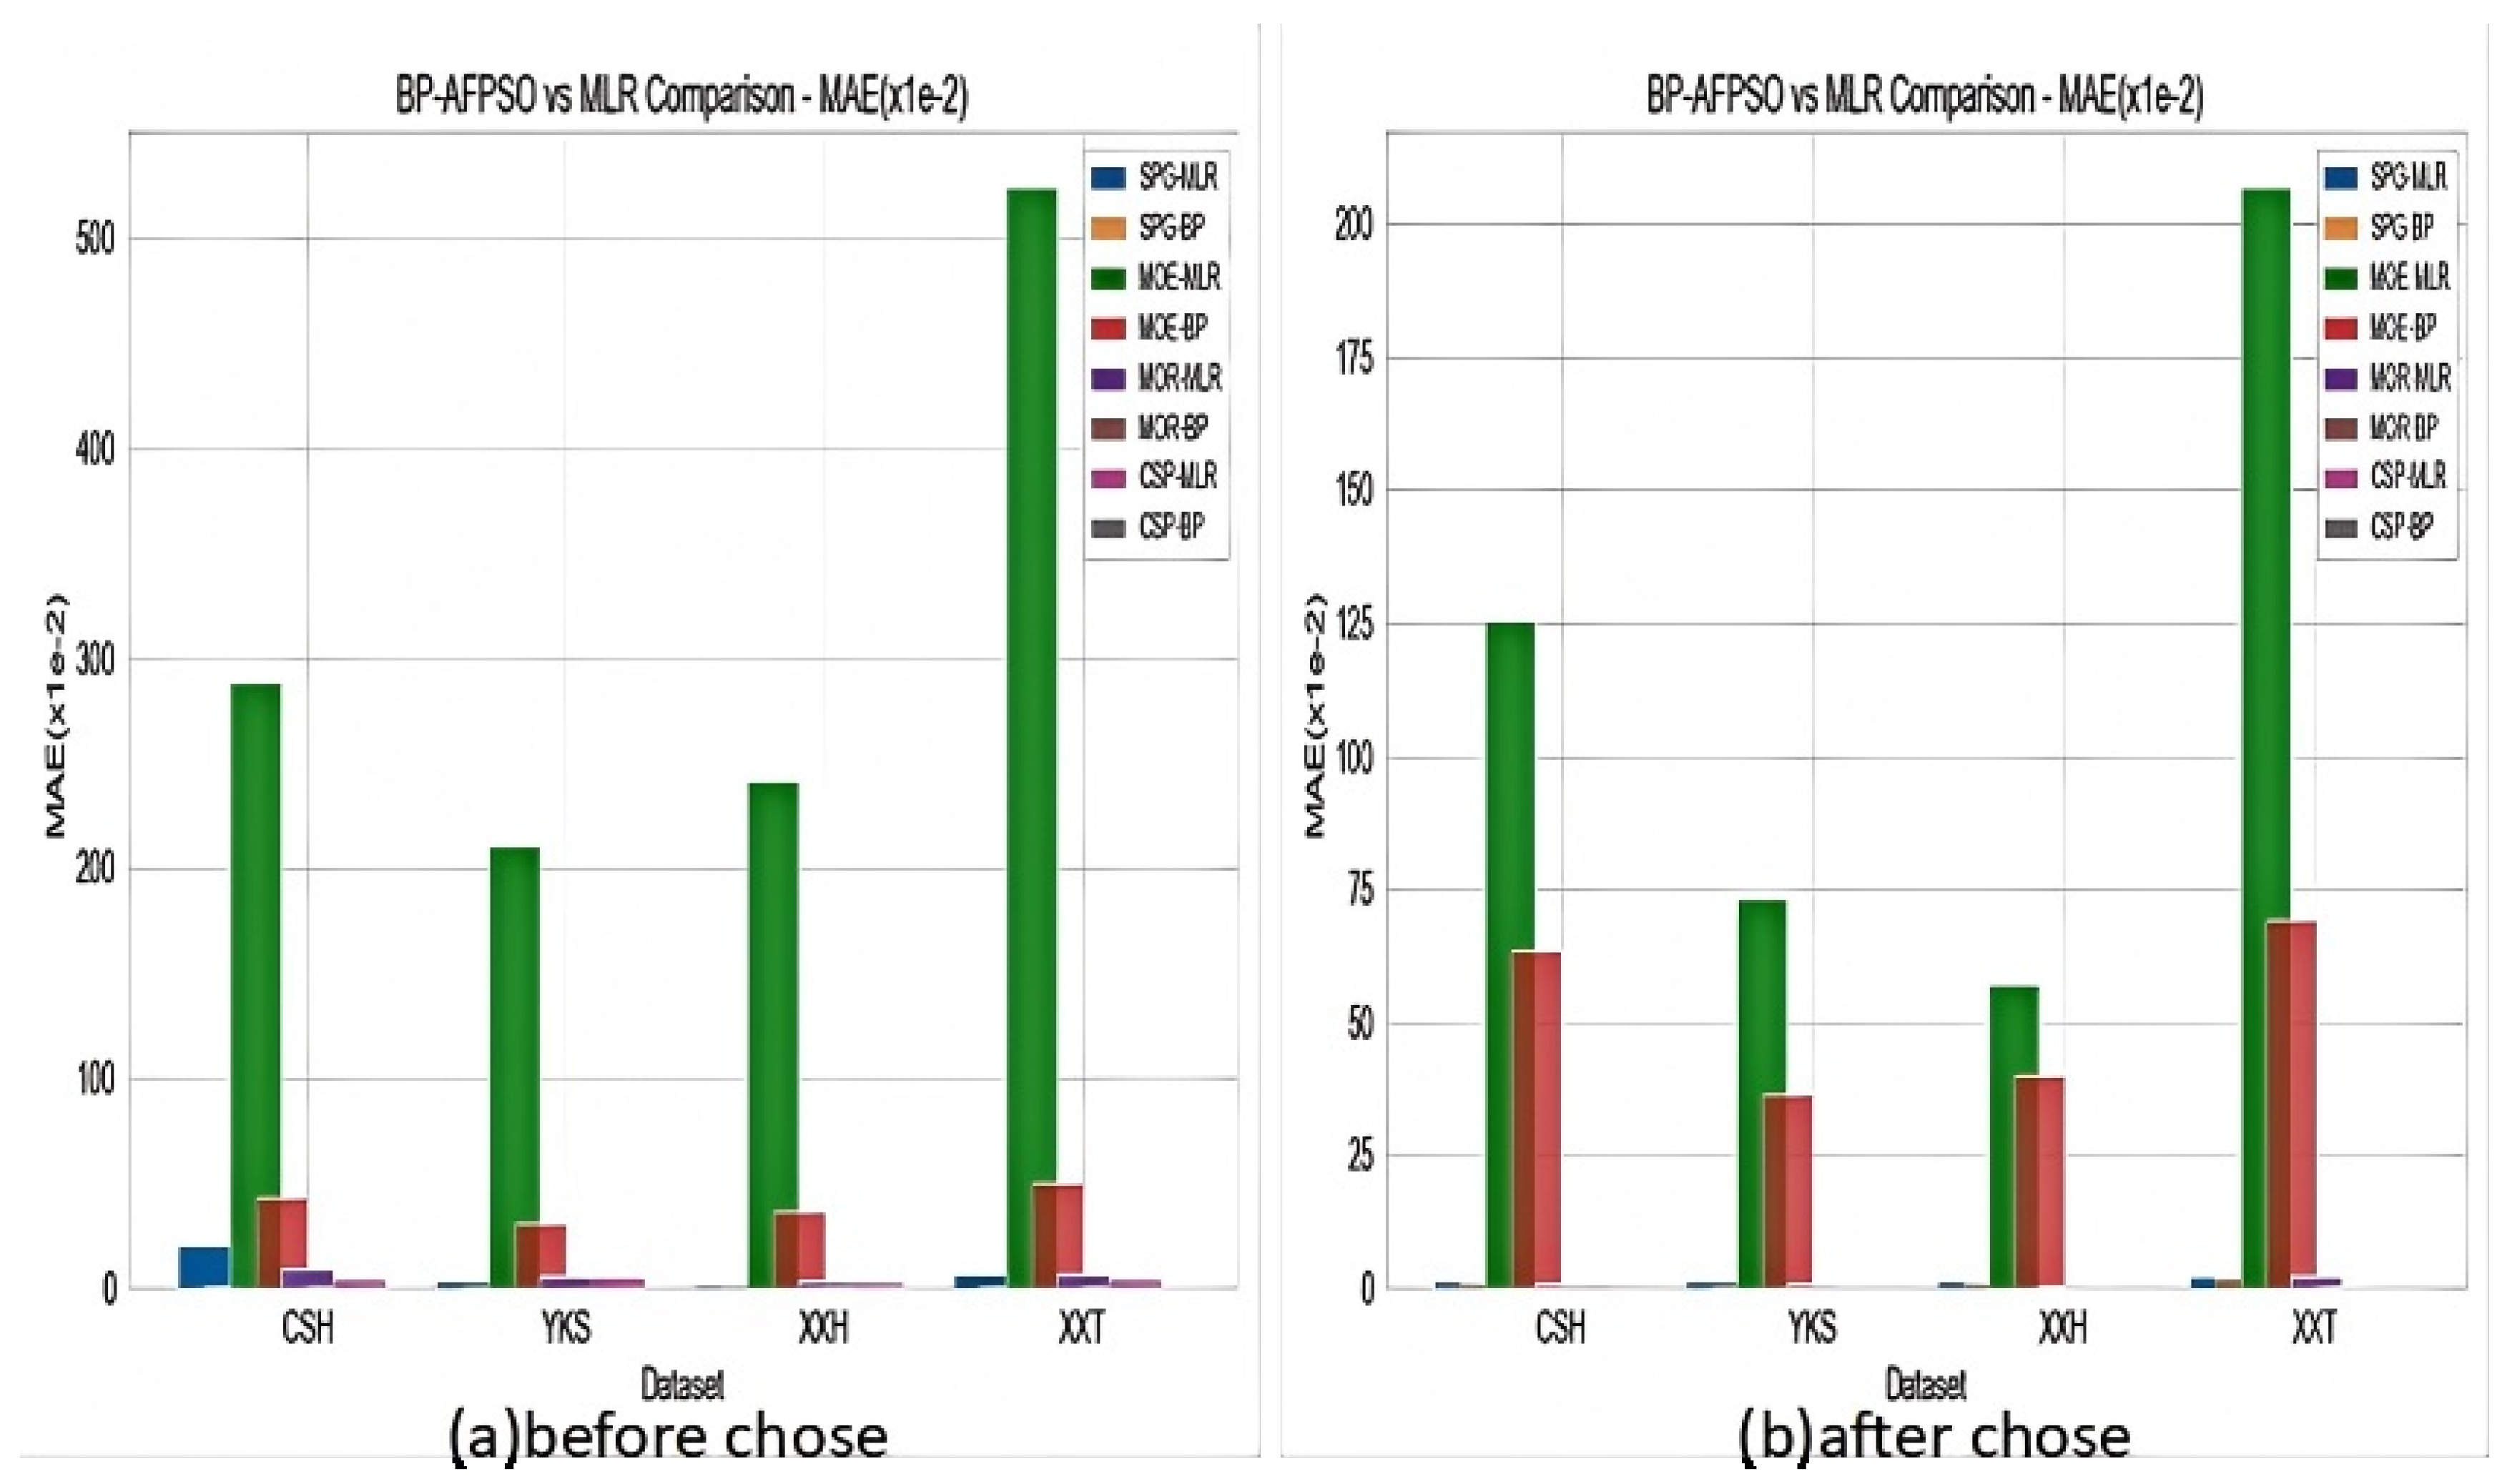

Table 1.
Basic information on different fir species.
| Area | Sort | Code | Average age/a | Average DBH/cm |
| Yangkou | Fast growing cedar | YKS | 53 | 47.5 |
| Chenshan | Red heart cedar | CSH | 51 | 29.5 |
| XXH | 50 | 30.8 | ||
| Xiaoxi | Hemlock | XXT | 53 | 28.6 |
Table 2.
Abbreviated list of physical properties of wood.
| Num | Name | Abbreviations |
| 1 | Wood basic density | WBD |
| 2 | Air-dry shrinkage of tangential | AST |
| 3 | Air-dry shrinkage of radial | ASR |
| 4 | Air-dry shrinkage of volume | ASV |
| 5 | Air-dry shrinkage of tangential to radia | ASTA |
| 6 | Absoluter-dry shrinkage of tangential | ABST |
| 7 | Absoluter-dry shrinkage of radial | ABSR |
| 8 | Absoluter-dry shrinkage of volume | ABSV |
| 9 | Absolute-dry shrinkage of tangential to radia | ABSTA |
Table 3.
Abbreviated list of mechanical properties of wood.
| Num | Name | Abbreviations |
| 1 | Tensile Strength patallel to grain |
SPG |
| 2 | Modulus of elasticity | MOE |
| 3 | Bending strength | MOR |
| 4 | Compression strength parallel to grain | CSP |
Table 4.
Mean value analysis of physico-mechanical properties of different species of fir trees.
| Event | Mean(YKS) | Mean(CSH) | Mean(XXH) | Mean(XXT) |
| ) | 0.023f | 0.034f | 0.035f | 0.025f |
| AST/% | 0.559e | 0.413c | 0.607b | 0.842a |
| ASR/% | 0.225d | 0.399b | 0.428a | 0.521a |
| ASV/% | 0.762d | 0.729c | 0.957b | 1.264a |
| ASTA/% | 2.773b | 1.05b | 0.574b | 0.656b |
| ABST/% | 1.047bc | 0.618d | 0.518b | 1.389bc |
| ABSR/% | 0.498c | 0.618c | 0.454ab | 0.959ab |
| ABSV/% | 1.11cd | 0.993e | 0.819b | 2.019bc |
| ABSTA/% | 0.655a | 0.479cd | 0.284cd | 0.453d |
| SPG/MPa | 15.676c | 14.636b | 22.953a | 38.980a |
| MOE/MPa | 1151.049d | 1646.908b | 1069.154b | 1212.171ab |
| MOR/MPa | 7.409f | 16.747d | 15.557b | 13.123ab |
| CSP/MPa | 4.022d | 8.604a | 5.128b | 4.927a |
Note: The values after "±" in the table indicate the standard deviation of the data, and the letters in the same column are the results obtained by multiple analysis at the 0.05 level using the LSD test, in which any 2 items containing the same letter are non-significant for the difference, or else the difference is significant.
Table 5.
Correlation Analysis of Physical and Mechanical Indicators of Chinese Fir.
| WBD | AST | ASR | ASV | ASTA | SPG | MOE | MOR | CSP | |
| WBD | 1.00 | ||||||||
| AST | 0.89 | 1.00 | |||||||
| ASR | 0.93 | 0.99 | 1.00 | ||||||
| ASV | 0.90 | 1.00 | 0.99 | 1.00 | |||||
| ASTA | -0.84 | -0.87 | -0.91 | -0.90 | 1.00 | ||||
| SPG | 0.92 | 0.95 | 0.96 | 0.95 | -0.80 | 1.00 | |||
| MOE | 0.67 | 0.89 | 0.86 | 0.88 | -0.78 | 0.78 | 1.00 | ||
| MOR | 0.89 | 0.95 | 0.97 | 0.95 | -0.86 | 0.96 | 0.83 | 1.00 | |
| CSP | 0.91 | 0.88 | 0.89 | 0.89 | -0.81 | 0.83 | 0.81 | 0.80 | 1.00 |
Disclaimer/Publisher’s Note: The statements, opinions and data contained in all publications are solely those of the individual author(s) and contributor(s) and not of MDPI and/or the editor(s). MDPI and/or the editor(s) disclaim responsibility for any injury to people or property resulting from any ideas, methods, instructions or products referred to in the content. |
© 2025 by the authors. Licensee MDPI, Basel, Switzerland. This article is an open access article distributed under the terms and conditions of the Creative Commons Attribution (CC BY) license (http://creativecommons.org/licenses/by/4.0/).
Copyright: This open access article is published under a Creative Commons CC BY 4.0 license, which permit the free download, distribution, and reuse, provided that the author and preprint are cited in any reuse.


