
Submitted:
05 June 2025
Posted:
11 June 2025
You are already at the latest version
Abstract
Since the end of the Civil War, Cambodia has pursued economic development to enhance livelihoods, particularly in rural areas, where land is a critical resource. Previous studies have indicated that the country has changed land use and land cover; however, they have not explained how these changes can improve the livelihoods of local communities, thereby mitigating their negative impacts through an asset-based approach. Thus, this study aims to examine agricultural livelihoods in the villages of Dei Kraham and Ou Toek Thla, located west of Battambang Town. These were selected because of their common characteristics. Adopting a quantitative approach and a sustainable livelihood frame-work, this study employed stratified random sampling to select 123 families for inter-views across three population subgroups: old settlers, new settlers, and young settlers. In-situ information was collected using structured questionnaires and analyzed using Kruskal–Wallis tests to assess the livelihood assets underlying physical, natural, human, financial, and social capital. The statistical analysis results reveal no significant differences (p-value = 0.079) in livelihood assets between the strata at the village level. Mean-while, significant differences were observed in physical, human, and financial capital between old and young settlers when examining the subgroups (p-value 0.000). The extent of the land resources held by old settlers was associated with household income and livelihoods related to agriculture. Based on livelihood asset scores, nearly half of the new settlers (0.49-0.5) and a quarter of the young settlers (0.47) are vulnerable groups requiring support. The youths will soon face an uncertain future if they do not prioritize education.
Keywords:
Land Resources
; Agriculture Livelihood
; Economic Development
; Vulnerability
1. Introduction
The Cambodian political and economic landscape has undergone significant changes since the end of the Civil War. The 1991 Paris Peace Agreement ended the conflict between the Cambodian Government and Democratic Kampuchea troops, leading to the UNTAC-supervised first election in 1993. In 1996, the win-win policy facilitated political integration, marking the end of three decades of civil war [1]. The country became the 10th ASEAN member in 1999 [2] and advanced its socioeconomic development, joining the World Trade Organization in 2003 [2]. These movements have significantly transformed household economies [3].
Land resources, which are crucial for agriculture, play a significant role in enhancing livelihoods. People in rural areas across the country depend on land to sustain their livelihoods, as evidenced by widespread changes in land use and cover [4]. This phenomenon has attracted the interest of both national and international drivers of change. In the northeastern region of the country, market accessibility has led to the expansion of agricultural land for cash crop production, such as cassava and cashew [5], resulting in a transition from swidden agriculture to commercial farming [5,6]. In Battambang Province, local efforts to boost commercial crops have also mirrored the trends in the northeastern region [7]. In 2021, the drivers of LULCC (Land Use and Land Cover Change) confirmed that trade liberalization policies and rural development projects, such as landmine clearance and road development, accelerated the shift from forestry to agriculture [8]. Thus, trade liberalization policies and improved access to and from village markets have encouraged rural populations to adopt a land use schema that includes commercial cropping to meet market demands [9]. Previous anecdotal evidence has provided clarity regarding drivers of land-use change; however, it does not fully explain the local livelihood involved.
Studies on livelihoods are crucial, as they can help mitigate land use issues. For example, during the neoclassical era, improvements in livelihoods or economic development focused on rural labor markets [10]. By contrast, as land resources are also essential for rural livelihood development [11], studies on land use are necessary to understand local livelihoods [12,13]. Increased research on rural livelihoods in the early 1990s provided anecdotal insights into rural poverty alleviation and improvements in living standards by introducing the Sustainable Livelihood Framework (SLF) [14]. This was essential for economic diversification [15] and the promotion of sustainable livelihoods for future generations [16] in the 21st century. Globally, research on rural livelihood has gained prominence, aligning with the political goals of eradicating poverty and hunger [16].
Studies on sustainable livelihoods, including measurement, evaluation, and development of livelihood models, aim to ensure the improvement of rural livelihoods. Thus, anecdotal evidence suggests that education, resource regime, and infrastructure access are vital for enhancing livelihood strategies in Kampong Chhnang, Kampong Spue, and Kampong Thom [17], and integrating off-farm employment with improved social networking and education can reduce reliance on natural resources, such as land [18,19], to improve the conditions of the rural poor [20]. However, local dependence on land for agriculture creates vulnerability when linked to the global agriculture market [21]. There is a lack of examination of livelihood asset portfolios, which vary across different ecological and economic contexts within the country.
This article aims to empirically apply the SLF to examine local livelihood assets, focusing on human, natural, financial, physical, and social capital, to identify local vulnerabilities and enhance the understanding of the livelihoods of local people in Northwestern Cambodia. Specifically, it addresses the following questions: (1) Are there differences in livelihoods within the study villages? (2) Can we examine the livelihoods of different population groups? (3) What are household livelihood strategies? (4) Are local people earning sufficient income from agriculture, and if not, how do they address this issue? (5) Which population groups are most vulnerable?
In the 21st century, studies on sustainable rural livelihoods have sought to gain a deeper understanding of existing conditions, their intensity, complexity, and the associated migration, to identify ways to create more desirable outcomes for people [14]. A sustainable livelihood is expected to provide better access to basic needs, opportunities for enhancement, and a sense of identity and belonging by producing and distributing services and resources that ensure economic viability and social status [22].
Since then, approaches and frameworks have been established to ensure sustainable livelihood. These may include people-centered approaches, as well as adaptation of assets and strategies, national and global linkages, and institutional arrangements [23]. The objective is to establish a sustainable livelihood framework that takes into account vulnerability, livelihood resources, institutional arrangements, and livelihood strategies and outcomes. Livelihood assets or resources, including human, natural, financial, social, and physical capital, are key elements that draw the attention of researchers and development institutes to understand better the context of the community and different group populations [24]. Thus, understanding livelihood assets—the resource base of communities and households [25]—proves to be essential for understanding the conditions local people need to create for their families to be preferred [14,25].
Globally, the United Nations Development Programme introduced a simple way to visualize local livelihoods by adopting the livelihood asset pentagon [26], which has been found in various studies. The capital can be visualized to characterize population groups. Therefore, group vulnerability can be identified, and through intervention, asset variability needs to address specific group vulnerabilities within the livelihood contexts [24,27].
Livelihood assets can be measured and evaluated using simple models according to differences in ecological or economic context. For example, livelihood assets demonstrated an increase from 0.56 in 2006 to 0.71 in 2010, with participants scoring 0.77 and non-participants scoring 0.51. These differences in livelihood assets were statistically significant, as indicated by the Kruskal-Wallis test for non-parametric data analysis, applied to understand local livelihoods in the Baishuijiang National Nature Reserve, northwest China [11] [12]. In Ecuador, evaluating and measuring livelihood assets is necessary to understand the indigenous context, such as that of Guangaje Centro, Tingo Pucará, and Curinge. All scored below 0.5 on human, physical, and financial capital, thereby requiring intervention investment. Post-intervention, the livelihood assets score averaged between 0.4 and 0.6; however, the natural and social capital scores ranged between 0.6 and.9 [28]. Both investigations used index scores (0–1) to measure and evaluate rural livelihoods.
In Stung Treng Province, Cambodia, evaluating livelihood capital could potentially identify the vulnerability context through principal component analysis. The Heckman model, with Wilcoxon, Kruskal-Wallis, and chi-square tests, was employed to classify population group vulnerability. The authors found that high levels of human, physical, and social capital could enable households to benefit from the environmental extraction of fishing. However, enhanced human and social capital could also promote off-farm employment, reducing livelihood dependency on land and forest resources and promoting environmental stability in the face of forest degradation [18]. This research presents a challenging method for exploring the relationship between environmental income and rural livelihood, but it does not reveal the weaknesses of investment intervention. Hence, a simple model needs to be adopted.
Based on the series of questions presented in the Introduction section and the literature review in this section, we deliberately set the following research hypotheses: Hypothesis A mainly focuses on different livelihood assets of the population groups living in two villages, including the five types of capital and Hypothesis B aims for a deep understanding of the livelihood of sub-population groups and identify the most vulnerable group.
Hypothesis A: Different villages have different livelihood assets. This is because Dei Kraham villagers have better access to development projects, so they can access additional services than Ou Toek Thla Villagers.
Hypothesis B: New Settlers and Young Generation, the sub-population groups, are vulnerable due to low natural and human capital, thereby requiring intervention.
2. Materials and Methods
2.1. Study Location and Sampling Methods
Figure 1 shows the study location. This study was conducted in Battambang Province, which has undergone significant historical and transformational changes in both land use and governance since the 1700s. From 1775 to 1907, known as the Lord Governor Era, the province was under Thai influence; thereafter, it became a French protectorate until 1953. Following independence from France in 1953, development and investment projects were initiated until the onset of the civil war in 1970, which lasted until 1989. During this period, the province was under the rule of the Khmer Republic (1970-75), the Khmer Rouge (1975-79), and the People’s Republic of Kampuchea (1979-89), receiving significant migration from southern provinces, such as Kampot or Kampong Spue [29].
The study deliberately selected Dei Kraham Village (DK) and Ou Toek Thla Village (OT), located approximately 124 km west of Battambang Twon, with OT located approximately 10 km east of DK. The two study villages, located in the Ta Saen Commune in Kamrieng District, were selected for their common characteristics: (1) DK was established around 1979 by the Khmer Rouge and has existed ever since; (2) OT, a hamlet of DK, was formed 3-5 years later for land resource exploration; and (3) both villages consist mainly of migrants from Cambodian southern provinces with few original inhabitants from Battambang. These characteristics make them representative of similar villages along the Cambodian-Thai Border and northwest plateaus region.
Two years after the political integration, in 1998, the Cambodian census recorded the population of DK as 295 villagers (or 60 families) [30], which surged to 1491 villagers in 2008, while OT had 309 villagers in the same year [31].
The field observations recorded a total population of 1480 villagers (741 females) or 355 families in DK and 730 villagers (357 females) in OT across 156 families. The villages were divided into three main population subgroups: Old Settlers (OS), New Settlers (N.S.), and the Young Generation (YG). See Table 1 for details.
The first group, known as Old Settlers (OS), primarily from southern provinces such as Takeo and Kampot, consisted of former Khmer Rouge soldiers who served between 1970 and 1979 and retired between 1979 and 1996. They began to settle permanently in these villages between 1990 and 2002, acquiring forest lands whose size could be expanded based on the number of family members and labor force for agriculture, starting in 1993.
The second group, the New Settler (N.S.) families, comprised mostly ordinary people, with a few former Khmer Rouge and Government Soldiers, who relocated from their hometowns between 1970 and 2018, settling in this region between 1981 and 2016. Most were from the same province as the OS families with few variations. They migrated to this region to access land resources by purchasing land or seeking employment opportunities.
The children of the OS and N.S. families constituted the third group, the Young Generation (YG). More than 80 % of this subgroup was born in this region between 1970 and 2000, and is currently aged 23 to 53. The oldest among YG, over 45 years old, initially lived and were born elsewhere before their families moved to this region.
2.2. Sampling Method and Size
We adopted the stratified random sampling method to ensure representative coverage of the population subgroups living in the two-study villages in order to achieve sufficient sample size [32]; the sampling size estimation equations [33] are as follows:
Equation 1: Estimate total sample size by villages
where is the total sample size for each village, is the error margin of 10% (0.1), and the total population of each village. We then estimated the sample size of each stratum based on .
Equation 2: Sampling size estimation by stratum
where and denote, respectively, the total sample size and total population of each stratum. After determining the sample size, households were selected randomly from the voter list, excluding emigrated and immigrated families. This estimation was to improve the representativeness of population groups [32] and to understand the subgroup [34].
2.3. Livelihood Assets and Indicators
Based on field observations, a series of indicators were designed and selected to examine livelihood assets, including physical, natural, human, financial, and social capital [11,14,27,35]. These indicators were selected to match the reality and characteristics of the study locations.
For physical capital, we included indicators, such as " household fixed assets,” “household durable goods,” and “household energy structure” [11]. Although fuelwood remains the primary energy source, villagers have begun using gasoline, diesel, cooking gas, and grid electricity, which were incorporated into the questions [35].
For natural capital, we pinpointed “land and water resources” [5,7] and “forest resources” [12,14] due to their importance for survival and agricultural expansion. We also accessed “household environment” because it relates to the well-being of the household livelihood system [23,46].
For human capital, the study emphasized “Formal education” and “Education service” [37] established by the government since the political integration. “Health status” and “dependency ratio” have been introduced to reflect the impact of health on livelihood outcomes [39,47].
In term of social capital, the study selected “social network,” “community actions,” and “traditions,” such as mutual aid in agriculture, and religion and activities practiced by locals to create availability in their transitional social networks and relationships [11,41,42,43].
For financial capital, we used the core indicator of “household annual income in 2022-23” generated from commercial crops, mainly cassava, and included “household expenditure” questions, i.e., yes/no to simplify recall [44,45]. “Household income sources” were adopted to better understand livelihood diversification [38]. The details of the indicators, question types, and measurement models are provided in Table 2.
2.4. Measuring Livelihood
Table 3 shows the average livelihood scores for every population subgroup in each village, calculated using the equations provided. Weighting methods were adopted to examine local livelihood [11]. The results were visualized in three ways based on the questionnaire data.
First, for “Yes” and “No” questions (e.g., “whether…” or “do…”), scoring was calculated using Equation 3.
Equation 3: Scoring yes / no question [11]
Second, for questions with status ranking from good to poor, the scoring mode is shown in Equation 4.
Equation 3: Scoring scale question and answer from 1 through 3 [11]
Third, we used Equation 5 to estimate daily income per individual (aged 15 – 64 years) related to “HH annual income” earned from agriculture.
Equation 5: Estimating the daily per capita income of the working-age population [44]
Where is daily income per person, is HH annual income from agriculture, is the number of active family members, aged 15-64 years (), is number of days in a year (365 days), and is the poverty line in rural Cambodia, i.e., 8,908.00 KHR (2.196 USD)/day [48]. The average exchange rate of KHR against the US Dollar was the average exchange rate evaluated by NBC, i.e., 4110KHR/USD, in 2023 [49]. We then adopted the conditions to score this indicator, as shown in (6).
Equation 6: Scoring answers related to household annual income modified from (4)
Finally, the financial, human, physical, natural, and social capital values were calculated using Equation 7:
Equation 7: Calculation of livelihood capital [11]
Where (0 ≤ ≤ 1) is the criteria score for the types of capital, is the indicator index ( = 1, 2, 3, … ), is the indicator value, and denotes the total number of questions and answers.
The mean “Livelihood Asset” per person is calculated as:
Equation 8: Calculation of livelihood assets [11]
where , , , , and denote the physical, natural, human, financial, and social capital, respectively. A higher indicates a better livelihood.
3.5. Data Analysis
To compare livelihoods among the respondents, the study adopted the Kruskal-Wallis Test, a rank-based non-parametric method, at the error level of 5%, to identify statistically significant differences between the population groups [11]. Data were entered in Google Sheets for easy sharing with co-authors and the analysis used the “dplyr” package [50] in R version 4.4.0. Data manipulation followed R Cookbook [51] and “ggplot2” package [52] and MS Excel were used for visualization. Data analysis was conducted at two levels: village and population subgroups.
3. Results
In village-level livelihood discussions, the percentages were based on the total sample size of each village. For the population subgroups, percentages were derived from the sample size of each stratum.
3.1. Village Level Analysis
The data analysis suggests that livelihood assets are not significantly different between the villagers in DK and OT, except for human and financial capital, which indicate a significant difference (p < 0.001 and p < 0.003; see Table 4). Educational attainment was empirically low in both groups. In DK, 58% of villagers attended elementary school, 16% attended secondary school, 4% attended high school, and 1% attended university. In comparison, in OT, 69% of villagers attended elementary school, 10% attended secondary school, and 2% attended high school 2%. The illiteracy rate in DK was 2% higher than that in OT.
3.2. Livelihood Analysis for Population Subgroups
The analysis illustrates a significant difference in livelihood assets among the population subgroups in the study locations, with a chi-squared value= 23.878, df = 5, and p-value= 0.0002. The four livelihood capital types–Cp, Ch, Cs, and Cf–were significantly different, with p-values ranging from 0.0009 to 0.026; Cn was an exception. The detailed comparison results for each population subgroup are provided in Table 5.
According to the Kruskal-Wallis test, the results indicate insignificant differences between the DK and OT villagers, except in human (Ch) and financial (Cf) capital. In general, livelihood assets are similar across villages and income is generated primarily from agriculture. Significant differences were observed between the population subgroups; thus, the following section details the subgroup characteristics.
3.3. Livelihood at the Two Villages
The statistical test indicates that livelihood assets were not significantly different between DK and OT villagers; however, the empirical data reveal distinct characteristics (Figure 2). Low education levels caused a reliance on agriculture in both villages. In DK, only 1% of household heads had attended university, 4%, high school, 16%, secondary school, and 58% had attended elementary school, while 2% were illiterate. Consequently, 46% of villagers depended on farming, 41% on wage labor, 7% on pensions, and 7% on off-farm businesses. For secondary jobs, 12% of DK relied on farms, 24%, on wage labor (mostly in Thailand), 1%, on pensions, and 5%, on off-farm businesses. Annual family income ranged between 1,338,720 KHR (325.72 USD) and 228,698,000 KHR (55,644.28 USD), translating into 2292 KHR (0.56 USD) to 313285 KHR (76.25 USD) per day per working-age population. This implies that 28% of the villagers earned below the poverty line including 24% aged between 16-64 years old and 4% aged ≥ 65 years old with majority of N.S.DK families.
In OT, 2% had attended high school, 10%, secondary school, 69%, elementary school, while 18% were illiterate. Their primary sources of income were farming, accounting for 53%, wage labor, 35%, off-farm businesses, 8%, and pensions, 4%. Regarding secondary jobs, farming accounted for 8%, wage labor for 27%, and off-farm businesses for 12%. The earnings ranged between 334680 KHR (81.43 USD) and 100404000 KHR (24429.2 USD) per family annually or between 458 KHR (0.11 USD) to 137540 KHR (33.46 USD) per day per working-age population. As a result, 43% of the OT families lived below the poverty line including 29% and 14% of population aged 16-64 years old and older than or equal 65 years old. Mostly, they are OS.OT families who depend on their children.
3.4. Population Subgroups’ Livelihood
3.3.1. OS Family Livelihoods
OS families in both villages showed significant differences in livelihood assets, including Cp (p = 0.026), Ch (p = 0.023), and Cf (p = 0.001), while the overall livelihood assets were significant, with a p-value of 0.009 (see Table 3). OS.DK families had a livelihood score of 0.58, which is slightly better than OS.OT’s 0.51 (see Figure 3, left). After the civil war, these subgroups began logging forest land for agriculture, making natural resources central to livelihood improvement.
In DK, OS.DK Families acquired an average of 6.94 hectares of farmland, with 7%, aged 60 – 68 years, being landless (depended on children). The average annual income per family was 46,488,646.00 KHR (11311.11 USD). The minimum daily income of working-age household was 3,668 KHR (0.89 USD), with a maximum of 313,285 KHR (76.23 USD) per working-age population. Of these families, 21% earned below the poverty line and were indebted to microfinance institutions for agricultural improvement, but with low dependency ratio (see Figure 4: landholdings and annual income).
Regarding human capital, OS.DK families prioritized formal education for their children, despite limited access to school of household heads due to war. Education attainment among the household heads was as follows: Elementary school: 50%, secondary school: 14%, high school: 7% and illiterate: 29%. In contrast, their first children have higher education attainment: 21% at elementary, 29% at secondary, 7% at high school levels, 43% at university. The families’ second children attend elementary, secondary, and high school, each 21%, 29% at university, and illiterate: 7% respectively.
OS.OT families arrived a few years after OS.DK families, sent by their army division to acquire land for their livelihood. On average, OS.OT families owned 2.7 ha, with 11% (2 families only) being landless and aged between 52 and 74 years. Annual income was 6,226,288.00 KHR (1,514.91 USD) per family, and the average daily income was 6,224 KHR (1.51 USD), with a minimum of 458 KHR (0.11 USD) and a maximum of 40,753 KHR (9.91 USD). Due to lower incomes, 78% of OS.OT families lived below the poverty line.
OS.OT families had the highest education levels, with 5% having attended secondary school, 89%, elementary school, and 6% being illiterate. Regarding their children’s education: 44% of the first children of these families attended elementary school, 50%, secondary school, and 6% did not attend school. The second child had a higher illiteracy rate (or not yet due), with 39%, 39% attending elementary school, 17%, secondary school, and 6% attending university.
Energy use demonstrated insignificant differences; however, a notable variation was noted in grid electricity access. In DK, 100% of OS families received grid electricity, compared to 67% in OT. Consequently, 77% of the OT.OS families used solar power versus 21% of DK.OS families. Gasoline and diesel were locally available to all OS families. See Appendix A for detailed empirical data on the physical capital of each population subgroup.
3.4.2. N.S. Family Livelihoods
In general, the overall livelihood assets of N.S. Families in the two villages indicated an insignificant difference, with a p-value of 0.814 (Table 5). Livelihood asset scored 0.49 and 0.50 (Figure 3, middle panel). However, social capital was significant with a p-value of 0.033. N.S. families settled in this region through relatives or friends, unlike OS Families, and accessed land for farming through purchases and requests.
N.S.DK families owned an average of 4.81 hectares for residential and agricultural use. Their annual income ranged from 3,012,120 KHR (732.59 USD) to 51,540,720 KHR (12,540.32 USD), with 37% living below the poverty line, with a daily income of 4075 KHR (0.99 USD) per capita for the lower income and 70,604 KHR (17.17 USD) per capita for higher income.
Table 6 presents the education levels of the household head to the second child of N.S. families. N.S.DK families had low education levels, with the highest being secondary school, due to the lack of schools during the war. Despite this, they place great importance on their children’s education as a means of improving their families’ futures.
N.S.OT families earned between 3,346,800 KHR (814.3 USD) and 55,780,000 KHR (13,571.78 USD) annually, with per capita incomes ranging from 2445 (0.59 USD) KHR to 50,941 KHR (12.39 USD). Approximately 71% of N.S.OT families lived above the poverty line.
Although, like N.S.DK families, NS.OT families prioritized education, financial constraints, poor road accessibility, and long distances to school made it challenging for them to send their children to school. For a comparison of landholdings per family and their annual incomes, see Figure 4.
3.4.3. YG Family Livelihoods
According to the Kruskal–Wallis test, the YG.DK and YG.OT families had significant LA, Ch, and Cf values, with p-values of 0.027, 0.001, and 0.023, respectively (Table 5). YG.DK families have better livelihood assets than those living in OT (Figure 2, right panel). The heads of the YG.DK and YG.OT families were aged between 23 and 53 years, with an average of 34 years. YG. DK families possessed higher education levels, with more children acquiring education, which enhanced their chances of university attendance. In contrast, YG.OT families had lower education levels and less participation in education (Table 7).
YG.DK families owned lands between 0.04 ha to 27 ha for agricultural or residential purposes, varying by age and land transfer. Their annual income was between 1,673,400.00 KHR (407.15 USD) and 167,340,000.00 KHR (40715.33 USD). Approximately 20% of population subgroups earned below than the poverty line, with daily incomes of 2,292 KHR (0.56 USD) and to 229,233 KHR (55.77 USD) per person.
YG.OT families earned between 5,912,680.00 KHR (1,438.61 USD) to 100,404,000.00 KHR (24,429.2 USD) annually. Their daily incomes were between 8,100 KHR (1.97 USD) and 137,540 KHR (33.46 USD). About 14% of the villagers were below the poverty line.
4. Discussion
Agriculture is the primary source of livelihood in this region, supporting diversified agricultural practices and eradicating poverty. Old settlers have better access to land, which they have expanded for commercialization. New settlers seek land to improve their livelihood. Commercialization of farms, e.g., large cassava farms in this study location, could help sustain the livelihoods of the poor by providing job opportunities [53] and can potentially eradicate poverty, but it is a key factor for land change drivers [7,8,54].
Land is crucial for livelihood improvement and future prospects, particularly for the younger generations. Commercial agriculture has long been a key source of income for locals, enabling the modernization of farming and family support. Locals use income to gain better access to media, such as TV, radio, smartphones, and the Internet for opportunities to adopt modern farming practices [55]. This connectivity also supports small and medium enterprises in local agricultural markets [56] and makes local decisions on education as a long-term investment for the younger generation. See Appendix A for details on physical capital.
Land resources are becoming scarce owing to population pressure and agricultural expansion for commercialization. For example, in DK, population surged from 295 villagers in 1998 [30] to 1491 in 2008 [31] and 1480 in 2023, limiting the land resources that the villagers have transformed into commercial farms. Consequently, the Roneam Daun Sam Wildlife Sanctuary, initially covering 178,000 ha, was revoked in 2018 in this region due to population pressure and agricultural expansion [57]. Thus, land is already in short supply, limiting accessibility; N.S. families, who had late access, are mostly becoming landless agricultural workers because of land resource limitations.
Commercialized agriculture has been conducted by local people, providing general annual income that is used to modernize agricultural activities and enhance their livelihoods. This mechanism can help diversify careers within the livelihood structure, which is a strategy based on agricultural commercialization to enhance overall livelihood profiles (Table 8). As locals engage in global economic trends, they face market uncertainties [58].
In this study, we analyzed local livelihoods at two levels. At village level, we found that DK villagers have livelihood assets score ranging from 0.32 to 0.73 and OT villagers received livelihood assets score between 0.33 and 0.62. The livelihood asset score ranges from 0 (worse) to 1 (excellence). About 46% of DK villagers have a livelihood asset score below 0.5, compared to 53% of OT villagers of (See Figure 5, left).
Considering population subgroups, livelihood measurements indicate vulnerability groups. 14% of OS.DK families scored lower than 0.5, compared to 60% of N.S.DK, 44% of YG.DK, 33% of OS.OT, 58.82% of N.S.OT, and 71.43% of YG.OT families. Therefore, YG.OT families were the most vulnerable group, followed by N.S.DK and N.S.OT families (Figure 5, right panel).
Accessing the livelihoods of population subgroups can enhance our understanding of subgroup vulnerability. A Sustainable Livelihood Framework can effectively examine local livelihood conditions [14]. Focusing solely on daily income reveals that a significant portion of the population aged 15-64 years is below the poverty line in Equation 5 [44]. Using the livelihood pentagon from scoring methods for measurement and evaluation [11] will provide clearer information about local livelihoods and help identify vulnerable groups.
The estimated daily income of the working-age population is similar to the Cambodian national poverty line reported by the World Bank in 2022. In general, the population living in poverty is 17% lesser than the national poverty line of 24% in plateaus, 23% in mountains, and 23% in rural areas on average [59]. By comparing the sample size of each village, the study found that 28% of DK villagers are living below the poverty line, compared 43% of OT villagers. Considering working-age population (16-64 years old), the poor are 24% in DK and 29% in OT. OT villagers mostly have lower incomes because this village is farther and more remote than DK, where development projects, such as roads, schools, and markets are easier for villagers.
Education plays a vital role in the development of livelihoods. Microeconomic analyses indicate that education positively affects household distribution and overall livelihood improvement [37]. Thus, villagers, especially OS families with higher education levels, prioritize expanding agricultural land to enhance their economic status and secure their children’s education pathways.
This study could help identify local vulnerabilities and improve the understanding of the livelihoods of local people in Northwestern Cambodia. However, it has a limitation related to its cross-section study design to collect in-situ information at a specific point around or in time rather than providing time-series data as noted by Kemodel 2018, it requires repeated findings to capture the livelihood dynamic [60].
On the positive side, the study allows for a quick examination of rural livelihood conditions, highlighting the important of understanding livelihood dynamic process involved Ellis, (2000) [61] which the approach can inform future study on rural livelihood, similar to the working efforts of Pritchard et al., (2019) who used the data from cross-sectional study to investigate non-farm livelihoods for securing and diversifying food and dietary options for rural Myanmar [62].
5. Conclusions
Cambodia’s economy has been transformed since the end of the Civil War, with land becoming a crucial resource for improving agricultural livelihoods. The locals have shifted from subsistence to commercial agriculture. This study adopted a sustainable livelihood framework and examined population group vulnerability by analyzing physical, natural, human, social, and financial capital to identify three population subgroups in the study location: the OS, NS, and YG families. To examine local livelihoods, this study separately analyzed in-situ information in two stages: village-level and population subgroup evaluation.
Notably, the analysis results indicated insignificant differences among the DK and OT, but significant differences among the subgroups of the population. At the village level, human and financial capital are significantly different, resulting in the DK villagers’ livelihood assets being better than those of the OT villagers. Hence, Hypothesis A was rejected because livelihood assets, in general, were not different; however, the model has the potential to evaluate livelihood capital.
The sub-population groups, N.S. and YG, are facing a vulnerability that requires intervention because of the low nature of lands, and a formal education level would reduce the future uncertainty. Physical, human, and financial capital are key differentiating factors, when examining the subpopulation groups. This is because OS.DK benefits from land acquired after the war, better enhancing its capital than OS.OT. N.S. families face socioeconomic challenges, often becoming laborers rather than landowners due to “first come, first served.” They are among the most vulnerable, and many are landless agrarian workers.
The YG families, who either inherited or purchased land after marriage, demonstrate varying characteristics based on education levels and opportunities. YG.DK had higher education levels than YG.OT, reflecting the importance of education in overcoming limited land resources. Financial capital significantly influences physical capital; therefore, there is an urgent need to enhance both human and financial capital for N.S. and YG families. Thus, Hypothesis B was accepted.
In conclusion, land is essential to improve livelihoods in rural Cambodia. OS families are relatively secure and are facing aging issues, but N.S.DK and N.S.OT families are considered vulnerable groups that require attention, while YG.DK and YG.OT families are facing an uncertain future, with education being necessary for long-term sustenance of their livelihoods and those of future generations.
This method can be applied to examine local livelihoods in a specific context, offering insights into livelihood assets, weaknesses, and vulnerability groups. For the future investigations, the studies on livelihood trajectory would need to improve the understanding of how local people escape from, or get trapped in poverty after the long decades of the post-civil war period. The exploration will help identify the drivers that contribute to enhancing rural livelihood sustainability, with efforts to reduce inequality.
Author Contributions
Conceptualization, C.D. & S.H.; Data curation and analysis, D.C.; Investigation, D.C., S.H., S.S., S.P., C.C., S.E., L.L., N.S., and H.S.; Supervision, S.H. and H.S.; Data validation and Methods, C.D. & H.L., and H.S.; Proofing – S.H. and H.S.; Writing original draft, D.C.; Writing review & editing, S.H., H.S., S.P., and L.H.S. All authors have read and agreed to the published version of the manuscript.
Funding
This work is funded by the Royal Government of Cambodia to the Faculty of Land Management and Land Administration, the Royal University of Agriculture, the Ministry of Agriculture, Forestry and Fisheries through the Higher Education Improvement Project of the General Department of Higher Education, the Ministry of Education, Youth, and Sport under the World Bank Credit No. 6221-KH.
Institutional Review Board Statement
Not applicable
Informed Consent Statement
Not applicable
Data Availability Statement
The interviewed data is available on request from the corresponding authors, C.D. and S.H
Acknowledgments
We are grateful to the Graduate School of Agriculture (GSA) and the Graduate School of Global Environmental Studies (GSGES), Kyoto University, Japan. Prof. Izuru Saizen from Regional Planning Laboratory, Prof. Higuchi from Laboratory, and Prof. Shinya Funakawa from Soil Science Laboratory that provide the hospitality for long-term collaboration.
Conflicts of Interest
The authors declare no conflict of interest.
Abbreviations
The following abbreviations are used in this manuscript:
| KHR | Khmer Reil |
| DK | Dei Kraham Village |
| OT | Ou Toek Thla Village |
| OS | Old settlement |
| N.S. | New settlement |
| YG | Young generation of OS and N.S. |
| OS.DK | Old settler families living in DK Village |
| NS.DK | New settler families living in DK Village |
| YG.DK | New generation families or youth generation families living in DK Village |
| OS.OT | Old settler families living in OT Village |
| NS.OT | New settler families living in OT Village |
| YG.OT | New generation families or youth generation families living in OT Village |
Appendix A: Detail physical capital in percentage
| Indicators | Materials or Tools | DK Village | OT Village | ||||
| OS | NS | NGYG | OS | NS | NGYG | ||
| HH Fixed asset | Farmlands | 100 | 94.29 | 100 | 100 | 88.24 | 78.57 |
| House | 100 | 94.29 | 96 | 100 | 94.12 | 85.71 | |
| House with road access | 100 | 97.14 | 96 | 100 | 100 | 100 | |
| Farmlands with road access | 100 | 25.71 | 56 | 55.56 | 52.94 | 64.29 | |
| Irrigation | 42.86 | 14.29 | 32 | 11.11 | 17.65 | 21.43 | |
| Durable goods | Power tillage | 57.14 | 2.86 | 16 | 16.67 | 5.88 | 7.14 |
| Tractors | 42.86 | 5.71 | 20 | 5.56 | 5.88 | 7.14 | |
| Harvesters | 7.14 | 0 | 4 | 0 | 0 | 0 | |
| Power generator | 14.29 | 14.29 | 8 | 27.78 | 5.88 | 21.43 | |
| Motors | 92.86 | 82.86 | 84 | 83.33 | 82.35 | 71.43 | |
| Cars | 35.71 | 5.71 | 24 | 0 | 5.88 | 14.29 | |
| Pumps | 85.71 | 31.43 | 56 | 72.22 | 41.18 | 50 | |
| Sprayers | 85.71 | 34.29 | 72 | 94.44 | 64.71 | 64.29 | |
| Disc plows | 35.71 | 5.71 | 32 | 5.56 | 5.88 | 7.14 | |
| TVs | 100 | 45.71 | 52 | 77.78 | 41.18 | 28.57 | |
| PCs | 0 | 0 | 8 | 0 | 0 | 0 | |
| Freezers | 85.71 | 8.57 | 12 | 5.56 | 11.76 | 7.14 | |
| Washing | 28.57 | 0 | 4 | 0 | 0 | 7.14 | |
| Mobiles | 100 | 94.29 | 100 | 88.89 | 100 | 85.71 | |
| HH Energy structure | Gasoline | 92.86 | 85.71 | 96 | 85.71 | 70.59 | 83.33 |
| Battery | 50 | 45.71 | 60 | 50 | 64.71 | 55.56 | |
| Grid | 100 | 74.29 | 68 | 57.14 | 58.82 | 66.67 | |
| Fuel | 92.86 | 85.71 | 96 | 85.71 | 82.35 | 88.89 | |
| Solar | 21.43 | 28.57 | 40 | 85.71 | 82.35 | 77.78 | |
References
- Chhay, P.; Soeun, P.; Sambath, N. Policy Paper: The Success of Win-Win Policy and Peace Building Process in Cambodia. the Cambodia Journal of Basic and Applied Research 2022, 4, 82–90. [Google Scholar]
- Sok, S. Cambodia Enters the WTO: Lessons Learned for Least Developed Countries. 2005.
- Sok, K. Dynamics of Rural Household Activities and Poverty at Diversified Agro-Ecosystems of Tonle Sap Lake in Battambang Province, Cambodia, Institut National d’Etudes Supérieures Agronomiques de Montpellier, 2023.
- Fox, J.; McMahon, D.; Poffenberger, M.; Vogler, J. Land for My Grandchildren : Land-Use and Tenure Change In Ratanakiri : 1989-2007; CFi&EWC: Cambodia, 2008. [Google Scholar]
- Hor, S.; Saizen, I.; Tsutsumida, N.; Watanabe, T.; Kobayashi, S. The Impact of Agricultural Expansion on Forest Cover in Ratanakiri Province, Cambodia. Journal of Agricultural Science 2014, 6, 46–59. [Google Scholar] [CrossRef]
- Hor, S.; Mizuno, K.; Kobayashi, S.; Watanabe, T. The Traditional Practice of Swidden Cultivation in the Djarai Ethnic Communities of Northeastern Cambodia. Journal of the Japanese Agricultural Systems Society 2014. [Google Scholar] [CrossRef]
- Kong, R.; Diepart, J.C.; Castella, J.C.; Lestrelin, G.; Tivet, F.; Belmain, E.; Bégué, A. Understanding the Drivers of Deforestation and Agricultural Transformations in the Northwestern Uplands of Cambodia. Applied Geography 2019, 102, 84–98. [Google Scholar] [CrossRef]
- Sourn, T.; Pok, S.; Chou, P.; Nut, N.; Theng, D.; Rath, P.; Reyes, M.R.; Prasad, P.V.V. Evaluation of Land Use and Land Cover Change and Its Drivers in Battambang Province, Cambodia from 1998 to 2018. Sustainability 2021, 13, 11170. [Google Scholar] [CrossRef]
- Leisz, S.J.; Yasuyuki, K.; Fox, J.; Masayuki, Y.; Rambo, T.A. Land Use Changes in the Uplands of Southeast Asia: Proximate and Distant Causes. Southeast Asian Studies 2009, 47, 237–243. [Google Scholar]
- Lewis, W.A. Economic Development with Unlimited Supplies of Labour. The Manchester School 1954, 22, 139–191. [Google Scholar] [CrossRef]
- Chen, H.; Zhu, T.; Krott, M.; Calvo, J.F.; Ganesh, S.P.; Makoto, I. Measurement and Evaluation of Livelihood Assets in Sustainable Forest Commons Governance. Land use policy 2013, 30, 908–914. [Google Scholar] [CrossRef]
- Kamwi, J.M.; Chirwa, P.W.C.; Manda, S.O.M.; Graz, P.F.; Kätsch, C. Livelihoods, Land Use and Land Cover Change in the Zambezi Region, Namibia. Popul Environ 2015, 37, 207–230. [Google Scholar] [CrossRef]
- Mahdi; Shivakoti, G.P.; Schmidt-Vogt, D. Livelihood Change and Livelihood Sustainability in the Uplands of Lembang Subwatershed, West Sumatra, Indonesia, in a Changing Natural Resource Management Context. Environ Manage 2009, 43, 84–99. [CrossRef]
- Chambers, R.; Conway, G.R. Sustainable Rural Livelihood: Practical Concepts for the 21st century; 72; 1991.
- Reardon, T.; Taylor, J.E. Agroclimatic Shock, Income Inequality, and Poverty: Evidence from Burkina Faso. World Dev 1996, 24, 901–914. [Google Scholar] [CrossRef]
- Franco, I.B.; Minnery, J. SDG 1 No Poverty. In Actioning the Global Goals for Local Impact; Springer: Singapore, 2020; pp. 5–21. [Google Scholar]
- Jiao, X.; Pouliot, M.; Walelign, S.Z. Livelihood Strategies and Dynamics in Rural Cambodia. World Dev 2017, 97, 266–278. [Google Scholar] [CrossRef]
- Nguyen, T.T.; Do, T.L.; Bühler, D.; Hartje, R.; Grote, U. Rural Livelihoods and Environmental Resource Dependence in Cambodia. Ecological Economics 2015, 120, 282–295. [Google Scholar] [CrossRef]
- Lonn, P.; Mizoue, N.; Ota, T.; Kajisa, T.; Yoshida, S. Evaluating the Contribution of Community-Based Ecotourism (CBET) to Household Income and Livelihood Changes: A Case Study of the Chambok CBET Program in Cambodia. Ecological Economics 2018, 151, 62–69. [Google Scholar] [CrossRef]
- Felkner, J.S.; Lee, H.; Shaikh, S.; Kolata, A.; Binford, M. The Interrelated Impacts of Credit Access, Market Access and Forest Proximity on Livelihood Strategies in Cambodia. World Dev 2022, 155, 105795. [Google Scholar] [CrossRef]
- Hought, J.; Birch-Thomsen, T.; Petersen, J.; de Neergaard, A.; Oelofse, M. Biofuels, Land Use Change and Smallholder Livelihoods: A Case Study from Banteay Chhmar, Cambodia. Applied Geography 2012, 34, 525–532. [Google Scholar] [CrossRef]
- Manion, H.K. International Social Problems: A Systems Perspective. International Encyclopedia of the Social & Behavioral Sciences: Second Edition 2015, 12, 542–549. [Google Scholar] [CrossRef]
- Scoones, I. Sustainable Rural Livelihoods: A Framework for Analysis; 72; 1998.
- DFID Sustainable Livelihoods Guidance Sheets; London, 1999.
- Chambers, R. Rural Development Putting the Last First; Pearson Education Limited, 1983; Vol. 60; ISBN 9780582644434.
- UNDP Guidance Note: Application of the Sustainable Livelihoods Framework in Development Project; 2017.
- Carney, D. Sustainable Livelihoods Approaches : Progress and Possibilities for Change. Secretary 2003, 2008, 67. [Google Scholar]
- Blackmore, I.; Iannotti, L.; Rivera, C.; Waters, W.F.; Lesorogol, C. A Formative Assessment of Vulnerability and Implications for Enhancing Livelihood Sustainability in Indigenous Communities in the Andes of Ecuador. J Rural Stud 2023, 97, 416–427. [Google Scholar] [CrossRef]
- Han, S.S.; Lim, Y. Battambang City, Cambodia: From a Small Colonial Settlement to an Emerging Regional Centre. Cities 2019, 87, 205–220. [Google Scholar] [CrossRef]
- NIS Cambodian Population Census 1998; National Institute of Statistics, Ministry of Planning: Phnom Penh, Cambodia, 1998.
- NIS Cambodian Population Census 2008; National Institute of Statistics, Ministry of Planning: Phnom Penh, Cambodia, 2008.
- Cochran, W.G. Sampling Techniques; 3rd ed.; Wiley, 1977; ISBN 978-0-471-16240-7.
- Yamane, T. Statistics: An Introductory Analysis; Harper & Row: New York, 1967. [Google Scholar]
- Bryman, A. Social Research Methods; Fifth.; Oxford University Press: Oxford, 2016. [Google Scholar]
- Trung Thanh, H.; Tschakert, P.; Hipsey, M.R. Moving up or Going under? Differential Livelihood Trajectories in Coastal Communities in Vietnam. World Dev 2021, 138, 105219. [Google Scholar] [CrossRef]
- Ravallion, M. Poverty and Inequality Measures. In The Economics of Poverty; Ravallion, M., Ed.; Oxford University Press: New York, 2016; pp. 219–289. ISBN 9780190212766. [Google Scholar]
- Tran, T.A.; Tran, T.Q.; Tran, N.T.; Nguyen, H.T. The Role of Education in the Livelihood of Households in the Northwest Region, Vietnam. Educational Research for Policy and Practice 2020, 19, 63–88. [Google Scholar] [CrossRef]
- Bhatti, M.A.; Godfrey, S.S.; Ip, R.H.L.; Kachiwala, C.; Hovdhaugen, H.; Banda, L.J.; Limuwa, M.; Wynn, P.C.; Ådnøy, T.; Eik, L.O. Diversity of Sources of Income for Smallholder Farming Communities in Malawi: Importance for Improved Livelihood. Sustainability 2021, 13, 9599. [Google Scholar] [CrossRef]
- Ayana, G.F.; Megento, T.L.; Kussa, F.G. The Extent of Livelihood Diversification on the Determinants of Livelihood Diversification in Assosa Wereda, Western Ethiopia. GeoJournal 2022, 87, 2525–2549. [Google Scholar] [CrossRef]
- Feldstein, M.; Liebman, J.B. Chapter 32 Social Security. In Handbook of Public Economics; Auerbach, A.J., Feldstein, M., Eds.; ScienceDirect, 2002; pp. 2245–2324.
- Wijers, G.D.M. Navigating a River by Its Bends: A Study on Transnational Social Networks as Resources for the Transformation of Cambodia. Ethn Racial Stud 2014, 37, 1526–1545. [Google Scholar] [CrossRef]
- Kobayashi, S. Cultural Innovation in the Face of Modernization: A Study of Emerging Community-Based Care in Rural Cambodia. South East Asia Res 2020, 28, 231–247. [Google Scholar] [CrossRef]
- Cook, B.R.; Satizábal, P.; Touch, V.; McGregor, A.; Diepart, J.-C.; Utomo, A.; Harrigan, N.; McKinnon, K.; Srean, P.; Tran, T.A.; et al. Historical Agrarian Change and Its Connections to Contemporary Agricultural Extension in Northwest Cambodia. Crit Asian Stud 2024, 1–28. [Google Scholar] [CrossRef]
- US Census Bureau How the Census Bureau Measures Poverty. Available online: https://www.census.gov/topics/income-poverty/poverty/guidance/poverty-measures.html (accessed on 5 January 2024).
- Haughton, J.; Khandker, S.R. Handbook on Poverty and Inequality; The World Bank: Washington DC, 2009; ISBN 978-0-8213-7613-3. [Google Scholar]
- Li, T.; Singh, R.K.; Cui, L.; Xu, Z.; Liu, H.; Fava, F.; Kumar, S.; Song, X.; Tang, L.; Wang, Y.; et al. Navigating the Landscape of Global Sustainable Livelihood Research: Past Insights and Future Trajectory. Environmental Science and Pollution Research 2023, 30, 103291–103312. [Google Scholar] [CrossRef]
- Mphande, F.A. Rural Livelihood. In Infectious Diseases and Rural Livelihood in Developing Countries; Springer Singapore: Singapore, 2016; pp. 17–34. [Google Scholar]
- Karamba, W.; Tong, K.; Salcher, I. Cambodia Poverty Assessment Toward A More Inclusive and Resilient Cambodia; Phnom Penh, 2022.
- NBC Annual Report 2023; Phnom Penh, 2023; Vol. 5.
- Wickham, H.; François, R.; Henry, L.; Müller, K.; Vaughan, D. A Grammar of Data Manipulation “Dplyr” 2023.
- Teetor, P. R Cookbook; Loukides, M., Ed.; O’Reilly Media: Sebastopol, 2011; ISBN 9780596809157.
- Wickham, H.; Chang, W.; Henry, L.; Pedersen, T.L.; Takahashi, K.; Wilke, C.; Woo, K.; Yutani, H.; Dunnington, D.; Brand, T. van den Create Elegant Data Visualisations Using the Grammar of Graphics 2024, 354.
- Giger, M.; Reys, A.; Anseeuw, W.; Mutea, E.; Kiteme, B. Smallholders’ Livelihoods in the Presence of Commercial Farms in Central Kenya. J Rural Stud 2022, 96, 343–357. [Google Scholar] [CrossRef]
- Hor, S. The Transition of Farming Systems Causing Forest Degradation in Ratanakiri Province, Cambodia, Kyoto University, 2014.
- Asuman, M.K.A.; Moodley, S. Livelihood Improvement Through Participatory Mass Communications: A Study on Community Radio and the Lives of Women in Northern Ghana. In Indigenous African Language Media; Springer Nature Singapore: Singapore, 2023; pp. 381–399. [Google Scholar]
- Wicaksono, T.; Nugroho, A.D.; Lakner, Z.; Dunay, A.; Illés, C.B. Word of Mouth, Digital Media, and Open Innovation at the Agricultural SMEs. Journal of Open Innovation: Technology, Market, and Complexity 2021, 7, 91. [Google Scholar] [CrossRef]
- RGC Revocation Snoul Wildlife Sanctuary in Kratie Province and Roneam Daun Sam Wildlife Sanctuary in Battambang Province; Cambodia, 2018; p. 2970.
- Nicod, T.; Bathfield, B.; Bosc, P.-M.; Promkhambut, A.; Duangta, K.; Chambon, B. Households’ Livelihood Strategies Facing Market Uncertainties: How Did Thai Farmers Adapt to a Rubber Price Drop? Agric Syst 2020, 182, 102846. [Google Scholar] [CrossRef]
- CAMBODIA POVERTY ASSESSMENT Toward A More Inclusive and Resilient Cambodia; 2022.
- Kesmodel, U.S. Cross-Sectional Studies – What Are They Good For? Acta Obstet Gynecol Scand 2018, 97, 388–393. [Google Scholar] [CrossRef] [PubMed]
- Ellis, F. Rural Livelihood Diversity in Developing Countries: Evidence and Policy Implications.
- Pritchard, B.; Rammohan, A.; Vicol, M. The Importance of Non-Farm Livelihoods for Household Food Security and Dietary Diversity in Rural Myanmar. J Rural Stud 2019, 67, 89–100. [Google Scholar] [CrossRef]
Figure 1.
Map of the study locations
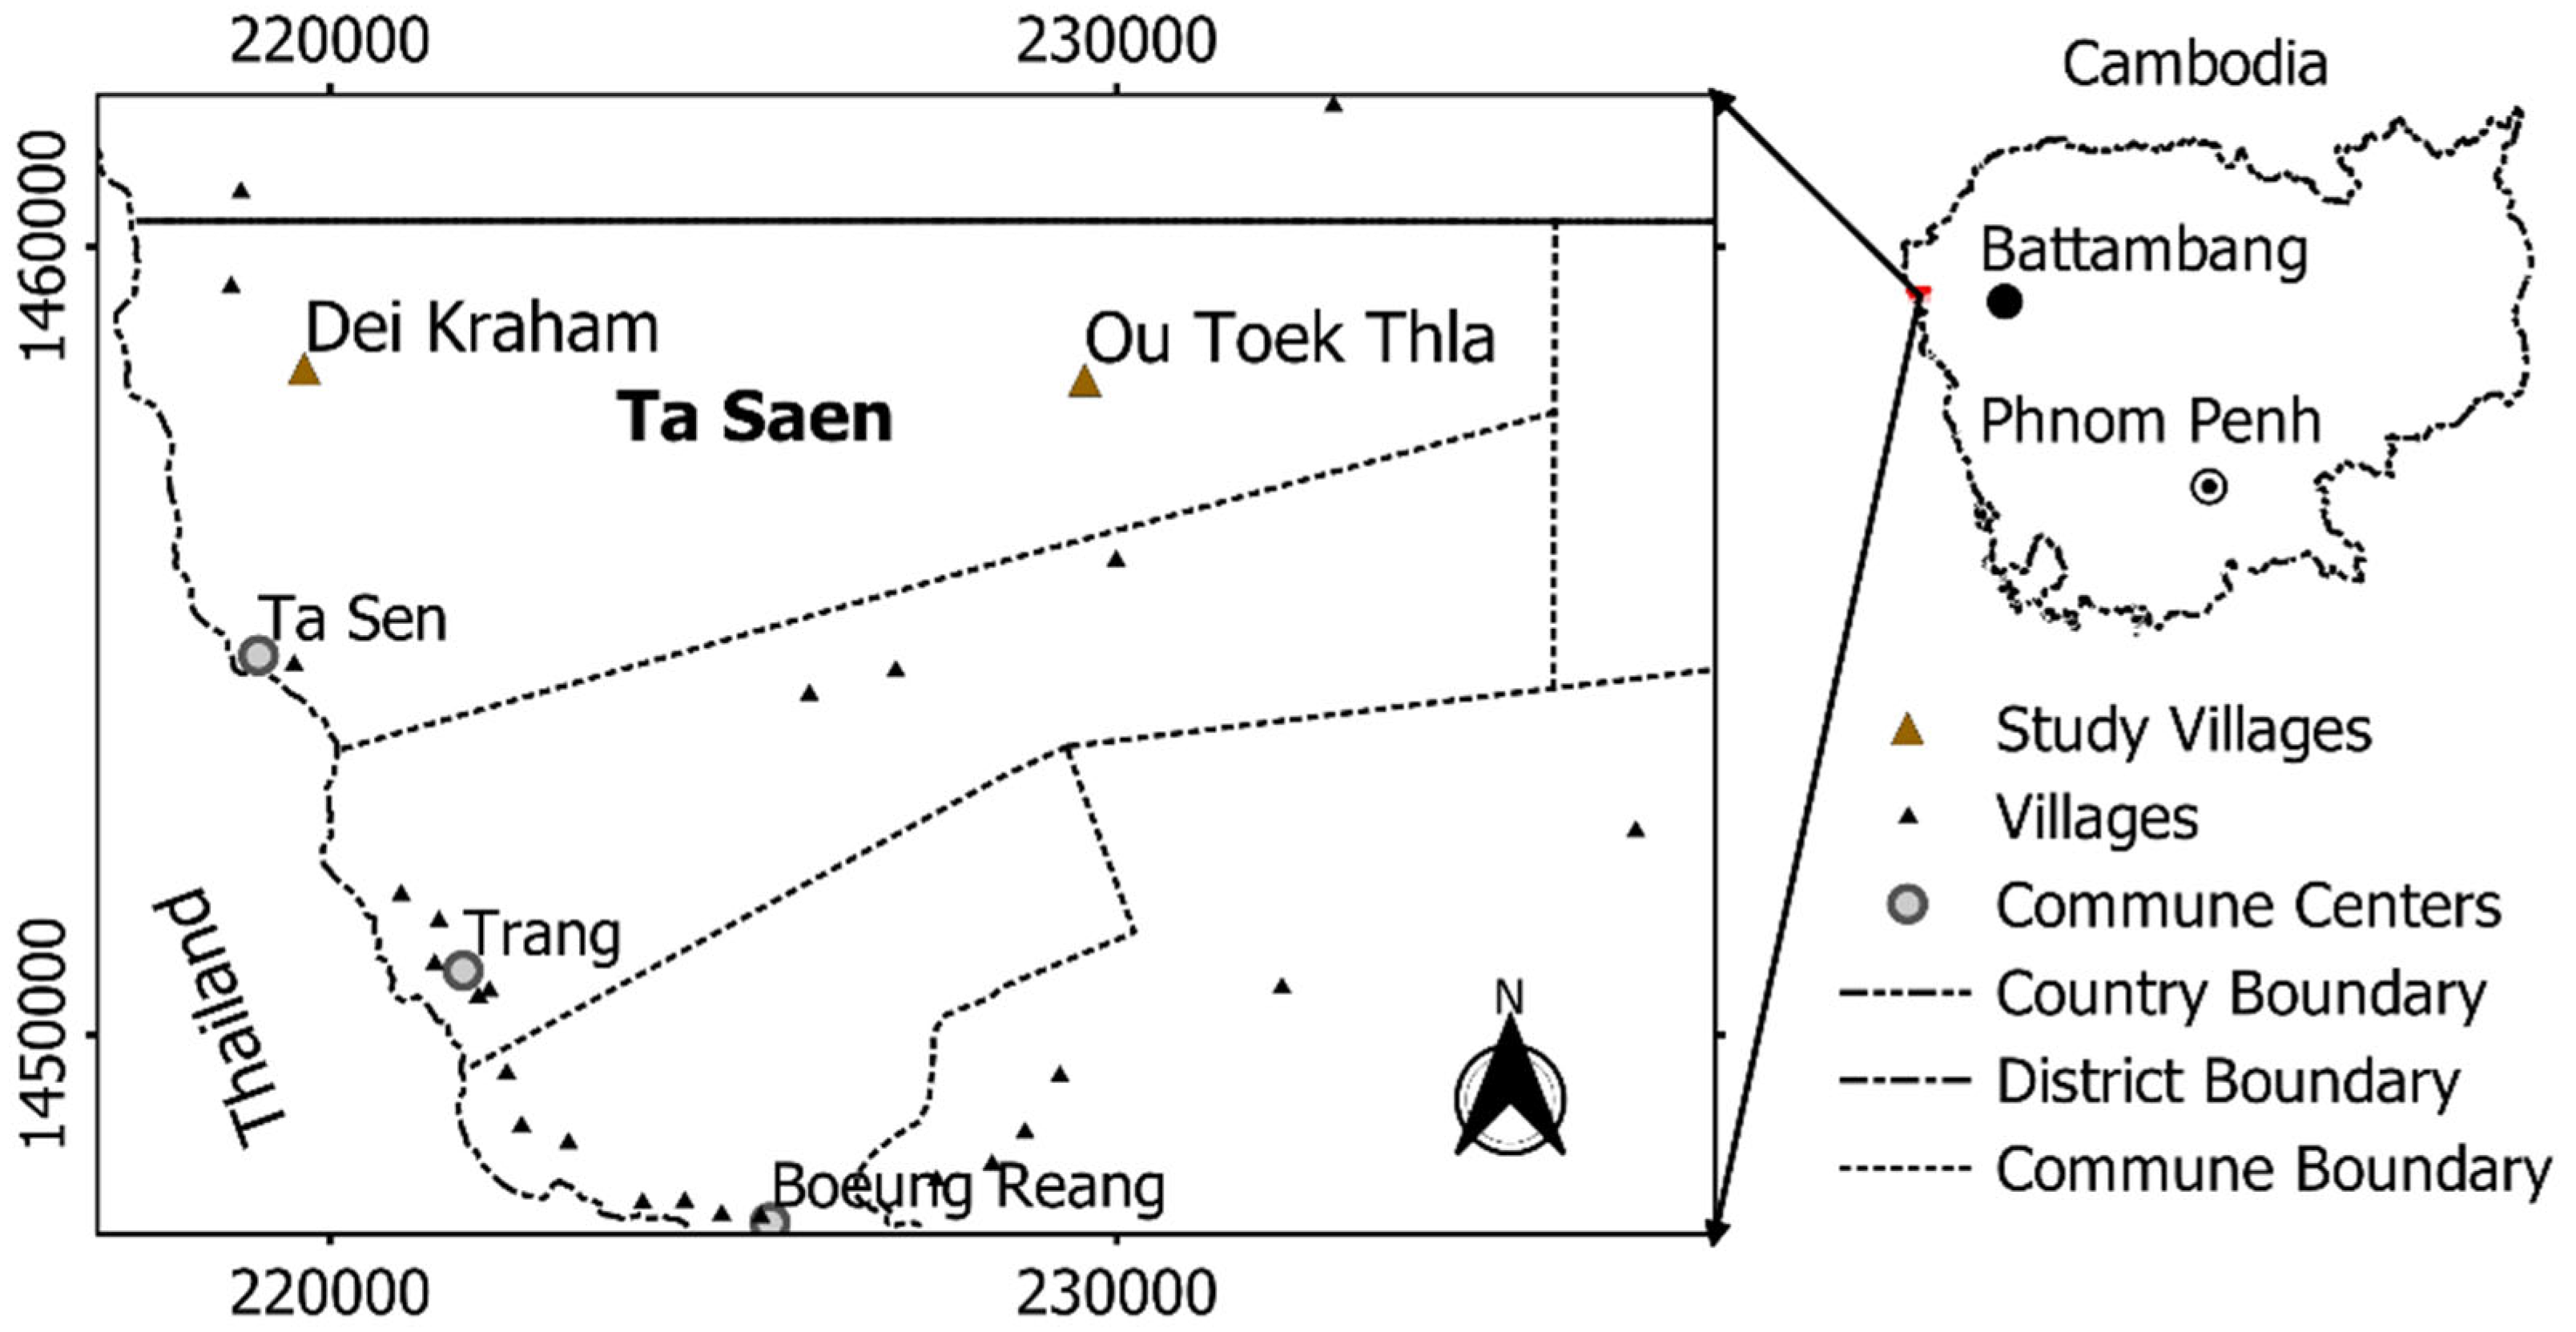
Figure 2.
Comparing livelihood of the villagers living in the two villages.
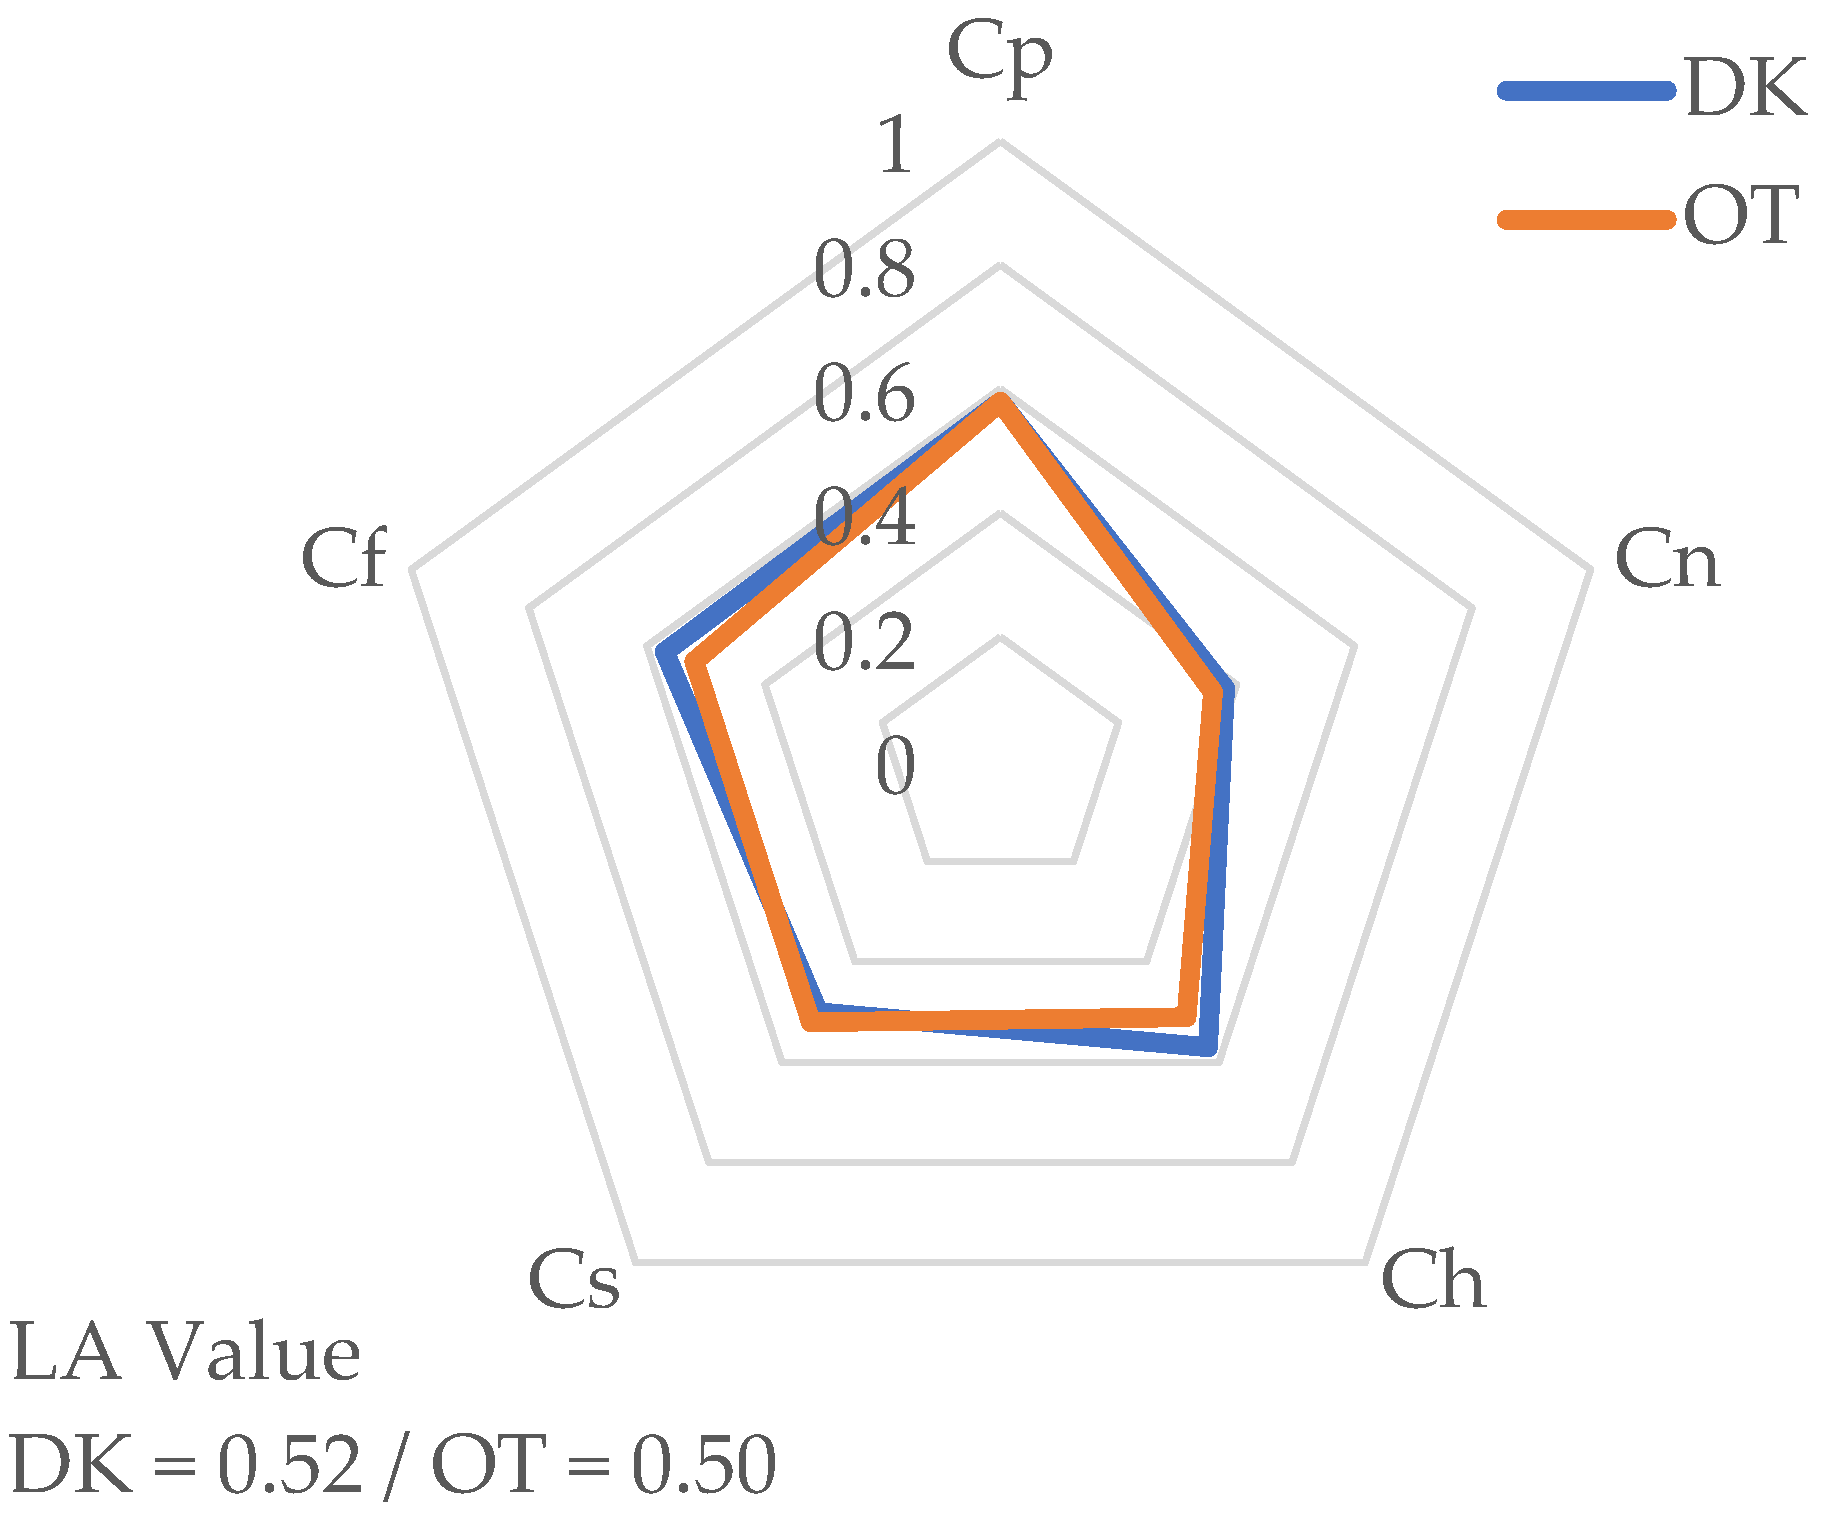
Figure 3.
Illustrating the livelihood of OS Families, NS Families, and NGYG Families living in DK and OT Village. From left to right, the first livelihood pentagon is comparing OS.DK and OS.OT, NS.DK and N.S.OT in the middle, and NGYG.DK and NG.OT in the right.
Figure 3.
Illustrating the livelihood of OS Families, NS Families, and NGYG Families living in DK and OT Village. From left to right, the first livelihood pentagon is comparing OS.DK and OS.OT, NS.DK and N.S.OT in the middle, and NGYG.DK and NG.OT in the right.
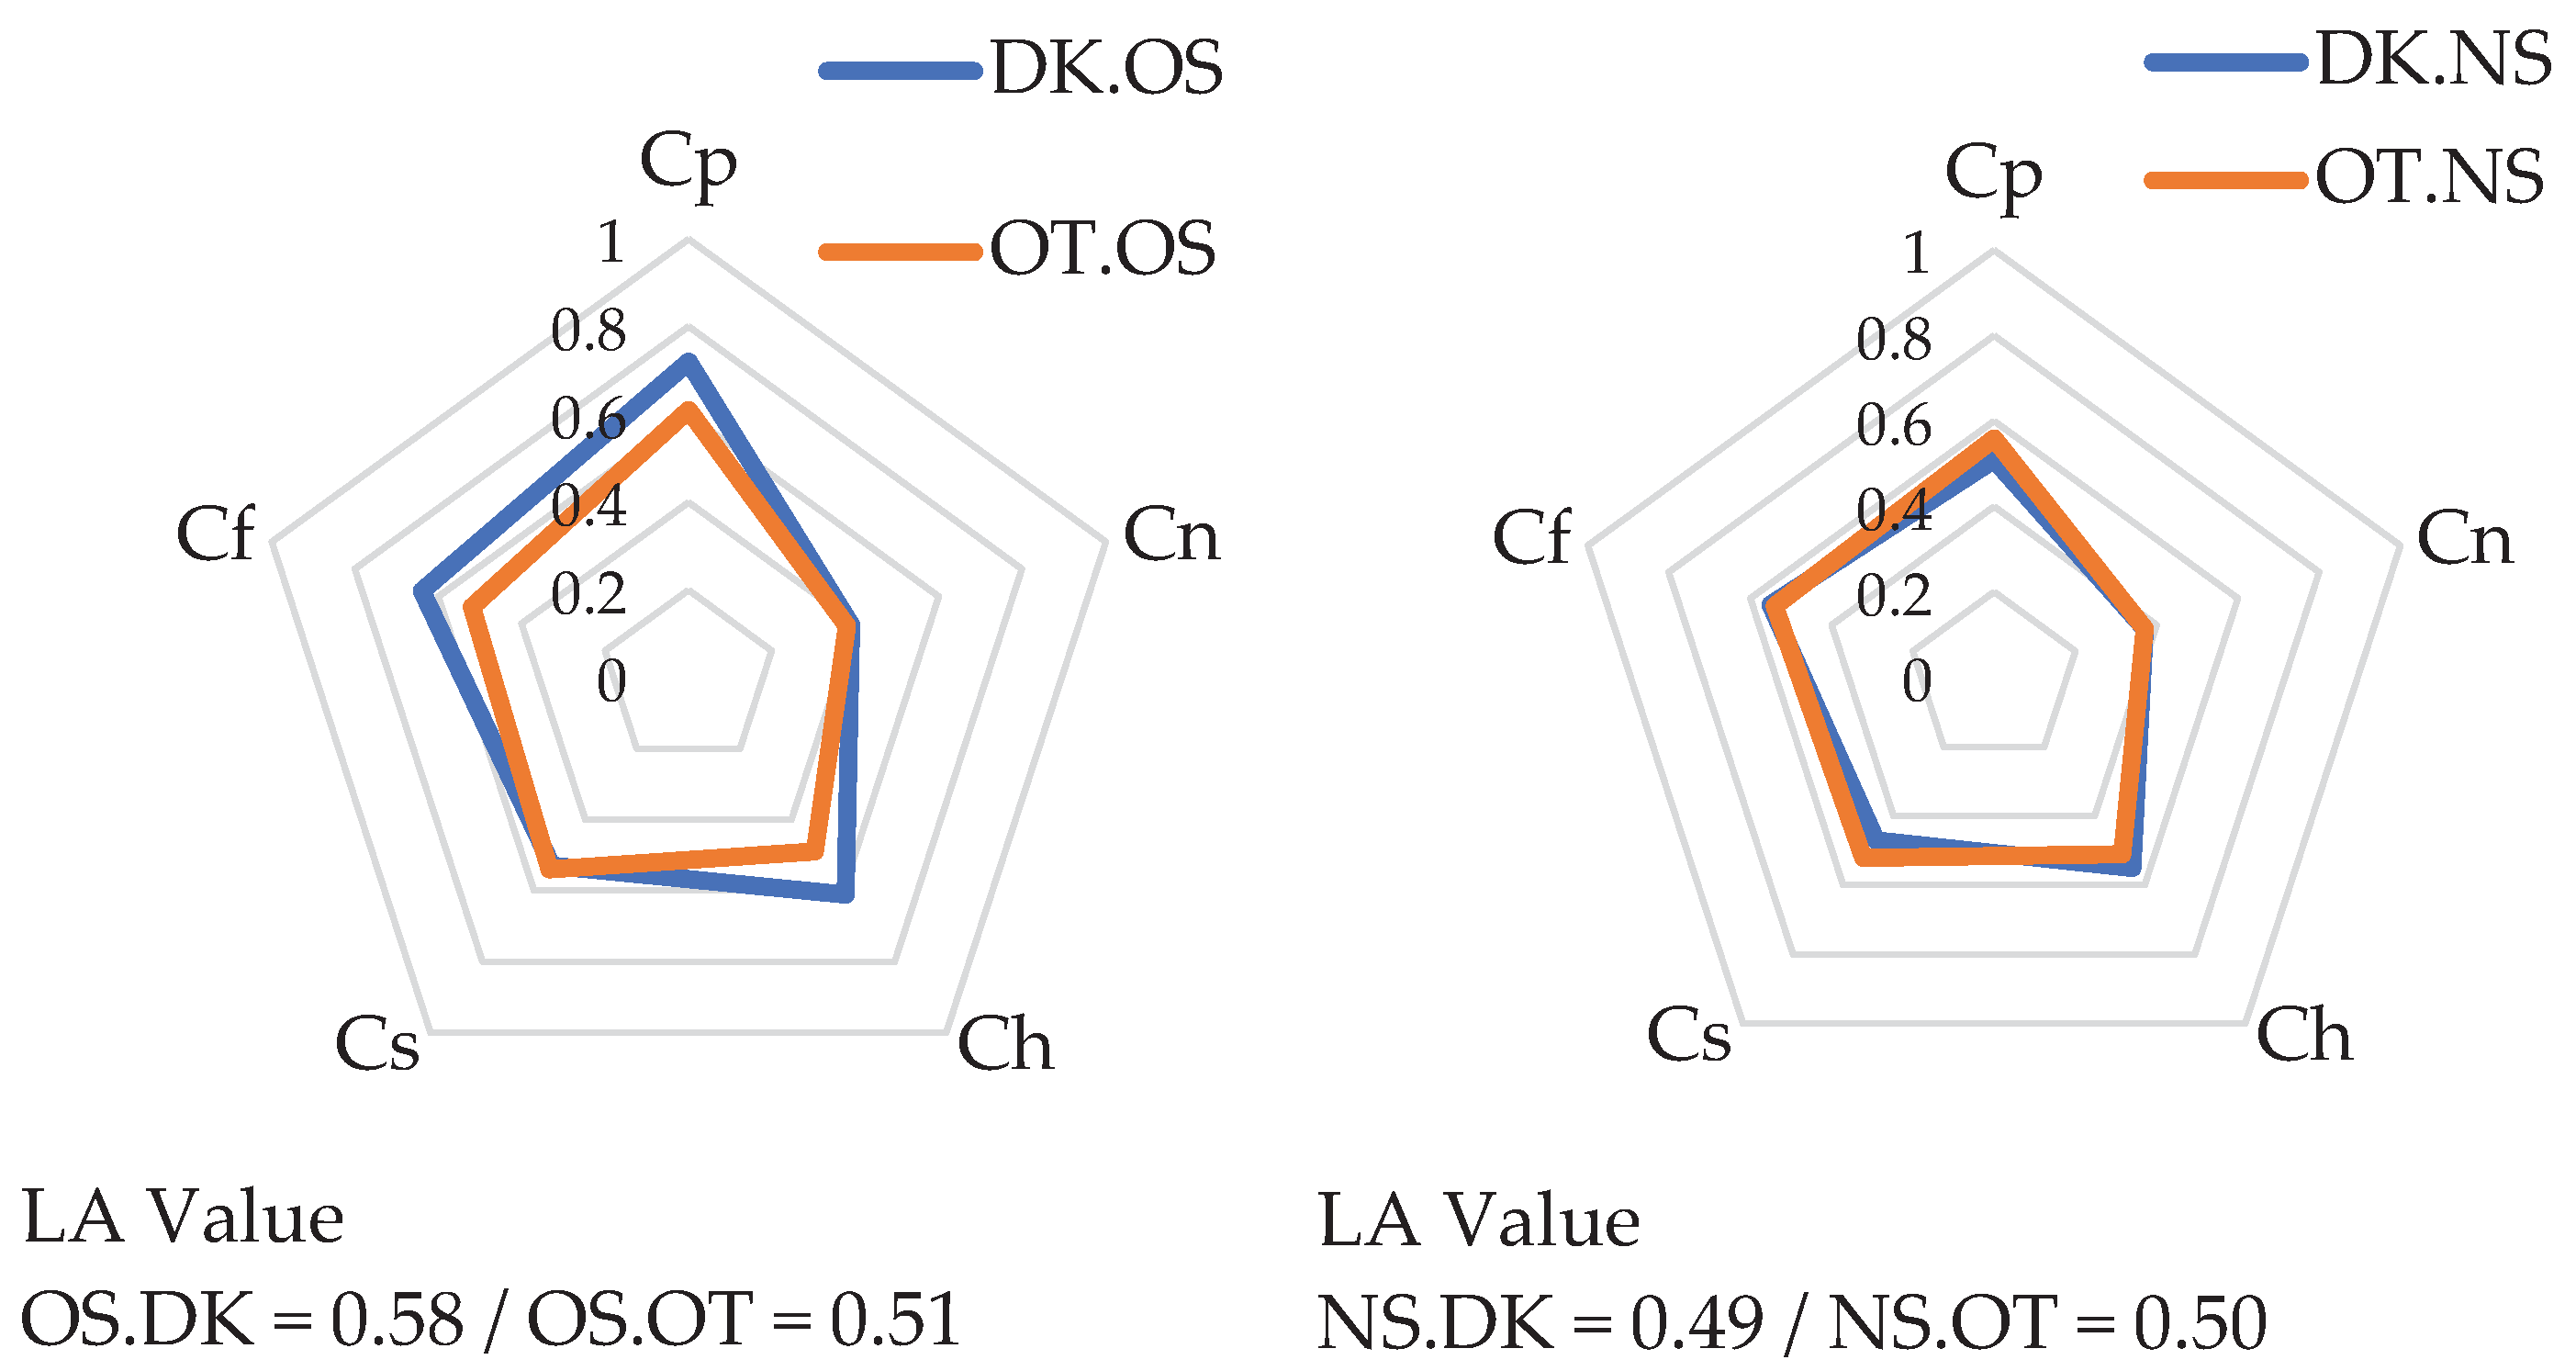
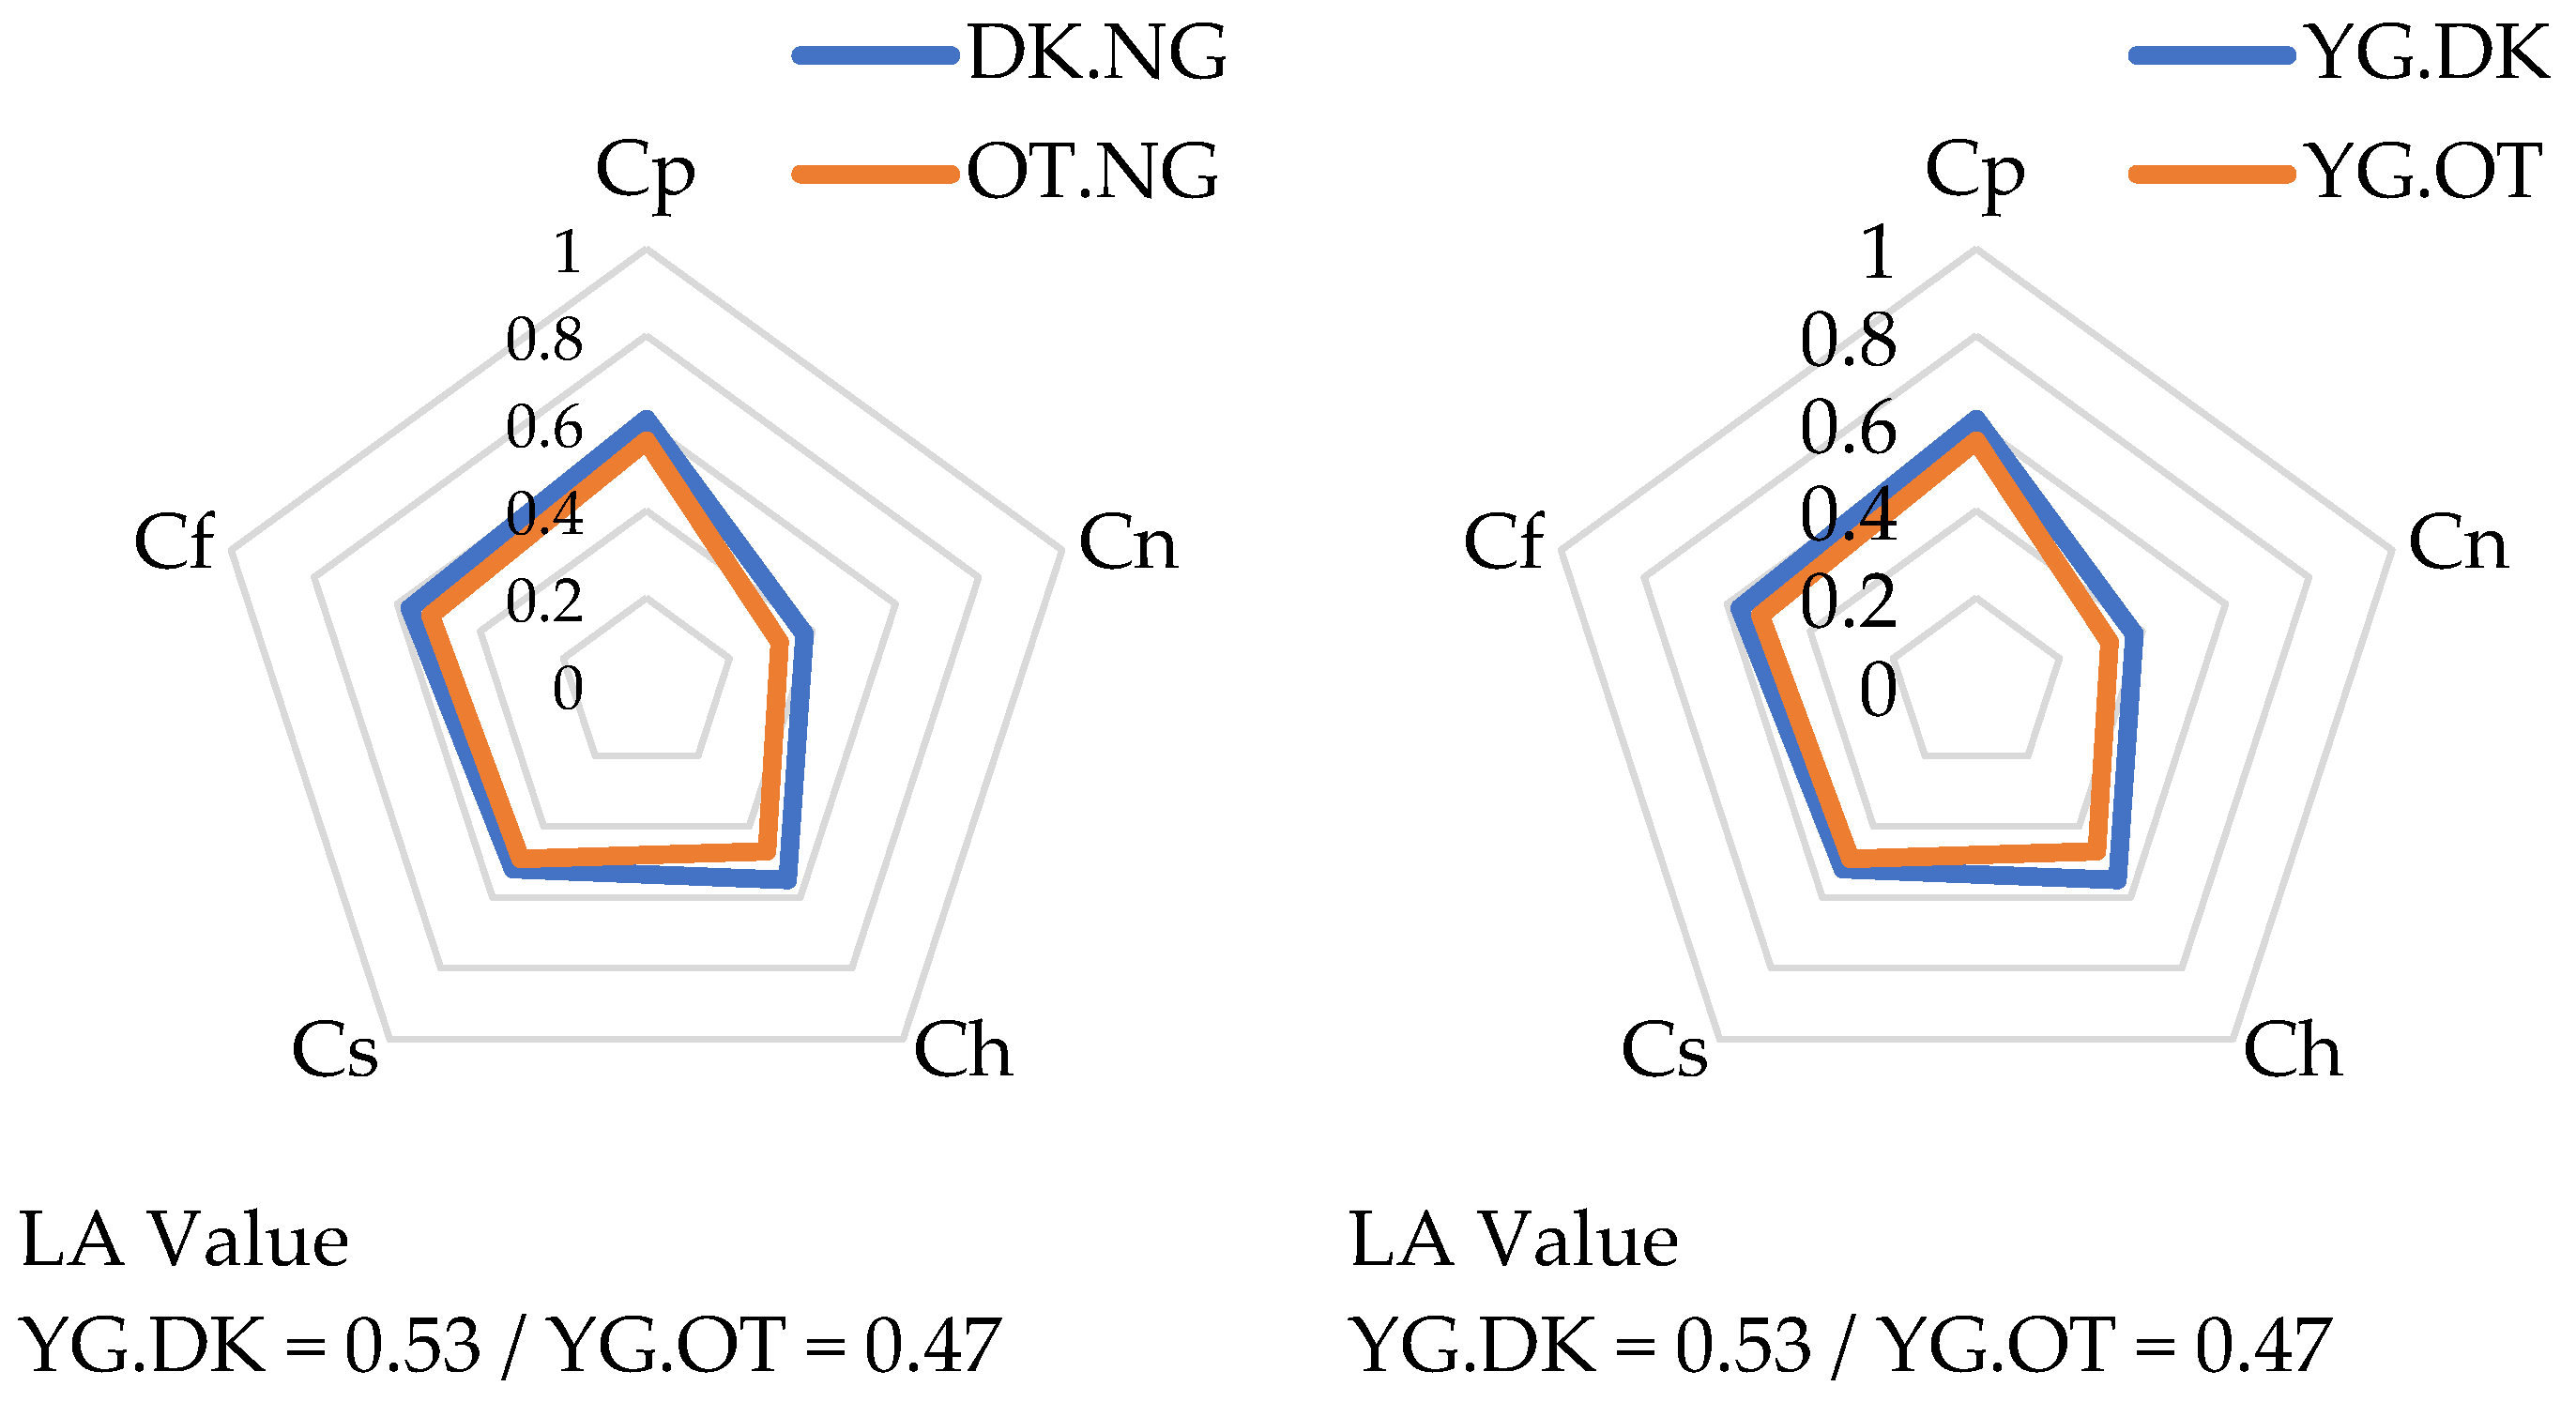
Figure 4.
Boxplot compares HH landholding (left) and HH Annual income (right) per family in 2023.
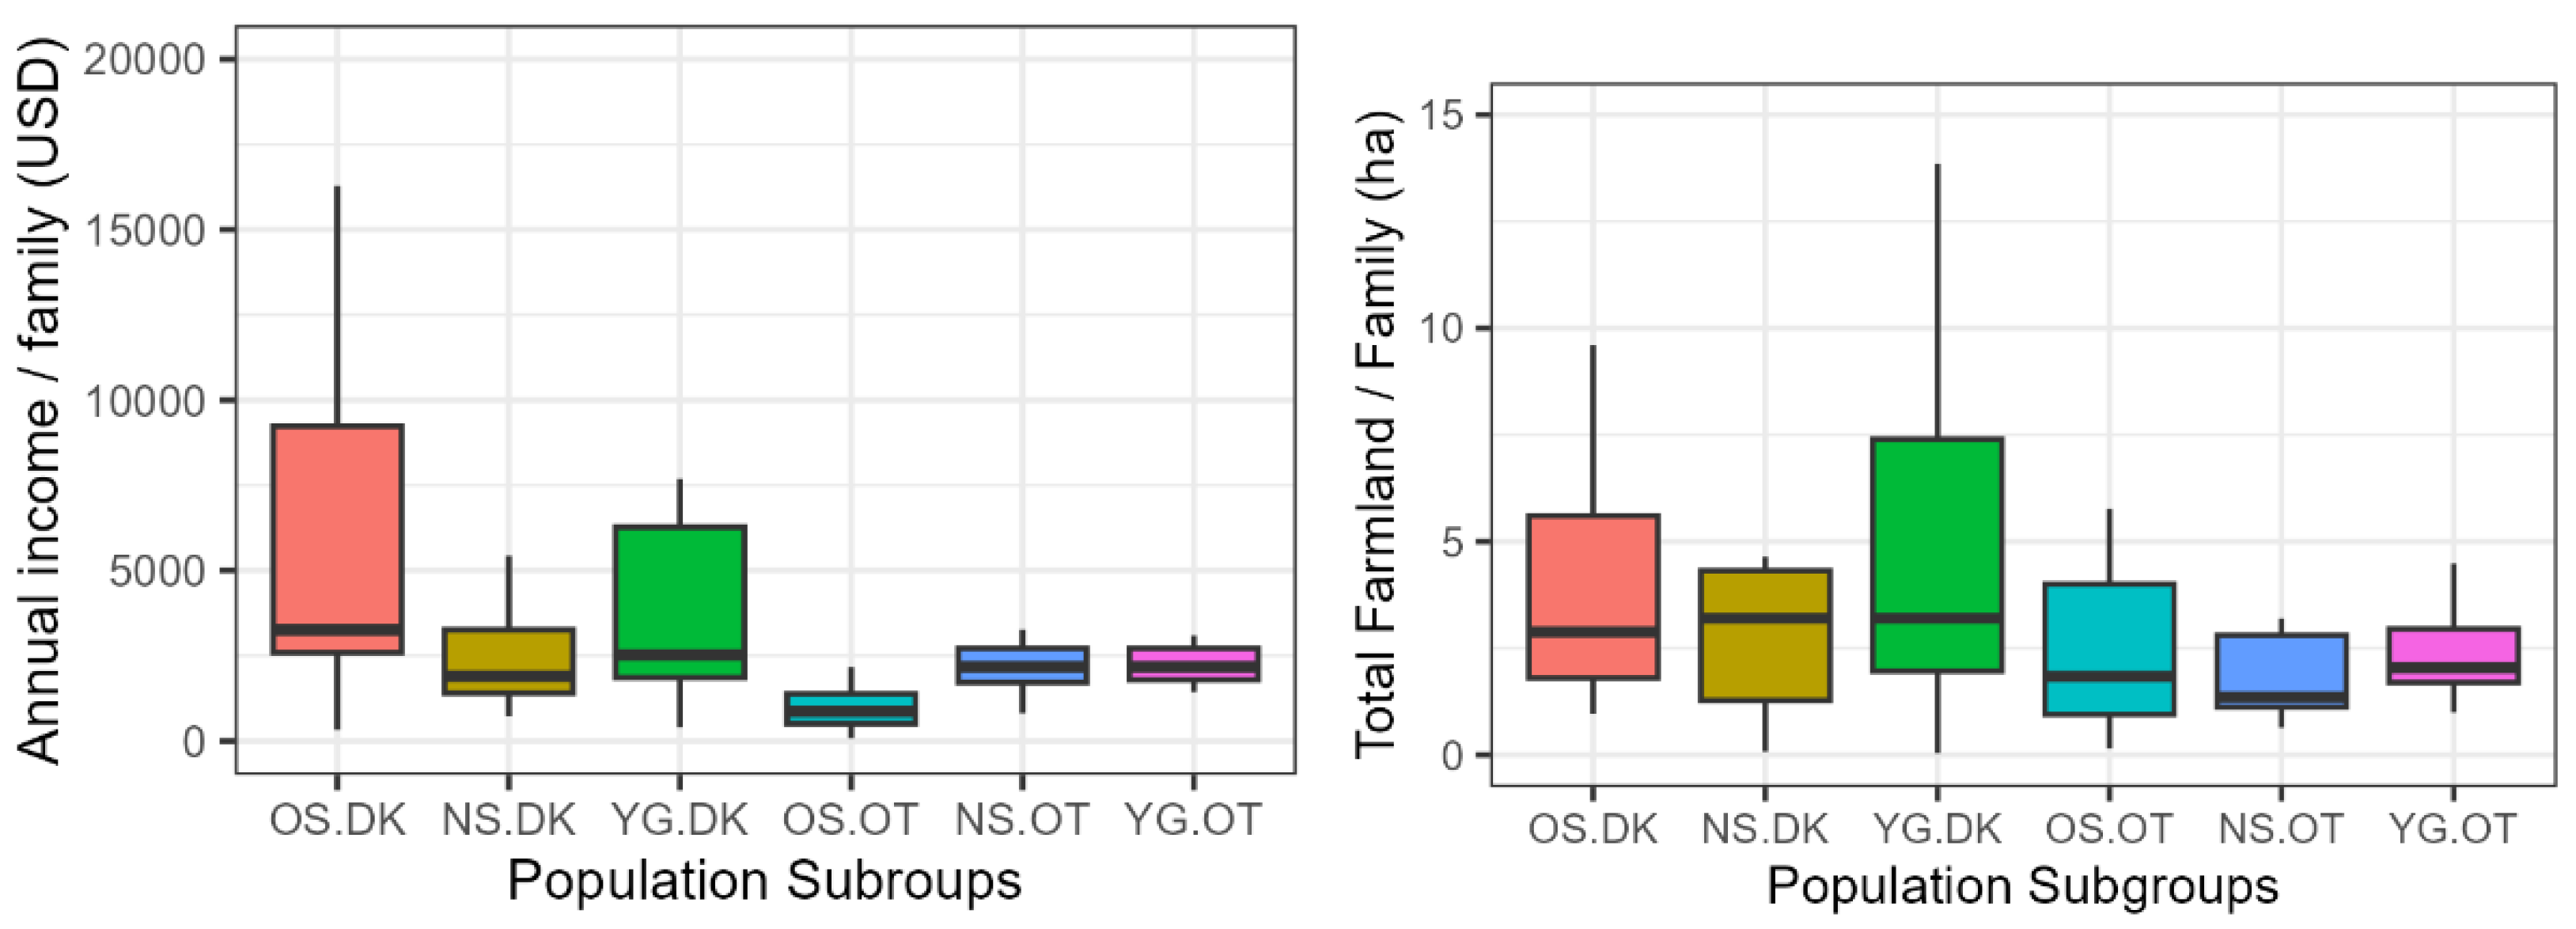
Figure 5.
Livelihood asset score by villages (left) and population groups (right).


Table 1.
Numbers of total families collected during field observation in 2023.
| Villages | Total Families | Migrated Families | Settled Families | ||||||
|---|---|---|---|---|---|---|---|---|---|
| OS | NS | NGYG | OS | NS | NG | OS | NS | NGYG | |
| DK Village | 60 | 167 | 128 | 13 | 37 | 35 | 47 | 130 | 93 |
| OT Village | 45 | 26 | 85 | 5 | 2 | 52 | 40 | 24 | 33 |
Note: The number of settled families was adopted for sample size estimation because of availability. This data was collected during field observation.
Table 2.
Llivelihood assets and capital indicators question types with model usages.
| Capitals | Indicators | Questions / Answers |
Measurement models |
References |
|---|---|---|---|---|
| Physical | HH Fixed Assets | Yes / No | (1) | [11] |
| HH Durable Goods | Yes / No | (1) | ||
| HH Energy Structure | Yes / No | (1) | ||
| Natural | Land and water resources | Yes / No | (1) | [12,14] |
| Forest resources | Yes / No | (1) | [11] | |
| HH Environment | Ranking (1-3) | (2) | [36] | |
| Human | Formal education | Ranking (1-3) | (2) | [37] |
| Education service | Yes / No | (1) | ||
| Health status | Ranking (1-3) | (2) | [38] | |
| HH Dependency Ratio | Ratio | (2) | [39] | |
| Social security | Yes / No | (1) | [40] | |
| Social | Social network | Ranking (1-3) | (2) | [41] |
| Traditions | Ranking (1-3) | (1) | [41,42] | |
| Community actions | Yes / No | (1) | [43] | |
| Financial | HH annual incomes | Num., ranking | (3,4) | [44] |
| HH income sources | Ranking | (1) | [38] | |
| HH expenditure | Yes / No | (1) | [44,45] |
Note: Questionnaire design concepts are based on the above references. “Num., ranking” is numeric; ranking 1, 2, and 3 denote good, average, and poor, respectively.
Table 3.
Means of livelihood values of the population groups from the study locations.
| Capitals | Household (HH) Indicators |
= 74) | =49) | ||||||||||
|---|---|---|---|---|---|---|---|---|---|---|---|---|---|
| =14) | =35) | =25) | =18) | =17) | =14) | ||||||||
| IW | CV | IW | CV | IW | CV | IW | CV | IW | CV | IW | CV | ||
| Physical | HH Fixed Assets | 0.89 | 0.72 | 0.65 | 0.51 | 0.76 | 0.61 | 0.73 | 0.61 | 0.71 | 0.56 | 0.7 | 0.56 |
| HH Durable Goods | 0.55 | 0.24 | 0.35 | 0.34 | 0.26 | 0.27 | |||||||
| HH Energy Structure | 0.71 | 0.64 | 0.72 | 0.74 | 0.72 | 0.73 | |||||||
| Natural | Land and water resources | 0.72 | 0.39 | 0.64 | 0.37 | 0.69 | 0.38 | 0.67 | 0.38 | 0.66 | 0.37 | 0.68 | 0.32 |
| Forest resources | 0.01 | 0.02 | 0.03 | 0.01 | 0.02 | 0.01 | |||||||
| HH Environment | 0.44 | 0.45 | 0.42 | 0.46 | 0.42 | 0.28 | |||||||
| Human | Formal education | 0.39 | 0.64 | 0.09 | 0.55 | 0.15 | 0.55 | 0.1 | 0.53 | 0.08 | 0.51 | 0.1 | 0.47 |
| Education service | 0.6 | 0.55 | 0.63 | 0.61 | 0.57 | 0.55 | |||||||
| Health status or conditions | 0.86 | 0.94 | 0.88 | 0.76 | 0.86 | 0.76 | |||||||
| HH Dependency Ratio | 0.78 | 0.61 | 0.52 | 0.72 | 0.59 | 0.45 | |||||||
| Social security | 0.59 | 0.54 | 0.6 | 0.48 | 0.46 | 0.49 | |||||||
| Social | Traditions (Dhamma) | 0.81 | 0.53 | 0.75 | 0.47 | 0.79 | 0.52 | 0.86 | 0.54 | 0.8 | 0.52 | 0.74 | 0.49 |
| Communication | 0.13 | 0.01 | 0.06 | 0.04 | 0.04 | 0.02 | |||||||
| Social network | 0.66 | 0.64 | 0.72 | 0.72 | 0.72 | 0.7 | |||||||
| Financial | HH Incomes as cash | 0.78 | 0.63 | 0.62 | 0.55 | 0.78 | 0.57 | 0.42 | 0.51 | 0.62 | 0.54 | 0.69 | 0.52 |
| HH Income sources | 0.43 | 0.19 | 0.11 | 0.3 | 0.24 | 0.02 | |||||||
| HH Expenditure | 0.52 | 0.77 | 0.88 | 0.61 | 0.71 | 0.9 | |||||||
| Livelihood Assets by Subgroups | 0.58 | 0.49 | 0.53 | 0.51 | 0.50 | 0.47 | |||||||
| Livelihood Assets by Villages | 0.52 | 0.50 | |||||||||||
Note: DK and OT are Dei Kraham and Ou TuekToek Thla Village, HH = Household, IW = Indicator weight, and CV = Capital value.
Table 4.
Data statistics for livelihood Assets between DK and OT
| Mean Rank by capitals | Cp | Cn | Ch | Cs | Cf | LA | ||
|---|---|---|---|---|---|---|---|---|
| DK Village | 0.583 | 0.377 | 0.567 | 0.500 | 0.571 | 0.520 | ||
| OT Village | 0.579 | 0.359 | 0.507 | 0.518 | 0.522 | 0.497 | ||
| Descriptive statistics | N | Mean | Median | Stdev | Min. | Max. | ||
| DK | 74 | 0.520 | 0.522 | 0.071 | 0.319 | 0.728 | ||
| OT | 49 | 0.497 | 0.497 | 0.059 | 0.328 | 0.616 | ||
| Kruskal-Wallis Test | Chi-square | Df | p-Value | |||||
| Cp | 0.029 | 1 | 0.864 | |||||
| Cn | 1.435 | 1 | 0.231 | |||||
| Ch | 9.892 | 1 | 0.001 | |||||
| Cs | 2.319 | 1 | 0.128 | |||||
| Cf | 8.679 | 1 | 0.003 | |||||
| LA | 3.085 | 1 | 0.079 | |||||
Note: Stdev = the Standard Deviation, df = degree of freedom, Min. = Minimum, and Max. = Maximum
Table 5.
Results of comparison of population subgroups.
| Kruskal-Wallis Test |
OS.DK vs OS.OT | NS.DK vs NS.OT | NGYG.DK vs NGYG.OT | ||||||
|---|---|---|---|---|---|---|---|---|---|
| Chi-square | df | p-Value | Chi-square | Df | p-Value | Chi-square | df | p-Value | |
| Cp | 4.896 | 1 | 0.026 | 0.975 | 1 | 0.323 | 0.454 | 1 | 0.500 |
| Cn | 0.246 | 1 | 0.619 | 0.013 | 1 | 0.906 | 2.897 | 1 | 0.088 |
| Ch | 5.132 | 1 | 0.023 | 1.217 | 1 | 0.270 | 11.743 | 1 | 0.000 |
| Cs | 0.032 | 1 | 0.858 | 4.524 | 1 | 0.033 | 0.522 | 1 | 0.469 |
| Cf | 10.378 | 1 | 0.001 | 0.185 | 1 | 0.666 | 5. 151 | 1 | 0.023 |
| LA | 8.334 | 1 | 0.003 | 0.055 | 1 | 0.822 | 4.835 | 1 | 0.026 |
Note: Appreciation used in this article is explained in the note of table 1. For example, OS.OT is referred to as “Old Settler Families living in Ou TuekToek Thla Village” or “OS family at OT Village”.
Table 6.
The percentages of HH education levels of the N.S. Families (Percentages)
| Families | Education levels | HH Head | First Child | Second Child |
|---|---|---|---|---|
| NS.DK | University | 0 | 2.9 | 0 |
| High School | 0 | 8.6 | 2.9 | |
| Secondary School | 11.43 | 22.9 | 17.1 | |
| Elementary School | 65.71 | 57.1 | 57.1 | |
| Illiterate/Not yet due* | 22.86 | 8.6 | 22.9 | |
| NS.OT | University | 0 | 0 | 0 |
| High School | 0 | 11.8 | 0 | |
| Secondary School | 5.88 | 23.5 | 17.6 | |
| Elementary School | 64.71 | 58.8 | 70.6 | |
| Illiterate/Not yet due* | 29.41 | 5.9 | 11.8 |
Note: For HH Head, they did not participate the education because of the Civil War between 1975-79. For first and second child, they did not participate with education system due to facilities according to report by local people.
Table 7.
Education levels of YG Families in the two location (Percentages).
| Families | Education levels | HH Head | First Child | Second Child |
|---|---|---|---|---|
| YG.DK | University | 4 | 8 | 0 |
| High School | 8 | 8 | 4 | |
| Secondary School | 24 | 28 | 8 | |
| Elementary School | 52 | 40 | 36 | |
| Illiterate * | 12 | 16 | 52 | |
| YG.OT | University | 0 | 0 | 0 |
| High School | 0 | 14.3 | 7.1 | |
| Secondary School | 28.57 | 21.4 | 0 | |
| Elementary School | 50 | 50 | 42.9 | |
| Illiterate * | 21.43 | 14.3 | 50 |
Table 8.
Jobs in agriculture sector by villages and population subgroups (Percentage)
| No. | Types of Jobs | DK Village | OT Villages | ||||
|---|---|---|---|---|---|---|---|
| OS | NS | NGYG | OS | NS | NGYG | ||
| 1 | Agrarian worker | 0.00 | 31.43 | 32.00 | 27.78 | 23.53 | 28.57 |
| 2 | Agripreneur | 0.00 | 2.86 | 8.00 | 11.11 | 0.00 | 21.43 |
| 3 | Business | 7.14 | 2.86 | 0.00 | 0.00 | 0.00 | 0.00 |
| 4 | Full-time farmer | 64.29 | 8.57 | 16.00 | 27.78 | 17.65 | 7.14 |
| 5 | Landless agricultural worker | 7.14 | 45.71 | 28.00 | 11.11 | 58.82 | 21.43 |
| 6 | Pluriactive farmer | 21.43 | 5.71 | 8.00 | 11.11 | 0.00 | 7.14 |
| 7 | Stay at home | 0.00 | 0.00 | 0.00 | 11.11 | 0.00 | 0.00 |
| 8 | Unknow | 0.00 | 2.86 | 8.00 | 0.00 | 0.00 | 14.29 |
Disclaimer/Publisher’s Note: The statements, opinions and data contained in all publications are solely those of the individual author(s) and contributor(s) and not of MDPI and/or the editor(s). MDPI and/or the editor(s) disclaim responsibility for any injury to people or property resulting from any ideas, methods, instructions or products referred to in the content. |
© 2025 by the authors. Licensee MDPI, Basel, Switzerland. This article is an open access article distributed under the terms and conditions of the Creative Commons Attribution (CC BY) license (http://creativecommons.org/licenses/by/4.0/).
Copyright: This open access article is published under a Creative Commons CC BY 4.0 license, which permit the free download, distribution, and reuse, provided that the author and preprint are cited in any reuse.


