
Submitted:
04 June 2025
Posted:
11 June 2025
You are already at the latest version
Abstract
Rare earth elements (REE) are crucial components of billions of products worldwide. Transitioning from foreign to domestic REE sources requires utilizing both primary (i.e., carbonatites, alkaline igneous rocks, pegmatites, skarn deposits) and secondary (unconventional) sources (i.e., ion adsorption clays, placer deposits, weathered rock, black and/or oil shales). Coal and coal-bearing strata, a promising secondary REE resource, are the focus of this study. Understanding REE mineral associations in unconventional resources is essential to quantify resource volume and identify viable mineral separation and processing techniques. Highly REE-enriched (>750 ppm) coal or mudstone samples from the Uinta Region were selected for scanning electron microscopic (SEM) analysis. Energy Dispersive X-ray Spectroscopy (EDS) determined REE enrichment occurs in: 1) a silt-size fraction (5–30 μm) of monazite and xenotime REE-enriched grains, 2) a clay-size fraction (2–5 μm) of monazite REE-enriched grains dispersed in the clay-rich matrix, and 3) organic-hosted REE domains >2 μm. Findings suggest possible REE enrichment from multiple sources, including: 1) detrital silt-size grains, 2) volcanic ash fall, largely in clay-size grains, and 3) organic REE uptake in the peat swamp depositional environment.
Keywords:
rare earth elements (REE)
; coal
; mode of occurrence
1. Introduction
Critical minerals (CM) and rare earth elements (REE), the lanthanide series (La through Lu) of elements, and often yttrium (Y) and scandium (Sc) due to their similar properties, are crucial components to billions of products worldwide, particularly those in military defense applications and green energy technologies. Despite their relative abundance in crustal rock, sufficient quantity and quality in surficial deposits are much more difficult to source [1,2,3,4,5,6,7,8,9,10].
Moving away from foreign to domestic sources of CM and REE requires utilization of both primary ore resources (e.g., carbonatites, alkaline igneous rock), secondary source materials (e.g., ion adsorption clays, placer deposits), and alternative or unconventional resources (coal, waste rock from coal mines, phosphorites) known to contain viable amounts for industrial processing [13,14]. The most abundant resource for economically viable REE are typically found in primary igneous deposits and are predominantly concentrated in bastnasite [(Ce, La)(CO3)F], monazite [(Ce, La)PO4)], xenotime (YPO4), loparite [(Ce, Na, Ca)(Ti, Nb)O3], apatite [(Ca, REE, Sr, Na, K)3Ca2(PO4)3(F, OH)], and ion-adsorption clays [2,5,6,15,16]. Bastnasite, monazite, and xenotime make up 95% of the world’s REE reserves [16,17].
China currently dominates the REE industry with abundant production and distribution of REE resources from secondary sources, supplying over 90% of the global demand [6,8,18]. Due to limited surficial resource abundance and geopolitical concerns, increased attention has focused on coal and coal by-products as unconventional resources for REE [5,19,20,21,22]. Current research points toward the possible utilization of REE in coal and coal-adjacent strata as viable secondary sources for REE and CM [10,16,23,24]. Typically, REE is subdivided into light REE (LREE) and heavy REE (HREE) with LREE consisting of Lanthanum (La) through Europium (Eu) and HREE comprising Gadolinium (Gd) to Lutetium (Lu) [9,16,19]. Coal and coal-related material is particularly promising as a source of valuable HREE, particularly as compared to primary igneous sources [5,21,25]. This study leverages a recent comprehensive study by Coe et al. (2024) that supports REE enrichment (>200 ppm) in the coal-related material in the Uinta Region of Utah and western Colorado specifically.
Understanding the mineral association of REE in these unconventional resources is imperative to quantify and characterize potential resource volume. Extraction of REE from coals and carbonaceous shales/mudstones relies on several factors such as the REE-bearing mineral type, crystallinity, and spatial distribution, as well as the nature of associations with other minerals and/ or sample matrix [13,21,24,26,27].
Previous work highlights the complicated nature of identifying definitive REE-enrichment mechanisms in coal and coal-adjacent strata due to REE and/or CM displaying both organic and inorganic associations [23,28,29]. Depositional conditions can control these associations as well as sediment provenance geochemistry, volcanic input via ash, redox conditions, or other diagenetic processes that may occur after deposition [16,29,30,31,32]. Multiple REE sources and mineral associations may be present making correlations of REE-enrichment mechanisms difficult to interpret.
Both LREE and HREE in coal have been associated with organic and inorganic sources [19,33,34]. Modes of occurrence are dependent on depositional, as well as geologic factors, and thus far are poorly constrained [23,24]. Differentiation of LREE vs HREE have been shown, in previous work, as a metric for analyzing possible mechanisms for REE enrichment, particularly when attempting to determine grain provenance or diagenetic conditions leading to present anomalous concentrations of select REE [19,31,35,36].
This research builds on prior studies by analyzing REE-enrichment patterns at the micro- to nanoscale in coal and coal-adjacent samples in the Uinta Region. We develop a novel, systematic, and thorough approach to scanning samples for REE using scanning electron microscopy (SEM) with energy dispersive x-ray spectroscopy (EDS) to 1) identify mineral associations of REE in samples from the Uinta Region, and 2) document the spatial distribution, grain size fractions and morphology of REE-hosted minerals. Observational data regarding REE-bearing grain size, morphology and spatial distribution, as well as EDS-based REE mineral association interpretation, is used to uniquely illuminate depositional and diagenetic mechanisms for REE-enrichment in coals and coal-adjacent strata.
2. Materials and Methods
2.1. Geologic Setting
Coal-bearing strata and adjacent units in the Uinta Region include the Ferron Sandstone Member of the Mancos Shale and Blackhawk Formation in Utah (Figure 1). Late Cretaceous crustal thickening and subsidence due to loading from the Sevier Fold and Thrust Belt led to the development of the Western Interior foreland basin [37,38,39,40]. Cretaceous coal-bearing units of the Uinta Region record coastal plain and deltaic deposition along the shoreline of the Western Interior Seaway, as clastic sediment was shed off the fold and thrust belt into the foreland basin [37,38,39].
The Ferron Sandstone is Turonian in age and is a relatively thin member of the Mancos Shale (Figure 1). It is underlain by the Naturita Sandstone and Tununk Shale Members of the Mancos Shale. The Blue Gate Shale and Emery Sandstone Members of the Mancos Shale overlie the Ferron Sandstone [47,48,49].
The Ferron Sandstone contains coal, sandstone, and mudstone, including carbonaceous shale. Interpreted as a primarily coastal plain, fluvial, and river to storm dominated deltaic deposits, the Ferron Sandstone has abundant bituminous coal resources currently in production from the Emery underground mine. As such, the unit offers a unique opportunity for sample collection to determine if coal and coal-adjacent sandstones and mudstones are candidates for REE recovery [10,47,50].
The Blackhawk Formation is Campanian in age. It is overlain by the fluvial Castlegate Sandstone and underlain by the shallow marine Star Point Sandstone, which in turn overlies the Mancos Shale (Figure 1). The Blackhawk Formation contains bituminous coal resources as well as shale, siltstone, carbonaceous shale, and sandstone [51]. The Blackhawk Formation is a relatively thick deposit of sandstone, mudstone, and coal that records fluvial, coastal plain to shallow marine deposition. The Blackhawk Formation progrades eastward into the Western Interior Seaway and interfingers with the offshore marine mudstone of the Mancos Shale [51,52].
2.2. Sample Selection
A large, previously developed pXRF and ICP-MS geochemical dataset consisting of samples collected from historical and inactive mines, outcrops, and stratigraphically complete cores throughout the Uinta Region was utilized for sample collection in this study [10,11]. This larger, robust dataset includes coal and adjacent mudstones (including claystone & siltstone) and sandstones from the Blackhawk Formation, n = 3113 [10] and the Ferron Sandstone, n = 6641 [11,12]. The dataset from the Blackhawk Formation and Mesaverde Group, n = 3113, reveals economically viable levels of REE-enrichment in shales, with over 40% of the shale samples showing REE concentrations that are considered to be enriched (>200 ppm), when analyzed via pXRF [10]. Similarly, the Ferron Sandstone Member displays comparable, if not higher, levels of REE-enrichment in ongoing research [11,12].
Highly REE-enriched samples from the Ferron Sandstone Formation and Blackhawk-Mesaverde datasets, as determined by ICP-MS or pXRF analysis, were prioritized to maximize REE detection using SEM-EDS imaging and quantification techniques. Preliminary analysis suggested that the quality of EDS spectra for REE was particularly robust for samples with REE concentrations greater than 750 ppm, as determined through ICP-MS or pXRF geochemical characterization. ICP-MS geochemical analysis included the entire suite of REE (Sc, Y and the lanthanides) while pXRF geochemical dataset only included Sc, Y, Nd, Ce and La. High REE enrichment as detected by ICP-MS or pXRF is paramount as the EDS detection limit for most elements to be distinguished from the sample background accurately necessitates ~1000 ppm individual elemental concentrations, though in some cases the limit can be lowered depending on methodology and instrumentation.
For this study, baseline levels of REE enrichment greater than 750 ppm were determined to be most suitable for SEM-EDS analysis. N = 6 samples from the Blackhawk Formation and Ferron Sandstone were selected based on known based on combined concentrations of lanthanum (La), cerium (Ce), praseodymium (Pr), neodymium (Nd), yttrium (Y), and scandium (Sc) being greater than 750 ppm present based on either pXRF or ICP-MS analysis. REE-enrichment quantification and geochemical analysis methods of the larger dataset (n = 9754) and the subset of samples in this study (n = 6) are further described in Coe et al. (2024) [10] and Morris et al. (in prep) [11] (Table 1).
Lithologies of the six samples include: two coals, two carbonaceous shales, and two siltstones. Of the two coals, one sample was sourced from the Ferron Sandstone Member and the other from the Blackhawk Formation. The Ferron Sandstone uses letter nomenclature to identify coal seams. The Ferron Sandstone coal sample used in this study comes from the ‘C’ coal seam (MC-C) and was collected from an outcrop near Miller Canyon in Emery Coal Field, as a part of a measured section, sampling and geochemical data reported in Morris et al. (in prep) and Birgenheier et al. (2024) [11,12] (Figure 2). The second coal sample, BVCA-4, from the Castlegate A coal seam, is a Utah Geological Survey archived hand sample from the Beaver Creek closed historic mine [10].
Both carbonaceous shale samples are from the Ferron Sandstone, though sourced from different locations and coal seams within the Emery Coal Field. MC-G-02-03 (MC-G) is a carbonaceous shale located stratigraphically below the ‘G’ coal seam in Miller Canyon from outcrop [11]. WF-M-10-03 (WF-M) is a carbonaceous shale from the Walker Flats shallow mine and is stratigraphically between two subsections of the ‘M’ coal seam [11]. Carbonaceous shales have varying mineral composition, are typically clay-rich, and contain slightly higher than 10% fraction of organic constituents.
One siltstone sample, IPA-1-1673.6 (IPA-1), is sourced from the IPA-1 core of the Blackhawk Formation in the Book Cliffs Coal Field, sampled at 1673.6 ft (510.10 m) core depth. IPA-1 is a fine-grained siltstone that is stratigraphically below the Sunnyside coal seam of the Blackhawk Formation [10]. Rockland-JM-02-07-08 (Rockland) sample is a coarse to medium grain siltstone that is stratigraphically above a subsection of the Ferron Sandstone ‘J’ coal. It was taken from the Rockland shallow mine measured section in the Emery Coal Field [11].
2.3. Petrography and SEM-EDS
Sample thin sections were prepared ultra-thin at 15-20 microns thickness by Wagner Petrographic. Bedding direction could not be inferred from the collected hand samples and thus were cut randomly relative to bedding. Blue epoxy impregnation was utilized on all samples to highlight pore space between grains. Because of the fine-grained nature of each of the six samples, the blue epoxy impregnation for pore space proved to be largely unhelpful.
Prior to SEM-EDS analysis, thin sections were petrographically imaged for sample characterization and potential grain analysis. Petrographic images were used to develop a mount map to guide strategic SEM analysis to reduce redundancy of scans and/or missing possible targets (Figure 3).
Thin sections were carbon coated to reduce charging inside the chamber of the SEM. Processing of samples was completed on an FEI Teneo SEM with Trinity Detection System and an EDAX Octane Elite system at an average accelerating voltage between 15-20 keV depending on the sample. A working distance of between 8.5-11mm and a spot size of 11-13 was determined to be the most effective in achieving the maximum resolution possible given the high accelerating voltage needed to detect REE in thin sections.
The accelerating voltage required to identify heavier elements in EDS vastly limits visual resolution of sample grains and/or areas of interest. It is necessary to overshoot the critical ionization energy of elements of interest for adequate detection levels to be observed in EDS. Typically, accelerating voltage is set at 2-3 times the critical ionization energy of the elements of interest [53]. This use of overvoltage limits resolution to about 2μm, meaning particles smaller than 2μm were detectable but difficult to discern or accurately image in detail.
SEM-EDS analysis was completed using a modified methodology outlined by Fu et al., (2024) [23] and Ji et al., (2022) [54]. Fu recognized that the intensity of backscattered electron (BSE) signals is directly proportional to the average atomic number within the minerals present in the sample. BSE signals can be seen in greyscale ranges from near black to bright white spots. The brighter, more intense spots indicate heavier elements that include REE and, therefore, are the focus of SEM-EDS analysis (Figure 4).
Bright spots (white in BSE) that may contain REE were primary targets for higher magnification BSE imaging and EDS analysis. Carbonates, aluminosilicates and silicates are typically darker grey to light grey, as they contain lighter elements. The grey zones were easier to distinguish between the brighter zones of heavier elements that contain possible REE-hosted minerals [23].
To strategically analyze samples, Ji et al. (2022) [54] further refined methodology for probing areas of interest with EDS mapping. Areas of interest that contain suspected heavy elemental concentrations (bright grains or zones) were scanned using EDS briefly (≤10 scans) to determine if REE is present in the scan. If this brief EDS analysis of the area of interest showed detectable levels of REE enrichment, then a more detailed EDS analysis of the zone was performed. Specifically, the more detailed EDS analysis was longer (≥30 scans) and at a higher magnification (Figure 5).
Scans of samples and images collected were performed with backscattered electron before EDS analysis. Grid pattern exploration was utilized to better analyze areas of interest. Spots where minerals or zones were targeted for EDS analysis were marked on the sample map to prevent re-scans of the same mineral or zone.
Since Iridium (Ir), Platinum (Pt), Lithium (Li), Cobalt (Co), Nickel (Ni), Vanadium (V), Manganese (Mn), Germanium (Ge), and Gallium (Ga) were deemed to be particularly valuable non-REE CMs, they were also included in EDS analysis and search criteria.
EDS spectra were monitored and corrected as needed based on the EDS Octane Elite system’s built-in deconvolution curve estimates, as well as known ionization energy for K, L, and M shells. Overlap was reduced in areas of interest, with manual correction of elemental spectra coupled with longer EDS scanning and processing times. LREE were the primary fraction of REE detected during EDS and consisted predominantly of Nd, Pr, La, and Ce (Figure 6). Though some HREE were present in minor quantities, LREE was the most abundant REE fraction identified in substantial, detectable concentrations during detailed EDS mapping.
3. Results
3.1. ICP-MS Geochemical Sample Characterization
ICP-MS data were normalized to upper continental crust (UCC) values to more strategically analyze the sample dataset’s REE relative enrichments or depletions as well as to identify any distinct patterns in element mobility (Table 2; Figure 7). To better constrain and differentiate between geochemically distinct groups of REE, this study utilizes REE to denote relative totals of scandium, yttrium, and the lanthanides, whereas LREE is used in reference to La through Eu, and HREE in reference to Gd to Lu.
3.2. Petrography and SEM-EDS Grain Characteristics
General petrographic observations of grain assemblages of mudstones, both carbonaceous shales and siltstones, show samples contain both clay size and silt size grains with size fractions characteristics typical of the host lithology. Quartz is abundant in mudstones and occurs in both clay size and silt size fractions. Coal samples also contain smaller fractions of fine to very fine silt and clay size grains of various mineralogy, largely quartz, though these individual grains are interspersed throughout clay within the sample’s matrix. Framboid pyrite and microquartz growth in pore spaces are also observed in several samples.
A total of 135 grains (n = 135) were analyzed through EDS. Grain selection for EDS processing was based on the intensity and brightness as described in the methodology. Of the 135 grains analyzed in EDS, a total of 15 (n=15) individual grains and/or zones within the sample are confirmed to bear REE (Table 3; Figure 8).
3.3. Silt Size REE-Enriched Grains
Based on SEM petrographic observation, REE-enriched grains identified are binned into three size fractions for differentiated characterization (Table 3; Figure 8). The three size categories include: 1) 5 μm to 30 μm size grains, 2) 5-2 μm, and 3) <2 μm. REE-enriched grains identified that are between 5μm to 30μm are defined as silt size grains per the Udden-Wentworth grain scale. They include fine and medium silt size grains. REE-enriched grains identified that are between 5-2 μm in size are defined as largely clay size grains (<4 μm) and include very fine silt size grains (4–5 μm). For simplicity, this study refers to 5-2 μm as “clay size” and grains 5 μm to 30 μm as “silt size”. Finally, zones of REE enrichment less than 2 μm were identified. These zones cannot be properly sized or characterized due to limitations in SEM imaging resolution at high accelerating voltages. However, observed zones of REE enrichment less than 2 μm are only documented in two cases in one sample, MC-G (Table 3). There, they occur within organic matter in the sample.
Silt and clay size grain size fractions are consistent within and between samples. For example, all REE-enriched grains found within sample Rockland are silt size grains (Figure 9). REE bearing grain size fractions that are present vary by sample lithology. Of the fifteen grains or organic zones that contain REE-enrichment, five are silt size (Table 3; Figure 9). The five silt size grains are found within three samples, one carbonaceous shale (WF-M) and the two siltstones (IPA-1 and Rockland). Eight dispersed clusters of clay size grains were found only in the two coal samples, which include a Blackhawk Formation and Ferron Sandstone coal (Table 3; Figure 8).
REE-enriched silt size grains identified are generally subrounded to subangular with varying degrees of sphericity (Figure 8). REE-enriched silt size grains share similar shape and size distributions as well as random orientation as surrounding non-REE bearing grains (Figure 9A). The spatial distribution of REE-enriched silt size grains is unevenly spread throughout the sample indicating that there is no strong spatial trend or zones in which the REE-enriched grains are concentrated.
EDS analysis shows that REE-enriched silt size grains are primarily phosphates with some trace signatures of other elements such as Ca, Mg, Na, S, Cl, and Fe. Trace element presence not typical in phosphates may indicate spectral interference from the adjacent grains and/or the surrounding clay matrix [55]. REE enriched phosphates also carry a typical associated thorium signature. This, combined with the presence of Ce, Pr, Nd, and/or La concentrations indicates that silt size phosphate grains are predominately monazite, specifically monazite-Ce due to the higher spectral signature of Ce in relation to the other REE (Figure 9B-C). Though primary enrichment of REE comes from monazite, xenotime is also present as a single silt size grain in one sample of siltstone (Table 4).
3.4. Clay Size REE-Enriched Grains
Two samples contain large fractions of clustered REE-enriched clay size grains or zones 5 μm to 2 μm in size (Figure 9). Both samples that contain this size fraction of REE bearing grains or zones are coal: MC-C-01-06 (MC-C) and BVCA-4. Resolution limitations with the high accelerating voltage required to detect REE, coupled with the clustered and ambiguous nature of REE-enriched clay size grains and/or zones make exact measurement of grain size and shape difficult to precisely discern via SEM petrography. Where resolution allows for differentiation between individual grains, REE-enriched clay size grains in coal sample MC-C appear globular and show highly angular grain boundaries in some instances (Figure 8; Figure 9D). Clay size REE-enriched grains in MC-C are typically 5 μm or less in size and are considerably smaller than other non-REE-enriched clay size grains found within the sample. Clay size zones of REE-enrichment were identified in coal sample BVCA-4.
The abundance and overall spatial distribution of REE-enriched clay size grains or zones within the two coal samples are notable. REE-bearing clay size grains can be found in small to large clusters across the denser aluminosilicate-rich domains of the two coal samples analyzed (Figure 9D-F; Figure 10).
Non-REE-enriched clay size grains in coals do not display the same spatial distribution pattern and are far more randomly dispersed throughout the rest of the sample. It is notable that REE-bearing clay size grains and zones appear to be spatially distributed only across or within clay zones in the coal samples BVCA-4 and MC-C (Figure 11).
EDS analysis shows elemental assemblages of clay size grains within the coals are phosphates. REE-enriched clay size grains are determined to be monazite given their elemental properties and high concentrations of Ce further support that they are monazite-Ce (Figure 9D-F).
3.5. Organically Associated REE
Sample MC-G, a carbonaceous shale, did not contain any identifiable REE-enriched individual grains, though two zones of weak REE-enrichment within organic material were isolated and analyzed (Figure 8). Organic material in SEM imaging is typically dark grey to black depending on BSE sensor settings utilized during processing (Figure 4).
Weak REE-enrichment found within the organic zones is difficult to quantify due to spectral overlap, but EDS analysis shows weak and dispersed concentrations of Ce, La, Pr and Nd (Figure 12). EDS spectral analysis of adjacent clay and organic matter showed no significant REE-enrichment, making these two fractions of organic REE-enrichment unique within the analyzed areas of the sample.
3.6. LREE to HREE Ratios and Non-REE CM
Broadly, LREEN to HREEN ratios are between 0.84 to 3.05 when normalized to the average upper continental crust (UCC) values and have an average of 1.67 in favor of LREE enrichment [56] (Table 5).
Lithological differences between LREEN/HREEN are present as siltstone displays slightly lower LREEN/HREEN concentration ratios compared to coals and organic-rich shales (Figure 13). Overall, carbonaceous shales and coals show higher enrichment of LREEN to HREEN when normalized to average UCC values (Figure 13). Significant concentrations of non-REE CM were not observed or detected in EDS analysis of analyzed samples.
4. Discussion
Enriched silt size grains of monazite and xenotime are interpreted as largely detrital in origin and are typically found in siltstone samples. REE-bearing silt size grains share similar characteristic shapes and size of other, non-REE-bearing grains throughout the samples despite being geochemically and mineralogically unique from the surrounding non-REE-bearing grains. REE-bearing and non-REE-bearing silt size grains within the sample have low sphericity and are subangular to subrounded as is typical of detrital silt size grains [57,58,59]. REE-hosted silt size grains are uncommon in all samples and the spatial distribution did not bear any notable pattern when compared to other sample grains, suggesting they were transported and deposited concurrently with all the other detrital silt grains in the sample.
Minor to significant negative Europium (EuN) anomalies present in REE-hosted silt size grains provide further evidence of the detrital nature of the grain’s depositional mechanism (Figure 14). Negative EuN anomalies can be attributed to felsic detrital sediment input [36]. The nature of the grain distribution, size, and shape along with the negative EuN anomalies present support a detrital origin of REE enrichment of some of the silt size grains found in the siltstone samples (Figure 15A).
Enriched clay size grains are interpreted as volcanic in origin and are found exclusively in coal samples (MC-C and BVCA-4). REE-hosted clay size grains, identified as monazite-Ce, are atypical of the sample’s other, non-REE-bearing grains in both size and shape. Monazite-Ce clay size grains are present as clustered groups, distributed within clays in the sample, appear to be ≤5 μm in average size, and generally are high sphericity and highly angular in shape, which would be expected for a volcanic air fall origin [63,64].
High sphericity likely developed in lapilli and rapid cooling during air fall, whereas highly angular grain shapes from igneous crystals would also be expected. Coal sample BVCA-4 displays small clusters of phosphate and REE-enriched clay size particles that appear randomly dispersed in clay zones within the organic matter (Figure 6). The nature of these observed REE-enrichment patterns in clay size grains can be interpreted as probable adsorption of REE into clay particles through fluid mobility during digenesis [65]. This uptake of REE lends support to volcanic ash fall in that the mechanism of adsorption occurred post deposition when REE leeched from volcanic ash that was deposited adjacent to the coal [65].
Alternatively, because clay size grains are found in clay mineral domains and not in organic matter domains, it’s possible REEs were adsorbed onto clays through diagenetic fluid mobility [65]. It is also possible that depositional and diagenetic mechanisms contributed in combination to explain why REE-enriched monazite grains are restricted to clay zones and not dispersed throughout the sample’s organic domains. Other authors have noted that leaching of volcanic ash minerals from underlying and/or overlying strata may have contributed to REE incorporation of authigenic monazite during diagenetic fluid interaction [65,66].
Coal samples used in this study are highly LREE enriched compared to average UCC values and even among the other samples in this study (Figure 13). The relatively high LREE concentrations of coal samples further demonstrate plausible enrichment mechanisms through the deposition or adsorption of inorganic LREE enriched volcanic ash and detrital input from sediment source regions rather than organic uptake which would typically favor HREE, although it is important to note that are limitations on the detection of HREE in EDS using the methodology outlined in this study (Figure 15A) [16,29,30,31,32,60].
Coupled with high LREE concentrations, positive Ce and Eu anomalies are present with clay size grain monazite-Ce found in coal samples (Figure 14). Positive Ce and Eu anomalies are typically attributed to volcanogenic influence on peat swamp formation, with the latter anomaly also indicating possible injection of hydrothermal fluids during late deposition/diagenesis (Figure 15A-B) [19,31,35,36]
Organic zones of enrichment found in one carbonaceous shale sample are interpreted as a result of REE uptake into plants, deposited in peat swamps and hosted in organic matter [16,30,31,60]. This interpretation is supported by zones of organic matter showing minor detectable levels of Ce, Pr, Nd and La.
Identified REE-bearing silt size grains, clay size grains or zones and zones of inferred organic REE associations highlight multistep diagenetic and paleodepositional processes that led to the enrichment of Uinta Region samples (Figure 15A-B). REE enrichment in silt to clay size grains appear to be predominately influenced by direct detrital and volcanic ash input, respectively, into peat swamps, coastal plain and paralic environments that developed along the shores of the Cretaceous Western Interior Seaway. High positive and persistent Gd anomalies across the sample dataset support marine influence on developing peat mires [36,67] (Figure 14).
Detrital silt size grains were likely sourced from the Sevier Orogenic Belt, as previous literature supports [38,47,48,68,69,70]. While detrital phosphates influenced the REE enrichment in silt size grain sediments, volcanic input directly into peat or deposited adjacent to the developing coal led to substantial REE-enrichment of the clay size fraction, particularly in LREE. Volcanic ash fall as clay size grains were sourced from to periodic activation of the Sierra Nevada Arc during the mid to late Cretaceous [71,73].
ICP-MS measured REE anomalies are noted in the study dataset and can be utilized to provide some support to inferred enrichment mechanisms. High positive CeN and EuN anomalies have been shown to indicate volcanogenic influence on REE enrichment in coals [19,31,35,36,74]. Negative EuN has been used to indicate REE enrichment via detrital felsic input while positive EuN and YN anomalies can be used to suggest probable influence of hydrothermal and/or fluid interaction leading to REE migration during diagenesis [19,31,35,36,74].
5. Conclusions
This study identifies and characterizes REE-bearing grains and associated mineral associations within six highly REE-enriched coal and stratigraphically adjacent carbonaceous shale and siltstone samples from the Uinta Region. REE-bearing grains identified range in size from 30 µm to ≥2 µm. Small zones of weak REE organic enrichment within the matrix in zones <2 µm are also present but are beyond the limits of the SEM imaging at the resolution utilized for EDS data collection. Highly REE-enriched samples are predominantly host to monazite-Ce and, to a lesser degree, xenotime.
REE-bearing grains between 30-5 µm are classified as silt size grains and are found exclusively in siltstone and carbonaceous shale samples. Silt size REE-bearing grains demonstrate homogenous size and shape relative to surrounding non-REE-bearing grains. The spatial distribution of monazite and xenotime silt size grains in siltstones and carbonaceous shales are irregular. These spatial and morphologic observations suggest these REE-bearing grains are detrital in origin and are transported from up-dip sediment source areas and deposited together with non-REE-hosted grains.
Clay size (5-2 µm) monazite-Ce grains are also identified exclusively in both coal samples used in this study. The spatial distribution patterns and morphologies of REE-bearing clay size grains are distinct from silt size grains. Clay size grains appear in coal samples as small to extensive clusters within clay matrix particles. Clay size monazite grains ~2 µm in size are amorphous, lacking definitive shape, though larger grains (~5µm) are generally highly spherical or very angular.
The shape and distribution of REE-hosted clay size grains of monazite and REE enriched phosphates suggest a volcanogenic origin and likely represent volcanic ash fall into peat swamps during heightened periods of arc activity or ash fall. Because REE enriched clay size grains are only found within clay domains rather than organic matter domains within coal samples, it is possible that diagenetic fluid mobility and absorption of REEs on clay minerals was alternatively or additionally an important enrichment mechanism.
A higher LREEN to HREEN ratio further supports grain characteristic and provenance interpretations. The dominance of LREE (LREEN/HREEN average = 1.67) compared to HREE is indicative of higher detrital content and volcanoclastic ash that introduced REE into developing peat mires. LREE is attributed to mineral content sourced REE-enrichment whereas HREE typically has a greater adsorption affinity for organic matter, particular in lower grade coal [16,29,30,31,32,60]. In addition, a negative EuN anomaly further supports detrital and volcanic influence responsible for REE enrichment found in the study samples.
This study adds to prior work by confirming the presence of complex and varied enrichment mechanisms of coal and coal-bearing strata as well as identifying mineral association and mechanism for emplacement. Analysis from this work also shows that visual grain observations and mineral association interpretations coupled with LREEN/HREEN ratios and REE anomalies can provide insight into paleodepositional conditions and diagenetic mechanisms leading to REE enrichment.
Supplementary Materials
SEM-EDS images and relevant files are available online at the Open Science Framework https://osf.io/fu8ph/ (DOI 10.17605/OSF.IO/FU8PH).
Author Contributions
Conceptualization, L.W. and L.P.B.; methodology, L.W.; investigation, L.W, E.A.M, P.D.F, and H.H.C.; resources, D.P.F, M.D.V and R.G.; writing—original draft preparation, L.W. and L.P.B; writing—review and editing, L.W., L.P.B., E.A.M, P.D.F., H.H.C., R.D.G., and M.D.V; supervision, project administration and funding acquisition, L.P.B.
Funding
This research was funded by Department of Energy’s CORE-CM: Transforming Uinta Basin Earth Materials into Advanced Products project, DE-FE0032046.
Data Availability Statement
Data are contained within the article and Supplementary Materials.
Conflicts of Interest
The authors declare no conflicts of interest.
References
- Leslie, H. F.; Nordvig, M.; Brink, S. Critical Materials Strategy 2010; U.S. Department of the Interior: Washington, DC, 2010; pp. 1–166. [Google Scholar]
- Henderson, P.; Gluyas, J.; Gunn, G.; Wall, F.; Woolley, A.; Finlay, A.; Bilham, N. Rare Earth Elements: A Briefing Note by the Geological Society of London; Geological Society of London: London, 2011. [Google Scholar]
- Humphries, M. Rare Earth Elements: The Global Supply Chain. In Rare Earth Minerals Policies Issues; 2011; pp 1–20.
- Alonso, E.; Sherman, A. M.; Wallington, T. J.; Everson, M. P.; Field, F. R.; Roth, R. Evaluating Rare Earth Element Availability: A Case with Revolutionary Demand from Clean Technologies. Environ. Sci. Technol. 2012, 46(6), 3406–3414. [Google Scholar] [CrossRef] [PubMed]
- Long, K. R.; Van Gosen, B. S.; Foley, N. K.; Cordier, D. The Principal Rare Earth Elements Deposits of the United States: A Summary of Domestic Deposits and a Global Perspective. In Non-Renewable Resources: Issues, Geoscientific Society Challenges; 2012; pp 131–155. [CrossRef]
- Weng, Z. H.; Jowitt, S. M.; Mudd, G. M.; Haque, N. Assessing Rare Earth Element Mineral Deposit Types and Links to Environmental Impacts. Trans. Inst. Min. Metall. B Appl. Earth Sci. 2014, 122(2), 83–96. [Google Scholar] [CrossRef]
- Hower, J. C.; Granite, E. J.; Mayfield, D. B.; Lewis, A. S.; Finkelman, R. B. Notes on Contributions to the Science of Rare Earth Element Enrichment in Coal and Coal Combustion Byproducts. Minerals 2016, 6(2), 32. [Google Scholar] [CrossRef]
- hou, B.; Li, Z.; Zhao, Y.; Zhang, C.; Wei, Y. Rare Earth Elements Supply vs. Clean Energy Technologies: New Problems to Be Solved. Gospod. Surowc. Miner./Miner. Resour. Manag. 2016, 32 (4), 29–44. [CrossRef]
- Hower, J. C.; Warwick, P.; Scanlon, B. R.; Reedy, R. C.; Childress, T. M. Distribution of Rare Earth and Other Critical Elements in Lignites from the Eocene Jackson Group, Texas. Int. J. Coal Geol. 2023, 275, 104302. [Google Scholar] [CrossRef]
- Coe, H. H.; Birgenheier, L. P.; Fernandez, D. P.; Gall, R. D.; Vanden Berg, M. D.; Giebel, A. Rare Earth Element Enrichment in Coal and Coal-Adjacent Strata of the Uinta Region, Utah and Colorado. Front. Earth Sci. 2024, 12, 1381152. [Google Scholar] [CrossRef]
- Morris, E. A.; Birgenheier, L. P.; Fausett, P. D.; Fernandez, D. P.; Gall, R. D. Ferron Sandstone Coal-Bearing Coastal Plain Deposits as a Source of Rare Earth Elements and Critical Minerals. Geol. Soc. Am. Bull., (manuscript in preparation; to be submitted).
- Birgenheier, L. P.; Coe, H.; Morris, E.; Gall, R.; Fausett, P.; Wilcock, L.; Bailey, N.; Vanden Berg, M. D.; Giebel, A.; Fernandez, D. Basinal Assessment of Carbon Ore, Rare Earth, and Critical Minerals (CORE-CM) Resources. In CORE-CM: Transforming Uinta Basin Earth Materials into Advanced Products, Final Report to DOE; Free, M., Ed.; DOE Project: DE-FE0032046, 2024; pp. 21–168. [Google Scholar]
- Balaram, V. Potential Future Alternative Resources for Rare Earth Elements: Opportunities and Challenges. Minerals 2023, 13(3), 425. [Google Scholar] [CrossRef]
- U.S. Geological Survey. Mineral Commodity Summaries 2024; U.S. Geological Survey: Reston, VA, 2024; 212 pp. [CrossRef]
- Golev, A.; Scott, M.; Erskine, P. D.; Ali, S. H.; Ballantyne, G. R. Rare Earths Supply Chains: Current Status, Constraints and Opportunities. Resour. Policy 2014, 41, 52–59. [Google Scholar] [CrossRef]
- Laudal, D. A.; Benson, S. A.; Palo, D.; Addleman, R. S. Rare Earth Elements in North Dakota Lignite Coal and Lignite-Related Materials. J. Energy Resour. Technol. 2018, 140. [Google Scholar] [CrossRef]
- Gupta, C. K.; Krishnamurthy, N. Extractive Metallurgy of Rare Earths; CRC Press: Boca Raton, FL, 2005. [Google Scholar]
- Zhou, B.; Li, Z.; Chen, C. Global Potential of Rare Earth Resources and Rare-Earth Demand from Clean Technologies. Minerals 2017, 7(11), 203. [Google Scholar] [CrossRef]
- Seredin, V. V.; Dai, S. Coal Deposits as Potential Alternative Sources for Lanthanides and Yttrium. Int. J. Coal Geol. 2012, 94, 67–93. [Google Scholar] [CrossRef]
- Lin, R.; Soong, Y.; Granite, E. J. Evaluation of Trace Elements in U.S. Coals Using the USGS COALQUAL Database Version 3.0. Part I: Rare Earth Elements and Yttrium (REY). Int. J. Coal Geol. 2018, 192, 1–13. [CrossRef]
- Zhang, W.; Noble, A.; Yang, X.; Honaker, R. A Comprehensive Review of Rare Earth Elements Recovery from Coal-Related Materials. Minerals 2020, 10(5), 451. [Google Scholar] [CrossRef]
- Finkelman, R. B.; Palmer, C. A.; Wang, P. Quantification of the Modes of Occurrence of 42 Elements in Coal. Int. J. Coal Geol. 2018, 185, 138–160. [Google Scholar] [CrossRef]
- Fu, B.; Xu, G.; Hower, J. C.; Cao, Y.; Huang, Y.; Si, L.; Xian, L.; Luo, G.; Liu, G.; Hu, G.; Yao, H. Recognition and Semi-Quantitative Analysis of REE-Bearing Minerals in Coal Using Automated Scanning Electron Microscopy. Int. J. Coal Geol. 2024, 282(104443), 104443. [Google Scholar] [CrossRef]
- Yesenchak, R.; Sharma, S.; Lopano, C.; Montross, S. Rare-Earth Element Phase Associations in Four West Virginia Coal Samples. Minerals 2024, 14, 362. [Google Scholar] [CrossRef]
- Thomas, B. S.; Dimitriadis, P.; Kundu, C.; Vuppaladadiyam, S. S. V.; Raman, R. K. S.; Bhattacharya, S. Extraction and Separation of Rare Earth Elements from Coal and Coal Fly Ash: A Review on Fundamental Understanding and Ongoing Engineering Advancements. J. Environ. Chem. Eng. 2024, 12(3), 112769. [Google Scholar] [CrossRef]
- Yang, J.; Montross, S.; Britton, J.; Stuckman, M.; Lopano, C.; Verba, C. Microanalytical Approaches to Characterizing REE in Appalachian Basin Underclays. Minerals 2020, 10(6), 546. [Google Scholar] [CrossRef]
- Lin, R.; Howard, B. H.; Roth, E. A.; Bank, T. L.; Granite, E. J.; Soong, Y. Enrichment of Rare Earth Elements from Coal and Coal By-Products by Physical Separations. Fuel 2017, 200, 506–520. [Google Scholar] [CrossRef]
- Hower, J. C.; Groppo, J. G.; Hsu-Kim, H.; Taggart, R. K. Distribution of Rare Earth Elements in Fly Ash Derived from the Combustion of Illinois Basin Coals. Fuel 2021, 289(119990), 119990. [Google Scholar] [CrossRef]
- Modiga, A.; Eterigho-Ikelegbe, O.; Bada, S. Extractability and Mineralogical Evaluation of Rare Earth Elements from Waterberg Coalfield Run-of-Mine and Discard Coal. Int. J. Coal Sci. Technol. 2024, 11, 65. [Google Scholar] [CrossRef]
- Hower, J. C.; Eble, C. F.; Dai, S.; Belkin, H. E. Distribution of Rare Earth Elements in Eastern Kentucky Coals: Indicators of Multiple Modes of Enrichment? Int. J. Coal Geol. 2016, 160–161, 73–81. [CrossRef]
- Hower, J. C.; Eble, C. F.; Backus, J. S.; Xie, P.; Liu, J.; Fu, B.; Hood, M. M. Aspects of Rare Earth Element Enrichment in Central Appalachian Coals. Appl. Geochem. 2020, 120, 104676. [Google Scholar] [CrossRef]
- Liu, J.; Dai, S.; Berti, D.; Eble, C. F.; Dong, M.; Gao, Y.; Hower, J. C. Rare Earth and Critical Element Chemistry of the Volcanic Ash-Fall Parting in the Fire Clay Coal, Eastern Kentucky, USA. Clays Clay Miner. 2023, 71(3), 309–339. [Google Scholar] [CrossRef]
- Crowley, S. S.; Stanton, R. W.; Ryer, T. A. The Effects of Volcanic Ash on the Maceral and Chemical Composition of the C Coal Bed, Emery Coalfield, Utah. Org. Geochem. 1989, 14, 315–331. [Google Scholar] [CrossRef]
- Mastalerz, M.; Drobniak, A.; Eble, C.; Ames, P.; McLaughlin, P. Rare Earth Elements and Yttrium in Pennsylvanian Coals and Shales in the Eastern Part of the Illinois Basin. Int. J. Coal Geol. 2020, 231, 103620. [Google Scholar] [CrossRef]
- Bau, M.; Schmidt, K.; Koschinsky, A.; Hein, J.; Kuhn, T.; Usui, A. Discriminating between Different Genetic Types of Marine Ferro-Manganese Crusts and Nodules Based on Rare Earth Elements and Yttrium. Chem. Geol. 2014, 381, 1–9. [Google Scholar] [CrossRef]
- Dai, S.; Graham, I.; Ward, C. R. A Review of Anomalous Rare Earth Elements and Yttrium in Coal. Int. J. Coal Geol. 2016, 159, 82–95. [Google Scholar] [CrossRef]
- Kauffman, E. G.; Caldwell, W. G. E. The Western Interior Basin in Space and Time. In Geological Association of Canada Special Paper 39; 1993; pp 1–30.
- Roberts, L. N. R.; Kirschbaum, M. A. Paleogeography and the Late Cretaceous of the Western Interior of Middle North America: Coal Distribution and Sediment Accumulation. U.S. Geological Survey Professional Paper, 1995. [CrossRef]
- Liu, S.; Nummedal, D.; Gurnis, M. Dynamic versus Flexural Controls of Late Cretaceous Western Interior Basin, USA. Earth Planet. Sci. Lett. 2014, 389, 221–229. [Google Scholar] [CrossRef]
- Yonkee, W. A.; Weil, A. B. Tectonic Evolution of the Sevier and Laramide Belts within the North American Cordillera Orogenic System. Earth-Sci. Rev. 2015, 150, 531–593. [Google Scholar] [CrossRef]
- Gill, J. R.; Hail, W. J., Jr. Stratigraphic Sections across Upper Cretaceous Mancos Shale-Mesaverde Group Boundary, Eastern Utah and Western Colorado. Oil Gas Invest. Chart 1975. [CrossRef]
- Spencer, C. W.; Wilson, R. J. Petroleum Geology and Principal Exploration Plays in the Uinta-Piceance-Eagle Basins Province, Utah and Colorado. U.S. Geol. Surv. Open-File Rep. 1988, 88-450-G, 35 pp.
- Van Wagoner, J. C. Sequence Stratigraphy and Marine to Nonmarine Facies Architecture of Foreland Basin Strata, Book Cliffs, Utah, U.S.A. In Sequence Stratigraphy of Foreland Basin Deposits; Van Wagoner, J. C., Bertram, G. T., Eds.; AAPG Memoir 64; American Association of Petroleum Geologists: Tulsa, OK, 1995; pp 137–223.
- Willis, A. Tectonic Control of Nested Sequence Architecture in the Sego Sandstone, Neslen Formation and Upper Castlegate Sandstone (Upper Cretaceous), Sevier Foreland Basin, Utah, USA. Sedimentology 2000, 136, 277–317. [Google Scholar] [CrossRef]
- Hettinger, R. D.; Kirschbaum, M. A. Stratigraphy of the Upper Cretaceous Mancos Shale (Upper Part) and Mesaverde Group in the Southern Part of the Uinta and Piceance Basins, Utah and Colorado. U.S. Geol. Surv. Digit. Data Ser. 2003.
- ohnson, R. C.; Roberts, S. B. The Mesaverde Total Petroleum System, Uinta-Piceance Province, Utah and Colorado. In Petroleum Systems and Geologic Assessment of Oil and Gas in the Uinta-Piceance Province, Utah and Colorado; U.S. Geol. Surv. Digit. Data Ser. DDS-69-B, 2003.
- Condon, S. M. Fracture Network of the Ferron Sandstone Member of the Mancos Shale, East-Central Utah, USA. Int. J. Coal Geol. 2003, 56 (1–2), 111–139. [CrossRef]
- Ryer, T. A.; Anderson, P. B. Facies of the Ferron Sandstone, East-Central Utah. In Regional to Wellbore Analog for Fluvial-Deltaic Reservoir Modeling: The Ferron Sandstone of Utah; Chidsey, T. C., Jr., Adams, R. D., Morris, T. H., Eds.; AAPG Stud. Geol. 50, 2004; pp 59–78.
- Chidsey, T. C., Jr.; Ryer, T. A.; Morris, T. H. Introduction—Geological and Petrophysical Characterization of the Ferron Sandstone for 3-D Simulation of a Fluvial-Deltaic Reservoir. MP-02-6, 2001.
- Ryer, T. Cross Section of the Ferron Sandstone Member of the Mancos Shale in the Emery Coal Field, Emery and Sevier Counties, Central Utah. U.S. Geol. Surv. Misc. Field Stud. Map 1981. [CrossRef]
- Dubiel, R. F. Summary of Geology and Coal Resources of the Blackhawk Formation in the Southern Wasatch Plateau, Central Utah. U.S. Geol. Surv. Prof. Pap. 2000.
- Hampson, G. J.; Jewell, T. O.; Irfan, N.; Gani, M. R.; Bracken, B. Modest Change in Fluvial Style with Varying Accommodation in Regressive Alluvial-to-Coastal-Plain Wedge: Upper Cretaceous Blackhawk Formation, Wasatch Plateau, Central Utah, U.S.A. J. Sediment. Res. 2013, 83(2), 145–169. [Google Scholar] [CrossRef]
- Goldstein, J.; Newbury, D.; Joy, D.; Lyman, C.; Echlin, P.; Lifshin, E.; Sawyer, L.; Michael, J. Scanning Electron Microscopy and X-ray Microanalysis, 3rd ed.; Springer: New York, NY, 2003. [Google Scholar]
- Ji, B.; Li, Q.; Zhang, W. Rare Earth Elements (REE) Recovery from Coal Waste of the Western Kentucky No. 13 and Fire Clay Seams. Part I: Mineralogical Characterization Using SEM-EDS and TEM-EDS. Fuel 2022, 307, 121854. [Google Scholar] [CrossRef]
- Wang, W.; Qin, Y.; Sang, S.; Zhu, Y.; Wang, C.; Weiss, D. J. Geochemistry of Rare Earth Elements in a Marine Influenced Coal and Its Organic Solvent Extracts from the Antaibao Mining District, Shanxi, China. Int. J. Coal Geol. 2008, 76(4), 309–317. [Google Scholar] [CrossRef]
- Rudnick, R. L.; Gao, S. Composition of the Continental Crust. In Treatise on Geochemistry; Elsevier: Amsterdam, 2003; pp. 1–64. [Google Scholar]
- Powers, M. C. A New Roundness Scale for Sedimentary Particles. J. Sediment. Petrol. 1953, 23(2), 117–119. [Google Scholar] [CrossRef]
- Gorsline, D. S.; Stow, D. A. V.; Piper, D. J. W. A Review of Fine-Grained Sediment Origins, Characteristics, Transport and Deposition. In Fine-Grained Sediments: Deep-Water Processes and Facies; Reading, H. G., Ed.; Spec. Publ. Int. Assoc. Sedimentol., 1984, 15, 17–34. [Google Scholar] [CrossRef]
- Tucker, M. E. Sedimentary Rocks in the Field: A Practical Guide, 3rd ed.; Wiley-Blackwell: Oxford, 2003. [Google Scholar]
- Eskenazy, G. M. Aspects of the Geochemistry of Rare Earth Elements in Coal: An Experimental Approach. Int. J. Coal Geol. 1999, 38 (3–4), 285–295. [CrossRef]
- Creason, C. G.; Justman, D.; Rose, K.; Montross, S.; Bean, A.; Mark-Moser, M.; Wingo, P.; Sabbatino, M.; Thomas, R. B. A Geo-Data Science Method for Assessing Unconventional Rare-Earth Element Resources in Sedimentary Systems. Nat. Resour. Res. 2023, 32(3), 855–878. [Google Scholar] [CrossRef]
- Zhang, S.; Xiu, W.; Sun, B.; Liu, Q. Provenance of Multi-Stage Volcanic Ash Recorded in the Late Carboniferous Coal in the Jungar Coalfield, North China, and Their Contribution to the Enrichment of Critical Metals in the Coal. Int. J. Coal Geol. 2023, 273, 104265. [Google Scholar] [CrossRef]
- Heiken, G. Morphology and Petrography of Volcanic Ashes. Geol. Soc. Am. Bull. 1972, 83(7), 1961. [Google Scholar] [CrossRef]
- Liu, E. J.; Cashman, K. V.; Rust, A. C. Optimizing Shape Analysis to Quantify Volcanic Ash Morphology. GeoResJ 2015, 8, 14–30. [Google Scholar] [CrossRef]
- Hower, J. C.; Ruppert, L. F.; Eble, C. F. Lanthanide, Yttrium, and Zirconium Anomalies in the Fire Clay Coal Bed, Eastern Kentucky. Int. J. Coal Geol. 1999, 39 (1–3), 141–153. [CrossRef]
- Tuduri, J.; Pourret, O.; Gloaguen, E.; Lach, P.; Janots, E.; Colin, S.; Gouin, J.; Chevillard, M.; Bailly, L. Formation of Authigenic Grey Monazite: A Paleo-Thermal Anomaly Marker in Very-Low Grade Metamorphic Rocks? Ore Geol. Rev. 2023, 160, 105583. [Google Scholar] [CrossRef]
- Yu, C.; Mu, N.; Huang, W.; Xu, W.; Feng, X. Major and Rare Earth Element Characteristics of Late Paleozoic Coal in the Southeastern Qinshui Basin: Implications for Depositional Environments and Provenance. ACS Omega 2022, 7(35), 30856–30878. [Google Scholar] [CrossRef] [PubMed]
- Eaton, J. G.; Nations, J. D. Tectonic Setting along the Margin of the Cretaceous Western Interior Seaway, Southwestern Utah and Northern Arizona. In Stratigraphy, Depositional Environments, and Sedimentary Tectonics of the Western Margin, Cretaceous Western Interior Seaway; Nations, J. D., Eaton, J. G., Eds.; Geol. Soc. Am. Spec. Pap. 260, 1991; pp 1–8.
- Johnson, S. Y. Phanerozoic Evolution of Sedimentary Basins in the Uinta-Piceance Basin Region, Northwestern Colorado and Northeastern Utah. Digital Public Library of America 1992, http://catalog.hathitrust.org/Record/100901165.
- Dickinson, W. R.; Gehrels, G. E. Sediment Delivery to the Cordilleran Foreland Basin: Insights from U–Pb Ages of Detrital Zircons in Upper Jurassic and Cretaceous Strata of the Colorado Plateau. Am. J. Sci. 2008, 308(10), 1041–1082. [Google Scholar] [CrossRef]
- DeCelles, P. G.; Graham, S. A. Cyclical Processes in the North American Cordilleran Orogenic System. Geology 2015, 43(6), 499–502. [Google Scholar] [CrossRef]
- Chapman, J. B.; Ducea, M. N. The Role of Arc Migration in Cordilleran Orogenic Cyclicity. Geology 2019, 47, 1–5. [Google Scholar] [CrossRef]
- Ardill, K.; Attia, S.; Memeti, V.; Paterson, S. R. Fingerprinting the Geochemical Signals of Episodic Arc Activity in the Sierra Nevada Batholith in Space and Time. Geol. Soc. Am. Bull. 2024, 136 (9–10), 4321–4341. [CrossRef]
- Hussain, R.; Luo, K. Geochemical Evaluation of Enrichment of Rare-Earth and Critical Elements in Coal Wastes from Jurassic and Permo-Carboniferous Coals in Ordos Basin, China. Nat. Resour. Res. 2020, 29(3), 1731–1754. [Google Scholar] [CrossRef]
Figure 1.
Stratigraphic column showing Cretaceous mined coal-bearing units in the Uinta Region of Utah, including the Ferron Sandstone and Blackhawk Formation [41,42,43,44,45,46].
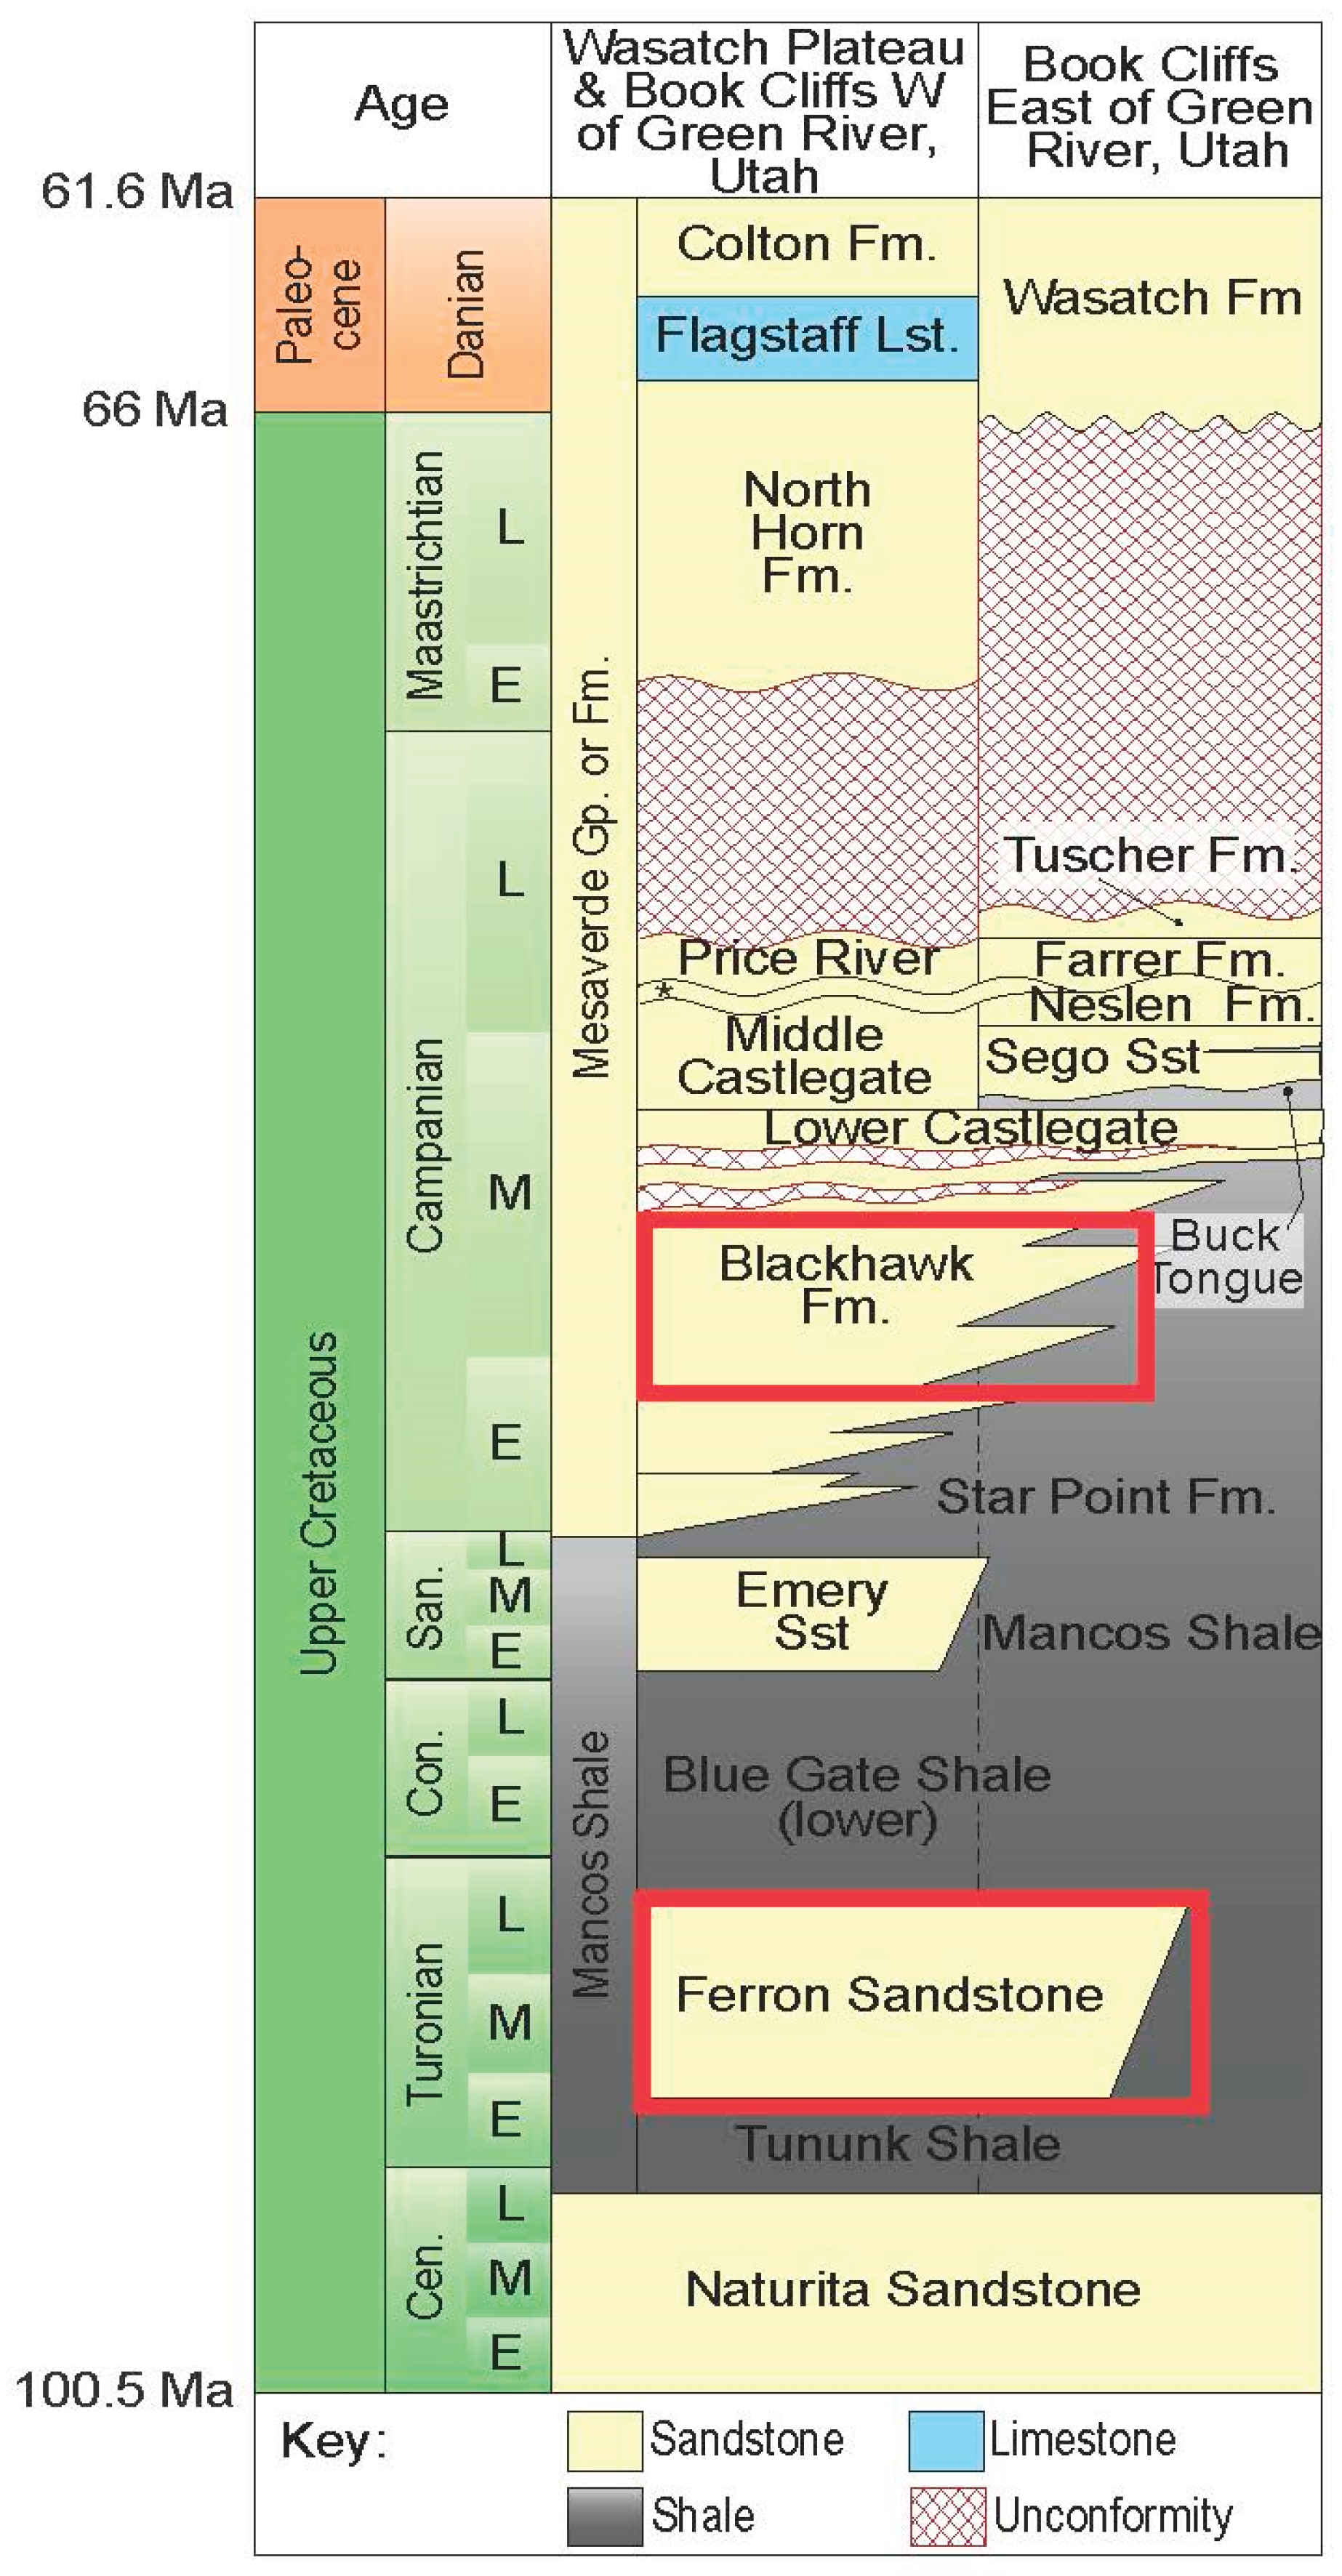
Figure 2.
Uinta Basin regional map of sample locations and source coal field. Historic mine, outcrop, and core samples were utilized for this study.
Figure 2.
Uinta Basin regional map of sample locations and source coal field. Historic mine, outcrop, and core samples were utilized for this study.
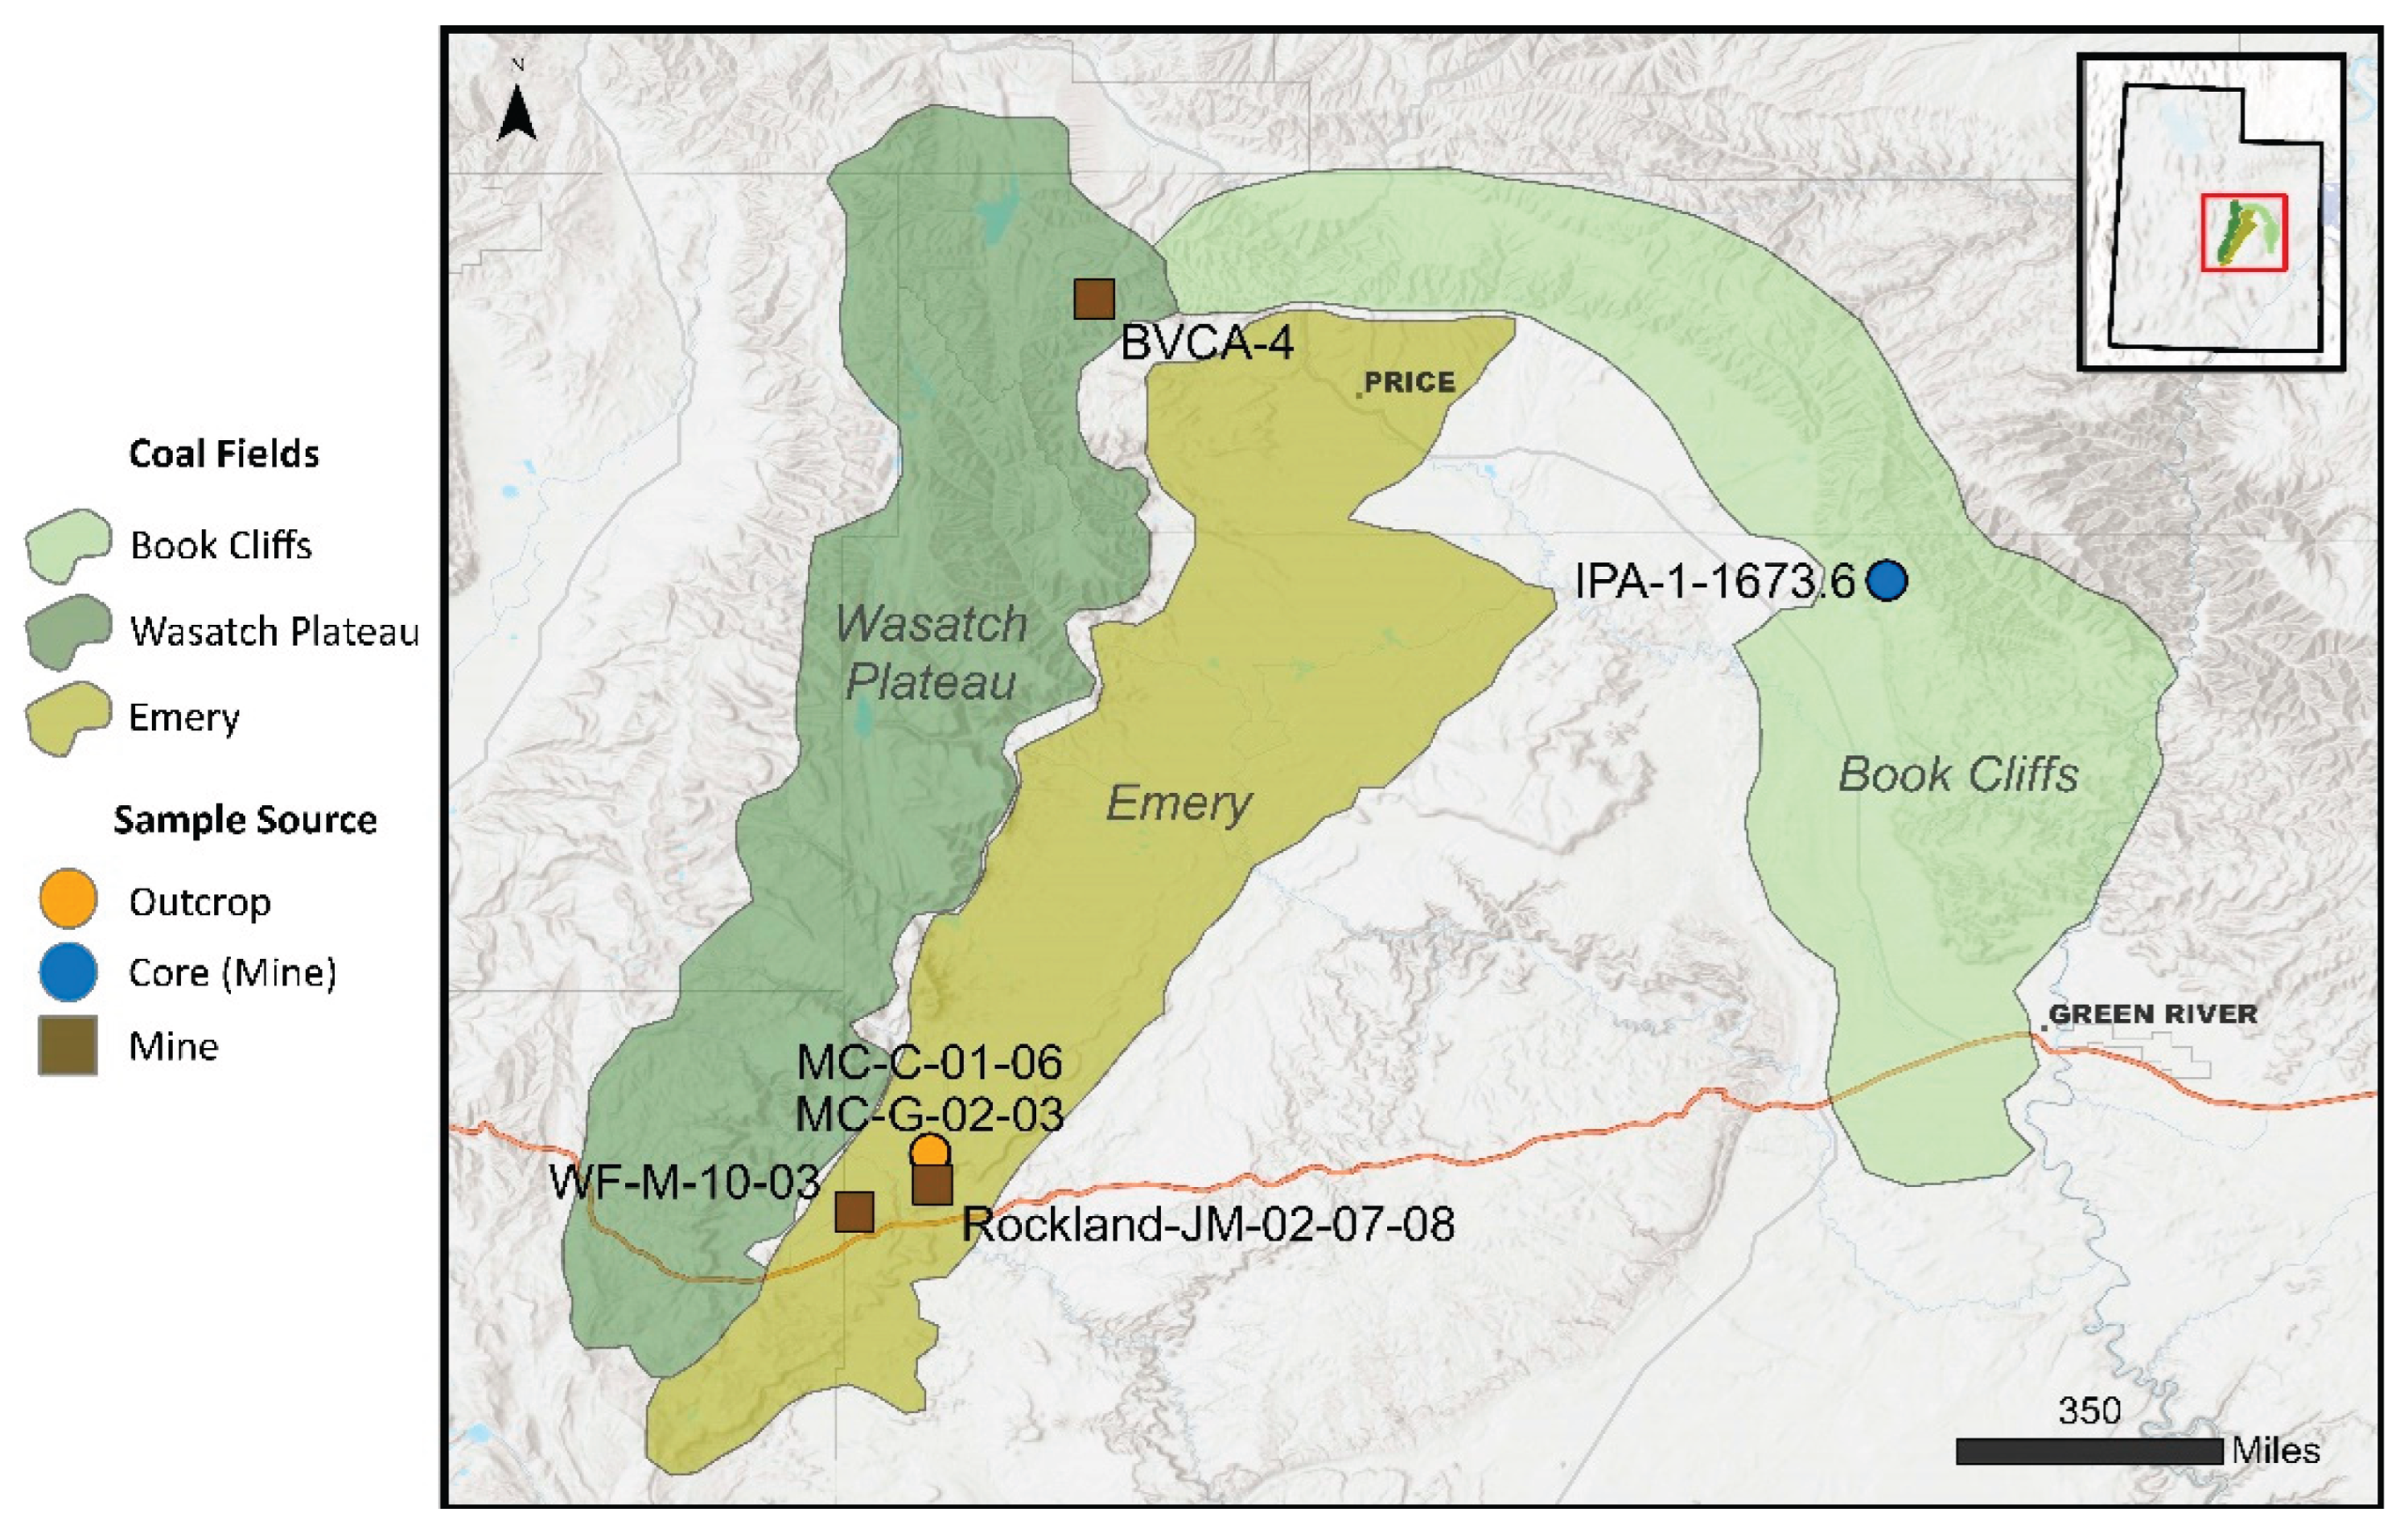
Figure 3.
Thin section map of siltstone Rockland showing six zones of petrographic images (marked 1-6). Red boxes indicate spots were detailed SEM-EDS analysis was completed (Spot(s) 1-17).
Figure 3.
Thin section map of siltstone Rockland showing six zones of petrographic images (marked 1-6). Red boxes indicate spots were detailed SEM-EDS analysis was completed (Spot(s) 1-17).
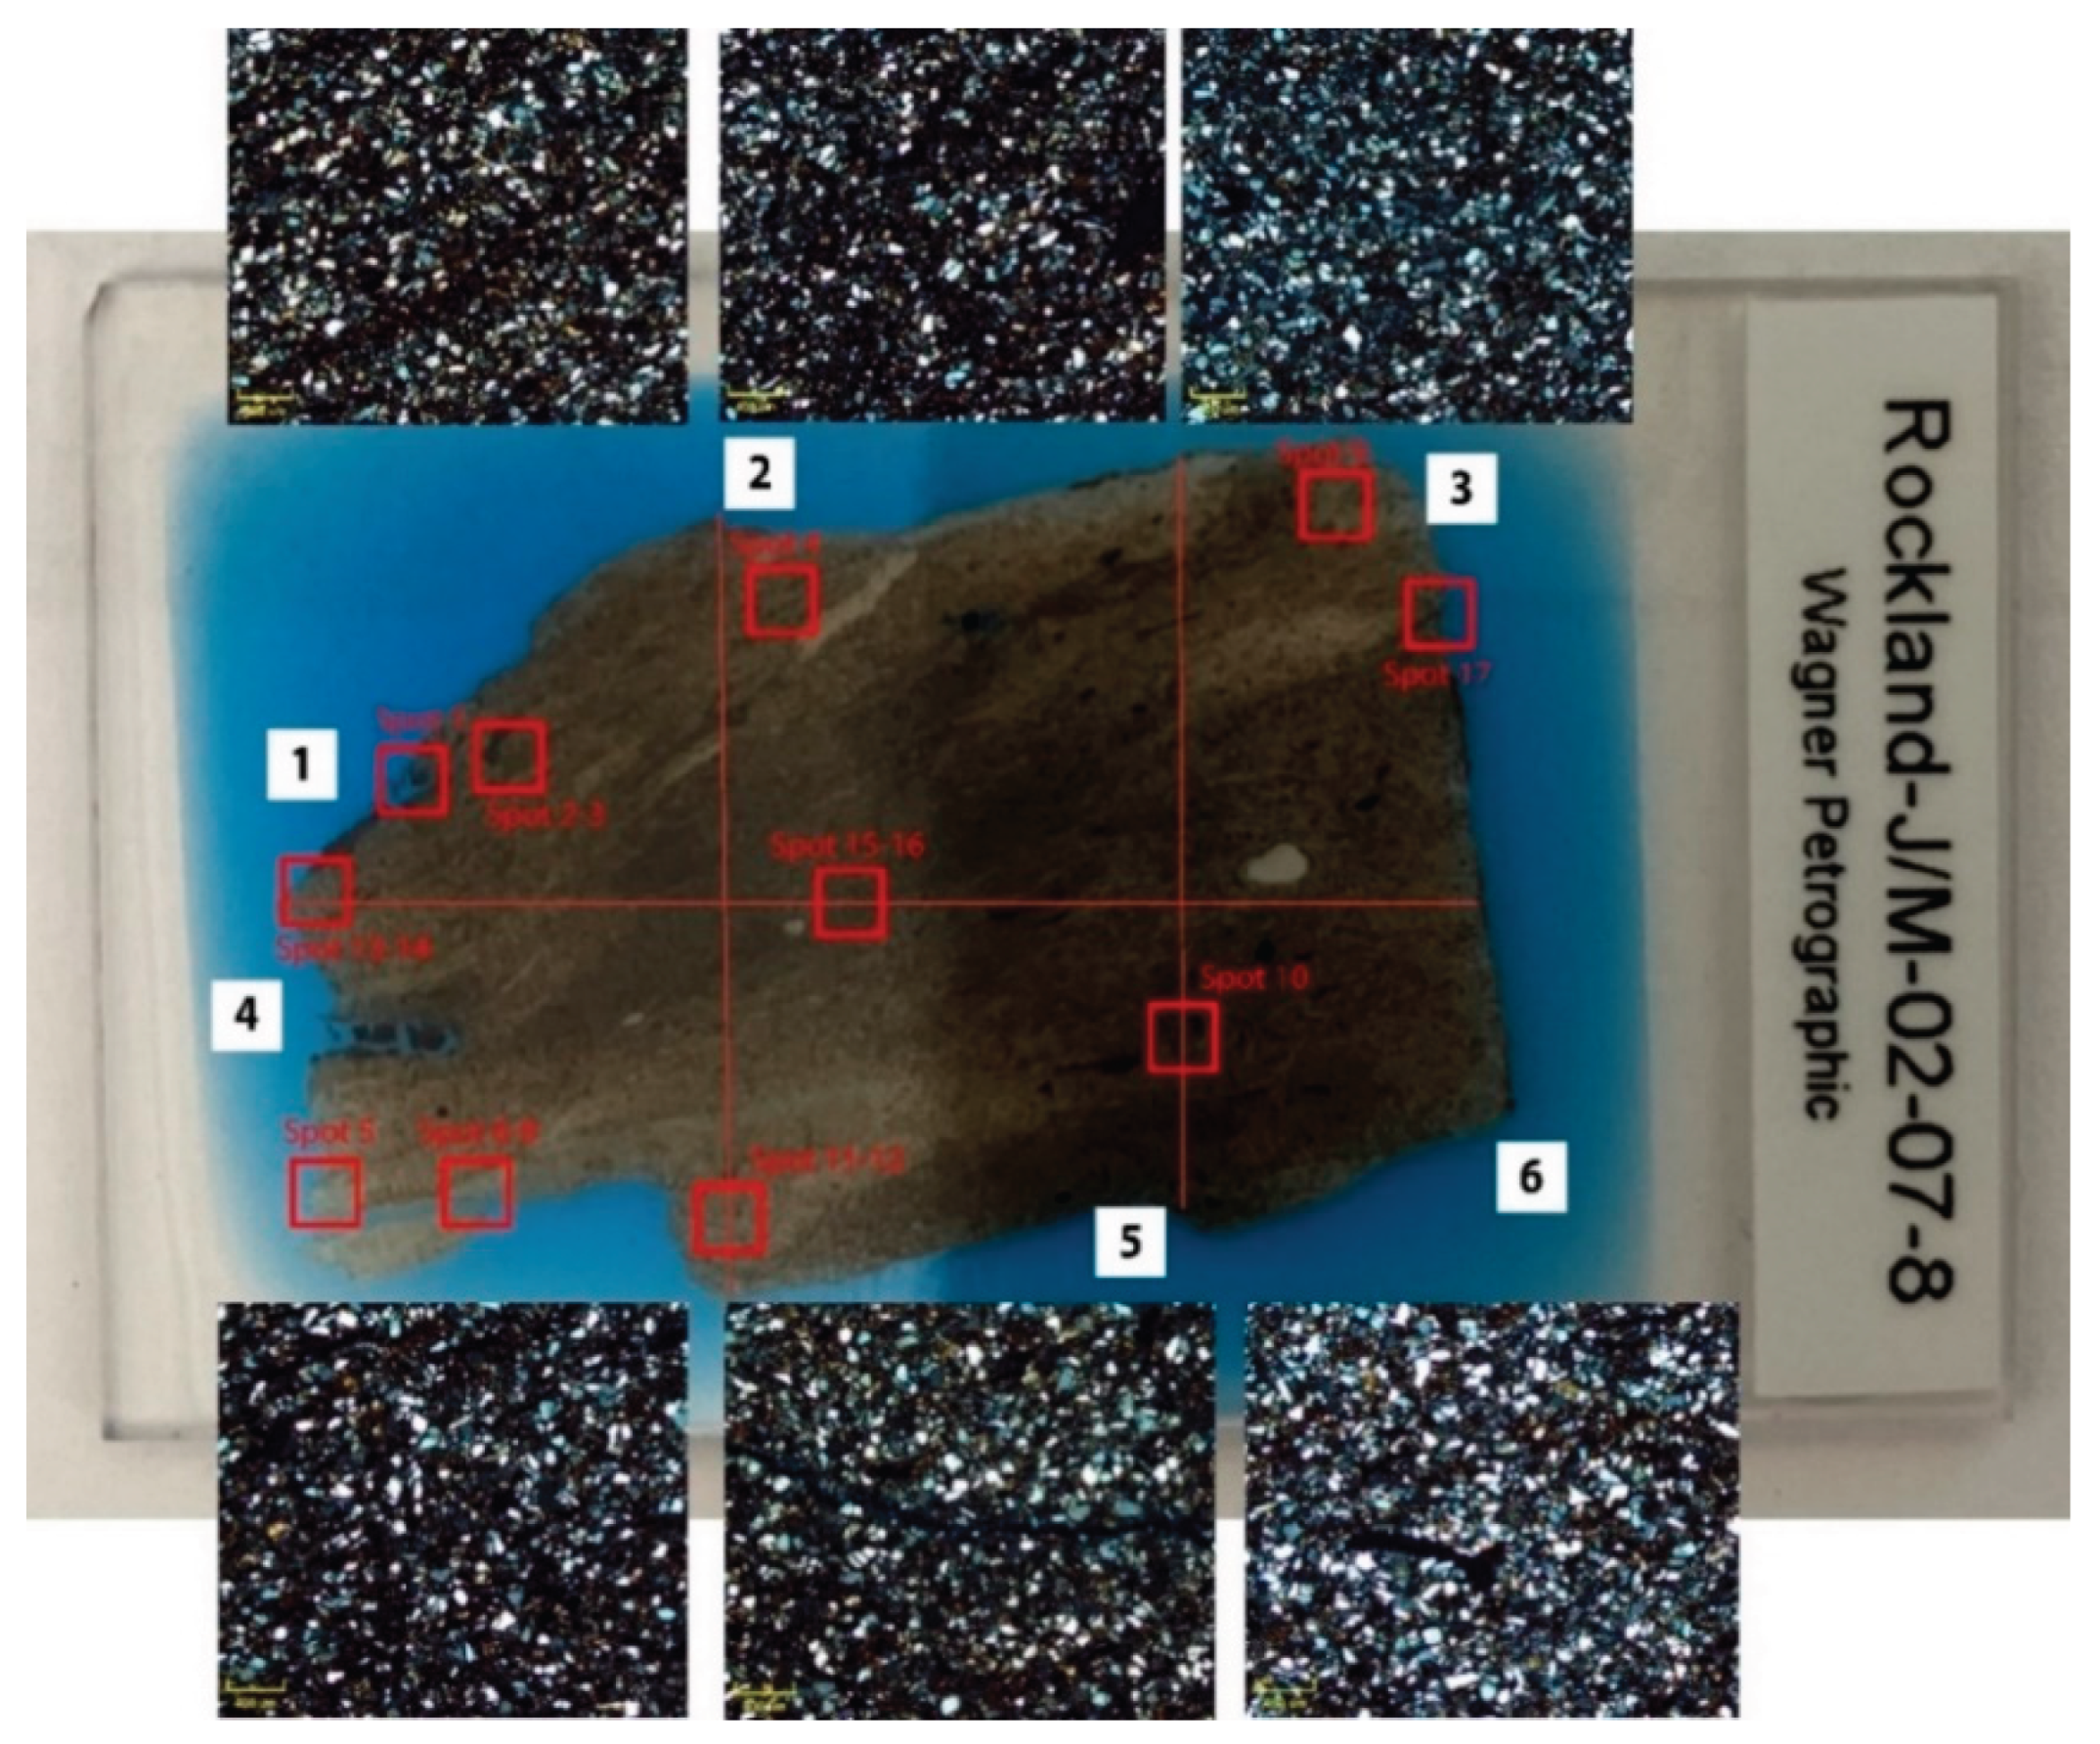
Figure 4.
Sample BVCA-4 exploratory image taken on the Teneo showing qualitative assessment of zones of brightness intensity. BSE (labeled as ABS) image shows areas of darker grayscale (dark gray to light gray) that indicate typical clay and/or organic areas rich in silica and aluminum. Zones with brighter (white) are areas that contain elements of higher atomic numbers and indicate possible REE enriched targets.
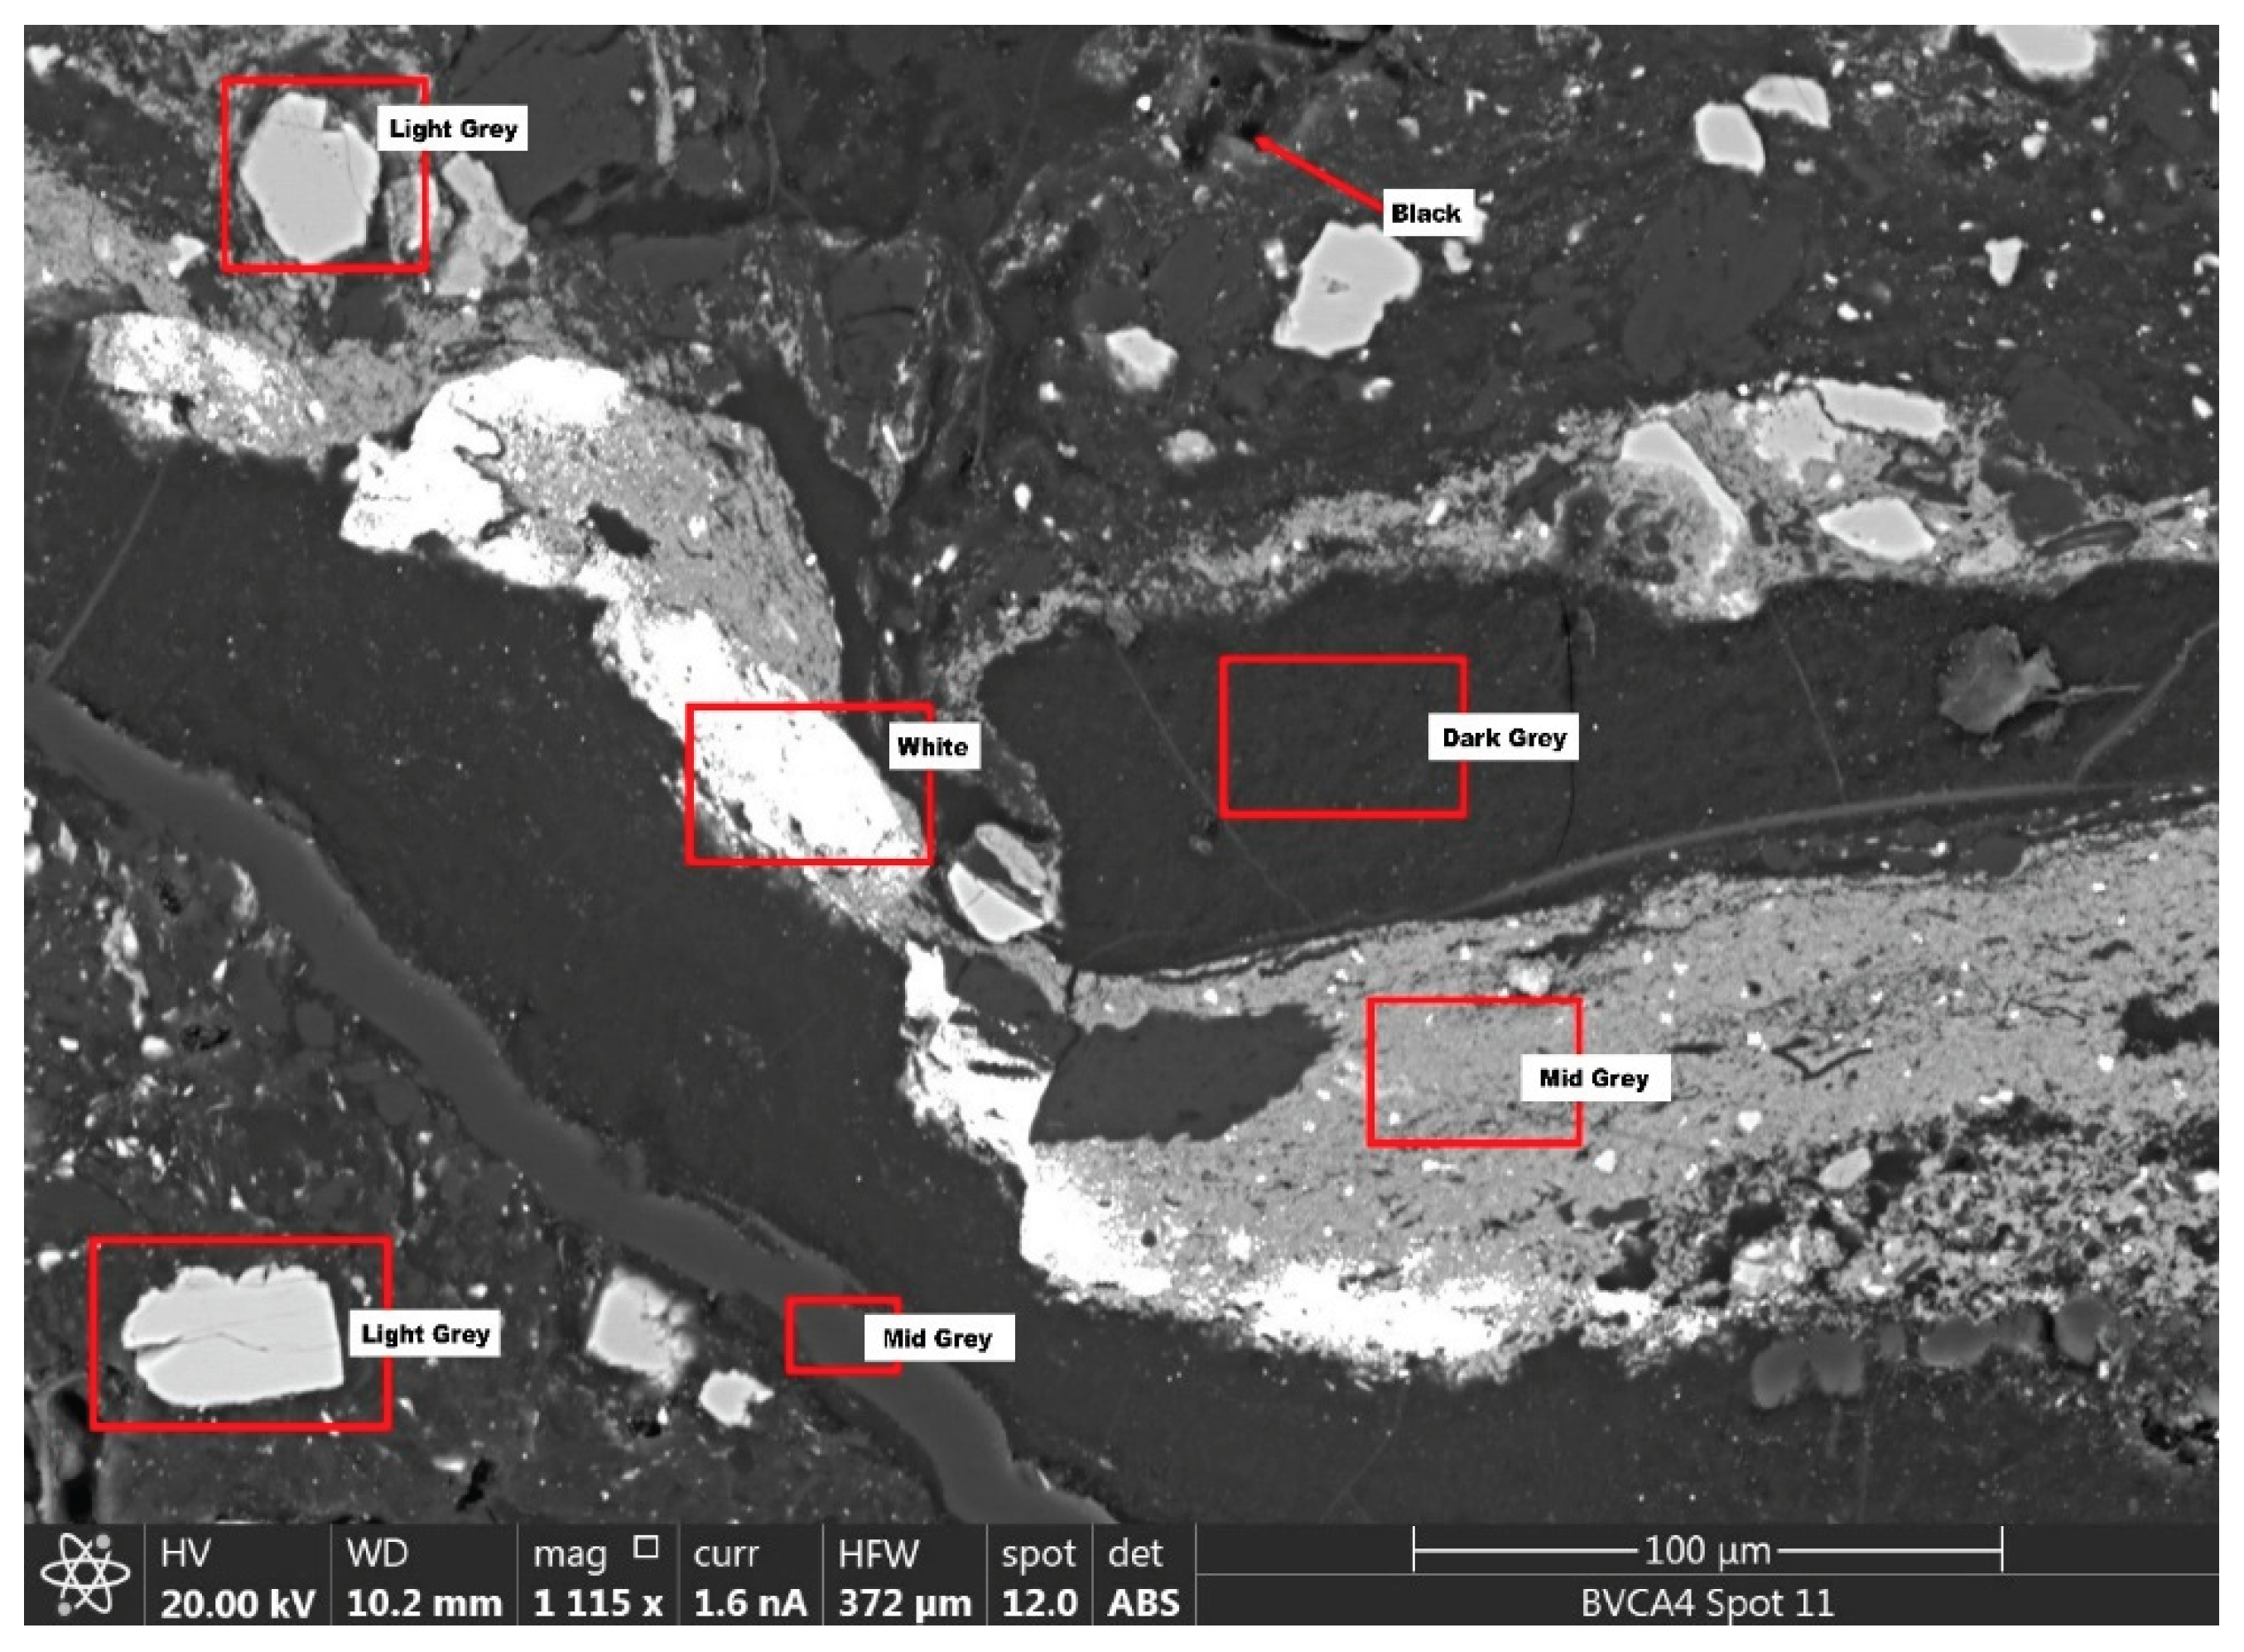
Figure 5.
Methodology modified from Ji et al. (2022) [54] showing the process for identifying areas of interest for EDS analysis.
Figure 5.
Methodology modified from Ji et al. (2022) [54] showing the process for identifying areas of interest for EDS analysis.
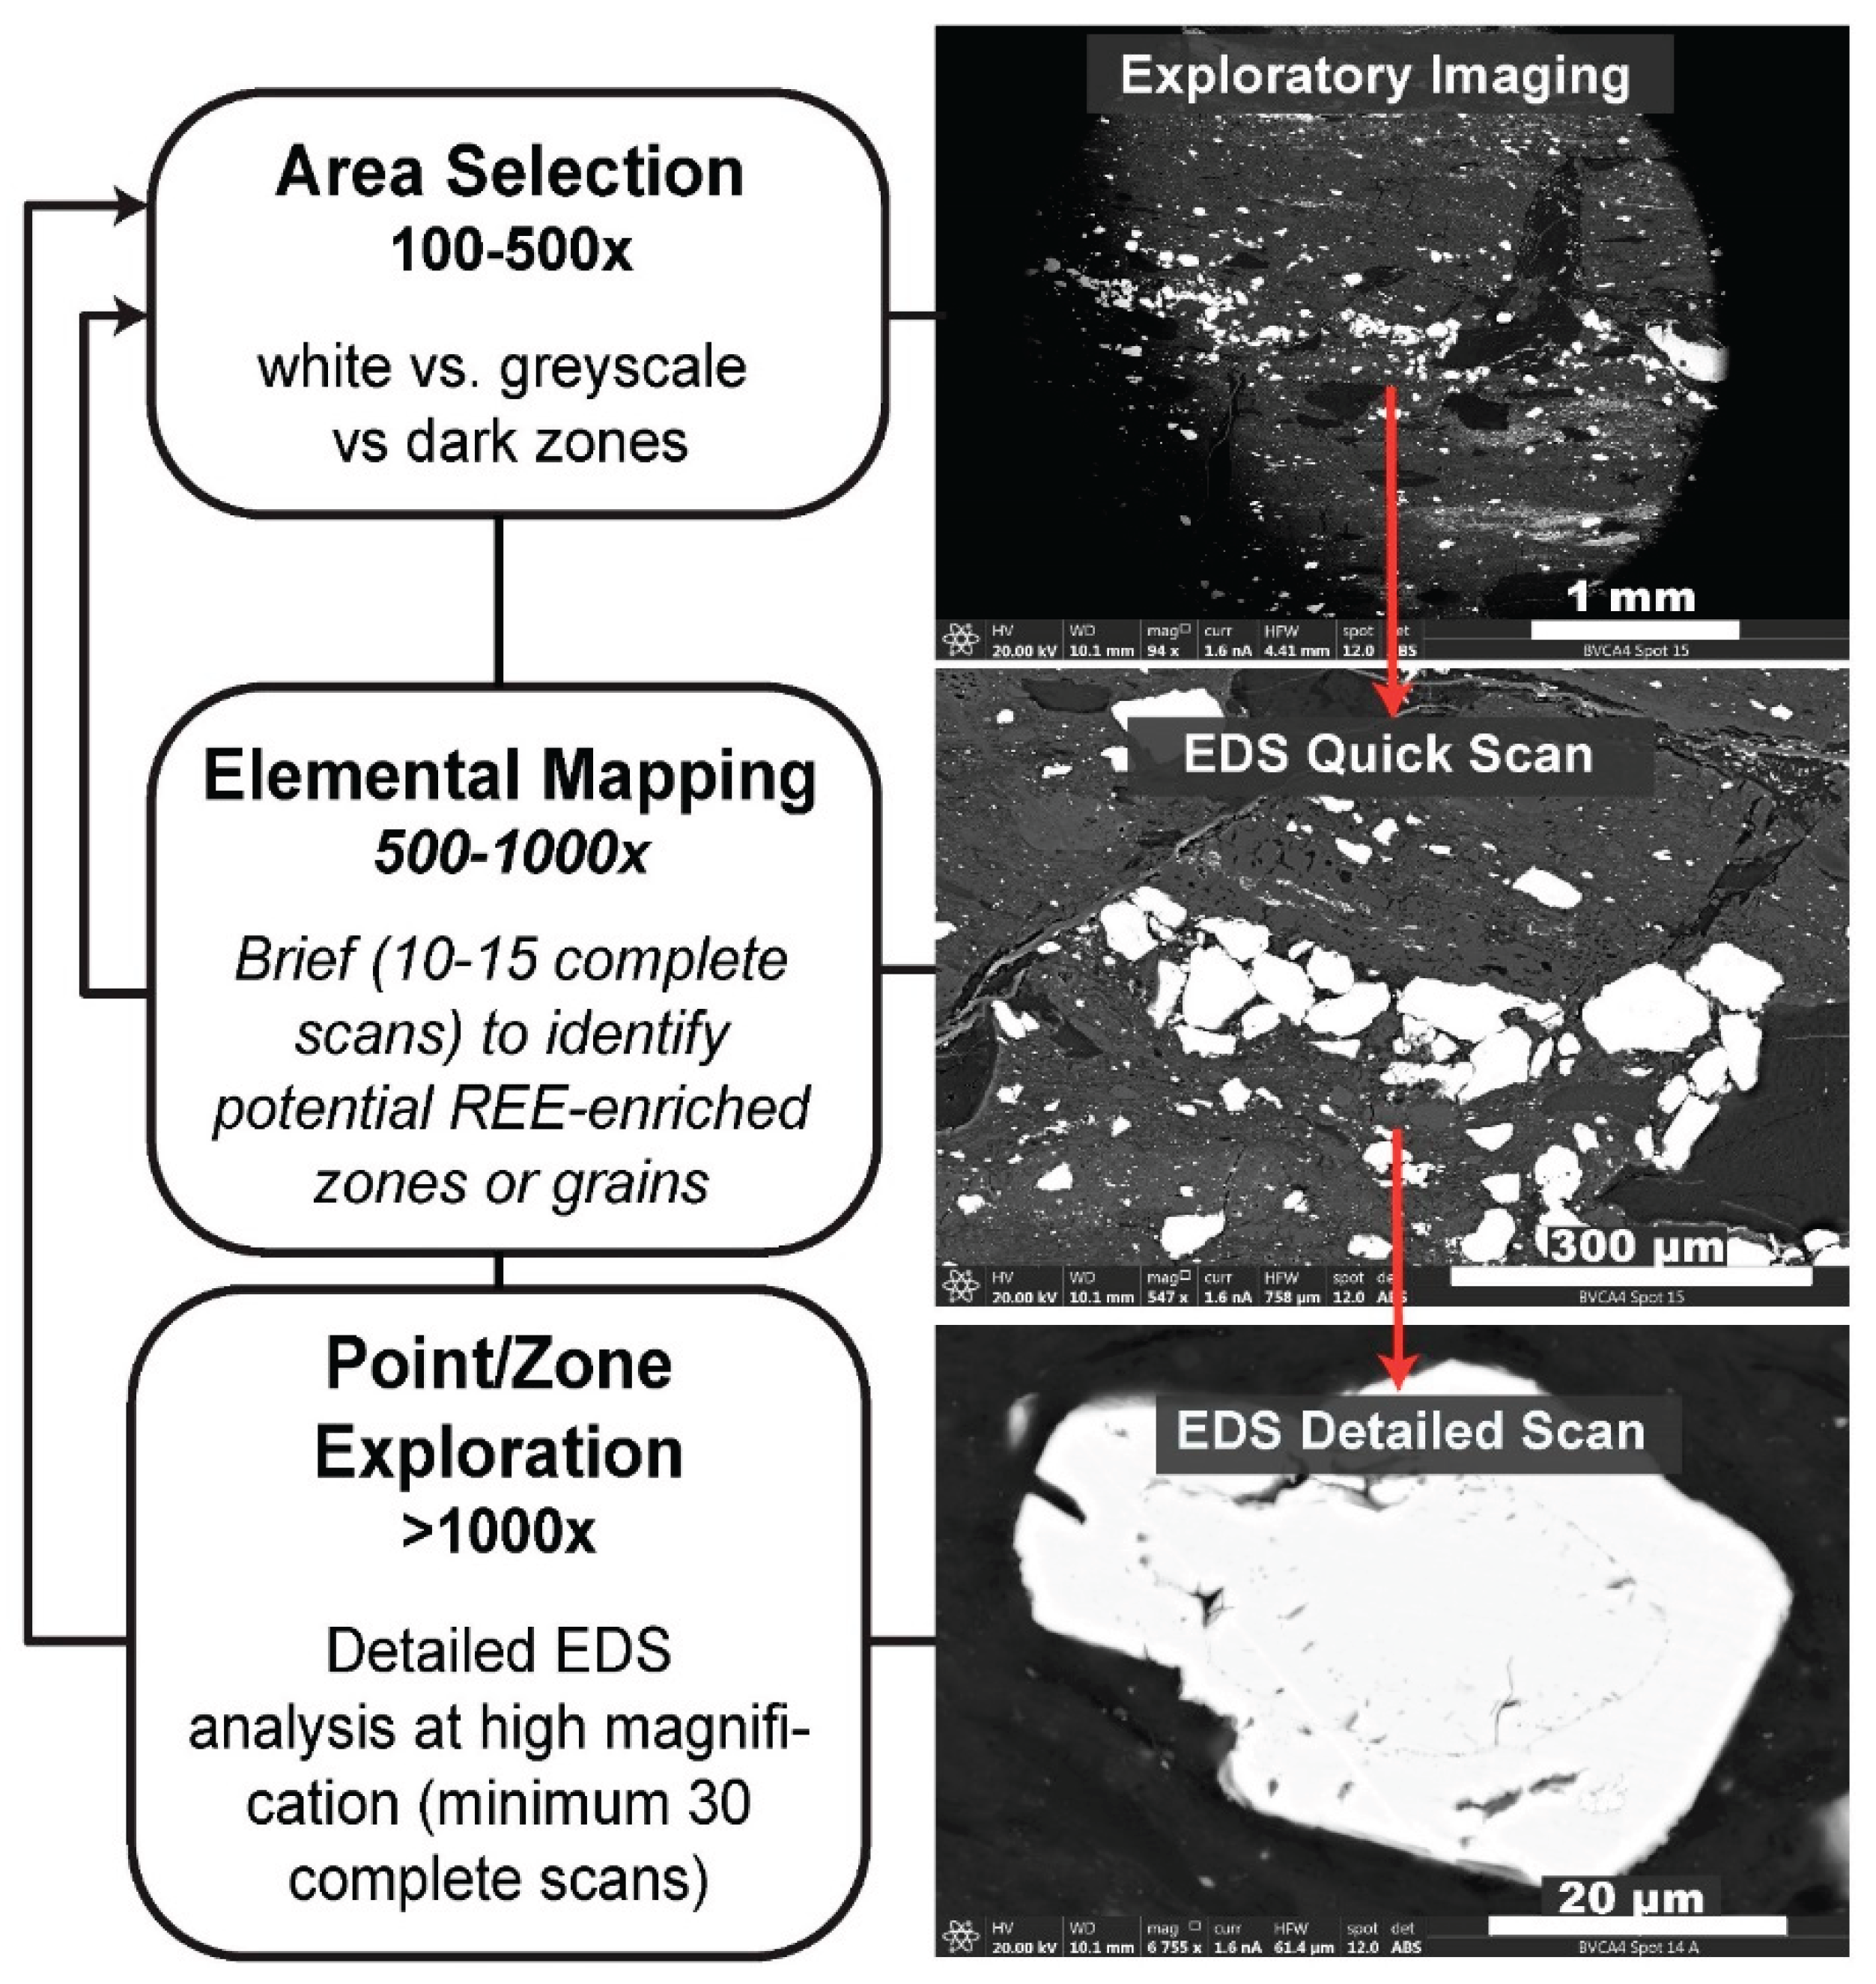
Figure 6.
Example of EDS methods employed for grain analysis on sample BVCA-4. A) initial BSE scan showing clay zone ≥40 μm that displays several bright spots indicative of heavier elements. B) EDS phase mapping of entire area of interest. C) BSE imaging at a higher magnification of bright spots for further EDS analysis. D) EDS analysis of bright outlined by green polygon showing high phosphate content. E) EDS spectral analysis of green polygonal region (D) showing elevated enrichment of REE.
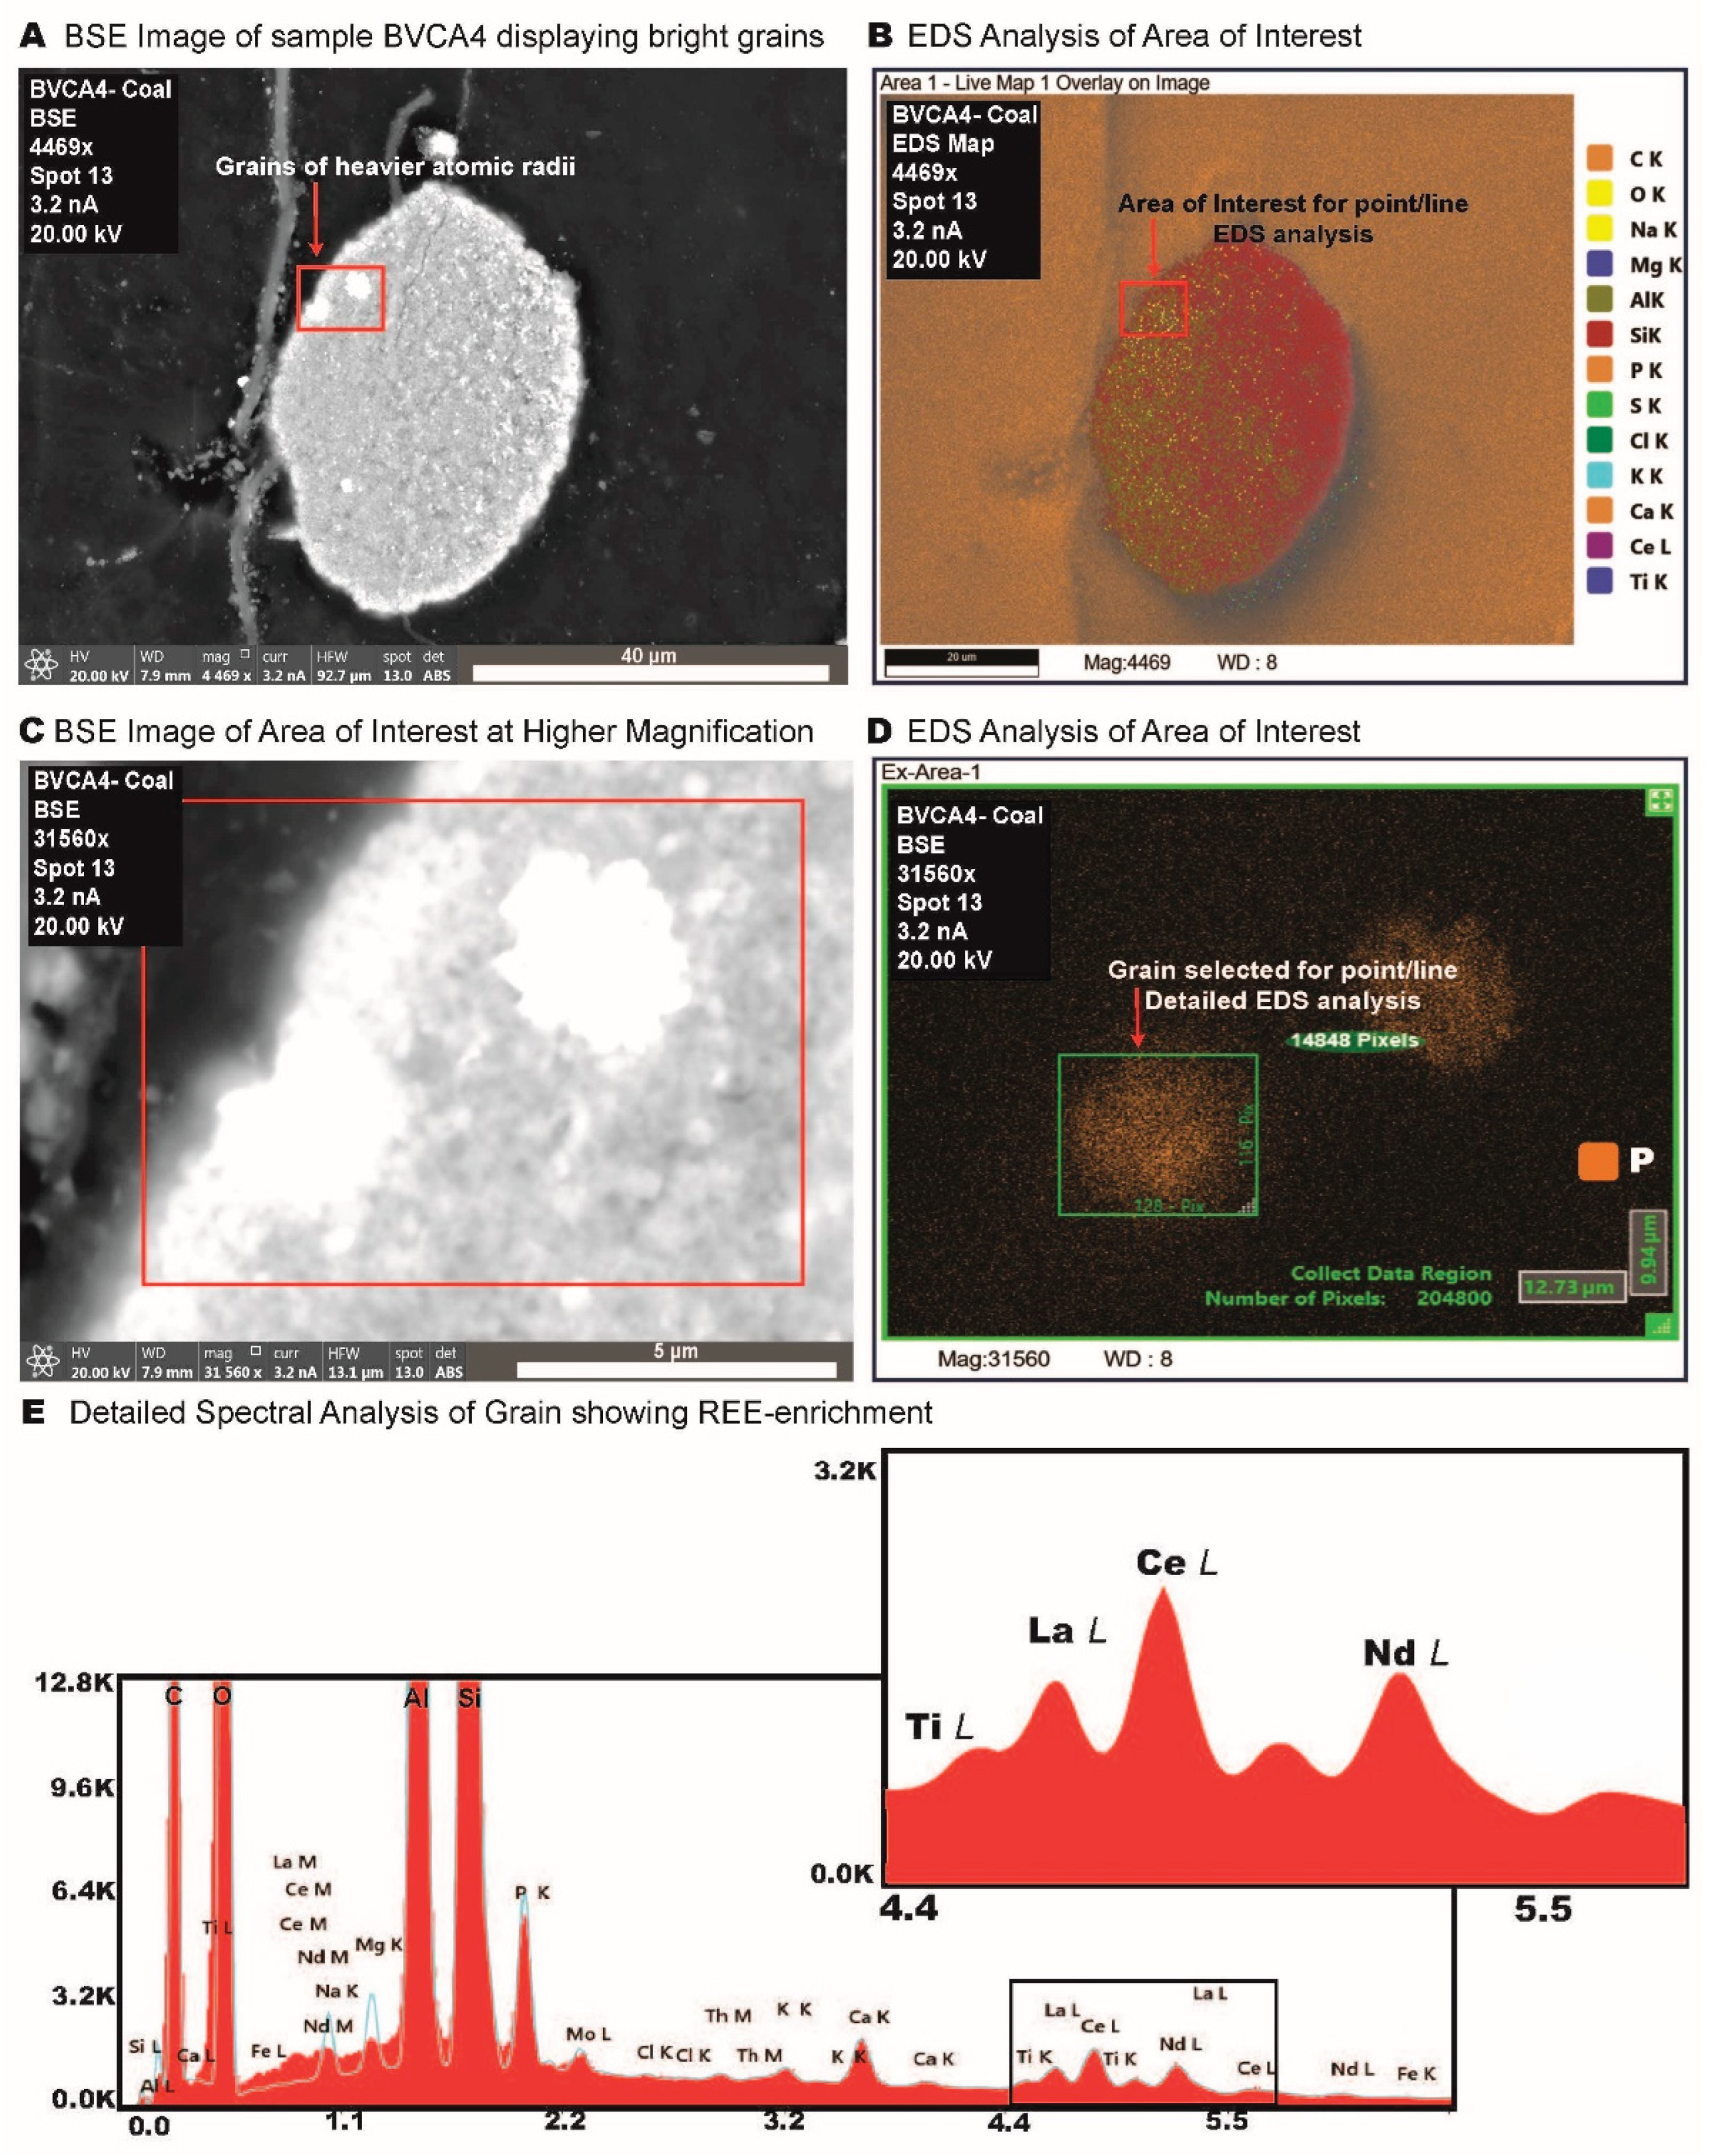
Figure 7.
Distribution of A) absolute REE concentrations in ppm, as measured by ICP-MS in study samples and B) REE concentrations normalized to average UCC values based on Rudnick and Gao (2003) [56].
Figure 7.
Distribution of A) absolute REE concentrations in ppm, as measured by ICP-MS in study samples and B) REE concentrations normalized to average UCC values based on Rudnick and Gao (2003) [56].
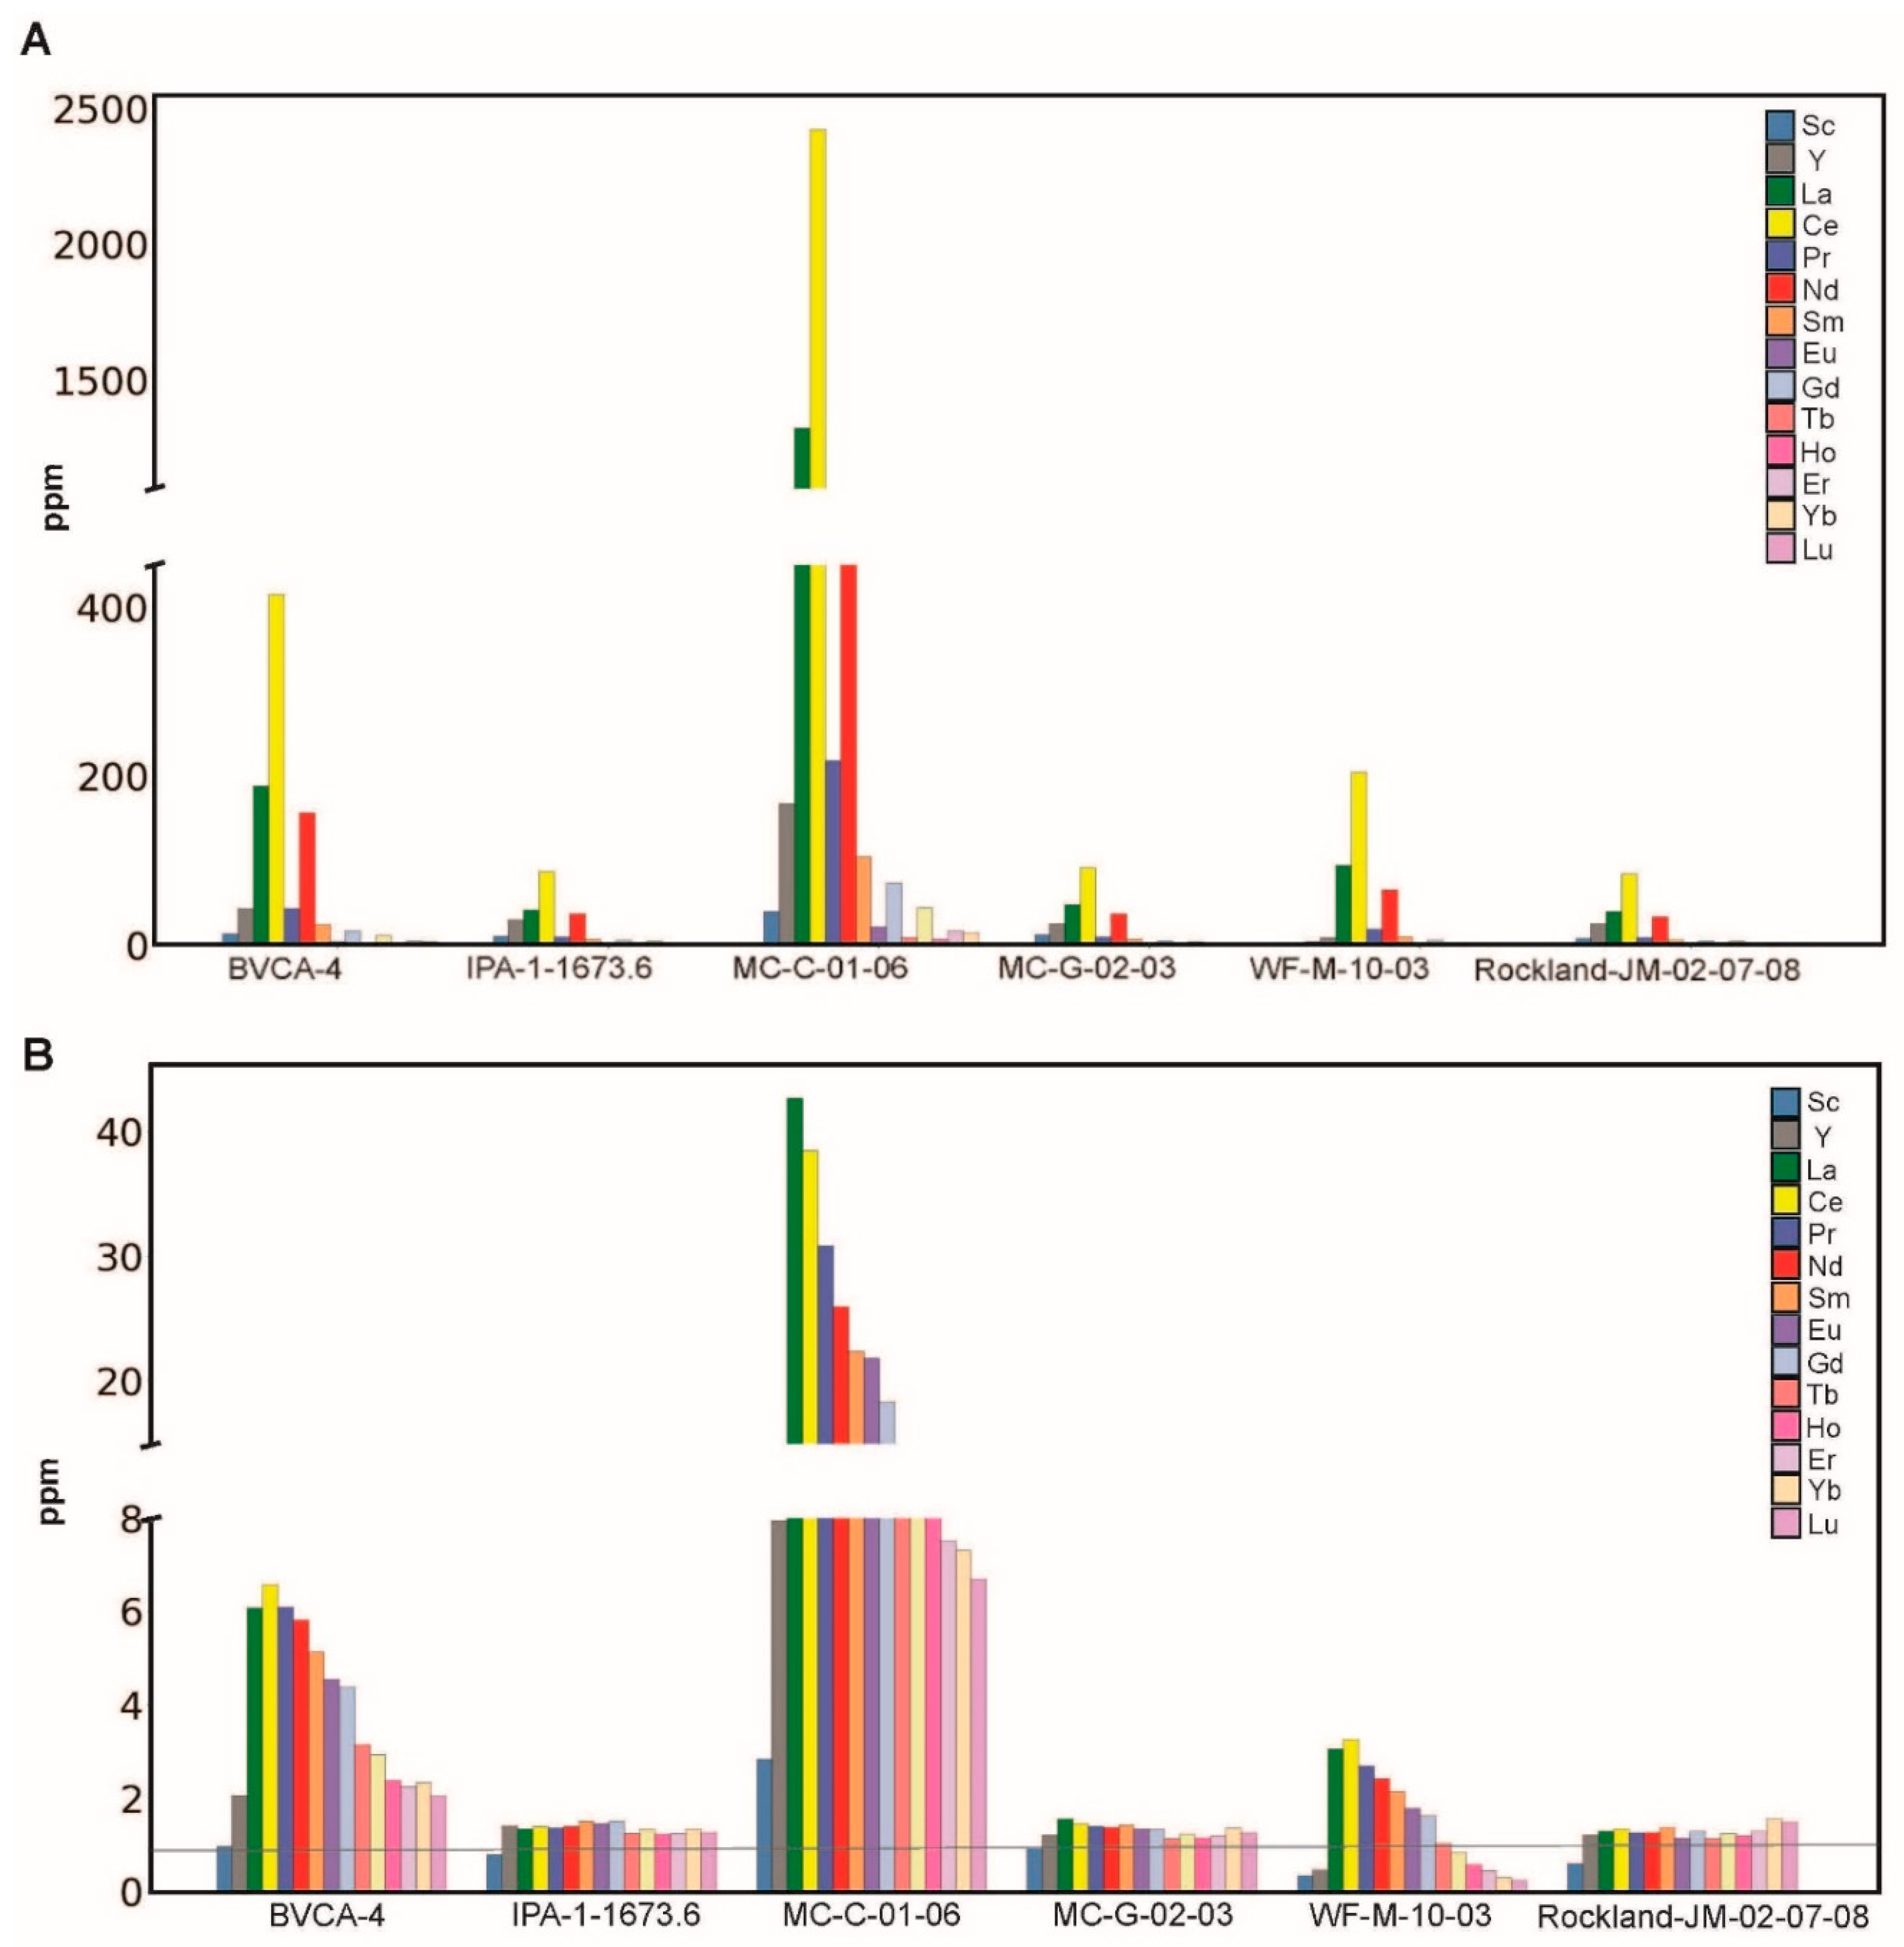
Figure 8.
BSE images of identified REE-enriched grains and REE-hosted organic matter categorized by size.
Figure 8.
BSE images of identified REE-enriched grains and REE-hosted organic matter categorized by size.
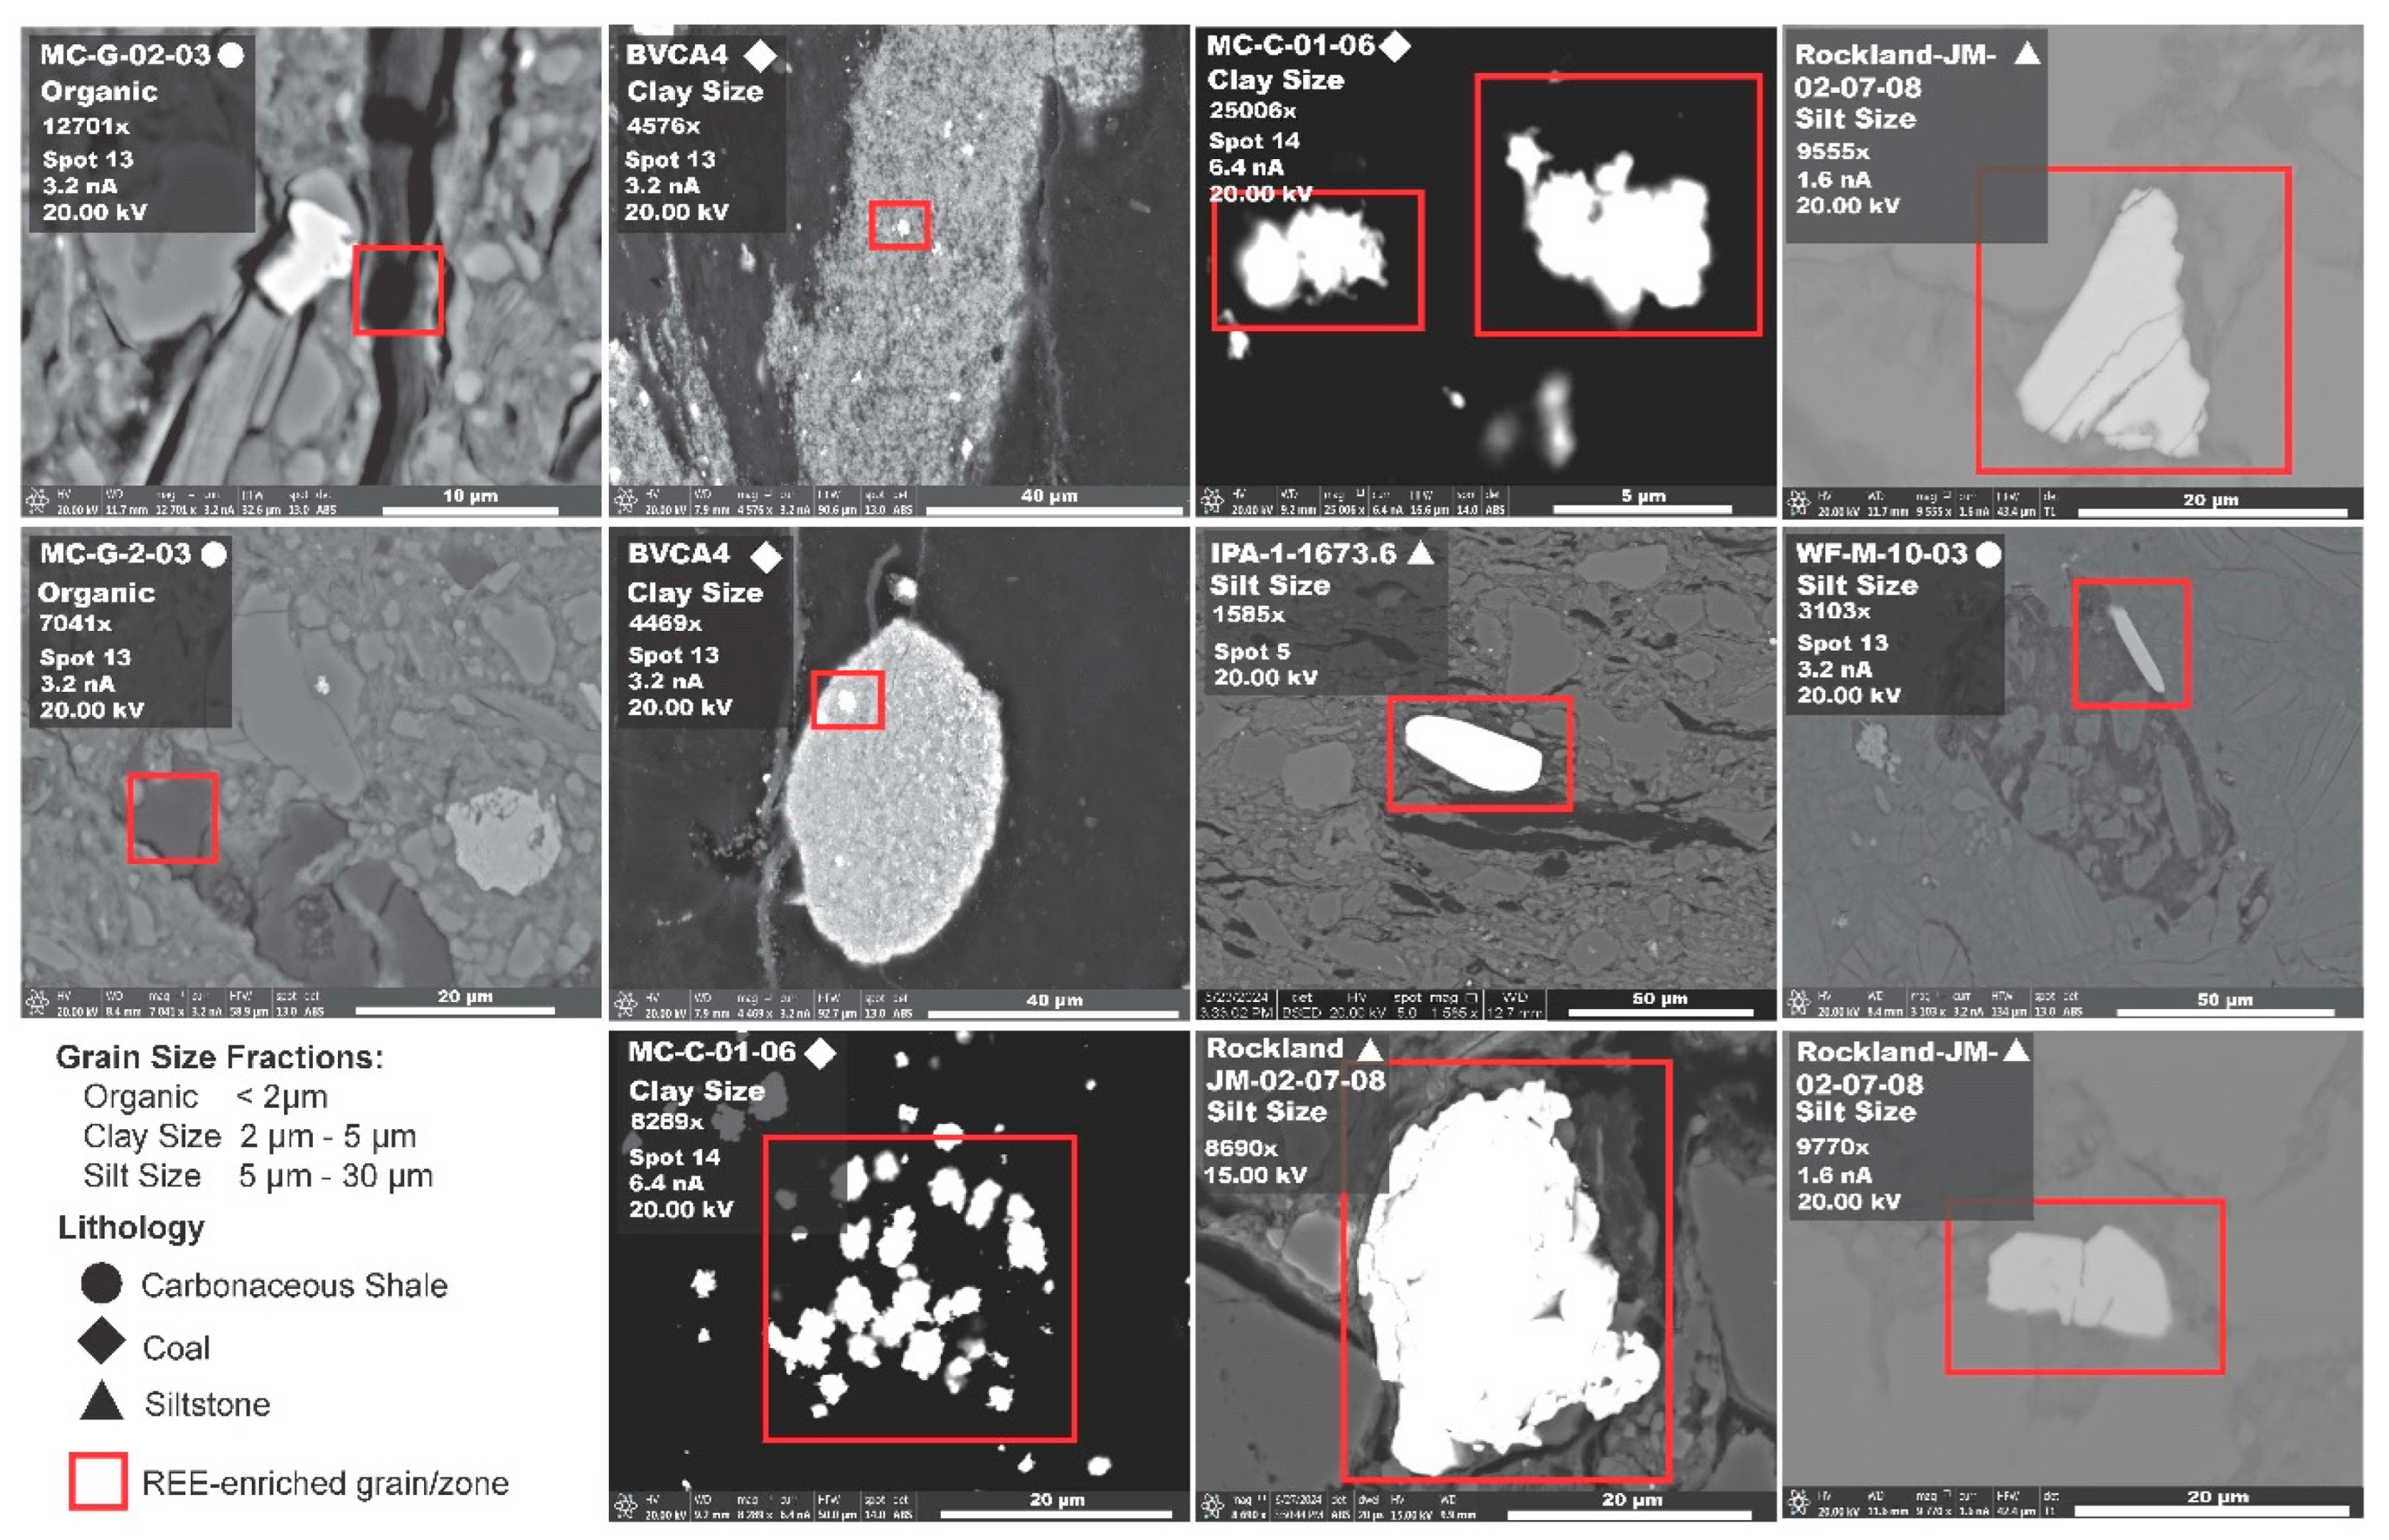
Figure 9.
Silt and clay size enriched monazite-Ce grains. A) BSE image of silt size monazite grain identified in Rockland siltstone sample. B) Qualitative concentrations of REE present in the Rockland monazite grain. C) EDS spectrum of REE-enriched monazite grain in the Rockland siltstone sample. D) BSE image of clay size monazite grains found in coal sample MC-C. E) Qualitative EDS analysis of REE concentrations present in clay size monazite grains F) EDS spectrum of REE-enriched monazite grain cluster found in MC-C coal sample.
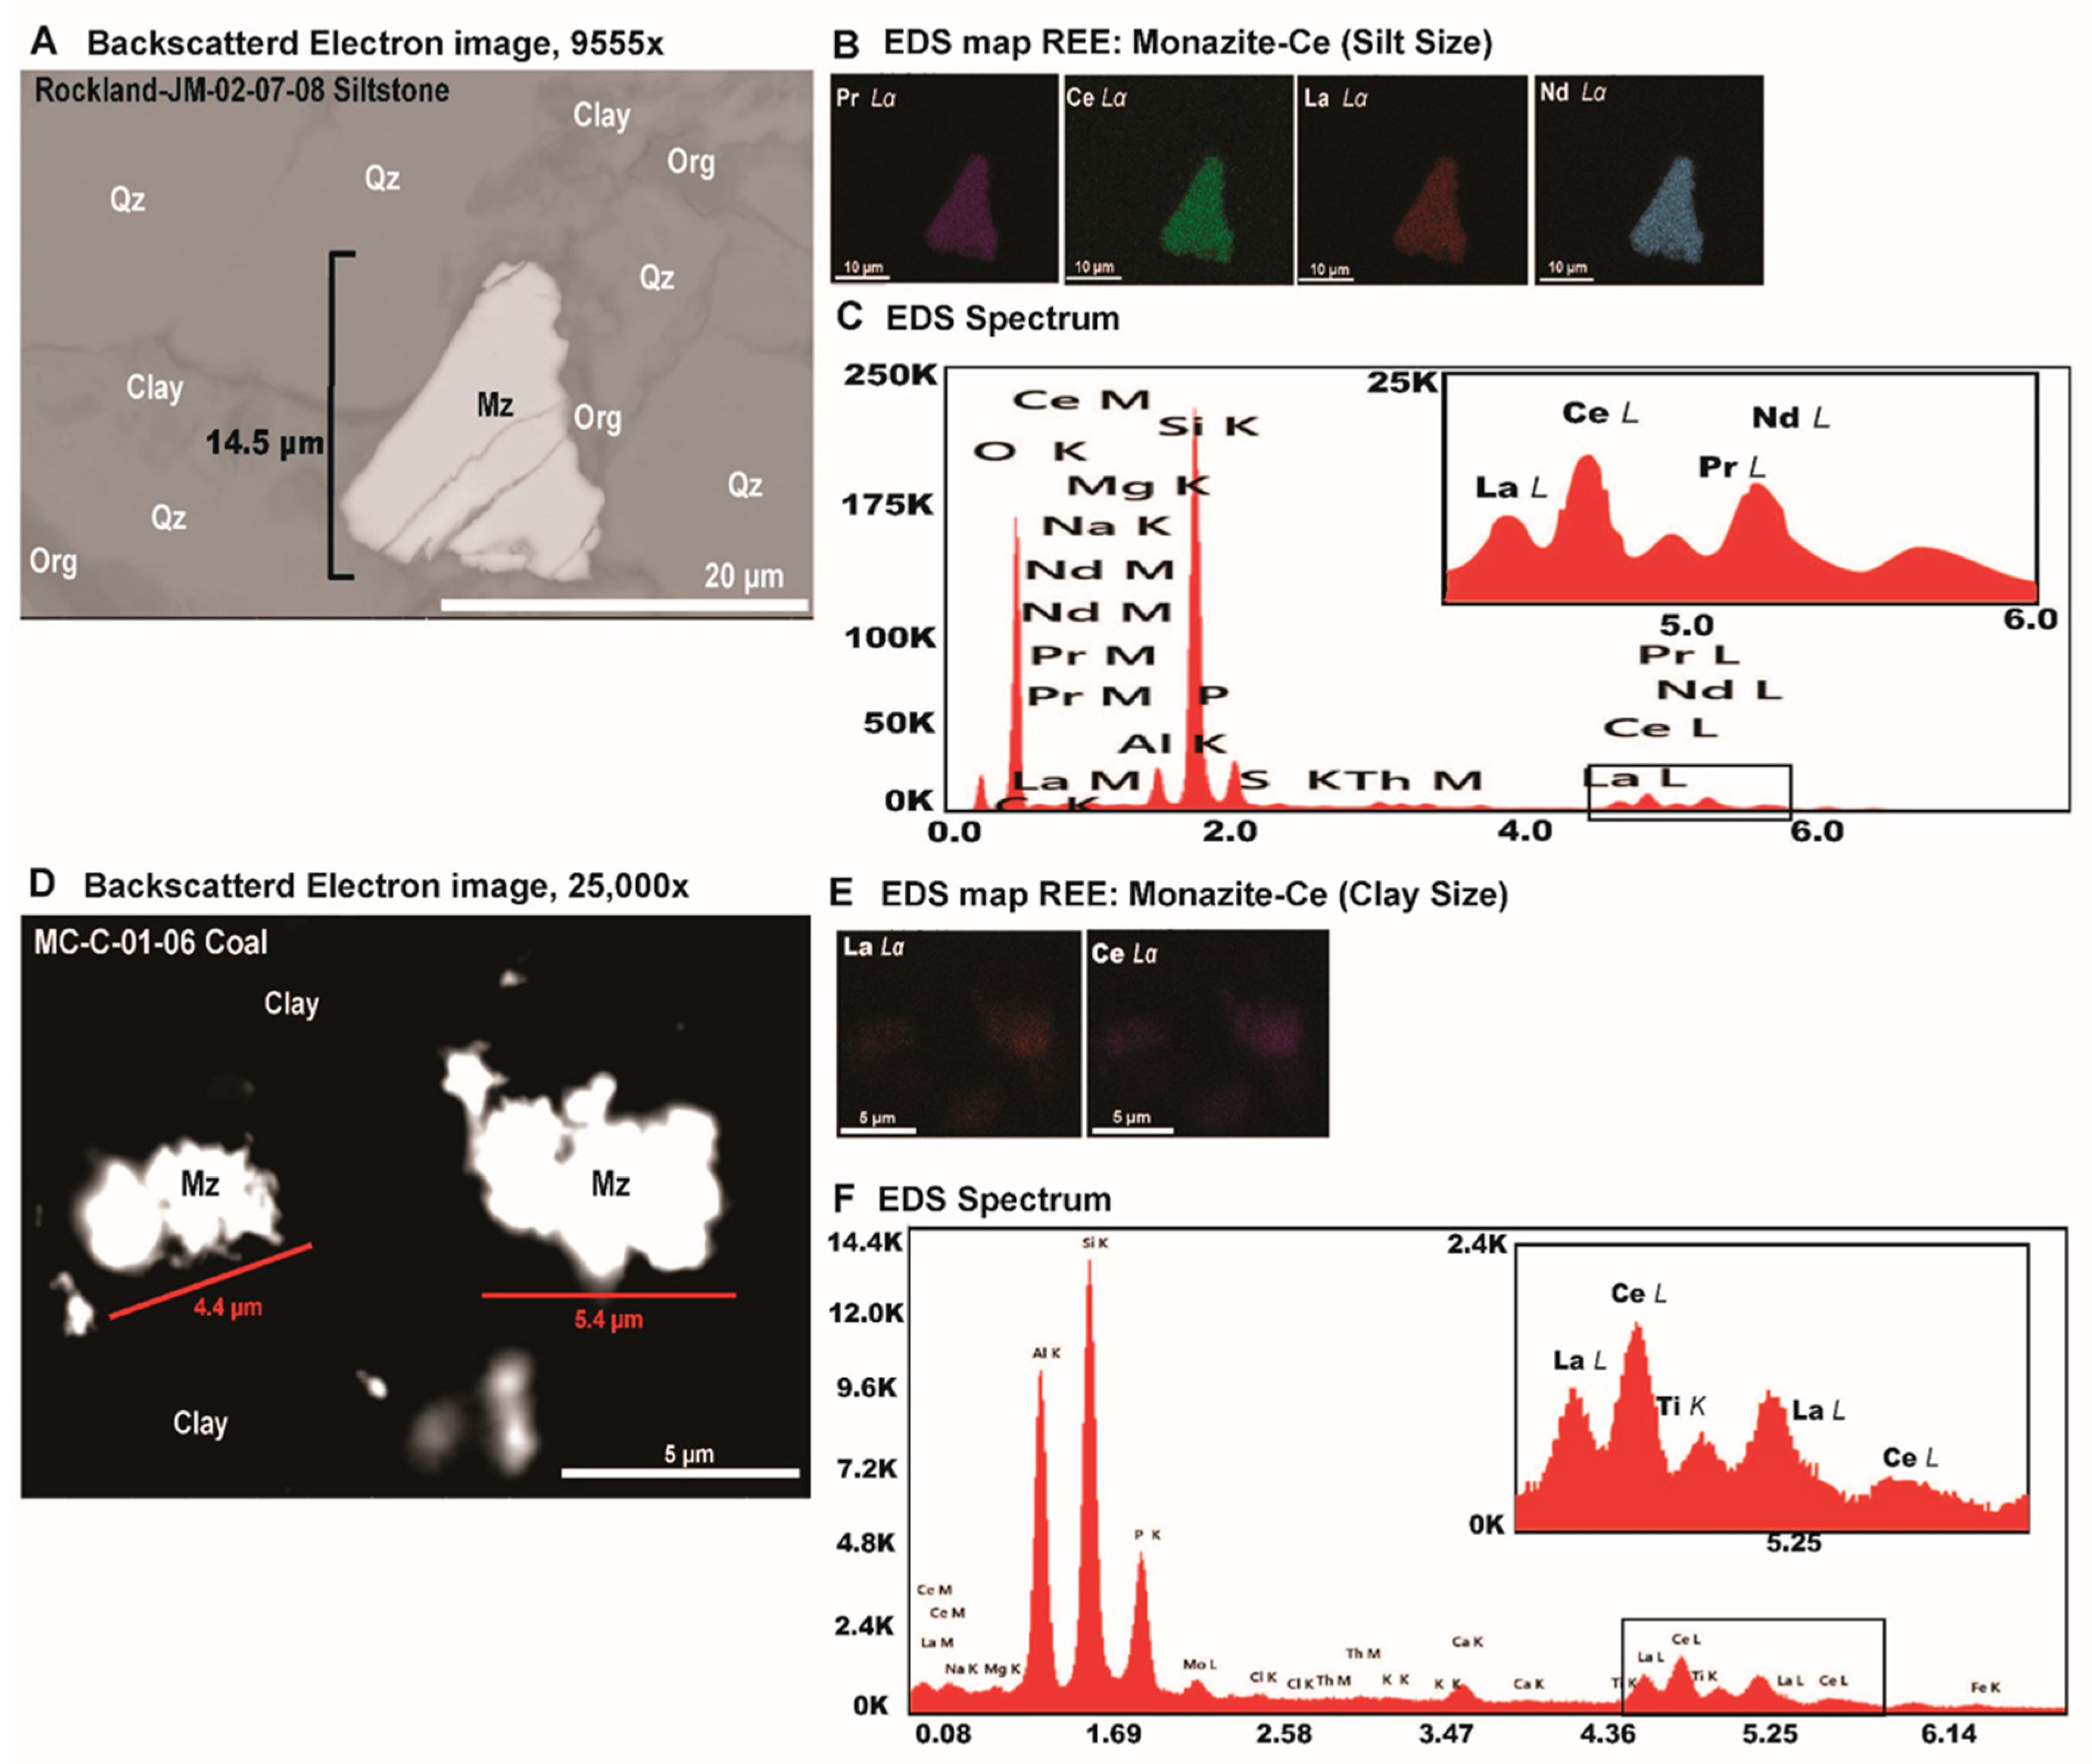
Figure 10.
(A) Bright spots are interpreted as phosphate grain field in clay from coal sample MC-C shown in secondary electrons (SE) (labeled ETD) and (B) BSE. The white grains pictured are all similar in geochemical makeup and are interpreted as containing varying levels of REE enrichment. The red box indicates an area of interest where detailed EDS analysis was completed, and REE-enrichment identified in clustered clay size phosphate (monazite) grains (see also Figure 9-D).
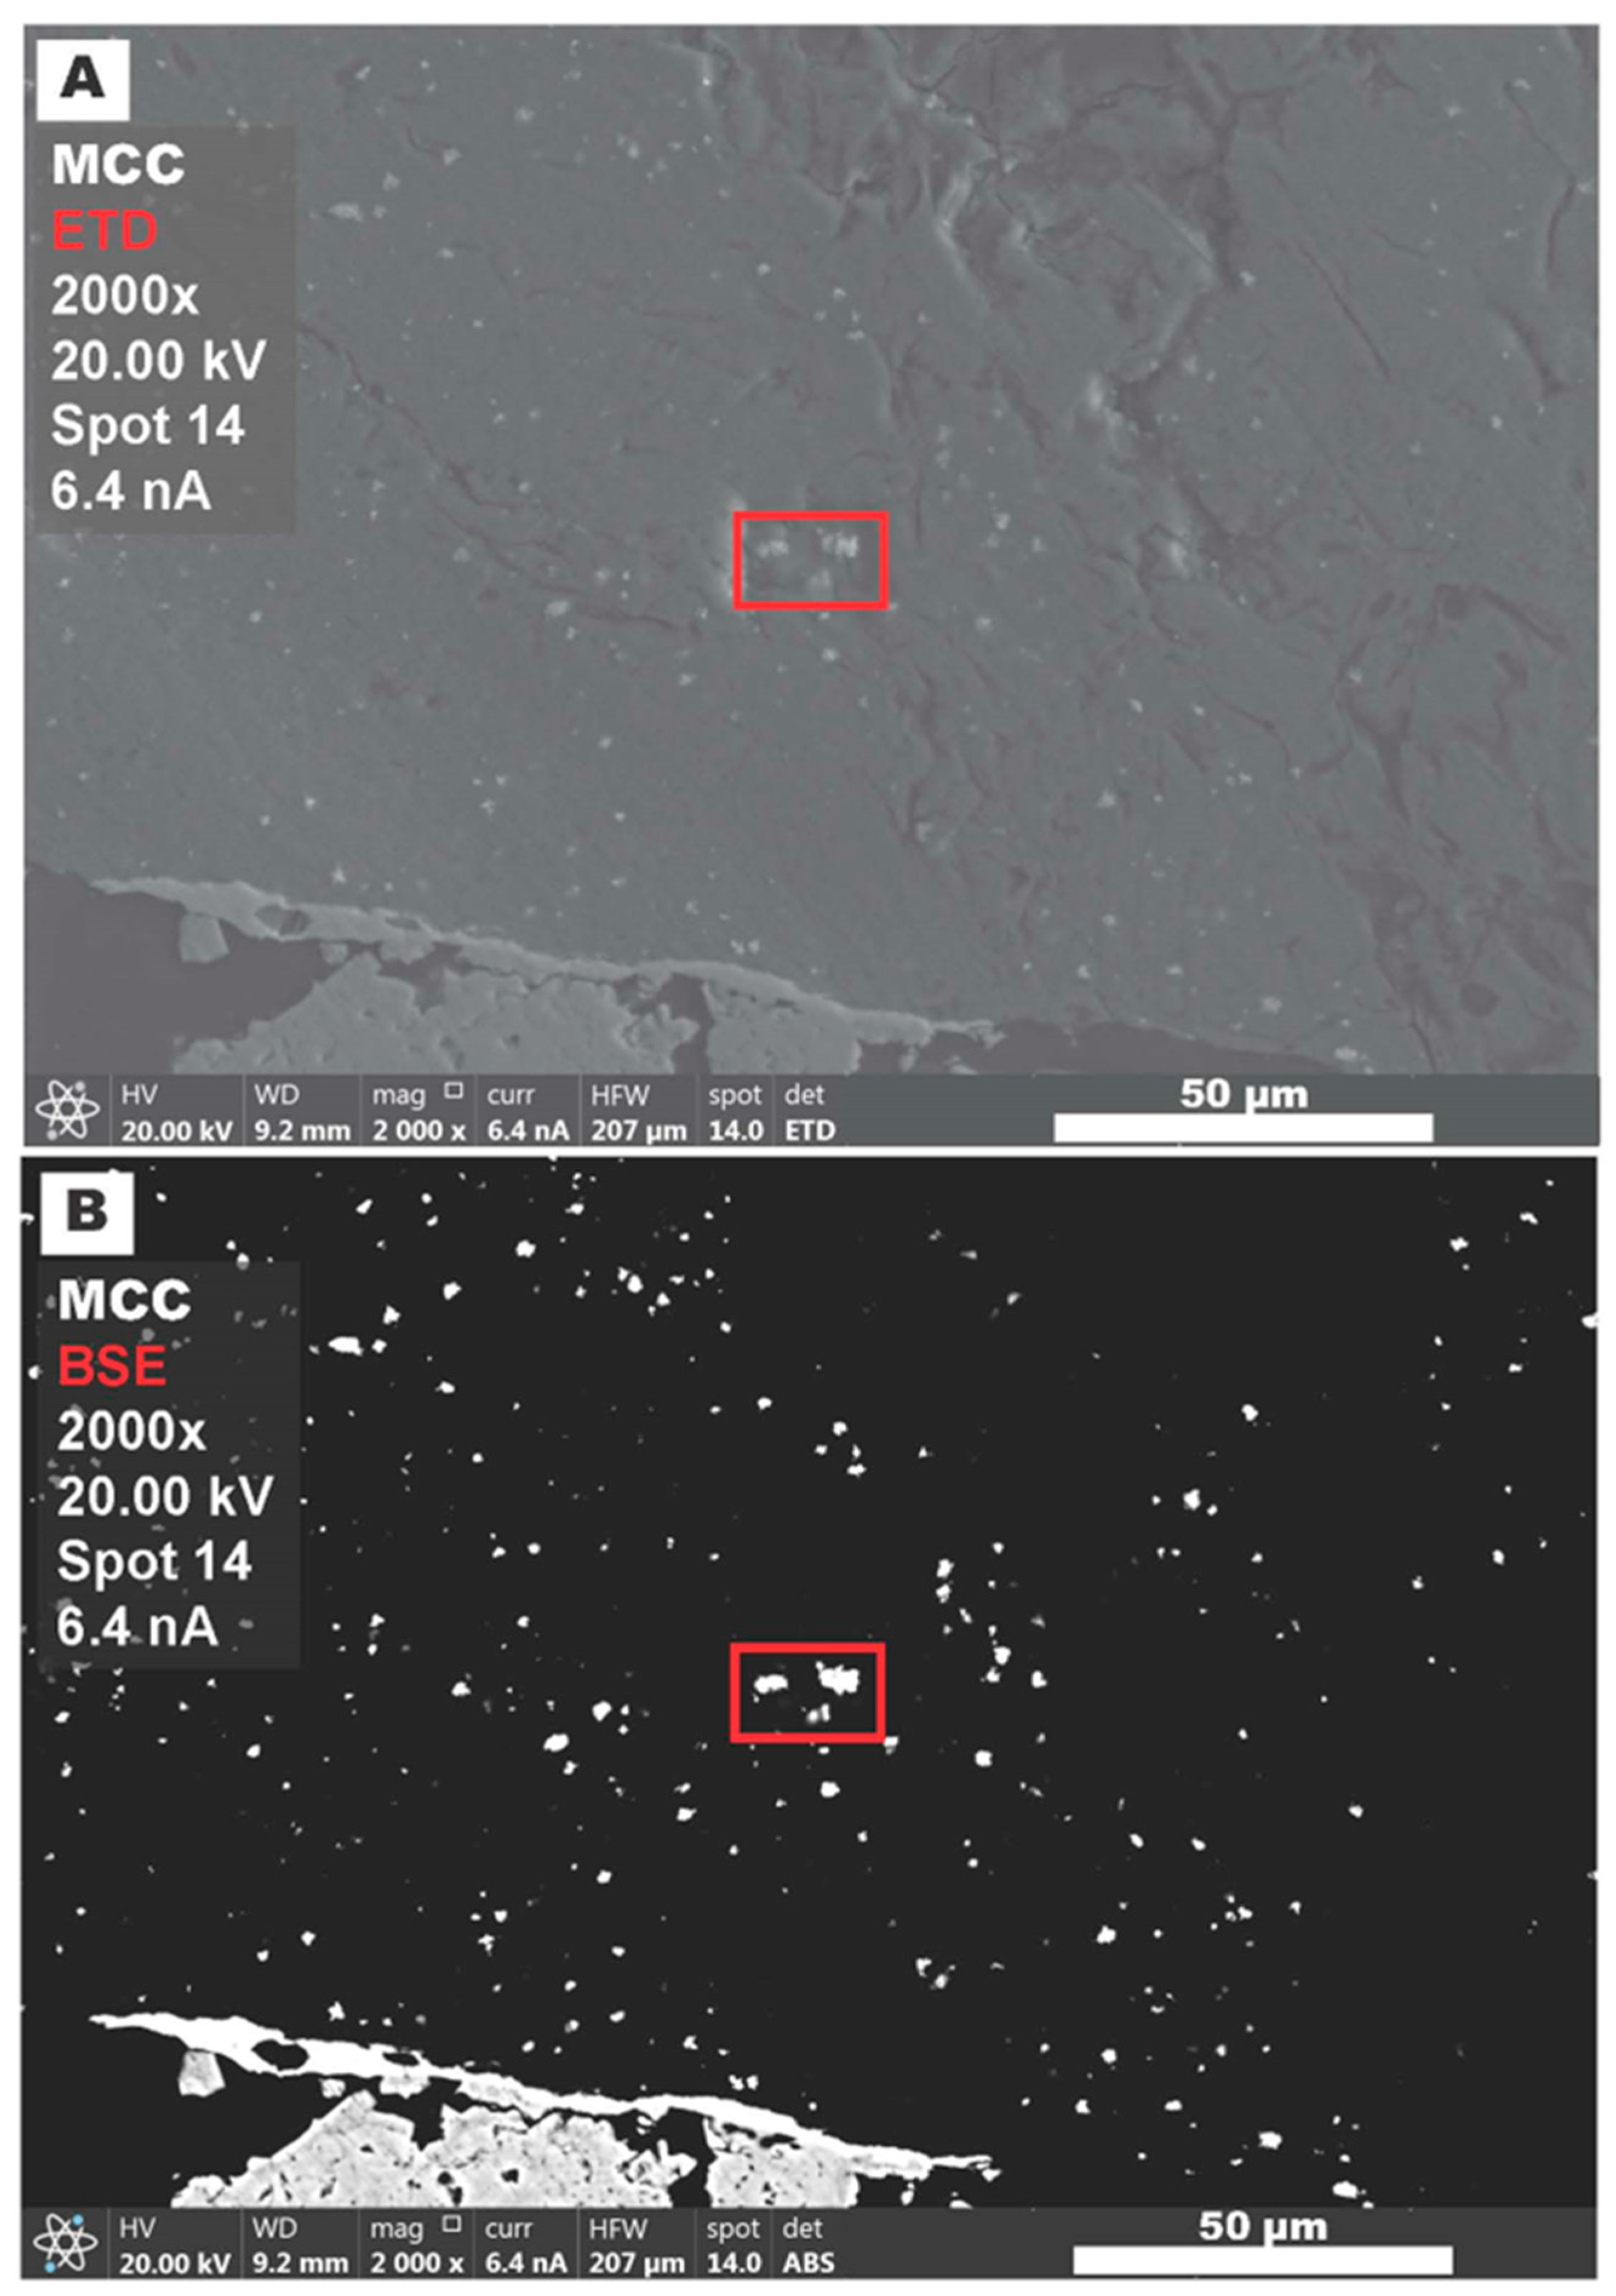
Figure 11.
BSE image of REE-bearing monazite (Mz) clay size grain field (white dispersed grains) in sample MC-C. Monazite clay size grains are concentrated primarily in clay matrix. Notably, REE-bearing monazites are not present in organic matter (Org).
Figure 11.
BSE image of REE-bearing monazite (Mz) clay size grain field (white dispersed grains) in sample MC-C. Monazite clay size grains are concentrated primarily in clay matrix. Notably, REE-bearing monazites are not present in organic matter (Org).
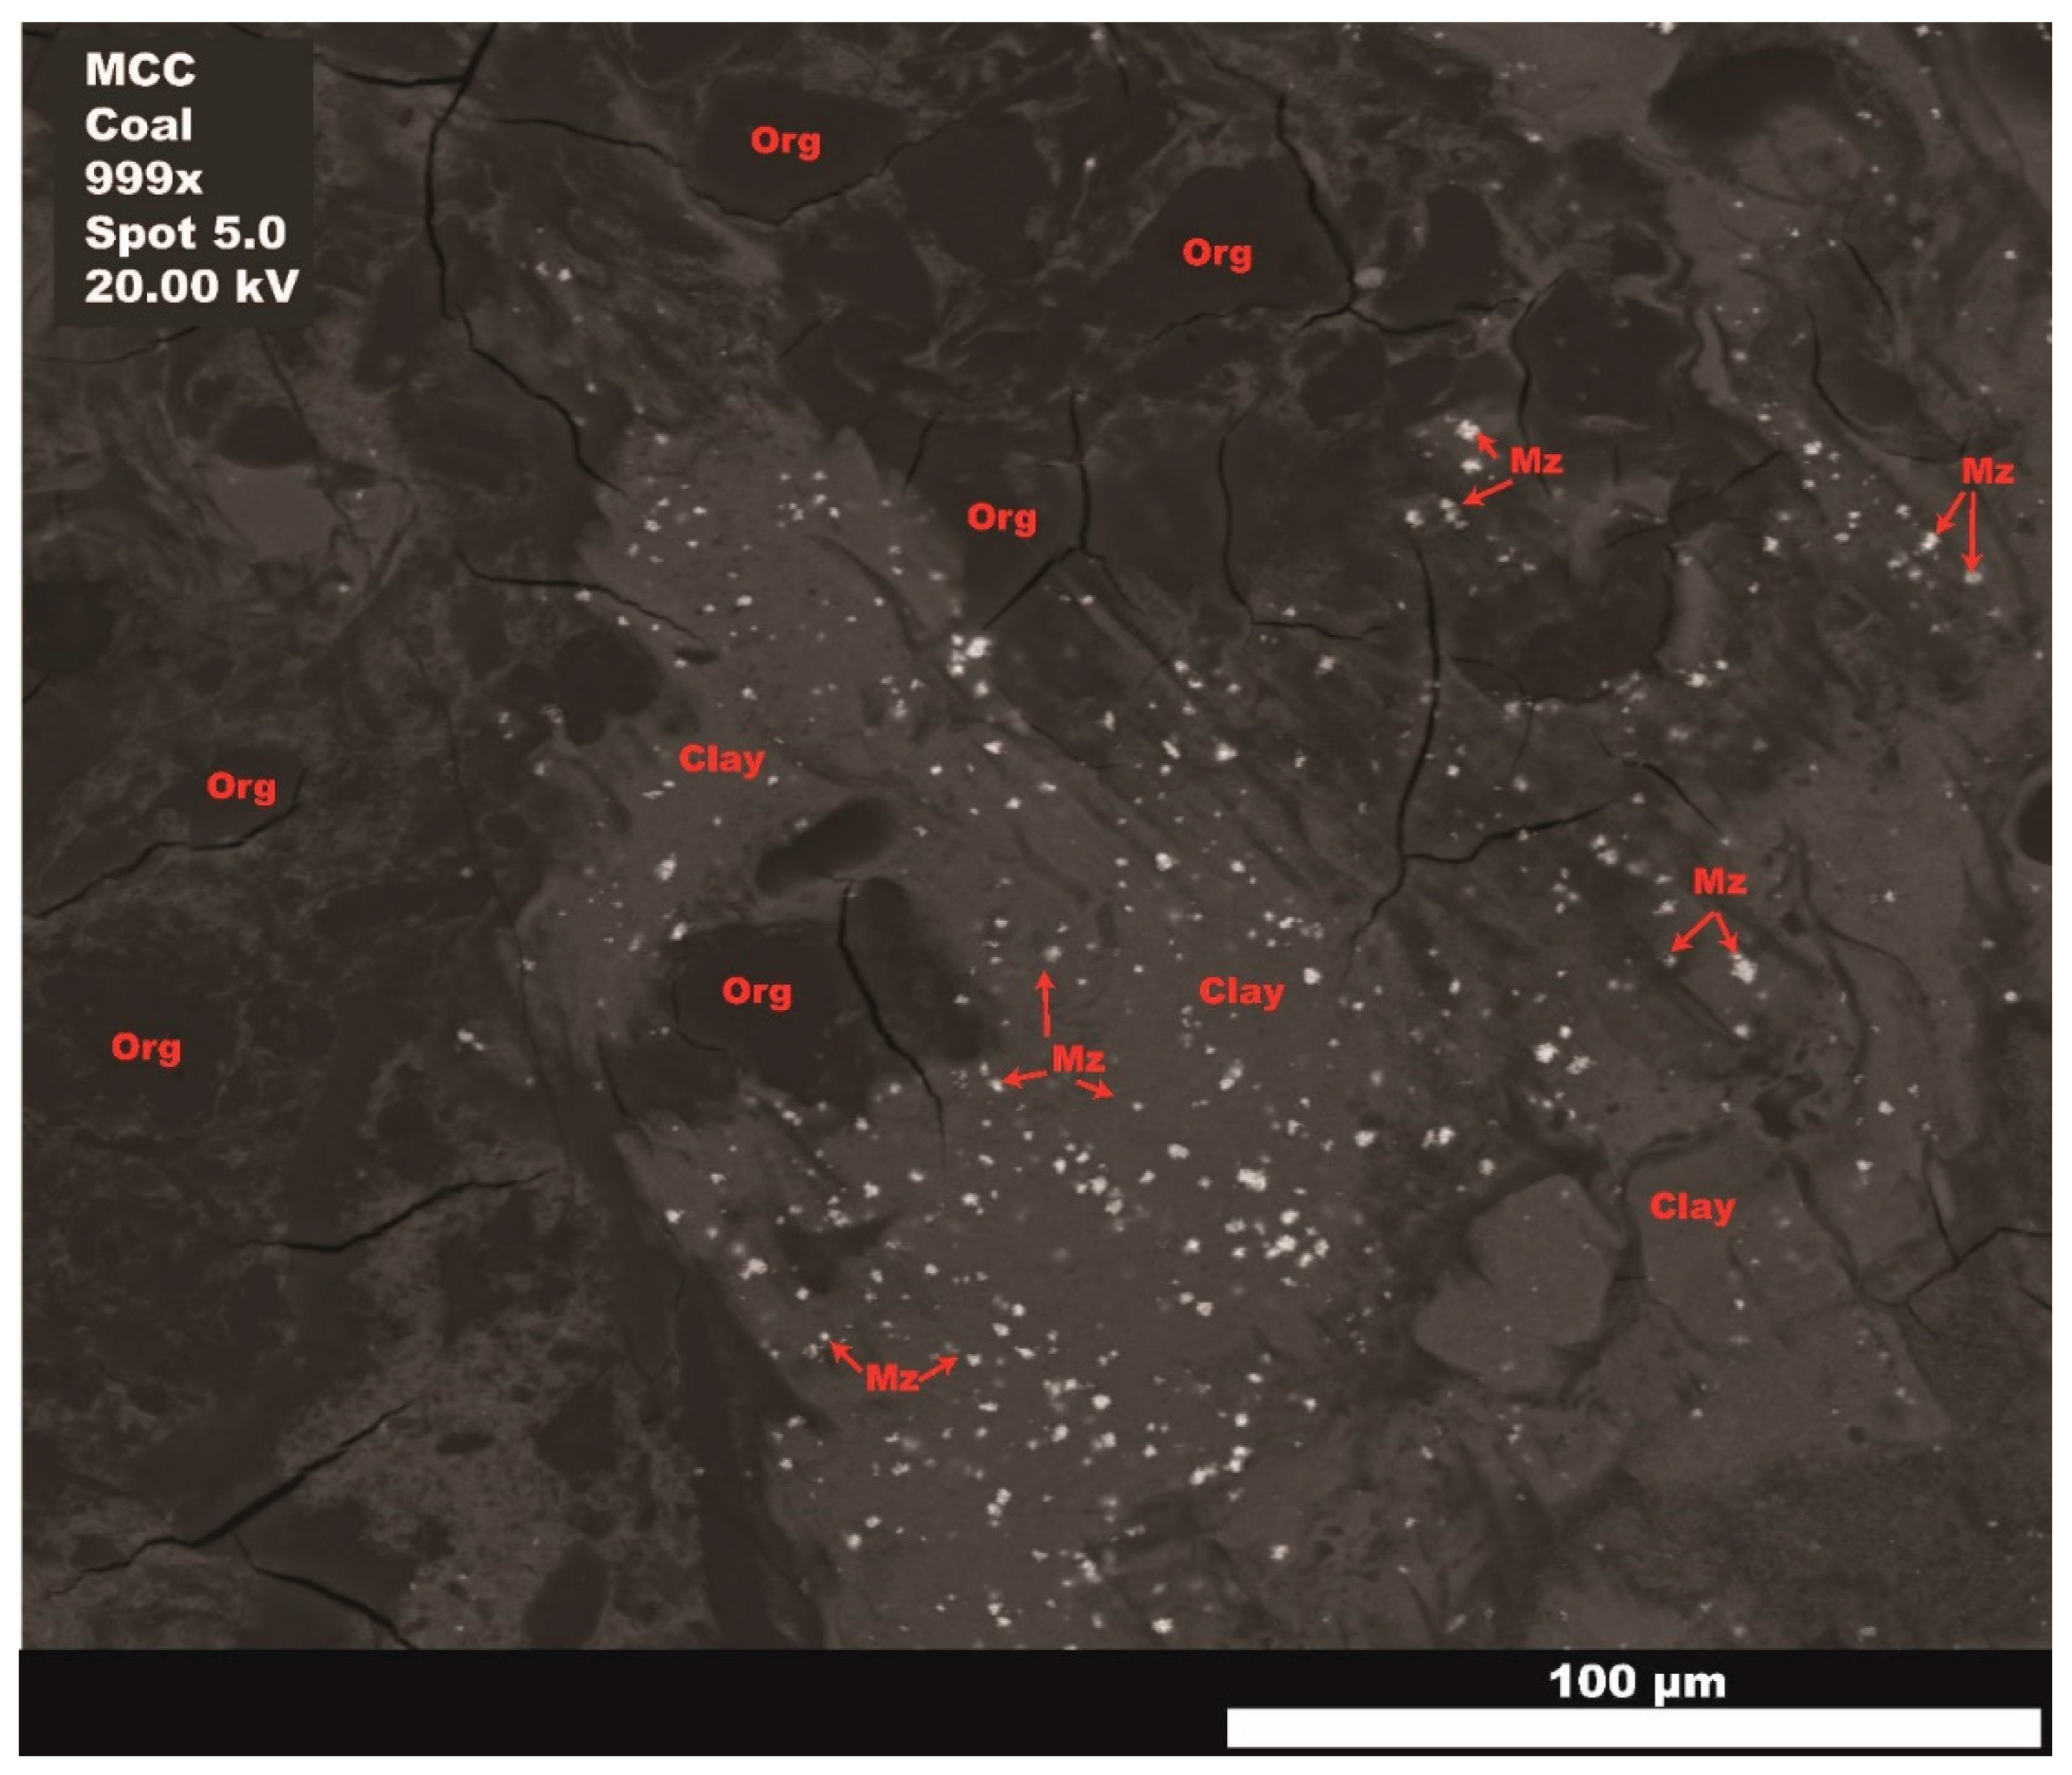
Figure 12.
A) BSE image of carbonaceous shale sample MC-G-02-03. Blue box represents the identified area of interest. B) Organic matter EDS spectral analysis elemental assemblages contain varying amounts of Si, Al, and Mg with fractions containing predominately C along with trace S and Na. Blue box represents where point and polygon detailed EDS analysis was completed. C) Red spectral EDS signature is representative of the entire imaged zone. Inset spectra shows higher than background (blue line) concentrations of REE Ce, La, Nd and Pr indicating slight enrichment within the organic matter.

Figure 13.
ICP-MS total REE concentrations normalized to UCC [56]. Samples show higher concentrations of LREE to HREE, particularly in coal samples.
Figure 13.
ICP-MS total REE concentrations normalized to UCC [56]. Samples show higher concentrations of LREE to HREE, particularly in coal samples.
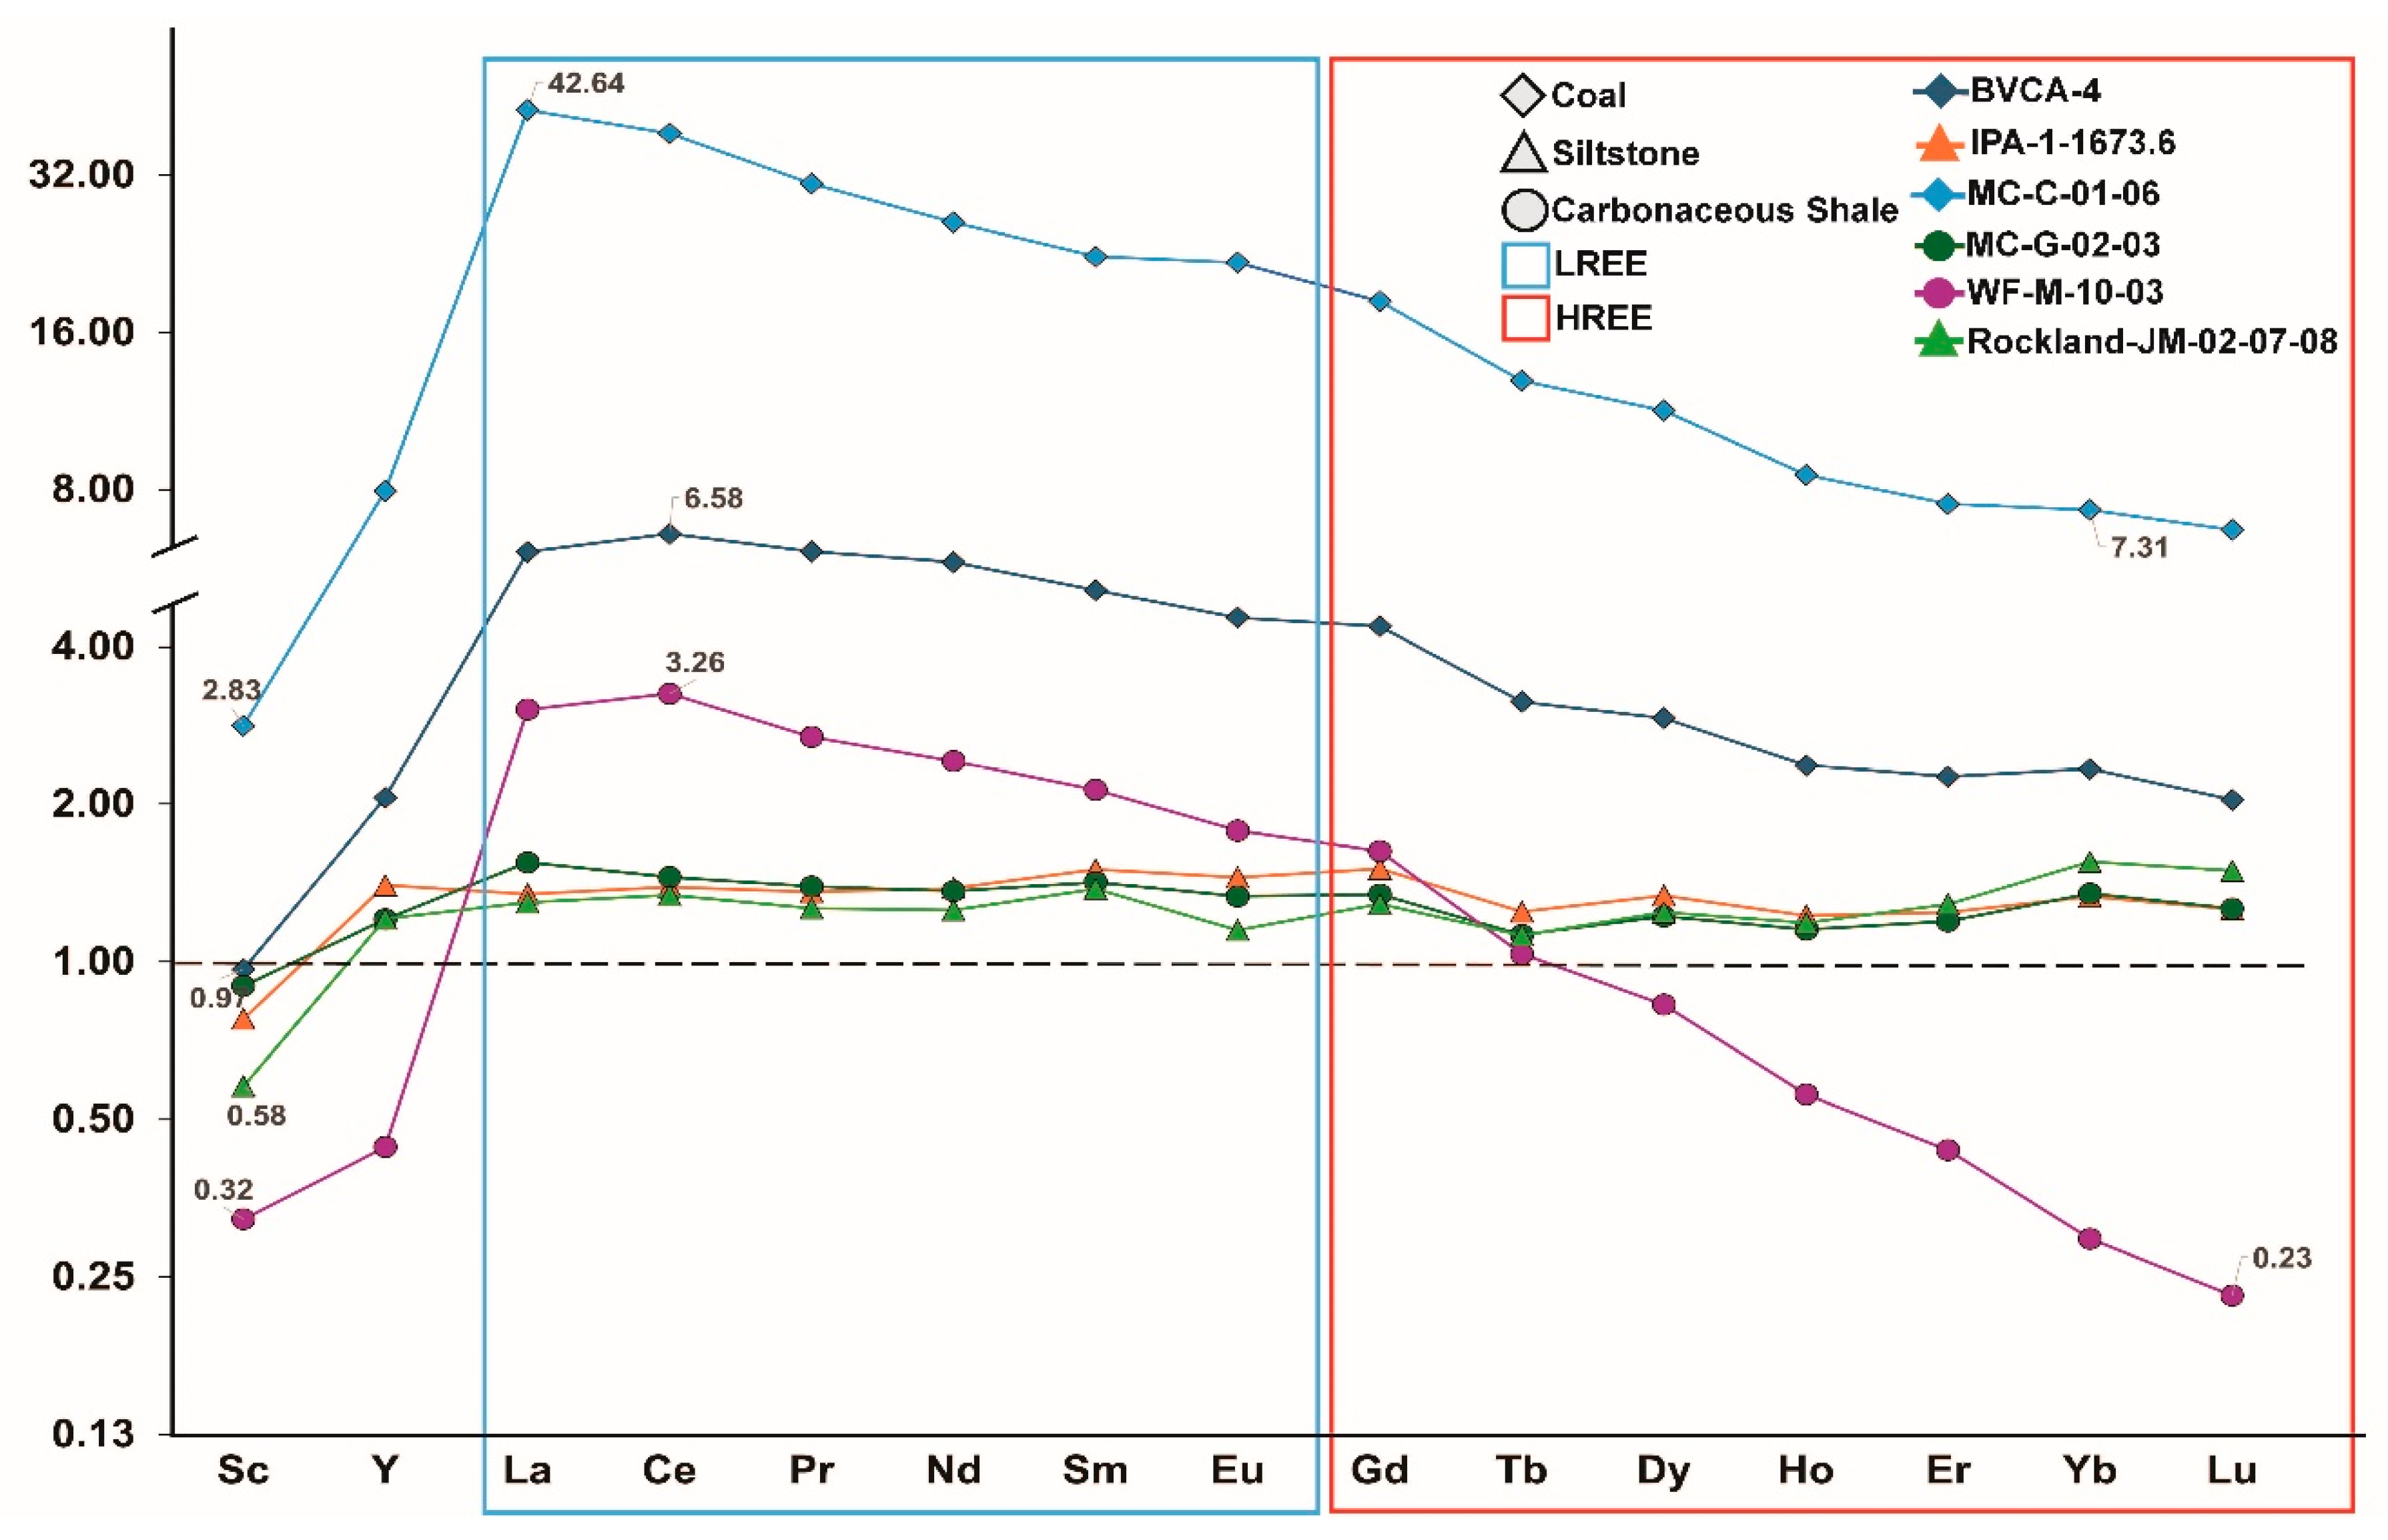
Figure 14.
REEN anomalies EuN, CeN, YN and GdN in study samples. Slightly anomalous values are at 1.0 ± < 0.1 while highly anomalous values are designated as 1.0 ± > 0.1 in the study samples.
Figure 14.
REEN anomalies EuN, CeN, YN and GdN in study samples. Slightly anomalous values are at 1.0 ± < 0.1 while highly anomalous values are designated as 1.0 ± > 0.1 in the study samples.
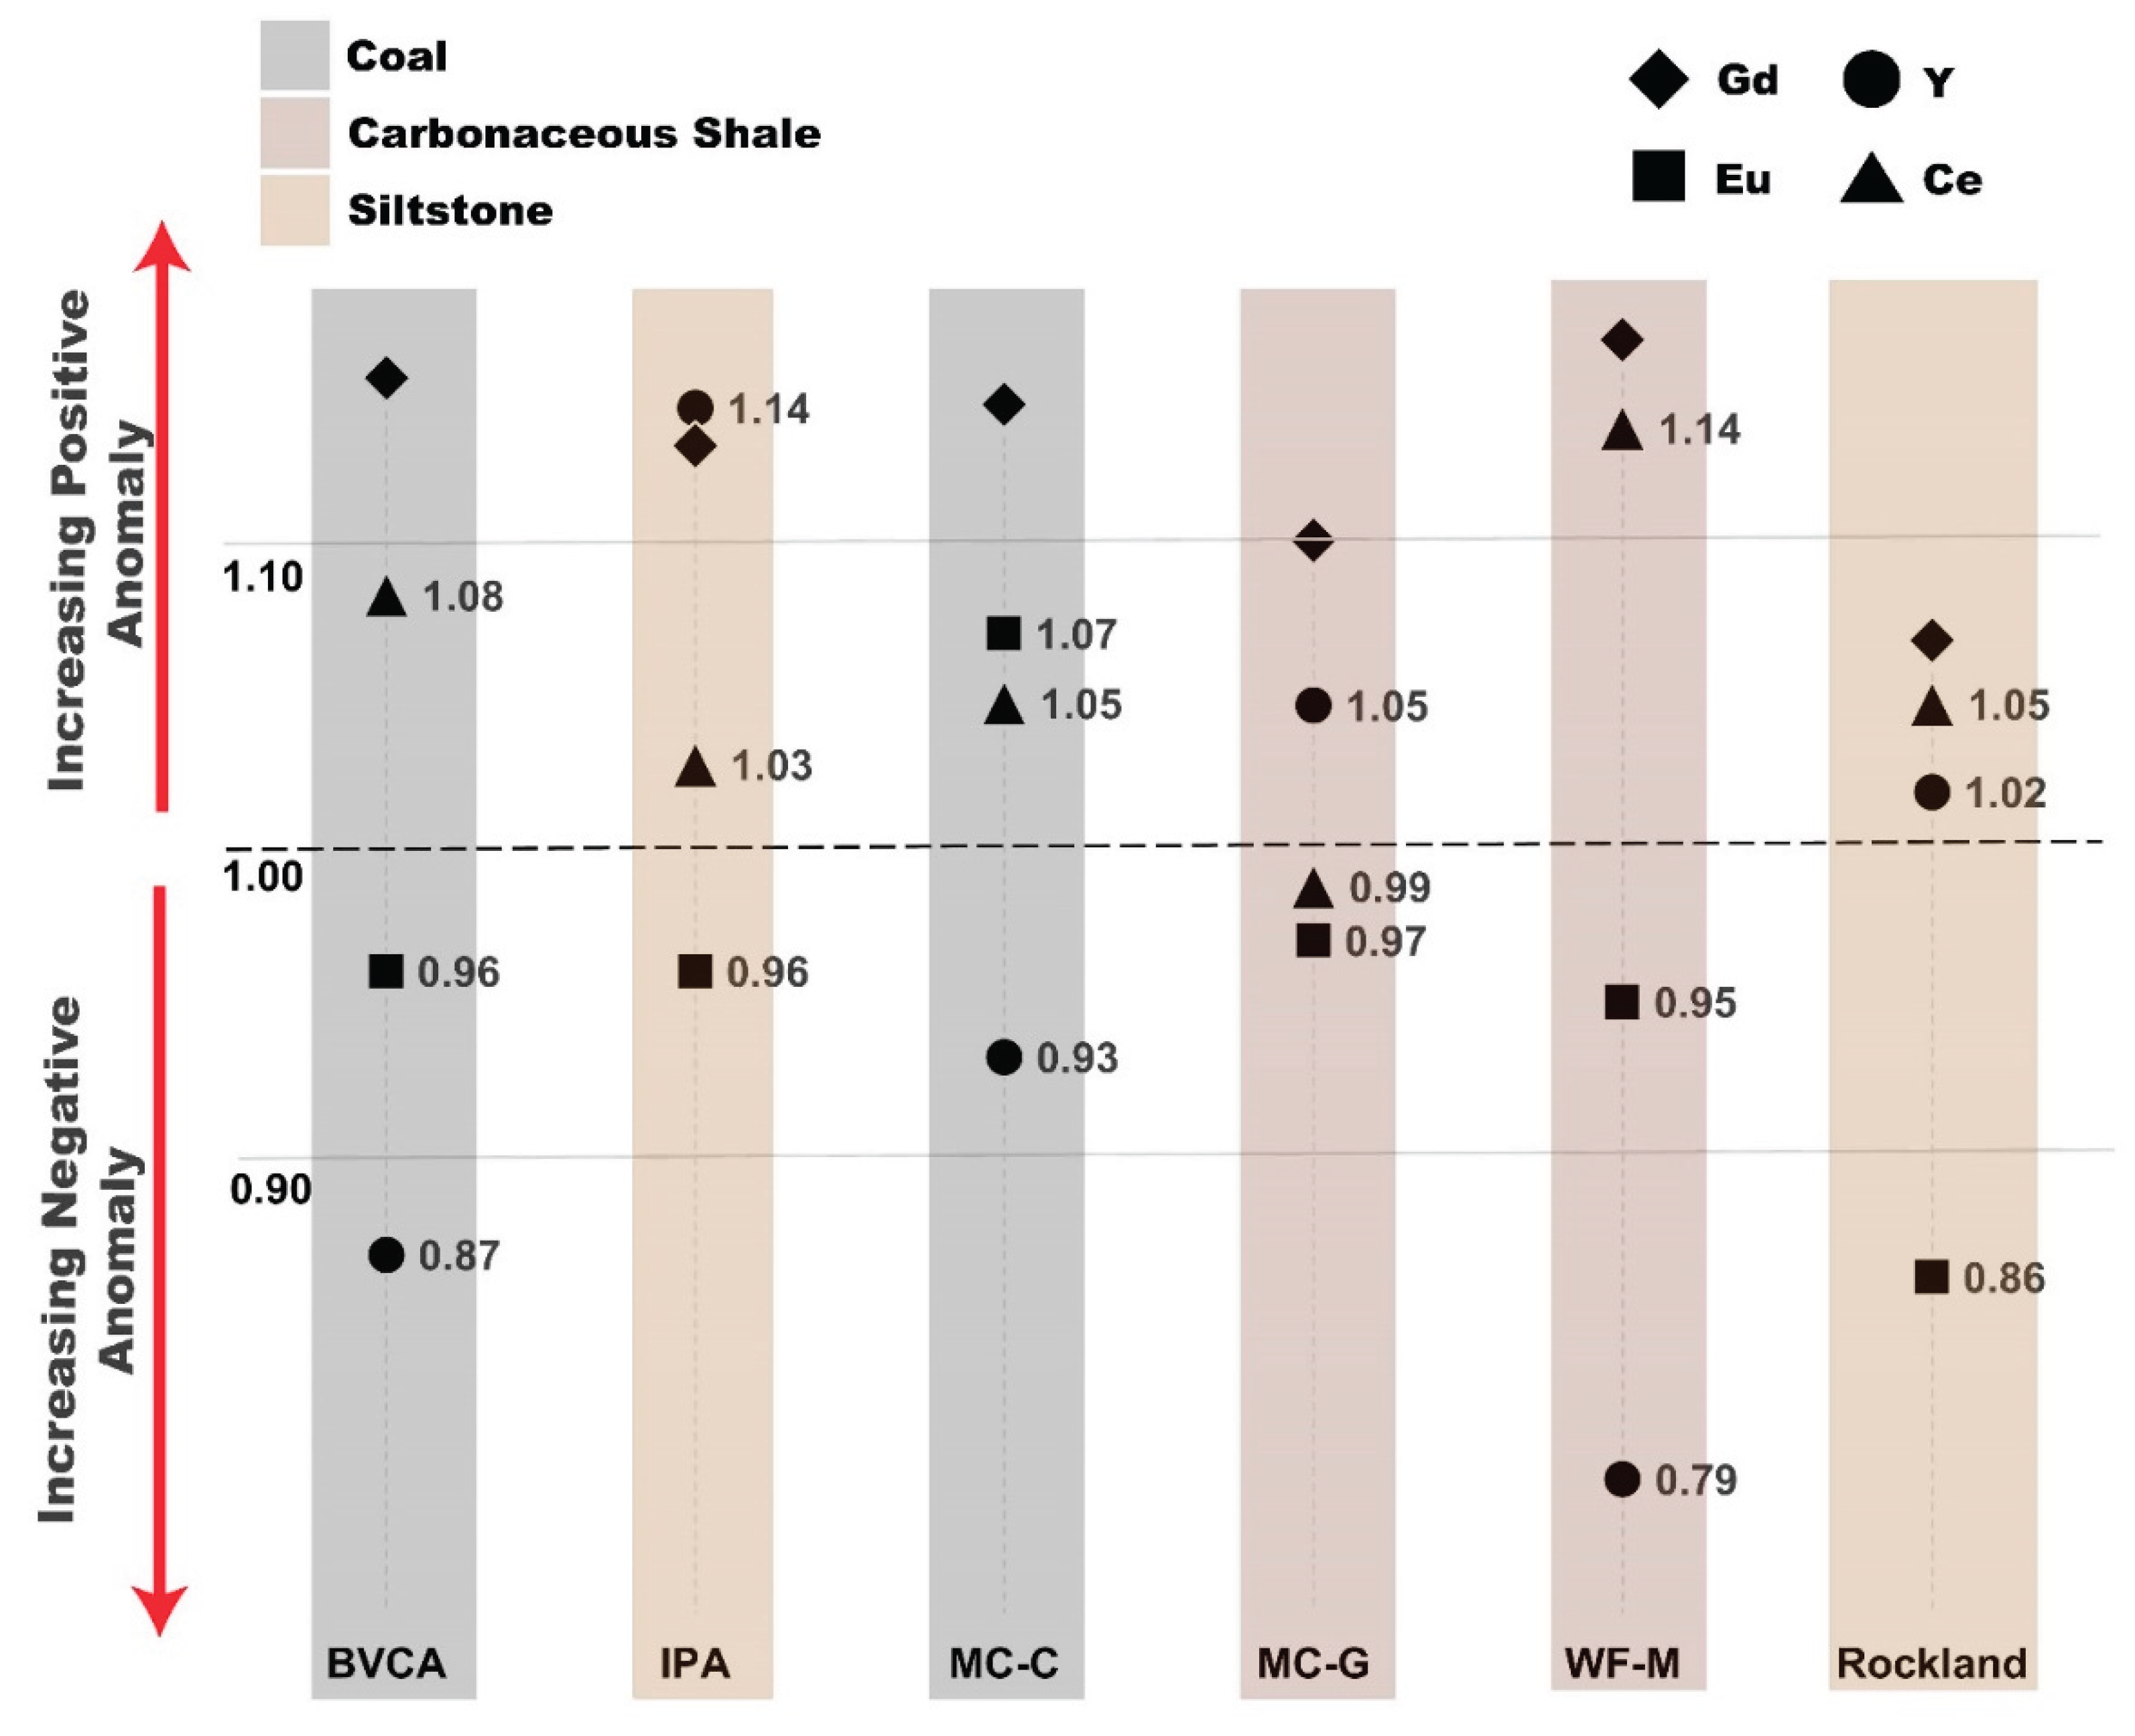
Figure 15.
Proposed REE-enrichment mechanisms in coal and coal adjacent strata A) Depositional environmental scenario’s leading to REE-enrichment from volcanic ash fall (A-1), detrital input (A-2) and organic uptake in developing peat mires (A-3). B) Post depositional REE-enrichment mechanisms with coal formation during early (B-1) to late diagenesis (B-2, 3). Figure is a visual representation based on compiling interpretations from previous work [12,16,29,30,31,32,60,61,62].
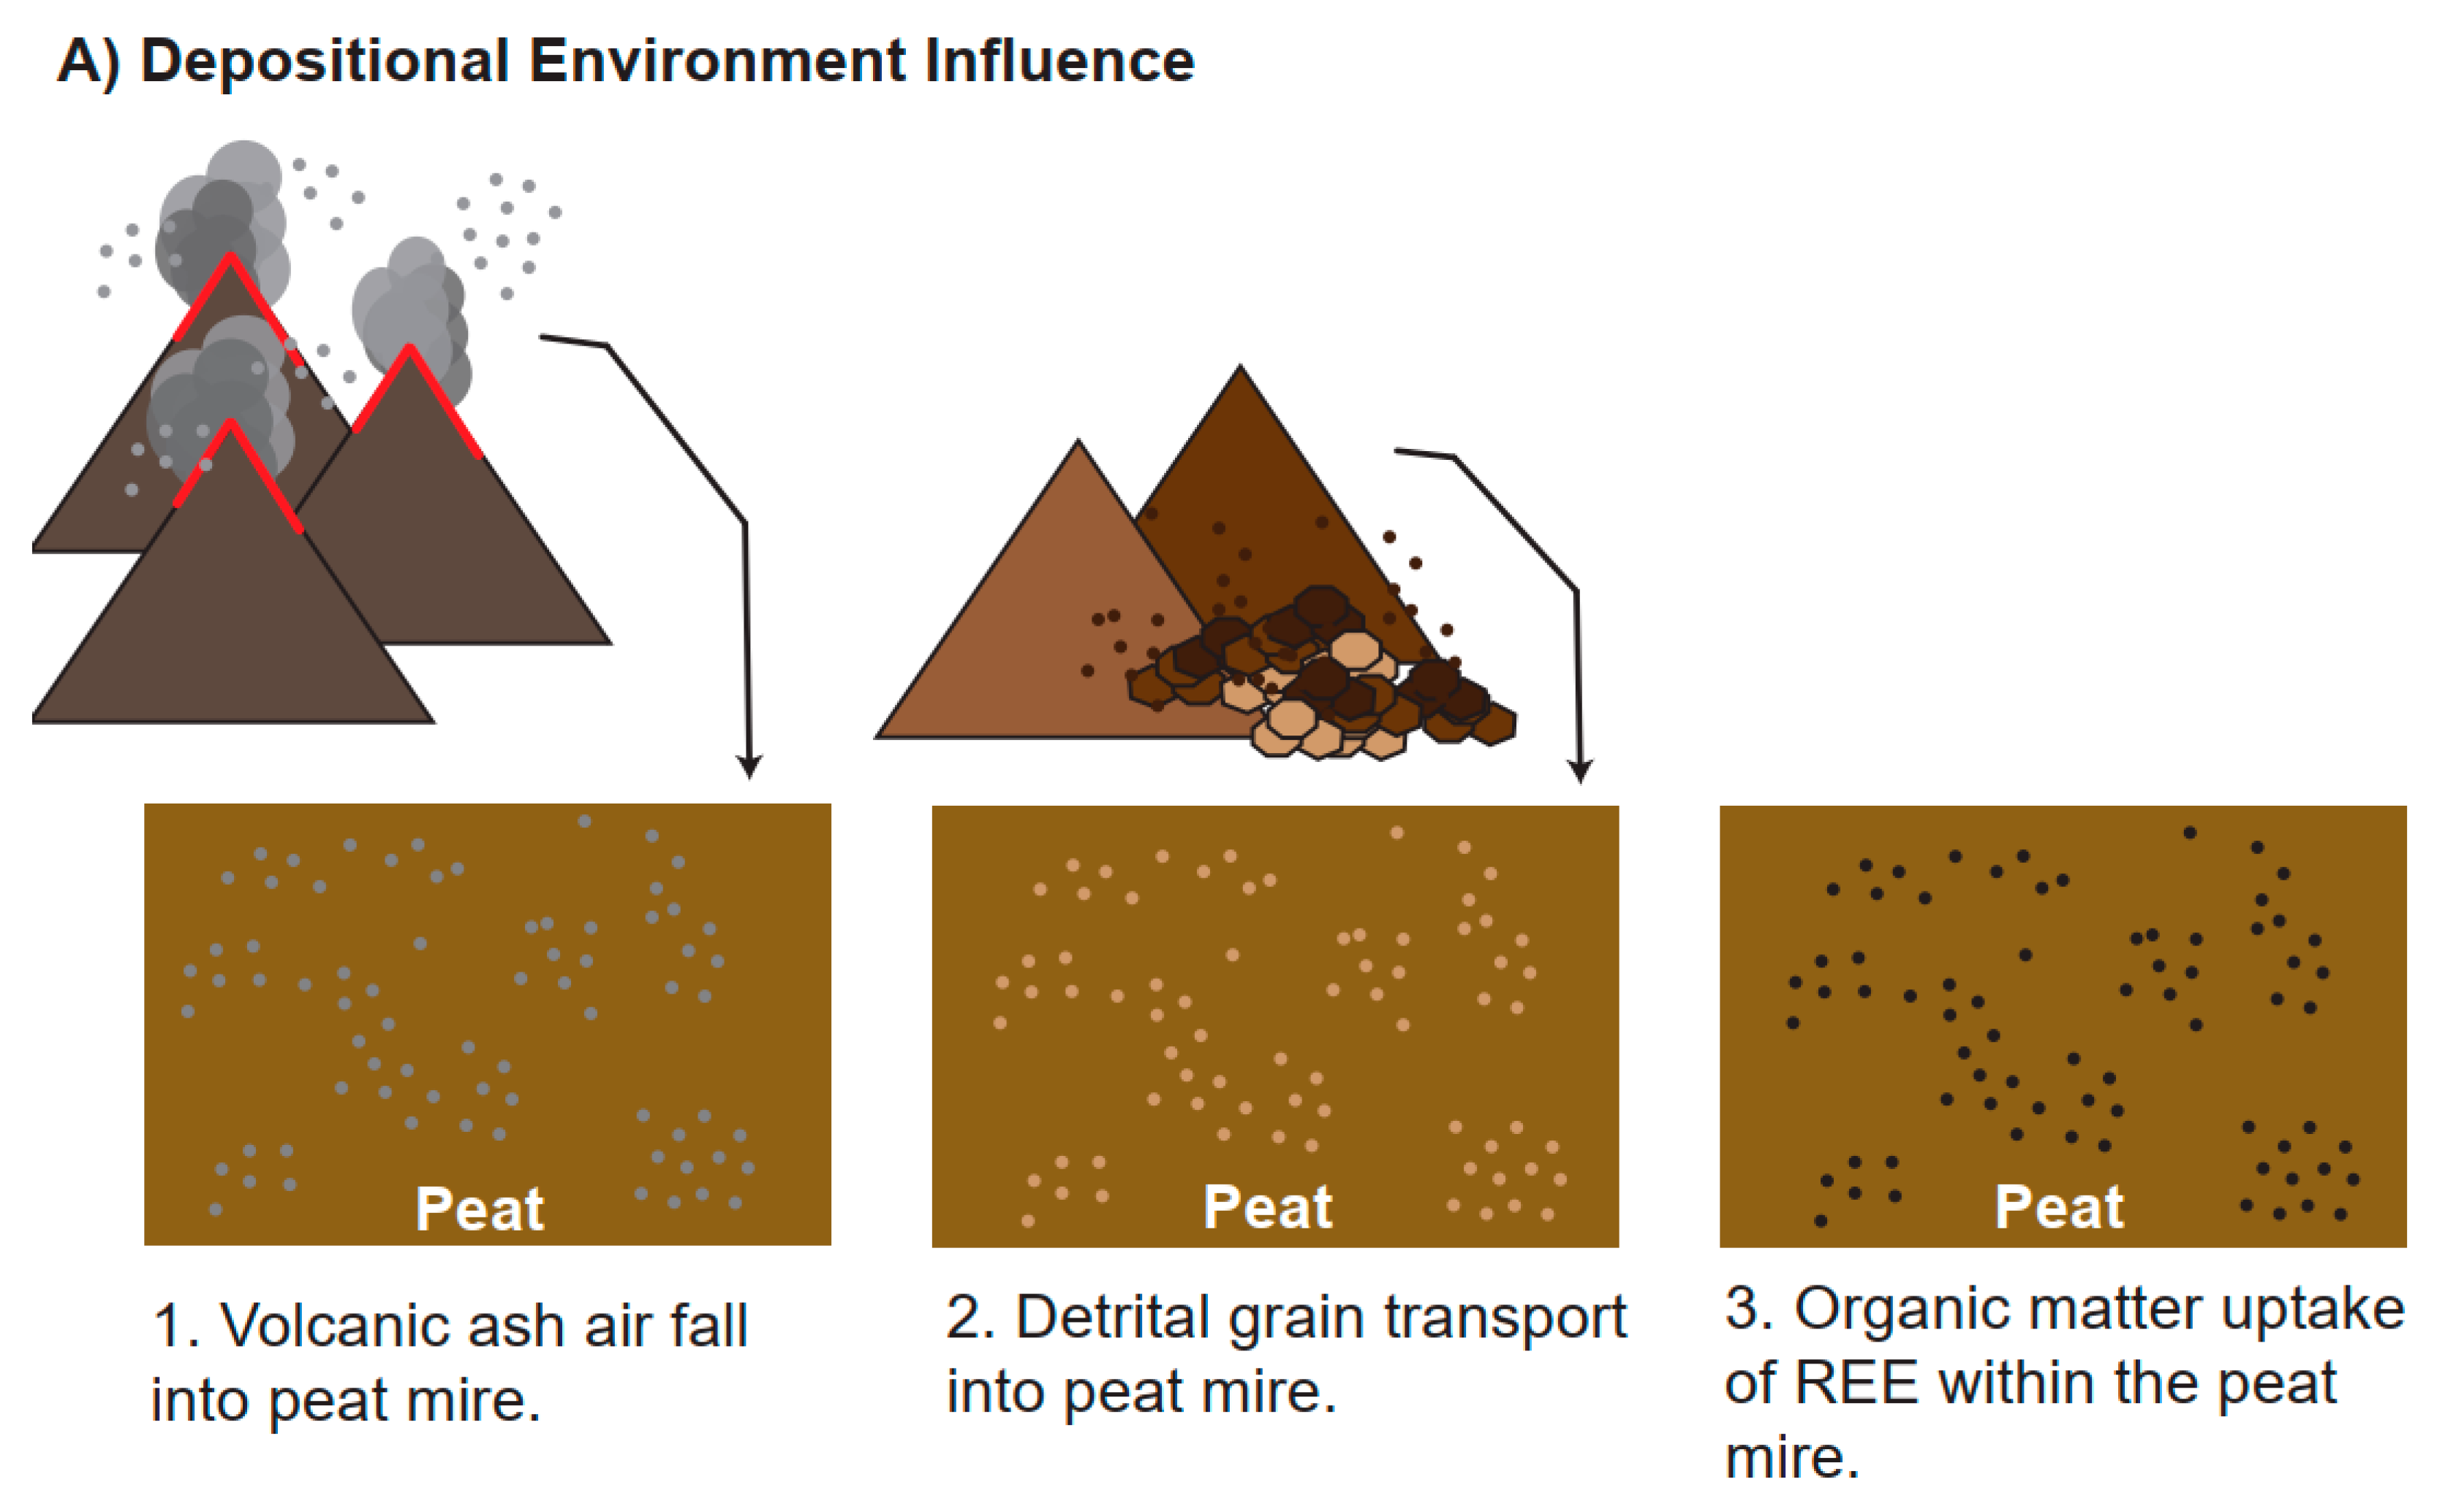
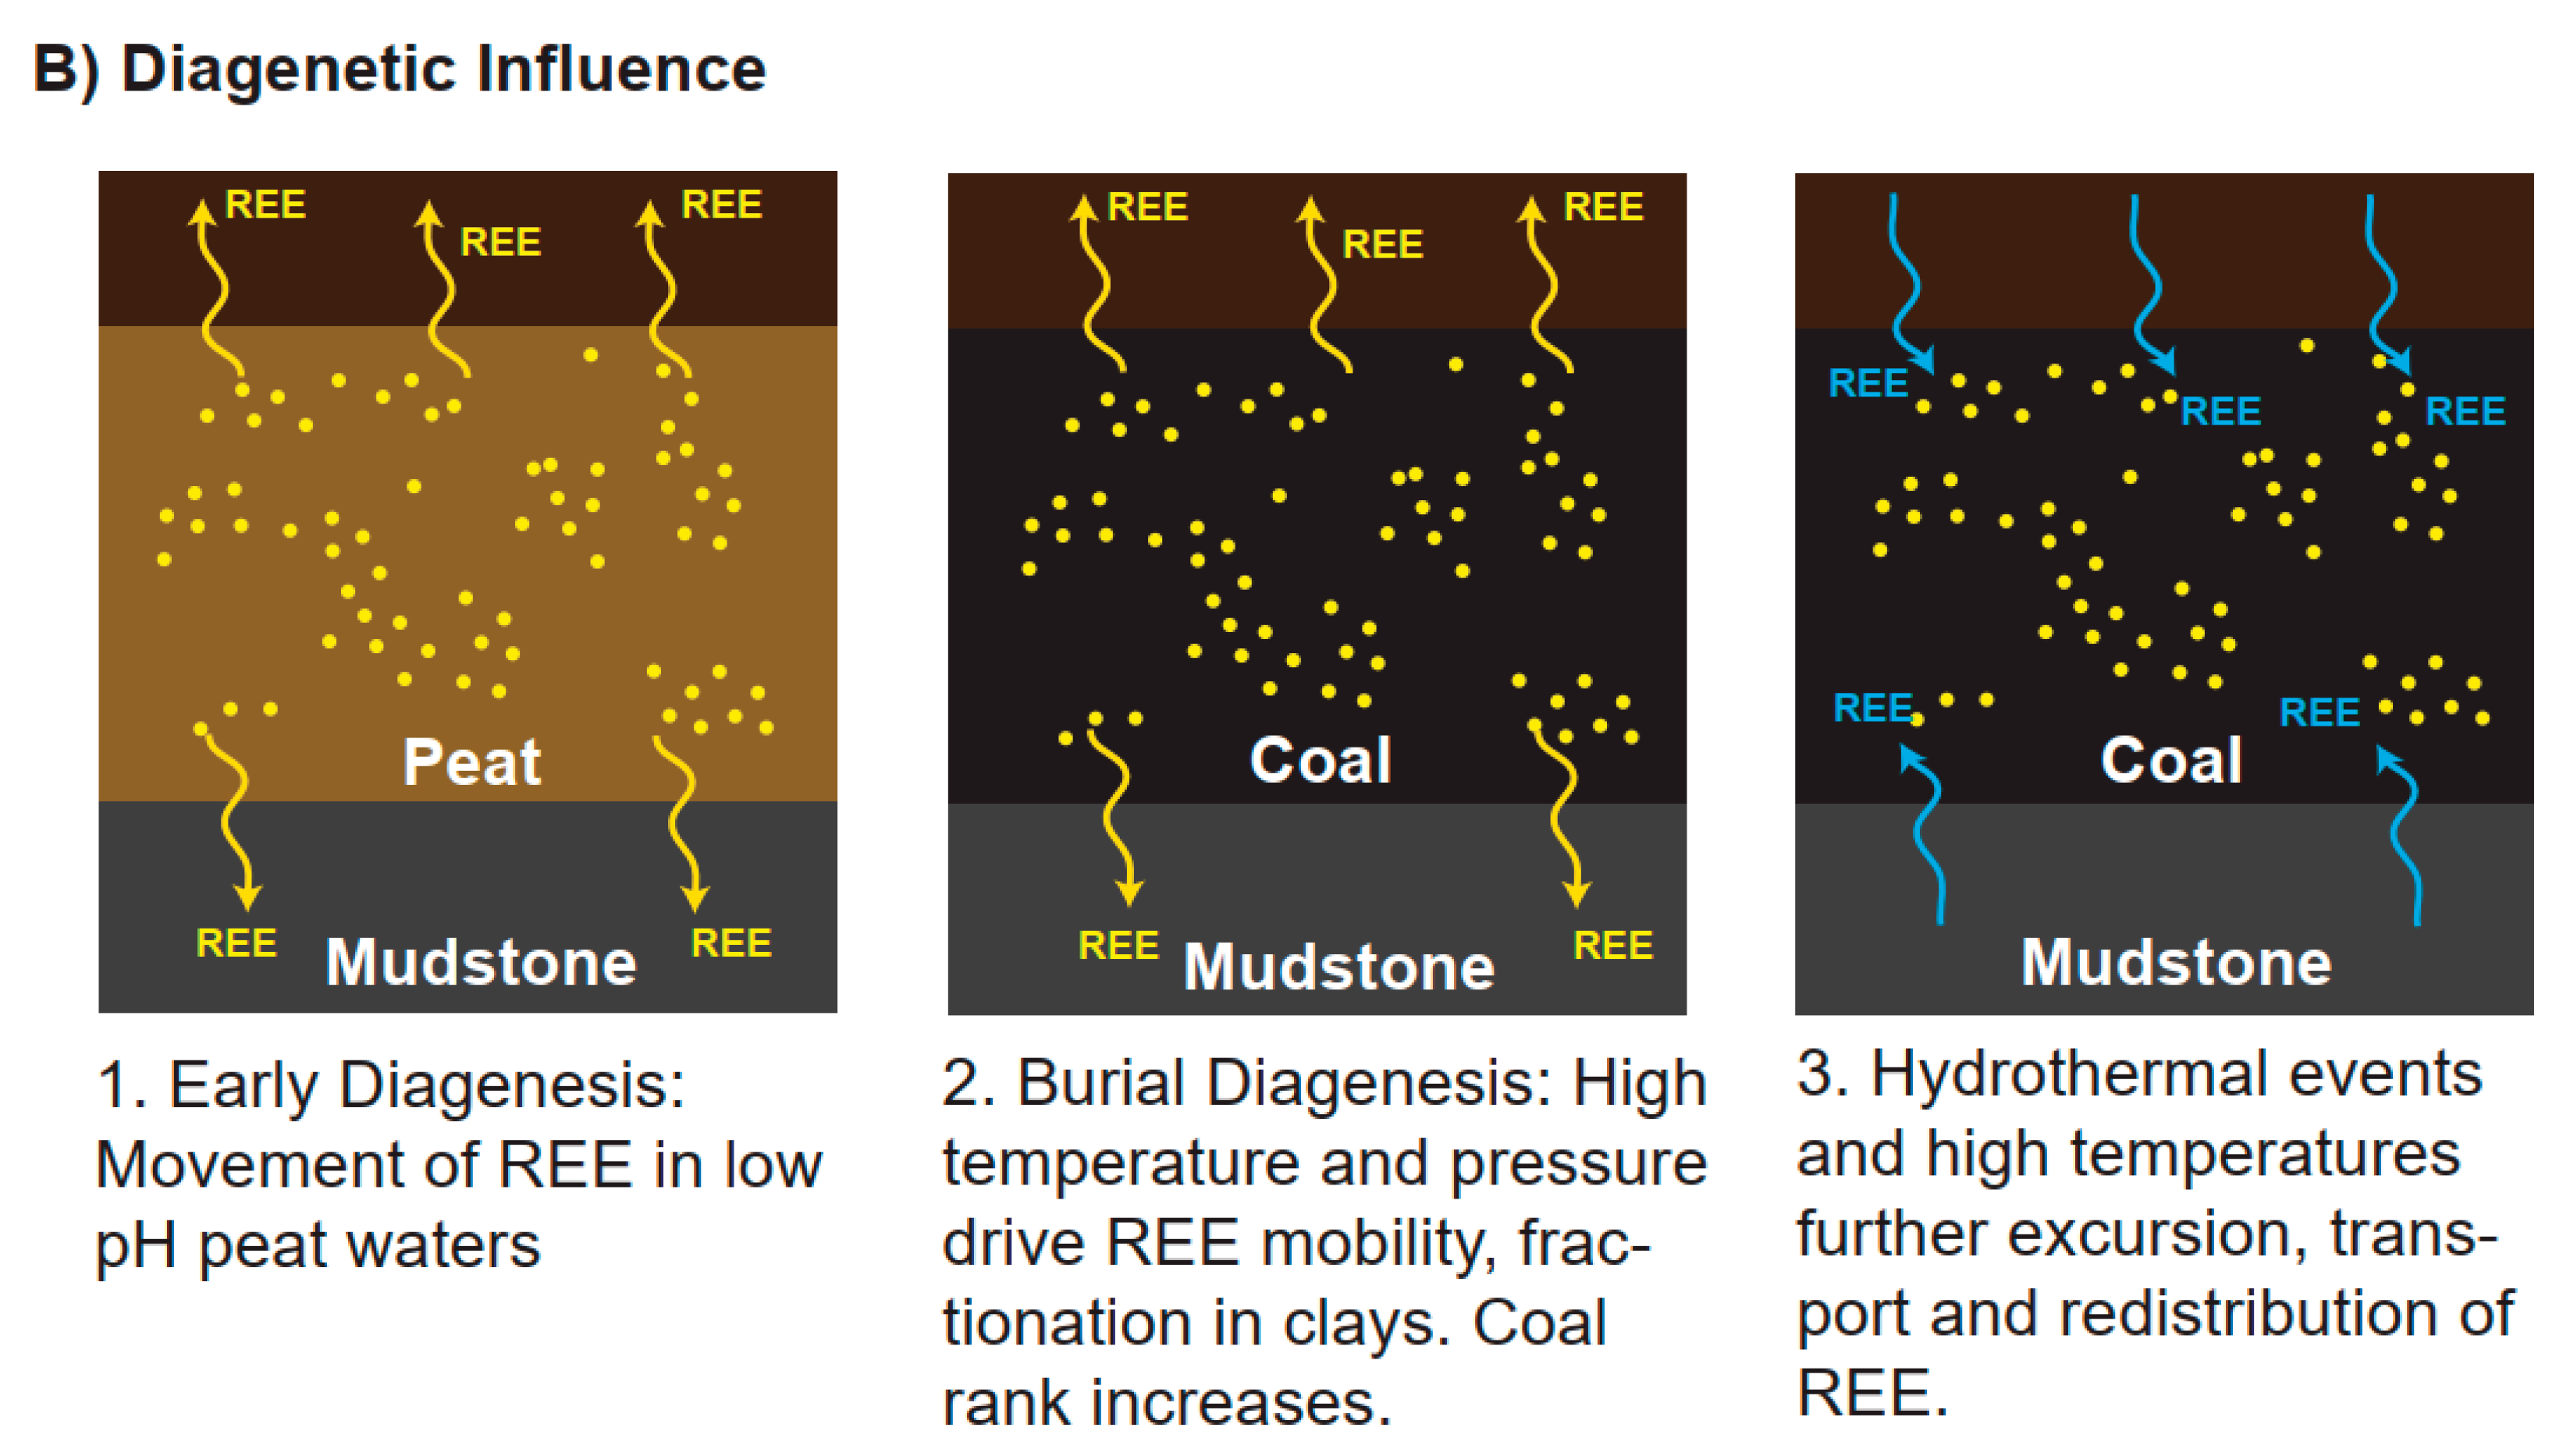

Table 1.
Samples selected for SEM-EDS analysis.
| Sample | Formation | Geologic Age | Simplified Lithology |
Coal Field | Location Type | Measured Height/Depth (m) | Named Coal Seam | Adjacency to Coal | Ash % 1 | ICP-MS TREE | pXRF REE |
|---|---|---|---|---|---|---|---|---|---|---|---|
| BVCA-4 | Blackhawk | Campanian | Coal | Wasatch | Mine | - | Castlegate A | - | 23 | 934.07 | 473.00 |
| IPA-1-1673.6 | Blackhawk | Campanian | Siltstone | Book Cliffs | Core | 510.1 | Sunnyside | Below | - | 244.32 | 3038.33 |
| MC-C-01-06 | Ferron | Turonian | Coal | Emery | Outcrop | 0.1 | C | Below | 16 | 5165.65 | 1711.40 |
| MC-G-02-03 | Ferron | Turonian | Carbonaceous Shale | Emery | Outcrop | 0.9 | G | Within | 84 | 250.01 | 1852.00 |
| WF-M-10-03 | Ferron | Turonian | Carbonaceous Shale | Emery | Mine | 0.6 | M | Above | 87 | 421.70 | 873.90 |
| Rockland-JM-02-07-08 | Ferron | Turonian | Siltstone | Emery | Mine | 2.10 | J | Above | 92 | 227.13 | 867.78 |
1 Based on ICP-MS analysis.
Table 2.
REEN, REE normalized to average UCC values based on Rudnick and Gao (2003) [57] and REEA, REE absolute concentrations in ppm as measured by ICP-MS.
Table 2.
REEN, REE normalized to average UCC values based on Rudnick and Gao (2003) [57] and REEA, REE absolute concentrations in ppm as measured by ICP-MS.
| Sample | Sc | Y | La | Ce | Pr | Nd | Sm | Eu | Gd | Tb | Dy | Ho | Er | Yb | Lu | tREE |
|---|---|---|---|---|---|---|---|---|---|---|---|---|---|---|---|---|
| BVCA-4N | 0.97 | 2.06 | 6.07 | 6.58 | 6.09 | 5.81 | 5.14 | 4.55 | 4.38 | 3.14 | 2.92 | 2.37 | 2.25 | 2.33 | 2.04 | 56.70 |
| BVCA-4A | 13.54 | 43.20 | 188.30 | 414.63 | 43.21 | 156.77 | 24.14 | 4.55 | 17.53 | 2.20 | 11.40 | 1.97 | 5.19 | 4.66 | 0.63 | 931.91 |
| IPA-1-1673.6N | 0.78 | 1.40 | 1.35 | 1.39 | 1.36 | 1.38 | 1.50 | 1.45 | 1.51 | 1.25 | 1.34 | 1.23 | 1.24 | 1.33 | 1.26 | 19.77 |
| IPA-1-1673.6A | 10.89 | 29.44 | 41.79 | 87.62 | 9.66 | 37.36 | 7.06 | 1.45 | 6.02 | 0.87 | 5.22 | 1.02 | 2.86 | 2.67 | 0.39 | 244.32 |
| MC-C-01-06N | 2.83 | 7.95 | 42.64 | 38.46 | 30.81 | 25.97 | 22.33 | 21.76 | 18.35 | 12.93 | 11.33 | 8.53 | 7.51 | 7.31 | 6.70 | 265.41 |
| MC-C-01-06A | 39.57 | 167.01 | 1321.88 | 2422.88 | 218.74 | 701.14 | 104.96 | 21.76 | 73.42 | 9.05 | 44.18 | 7.08 | 17.28 | 14.63 | 2.08 | 5165.65 |
| MC-G-02-03N | 0.90 | 1.21 | 1.55 | 1.45 | 1.39 | 1.37 | 1.42 | 1.33 | 1.35 | 1.13 | 1.22 | 1.15 | 1.20 | 1.35 | 1.26 | 19.28 |
| MC-G-02-03A | 12.59 | 25.33 | 48.04 | 91.55 | 9.90 | 36.87 | 6.67 | 1.33 | 5.38 | 0.79 | 4.76 | 0.96 | 2.75 | 2.70 | 0.39 | 250.01 |
| WF-M-10-03N | 0.32 | 0.44 | 3.04 | 3.26 | 2.69 | 2.42 | 2.13 | 1.78 | 1.63 | 1.04 | 0.83 | 0.56 | 0.44 | 0.30 | 0.23 | 21.08 |
| WF-M-10-03A | 4.51 | 9.30 | 94.11 | 205.08 | 19.10 | 65.24 | 10.00 | 1.78 | 6.51 | 0.72 | 3.23 | 0.46 | 1.00 | 0.59 | 0.07 | 421.70 |
| Rockland-JM-02-07-08N | 0.58 | 1.21 | 1.30 | 1.34 | 1.27 | 1.26 | 1.38 | 1.15 | 1.29 | 1.12 | 1.24 | 1.19 | 1.29 | 1.55 | 1.49 | 18.66 |
| Rockland-JM-02-07-08A | 8.09 | 25.38 | 40.26 | 84.56 | 8.98 | 33.90 | 6.48 | 1.15 | 5.16 | 0.79 | 4.85 | 0.99 | 2.96 | 3.11 | 0.46 | 227.13 |
Table 3.
Identified REE-enriched grains from SEM-EDS analysis.
| Sample | Formation | Lithology | # grains processed (EDS) | # REE enriched grains | Size | Size Fraction |
|---|---|---|---|---|---|---|
| BVCA-4 | Blackhawk | Coal | 33 | 5 | 5-2 μm | Clay Size |
| IPA-1-1673.6 | Blackhawk | Siltstone | 20 | 1 | 30-5 μm | Silt Size |
| MC-C-01-06 | Ferron | Coal | 26 | 3 | 5-2 μm | Clay Size |
| MC-G-02-03 | Ferron | Carbonaceous Shale | 21 | 2 | <2 μm | Organic |
| WF-M-10-03 | Ferron | Carbonaceous Shale | 17 | 1 | 30-5 μm | Silt Size |
| Rockland-JM-02-07-08 | Ferron | Siltstone | 18 | 3 | 30-5 μm | Silt Size |
Table 4.
Identified REE-enriched grains.
| Sample | Formation | Lithology | REE Bearing Minerals Identified |
|---|---|---|---|
| BVCA-4 | Blackhawk | Coal | La, Ce, Nd clusters of phosphate clay size grains (≤5 µm) found in zones of clay matrix (<1 µm) |
| IPA-1-1673.6 | Blackhawk | Siltstone | Ce bearing monazite grain >10 µm |
| MC-C-01-06 | Ferron | Coal | La, Ce, Pr, Nd clusters of monazite clay size grains (≤5 µm) throughout zones clay matrix (<1 µm) |
| MC-G-02-03 | Ferron | Carbonaceous Shale | La, Ce, Pr, Nd unevenly dispersed throughout two small (<1 µm) zones of organic matrix |
| WF-M-10-03 | Ferron | Carbonaceous Shale | La, Ce, Nd bearing monazite grain >10 µm; primary signal is Ce |
| Rockland-JM-02-07-08 | Ferron | Siltstone | La, Ce, Pr, Nd in two monazite grains >10 µm; primary signal is Ce. Y enriched xenotime was also identified in a >10 µm grain |
Table 5.
LREE and HREE values and ratios based on ICP-MS analysis using absolute values in ppm, labeled with “A” subscript (e.g., LREEA) and values normalized to the average UCC (e.g., LREEN). Average UCC values based on Rudnick and Gao (2003) [56].
Table 5.
LREE and HREE values and ratios based on ICP-MS analysis using absolute values in ppm, labeled with “A” subscript (e.g., LREEA) and values normalized to the average UCC (e.g., LREEN). Average UCC values based on Rudnick and Gao (2003) [56].
| Sample | Lithology | LREEN | LREEA | HREEN | HREEA | RatioN | RatioA |
|---|---|---|---|---|---|---|---|
| BVCA-4 | Coal | 34.23 | 831.60 | 19.44 | 43.57 | 1.76 | 19.08 |
| IPA-1-1673.6 | Siltstone | 8.44 | 184.94 | 9.16 | 19.05 | 0.92 | 9.70 |
| MC-C-01-06 | Coal | 181.97 | 4791.36 | 72.67 | 167.71 | 2.50 | 28.56 |
| MC-G-02-03 | Carbonaceous Shale | 8.52 | 194.36 | 8.66 | 17.73 | 0.98 | 10.95 |
| WF-M-10-03 | Carbonaceous Shale | 15.30 | 395.30 | 5.01 | 12.59 | 3.05 | 31.38 |
| Rockland-JM-02-07-08 | Siltstone | 7.69 | 175.34 | 9.18 | 18.32 | 0.84 | 9.57 |
Disclaimer/Publisher’s Note: The statements, opinions and data contained in all publications are solely those of the individual author(s) and contributor(s) and not of MDPI and/or the editor(s). MDPI and/or the editor(s) disclaim responsibility for any injury to people or property resulting from any ideas, methods, instructions or products referred to in the content. |
© 2025 by the authors. Licensee MDPI, Basel, Switzerland. This article is an open access article distributed under the terms and conditions of the Creative Commons Attribution (CC BY) license (http://creativecommons.org/licenses/by/4.0/).
Copyright: This open access article is published under a Creative Commons CC BY 4.0 license, which permit the free download, distribution, and reuse, provided that the author and preprint are cited in any reuse.


