Submitted:
10 June 2025
Posted:
11 June 2025
You are already at the latest version
Abstract
This study evaluated toxic metallic and organochlorine concentrations in tissues of marine mammals that stranded in Maryland over a 15-year period (2000-2015). The sampled marine animals belonged to Delphinidae (dolphins and long finned pilot whales; n=61), Phocidae (Harp, Gray, Harbor and Hooded seals; n=20), Phocoenidae (Harbor porpoises, n=4), Ziphiidae (Gervais' beaked whale and True’s beaked whale, n=2) Balaenopteridae (humpback whales, n=2) and Kogiidae (pygmy sperm whales, n=2). Stranding location, age group, sex, date and season were recorded. Metallic elements in liver and kidney were analyzed using ICP-MS, while GC-MS was used for organochlorines in blubber. Data were analyzed by computing median concentrations followed by analysis with Mann Whitney U or Kruskal Wallis tests. All statistical comparisons were considered statistically significant at p< 0.05. Mercury and copper were significantly elevated in Delphinidae liver in comparison to Phocidae. Hg was elevated in adult strandings. Concentrations of trans-nonachlor and oxychlordane were significantly higher in blubber of adult Phocidae strandings while p_p_DDD and dieldrin were significantly elevated in adult Delphinidae. Total PCB and p_p_DDE were significantly higher in Delphinidae females. This data shows variability in accumulations of toxic elements and persistent organic pollutants among different marine mammals. While it cannot be concluded that these pollutants are a major cause of strandings of the marine mammals, factors leading to bioaccumulation and toxicity of the contaminants need to be elucidated.
Keywords:
Toxic elements
; organochlorines
; PCBs
; marine animals
; Maryland
; stranding
1. Introduction
Marine mammals are protected species under the Marine Mammal Protection Act (MMPA), 1972 and some are threatened or endangered and protected by the Endangered Species Act, 1973. Strandings have been documented on all U. S. shores by private organizations, local jurisdictions, state and federal agencies. The Smithsonian Institution played a large role in stranding response prior to the enactment of the Title IV of the MMPA in 1994 when stranding networks were formalized and many individual networks were formed. The reasons for stranding events are varied and include anthropogenic (ship strikes, trauma, marine debris, entanglements, oil spills and other human interaction) and natural causes (infectious disease, harmful algal toxins, extreme weather events, and predation). When marine animals strand, there is concern about the health of the oceans, bays and tributaries (Bossart, 2011). Attempts have been made to identify infectious, metabolic, or other disease conditions that could lead to strandings (Gulland and Hall, 2007). Environmental pollution has also been added as possible factor for strandings (NOAA Fisheries, 2018). Stranded animals provide a valuable opportunity to investigate the causes of natural mortality of marine animals and to examine possibilities that human behavior is negatively impacting marine mammal populations. Marine mammals are exposed to toxicants through food and water (Ross, 2000). Large baleen whales are filter feeders, seals are intermediate predators and dolphins are apex predators (Ballance, 2009); hence cetaceans (whales, dolphins, and porpoises) are vulnerable to cumulative contaminants like organochlorines, polychlorinated biphenyls and heavy metals.
Persistent pollutants have been documented to bioaccumulate and biomagnify in marine mammal populations and food chains in recent decades since they are not readily metabolized (Gray, 2002). This risk is greater in heterotrophs like dolphins, seals and whales with long life expectancy and significant body fat stores. There is evidence that organochlorine compounds have several adverse effects on marine mammal populations. These include depression of the immune system and triggering of infectious diseases (Simmonds & Mayer, 1997) and; being endocrine disruptors, they also cause reproductive impairment (Beland et al., 1993). In addition, these pollutants have been implicated in adrenal gland toxicity (Olsson et al., 1994), cancers, and alterations in skeletal growth and bone lesions (Martineau et al., 1994). Liver and kidney are the most frequently analyzed tissues for toxicants as they play roles in biotransformation and excretion of xenobiotics (Das et al., 2003). They were therefore used in this study to assess accumulation of toxic elements. Highly lipophilic compounds tend to accumulate in tissues with a high lipid content and low-vascular exchange rate such as fat or blubber due to limited perfusion. Marine mammal blubber is a suitable tissue for monitoring organochlorines and PCBs as they tend to concentrate there (Hall et al., 2006). Hence blubber was used for analysis of organochlorines and PCBs.
The Maryland Department of Natural Resources Stranding Response Program (SRP) was established in the fall of 1990. The SRP is responsible for responding to all dead strandings that occur in the Chesapeake Bay, its tributaries, and along the Atlantic Coast of Maryland, which combined, includes approximately 3,800 miles of coastline (Figure 1). From 1990 through 2015, the SRP has responded to a total of 466 dead stranded marine mammals including 372 odontocetes, 19 mysticetes, 50 pinnipeds, 2 sirenians, and 23 unidentified/partial carcasses. When a stranding occurs, SRP staff respond to the carcass and complete a thorough external examination before a necropsy is conducted. During necropsy, organ samples are collected for complete diagnostic screening, including environmental contaminants. Samples of blubber, liver, and kidney are collected and sent to Iowa State University, where they are analyzed for heavy metals, polychlorinated biphenyls (PCBs) and organochlorinated pesticides. This study presents toxic metal and organochlorine concentrations in tissues of marine mammals that stranded along Maryland’s coastline from 2000-2015. The study is based on the hypothesis that there are no significant differences in concentrations of metallic elements and organochlorinated compounds in tissues of stranded marine mammals based on species, age group, sex, stranding location and season of the year.
2. Methods
2.1. Study Design
This was a longitudinal study monitoring metallic element and persistent organic pollutant concentrations in tissues of marine mammals stranding on shores of Chesapeake Bay and along the Atlantic coast of Maryland, USA (Figure 1), over a 15-year period (2000-2015). Samples were collected from all stranded mammals year-round. Liver and kidney samples were analyzed for metallic elements while blubber samples were analyzed for fat soluble organochlorinated pesticides and polychlorinated biphenyls (PCBs).
2.2. Sample and Data Collection
Blubber, liver, and kidney samples were collected from fresh dead stranded animals in a collaborative effort of National Oceanic and Atmospheric Administration (NOAA) and National Institute of Standards and Technology (NIST) prior to forwarding for toxicological testing. Samples were collected from 91stranded animals. Most of the sampled animals belonged to Delphinidae family (n=58) and these were; 32 bottlenose dolphins (Tursiops truncatus), 10 short beaked common dolphins (Delphinus delphis), 8 Risso’s dolphins (Grampus griseus), 5 striped dolphins (Stenella coeruleoalba), 2 Clymene dolphins (Stenella clymene), 2 Atlantic white-sided dolphins (Lagenorhynchus acutus) and 3 long-finned pilot whales (Globicephala melas). Those belonging to the Phocidae family (n=20) were 9 harp seals (Pagophilus groenlandica), 5 gray seals (Halichoerus grypus), 5 harbor seals (Phoca vitulina), and 1 hooded seal (Crystophora cristata). Ziphiidae family members (n=2) included 1 Gervais' beaked whale (Mesoplodon europaeus) and 1 True’s beaked whale (Mesaplodon mirus). Members of the Balaenopteridae family (n=2) were 2 humpback whales (Megaptera novaeangliae) while those belonging to the Kogiidae family (n=2) were 2 pygmy sperm whales (Kogia breviceps). The rest belonged to the Phocoenidae family and these were harbor porpoises (n=4). However, not all different sample types obtained were analyzed for all metallic elements and organochlorines due variations in sampling, reporting procedures and in some cases, the condition of the samples as some samples were autolyzed.
The samples were analyzed at the Iowa State University Veterinary Diagnostic Laboratory (Toxicology and Nutrition Section). For each sample, care was taken to record the animal species, tissues sampled, stranding location, age group, sex, date and season of the year.
2.3. Laboratory Analysis for Metallic Elements
Liver and kidney samples were analyzed for antimony (Sb), arsenic (As), boron (B), barium (Ba), calcium (Ca), cadmium (Cd), cobalt (Co), chromium (Cr), copper (Cu), iron (Fe), mercury (Hg), potassium (K), magnesium (Mg), manganese (Mn), molybdenum (Mo), sodium (Na), phosphorus (P), potassium (K) lead (Pb), selenium (Se), thallium (Tl), and zinc (Zn) following a previously published method (Baluka et al., 2017) with slight modification. Briefly, samples were digested in 70 % nitric acid at 60˚C for ≥12 hours. Samples (0.5g) were weighed into a 50 mL centrifuge tubes and 5 mL of 70% nitric acid was added. All samples were digested overnight at 60˚C, then diluted to 25 mL using 1% nitric acid with 0.5% hydrochloric acid (HCl) and analyzed directly by ICP-OES. An additional 1:10 dilution using 1% nitric acid with 0.5% HCl was made prior to analysis by ICP/MS.
Cadmium, Co, Cr, Cu, Fe, K, Mg, Mn, Mo, Na, P, Se, and Zn were analyzed using Inductively coupled plasma mass spectrometry (ICP/MS, Analytik Jena Inc. Woburn, MA, USA) in CRI mode with hydrogen as the skimmer gas (FSIS, 2013). As, B, Ba, Hg, Pb, Sb, and Tl were analyzed using Inductively coupled plasma optical emissions spectrometry (ICP-OES, Agilent Technologies, Santa Clara, CA, USA). Standards for elemental analyses were obtained from Inorganic Ventures (Christiansburg, VA) while digestion vessels, trace mineral grade nitric acid and hydrochloric acid (HCl) were obtained from Fisher Scientific (Pittsburgh, PA). For quality control Y was used as the internal standard for ICP-OES and Bi, Sc, In, Li, Y, and Tb were used as internal standards for the ICP/MS. All results were reported out on a wet weight basis.
2.4. Laboratory Analysis for Organochlorines and PCBs
Heptachlor epoxide, α-Chlordane, p_p_DDT, p_p_DDE, p_p_DDD, total DDT, Dieldrin, , lindane, trans_Nonachlor, oxychlordane and total PCBs were analyzed using a Gas Chromatograph (GC) equipped with an electron capture detector (Agilent Technologies, Santa Clara, CA, USA). Extraction was done by weighing 5g of pre-homogenized blubber fat into 50mL centrifuge tubes, adding 10mL of acetonitrile and vortexing the mixture for 5 minutes. Thereafter the tubes were centrifuged at 3000 rpm for 5 minutes to obtain the supernatant. The clean-up procedure employed the QuECHERs AOAC Method (AOAC, 2007). The entire supernatant from the clean-up step was transferred to 50mL centrifuge tubes containing 2g of magnesium sulfate and 0.5g of sodium chloride, was vortexed for 1 minute ad then centrifuged at 3000 rpm for 5 minutes. Next, 2mL of supernatant was transferred to 15mL centrifuge tubes containing 300mg of magnesium sulfate and 50mg of primary secondary amine (PSA). This was vortexed for 1 minute and centrifuged at 3000 rpm for 5 minutes. This was followed by transfer of 1 mL of this solution to a 7mL vial which was then concentrated to dryness. The precipitate was dissolved in 0.5mL of ethyl acetate before samples were taken to the GC for analysis. Sample dilutions were done by taking 100µL of each sample and adding 900µL of isooctane.
Argon: methane (95%: 5%) at a flow rate of 60mL/minute was used as make-up gas while helium at a flow rate of 1mL/minute was used as carrier gas. The column used was an Agilent HP-5ms Ultra Inert column of dimensions 30m length, 0.25mm diameter and 0.25µm stationary phase thickness. The temperature gradient for the oven started at 100˚C for 1 minute, ramped at 10˚/min to 180˚C, which was held for 5 minutes, then ramped at 25˚C/min to 300˚C, which was held for 8 minutes. Both injector and detector temperature were set at 250˚C.
2.5. Data and Statistical Analysis
The data (concentration in ppm) were placed into an MS Excel spreadsheet for sorting and analysis. Ranges (minimum-maximum concentrations) and median concentrations of toxic metallic elements (in kidney and liver) and organochlorines (in blubber) were determined since the data was not normally distributed . Data analysis was done mainly for Delphinidae and Phocidae due to the very low numbers of Ziphiidae, Balaenopteridae, Kogiidae and Phocoenidae as indicated in section 2.2 and for mainly the toxic metallic elements (As, Cd, Mo, Cr, Hg, Cu). Data was analyzed for any significant differences in median concentrations between Delphinidae and Phocidae. Where sufficient data was available it was analyzed for significant differences between age, sex, species and season categories; separately for Delphinidae and Phocidae. All data was statistically analyzed with SAS (SAS Institute Inc., 100 SAS Campus Drive, Cary, NC 27513-2414, USA) using Mann Whitney-U test (2 groups) or Kruskal Wallis test (>2 groups); since median concentrations were used. All statistical differences were considered significant at p<0.05.
3. Results
3.1. Sampled Marine Mammals
Males represented the majority of the sampled animals (63%, n=58), while female animals accounted for 35% (n=32). The age distribution was skewed towards subadults (33%) and adults (24.1%), with lower proportions of calves, neonates, and yearlings. Samples were collected from two major locations, the Atlantic Coast (92.2%) and Chesapeake Bay (7.8%). Taxonomically, the Delphinidae family was the most represented (67 %) as shown in Table 1. The most frequently sampled species was the Bottlenose dolphin (Tursiops truncatus), i.e. 35.1% of all samples, followed by Short-beaked common dolphins and Harp seals.
3.2. Heavy Metals
In the first set of analyses, toxic metallic element concentrations in Delphinidae liver and kidney were compared to those in Phocidae. Median As, Cr, Cd and Hg concentrations were higher in Delphinidae than in Phocidae with Hg concentrations being significantly higher (Mann-Whitney test) as shown in Table 1. Similarly higher median concentrations of Cd and Hg were observed in Delphinidae kidneys. The concentrations of these elements were much higher in liver than kidney (Table 2). Cu concentrations were significantly (p=0.0182) higher in livers of Phocidae than in Delphinidae.
In the second set of analyses, metallic element concentrations in livers and kidneys of Delphinidae were compared based on age category (adults versus non-adults) and sex (male versus female). Yearlings, pups, calves and sub-adults were grouped together as “non-adults”. Concentrations of Hg were higher in adults than non-adults in both liver (66 ppm cf 4.6 ppm) and kidney (6.58 ppm cf 1.23 ppm) as shown in Table 3, indicating possible bioaccumulation. The trend of much higher median Hg concentrations in adults than non-adults were also observed in both liver and kidney of Bottlenose dolphins when data was desegregated and analyzed according to age category (Table 6). On the other hand, Cd concentrations were much higher in non-adults in both kidney and liver. Furthermore, Hg and Cu concentrations were higher in liver than kidney (Table 3); probably due to the role the liver plays in metabolism and possibly excretion of these toxic metals. When toxic metal concentrations in Delphinidae were compared based on sex, Hg and Cd concentrations were higher in livers of females (30.7 ppm, 11.34 ppm) than males (16.05 ppm, 8.61 ppm) as shown in Table 3. Species-level analysis showed similar trends in Bottlenose dolphins (Tursiops truncatus) with females having higher liver Hg concentrations (8.13 ppm cf 5.29 ppm) as shown in Table 5. Median Cd concentrations were higher in kidneys of both males and females (24.05 ppm, 22.5 ppm) than in liver (11.34 ppm, 8.61 ppm), pointing to the kidney as key excretory route or accumulation site; and were highest (42.93 ppm) of Risso’s dolphins than other species (Table 4).
On comparison of toxic metallic elements in livers of different species of Phocidae, As, and Hg median concentrations were highest in Gray seals and Harbor seals respectively (Table 7). One particularly prominent finding was that the median concentration of Cd (44.72 ppm) in livers of Harbor seals (Phoca vitulina) was more than 12 times and 270 times that in Harp seals and Gray seals respectively. Similar trends were observed in Cd concentrations in the kidney samples with median concentrations in Harbor seals (39.63 ppm) being more than 5 times and 70 times that in Harp seals and Gray seals respectively. Of the three Phocidae species, Harbor seals had the highest concentrations of Hg in both liver and kidney (Table 7). Hooded seals were not included in this comparison because of low specimen numbers (n=1).
3.3. Organochlorines
Blubber is the ideal specimen because organochlorines are fat soluble. In a two-way comparison of organochlorines in Delphinidae and Phocidae blubber, significant differences were observed for p_p_DDD and dieldrin. For both these organochlorines, significantly higher median concentrations were found in Delphinidae than Phocidae; with almost 6 times the median concentration of p_p_DDD and 3 times the median concentration of dieldrin (Table 8).
When median organochlorine concentrations in Delphinidae blubber were compared by age category, significant differences were only observed for p_p_DDT whose median concentrations were significantly higher in adults (36 ppm) than non-adults (1.25 ppm) as shown in Table 9. In Phocidae blubbers on the other hand, trans-Nonachlor and Oxychlordane median concentrations were significantly higher in adults than non-adults (p=0.0167).
Regarding sex comparisons for Delphinidae, median total PCB and p_p_DDE concentrations were both significantly higher in females (3.66 ppm) than in males (0.92 ppm) (Table 10). Females had more than three times the concentration of PCBs in their blubber (7.19 ppm cf 2.35 ppm) and more than four times the concentration of p_p_DDE in their blubber compared to males (3.66 pm cf 0.92 ppm). On species-level comparison, p_p_DDD, dieldrin and oxychlordane median concentrations were highest in Bottlenose dolphins (Table 10). When median organochlorine concentrations in blubbers of Bottlenose dolphins were analyzed according to age category the concentrations of were much higher in adults than non-adults as shown Table 11. This comparison could not be done for other species due to low numbers.
For Phocidae, p_p_DDE and total PCB median concentrations were higher in Gray seals than Harp seals (Table 12). Hooded seals and Harbor seals were not included in this comparison because of limited availability of data due low specimen numbers (n=1). On the other hand, trans-Nonachlor and Oxychlordane median concentrations were at least 3 times higher in Harp seals than Gray seals.
Lastly, no significant differences in organochlorine concentrations were observed based on the location of stranding and season of the year (data not shown).
4. Discussion
Environmental pollution is one among other variables likely contributing to marine mammal strandings. Heavy metals and organochlorine compounds are very persistent in the marine environment and are bioaccumulative in living systems. While Mn, Mg, K, Na, P, Na, Co, Cu, Fe etc. are essential trace elements, heavy metals such as Hg, Cr, Pb, Cd, Mo and As generally do not play any physiological roles and are harmful to animal health. Marine mammals are sentinels of changes in marine environment health since they sit at the top of the marine food pyramid, have long life spans and extensive fat stores (Mössner and Ballschmiter, 1997). Long term exposure to heavy metals causes damage to the liver, kidney, central nervous system and bones; severely affecting the health of animals (Thévenod and Lee, 2013; Clarkson and Magos, 2006). Organochlorines can easily be translocated to distant places and be incorporated in remote food webs. They cause liver and nervous system damage, and chronic toxicity effects such as carcinogenesis, teratogenicity and endocrine disruption in mammals. Both classes of toxicants could theoretically play a role in stranding episodes. DDT and PCBs have been implicated in immune suppression in bottlenose and striped dolphins, harbor porpoises and harbor seals (Grattarola et al. 2023).
In Maryland, bottlenose dolphins tend to be coastal in their distribution compared to other dolphins such as striped dolphins which tend to be located offshore. Bottlenose dolphins typically have long lives and feed in shallow waters and their diet is composed of soniferous fish associated with seagrasses (Barros and Wells, 1998). This could explain why most of the dolphins stranding on the Maryland coast (63%) were of this species. The significantly higher concentrations of Hg, a majorly anthropogenic marine pollutant, in Delphinidae could be attributed to higher concentrations of these pollutants in coastal waters. The liver Hg concentrations for stranded Delphinidae were higher than kidney Hg concentrations, and this is in agreement with findings by Law et al. (1991) who evaluated Hg concentrations in tissues of dolphins, whales and porpoises in waters around the British Isles.
The significantly higher concentrations of Hg in adult marine mammals is logical given they feed largely on fish and are on top of the marine food pyramid; and their longevity; favoring biomagnification of this potent toxin. Various authors also attribute the elevated Hg concentrations in Delphinidae especially bottlenose dolphins (Tursiops truncatus) to their tendency to inhabit near-shore environments where pollution is more prevalent. Adult marine mammals logically have higher concentrations of Hg than younger animals because this toxin bioaccumulates over time. In a study of Hg concentrations in bottlenose dolphins that stranded on the coast of north-east Florida during the period 2013-2021, Hg concentrations in tissues were similarly higher in adults than non-adults (Bielmyer-Fraser et al. 2024). Possible sources of marine metallic pollution include sewage effluent containing industrial waste, municipal waste, agricultural pesticides, fertilizers, animal wastes, manure and sludge (Islam and Tanaka, 2004). Previous studies indicate that sedimentary Hg, monomethylmercury (the most bioaccumulative form) and total mercury concentrations in sediments collected from Baltimore Harbor and Chesapeake Bay in Maryland exceeded environmental guidelines (Mason et al. 1999) and tended to decrease towards further offshore (Hollweg et al. 2010). This region is surrounded by urban settings and industrial activity which are a possible source of anthropogenic marine pollution. The limit of tolerance in mammalian liver tissues for Hg is believed to be 100-400 ppm and impaired coordination has been reported in seals at hepatic concentrations of 200 ppm (Piotrowski & Coleman, 1980). In this study, 3 animals had hepatic Hg concentrations of 261, 288 and 311 ppm. At this concentration, incoordination would be expected.
The high median concentrations of Hg and Cd in tissues of Risso’s dolphins could be attributed to their ability to dive and search for preys in the depths of seas and oceans where these metals accumulate in sediment and lower trophic organisms (Kershaw and Hall, 2019). Higher Cd concentrations in kidneys than livers were also observed in stranded Bottlenose, striped and Rissos’s dolphins in the Eastern Adriatic sea (Bilandžić et al. 2012). On the other hand the higher concentrations of Hg and Cd in Harbor seals could be attributed to their tendency to be non-migratory, and showing preference for mainland coastline, coastal islands and bays where pollution is highest (Murillo-Cisneros et al. 2022). This, in addition to their long lifespan and fish-based diet makes Harbor seals sentinels of regional Hg pollution.
While this study showed that total PCB concentrations were significantly higher in female marine mammals, Weisbrod et al., (2001) found higher concentrations of PCBs in male Delphinidae . However, their study comprised of only Atlantic white-sided dolphins. PCBs are highly lipophilic compounds and females, whose bodies tend to have higher fat content would be expected to have higher concentrations. Furthermore, significantly higher concentrations of trans-nonachlor in adults is likely an indicator of bioaccumulation of this organochlorine compound in living tissues with age. Phocidae blubber contained higher concentrations of lindane, compared to Delphinidae. Earlier studies indicated that concentrations of this highly persistent organochlorine remarkably increases with trophic levels in the marine environment and significantly higher concentrations have been found in Phocidae compared to Phocoenidae to which porpoises belong (Kawano et al., 1988).
The data presented in this study are limited to only the sampled stranded mammals. In addition, geospatial distribution, proximity to the core sampling area, sample quality, hours after death prior to reporting, and other unknown limitations could have effected some of the samples collected. The background and history on these samples is limited. Furthermore, reference values of published data on toxicology of metals and organochlorines in marine mammals is limited. Therefore, the implication of significantly increased metallic and organochlorine toxicants found in this study is inconclusive. However, long-term studies should be continued to increase the database for Maryland marine mammals. While it cannot be concluded that these pollutants are a major cause of strandings of the marine mammals, Hg, chlorinated pesticides, and PCBs are all known to negatively impact animal health. High concentrations of contaminants in marine animals may weaken their immunity and resistance to pathogens that have been implicated in some stranding episodes such as morbillivirus (Morris et al., 2015). Similarly, Bielmyer-Fraser et al. (2024) observed that dolphins that showed immunosuppression due to morbillivirus infections tended to have higher mercury concentrations in their tissues.
In order to fully assess the health risks posed by these environmental chemical contaminants and other related factors that could lead to stranding, many more tissues need to be analyzed. Specific elements in the animals' diet, and factors leading to bioaccumulation and toxicity of the contaminants also need to be elucidated.
Author’s Contributions
John N Kateregga collated the data, coordinated with statistician for data analysis, interpreted the data and drafted the manuscript. Cindy Driscoll and Amanda Weschler prepared the John H Prescott Grant proposals for funding, responded to strandings, collected tissue samples, and participated in writing of the manuscript. Dwayne Schrunk is the analytical chemist who analyzed samples. He also participated in writing the manuscript. Chong Wang is the study statistician. He analyzed all data and participated in writing the manuscript. Wilson Rumbeiha is the study toxicologist. He contributed towards writing of the grant proposal, supervised sample analysis, and participated in interpretation of data and writing of the manuscript.
Declarations of Interest
None.
Acknowledgements
This work was supported by the Maryland Department of Natural Resources’ Stranding Response Program the U. S. Department of Commerce, National Oceanic and Atmospheric Administration, National Marine Fisheries Service, John H. Prescott Marine Mammal Rescue Assistance Grant Program, and the National Institute of Standards and Technology. We thank the staff of the Iowa State University Veterinary Diagnostic Laboratory (Toxicology and Nutrition Section) for the laboratory analysis.
References
- AOAC (2007). AOAC Official Method 2007.01, Pesticide Residues in Foods by Acetonitrile Extraction and Partitioning with Magnesium Sulfate. http://www.weber.hu/PDFs/QuEChERS/AOAC_2007_01.pdf.
- Ballance, L. T. (2009). Cetacean ecology. Lat. Am. J. Aquat. Mamm, 2, 87-94.
- Baluka S.A., Schrunk D., Paula Imerman, Kateregga J.N., Camana E., Wang C., Rumbeiha W.K. & Yildiz K. (2017) Mycotoxin and metallic element concentrations in peanut products sold in Ugandan markets, Cogent Food & Agriculture, 3:1. [CrossRef]
- Barros, N. B., & Wells, R. S. (1998). Prey and feeding patterns of resident bottlenose dolphins (Tursiops truncatus) in Sarasota Bay, Florida. Journal of Mammalogy, 79(3), 1045-1059. [CrossRef]
- Béland, P., DeGuise, S., Girard, C., Lagace, A., Martineau, D., Michaud, R & Shugart, L. R. (1993). Toxic compounds and health and reproductive effects in St. Lawrence beluga whales. Journal of Great Lakes Research, 19(4), 766-775. [CrossRef]
- Bielmyer-Fraser, G. K., Courville, J. M., Ward, A., & Hardie, M. M. (2024). Mercury and Selenium Accumulation in the Tissues of Stranded Bottlenose Dolphins (Tursiops truncatus) in Northeast Florida, 2013–2021. Animals, 14(11), 1571. [CrossRef]
- Bilandžić, N., Sedak, M., Đokić, M., Đuras Gomerčić, M., Gomerčić, T., Zadravec, M., .. & Prevendar Crnić, A. (2012). Toxic element concentrations in the bottlenose (Tursiops truncatus), striped (Stenella coeruleoalba) and Risso’s (Grampus griseus) dolphins stranded in Eastern Adriatic Sea. Bulletin of environmental contamination and toxicology, 89, 467-473. [CrossRef]
- Bossart, G. D. (2011). Marine mammals as sentinel species for oceans and human health. Veterinary Pathology Online, 48(3), 676-690. [CrossRef]
- Clarkson, T. W., & Magos, L. (2006). The toxicology of mercury and its chemical compounds. Critical reviews in toxicology, 36(8), 609-662. [CrossRef]
- Das, K., Debacker, V., Pillet, S., & Bouquegneau, J. M. (2003). Heavy metals in marine mammals. Toxicology of marine mammals, 3, 135-167.
- Francesconi KA, Edmonds JS (1997). Arsenic and marine organisms. Advances in Inorganic Chemistry 44, 147–189. [CrossRef]
- FSIS (2013). Determination of Metals by ICP-MS and ICP-OES. Document of the United States Department of Agriculture Food Safety and Inspection Service (FSIS), Office of Public Health Science. Accessed online at https://www.fsis.usda.gov/wps/wcm/connect/b9a63ea1-cae9-423b-b200-36a47079ae49/CLGTM3.pdf?MOD=AJPERES on March 27th 2017.
- Grattarola, C., Minoia, L., Giorda, F., Consales, G., Capanni, F., Ceciarini, I., .. & Marsili, L. (2023). Health status of stranded common bottlenose dolphins (Tursiops truncatus) and contamination by immunotoxic pollutants: A threat to the Pelagos Sanctuary—Western Mediterranean Sea. Diversity, 15(4), 569. [CrossRef]
- Gray, J. S. (2002). Biomagnification in marine systems: the perspective of an ecologist. Marine Pollution Bulletin, 45(1), 46-52. [CrossRef]
- Gulland, F. M., & Hall, A. J. (2007). Is marine mammal health deteriorating? Trends in the global reporting of marine mammal disease. EcoHealth, 4(2), 135-150. [CrossRef]
- Hall, A. J., McConnell, B. J., Rowles, T. K., Aguilar, A., Borrell, A., Schwacke, L., & Wells, R. S. (2006). Individual-based model framework to assess population consequences of polychlorinated biphenyl exposure in bottlenose dolphins. Environmental Health Perspectives, 114(Suppl 1), 60. [CrossRef]
- Hollweg, T. A., Gilmour, C. C., & Mason, R. P. (2010). Mercury and methylmercury cycling in sediments of the mid-Atlantic continental shelf and slope. Limnology and Oceanography, 55(6), 2703-2722. [CrossRef]
- Islam, M. S., & Tanaka, M. (2004). Impacts of pollution on coastal and marine ecosystems including coastal and marine fisheries and approach for management: a review and synthesis. Marine pollution bulletin, 48(7), 624-649. [CrossRef]
- Kawano M, Inoue T, Wads T, Hldaka H and Tatsukawa R (1988). Bioconcentratlon and Residue Patterns of Chlordane Compounds in Marine Animals: Invertebrates, Fish, Mammals, and Seabirds. Environ. Sci Technol, 22, 792-797. [CrossRef]
- Kershaw, J. L., & Hall, A. J. (2019). Mercury in cetaceans: exposure, bioaccumulation and toxicity. Science of the Total Environment, 694, 133683. [CrossRef]
- Kubota, R., Kunito, T., & Tanabe, S. (2001). Arsenic accumulation in the liver tissue of marine mammals. Environmental Pollution, 115(2), 303-312. [CrossRef]
- Law, R. J., Fileman, C. E, Hopkins, A. D., Baker, J. R., Harwood, J., Jackson, D. B., Kennedy, S., Martin, A. R. & Morris, R. J. (1991). Concentrations of trace metals in the livers of marine mammals (seals, porpoises and dolphins) from waters around the British Isles. Mar. Pollut. Bull. 22,183-191. [CrossRef]
- Martineau, D., De Guise, S., Fournier, M., Shugart, L., Girard, C., Lagace´, A., & Be´land, P. (1994). Pathology and toxicology of beluga whales from the St. Lawrence Estuary, Que`bec, Canada. Past, present and future. Science of the Total Environment, 154, 201–215.
- Mason, R. P., & Lawrence, A. L. (1999). Concentration, distribution, and bioavailability of mercury and methylmercury in sediments of Baltimore Harbor and Chesapeake Bay, Maryland, USA. Environmental Toxicology and Chemistry, 18(11), 2438-2447. [CrossRef]
- Morris, S.E., Zelner, J.L., Fauquier, D.A., Rowles, T.K., Rosel, P.E., Gulland, F., Grenfell, B.T. (2015). Partially observed epidemics in wildlife hosts: modelling an outbreak of dolphin morbillivirus in the northwestern Atlantic, June 2013–2014. J. R. Soc. Interface 12: 20150676. [CrossRef]
- Mössner, S., & Ballschmiter, K. (1997). Marine mammals as global pollution indicators for organochlorines. Chemosphere, 34(5-7), 1285-1296. [CrossRef]
- Murillo-Cisneros, D. A., McHuron, E. A., Zenteno-Savín, T., Castellini, J. M., Field, C. L., & O'Hara, T. M. (2022). Fetal mercury concentrations in central California Pacific harbor seals: Associated drivers and outcomes. Science of the Total Environment, 820, 153246. [CrossRef]
- NOAA Fisheries (2018). Marine Mammal Health and Stranding Response Program. Available online at https://www.fisheries.noaa.gov/national/marine-life-distress/marine-mammal-health-and-stranding-response-program. Accessed 07/08/2018.
- Olsson, M., Karlsson, B., & Ahnland, E. (1994). Diseases and environmental contaminants in seals from the Baltic and Swedish west coast. Science of the Total Environment, 154, 217–227. [CrossRef]
- Piotrowski. J. K. & Coleman, D. O. (1980). Environmental hazards of heavy metals: Summary evaluation of lead, cadmium and mercury. Report no. 20, Monitoring and Assessment Research Centre, University of London.
- Ross, P. S. (2000). Marine mammals as sentinels in ecological risk assessment. Human and Ecological Risk Assessment, 6(1), 29-46. [CrossRef]
- Simmonds, M. P., & Mayer, S. J. (1997). An evaluation of environmental and other factors in some recent marine mammal mortalities in Europe: implications for conservation and management. Environmental Review, 5, 89–98. [CrossRef]
- Thévenod, F., & Lee, W. K. (2013). Toxicology of cadmium and its damage to mammalian organs. In Cadmium: From toxicity to essentiality (pp. 415-490). Springer Netherlands. [CrossRef]
- Weisbrod, A. V., Shea, D., Moore, M. J., & Stegeman, J. J. (2001). Species, tissue and gender-related organochlorine bioaccumulation in white-sided dolphins, pilot whales and their common prey in the Northwest Atlantic. Marine environmental research, 51(1), 29-50. [CrossRef]
Figure 1.
Map of Maryland showing the sites of marine mammal strandings over the period 2000-2015. Source: Maryland Department of Natural Resources.
Figure 1.
Map of Maryland showing the sites of marine mammal strandings over the period 2000-2015. Source: Maryland Department of Natural Resources.
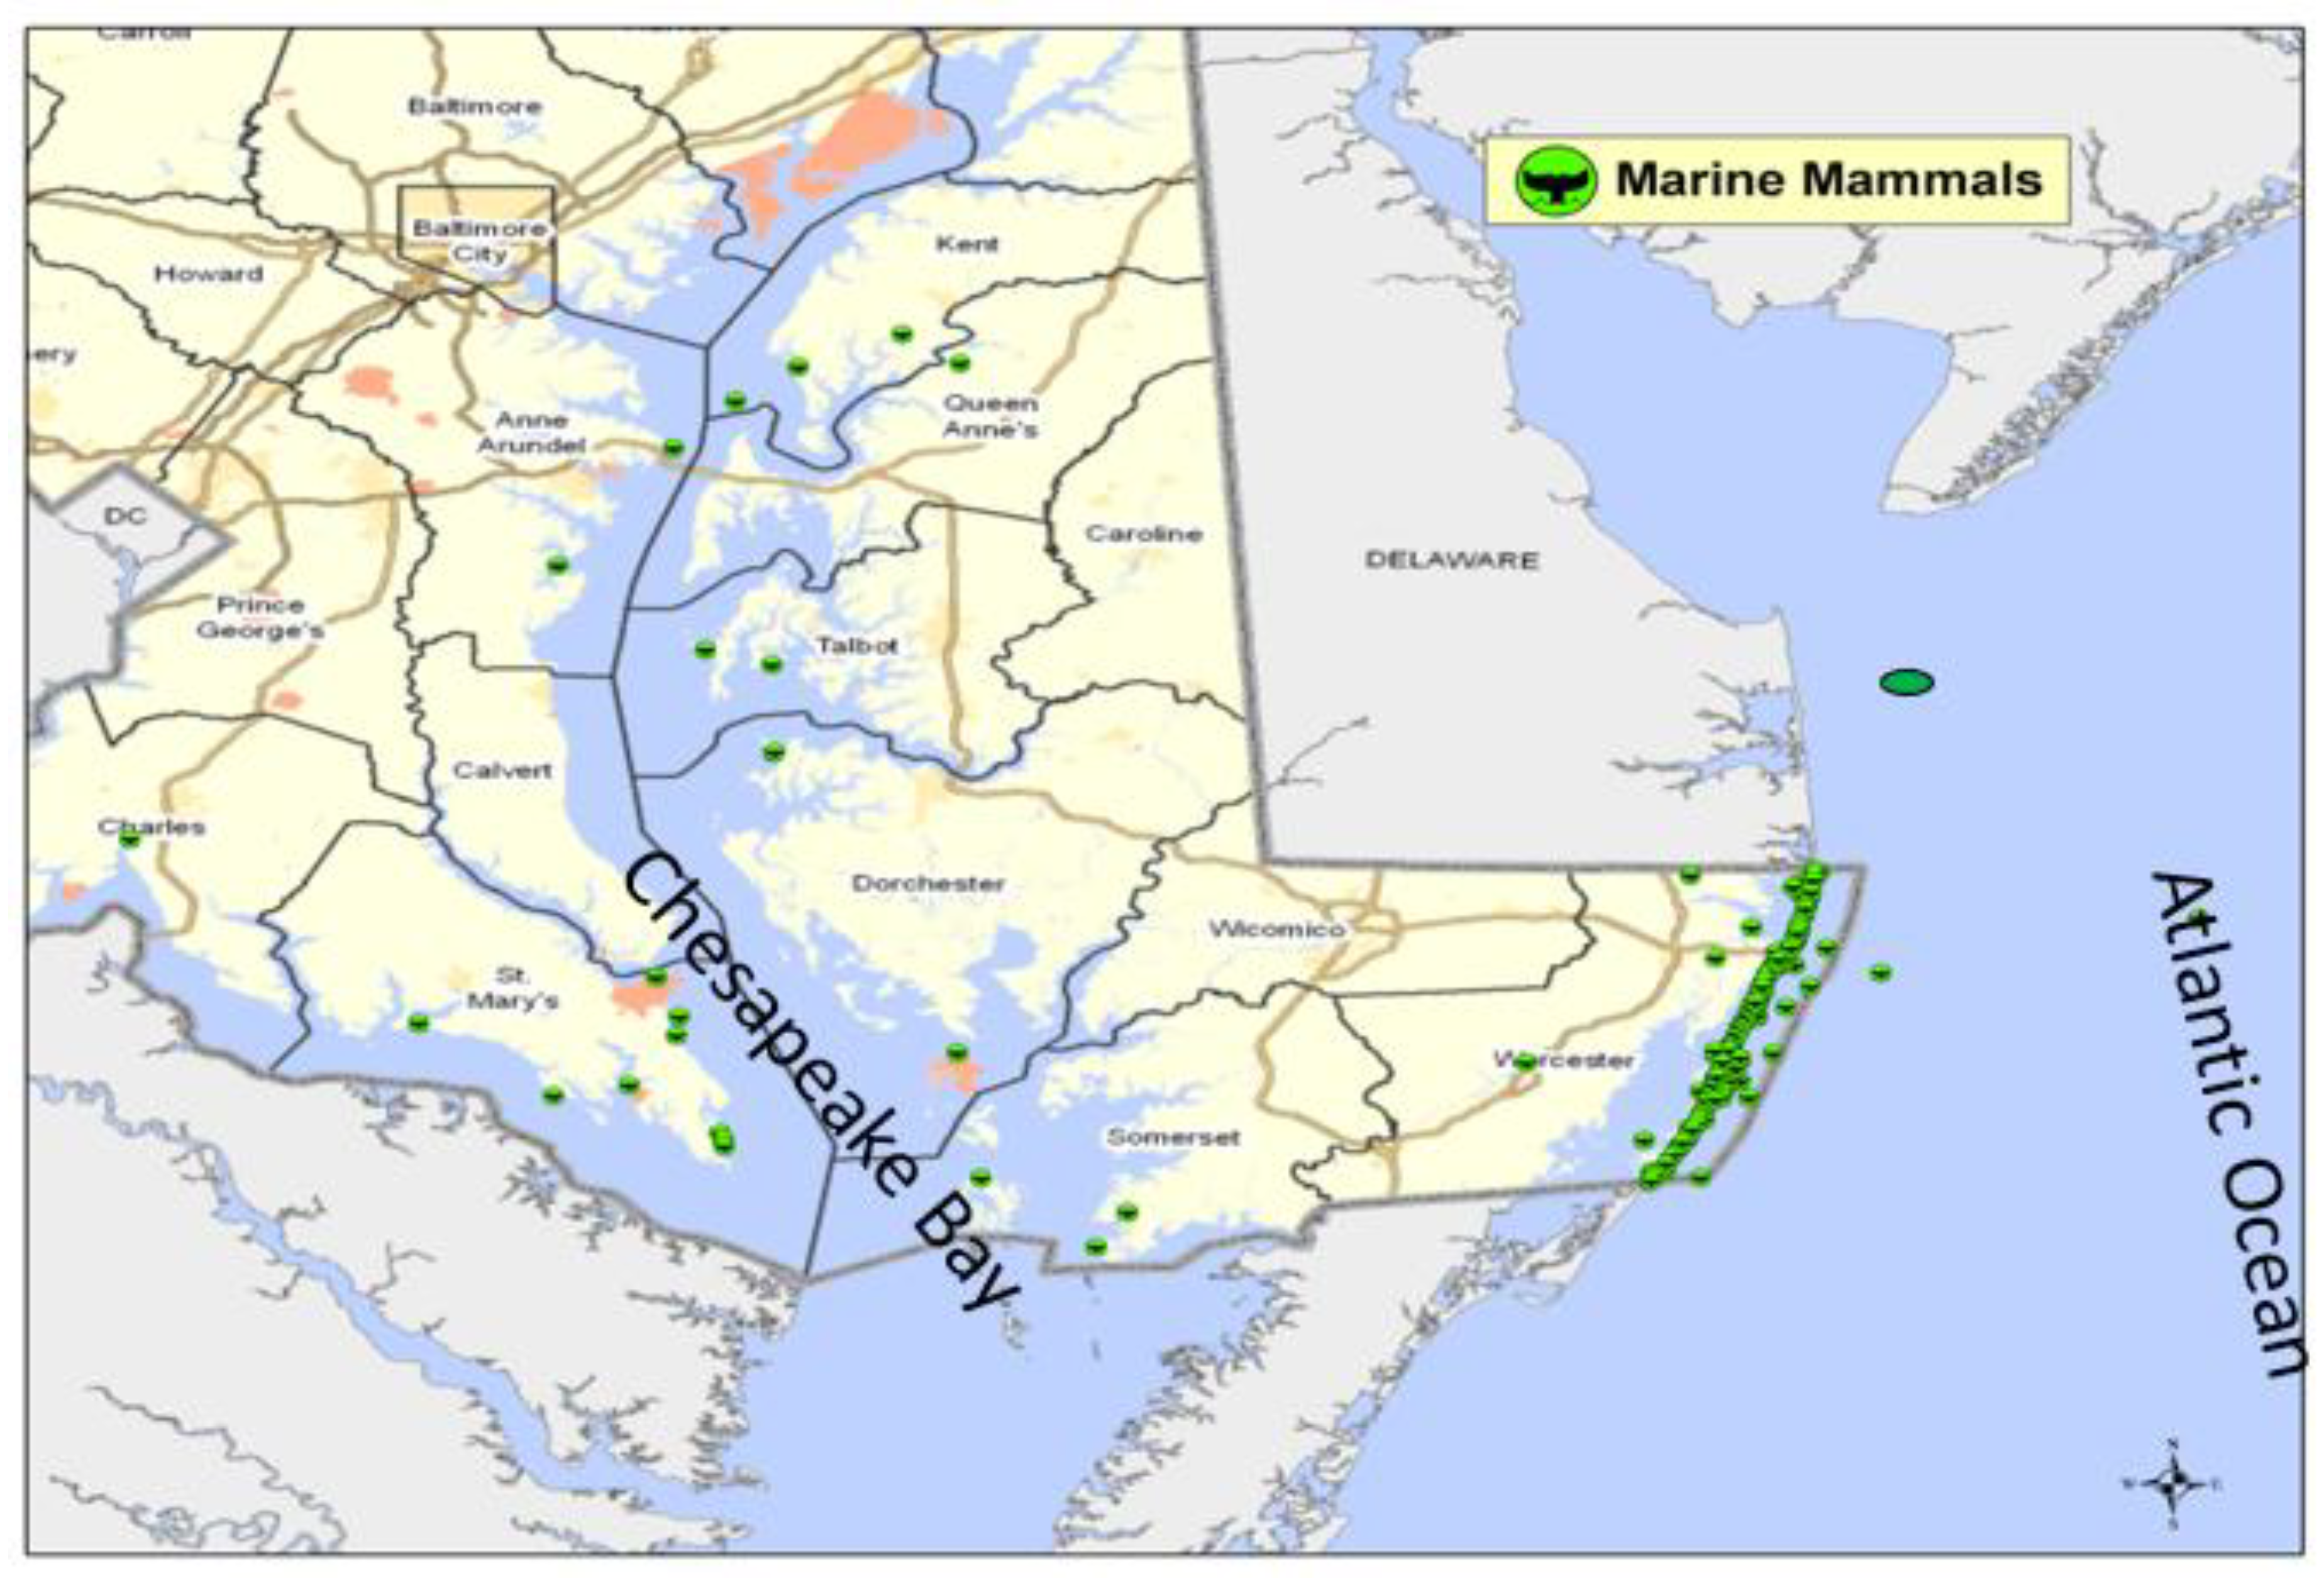

Table 1.
Characteristics of sampled stranded marine mammals.
| Variable | Characteristic | N = 91 |
|---|---|---|
| Sex | Female | 32 (35%) |
| Male | 58 (63%) | |
| Unknown | 3 (2%) | |
| Age | Adult | 22 (24.1%) |
| Neonate | 1 (1%) | |
| Pup/Calf | 9 (9.8%) | |
| Subadult | 30 (33%) | |
| Yearling | 8 (8.8%) | |
| Unknown | 31 (34%) | |
| Location | Atlantic Coast | 83 (92.2%) |
| Chesapeake Bay | 7 (7.8%) | |
| Family | Balaenopteridae | 2 (2.2%) |
| Delphinidae | 61 (67%) | |
| Kogiidae | 2 (2.2%) | |
| Phocidae | 20 (22%) | |
| Phocoenidae | 4 (4.4%) | |
| Ziphiidae | 2 (2.2%) |
NB. 1. Calves, neonates, pups, sub-adults and yearlings were grouped as “non-adults“ during data analysis. 2. Not all different sample types obtained were analyzed for all analytes due variations in sampling, reporting procedures or condition of the samples as some samples were autolyzed.
Table 2.
Metallic concentrations in Delphinidae and Phocidae liver and kidney.
| Element | Median conc. in ppm (min-max) | ||
| Delphinidae | Phocidae | p_value | |
| Liver | |||
| Arsenic (As) | 1.00 (0.60–7.70); n = 19 | 0.60 (0.50–1.72); n = 10 | 0.0606 |
| Cadmium (Cd) | 9.38 (0.00–134.01); n = 53 | 3.53 (0.06–57.86); n = 18 | 0.18 |
| Chromium (Cr) | 0.14 (0.04–0.24); n = 26 | 0.05 (0.05–0.05); n = 1 | 0.774 |
| Copper (Cu) | 8.58 (2.54–175.00); n = 61 | 11.56 (2.96–35.00); n = 20 | 0.0182* |
| Mercury (Hg) | 20.15 (0.46–311.12); n = 60 | 3.36 (0.60–67.56); n = 17 | 0.002* |
| Molybdenum (Mo) | 0.48 (0.10–1.08); n = 51 | 0.46 (0.21–0.84); n = 19 | 0.846 |
| Kidney | |||
| Arsenic (As) | 0.80 (0.40–2.00); n = 15 | 0.77 (0.52–1.15); n = 8 | |
| Cadmium (Cd) | 23.00 (0.00–205.41); n = 54 | 7.32 (0.13–81.87); n = 20 | |
| Chromium (Cr) | 0.15 (0.03–0.97); n = 28 | 0.52 (0.52–0.52); n = 1 | |
| Copper (Cu) | 4.21 (2.00–62.00); n = 61 | 6.18 (2.39–25.93); n = 20 | |
| Mercury (Hg) | 2.78 (0.20–52.00); n = 58 | 1.44 (0.60–3.78); n = 17 | |
| Molybdenum (Mo) | 0.05 (0.02–0.80); n = 13 | 0.24 (0.04–0.45); n = 2 | |
Table 3.
Metallic concentrations in Delphinidae liver and kidney by age category.
| Metallic element | Median conc. in ppm (min-max) | |
|---|---|---|
| Adults | Non-adults | |
| Liver | ||
| Arsenic (As) | 2.30 (1.00–7.70); n = 7 | 0.90 (0.60–1.20); n = 8 |
| Cadmium (Cd) | 6.01 (0.07–134.01); n = 14 | 15.51 (0.00–84.38); n = 23 |
| Chromium (Cr) | 0.16 (0.04–0.23); n = 7 | 0.14 (0.06–0.24); n = 14 |
| Copper (Cu) | 7.17 (3.00–14.47); n = 16 | 9.19 (2.54–175.00); n = 29 |
| Mercury (Hg) | 66.00 (13.00–261.00); n = 16 | 4.60 (0.50–138.10); n = 28 |
| Molybdenum (Mo) | 0.54 (0.20–0.96); n = 14 | 0.43 (0.10–0.91); n = 22 |
| Kidney | ||
| Arsenic (As) | 1.60 (1.20–2.00); n = 6 | 0.80 (0.40–1.20); n = 5 |
| Cadmium (Cd) | 7.00 (0.28–205.41); n = 16 | 32.63 (0.01–192.61); n = 22 |
| Chromium (Cr) | 0.19 (0.10–0.23); n = 7 | 0.16 (0.03–0.97); n = 16 |
| Copper (Cu) | 3.60 (2.00–6.64); n = 16 | 4.93 (2.80–62.00); n = 29 |
| Mercury (Hg) | 6.58 (2.20–15.60); n = 16 | 1.23 (0.26–52.00); n = 27 |
| Molybdenum (Mo) | 0.04 (0.04–0.05); n = 2 | 0.04 (0.02–0.80); n = 7 |
| Females | Males | |
| Liver | ||
| Arsenic (As) | 0.67 (0.60–1.00); n = 5 | 1.20 (0.60–7.70); n = 13 |
| Cadmium (Cd) | 11.34 (0.01–134.01); n = 20 | 8.61 (0.00–107.85); n = 33 |
| Chromium (Cr) | 0.07 (0.04–0.20); n = 7 | 0.14 (0.04–0.24); n = 18 |
| Copper (Cu) | 9.03 (2.54–175.00); n = 21 | 8.54 (3.01–98.30); n = 39 |
| Mercury (Hg) | 30.70 (0.70–311.12); n = 21 | 16.05 (0.46–288.10); n = 38 |
| Molybdenum (Mo) | 0.48 (0.10–1.08); n = 20 | 0.48 (0.11–1.07); n = 31 |
| Kidney | ||
| Arsenic (As) | 0.68 (0.57–1.20); n = 3 | 1.00 (0.40–2.00); n = 10 |
| Cadmium (Cd) | 22.50 (0.01–141.72); n = 19 | 24.05 (0.00–205.41); n = 34 |
| Chromium (Cr) | 0.10 (0.04–0.41); n = 7 | 0.18 (0.03–0.97); n = 19 |
| Copper (Cu) | 4.02 (2.47–5.00); n = 19 | 4.44 (2.00–62.00); n = 40 |
| Mercury (Hg) | 3.05 (0.60–10.50); n = 18 | 2.75 (0.20–52.00); n = 38 |
| Molybdenum Mo | 0.04 (0.02–0.04); n = 4 | 0.05 (0.02–0.35); n = 8 |
Table 4.
Toxic metal concentrations in Delphinidae liver and kidney by species category.
| Median conc. in ppm (min-max) | ||||
| Bottlenose Dolphin | Risso’s Dolphin |
Short Beaked Common Dolphin |
Striped Dolphin | |
| Liver | ||||
| As | 1.20 (0.90–7.70); n = 11 | 0.60 (0.60–0.60); n = 1 | 0.90 (0.67–3.70); n = 3 | 0.73 (0.66–1.20); n = 3 |
| Cd | 0.50 (0.0–84.38); n = 24 | 38.17 (13.30–72.91); n = 7 | 9.00 (0.25–107.85); n = 10 | 4.83 (3.67–65.18); n = 5 |
| Cr | 0.15 (0.04–0.24); n = 18 | 0.13 (0.05–0.20); n = 2 | 0.14 (0.06–0.14); n = 3 | 0.15 (0.15–0.15); n = 1 |
| Cu | 8.37 (2.54–175); n = 31 | 9.07 (5.11–19.00); n = 8 | 8.78 (4.30–13.60); n = 10 | 11.00 (6.50–14.40); n = 5 |
| Hg | 8.06 (0.5–179.9); n = 31 | 99.94 (11.00–311.12); n = 7 | 62.65 (0.46–104.7); n = 10 | 39.70 (2.77–288.10); n = 5 |
| Mo | 0.39 (0.10–0.80); n = 23 | 0.60 (0.33–0.91); n = 7 | 0.86 (0.28–1.08); n = 9 | 0.75 (0.38–0.80); n = 5 |
| Kidney | ||||
| As | 1.20 (0.40–2.00); n = 11 | NA (Inf–-Inf); n = 0 | 1.14 (0.57–1.70); n = 2 | 0.59 (0.50–0.68); n = 2 |
| Cd | 1.08 (0.0–192.6); n = 25 | 42.93 (19.30–205.41); n = 7 | 24.95 (0.85–53.72); n = 10 | 23.50 (8.00–70.52); n = 5 |
| Cr | 0.18 (0.03–0.80); n = 19 | 0.24 (0.07–0.41); n = 2 | 0.25 (0.06–0.97); n = 4 | 0.04 (0.04–0.04); n = 1 |
| Cu | 4.32 (2.0–62.0); n = 31 | 4.00 (2.47–4.72); n = 8 | 4.15 (3.04–7.29); n = 10 | 4.09 (3.00–6.55); n = 5 |
| Hg | 2.78 (0.20–52.0); n = 30 | 4.80 (2.70–7.79); n = 7 | 2.30 (0.31–6.70); n = 10 | 5.96 (1.08–9.80); n = 4 |
| Mo | 0.05 (0.02–0.80); n = 7 | 0.04 (0.04–0.04); n = 1 | 0.05 (0.03–0.35); n = 3 | 0.05 (0.05–0.05); n = 1 |
Table 5.
Toxic metal concentrations in Delphinidae liver and kidney by species and age category.
| Median conc. in ppm (min-max) | ||||
|---|---|---|---|---|
| Bottlenose Dolphin | Short-Beaked Common Dolphin | |||
| Liver | ||||
| Male | Female | Male | Female | |
| As | 0.95 (0.90–1); n = 2 | 1.20 (0.90–7.70); n = 8 | 0.67 (0.67–0.67); n = 1 | 2.30 (0.90–3.70); n = 2 |
| Cd | 0.63 (0.01–77.1); n = 7 | 0.40 (0.0–84.4); n = 17 | 5.98 (4.95–9.38); n = 3 | 12.30 (0.25–107.85); n = 7 |
| Cr | 0.11 (0.04–0.20); n = 4 | 0.16 (0.04–0.24); n = 13 | 0.14 (0.06–0.14); n = 3 | |
| Cu | 7.82 (2.54–175); n = 8 | 8.65 (3.5–98.3); n = 22 | 11.00 (8.34–13.6); n = 3 | 8.37 (4.30–12.0); n = 7 |
| Hg | 5.29 (0.70–73.6); n = 8 | 8.13 (0.5–179.9); n = 22 | 74 (54.5–93.3); n = 3 | 61.6 (0.46–104.7); n = 7 |
| Kidney | ||||
| As | 1.20 (1.20–1.20); n = 1 | 1.0 (0.40–2.00); n = 8 | 0.57 (0.57–0.57); n = 1 | 1.70 (1.70–1.70); n = 1 |
| Cd | 1.93 (0.01–60.5); n = 6 | 1.33 (0.0–19.6); n = 18 | 18.0 (10.42–24.8); n = 3 | 28.51 (0.85–53.72); n = 7 |
| Cr | 0.10 (0.10–0.13); n = 3 | 0.18 (0.03–0.80); n = 14 | 0.29 (0.29–0.29); n = 1 | 0.21 (0.06–0.97); n = 3 |
| Cu | 3.75 (3.00–5.00); n = 6 | 4.96 (2.00–62); n = 23 | 3.61 (3.04–4.25); n = 3 | 4.93 (3.40–7.29); n = 7 |
| Hg | 2.24 (0.60–10); n = 6 | 2.78 (0.20–52); n = 22 | 2.20 (2.09–2.75); n = 3 | 2.31 (0.31–6.70); n = 7 |
Table 6.
Toxic metal concentrations in Bottlenose dolphins liver and kidney by age category.
| Median conc. in ppm (min-max) | ||
|---|---|---|
| Adults | Non-adults | |
| Liver | ||
| As | 1.80 (1.00–7.70); n = 6 | 0.90 (0.90–1.20); n = 5 |
| Cd | 0.62 (0.07–83.17); n = 8 | 21.98 (0.00–84.38); n = 12 |
| Cr | 0.17 (0.04–0.23); n = 6 | 0.16 (0.06–0.24); n = 9 |
| Cu | 5.10 (3.00–14.47); n = 10 | 11.49 (2.54–175.00); n = 17 |
| Hg | 53.05 (13.00–179.90); n = 10 | 3.95 (0.50–138.10); n = 17 |
| Kidney | ||
| As | 1.50 (1.20–2.00); n = 5 | 0.80 (0.40–1.20); n = 5 |
| Cd | 0.88 (0.28–101.83); n = 10 | 24.61 (0.01–192.61); n = 11 |
| Cr | 0.18 (0.10–0.23); n = 6 | 0.16 (0.03–0.80); n = 10 |
| Cu | 3.83 (2.00–6.64); n = 10 | 4.96 (2.80–62.00); n = 17 |
| Hg | 7.90 (2.86–15.60); n = 10 | 0.80 (0.26–52.00); n = 16 |
Table 7.
Toxic metal concentrations in Phocidae liver and kidney by species category.
| Median conc. in ppm (min-max) | |||
|---|---|---|---|
| Gray Seals | Harbor Seals | Harp Seals | |
| Liver | |||
| As | 1.39 (0.94–1.72); n = 4 | 0.53 (0.50–0.56); n = 2 | 0.55 (0.51–0.55); n = 3 |
| Cd | 0.16 (0.06–43.33); n = 4 | 44.72 (0.39–57.86); n = 5 | 3.53 (2.04–38.98); n = 8 |
| Cu | 14.60 (9.08–35.00); n = 5 | 11.60 (10.32–16.42); n = 5 | 10.74 (2.96–19.00); n = 9 |
| Hg | 2.18 (1.04–3.36); n = 4 | 3.60 (1.09–5.67); n = 5 | 2.78 (0.60–67.56); n = 7 |
| Mo | 0.52 (0.40–0.71); n = 5 | 0.47 (0.46–0.48); n = 4 | 0.33 (0.21–0.84); n = 9 |
| Kidney | |||
| As | 0.98 (0.71–1.15); n = 4 | 0.73 (0.69–0.78); n = 2 | 0.64 (0.52–0.76); n = 2 |
| Cd | 0.54 (0.16–74.34); n = 5 | 39.63 (1.59–71.29); n = 5 | 7.40 (0.13–81.87); n = 9 |
| Cu | 0.98 (0.71–1.15); n = 4 | 0.73 (0.69–0.78); n = 2 | 0.64 (0.52–0.76); n = 2 |
| Hg | 1.19 (0.97–1.73); n = 4 | 2.07 (0.63–3.78); n = 5 | 0.83 (0.60–1.56); n = 7 |
Table 8.
Organochlorine concentrations in Delphinidae and Phocidae blubber by age and sex.
| Organochlorine | Median conc. in ppm (min-max) | ||
|---|---|---|---|
| Delphinidae | Phocidae | p_value | |
| α-Chlordane | 0.06 (0.01–0.78); n = 10 | NA (Inf–-Inf); n = 0 | NA |
| p_p_DDT | 1.30 (0.00–84.00); n = 25 | 1.31 (1.31–1.31); n = 1 | 1 |
| p_p_DDE | 2.66 (0.06–2950.00); n = 52 | 1.80 (0.29–4.25); n = 14 | 0.185 |
| p_p_DDD | 0.35 (0.01–614.00); n = 39 | 0.06 (0.02–0.54); n = 10 | 0.0003* |
| Dieldrin | 0.22 (0.00–303.00); n = 37 | 0.07 (0.00–0.23); n = 13 | 0.0368* |
| Lindane | 0.06 (0.01–0.44); n = 9 | 0.45 (0.45–0.45); n = 1 | 0.2 |
| trans-Nonachlor | 0.46 (0.04–16.10); n = 20 | 0.33 (0.07–1.76); n = 13 | 0.32 |
| Oxychlordane | 0.20 (0.03–141.00); n = 26 | 0.21 (0.05–1.40); n = 13 | 0.644 |
| Total PCB | 6.70 (0.00–239.00); n = 43 | 3.98 (0.50–14.40); n = 14 | 0.131 |
Table 9.
Organochlorine concentration in Delphinidae and Phocidae blubber by age category and sex.
| Organochlorine | Median conc. in ppm (min-max) | ||
|---|---|---|---|
| Delphinidae | |||
| Adults | Non-adults | p_value | |
| α-Chlordane | 0.02 (0.01–0.78); n = 4 | 0.01 (0.01–0.01); n = 1 | 1 |
| p_p_DDT | 36.00 (0.87–84.00); n = 7 | 1.25 (0.29–75.00); n = 13 | 0.0236* |
| p_p_DDE | 9.48 (0.06–2081.00); n = 14 | 2.30 (0.07–2950.00); n = 23 | 0.175 |
| p_p_DDD | 5.23 (0.08–378.00); n = 12 | 0.31 (0.01–614.00); n = 16 | 0.15 |
| Dieldrin | 41.60 (0.04–131.00); n = 10 | 0.14 (0.00–303.00); n = 15 | 0.0695 |
| Lindane | 0.08 (0.03–0.44); n = 6 | ||
| trans-Nonachlor | 1.41 (0.21–16.10); n = 5 | 0.39 (0.04–3.00); n = 5 | 0.295 |
| Oxychlordane | 10.55 (0.05–57.00); n = 10 | 21.00 (0.06–141.00); n = 7 | 0.669 |
| Total PCB | 6.50 (2.12–239.00); n = 13 | 6.33 (0.00–42.60); n = 16 | 0.511 |
| Male | Female | ||
| α-Chlordane | 0.06 (0.01–0.40); n = 6 | 0.05 (0.01–0.78); n = 4 | 0.831 |
| p_p_DDT | 1.20 (0.00–1.69); n = 4 | 1.25 (0.17–84.00); n = 19 | 0.505 |
| p_p_DDE | 0.92 (0.06–14.21); n = 15 | 3.66 (0.07–2950.00); n = 35 | 0.0432* |
| p_p_DDD | 0.14 (0.02–1.32); n = 12 | 0.35 (0.01–614.00); n = 25 | 0.0515 |
| Dieldrin | 0.12 (0.00–1.19); n = 11 | 0.24 (0.00–303.00); n = 24 | 0.128 |
| Lindane | 0.06 (0.01–0.44); n = 4 | 0.06 (0.02–0.32); n = 5 | 1 |
| trans-Nonachlor | 0.36 (0.04–3.16); n = 8 | 0.58 (0.07–16.10); n = 12 | 0.375 |
| Oxychlordane | 0.06 (0.03–0.43); n = 7 | 0.18 (0.04–82.00); n = 17 | 0.0609 |
| Total PCB | 2.35 (0.00–48.80); n = 11 | 7.19 (2.12–239.00); n = 30 | 0.0244* |
| Phocidae | |||
| Adults | Non-adults | p_value | |
| p_p_DDE | 3.37 (2.20–4.25); n = 4 | 1.60 (0.80–4.13); n = 7 | 0.109 |
| p_p_DDD | 0.05 (0.04–0.54); n = 4 | 0.06 (0.02–0.12); n = 6 | 1 |
| Dieldrin | 0.03 (0.00–0.06); n = 4 | 0.10 (0.02–0.23); n = 6 | 0.238 |
| trans-Nonachlor | 1.70 (1.68–1.76); n = 3 | 0.30 (0.07–0.65); n = 7 | 0.0167* |
| Oxychlordane | 1.09 (0.99–1.40); n = 3 | 0.14 (0.08–0.72); n = 7 | 0.0167* |
| PCB | 9.42 (2.60–14.40); n = 4 | 3.56 (1.00–9.70); n = 7 | 0.315 |
| Male | Female | ||
| p_p_DDE | 0.80 (0.29–0.93); n = 3 | 2.20 (0.70–4.25); n = 11 | 0.0604 |
| p_p_DDD | 0.08 (0.08–0.08); n = 1 | 0.06 (0.02–0.54); n = 9 | 0.48 |
| Dieldrin | 0.09 (0.08–0.23); n = 3 | 0.04 (0.00–0.17); n = 10 | 0.15 |
| trans-Nonachlor | 0.23 (0.11–0.65); n = 3 | 0.37 (0.07–1.76); n = 10 | 0.573 |
| Oxychlordane | 0.12 (0.05–0.33); n = 3 | 0.22 (0.08–1.40); n = 10 | 0.371 |
| Total PCB | 1.00 (0.50–4.40); n = 3 | 4.84 (1.10–14.40); n = 11 | 0.0879 |
Table 10.
Organochlorine concentrations in Delphinidae blubber by species category.
| Organochlorine | Median conc. in ppm (min-max) | p value |
|||
|---|---|---|---|---|---|
| Bottlenose Dolphin | Risso's Dolphin | Short-Beaked Common Dolphin | Striped Dolphin | ||
| α-Chlordane | 0.01 (0.01–0.78); n = 4 | 0.03 (0.03–0.03); n = 1 | 0.08 (0.04–0.08); n = 3 | 0.40 (0.40–0.40); n = 1 | 0.501 |
| p_p_DDT | 2.92 (0.29–84); n = 17 | 0.43 (0.00–0.87); n = 2 | 18.45 (0.89–36); n = 2 | 0.42 (0.17–0.68); n = 2 | 0.112 |
| p_p_DDE | 3.66 (0.07–2950); n = 29 | 0.96 (0.39–2.47); n = 6 | 1.08 (0.06–750); n = 10 | 6.35 (4.24–10.3); n = 4 | 0.236 |
| p_p_DDD | 1.72 (0.01–614); n = 21 | 0.15 (0.02–0.72); n = 6 | 0.17 (0.12–43); n = 6 | 0.35 (0.14–1.32); n = 3 | 0.269 |
| Dieldrin | 0.91 (0.00–303); n = 19 | 0.13 (0.00–0.37); n = 6 | 0.20 (0.04–80); n = 6 | 0.22 (0.11–1.07); n = 3 | 0.282 |
| Lindane | 0.04 (0.02–0.07); n = 5 | 0.22 (0.01–0.44); n = 2 | 0.311 | ||
| trans-Nonachlor | 1.25 (0.07–16.1); n = 5 | 0.36 (0.21–0.65); n = 4 | 0.40 (0.04–3); n = 7 | 2.24 (0.51–3.68); n = 3 | 0.288 |
| Oxychlordane | 42 (0.13–141); n = 12 | 0.06 (0.03–0.11); n = 4 | 0.07 (0.04–19); n = 6 | 0.16 (0.10–0.41); n = 3 | 0.003* |
| Total PCB | 8.55 (1.06–239); n = 22 | 2.58 (0.00–4.29); n = 6 | 6.26 (0.6–40.1); n = 10 | 13 (6.7–21.2); n = 4 | 0.047* |
Table 11.
Organochlorine concentrations in Bottlenose Dolphin blubber by age category.
| Organochlorine | Median conc. in ppm (min-max) | |
|---|---|---|
| Adults | Non-adults | |
| p_p_DDT | 40.00 (2.92–84.00); n = 5 | 1.47 (0.29–75.00); n = 10 |
| p_p_DDE | 43.16 (0.42–2081.00); n = 10 | 3.63 (0.07–2950.00); n = 15 |
| p_p_DDD | 54.14 (0.08–378.00); n = 8 | 0.39 (0.01–614.00); n = 11 |
| Dieldrin | 91.00 (0.04–131.00); n = 7 | 0.53 (0.00–303.00); n = 10 |
| Oxychlordane | 46.00 (0.23–57.00); n = 6 | 32.50 (0.13–141.00); n = 6 |
| PCB | 13.40 (2.12–239.00); n = 9 | 8.55 (1.06–42.60); n = 10 |
Table 12.
Organochlorine concentrations in blubber of Phocidae by species category.
| Organochlorine | Median conc. in ppm (min-max) | |
|---|---|---|
| Gray Seals | Harp Seals | |
| p_p_DDE | 2.54 (0.80–4.13); n = 4 | 1.51 (0.29–4.25); n = 8 |
| p_p_DDD | 0.05 (0.02–0.07); n = 4 | 0.07 (0.04–0.54); n = 6 |
| Dieldrin | 0.02 (0.02–0.07); n = 3 | 0.07 (0.00–0.23); n = 8 |
| trans-Nonachlor | 0.18 (0.07–0.30); n = 4 | 0.65 (0.23–1.76); n = 7 |
| Oxychlordane | 0.11 (0.08–0.24); n = 4 | 0.33 (0.12–1.40); n = 7 |
| Total PCB | 8.60 (2.83–9.70); n = 4 | 2.48 (0.50–14.40); n = 8 |
Disclaimer/Publisher’s Note: The statements, opinions and data contained in all publications are solely those of the individual author(s) and contributor(s) and not of MDPI and/or the editor(s). MDPI and/or the editor(s) disclaim responsibility for any injury to people or property resulting from any ideas, methods, instructions or products referred to in the content. |
© 2025 by the authors. Licensee MDPI, Basel, Switzerland. This article is an open access article distributed under the terms and conditions of the Creative Commons Attribution (CC BY) license (http://creativecommons.org/licenses/by/4.0/).
Copyright: This open access article is published under a Creative Commons CC BY 4.0 license, which permit the free download, distribution, and reuse, provided that the author and preprint are cited in any reuse.


