
Submitted:
10 June 2025
Posted:
11 June 2025
You are already at the latest version
Abstract
Objectives: To examine travel distance and its impact on wait time for Positron emission tomography–computed tomography (PET/CT) in patients with lung, lymphoma, and prostate cancers in Alberta.
Methods: We used Alberta cancer registry and diagnostic imaging database to identify patients with lung, lymphoma, and prostate cancers who had a PET/CT scan during April 2017 and March 2023. Alberta Facilities Distance/Time Look Up Table was used to calculate travel distance from patient’s residence to PET/CT facility. Negative binomial regression was used to assess association between travel distance and wait time for PET/CT.
Results: The study included 9,503 patients. Lung cancer accounted for 43.4% of patients, followed by lymphoma (37.1%) and prostate (19.5%) cancers. There were more female patients with lung (55.5%) than lymphoma (42.9%; p< 0.001) cancers. Mean (SD) age was 66.8 (13.8) years and lymphoma patients were younger (59.6 years) than lung (70.3 years; p< 0.001) or prostate (72.7 years; p< 0.001) patients. Diabetes (14.2%) was the most prevalent comorbidity. Median (IQR) travel distance was 21 (12-121) km and was shorter for urban (16 km) than rural (148 km; p< 0.001) patients, but wait time was similar (median=20 vs. 21 days; p=0.378). There were no significant associations between travel distance and wait time (IRR=1.00; p=0.108). The results were robust in subgroup analyses by type of cancer and scan priority.
Conclusion: There were no associations between travel distance and wait time for PET/CT. Additional research is warranted to examine the potential impact of longer travel distance on overall access to care and patient outcomes.
Keywords:
travel distance
; travel time
; wait time
; PET/CT
; cancers
1. Introduction
Cancer is a common condition in developed countries with an aging population. The Canadian Cancer Society estimates that approximately 50% of Canadians could develop cancer during their lifetime. Even though the mortality rate has decreased remarkably over time, cancer is still the leading cause of death for Canadians where one-fourth of all deaths in Canada could be attributed to cancer.[1] The sex-age standardized incidence rate for all cancers has been projected to decrease among males (from 464.8 to 443.2 per 100,000 population between 2003-2007 and 2028-2032) but to increase among females (from 358.3 to 371.0 per 100,000 population between 2003-2007 and 2028-2032).[2] Due to a combination effect of continued population growth and population aging in Canada in the coming years, it is estimated that the absolute number of new cancer cases could escalate in both sexes to 280,000 cases in 2028-2032.[2,3] Accordingly, the economic burden of cancer care in Canada increased from $3.7 billion (in 2024 CA$ value) in 2005 to $8.3 billion (in 2024 CA$ value, equaling 3.6% of total health expenditure) in 2012 and is expected to increase further in the future.[4,5,6]
Alberta has an integrated, publicly funded, and universally covered healthcare system serving a population of over four million people in five health zones in a large and diverse geographical area (Supplementary Figure S1). The cancer epidemic in the province has been projected to follow suit with the national trends. One in two people may develop a cancer during their lifetime, of which breast (for women), prostate (for men), lung, and colorectal cancers are most prevalent.[7] Lymphoma cancer is also quite common in both men and women.[7,8] The total number of cancer cases in the province was projected to reach 22,000 in 2021 (approximately 482 cases per 100,000 population), representing a 115% increase from 1996.[7] The total healthcare costs related to cancer in Alberta were previously estimated at $623.6 million (in 2024 CA$ value) per year.[5,9]
Positron emission tomography–computed tomography (PET/CT) is considered an emerging clinical diagnostic imaging technique that could greatly assist diagnosis and treatment of several diseases, including cancer. PET/CT is currently recommended for initial staging, restaging, and treatment response assessments in patients with lung, lymphoma, and prostate cancers in Canadian, American, and European guidelines.[8,10] Presently, there are four PET/CT facilities with five scanners located in the two biggest urban centres in Alberta. There is one scanner each in the Cross Cancer Institute, Royal Alexandra Hospital, and University of Alberta Hospital in the city of Edmonton, while the Foothills Medical Centre in the city of Calgary has two scanners (Supplementary Table S1 and Supplementary Figure S1). Patients with a PET/CT order may need to enter a booking system and join a waitlist for the scan. However, there is no single central booking system for PET/CT in Alberta, so the facility of choice is dependent on physician and patient’s preference, travel distance, and availability and wait time at the target scanning facility. Generally, the Cross Cancer Institute can receive patients from anywhere in the province. Patients from the South and Calgary zones mostly have PET/CT scans at the Foothills Hospital while patients in the North and Edmonton zones can have services at the University of Alberta Hospital or Royal Alexandra Hospital. Patients in the Central zone can go to either facility based on its availability and corresponding wait time. AHS recommends target wait time for PET/CT ranging from 2 to 6 weeks depending on the priority of the scan which includes priority 1 (urgent), 2 (semi-urgent), 3 (not urgent), and 4 (scheduled exams). There are no wait time targets for scheduled exams as they are determined by the physicians for their clinical decision and the patients do not have to enter the waitlist for a PET/CT scan (Supplementary Table S2).[11]
Previous studies suggested that increased travel burden may contribute to delayed diagnosis and treatment, reduced treatment adherence and health outcomes, increased disparity in healthcare access, and increased financial strains in patients with cancer.[12,13,14] There is a lack of current literature on travel distance from patient’s residence to PET/CT facility and wait time for the scanning procedure for patients with cancers in Alberta. Accordingly, we evaluated travel distance, wait time for PET/CT, and whether travel distance could have an impact on wait time for the procedure in patients with lung, lymphoma, and prostate cancers. The study findings could support policy decision-making on the capacity, demand, supply, and use of PET/CT in patients with cancers in Alberta.
2. Methods
2.1. Data Source and Study Population
We conducted a population-based retrospective cohort study using Alberta Cancer Registry (ACR) and Alberta administrative datasets to include patients aged ≥18 years with lung, lymphoma, and prostate cancers who were active at any time in the ACR and used PET/CT between April 1, 2017, and March 31, 2023 (the study period). The ACR contains a complete register of patients diagnosed or treated with cancer in Alberta from 1982 and provides rich data on patient such as demographics, referrals to medical oncologists, tumour topography and morphology at diagnosis, and treatments during patient follow-up.[15] The North American Association of Comprehensive Cancer Registries has recognized the excellent quality of the ACR data.[16]
The ACR was linked to other Alberta administrative health datasets, including the diagnostic imaging (DI) database and population registry using unique personal healthcare numbers.[17] The DI database records all DI encounters for patients (e.g., X-Ray or PET/CT) and the population registry provides demographics for all inhabitants of Alberta who are members of the Alberta Health Care Insurance Plan.[17,18,19]
2.2. Variables of Interest
Travel distance and time from a patient’s residence location to a PET/CT facility was based on the “Alberta Facilities Distance/Time Look Up Table” by Alberta Health Services (AHS) Applied Research and Evaluation Services.[20] Briefly, the distance along a road network (by car) travelled from a patient location (by postal code) to a healthcare facility (by exact location) were calculated using multiple linked datasets, including Postal Code Translation File, DMTI Route Logistics Road Network File, Alberta Municipality Data Sharing Partnership road data, and AHS Facility Locations. The calculation considered several factors potentially affecting travel distance and time, such as one-way road, primary/secondary road (with posted speed limit), and winter travel. The road network model was validated using actual travel times from emergency medical services interfacility transfer (non-urgent) data. An optimal scenario (with posted speed limit and no delays due to rush hour, road closure, or traffic accidents) was used to generate travel distance and time. The method of calculating travel distance and travel time has been used previously.[21]
The wait time for a PET/CT scan was defined as the time from the order (or booking) date, when the physician and patient agreed to the PET/CT scan, to the service date, when the PET/CT scan was performed. Because the PET/CT procedures could also be used for non-cancer conditions, we only considered the PET/CT scans ordered after the date of cancer diagnosis (incidence), assuming that these PET/CT scans were for cancers. We followed wait time computation methods from Canadian Institute for Health Information and AHS in which we excluded scans that were for inpatient/emergency patients (7.5% of the study cohort) because these patients usually did not have to wait and there is no target wait time for this patient group. We also excluded a scanning encounter that the patient deferred the planned scan (5.7% of the study cohort).[11,22]
2.3. Statistical Analysis
Patient characteristics and unadjusted outcomes (i.e., travel distance or wait time) were reported as mean (standard deviation), median (interquartile range), and count (proportion), as appropriate. T-test and Kruskal-Wallis test were used for continuous variables and χ2 test was used for categorical variables, respectively. Patient median household income in the residential neighborhood (forward sortation area level) was based on the 2021 Canada Census (provided by Alberta Health), while residency (urban or rural) was based on the 2nd digit of the postal code.[23] Previously validated International Classification of Diseases codes were used to identify patient comorbidities,[24] which were considered to be present if they were recorded in the Discharge Abstract Database or National Ambulatory Care Reporting System during one year before the PET/CT order date.
We calculated travel distance and wait time for both the first PET/CT scan and subsequent scans during the study period. We excluded scheduled exams from the models examining the risk-adjusted association between travel distance and wait time because the wait time of scheduled exams was pre-determined by physicians. Further, we only included the first scan in modelling because initial data examination indicated that the travel distance and wait time were found similar between the first scan and subsequent scans and 71.3% of the subsequent scans were scheduled exams. Therefore, adding subsequent scans would not improve the models while it could introduce additional bias due to within patient interactions. In addition to a model for the whole study cohort, we performed subgroup analyses where we evaluated adjusted associations between travel distance and wait time by type of cancer and for urgent and semi-urgent scan priorities which accounted for the majority of the scans.
We used multivariable negative binomial regressions to assess the association between travel distance and wait time. The primary variables of interest were travel distance (in unit of 10km), patient sex, age, type of cancer, residence location (urban or rural), and health zone. We first included the primary variables and additional risk factors in the model and used a backward stepwise variable selection process with Likelihood Ratio (LR) test to examine retainment of the additional risk factors in the final regression model. The additional risk factors included household income quartiles, Charlson comorbidity score, scan priority, scan year, number of tumors, cancer stage at incidence, time from the cancer incidence to the PET/CT order date, whether the patient had another cancer, and the scanning facility. Except for the primary variables, a variable remained in the final regression model if the LR test was significant at a 10% level. We did not use the traditional stopping rule of 5% significant level because it has been reported that a strict rule could lead to exclusion of important variables.[25,26,27]
All analyses were performed using SAS Studio (SAS Institute, NC) and Stata version 14 (Stata Corporation, College Station, Texas); two-sided P values < 0.05 were considered statistically significant.
2.4. Sensitivity Analysis
We examined the association between travel distance and wait time for PET/CT in base case analysis. We performed another modeling exercise to assess if there could be an association between travel time and wait time.
The study period coincided with the Coronavirus 2019 (COVID-19) pandemic where public health restrictions were introduced on March 11, 2020 in Alberta.[28] It has been reported previously that there were significant declines in hospital admissions and ED visits during the pandemic in the province.[29] Therefore, we compared PET/CT wait time during pre-pandemic (ordered before March 11, 2020) and COVID-19 (ordered March 11, 2020 onwards) to examine whether COVID-19 had an impact on PET/CT wait time.
We excluded scheduled exams in the modelling to examine association between travel distance and wait time in the main analysis because the wait time for scheduled exams is pre-determined by physicians. We conducted additional analyses where we included all PET/CT scans because a patient’s travel distance might be a factor to consider when a physician decides on when they need results of the scheduled exams.
3. Results
3.1. Patient Characteristics
There were 74,220 unique patients with lung, lymphoma, and prostate cancers in Alberta who were 18 years or older at the time of cancer diagnosis and alive at least one day between April 1, 2017, and March 31, 2023 (the study period). After excluding patients who did not undertake a PET/CT scan, who had a PET/CT scan ordered before the start of the study period, and patients who had a PET/CT scan ordered before the cancer diagnosis, the final study cohort included 9,503 (12.8%) patients who undertook 16,228 PET/CT scans during the study period. Of them, patients with lung cancer accounted for 43.4%, followed by lymphoma (37.1%) and prostate (19.5%) cancers. Patient selection is depicted in Figure 1.
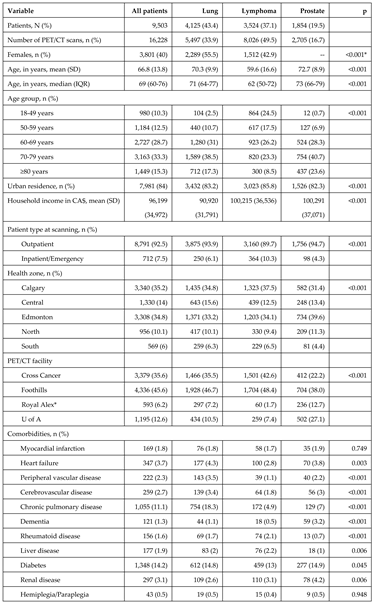
Patient characteristics at the first PET/CT scan request are presented in Table 1. There were more female patients with lung cancer (55.5%) than with lymphoma (42.9%; p<0.001). The mean (SD) age was 66.8 (13.8) years and patients with lymphoma (59.6 years) were younger than those with lung (70.3 years; p<0.001) or prostate (72.7 years; p<0.001) cancers. Eighty-four percent of patients resided in urban areas.
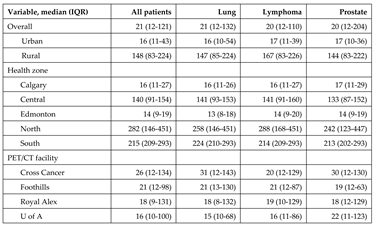
Diabetes (14.2%) and chronic pulmonary disease (11.1%) were the two most prevalent comorbidities, and they were more common in patients with lung and prostate cancers than those with lymphoma, especially for chronic pulmonary disease where almost one of five patients with lung cancer had it (18.3%). Both diabetes (16.2% vs. 13.8%; p=0.013) and chronic pulmonary disease (15.4% vs. 10.3%; p<0.001) were also more prevalent in patients who resided in rural areas compared to those in urban areas. Patients with lung cancer had a higher Charlson score (mean=3.7) than patients with lymphoma (mean=2.9; p<0.001) and patients with prostate (mean=3.1; p<0.001) cancers. However, there were no differences in Charlson score between urban (mean=3.3) and rural (mean=3.4; p=0.165) patients.
Patients residing in the Calgary zone (35.2%) and Edmonton zone (34.8%) accounted for 70% of the patients, while the South zone (6%) contributed the least patients. Of the four PET/CT facilities in Alberta, Foothills Hospital led the services provision with 45.6%, followed by the Cross Cancer Institute with 35.6% (Table 1).
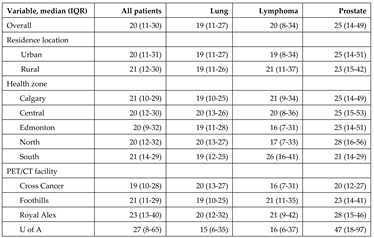
3.2. Travel Distance
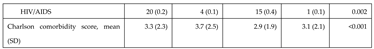
Overall, a patient with cancer travelled a median (IQR) of 21 (12-121) km to receive a PET/CT scan. The travel distance was shorter for patients in urban areas (median=16 km) than those in rural areas (median=148 km; p<0.001). Patients in Calgary and Edmonton zones only travelled a fraction of the distance (16 and 14 km, respectively) that their counterparts in Central (140 km), North (282 km), and South (215 km) zones, because all 4 PET/CT facilities are located in the 2 respective cities (Table 2).
Travel time in optimal conditions (e.g., no roadblocks and at optimal speed) to PET/CT facilities is presented in Supplementary Table S3. Overall, a patient spent a median of 40 minutes to go for a PET/CT scan in Alberta. The travel time also greatly varied between urban (36 minutes) and rural (121 minutes; p<0.001) areas and across health zones (a minimum of 31 minutes in Edmonton to a maximum of 203 minutes in North zone; p<0.001). Although the travel time also differed between facilities (p<0.001), the difference was only 10 minutes (a minimum of 34 minutes at the University of Alberta Hospital to a maximum of 44 minutes at the Cross Cancer Institute).
3.3. Wait Time for PET/CT
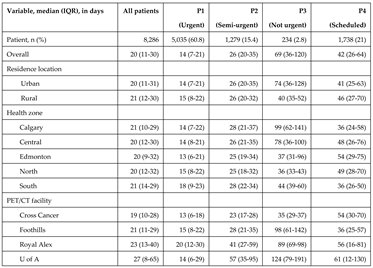
Of 9,503 first PET/CT scans during the study period, 712 (7.5%) were from inpatient/emergency units and were excluded from wait time calculations. Of the remaining 8,791 outpatient patients’ scans, we further excluded 505 (5.7%) who requested a delay in scanning or if the indication of priority was not available, resulting in a cohort of 8,286 patients for wait time calculations. There were no differences between the wait time patient cohort and patients who delayed the scan (excluded) with regard to sex, age, residence location, median household income, and Charlson comorbidity score. However, close to half of the delayed patients were those who resided in the Edmonton zones (47.7%) (Supplementary Table S4).
The median (IQR) wait time was 20 (11-30) days. Wait time for patients with lung (median=19 days) and lymphoma (median=20 days) cancers was shorter than that in patients with prostate cancer (median=25 days; p<0.001) (Table 3). Although the travel distance greatly differed between urban and rural areas, the wait time was similar between the two regions (20 days vs. 21 days; p=0.378). Similarly, there were no differences in wait time between the five health zones in Alberta (p=0.162) despite a substantial disparity in travel distances that patients resided in these health zones had (Table 2). Although there were variations in wait time between facilities, the wait time met AHS target recommendations for patients with urgent and semi-urgent priorities who accounted for 96.4% of patients who had to enter the waitlist and wait time is subjected to an AHS target (Table 4).
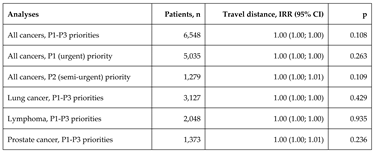
Before risk adjustment, there were no significant associations between travel distance and wait time for the first PET/CT scan in Alberta (IRR=1.00; p=0.852). After adjusting for patient and regional characteristics, there were no significant associations between travel distance and wait time (IRR=1.00; p=0.108) for the first scan (Table 5). The adjusted wait time was similar between rural and urban areas (IRR=1.00; p=0.943). Compared to patients who resided in the Calgary zone, the wait time for PET/CT was similar for patients living in the Central (IRR=1.00; p=0.952), Edmonton (IRR=0.99; p=0.819), North (IRR=1.01; p=0.891) and South (IRR=1.02; p=0.607) zones. Patients at the Foothills (IRR=1.25; p<0.001), Royal Alexandra (IRR=1.37; p<0.001) and University of Alberta (IRR=1.88; p<0.001) Hospitals had a longer wait time than those who attended the Cross Cancer Institute (Supplementary Table S5).
Subgroup analyses by scan priority and type of cancer showed similar results. There were no associations between travel distance and wait time in patients with an urgent (IRR=1.00; p=0.263) and semi-urgent (IRR=1.00; p=0.109) scan priorities, and in patients with lung (IRR=1.00; p=0.429), lymphoma (IRR=1.00; p=0.935), and prostate (IRR=1.00; p=0.236) cancers (Table 5). Detailed results of negative binomial regressions assessing associations between travel distance and wait time for PET/CT by scan priority and by type of cancer are presented in Supplementary Tables S6-S7 and S8-S10, respectively.
3.4. Sensitivity Analysis
Similar to travel distance, travel time had no significant association with wait time for PET/CT for all patients (IRR=1.00; p=0.159). The results were robust in two analyses by scan priorities (urgent and semi-urgent) and three analyses by type of cancer (lung, lymphoma, and prostate) (Supplementary Table S11).
There were no differences in PET/CT wait time during the pre-pandemic (20 days) and COVID-19 (21 day; p=0.209) periods. The wait time was also similar between the pre-pandemic and COVID-19 periods in urban (20 vs. 21 days; p=0.403) and rural (21 vs. 20 days; p=0.200) areas (Supplementary Table S12).
Results of sensitivity analyses with addition of scheduled exams (priority 4) are presented in Supplementary Table S13. The trends remained with no association between travel distance and wait time for all patients (IRR=1.00; p=0.107), patients with lung (IRR=1.00; p=0.950) and lymphoma (IRR-1.00; p=0.823). However, a 10-km longer travel distance was associated with a 1% increase (or 0.2 days) in wait time (IRR=1.01; p=0.034) in patients with prostate cancer. Further, a 10-km longer travel distance was found significantly associated with a 1% decrease (approximately 0.7 days) in wait time (IRR=0.99; p=0.019) in patients with a non-urgent (priority 3) priority though the sample size was small (234 patients).
4. Discussion
Our population-based retrospective cohort study of patients with lung, lymphoma, and prostate cancers in Alberta who ordered and had a PET/CT scan between April 2017 and March 2023 found that a majority of patients resided in Calgary and Edmonton zones and they received PET/CT scans mainly from the Foothills Hospital (45.6%) and Cross Cancer Institute (35.6%). The other two PET/CT facilities (the University of Alberta and Royal Alexandra Hospitals) provided a smaller share of the PET/CT services in the province for patients with these three cancers. There was a substantial variation in travel distance for PET/CT between patients in urban areas (16 km) and rural areas (148 km) as well as across health zones (ranged 14 - 282 km). However, the wait time was similar between patients in urban areas (20 days) and rural areas (21 days). Wait time was almost the same across health zones (20-21 days). The wait time for PET/CT met AHS target wait time recommendations for urgent and semi-urgent priority patient groups which accounted for 96.4% of the patients who had to enter the waitlist for PET/CT. After risk adjustments, we did not find any associations between travel distance and wait time. The results were robust in all subgroup and sensitivity analyses including using travel time as a proxy for travel burden. There was one exception, a positive association was observed between travel distance and wait time in patients with prostate cancers when scheduled exams (not subject to entering a waitlist) were taken into consideration.
The findings on no significant association between travel distance and wait time have important implications. First, it suggests that Alberta DI services for the three cancers considered in this study were delivered effectively with regard to wait time during the study period. The contrast between a similarity in wait time and a vast difference in travel distance may also suggest efficient and effective coordination between physicians, DI services, and patients. Further, the findings suggest that travel distance was generally not a barrier to meeting PET/CT wait time guidelines and access to care for an average patient with lung, lymphoma, or prostate cancer in Alberta. Therefore, additional PET/CT capacity (e.g., mobile PET/CT to rural and remote regions) may potentially reduce travel distances needed for some patients, but it may not have an impact on the overall wait time for PET/CT in Alberta. Nonetheless, long waits for diagnostic procedures could be a source of distress in patients with cancer; therefore, reducing travel distance could still support the patient’s fight against cancer and improve patient satisfaction, which is an important factor in a patient-centered healthcare system.[30]
Our findings of insignificant impact of travel distance on wait time further emphasized that travel distance (and travel time) may have complex effects on access to care and patient outcomes depending on localities, populations, and healthcare specialties.[31,32] For example, a study in the United States found no impact of increased travel distance on the risk of intervention in patients with renal trauma.[33] However, Liu et al (2022) evaluated travel distance and time for patients with osteoarthritis in Alberta to general practitioners, orthopedic surgeons, and physiotherapists in Alberta and reported a significant disparity in realized access to healthcare providers between urban and rural areas.[21] In cancer care, a study at a Rwandan cancer center that serves low-income rural population found a higher odd of late-stage diagnosis among patients living in the farthest distance quartile[34] while Myneni et al. (2025) reported a low use of ancillary services (e.g., diet or pain management consultation) in patients with pancreatic cancers with long travel distance in the United States.[35] A recent systematic review by Silverwood et al. (2024) also found both positive and negative impacts of travel distance on adherence, receiving guideline-concordance therapy, and survival in cancer patients with radiotherapy.[14]
Although we found consistent wait time for PET/CT regardless of significant variations in travel distance in this study, it should be noted that wait time for PET/CT is only a part of overall wait time for treatment and care, and there could be multiple factors throughout the care pathways that could impact the overall time to treatment. For example, Stokstad et al. suggested some common reasons for treatment delays, namely duplication in procedures, newly-discovered issues that need additional sequential diagnostic procedures, pathology report not acted upon in a timely manner, late referrals, and long wait time for diagnostic procedures.[36] Thus, further reducing PET/CT wait time (e.g., by providing mobile PET/CT services) which largely met target recommendations for this specific patient population may not have an impact on patient outcomes as well as the healthcare system in Alberta. However, adding additional PET/CT capacity could still potentially have benefits for other diseases that need PET/CT such as cardiovascular disease, neurological conditions, or other cancers. Nonetheless, an effort to identify and address other potential roadblocks in access to treatment and care may provide benefits to patients with cancer in Alberta.
Timely access to necessary care is an important metric for quality of care. The literature of the impact of wait time on patient outcomes in cancer care is not rich, not fully conclusive, and is changing over time. To our knowledge, most studies focused only on lung cancer. Several studies dated in the 2000s reported negative or no associations between wait time and patient outcomes in patients with lung cancer,[37,38,39,40,41,42] while more recent studies suggested that long wait time in general could be considered to have a negative impact on patient outcomes in addition to a being a source of increased distress in patients.[30] For example, a study by Mohamed et al. in 2011 reported a positive association between treatment delay and disease progression in patients with lung cancer in the United States which was also found in another study by Everitt et al. in 2013 in Australia.[43,44] A more recent multi-centre international prospective cohort study with a larger sample size in 2021 that used time interval between staging and radiotherapy planning PET/CT scans (median=42 days) as an exposure concluded that long intervals between PET/CT imaging and treatment initiation were associated with a higher rate of progression in patients with non-small cell lung cancer.[45] The differences in findings could stem from the differences in the healthcare systems and advancements in health technology in recent decades where cancer could be diagnosed earlier and new treatments could have more powerful impacts on patient survival if provided in a timely manner.[46,47]
Although this study provides novel data on travel distance, wait time for PET/CT, and the association between travel distance and wait time, it has several limitations. First, this study only included patients who had a PET/CT scan, so patients who were ordered a PET/CT scan but did not survive long enough to receive the scan, were not included in the assessment. However, given the short wait time for PET/CT, the impact of deceased patient exclusion, if any, should be minimal. Further, it should be noted that PET/CT can also be used for other conditions (e.g., other cancers, cardiovascular, and neurological diseases) and we could not account for the impact of the waitlist of PET/CT for these conditions on the wait time for PET/CT in patients with cancers in the present study because of data unavailability.
5. Conclusions
Our population-based retrospective cohort study of patients with lung, lymphoma, and prostate cancers who used PET/CT scan in Alberta between April 2017 and March 2023 found that the wait time for PET/CT was similar across geographic regions in Alberta and met target recommendations despite a large disparity in travel distances between health zones and rural and urban areas. Generally, there were no associations between travel distance and wait time for PET/CT in this patient population. Additional research is warranted to examine if additional PET/CT capacity (e.g., mobile PET/CT) could have an impact on other groups of patients (e.g., patients with cardiovascular disease or other cancers) in Alberta.
Supplementary Materials
The following supporting information can be downloaded at the website of this paper posted on Preprints.org.
Ethics Approval
The study is a part of a health economics assessment, commissioned and approved by Alberta Primary and Preventative Health Services.
Consent to Participate
Not applicable.
Consent for Publication
Alberta Primary and Preventative Health Services approves publication.
Availability of Data and Material
This study used anonymized patient-level data. The data are not publicly available because of privacy and confidentiality requirements. However, the data could be requested for research from Alberta Primary and Preventative Health Services.
Acknowledgments
This study was supported by a financial contribution from Alberta Primary and Preventative Health Services through the Alberta Primary and Preventative Health Services/Institute of Health Economics grants (#12651 and #019109). This study is based in part on data provided by Alberta Primary and Preventative Health Services. The interpretation and conclusions contained herein are those of the researchers and do not necessarily represent the views of the Government of Alberta. Neither the Government nor Alberta Primary and Preventative Health Services express any opinion in relation to this study.
Conflicts of Interest
DT: XL, AP, RS, and MU have no conflicts of interest to declare.
References
- Canadian Cancer Statistics Advisory Committee. Canadian cancer statistics 2018. Toronto, ON: Canadian Cancer Society; 2018. Available from: cancer.ca/Canadian-Cancer-Statistics-2018-EN.
- Xie L, Semenciw R, Mery L. Cancer incidence in canada: Trends and projections (1983-2032). Health promotion and chronic disease prevention in Canada : research, policy and practice 2015;35 Suppl 1:2-186.
- Statistics Canada. Table 17-10-0057-01 (formerly cansim 052-0005) - estimates of population, by age group and sex for july 1, canada, provinces and territories [Internet]c2018 [cited February 7]. Available from: http://www5.statcan.gc.ca/cansim/pick-choisir?lang=eng&p2=33&id=0520005.
- de Oliveira C, Weir S, Rangrej J, Krahn MD, Mittmann N, Hoch JS, et al. The economic burden of cancer care in canada: A population-based cost study. CMAJ open 2018;6(1):E1-e10.
- Statistics Canada. Table 326-0020: Consumer price index (cpi) [Internet] [updated June 6, 2018; cited May 3]. Available from: http://www5.statcan.gc.ca/cansim/a26?lang=eng&retrLang=eng&id=3260020&&pattern=&stByVal=1&p1=1&p2=37&tabMode=dataTable&csid=.
- Canadian Institute for Health Information. National health expenditure trends, 1975 to 2013. 2013. Available from: https://secure.cihi.ca/free_products/NHEXTrendsReport_EN.pdf.
- Alberta Health Services. The 2019 report on cancer statistics in alberta. Edmonton, AB: Alberta Cancer Control; 2019. Available from: https://public.tableau.com/profile/cancercontrol.ab#!/vizhome/The2019ReportonCancerStatisticsinAlberta/Highlights?publish=yes.
- Alberta Health Services. Lymphoma. Edmonton, AB: Cancer Care Alberta; 2025. Available from: https://www.albertahealthservices.ca/assets/info/hp/cancer/if-hp-cancer-guide-lyhe002-lymphoma.pdf.
- Sam D, Cheung WY. A population-level comparison of cancer-related and non-cancer-related health care costs using publicly available provincial administrative data. Current Oncology; Vol 26, No 2 (2019) 2019.
- I A, D C, B G. Pet/ct capacity for cancer diagnosis and follow-up phase 1: Rapid review. Edmonton, AB: Institute of Health Economics; 2023.
- Alberta Health Services. Ahs pet/ ct prioritization guidelines. Edmonton, AB: Alberta Health Services; 2012.
- Planey AM, Spees LP, Biddell CB, Waters A, Jones EP, Hecht HK, et al. The intersection of travel burdens and financial hardship in cancer care: A scoping review. JNCI Cancer Spectrum 2024;8(5):pkae093.
- Rocque GB, Williams CP, Miller HD, Azuero A, Wheeler SB, Pisu M, et al. Impact of travel time on health care costs and resource use by phase of care for older patients with cancer. J Clin Oncol 2019;37(22):1935-45.
- Silverwood SM, Waeldner K, Demeulenaere SK, Keren S, To J, Chen JJ, et al. The relationship between travel distance for treatment and outcomes in patients undergoing radiation therapy: A systematic review. Adv Radiat Oncol 2024;9(12):101652.
- Alberta Real World Evidence Consortium. Alberta health data asset directory. Edmonton, AB: 2018. Available from: https://albertarwe.ca/wp-content/uploads/2018/07/Alberta-Health-Data-Asset-Directory-2018-1.pdf.
- Naaccr certification by registry and year [Internet]. 2019. Available from: https://www.naaccr.org/wp-content/uploads/2018/06/NAACCR-Certification-Historical-Results2018.xlsx.
- Alberta Health. Overview of administrative health datasets [Internet]. Edmonton [updated April 28, 2017; cited December 1]. Available from: https://open.alberta.ca/dataset/657ed26d-eb2c-4432-b9cb-0ca2158f165d/resource/38f47433-b33d-4d1e-b959-df312e9d9855/download/Research-Health-Datasets.pdf.
- Canadian Institute for Health Information. Discharge abstract database metadata (dad) [Internet] [cited August 12]. Available from: https://www.cihi.ca/en/discharge-abstract-database-metadata.
- Canadian Institute for Health Information. Case mix [Internet] [cited April 16]. Available from: https://www.cihi.ca/en/data-and-standards/standards/case-mix.
- Applied Research and Evaluation Services (ARES)- Primary Health Care. Alberta facilities distance/time look up table. Calgary, AB: Alberta Health Services; 2022.
- Liu X, Seidel JE, McDonald T, Patel AB, Waters N, Bertazzon S, et al. Rural-urban disparities in realized spatial access to general practitioners, orthopedic surgeons, and physiotherapists among people with osteoarthritis in alberta, canada. Int J Environ Res Public Health 2022;19(13).
- Canadian Institute for Health Information. Wait times for priority procedures in canada [Internet]. Ottawa, ON: CIHI; c2022 [cited August 23]. Available from: https://www.cihi.ca/en/wait-times-for-priority-procedures-in-canada-2022.
- Statistics Canada. Postal code conversion file (pccf), reference guide [Internet] [updated January 25, 2018; cited February 2]. Available from: https://www150.statcan.gc.ca/n1/pub/92-153-g/2011002/tech-eng.htm.
- Quan H, Sundararajan V, Halfon P, Fong A, Burnand B, Luthi JC, et al. Coding algorithms for defining comorbidities in icd-9-cm and icd-10 administrative data. Med Care 2005;43(11):1130-9.
- Bendel RB, Afifi AA. Comparison of stopping rules in forward “stepwise” regression. Journal of the American Statistical Association 1977;72(357):46-53.
- Bursac Z, Gauss CH, Williams DK, Hosmer DW. Purposeful selection of variables in logistic regression. Source Code Biol Med 2008;3:17.
- Mickey RM, Greenland S. The impact of confounder selection criteria on effect estimation. Am J Epidemiol 1989;129(1):125-37.
- Newton AS, Xie J, Wright B, Lategan C, Winston K, Freedman SB. Visits to alberta emergency departments for child mental health concerns during the covid-19 pandemic: An examination of visit trends in relation to school closures and reopenings. Pediatr Emerg Care 2023;39(7):542-7.
- Rennert-May E, Leal J, Thanh NX, Lang E, Dowling S, Manns B, et al. The impact of covid-19 on hospital admissions and emergency department visits: A population-based study. PLoS One 2021;16(6):e0252441.
- Paul C, Carey M, Anderson A, Mackenzie L, Sanson-Fisher R, Courtney R, et al. Cancer patients' concerns regarding access to cancer care: Perceived impact of waiting times along the diagnosis and treatment journey. Eur J Cancer Care (Engl) 2012;21(3):321-9.
- Jia P, Wang F, Xierali IM. Differential effects of distance decay on hospital inpatient visits among subpopulations in florida, USA. Environmental Monitoring and Assessment 2019;191(2):381.
- Jia P, Fahui W, and Xierali IM. Delineating hierarchical hospital service areas in florida. Geographical Review 2017;107(4):608-23.
- Visingardi J, Feustel PJ, Edwards K, Inouye B, Welliver C. Greater distance traveled for renal trauma care is not associated with higher rates of intervention. Eur J Trauma Emerg Surg 2025;51(1):38.
- Bhangdia K, Natarajan A, Rudolfson N, Verguet S, Castro MC, Dusengimana JV, et al. The association of travel distance and other patient characteristics with breast cancer stage at diagnosis and treatment completion at a rural rwandan cancer facility. BMC Cancer 2025;25(1):146.
- Myneni R, Pathak P, Hacker-Prietz A, He J, Kumar R, Narang AK. Effect of travel distance on utilization of ancillary services among patients with pancreatic ductal adenocarcinoma: A single institution study. Support Care Cancer 2025;33(4):282.
- Stokstad T, Sørhaug S, Amundsen T, Grønberg BH. Reasons for prolonged time for diagnostic workup for stage i-ii lung cancer and estimated effect of applying an optimized pathway for diagnostic procedures. BMC Health Serv Res 2019;19(1):679.
- Aragoneses FG, Moreno N, Leon P, Fontan EG, Folque E. Influence of delays on survival in the surgical treatment of bronchogenic carcinoma. Lung Cancer 2002;36(1):59-63.
- Bozcuk H, Martin C. Does treatment delay affect survival in non-small cell lung cancer? A retrospective analysis from a single uk centre. Lung Cancer 2001;34(2):243-52.
- Brocken P, Kiers BA, Looijen-Salamon MG, Dekhuijzen PN, Smits-van der Graaf C, Peters-Bax L, et al. Timeliness of lung cancer diagnosis and treatment in a rapid outpatient diagnostic program with combined 18fdg-pet and contrast enhanced ct scanning. Lung Cancer 2012;75(3):336-41.
- Comber H, Cronin DP, Deady S, Lorcain PO, Riordan P. Delays in treatment in the cancer services: Impact on cancer stage and survival. Ir Med J 2005;98(8):238-9.
- Myrdal G, Lambe M, Hillerdal G, Lamberg K, Agustsson T, Ståhle E. Effect of delays on prognosis in patients with non-small cell lung cancer. Thorax 2004;59(1):45-9.
- Salomaa ER, Sällinen S, Hiekkanen H, Liippo K. Delays in the diagnosis and treatment of lung cancer. Chest 2005;128(4):2282-8.
- Mohammed N, Kestin LL, Grills IS, Battu M, Fitch DL, Wong CY, et al. Rapid disease progression with delay in treatment of non-small-cell lung cancer. Int J Radiat Oncol Biol Phys 2011;79(2):466-72.
- Everitt S, Plumridge N, Herschtal A, Bressel M, Ball D, Callahan J, et al. The impact of time between staging pet/ct and definitive chemo-radiation on target volumes and survival in patients with non-small cell lung cancer. Radiother Oncol 2013;106(3):288-91.
- Bissonnette JP, Sun A, Grills IS, Almahariq MF, Geiger G, Vogel W, et al. Non-small cell lung cancer stage migration as a function of wait times from diagnostic imaging: A pooled analysis from five international centres. Lung Cancer 2021;155:136-43.
- Alexander M, Kim SY, Cheng H. Update 2020: Management of non-small cell lung cancer. Lung 2020;198(6):897-907.
- Carlisle JW, Leal T. Advancing immunotherapy in small cell lung cancer. Cancer 2023;129(22):3525-34.
Figure 1.
Patient selection flowchart.
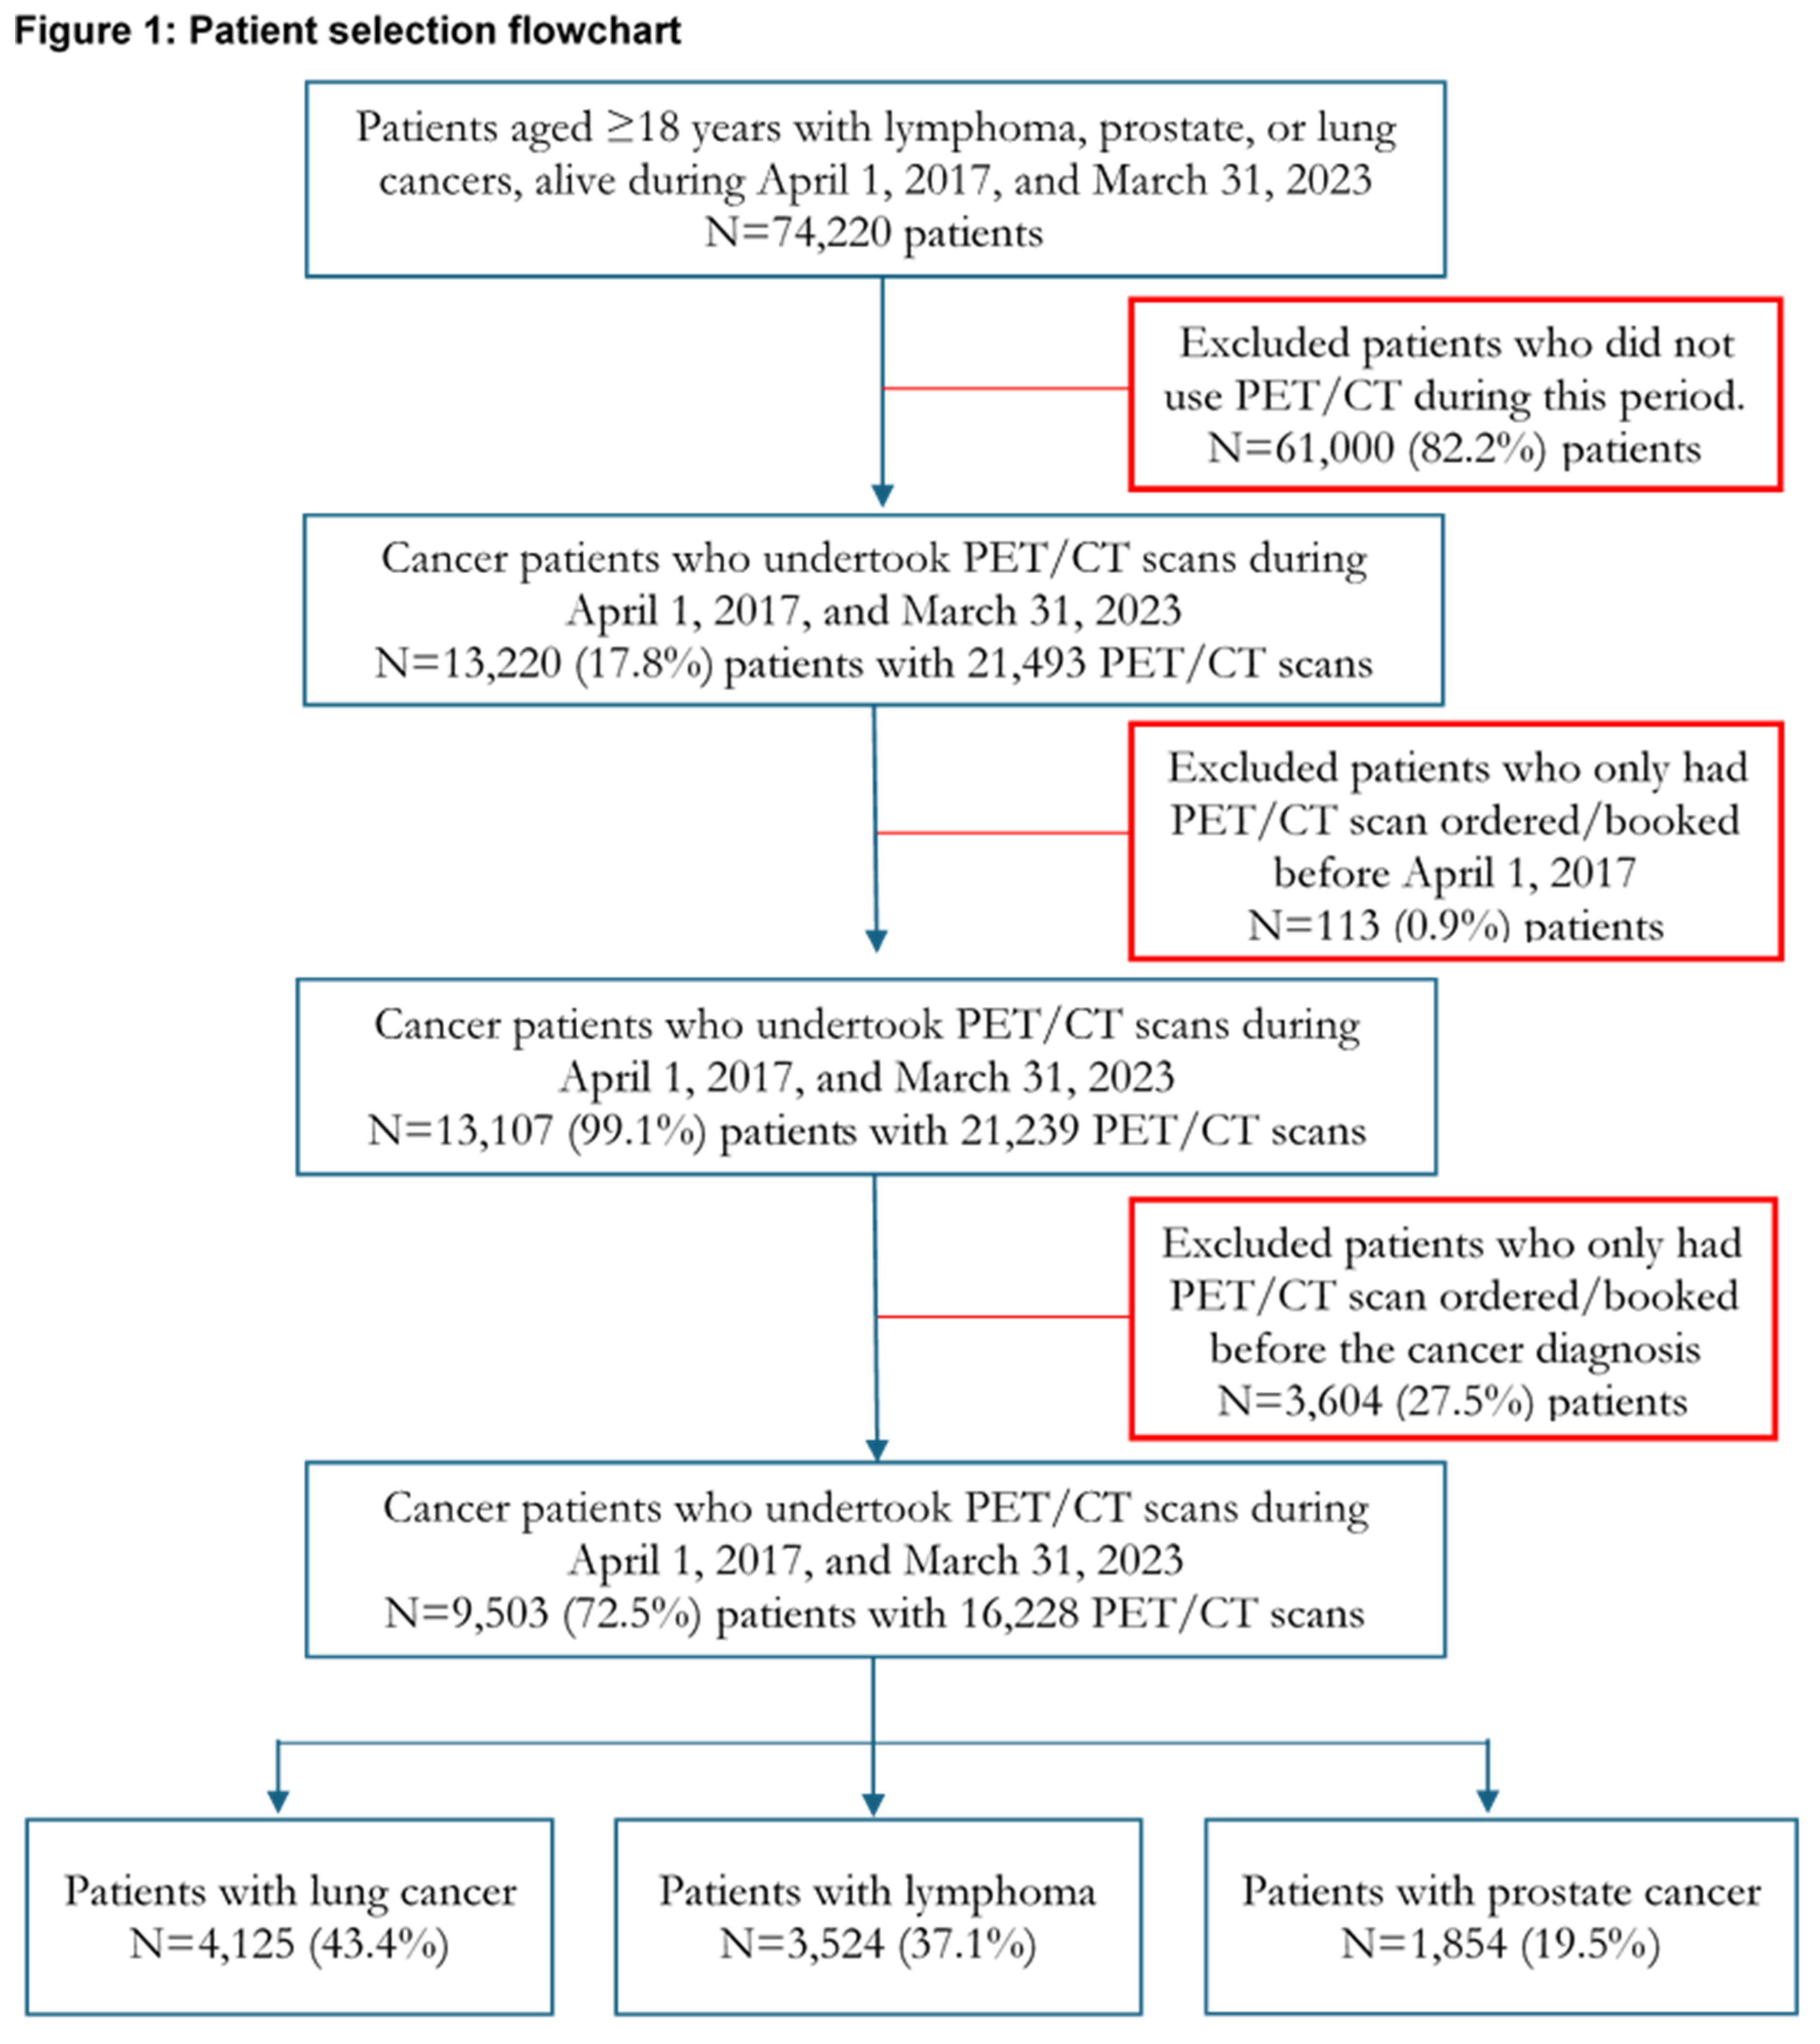

Table 1.
Patient characteristics at the first PET/CT scan request.
|
Notes: CA$= Canadian dollars; HIV/AIDS: Human Immunodeficiency Virus/ Acquired Immunodeficiency Syndrome; IQR: interquartile range; p= p-value; SD= standard deviation. *Between lung and lymphoma patients only. Cross Cancer= Cross Cancer Institute; Foothills= Foothills Hospital; Royal Alex= Royal Alexandra Hospital; U of A= University of Alberta Hospital. *Royal Alexandra Hospital started providing PET/CT in 2021.
Table 2.
Travel distance (in km) to the first PET/CT scanning (N=9,503 patients).
 |
Notes: Cross Cancer= Cross Cancer Institute; Foothills= Foothills Hospital; IQR= inter-quartile range; Royal Alex= Royal Alexandra Hospital; U of A= University of Alberta Hospital.
Table 3.
Wait time (in days) at the first scan for outpatient patients with cancer in Alberta (N=8,286).
Table 3.
Wait time (in days) at the first scan for outpatient patients with cancer in Alberta (N=8,286).
 |
Notes: Cross Cancer= Cross Cancer Institute; Foothills= Foothills Hospital; IQR= inter-quartile range; Royal Alex= Royal Alexandra Hospital; U of A= University of Alberta Hospital.
Table 4.
Wait time at the first scan by priority for outpatient patients with cancer in Alberta (N=8,286).
Table 4.
Wait time at the first scan by priority for outpatient patients with cancer in Alberta (N=8,286).
 |
Notes: IQR= inter-quartile range; p=p-value; P1= Priority 1, Urgent; P2= Priority 2, Semi-urgent; P3= Priority 3, non-urgent; P4= Priority 4, planned; Alberta Health Services guidelines for wait time targets: P1: <= 2 weeks; P2: <= 4 weeks; P3: <= 6 weeks; P4: scheduled exams, target not applicable.
Table 5.
Summary of the associations between travel distance (in 10km) and wait time for PET/CT in Alberta.
Table 5.
Summary of the associations between travel distance (in 10km) and wait time for PET/CT in Alberta.
 |
Notes: IRR= incident rate ratio; P1= Priority 1, Urgent; P2= Priority 2, Semi-urgent; P3= Priority 3, Not urgent; p= p-value.
Disclaimer/Publisher’s Note: The statements, opinions and data contained in all publications are solely those of the individual author(s) and contributor(s) and not of MDPI and/or the editor(s). MDPI and/or the editor(s) disclaim responsibility for any injury to people or property resulting from any ideas, methods, instructions or products referred to in the content. |
© 2025 by the authors. Licensee MDPI, Basel, Switzerland. This article is an open access article distributed under the terms and conditions of the Creative Commons Attribution (CC BY) license (http://creativecommons.org/licenses/by/4.0/).
Copyright: This open access article is published under a Creative Commons CC BY 4.0 license, which permit the free download, distribution, and reuse, provided that the author and preprint are cited in any reuse.


