

Submitted:
10 June 2025
Posted:
11 June 2025
You are already at the latest version
Abstract
Classifying land cover in mountainous areas has always been challenging due to the high diversity of ecosystems and the complexity of the spectral-temporal-spatial relationships caused by the rugged terrain. This paper introduces multi-year synthesized phenological data to improve land cover classification in these regions. Using the Shennongjia Forestry District in Hubei Province, China, as a case study, we investigate how incorporating multi-year synthesized phenological data enhances the accuracy of land cover classification with single-temporal and multi-temporal remote sensing imagery, as well as how it aids in identifying different vegetation types in shaded areas of the mountains. The research results indicate that incorporating multi-year synthesized phenological data significantly improves the accuracy of land cover classification for single summer imagery, single autumn imagery, multi-temporal summer-autumn imagery, and mountain shadow areas. The Kappa coefficient (Kappa) increased by 1.57% to 9.93%, while overall accuracy (OA) improved by 1.4% to 8.75%. Notably, the improvement in classification accuracy was most pronounced for single summer imagery. Furthermore, the results demonstrate that in the absence of terrain data, multi-year synthesized phenological data provide even greater enhancements in land cover classification accuracy using remote sensing imagery.
Keywords:
phenology
; classification
; mountainous areas
; multi-year synthesized phenological data
; land use and land cover (LULC)
1. Introduction
Mountainous environments are characterized by unique and extensive biodiversity, with numerous endemic species playing integral roles in maintaining local ecological equilibrium and ecosystem functions [1]. The profusion of vegetation in such regions significantly contributes to climate regulation, water resource preservation, soil erosion mitigation, and biodiversity conservation [2,3]. However, the inherent vulnerability of mountain ecosystems cannot be ignored. Threats such as climate change, deforestation, land use alterations, and human activities endanger these ecosystems [4,5]. To enhance the protection and management of mountain ecosystems and sustain their ecological services and biodiversity, it is imperative to accurately classify and monitor land cover in these areas.
Due to the unique geographical and environmental characteristics of mountainous regions, researchers face significant challenges in achieving precise analysis of land cover information [6,7]. The complex and variable terrain, rich biodiversity, and uneven lighting in mountainous areas often result in satellite data that fail to fully capture the distinct features of land cover types [8,9]. Particularly in transitional zones of mountainous regions, the spectral identification of vegetation types from remote sensing imagery is severely limited [10,11]. The high heterogeneity of mountain environments frequently leads to the phenomenon of "same object, different spectrum," where the same type of land cover exhibits different spectral characteristics under different environmental conditions [12,13]. A typical example is the variation in phenological stages of vegetation, which causes even the same type of vegetation to have different spectral characteristics at different growth stages [14,15]. For instance, the spectral signals of wheat differ significantly between its early growth and maturity stages, directly affecting the land cover classification results in remote sensing imagery. The differences in vegetation phenology along altitudinal gradients are a significant cause of the "same object, different spectrum" phenomenon observed in mountainous vegetation on remote sensing imagery.
To address the challenges in land cover classification in mountainous areas, researchers have made numerous attempts in recent years. For instance, some researchers integrated features and textures from multi-source, multi-resolution, and multi-temporal remote sensing data to capture the characteristics and dynamic changes of different mountain vegetation types, thereby enhancing their differentiation and achieving classification of different land use types. However, this approach fails to utilize the topographic information contained in the data or vegetation knowledge graphs, resulting in limitations in finer vegetation classification [7]. While others attempted to incorporate topographic data into their analysis, hoping to improve classification accuracy by considering elevation, slope, and aspect. However, relying solely on traditional topographic indicators is still insufficient to fully capture the complex relationship between mountain vegetation and terrain, leading to less than ideal results in land cover classification [16]. The relationship between vegetation and terrain is far more complex than imagined, and the ideal vertical vegetation belt structure may become blurred due to terrain undulations and microclimate differences, making it more difficult to distinguish vegetation types in mountainous areas Shaping of topography by topographically-controlled vegetation in tropical montane rainforest.
The introduction of phenological data provides a new approach to addressing this issue. Phenological data record key events in the plant growth cycle, such as budburst, flowering, and leaf fall, offering crucial temporal supplements to remote sensing imagery [17,18]. Studies have shown that although many vegetation types share similar visible spectral characteristics, they exhibit significant differences in important life cycle events [19]. Therefore, by examining the spectral differences of different vegetation types at specific phenological stages, the identification of vegetation types in mountainous land cover can be improved. Currently, research on using phenological data to assist land cover classification primarily focuses on identifying different vegetation types through spectral differences. For example, S. Saquella used phenological information extracted from Sentinel-2 time series data to classify crop fields, while Peter J. Weisberg utilized UAV imagery and phenological information to analyze the phenological differences of plants at different stages of the growing season, thereby distinguishing two invasive annual grass species [20,21]. Although these studies have attempted to apply phenology to classification, there is still limited exploration of the issue of the same vegetation type exhibiting different spectral characteristics due to factors such as terrain in mountainous environments. In land cover classification, mountain shadows are often overlooked; most researchers choose to exclude shadowed areas or perform topographic correction [22,23]. The role of phenological data in identifying vegetation types in mountainous shadow areas remains unclear.
This study is conducted in the Shennongjia Forestry District, aiming to explore the potential of synthesized phenological data in improving land cover classification in mountainous areas, as well as its role in interpreting vegetation information in shadowed regions. The Shennongjia Forestry District, as a transitional alpine zone, features significant elevation differences, rich species diversity, and distinct vertical vegetation zoning [24]. This paper will use pixel-based synthesized of Landsat imagery from 2000 to 2022 to extract phenological data with a spatial resolution of 30 meters. The research will focus on three main questions: investigating the feasibility of extracting multi-year synthesized phenological data at a 30-meter spatial resolution; whether combining multi-year synthesized phenological data with single-temporal and multi-temporal spectral data, vegetation index data, and topographic data is an effective method to improve land cover classification accuracy in mountainous areas; and whether multi-year phenological information has the potential to classify and identify vegetation types in mountainous shadow areas.
2. Materials and Methods
2.1. Study Area
In the northwest part of Hubei Province, China, lies Shennongjia Forestry District, which has territory totaling 3,253 km2 and is situated between 109°56′ and 31°85′ E. as shown in Figure 1(a). The National Nature Reserve has well-preserved primary forests and is a key ecological functional area [25]. Subtropical monsoon weather is the climate of Shennongjia National Nature Reserve, which gradually transitions from subtropical to temperate. Summers are humid and rainy, while winters are mild and dry, and annual rainfall varies between 800 to 2,500 m, and increases with elevation [26]. The Shennongjia Mountain range runs nearly east-west in the southwestern part of the district, with Shennong Peak being the highest at 3,105.4 m, making it the highest point in central China. The lowest point in the district is at an elevation of 398.0 m, resulting in a relative height difference of 2,707.4 m, as shown in Figure 1(b).
2.2. Data Source
2.2.1. Data Used for Land Cover Classification
- The spectral data were obtained from the "LANDSAT/LC08/C02/T1_L2" dataset on the US Geological Survey (USGS) website, following atmospheric correction, radiometric correction, and cloud removal. To better distinguish between various vegetation types, we selected images from two seasons: Summer Imagery dated July 9, 2023, and Autumn Imagery dated October 31, 2018, the spatial resolution is 30m. We also used specific vegetation indices and terrain data to assist in land cover classification. The calculation methods for each index are shown in Table 1 The Terrain data include DEM, slope, and aspect, with the DEM sourced from the "USGS/SRTMGL1_003" dataset on the USGS website, also with a spatial resolution of 30 meter.
- The phenology data validated in this study were sourced from the USGS’s ‘MODIS/006/MCD12Q2’ dataset, which provides annual data at a spatial resolution of 500 m. We calculated the average of the MCD12Q2 imagery data from 2000 to 2022 to serve as the comparative data for the multi-year synthesized phenological data.
- High-resolution remote sensing satellite images were used to establish a training sample library. We utilized high-resolution remote sensing images from the ZY-3 and GF-1 satellites, captured from July to November, combined with Google Earth imagery.
- In establishing the sample library, we referenced data from the eastern transect obtained during the 2017–2019 field surveys of the Qinling-Daba Mountains. This field plot includes 69 plant community sample species. The data covers a total of 47 field plots in the Shennongjia Forestry District, providing information on species types, individual numbers, tree height, diameter at breast height (DBH), crown width, canopy cover, as well as plot coordinates, and elevation. Figure 1(c) shows the location of the field plots in the Shennongjia Forestry District.
2.2.2. Land Cover Classification System and Establishment of Sample Library
China’s national land cover classification system, which was established in 2013, is the basis of the land cover classification system for the Shennongjia Forestry District. The training data selection was made in a way that was convenient, considering the fact that Google Earth provided high-resolution images, the ZY-3 satellite provided high-resolution remote sensing images, and the GF-1 satellite provided high-resolution remote sensing images, and by comparing the Landsat reference images acquired in two epochs [27]. The Chinese Academy of Sciences released the 2015 China Land Use Status Remote Sensing Monitoring Dataset, and we also used descriptions of vegetation types in the Shennongjia Forestry District from the " Vegetation map of the People’s Republic of China (1:1 000 000) " published by Beijing Science Press in 2001. By combining this with data from field plots, we were able to finish building the sample library for the entire Shennongjia Forestry District. The land cover types in the study area are divided into 11 categories: evergreen broadleaf forest, deciduous broadleaf forest, evergreen coniferous forest, coniferous and broadleaved mixed forest, evergreen broadleaf shrubland, deciduous broadleaf shrubland, grassland, meadow, water bodies, farmland, and artificial land. In this assay, we extracted the mountain shadow areas and non-shadow areas of the Shennongjia Forestry District using the SVI threshold method on autumn imagery, and then separately extracted samples for classification.
There are two sample libraries: one is the sample library for non-shadow areas, which includes 11 classes and a total of 10,418 sample points, the number of points per land cover type ranges from 400 to 2,000, selected based on the distribution of each land cover type; and the other one is the sample library for shadow areas, the shadow area sample library includes 4 types of samples: evergreen broadleaf forest, deciduous broadleaf forest, evergreen coniferous forest, and coniferous and broadleaved mixed forest with a total of 915 sample points. Each sample type has approximately 100 to 300 points. Additionally, we selected two sample areas in the Shennongjia Forestry District to present the classification results, namely Area 1 and Area 2. The locations of the sample points and the sample areas are shown in Figure 1(c).
2.3. Methology
Traditional land cover classification methods primarily rely on the spectral reflectance of visible and near-infrared bands, as well as topographic data, to identify and classify different land cover types [28]. However, these methods show significant limitations when facing the complex terrain of mountainous areas and the vertical zonation of vegetation. Relying solely on visible spectral data and topographic information is insufficient to accurately reflect the spectral differences in vegetation types caused by changes in their growth periods at different altitudes [29]. In this context, this study introduces vegetation phenological characteristics into land cover classification in mountainous environments. Phenological information can provide the dynamic ability to capture changes in the vegetation growth cycle, which traditional methods relying on static data lack. More importantly, phenology also exhibits an altitude-dependent pattern, and multiple phenological parameters are crucial for distinguishing vegetation types with similar spectral characteristics but differing growth cycles. Therefore, this study attempts to integrate phenological data into traditional land cover classification methods.
A key limitation in applying phenological data to land cover classification in mountainous areas is the resolution of the data [30,31]. Due to the complexity of mountain vegetation, the spatial resolution requirements for phenological data are higher than those for flatland areas [32]. Existing remote sensing phenological products, such as MODIS data with spatial resolutions of 500 meters or 250 meters, often fail to meet the needs of small-scale phenological change research required for mountain land cover classification [33]. In mountainous environments, smaller horizontal distances are often accompanied by significant altitude differences, and altitude is a primary factor driving changes in vegetation phenological periods [29]. Therefore, when conducting land cover classification, the spatial resolution of phenological data is far more critical than the temporal resolution. There are significant differences in phenological periods among different vegetation types, and these differences are reflected in the high spatial resolution of the phenological patterns, which can reveal more information about vegetation types and states. Because vegetation type changes in mountainous areas tend to fluctuate less, especially in regions with many nature reserves, which are subject to minimal human disturbance, and studies have shown that the land cover type changes in the Shennongjia Forestry District are relatively small over the years [34]. Therefore, this study proposes an improved land cover classification algorithm that attempts to disregard the temporal characteristics of phenological data and instead emphasizes their spatial features. By synthesizing high-resolution phenological data from multi-year Landsat imagery, the method aims to assist traditional land cover classification in the Shennongjia Forestry District.
Extraction of High Spatial Resolution Multi-Year Synthesized Phenological Indicators
Vegetation phenological data are typically extracted using the Normalized Difference Vegetation Index (NDVI) [35]. However, in regions with high vegetation cover, NDVI often suffers from saturation issues. To mitigate this problem, we utilized the Enhanced Vegetation Index (EVI) to extract vegetation phenology in the study area [36]. Due to the 16-day revisit cycle of Landsat imagery and frequent cloud cover in mountainous areas, resulting in poor image quality, we considered the data availability and selected all Landsat images from the past 23 years as the base data for synthesized phenological data. Using the GEE platform, we extracted all available cloud-free images from the Landsat5,Landsat7 and Landsat8 datasets covering the Shennongjia Forestry District with cloud cover less than 10% from 2000 to 2022. The images were sorted based on DOY, and if multiple images existed for a day, the average value was taken. We calculated the EVI for each pixel in the study area and synthesized annual EVI time series data based on DOY. The entire dataset for the study area was then concatenated. By integrating 23 years of data, we established an annual EVI time series with an average interval of 3–4 days within the Shennongjia Forestry District.
This assay used the TIMESAT software to fit the synthesized annual EVI data using the Double Logistic (DL) algorithm provided within the software [37]. The logistic functional fitting method has advantages for estimating phenology with noisy data, and many researchers use it to fit phenology curves [38]. Based on previous phenological studies, the dynamic threshold method was selected, with 20% and 80% of the amplitude used as the thresholds for the start and end of the growing season, respectively. Using this approach, 13 phenological parameters were extracted for the study area. The phenological parameters and their definitions are shown in the Table 2.
Some researchers have attempted to classify phenological data based on the differences in phenology across different vegetation types. Compared to previous studies that only used partial parameters such as SOG and LOG, this paper retains all phenological parameters to maximize the display of differences among different land cover types [39]. This study attempts to use 13 high spatial resolution phenological bands as multi-spectral input to traditional land cover classification models, enhancing the spectral information of the original imagery to improve land cover classification accuracy in mountainous areas. By applying random forest classification to different data input combinations, the study explores how the inclusion of high spatial resolution phenological data enhances the performance of traditional land cover classification. Figure 2 shows the improved land cover classification model for mountainous areas with the inclusion of high spatial resolution phenological parameters used in this study, and Table 3 presents the different data input combinations tested in this study.
3. Results
3.1. Extraction Results of Multi-Year Synthesized Phenology
Due to the synthesized multi-year nature of our phenology data extraction and the limited availability of ground-validated phenology data for vegetation in the Shennongjia Forestry District, this study opted to compare the extracted phenology data with commonly used MODIS data product MCD12Q2 from previous research. Figure 3 presents comparative graphs of SOG (Start of the Growing Season) and LOG (Length of the Growing Season) extracted from Landsat phenology data and MCD12Q2 phenology product data used in this study.
Figure 3 shows that the multi-year average phenology data extracted for the Shennongjia Forestry District demonstrates overall spatial consistency with the multi-year average data from the MCD12Q2 product. The correlation coefficient for Start of Growing Season (SOG) is 0.70 and for Length of Growing Season (LOG) is 0.54, both passing the Pearson coefficient test, indicating significant spatial correlation between the two phenology datasets. In mountainous environments, slight changes in the horizontal gradient can correspond to significant changes in the vertical gradient, and phenology is very sensitive to vertical gradient changes. Compared to the 500 m spatial resolution of the MCD12Q2 phenology product, the phenology data we extracted, with a spatial resolution of 30 m, better captures the subtle phenological differences in mountainous areas, which is more conducive to distinguishing vegetation types in mountainous land cover classification.
3.2. Extraction Results of Multi-Year Synthesized Phenology
In this study, the Random Forest algorithm was used for classification, a powerful machine learning technique that has been proven to achieve high predictive accuracy in various scenarios [21,40]. Based on previous research, we compared four mainstream classification algorithms commonly used in remote sensing: Random Forest (RF) [41], Maximum Likelihood (ML) [42], Support Vector Machine (SVM) [32], and Convolutional Neural Network (CNN) [43]. The experimental results indicated that among these four classification algorithms, Random Forest yielded the best classification performance. The model operates with a default parameter of 1000 trees (ntree) and uses 20% of the training samples as reference samples. The model’s accuracy is evaluated using Producer’s Accuracy (PA), User’s Accuracy (UA), Overall Accuracy (OA), and Kappa Coefficient (Kappa) for each land cover type.
By comparing a1, and b1, c1 in Figure 4, it can be found that the area of broad-leaved evergreen forests in the summer imagery is obviously reduced and most of them are converted to mixed coniferous and broad-leaved forests after adding multi-year synthesized phenology data, indicating that it is difficult to recognize evergreen broadleaf forests and mixed coniferous and broadleaf forests by relying on the summer imagery alone. Comparison of a2 and b2, c2 in Figure 4 shows that the inclusion of multi-year synthesized phenology data improves the recognition of deciduous broadleaf shrub forests in summer imagery. Obviously, the inclusion of phenological data greatly improved the classification accuracy of the summer image on deciduous broadleaf shrub forests, and improved the ability of the summer image to distinguish between evergreen broadleaf forests and mixed coniferous broadleaf forests, and reduced the phenomenon of mixing coniferous broadleaf forests and evergreen broadleaf forests.
Table 4 shows the land cover classification accuracy results for the non-shadow areas of summer imagery. Su1, Su2, and Su3 correspond to different combinations of summer imagery, summer imagery with phenology, and summer imagery, phenology, and terrain data, respectively. The Su1 combination had the lowest recognition accuracy for mixed coniferous and broadleaf forests, with a PA of only 54.28% and a UA of just 62.54%. The second lowest was for deciduous broadleaf forests, with a PA of only 74.90% and a UA of just 69.87%. When only phenological data were included without terrain data, the Su2 combination increased the producer’s accuracy of mixed coniferous and broadleaf forests to 71.39%, an improvement of 17.11 percentage points, and raised the producer’s accuracy of deciduous broadleaf forests to 87.68%, an increase of 12.78 percentage points. The vegetation cover types with the greatest improvements in user’s accuracy were mixed coniferous and broadleaf forests and evergreen broadleaf forests, which improved by 16.92% and 15.31%, respectively. In comparison to Su1 and Su3, simply by adding phenological data, the Su3 combination increased the producer’s accuracy of mixed coniferous and broadleaf forests by 19.20% and the user’s accuracy by 17.86%, while the producer’s accuracy of evergreen broadleaf forests increased by 12.11% and the user’s accuracy improved by 14.86%.
In terms of OA, the Su3 combination improved OA from 77.29% to 86.04% and increased the Kappa from 74.19% to 84.12%, a rise of 9.93% compared to Su1. This indicates that the inclusion of phenological data can significantly enhance the accuracy of land cover classification in the Shennongjia Forestry District using summer imagery. Comparing the classification accuracies of Su1, Su2, and Su3 reveals that the addition of phenological data significantly improves the accuracy of different land cover classifications, particularly in the identification of evergreen broadleaf forests and mixed coniferous and broadleaf forests (Table 4).
3.3. Improvement in Classification Accuracy of Autumn Imagery Due to Phenological Data
With the addition of multi-year synthesized phenology data, the presence of deciduous broadleaf shrub forests was identified in both Figure 5(b1) and Figure 5(c1) compared to Figure 5(a1), and in the labeled area in Area 2, the identification of deciduous broadleaf shrub forests was more accurate in Figure 5(b2) and Figure 5(b3), which suggests that the multi-year synthesized phenology data still improves the identification of deciduous broadleaf shrub forests in the autumn imagery.
Table 5 shows that the inclusion of phenological data also enhances the classification accuracy of autumn imagery for land cover in the Shennongjia Forestry District. After adding phenological data, the two land cover types with the greatest increase in PA in Au1 are deciduous broadleaf forest and meadow. Au2 increases the PA of deciduous broadleaf forest by 3.11%, raising the PA of meadows to 87.02%, an increase of 2.71%; the UA for deciduous broadleaf shrub has the highest increase at 9.82%.
Au3 shows even greater improvements compared to Au1, with the PA for deciduous broadleaf forest and meadow increasing by 3.88% and 3.62%, respectively, while the UA for deciduous broadleaf shrub improves by 10.91%. A comparison of the OA and Kappa indicates that both the inclusion of phenological data and terrain data can enhance the classification accuracy of remote sensing imagery. However, the improvement in classification accuracy for various vegetation types is more significant with the addition of multi-year synthesized phenological data than with the inclusion of terrain data (Table 4 and Table 5). The best combination for land cover classification in the Shennongjia Forestry District using Autumn imagery is Au3 (Table 5), with the highest Kappa of 89.31% and an OA of 90.59%
3.4. Improvement in Classification Accuracy of Summer and Autumn Imagery Due to Phenological Data
Compared with the single summer imagery and autumn imagery, the multi-year synthesized phenology data did not improve the classification accuracy of the summer-autumn imagery significantly, but it still showed the advantage of multi-year synthesized phenology data in identifying deciduous broadleaf shrub forests as well as distinguishing between evergreen broadleaf forests and mixed coniferous and broadleaf forests in Figure 6.
In the Table 6, it can be seen that the inclusion of multi-year synthesized phenological data slightly improves the accuracy of classification results for summer and autumn imagery. Without considering terrain factors, the results for SA1 and SA3 indicate that phenological data significantly enhance the PA for the classification of deciduous broadleaf shrub, increasing it by 8.77%, while the UA improves by 5.43%. The next highest improvement is for Artificial land, with a PA increase of 5.01%. The OA increases by 1.46%, and the Kappa rises by 1.67%.
When terrain factors are considered, the results for SA1 and SA3 show that the addition of phenological data has the greatest impact on improving the PA for deciduous broadleaf shrub, which increases by 3.70%, while the UA improves by 6.53%. The second highest improvement is for farmland, with a PA increase of 3.23%. The OA increases by 0.91%, and the Kappa improves by 1.04% (Table 6).
A comparison of the classification results for SA2 and SA3 reveals that the inclusion of phenological data leads to a greater improvement in OA and Kappa for land cover types in the Shennongjia Forestry District than terrain factors, with Kappa improving by 0.57% and OA increasing by 0.50%.
3.5. Land Cover Classification Results for Mountain Shadow Areas
Compared to land cover classification in flat terrains, the complex terrain of mountainous areas presents unique challenges for land cover classification [44]. The slope and aspect of mountainous terrain surfaces affect the reception of visible light spectra from remote sensing satellites, leading to prominent mountain shadows in the images and reducing the accuracy of specific classifications [45,46].
To adjust the classification results and analyze the effectiveness of multi-year synthesized phenological data in classifying mountain shadow areas, we will separately extract the mountain shadow areas from the autumn imagery, re-establish the sample library, and perform the classification again. And we extracted the prominent mountain shadow areas from autumn date imagery in the Shennongjia Forestry District using the Shady Vegetation Index (SVI) with a threshold segmentation method. The classification accuracy for each category using machine learning is calculated as shown in the Table 7.
Comparing Table 7, it is evident that the inclusion of multi-year phenological synthesized data significantly improves the classification accuracy of autumn imagery in the mountain shadow areas of the Shennongjia Forestry District. Without considering terrain factors, a comparison between M3 and M1 shows that the use of phenological data increases the PA for evergreen coniferous forest in the shadow areas by 15.55%, while the UA for mixed coniferous and broadleaf forest improves by 5.32%. The OA and Kappa increase by 5.78% and 8.14%, respectively.
When terrain factors are considered, comparing M4 and M2 indicates that the addition of phenological data yields the greatest improvement in PA for mixed coniferous and broadleaf forest in the mountain shadow areas, with an increase of 9.98%. The PA for evergreen coniferous forest improves by 7.33%, and the UA for evergreen coniferous forest increases by 9.94%. The OA improves by 3.94%, and the Kappa coefficient increases by 9.98%. This suggests that the inclusion of phenological data effectively enhances the spectral differences of various vegetation types in the mountain shadow areas.
A comparison of the results between M4 and M2 indicates that the addition of phenological data provides a more significant improvement in classification accuracy for remote sensing imagery than the inclusion of terrain factors, with OA increasing by 2.89% and Kappa improving by 4.08%. Figure 7 shows the overall land cover classification results for the Shennongjia Forestry District. The classification results show that the forest types in the the Shennongjia forest region are primarily coniferous and broadleaf mixed forests and deciduous broadleaf forests, followed by evergreen broadleaf forests and evergreen coniferous forests. The distribution of vegetation types exhibits distinct regional differences and significant vertical zonality. For example, evergreen coniferous forests are generally found near higher altitudes, such as around Shennongding, while evergreen broadleaf forests are mainly distributed below 1,000 meters in elevation. Deciduous broadleaf forests and coniferous-broadleaf mixed forests have a wide distribution, primarily occurring in the elevation range of 1,000–2,800 meters.
4. Discussion
4.1. Feasibility of Applying Multi-Year Phenological Synthesized Data to Land Cover Classification
Integrating multi-source data is highly beneficial for land cover classification studies in mountainous areas. Researchers have found that using a random forest classifier, spectral vegetation indices, and auxiliary geographic data to create vegetation maps can accurately depict hard-to-reach mountainous landscapes in their study of mountainous classification in Ecuador [47]. Temporal phenological information can assist classifiers in identifying species at various phenological stages. This characteristic has led many researchers to use vegetation phenological information to aid in distinguishing different vegetation types [48].
Although 250-meter or coarser resolution phenological data have contributed to regional and global phenological studies, their spatial resolution is insufficient to reveal the fine-scale variability of vegetation phenology in mountainous areas [30]. Therefore, it is challenging to use them to improve land cover classification accuracy in mountainous regions. The combination of multiple years of Landsat acquisitions into a single ‘synthetic’ year is particularly useful for areas with high image density [49]. Based on this concept, we extract multi-year synthesized phenological data for the Shennongjia forest district through the synthesized of multi-year Landsat imagery. The phenological data, combined with data from different phases, are used to reveal the role of multi-year synthesized phenological data in mountainous land cover classification and its differential identification of various vegetation types in shadowed areas.
There are many studies related to the use of phenological data to assist in land cover classification [46]. For example, some researchers combined Sentinel-2 imagery with DEM and climatic zone data to form a framework, then input spectral phenological features into a random forest model to improve the accuracy of grassland classification [50]. Other researchers used a random forest algorithm based on Sentinel-2 pixels difference time series (PDTS) phenological parameters to classify six common plant species in three representative coastal areas of China. The results showed that PDTS-based classification improved accuracy by 5.1% compared to single-image classification [51]. These findings are similar to our study, indicating that phenological data is effective in improving classification accuracy.
4.2. The Effectiveness of Multi-Year Synthesized Phenological Data in Identifying Vegetation in Mountain Shadow Areas
The problem of mountain shadows is a significant obstacle to the application of remote sensing data in land cover classification studies in mountainous areas. The accuracy of land use sub-pixel mapping is substantially hindered by the presence of mountain shadows, according to Hao et al [23]. Wang et al. point out that remote sensing images have a harder time handling mountain shadows than natural images because there are larger shadow areas and more complex land cover information [52]. To address the mountain shadow issue, researchers have employed various methods. Matched filtering techniques have been used by some to remove shadows from hyperspectral data for atmospheric correction, for example [53]. To replace the images of shadowed areas, some have chosen to use multi-source data fusion [47]. Prior knowledge is required to build a mountain shadow model using geometric correction, which significantly limits the applicability of geometric correction methods [52].
Unlike previous studies, we provide a new solution to the challenges posed by mountain shadows by incorporating multi-year synthesized phenological data to identify different vegetation types in shadowed areas of the images. The research results indicate that the inclusion of multi-year synthesized phenological data significantly improves the accuracy of land cover classification in mountain shadow areas, with OA increasing by up to 6.83% and Kappa by up to 9.59%. The addition of this data also proved effective in distinguishing different vegetation types, with experimental results showing significant improvements in the PA for evergreen coniferous forests and Coniferous and broadleaved mixed forests in shadow areas, reaching up to 15.94% and 13.23%, respectively.
4.3. Deficiencies and Improvements in Research
This study relies mainly on Landsat imagery, utilizing multi-temporal remote sensing image data spanning five years and multi-year average climate data over a longer period of time. The extraction of phenological data and land cover classification will inevitably be affected by land cover changes. However, due to the vigorous ecological conservation efforts in the Shennongjia forestry district, the land resources remain relatively intact, and the degree of human development in the mountainous areas is extremely low, so the land cover changes are tiny. The research questions are as follows:
- Data Limitations: Landsat imagery, while covering a wide area and offering high temporal resolution, has insufficient spatial resolution to capture fine details of small features in mountainous regions. Future studies could optimize classification accuracy using higher-resolution data from Sentinel-2, especially for complex terrain and small-scale feature classification.
- Challenges and Improvements: Establishing a sample library for shadow areas poses challenges that may affect classification accuracy. The scale of the sample library and the selection of sample points may influence results. Future efforts will explore additional methods for handling shadow areas, such as incorporating auxiliary data or improving existing algorithms.
5. Conclusions
This study explores the potential of using multi-year synthesized vegetation phenological data based on Landsat imagery to improve land cover classification accuracy in the Shennongjia Forest District, characterized by complex mountainous terrain and diverse vegetation types. The study found that the multi-year synthesized phenological data extracted using Landsat synthesized have spatial patterns consistent with the existing MODIS MCD12Q2 data, but with an improved spatial resolution of 30m. By incorporating multi-year synthesized phenological data into summer imagery, autumn imagery, and combined summer-autumn imagery, the results showed that the inclusion of multi-year synthesized phenological data significantly improved the classification accuracy of the original imagery. This improvement was especially notable in the identification of Coniferous and broadleaved mixed forests, Evergreen broadleaf forests, and Deciduous broadleaf shrubs. The enhancement was greatest for single summer imagery, OA increased 8.75%, and Kappa rose 9.93%, followed by Autumn imagery, and least for combined Summer-Autumn imagery. It also significantly improves the identification of different vegetation types in mountain shadow areas, with the Kappa increasing by 9.59% and the OA by 6.83%. The study further indicates that in the absence of terrain data, phenological data have a greater impact on enhancing the accuracy of land cover classification from remote sensing imagery.
Author Contributions
Zhengzheng Hu: Writing – original draft, Visualization, Validation, Data curation. Fei Xiao: Investigation, Methodology, Writing – review &editing. Yun Du: Writing – review &editing, Supervision, Funding acquisition, Conceptualization, Methodology. Zhou Wang: Writing – review &editing, Supervision. Jiahuan Luo: Formal analysis, Supervision. Qi Feng: Writing – review & editing, Formal analysis, Supervision. Miaomiao Chen: Writing – review & editing, Formal analysis.
Funding
This work was supported by the Progress of Strategy Priority Research Program (Category A) of Chinese Academy of Sciences, the Key Research and Development(R&D) Program Project of Hubei Province under Grant 2023BCAU104, and the National Scientific and Technological Basic Resources Investigation Project(2017FY100900).
Data Availability Statement
Data will be made available on request.
Conflicts of Interest
The authors declare no conflicts of interest.
References
- Buchner, J., Yin, H., Frantz, D., Kuemmerle, T., Askerov, E., Bakuradze, T., Bleyhl, B., Elizbarashvili, N., Komarova, A., Lewinska, K.E., Rizayeva, A., Sayadyan, H., Tan, B., Tepanosyan, G., Zazanashvili, N., Radeloff, V.C., 2020. Land-cover change in the Caucasus Mountains since 1987 based on the topographic correction of multi-temporal Landsat composites. Remote Sens Environ 248, 111967. 2007 Volume 3, pp. 154–196. [CrossRef]
- Miehe, G. , Schleuss, P.M., Seeber, E., Babel, W., Biermann, T., Braendle, M., Chen, F.H., Coners, H., Foken, T., Gerken, T., Graf, H.F., Guggenberger, G., Hafner, S., Holzapfel, M., Ingrisch, J., Kuzyakov, Y., Lai, Z.P., Lehnert, L., Leuschner, C., Li, X.G., Liu, J.Q., Liu, S.B., Ma, Y.M., Miehe, S., Mosbrugger, V., Noltie, H.J., Schmidt, J., Spielvogel, S., Unteregelsbacher, S., Wang, Y., Willinghöfer, S., Xu, X.L., Yang, Y.P., Zhang, S.R., Opgenoorth, L., Wesche, K., 2019. The ecosystem of the Tibetan highlands - Origin, functioning and degradation of the world’s largest pastoral alpine ecosystem Kobresia pastures of Tibet. Sci Total Environ 648, 754-771.
- Bai, M.Y. , Peng, P.H., Zhang, S.Q., Wang, X.M., Wang, X., Wang, J., Pellikka, P., 2023. Mountain Forest Type Classification Based on One-Dimensional Convolutional Neural Network. Forests 14, 1823. [CrossRef]
- Canedoli, C. , Ferrè, C., Abu El Khair, D., Comolli, R., Liga, C., Mazzucchelli, F., Proietto, A., Rota, N., Colombo, G., Bassano, B., Viterbi, R., Padoa-Schioppa, E., 2020. Evaluation of ecosystem services in a protected mountain area: Soil organic carbon stock and biodiversity in alpine forests and grasslands. Ecosyst Serv 44. [CrossRef]
- Balkrishna, A. , Sharma, I.P., Kushwaha, A.K., Kumar, S., Arya, V., 2023. A study on multi-ranged medicinal plants and soil temperature in various sites of Garhwal Himalaya, Uttarakhand. Discover Environment 1. [CrossRef]
- Fang, P.F. , Ou, G.L., Li, R.A., Wang, L.G., Xu, W.H., Dai, Q.L., Huang, X., 2023. Regionalized classification of stand tree species in mountainous forests by fusing advanced classifiers and ecological niche model. Gisci Remote Sens 60, 1823. [CrossRef]
- Wang, B.G. , Yao, Y.H., 2024. Mountain Vegetation Classification Method Based on Multi-Channel Semantic Segmentation Model. Remote Sens-Basel 16, 256. [CrossRef]
- Zhang, R. , Tang, X.M., You, S.C., Duan, K.F., Xiang, H.Y., Luo, H.X., 2020. A Novel Feature-Level Fusion Framework Using Optical and SAR Remote Sensing Images for Land Use/Land Cover (LULC) Classification in Cloudy Mountainous Area. Appl Sci-Basel 10, 2928. [CrossRef]
- Gao, G.M. , Liu, B., Zhang, X.R., Jin, X.D., Gu, Y.F., 2022. Multitemporal Intrinsic Image Decomposition With Temporal-Spatial Energy Constraints for Remote Sensing Image Analysis. IEEE T Geosci Remote 60, 1-16. [CrossRef]
- Hurskainen, P. , Adhikari, H., Siljander, M., Pellikka, P.K.E., Hemp, A., 2019. Auxiliary datasets improve accuracy of object-based land use/land cover classification in heterogeneous savanna landscapes. Remote Sens Environ 233, 111354. [CrossRef]
- Zeferino, L.B. , Souza, de,, L.F.T., Amaral, do, C.H., Inácio, F.F.E., Oliveira, de, T.S., 2020. Does environmental data increase the accuracy of land use and land cover classification? Int J Appl Earth Obs 91, 102128.
- Adepoju, K.A. , Adelabu, S.A., 2020. Improving accuracy evaluation of Landsat-8 OLI using image composite and multisource data with Google Earth Engine. Remote Sens Lett 11, 107-116.
- Guo, Q.; Guan, H.; Hu, T.; Jin, S.; Su, Y.; Wang, X.; Wei, D.; Ma, Q.; Sun, Q. 2021, Remote sensing-based mapping for the new generation of Vegetation Map of China (1:500,000). Sci. China Life Sci. 51, 229–241. (In Chinese). [CrossRef]
- Ai, J.Q. , Gao, W., Gao, Z.Q., Shi, R.H., Zhang, C., 2017. Phenology-based mapping in coastal wetland of the Yangtze Estuary using time series of GaoFen satellite no. 1 wide field of view imagery. J Appl Remote Sens 11, 026020.
- Zeng, J. , Sun, Y.H., Cao, P.R., Wang, H.Y., 2022. A phenology-based vegetation index classification (PVC) algorithm for coastal salt marshes using Landsat 8 images. Int J Appl Earth Obs 110, 102776. [CrossRef]
- Luo, X. , Tong, X.H., Pan, H.Y., 2021. Integrating Multiresolution and Multitemporal Sentinel-2 Imagery for Land-Cover Mapping in the Xiongan New Area, China. IEEE T Geosci Remote 59, 1029-1040. [CrossRef]
- Tian, F. , Cai, Z.Z., Jin, H.X., Hufkens, K., Scheifinger, H., Tagesson, T., Smets, B., Van Hoolst, R., Bonte, K., Ivits, E., Tong, X.Y., Ardö, J., Eklundh, L., 2021. Calibrating vegetation phenology from Sentinel-2 using eddy covariance, PhenoCam, and PEP725 networks across Europe. Remote Sens Environ 260, 112456. [CrossRef]
- Shen, M.G. , Wang, S.P., Jiang, N., Sun, J.P., Cao, R.Y., Ling, X.F., Fang, B., Zhang, L., Zhang, L.H., Xu, X.Y., Lv, W.W., Li, B.L., Sun, Q.L., Meng, F.D., Jiang, Y.H., Dorji, T., Fu, Y.S., Iler, A., Vitasse, Y., Steltzer, H., Ji, Z.M., Zhao, W.W., Piao, S.L., Fu, B.J., 2022. Plant phenology changes and drivers on the Qinghai-Tibetan Plateau (Jul, 10.1038/s43017-022-00317-5, 2022). Nat Rev Earth Env 3, 717. [CrossRef]
- Pan, L. , Xia, H.M., Yang, J., Niu, W.H., Wang, R.M., Song, H.Q., Guo, Y., Qin, Y.C., 2021. Mapping cropping intensity in Huaihe basin using phenology algorithm, all Sentinel-2 and Landsat images in Google Earth Engine. Int J Appl Earth Obs 102, 102376. [CrossRef]
- Saquella, S., Laneve, G., Ferrari, A., 2022. A Cross-Correlation Phenology-Based Crop Fields Classification Using Sentinel-2 Time-Series. 2022 IEEE International Geoscience and Remote Sensing Symposium (IGRASS 2022), 5660-5663.
- Weisberg, P.J. , Dilts, T.E., Greenberg, J.A., Johnson, K.N., Pai, H., Sladek, C., Kratt, C., Tyler, S.W., Ready, A., 2021. Phenology-based classification of invasive annual grasses to the species level. Remote Sens Environ 263, 112568. [CrossRef]
- Su, N. , Zhang, Y., Tian, S., Yan, Y.M., Miao, X.Y., 2016. Shadow Detection and Removal for Occluded Object Information Recovery in Urban High-Resolution Panchromatic Satellite Images. IEEE J-STARS 9, 2568-2582. [CrossRef]
- Hao, M. , Dou, G.M., Zhang, X.T., Lin, H.J., Huo, W.Q., 2023. A Subpixel Mapping Method for Urban Land Use by Reducing Shadow Effects. IEEE J-STARS 16, 2163-2177. [CrossRef]
- Li, S. , Xu, L., Chen, J.J., Jiang, Y.Z., Sun, S.Y., Yu, S.H., Tan, Z.Y., Li, X.H., 2023. Monitoring vegetation dynamics (2010-2020) in Shengnongjia Forestry District with cloud-removed MODIS NDVI series by a spatio-temporal reconstruction method. Egypt J Remote Sens 26, 527-543. [CrossRef]
- Zhang, B. , Li, L., 2023. Evaluation of ecosystem service value and vulnerability analysis of China national nature reserves: A case study of Shennongjia Forest Region. Ecological Indicators 149, 110188. [CrossRef]
- Zhao, Y.J. , Zeng, Y., Zheng, Z.J., Dong, W.X., Zhao, D., Wu, B.F., Zhao, Q.J., 2018. Forest species diversity mapping using airborne LiDAR and hyperspectral data in a subtropical forest in China. Remote Sens Environ 213, 104-114. [CrossRef]
- Qiu, S. , Zhu, Z., Olofsson, P., Woodcock, C.E., Jin, S.M., 2023. Evaluation of Landsat image compositing algorithms. Remote Sens Environ 285, 113375. [CrossRef]
- Qu, L.A. , Chen, Z.J., Li, M.C., Zhi, J.J., Wang, H.M., 2021. Accuracy Improvements to Pixel-Based and Object-Based LULC Classification with Auxiliary Datasets from Google Earth Engine. Remote Sens-Basel 13, 453. [CrossRef]
- Malik, R. , Rossi, S., Sukumar, R., 2020. Variations in the timing of different phenological stages of cambial activity in (Royle) along an elevation gradient in the north-western Himalaya. Dendrochronologia 59. [CrossRef]
- Vrieling, A. , Skidmore, A.K., Wang, T.J., Meroni, M., Ens, B.J., Oosterbeek, K., O’Connor, B., Darvishzadeh, R., Heurich, M., Shepherd, A., Paganini, M., 2017. Spatially detailed retrievals of spring phenology from single-season high-resolution image time series. Int J Appl Earth Obs 59, 19-30. [CrossRef]
- Li, C. , Zou, Y.Y., He, J.F., Zhang, W., Gao, L.L., Zhuang, D.F., 2022. Response of Vegetation Phenology to the Interaction of Temperature and Precipitation Changes in Qilian Mountains. Remote Sens-Basel 14, 1248. [CrossRef]
- Wakulinska, M. , Marcinkowska-Ochtyra, A., 2020. Multi-Temporal Sentinel-2 Data in Classification of Mountain Vegetation. Remote Sens-Basel 12. [CrossRef]
- Zhang, X.Y. , Jayavelu, S., Liu, L.L., Friedl, M.A., Henebry, G.M., Liu, Y., Schaaf, C.B., Richardson, A.D., Gray, J., 2018. Evaluation of land surface phenology from VIIRS data using time series of PhenoCam imagery. Agricultural and Forest Meteorology 256, 137-149. [CrossRef]
- Deng, S.Y. , Dong, X.Z., Ma, M.Z., Zang, Z.H., Xu, W.T., Zhao, C.M., Xie, Z.Q., Shen, G.Z.,2018. Evaluating the effectiveness of Shennongjia National Nature Reserve based on the dynamics of forest carbon pools. Biodiv Sci, 26(1): 27-35.
- Yang, W. , Kobayashi, H., Wang, C., Shen, M.G., Chen, J., Matsushit, B., Tang, Y.H., Kim, Y., Bret-Harte, M.S., Zona, D., Oechel, W., Kondoh, A., 2019. A semi-analytical snow-free vegetation index for improving estimation of plant phenology in tundra and grassland ecosystems. Remote Sens Environ 228, 31-44. [CrossRef]
- Sun, Y.H. , Ren, H.Z., Zhang, T.Y., Zhang, C.Y., Qin, Q.M., 2018. Crop Leaf Area Index Retrieval Based on Inverted Difference Vegetation Index and NDVI. IEEE Geoscience and Remote Sensing Letters 15, 1662-1666. [CrossRef]
- Jin, H.X. , Jönsson, A.M., Bolmgren, K., Langvall, O., Eklundh, L., 2017. Disentangling remotely-sensed plant phenology and snow seasonality at northern Europe using MODIS and the plant phenology index. Remote Sens Environ 198, 203-212. [CrossRef]
- Dang, C.Y. , Shao, Z.F., Huang, X., Zhuang, Q.W., Cheng, G., Qian, J.X., 2023. Climate warming-induced phenology changes dominate vegetation productivity in Northern Hemisphere ecosystems. Ecological Indicators 151, 110326.(In Chinese). [CrossRef]
- Sivabalan, K.R. , Ramaraj, E., 2021. Phenology based classification index method for land cover mapping from hyperspectral imagery. Multimed Tools Appl 80, 14321-14342. [CrossRef]
- 40. Xu, J.X., Chen, C., Zhou, S.T., Hu, W.M., Zhang, W., 2024. Land use classification in mine-agriculture compound area based on multi-feature random forest: a case study of Peixian. Front Sustain Food S 7, 1335292. [CrossRef]
- Ghosh, A. , Fassnacht, F.E., Joshi, P.K., Koch, B., 2014. A framework for mapping tree species combining hyperspectral and LiDAR data: Role of selected classifiers and sensor across three spatial scales. Int J Appl Earth Obs 26, 49-63. [CrossRef]
- Burai, P. , Deák, B., Valkó, O., Tomor, T., 2015. Classification of Herbaceous Vegetation Using Airborne Hyperspectral Imagery. Remote Sens-Basel 7, 2046-2066. [CrossRef]
- Kupková, L. , Cervená, L., Suchá, R., Jakesová, L., Zagajewski, B., Brezina, S., Albrechtová, J., 2017. Classification of Tundra Vegetation in the Krkonose Mts. National Park Using APEX, AISA Dual and Sentinel-2A Data. Eur J Remote Sens 50, 29-46.
- Chen, R. , Yin, G.F., Zhao, W., Yan, K., Wu, S.B., Hao, D.L., Liu, G.X., 2023. Topographic Correction of Optical Remote Sensing Images in Mountainous Areas. IEEE Geosc Rem Sen M 11, 125-145. [CrossRef]
- Yin, G.F. , Li, A.N., Wu, S.B., Fan, W.L., Zeng, Y.L., Yan, K., Xu, B.D., Li, J., Liu, Q.H., 2018. PLC: A simple and semi-physical topographic correction method for vegetation canopies based on path length correction. Remote Sens Environ 215, 184-198. [CrossRef]
- Zhao, Y.F. , Zhu, W.W., Wei, P.P., Fang, P., Zhang, X.W., Yan, N.N., Liu, W.J., Zhao, H., Wu, Q.R., 2022. Classification of Zambian grasslands using random forest feature importance selection during the optimal phenological period. Ecological Indicators 135, 108529. [CrossRef]
- Tolt, G. , Shimoni, M., Ahlberg, J., 2011. A Shadow Detection Method for Remote Sensing Images Using Vhr Hyperspectral and Lidar Data. 2011 IEEE International Geoscience and Remote Sensing Symposium (IGRASS), 4423-4426.
- Ye, N. , Morgenroth, J., Xu, C., Cai, Z., 2022. Improving neural network classification of indigenous forest in New Zealand with phenological features. J Environ Manage 314, 115134. [CrossRef]
- Cheng, Y. , Vrieling, A., Fava, F., Meroni, M., Marshall, M., Gachoki, S., 2020. Phenology of short vegetation cycles in a Kenyan rangeland from PlanetScope and Sentinel-2. Remote Sens Environ 248, 112004. [CrossRef]
- Yu, H.L. , Zhu, L., Chen, Y., Yue, Z.D., Zhu, Y.S., 2024. Improving grassland classification accuracy using optimal spectral-phenological-topographic features in combination with machine learning algorithm. Ecological Indicators 158, 111392. [CrossRef]
- Sun, C. , Li, J.L., Liu, Y.X., Liu, Y.C., Liu, R.Q., 2021. Plant species classification in salt marshes using phenological parameters derived from Sentinel-2 pixel-differential time-series. Remote Sens Environ 256, 112320. [CrossRef]
- Wang, Q.J. , Yan, L., Yuan, Q.Q., Ma, Z.L., 2017. An Automatic Shadow Detection Method for VHR Remote Sensing Orthoimagery. Remote Sens-Basel 9. [CrossRef]
- Le Hégarat-Mascle, S. , André, C., 2009. Use of Markov Random Fields for automatic cloud/shadow detection on high resolution optical images. Isprs J Photogramm 64, 351-366. [CrossRef]
Figure 1.
Location of the study area and sample points.
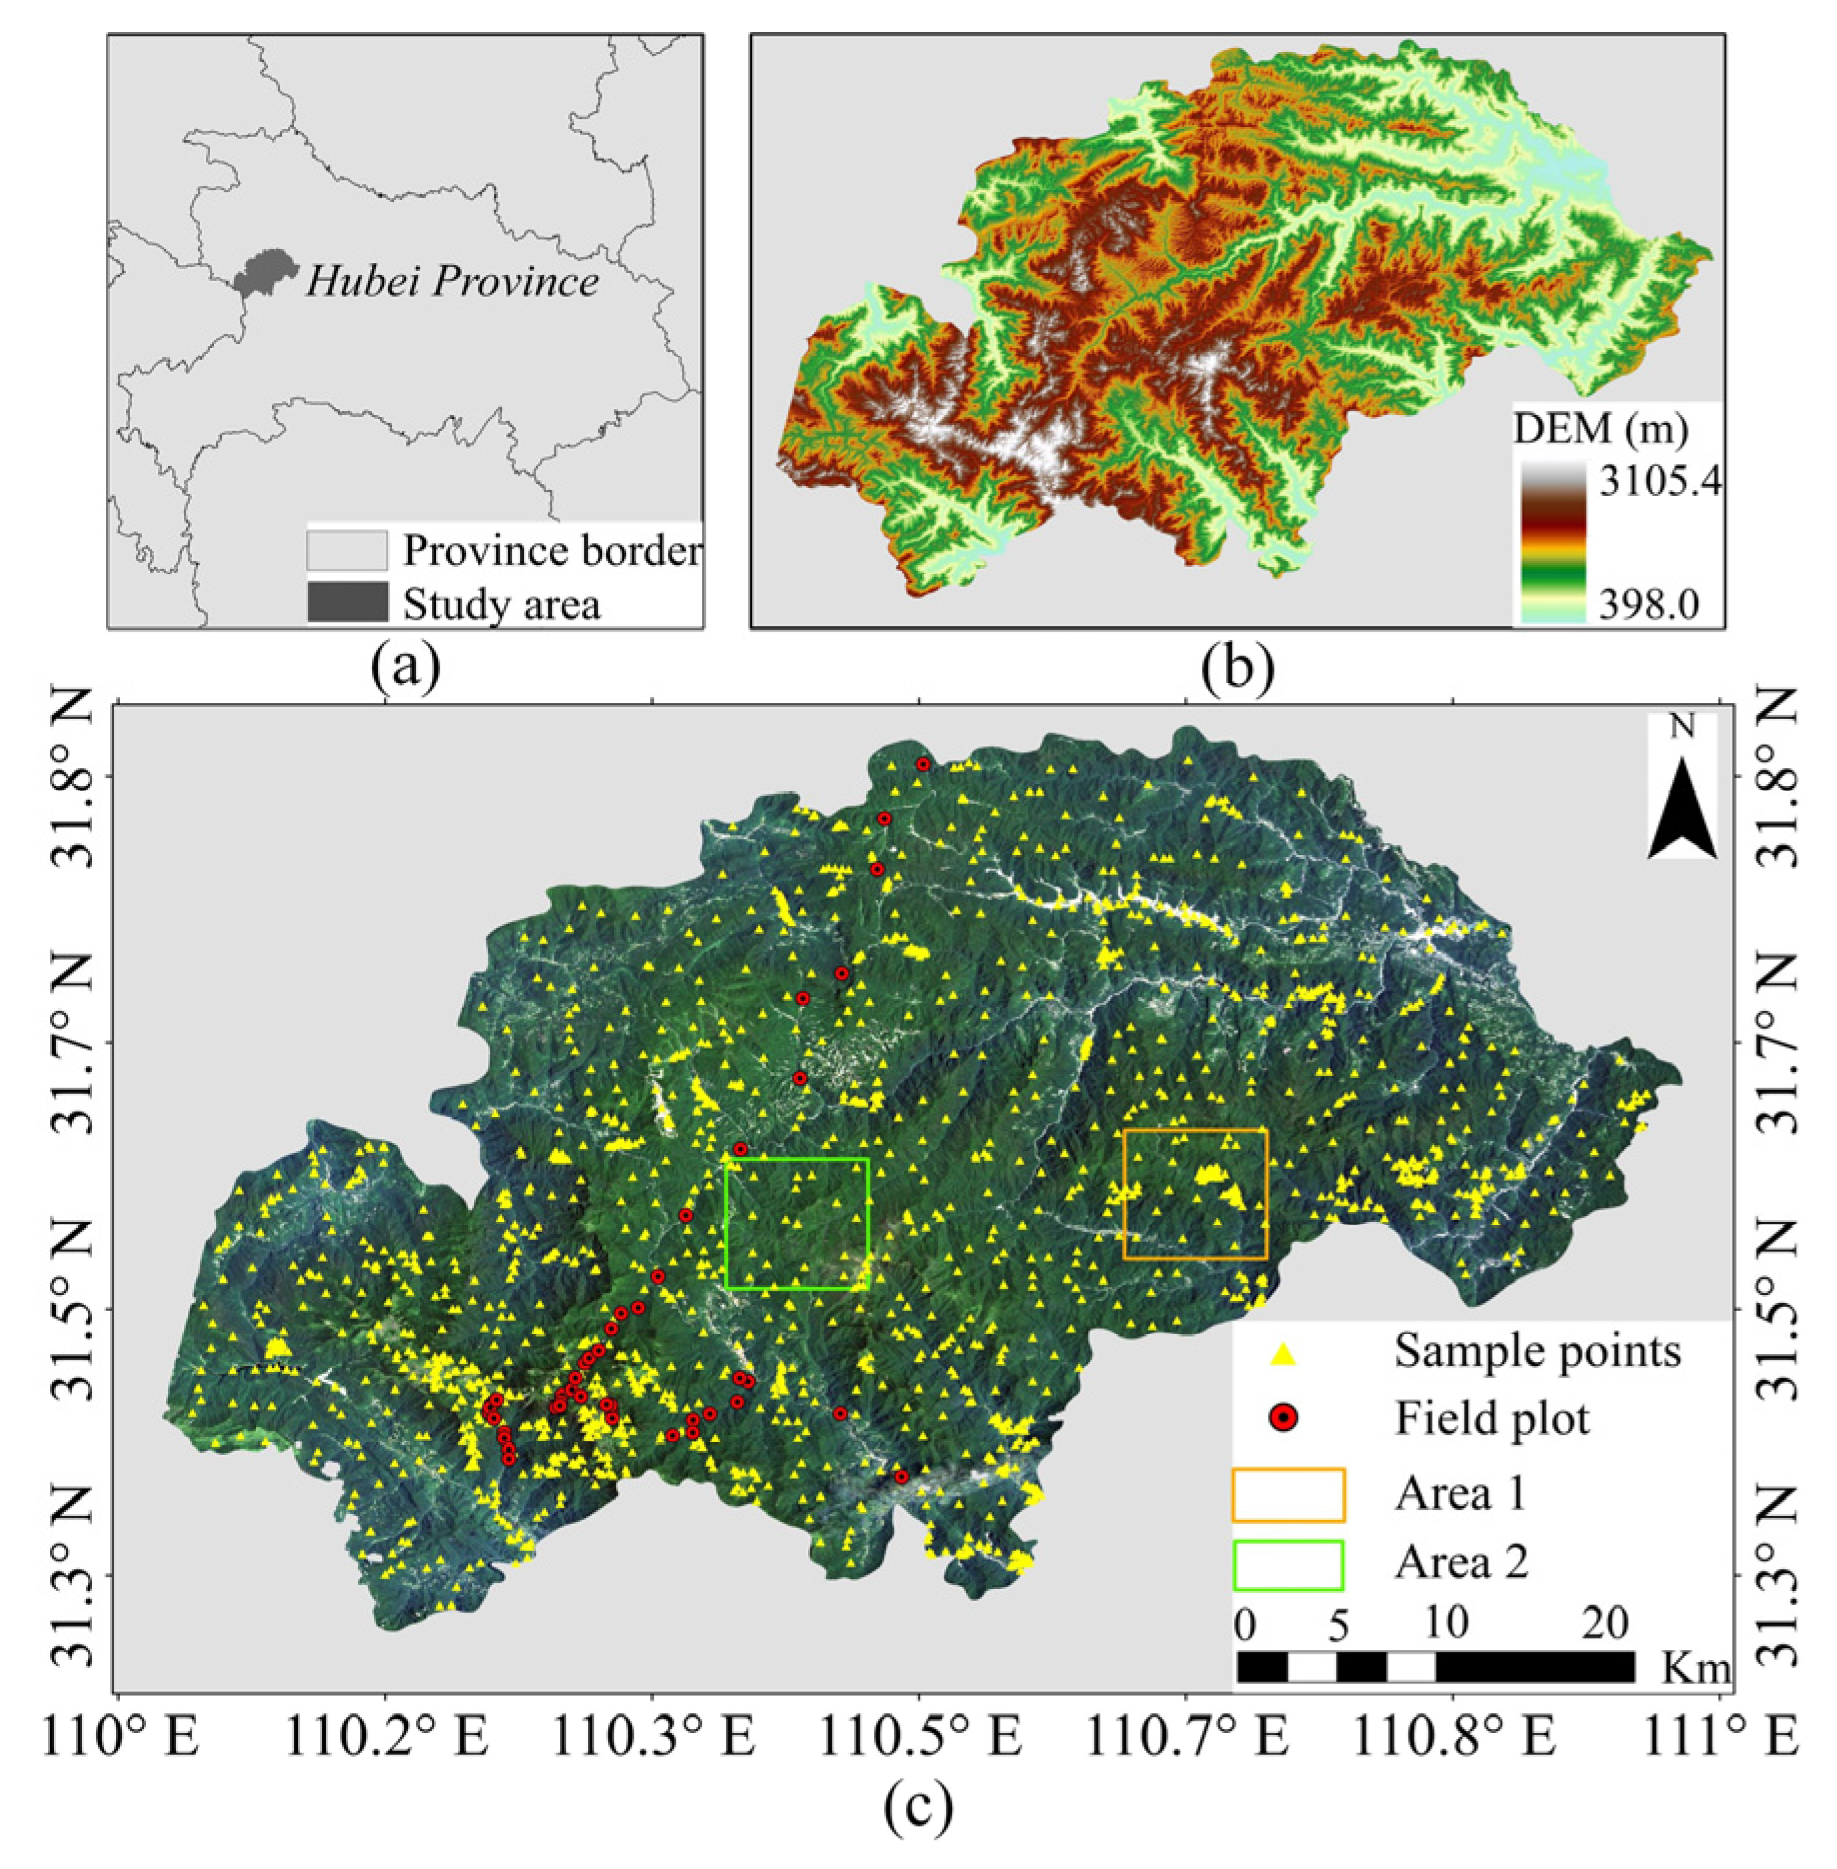
Figure 2.
The flowchart of the improved land cover classification model for mountainous areas with the inclusion of high spatial resolution phenological parameters.
Figure 2.
The flowchart of the improved land cover classification model for mountainous areas with the inclusion of high spatial resolution phenological parameters.
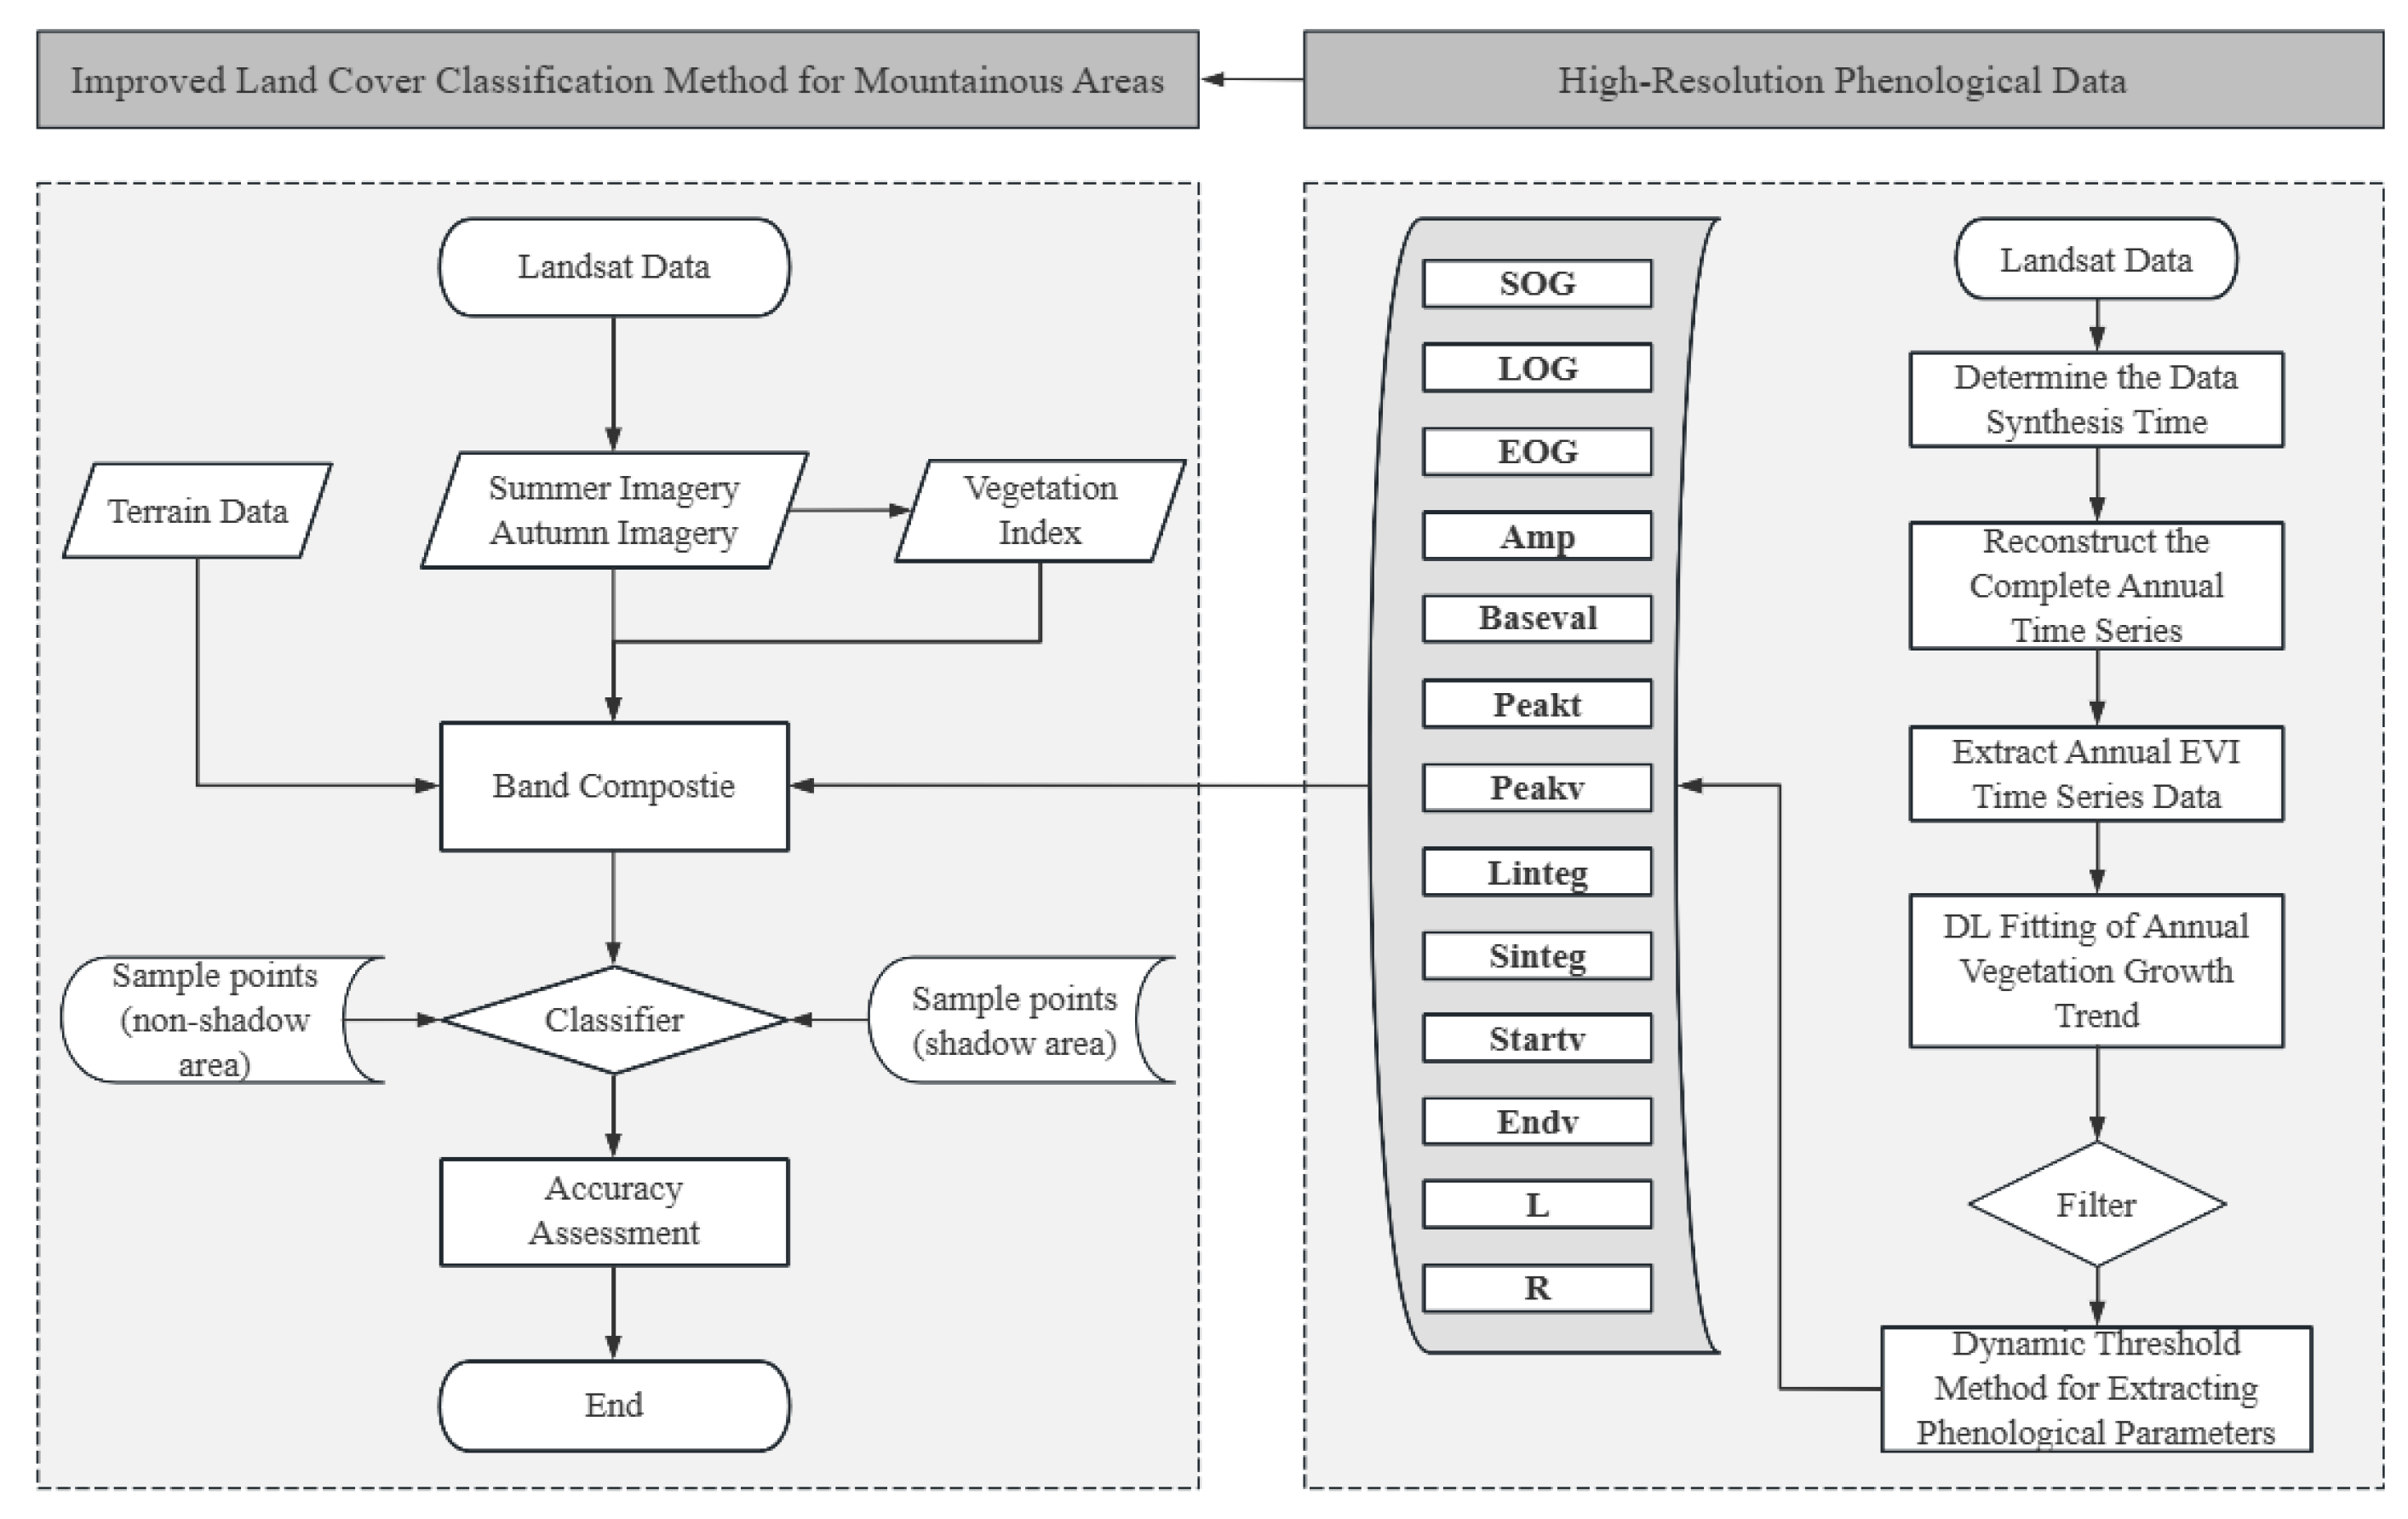
Figure 3.
A comparison of the SOG and EOG between Landsat phenology data and MCD12Q2 phenology product data. Figure 3(a) and Figure 3(b) are from Landsat imagery, while Figure 3(c) and Figure 3(d) are from MODIS imagery.
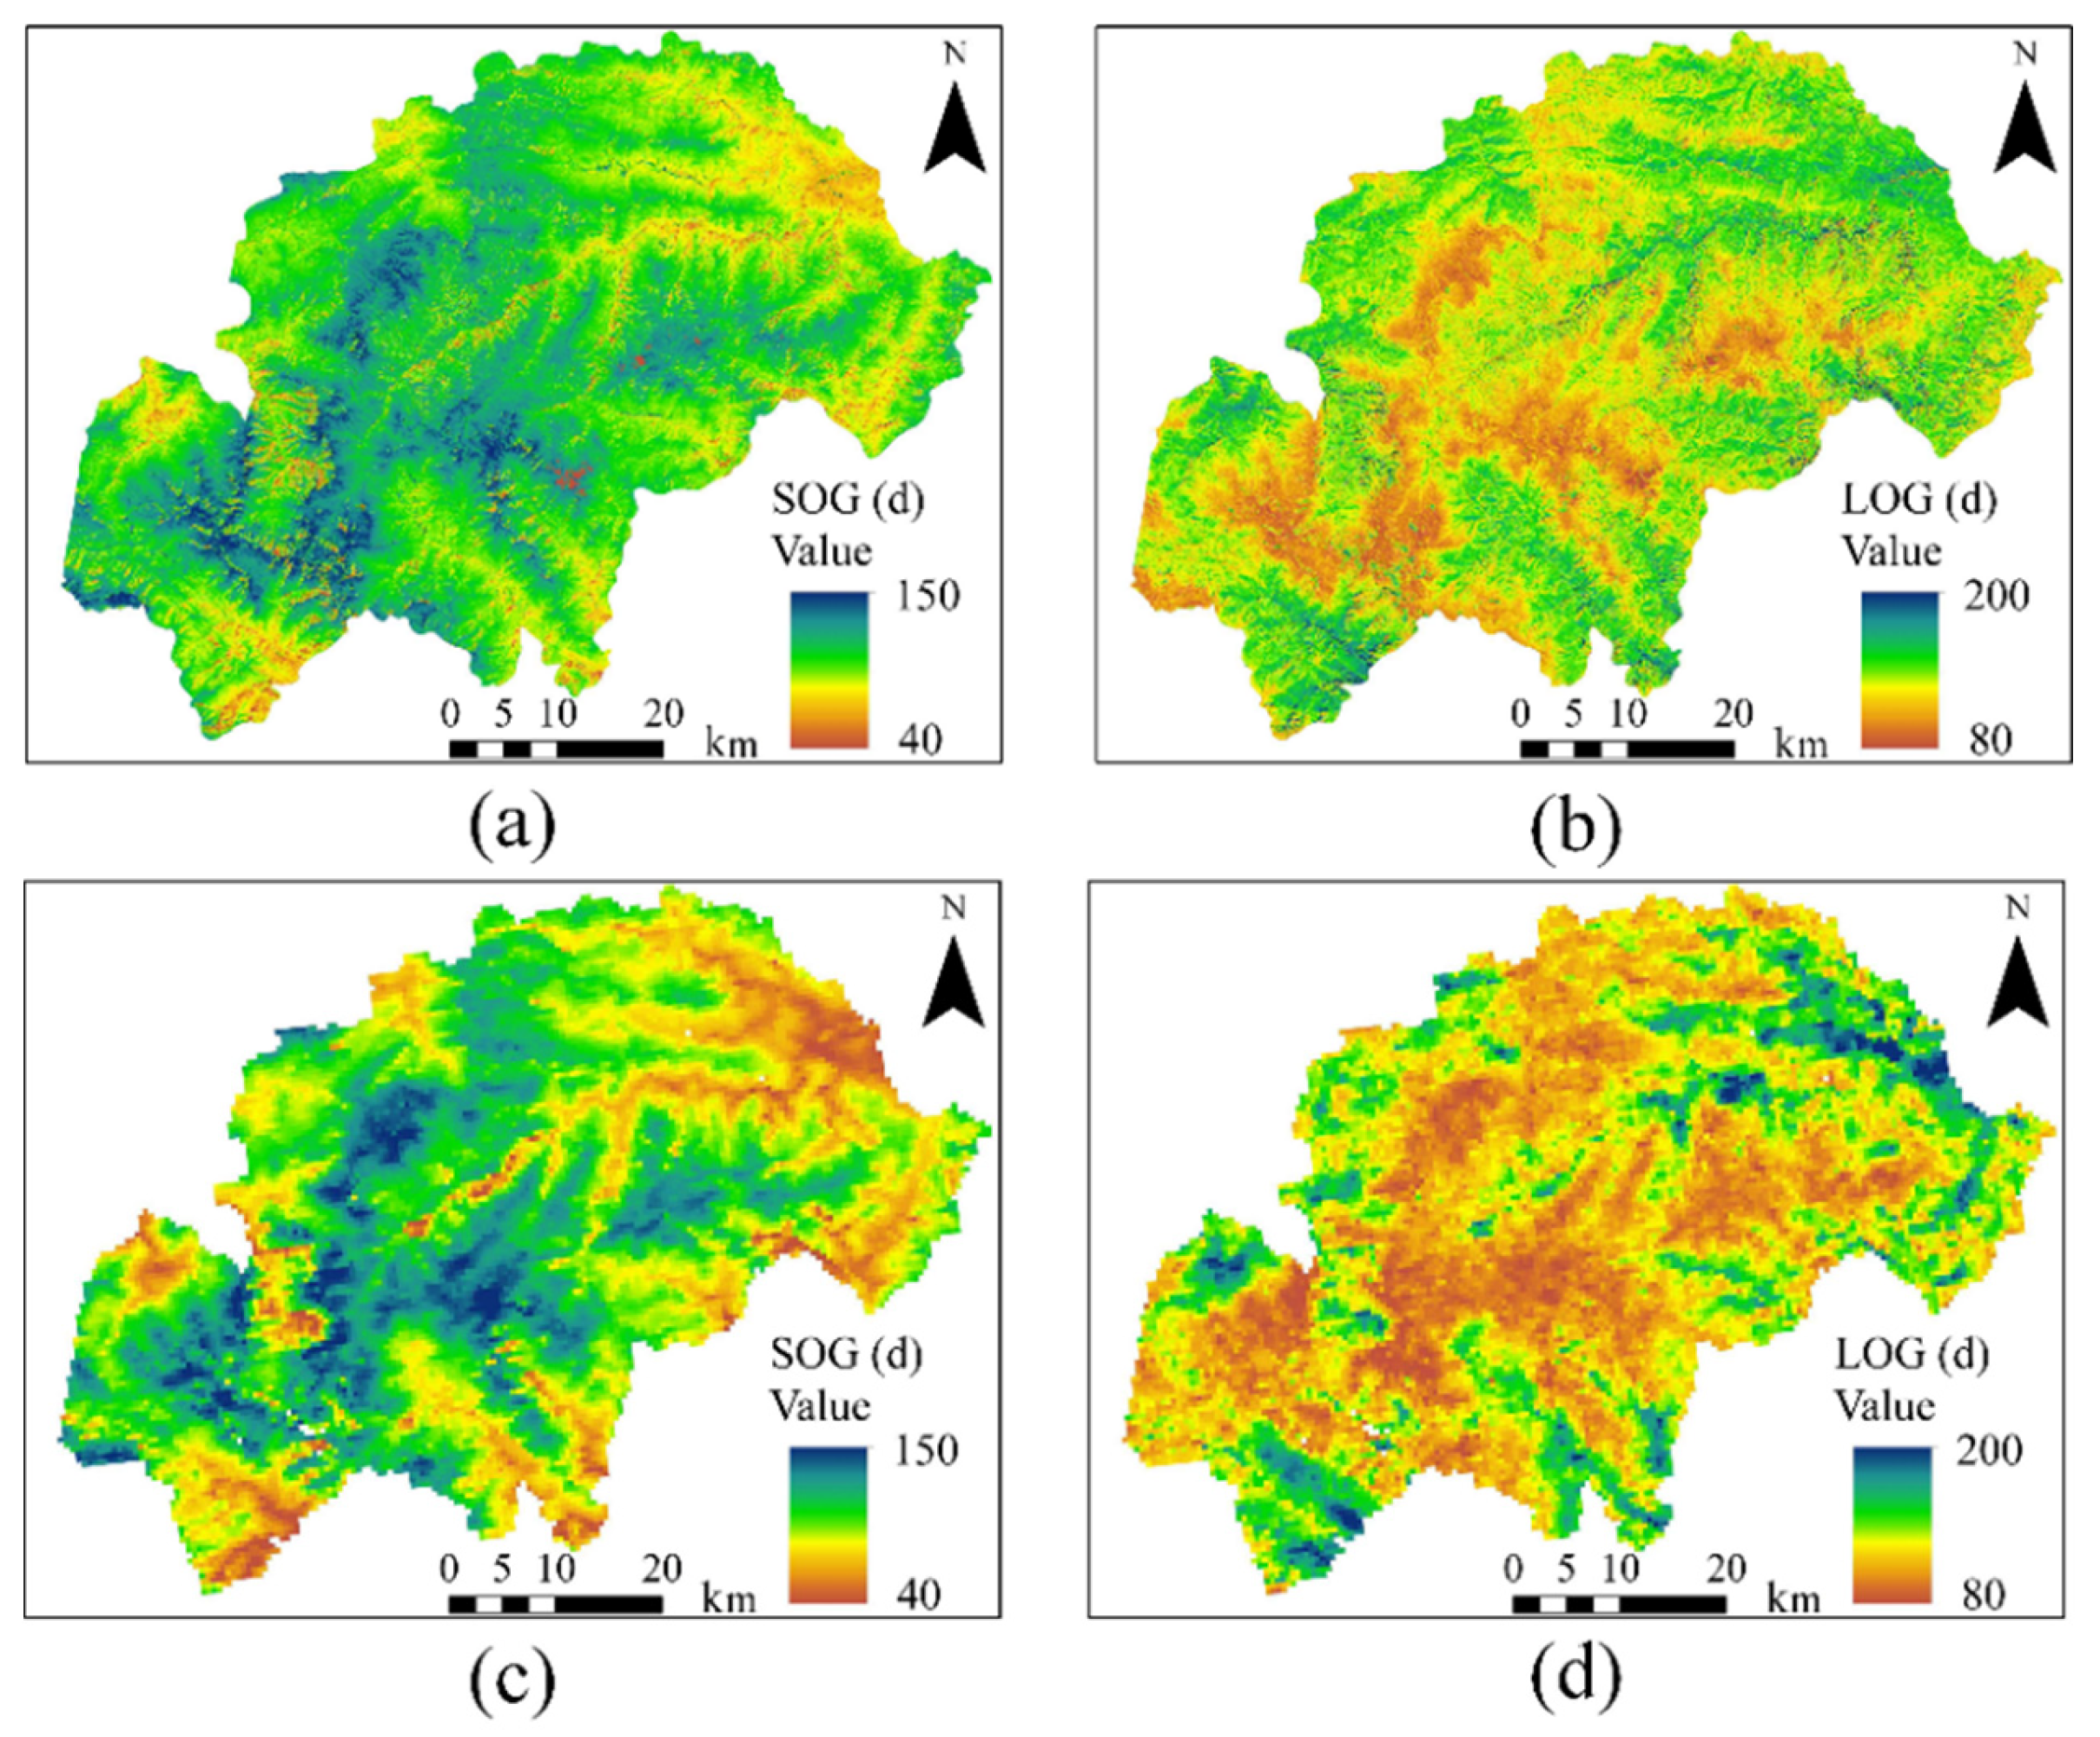
Figure 4.
Comparison of classification results based on summer imagery. a1, b1, c1 represent the classification results of Su1, Su2, and Su3 for Area 1 in the Figure 1(c), and a2, b2, and c2 represent the classification results of Su1, Su2, and Su3 for Area 2 in the Figure 1(c) respectively. (d) Labels.
Figure 4.
Comparison of classification results based on summer imagery. a1, b1, c1 represent the classification results of Su1, Su2, and Su3 for Area 1 in the Figure 1(c), and a2, b2, and c2 represent the classification results of Su1, Su2, and Su3 for Area 2 in the Figure 1(c) respectively. (d) Labels.
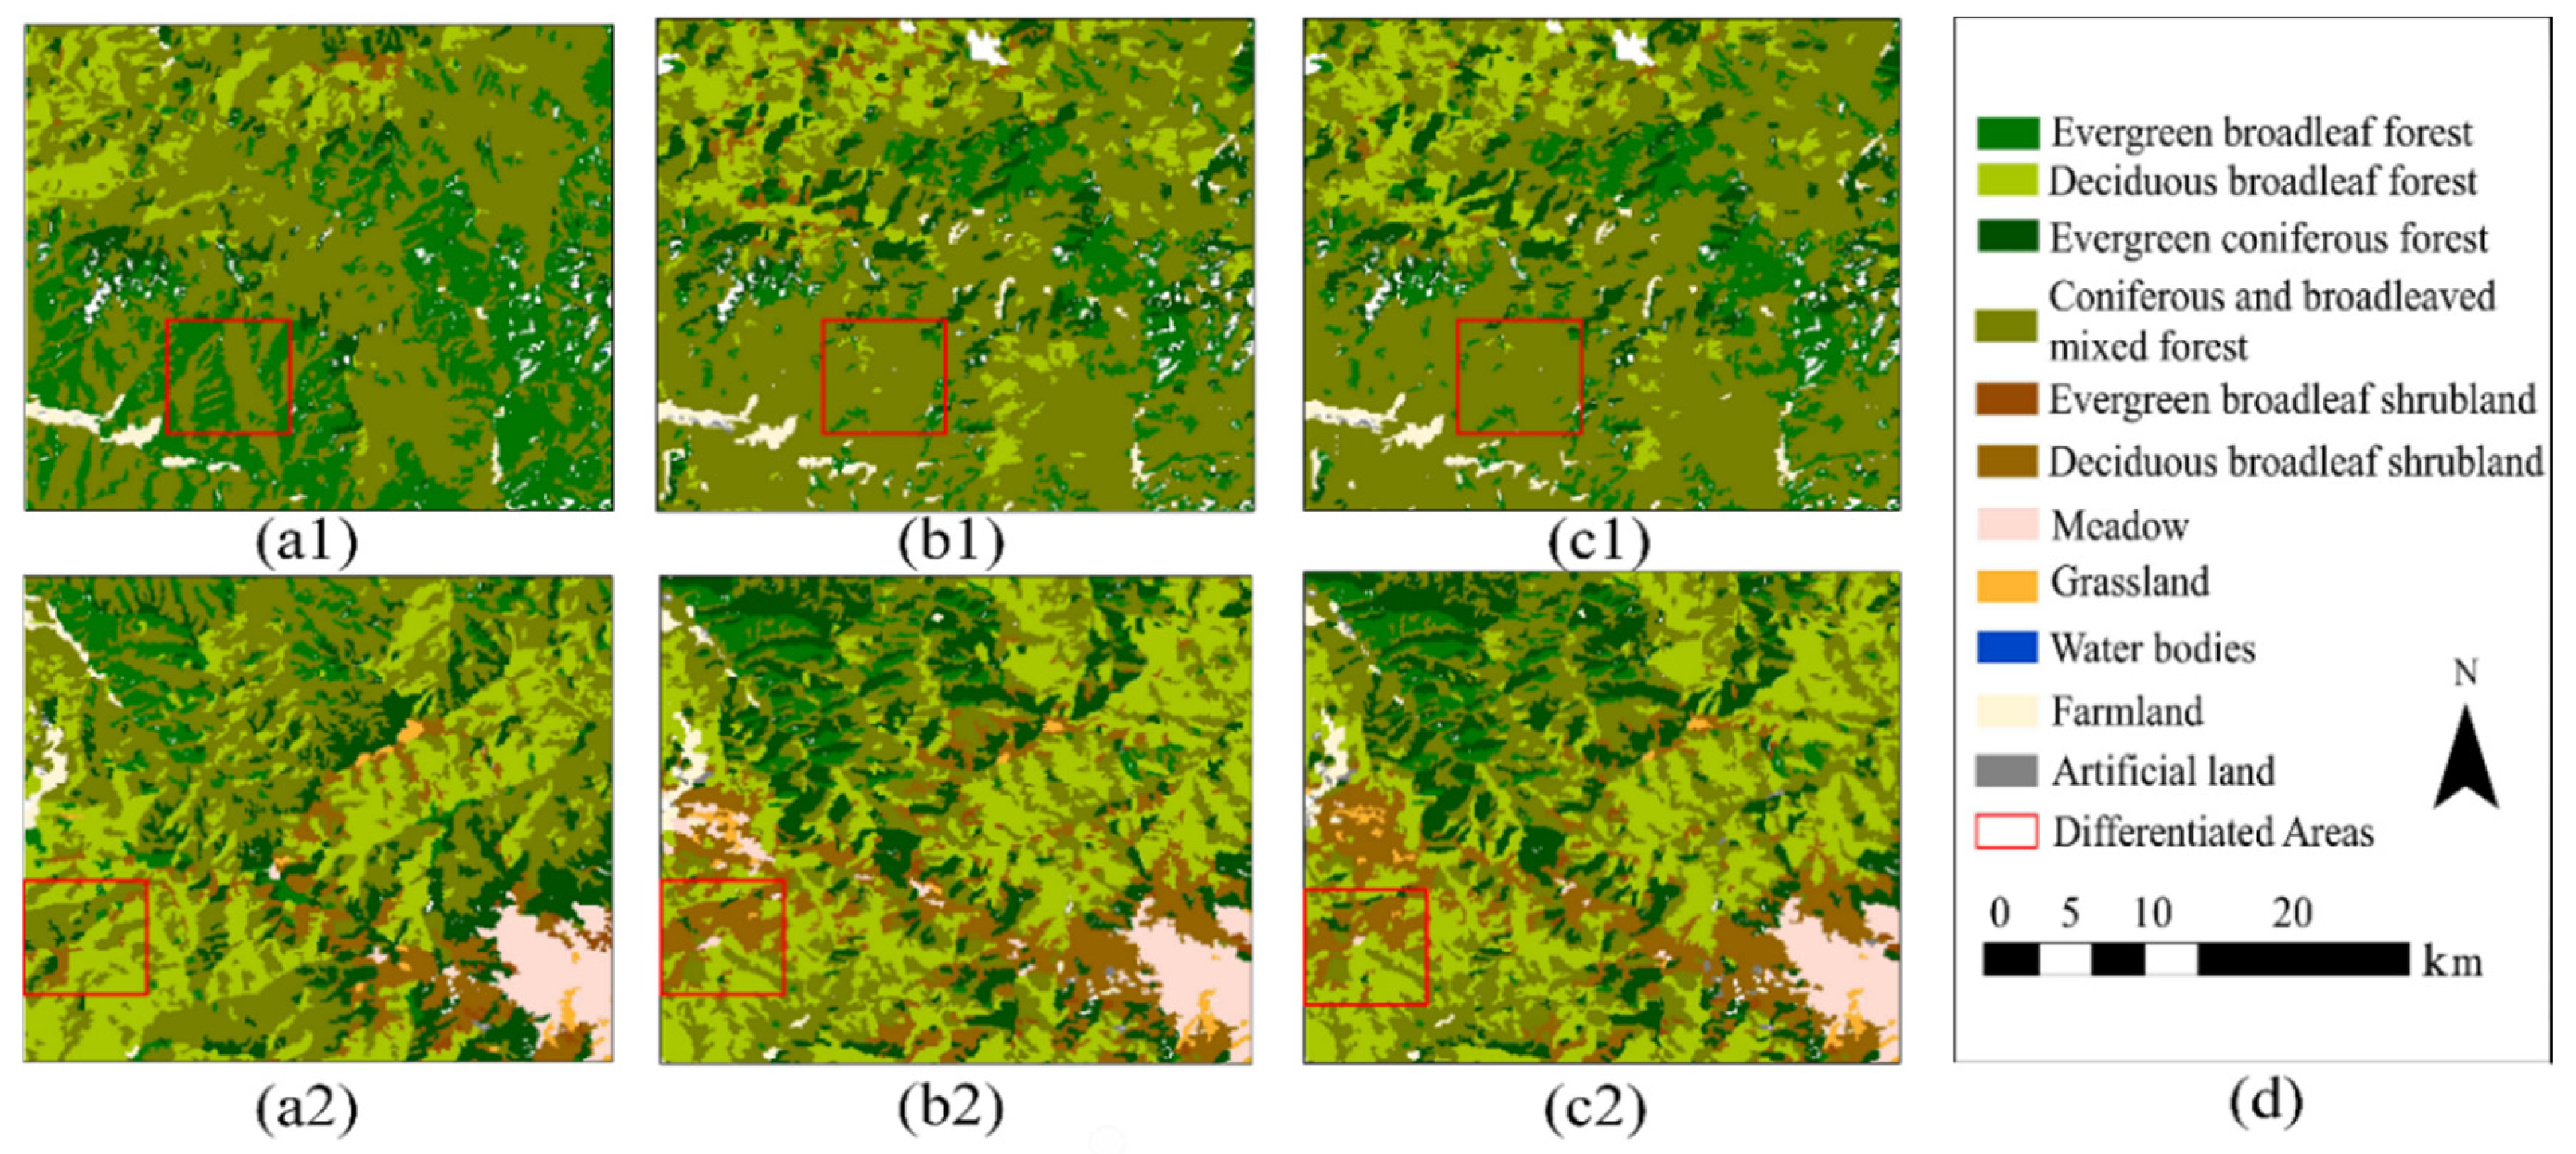
Figure 5.
Comparison of classification results based on autumn imagery. a1, b1, c1 represent the classification results of Au1, Au2, and Au3 for Area 1 in the Figure 1(c), and a2, b2, and c2 represent the classification results of Au1, Au2, and Au3 for Area 2 in the Figure 1(c) respectively. (d) Labels.
Figure 5.
Comparison of classification results based on autumn imagery. a1, b1, c1 represent the classification results of Au1, Au2, and Au3 for Area 1 in the Figure 1(c), and a2, b2, and c2 represent the classification results of Au1, Au2, and Au3 for Area 2 in the Figure 1(c) respectively. (d) Labels.
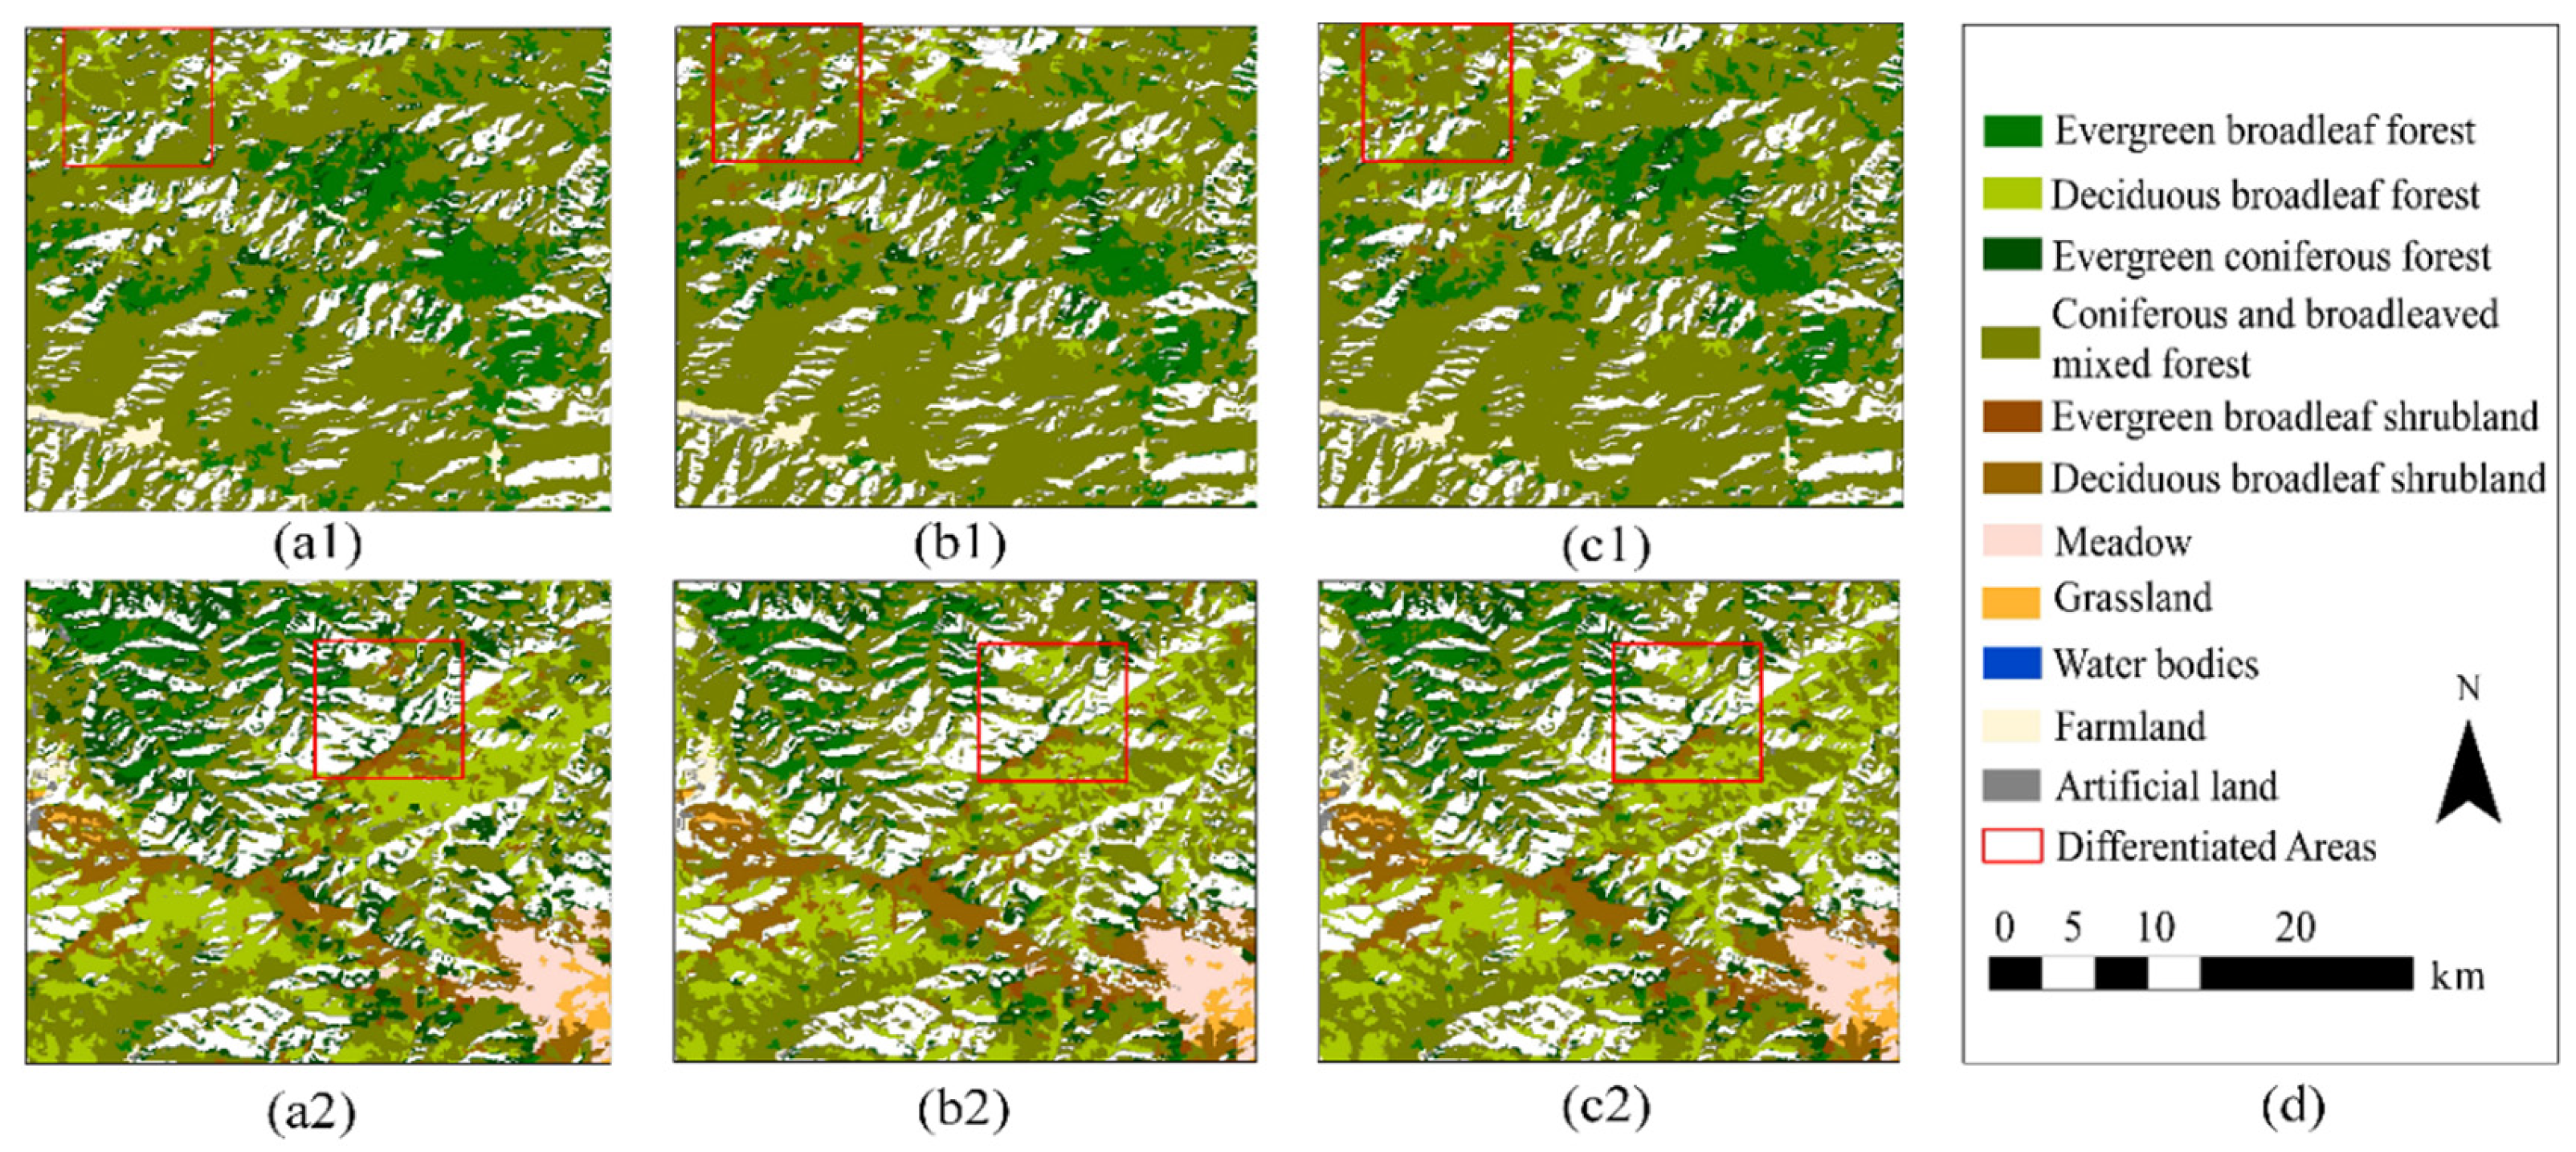
Figure 6.
Comparison of classification results based on autumn imagery. a1, b1, c1, d1 represent the classification results of SA1, SA2, SA3 and SA4 for Area 1 in the Figure 1(c), and a2, b2, c2 and d2 represent the classification results of SA1, SA2, SA3 and SA4 for Area 2 in the Figure 1(c) respectively. (e) Labels.
Figure 6.
Comparison of classification results based on autumn imagery. a1, b1, c1, d1 represent the classification results of SA1, SA2, SA3 and SA4 for Area 1 in the Figure 1(c), and a2, b2, c2 and d2 represent the classification results of SA1, SA2, SA3 and SA4 for Area 2 in the Figure 1(c) respectively. (e) Labels.
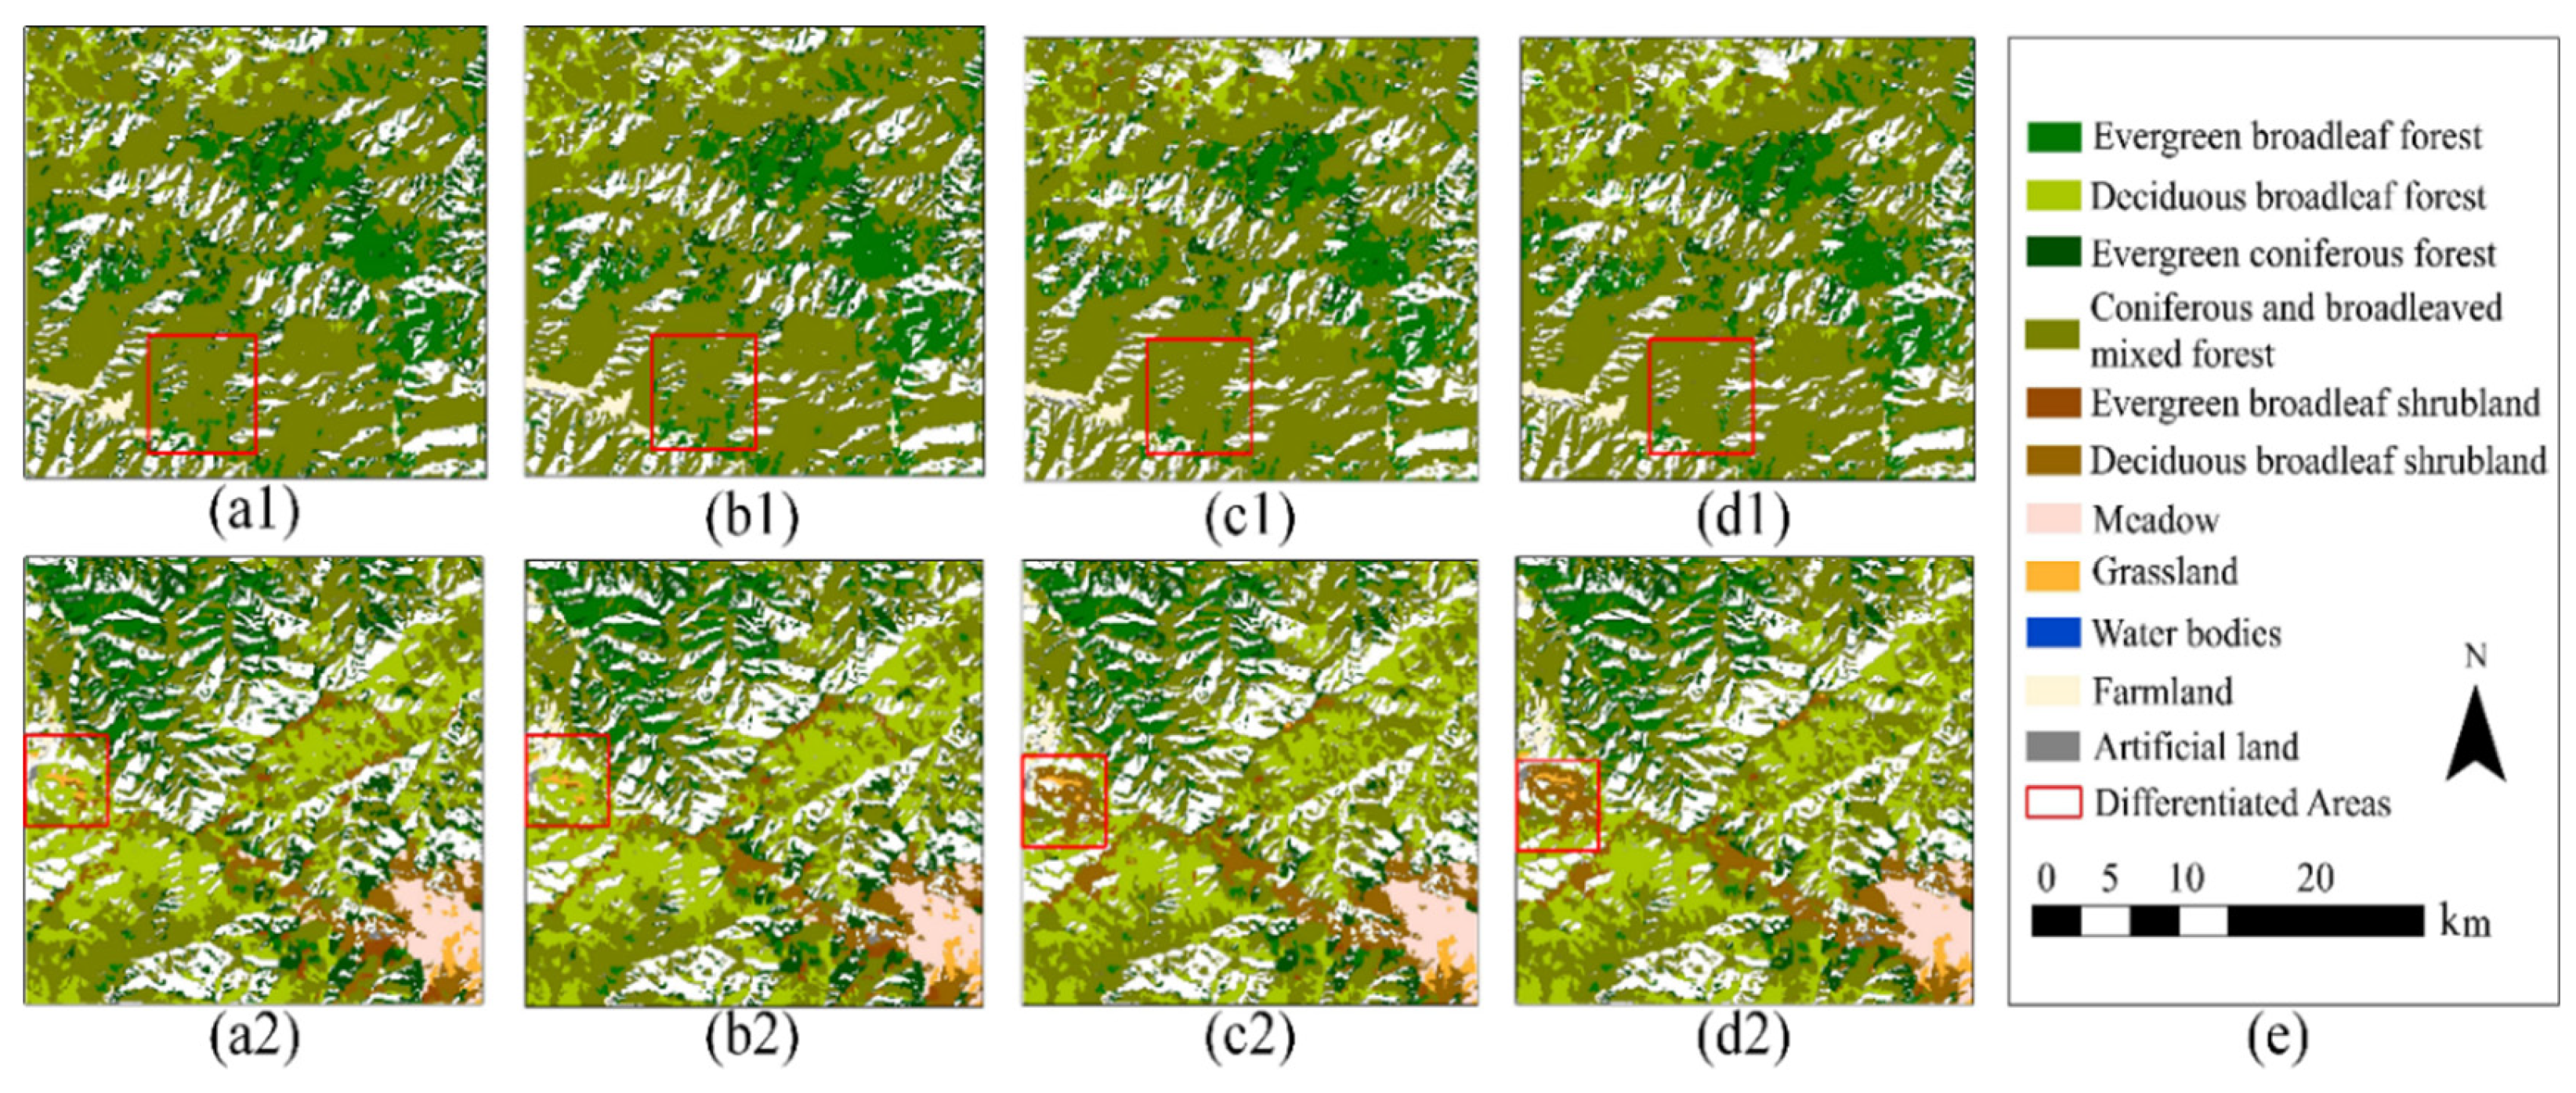
Figure 7.
The overall land cover classification results for the Shennongjia Forestry District.
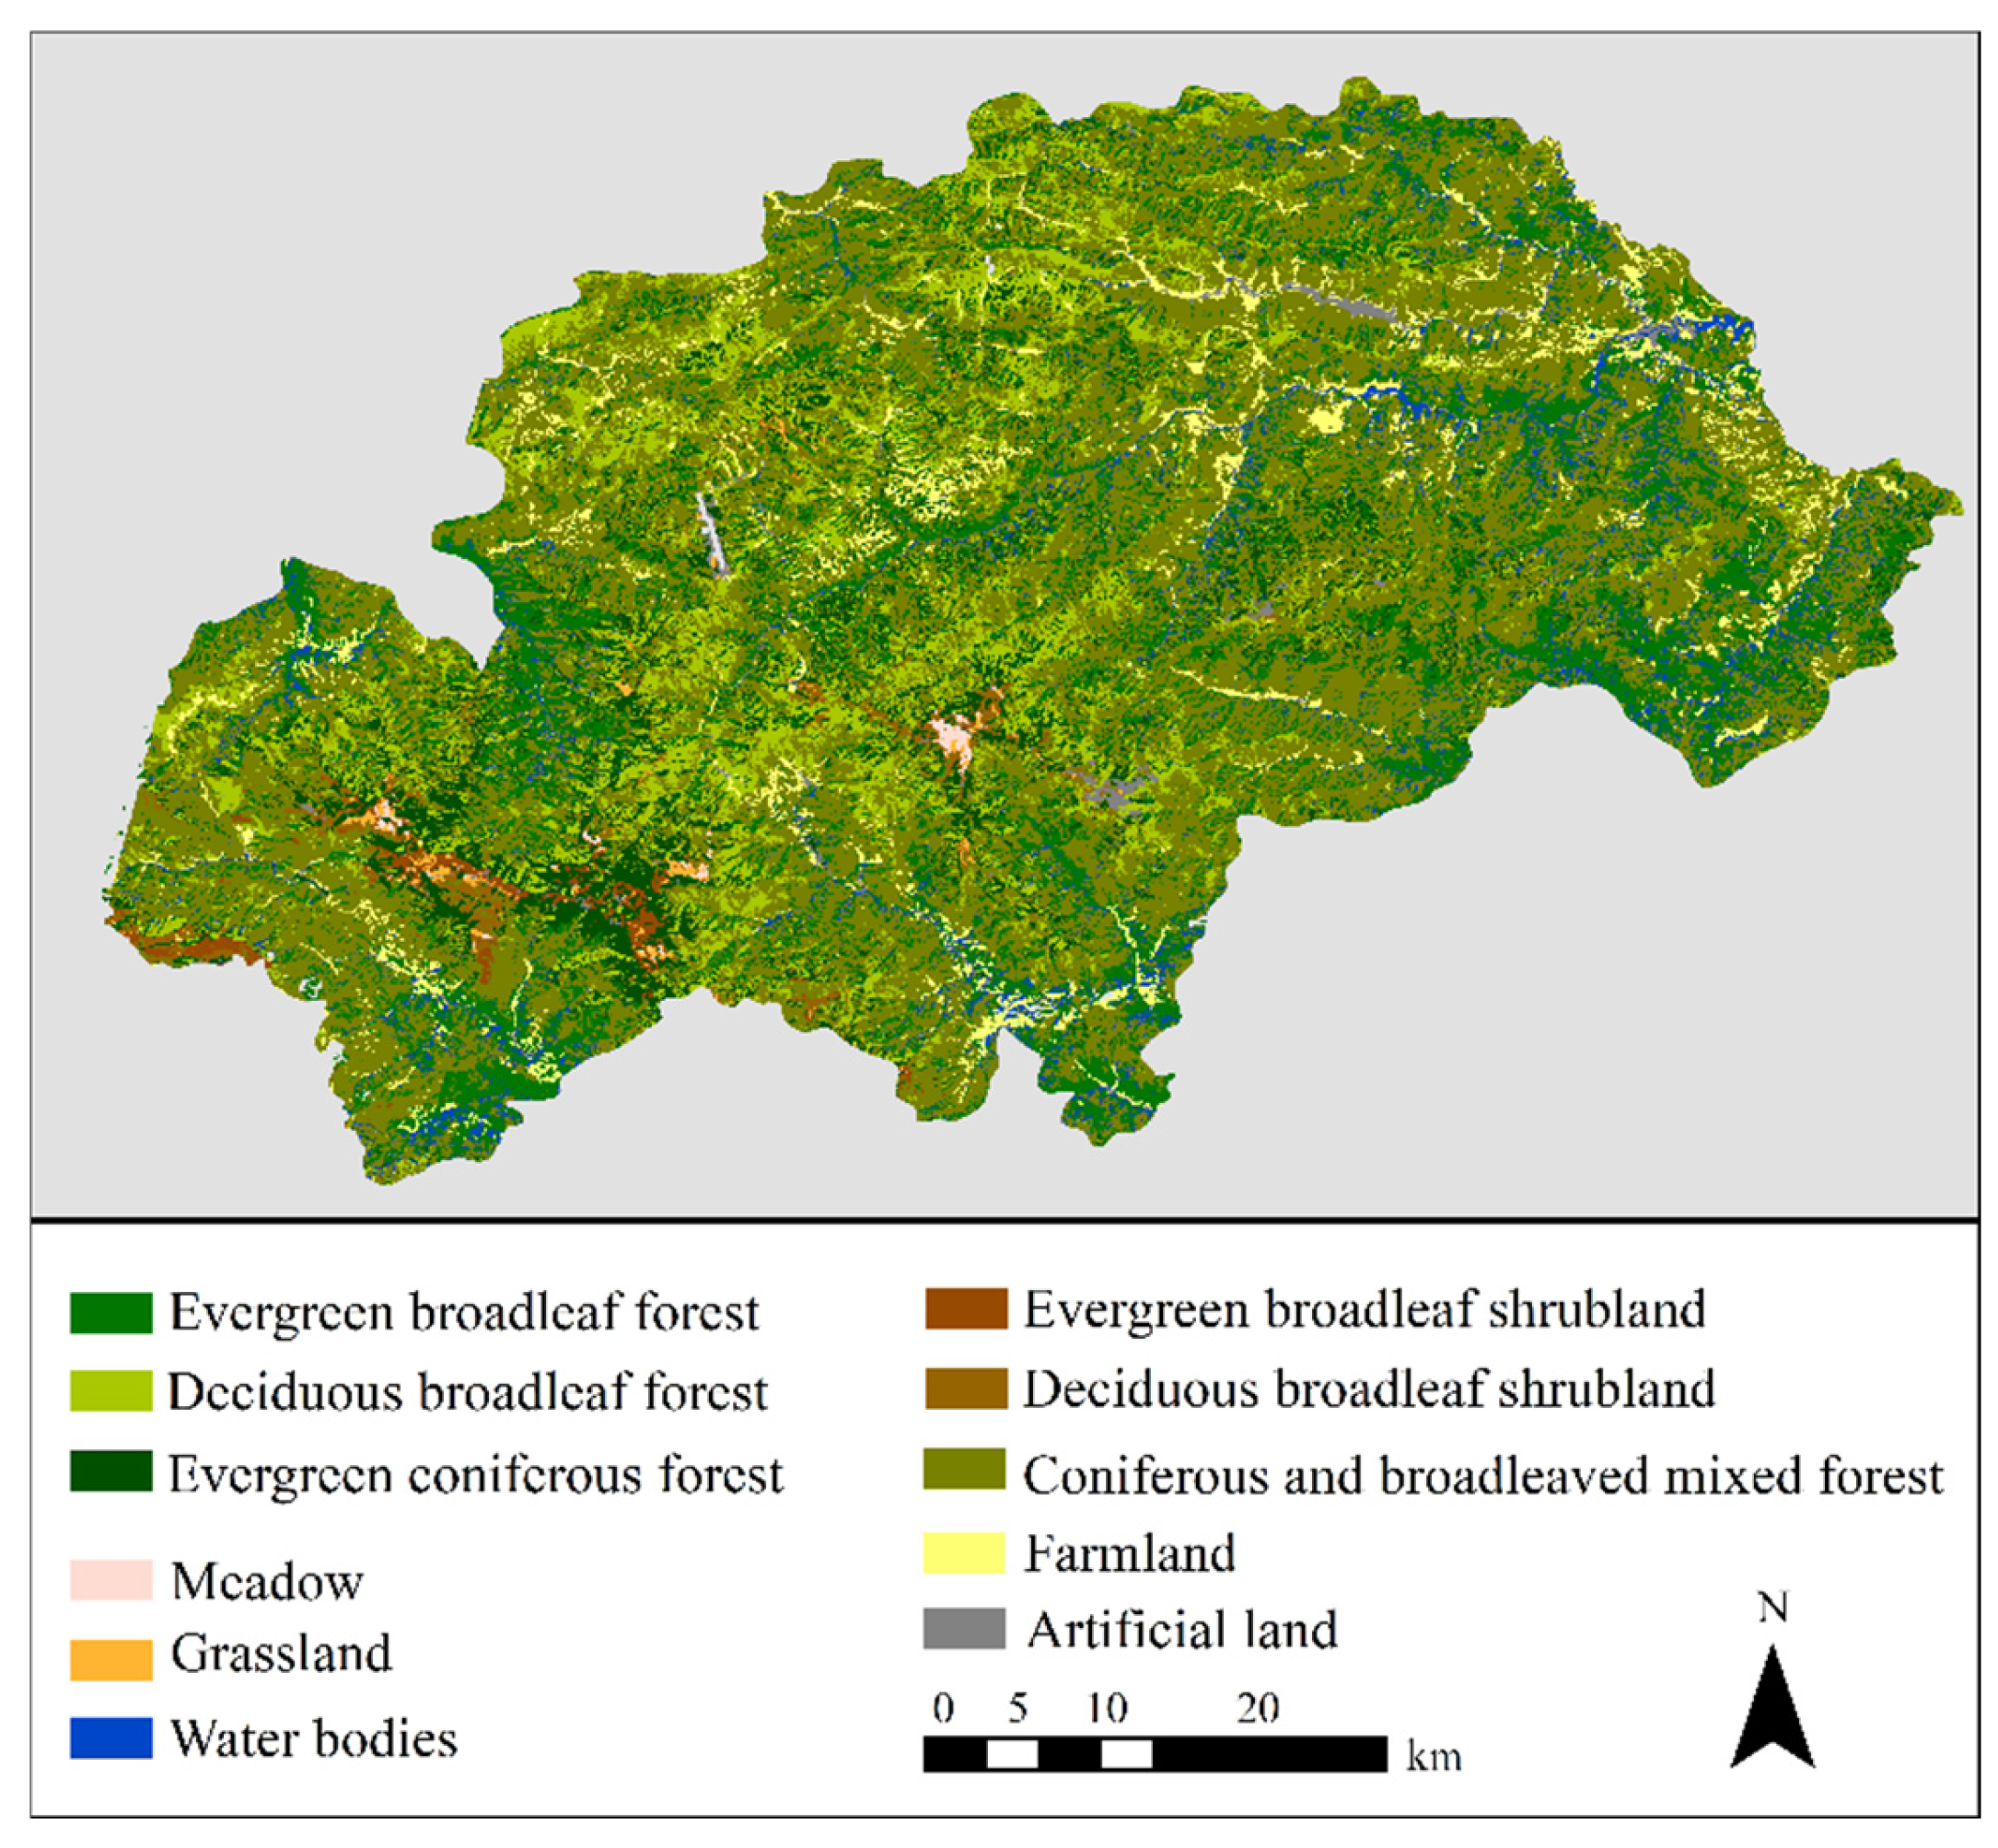

Table 1.
Equations for calculating various spectral indices used in the supervised classification of mountain land cover types are provided.
Table 1.
Equations for calculating various spectral indices used in the supervised classification of mountain land cover types are provided.
| Data Type | Name | Band Content/Formula |
|---|---|---|
| Vegetation Index Data (vegetation index) |
NDMVI | . |
| EWI | ||
| NDBBI | ||
| Shady Vegetation Index (SVI) | SVI |
Table 2.
Calculation Method and Interpretation of Multi-year Synthesized Phenological Data Bands.
| Abbreviation | Name | Definition |
|---|---|---|
| SOG | time for the start of the season | time for which the left edge has increased to a user defined level, measured from the left minimum level. |
| LOG | length of the season | time from the start to the end of the season |
| EOG | time for the end of the season | time for which the right edge has decreased to a user defined level measured from the right minimum level. |
| Amp | seasonal amplitude | difference between the maximum value and the base level |
| Baseval | base level | given as the average of the left and right minimum values |
| Peakt | time for the mid of the season | computed as the mean value of the times for which, respectively, the left edge has increased to the 80 % level and the right edge has decreased to the 80 % level. |
| Peakv | largest data value for the fitted function during the season | may occur at a different time compared with Peakt |
| Linteg | large seasonal integral | integral of the function describing the season from the season start to the season end |
| Sinteg | small seasonal integral | integral of the difference between the function describing the season and the base level from season start to season end. |
| Startv | value for the start of the season | value of the function at the time of the start of the season |
| Endv | value for the end of the season | value of the function at the time of the end of the season |
| L | rate of increase at the beginning of the season | calculated as the ratio of the difference between the left 20 % and 80 % levels and the corresponding time difference |
| R | rate of decrease at the end of the season | calculated as the absolute value of the ratio of the difference between the right 20 % and 80 % levels and the corresponding time difference. |
Table 3.
Different Combinations of Data Inputs in the Article.
| Name | Band Composite | |
|---|---|---|
| Non-shadow Area | Su1 | Summer Imagery+ Vegetation Index+ Terrain Data |
| Su2 | Summer Imagery+ Vegetation Index+ Phenology Data | |
| Su3 | Summer Imagery+ Vegetation Index+ Terrain Data+ Phenological Data | |
| Au1 | Autumn Imagery+ Vegetation Index+ Terrain Data | |
| Au2 | Autumn Imagery+ Vegetation Index+ Phenological Data | |
| Au3 | Autumn Imagery+ Vegetation Index+ Terrain Data+ Phenological Data | |
| SA1 | Summer Imagery+ Autumn Imagery +Vegetation Index | |
| SA2 | Summer Imagery+ Autumn Imagery +Vegetation Index+ Terrain Data | |
| SA3 | Summer Imagery+ Autumn Imagery +Vegetation Index+ Phenological Data | |
| SA4 | Summer Imagery+ Autumn Imagery +Vegetation Index+ Terrain Data+ Phenological Data | |
| Shadow Area | M1 | Autumn Imagery+ Vegetation Index |
| M2 | Autumn Imagery+ Vegetation Index+ Terrain Data | |
| M3 | Autumn Imagery+ Vegetation Index+ Phenological Data | |
| M4 | Autumn Imagery+ Vegetation Index+ Terrain Data+ Phenological Data |
Table 4.
PA, UA, Kappa, and OA for each class in the non-shadow areas classification results of summer imagery.
Table 4.
PA, UA, Kappa, and OA for each class in the non-shadow areas classification results of summer imagery.
| Accuracy Assessment | Different Data Combinations of Summer Imagery | |||||
|---|---|---|---|---|---|---|
| Class Name | Su1 | Su2 | Su3 | |||
| PA | UA | PA | UA | PA | UA | |
| Evergreen broadleaf forest | 75.41% | 76.37% | 85.71% | 91.68% | 87.52% | 91.23% |
| Deciduous broadleaf forest | 74.90% | 69.87% | 87.68% | 77.81% | 86.49% | 79.61% |
| Evergreen coniferous forest | 94.66% | 90.97% | 93.28% | 97.13% | 93.52% | 96.98% |
| Coniferous and broadleaved mixed forest | 54.28% | 62.54% | 71.39% | 79.46% | 73.48% | 80.40% |
| Evergreen broadleaf shrubland | 90.28% | 94.10% | 86.21% | 96.27% | 90.72% | 97.66% |
| Deciduous broadleaf shrubland | 80.12% | 68.84% | 84.41% | 80.04 % | 89.08% | 82.64% |
| Grassland | 82.13% | 86.74% | 90.00% | 81.50% | 89.57% | 86.98% |
| Meadow | 87.65% | 76.38% | 88.86% | 89.67% | 92.47% | 88.47% |
| Water bodies | 90.58% | 96.42% | 89.01% | 86.68% | 91.03% | 96.44% |
| Farmland | 82.88% | 83.58% | 88.62% | 85.33% | 88.31% | 86.06% |
| Artificial land | 78.68% | 77.80% | 82.23% | 82.76% | 84.41% | 78.31% |
| Kappa | 74.19% | 82.76% | 84.12% | |||
| OA | 77.29% | 84.85% | 86.04% | |||
Table 5.
PA, UA, Kappa, and OA for each class in the non-shadow areas classification results of autumn imagery.
Table 5.
PA, UA, Kappa, and OA for each class in the non-shadow areas classification results of autumn imagery.
| Accuracy Assessment | Different Data Combinations of Autumn Imagery | |||||
|---|---|---|---|---|---|---|
| Class Name | Au1 | Au2 | Au3 | |||
| PA | UA | PA | UA | PA | UA | |
| Evergreen broadleaf forest | 96.11% | 94.24% | 95.30% | 93.94% | 95.30% | 93.86% |
| Deciduous broadleaf forest | 81.52% | 93.75% | 84.63% | 89.49% | 85.40% | 90.26% |
| Evergreen coniferous forest | 95.30% | 95.77% | 94.57% | 97.82% | 94.66% | 97.91% |
| Coniferous and broadleaved mixed forest | 88.61% | 85.11% | 88.40% | 87.60% | 88.72% | 88.01% |
| Evergreen broadleaf shrubland | 95.79% | 94.83% | 94.48% | 95.31% | 96.08% | 95.80% |
| Deciduous broadleaf shrubland | 90.64% | 66.81% | 89.47% | 76.63% | 91.81% | 77.72% |
| Grassland | 84.68% | 92.77% | 87.02% | 96.01% | 87.45% | 94.92% |
| Meadow | 90.36% | 84.27% | 93.07% | 85.12% | 93.98% | 91.23% |
| Water bodies | 89.24% | 91.49% | 89.01% | 85.93% | 89.46% | 92.79% |
| Farmland | 90.71% | 89.96% | 93.01% | 89.46% | 93.95% | 90.54% |
| Artificial land | 82.23% | 86.86% | 83.36% | 87.61% | 84.98% | 84.57% |
| Kappa | 87.74% | 88.52% | 89.31% | |||
| OA | 89.19% | 89.89% | 90.59% | |||
Table 6.
PA, UA, Kappa, and OA for each class in the non-shadow areas classification results of summer-autumn imagery.
Table 6.
PA, UA, Kappa, and OA for each class in the non-shadow areas classification results of summer-autumn imagery.
| Accuracy Assessment | Different Data Combinations of Autumn Imagery | |||||||
|---|---|---|---|---|---|---|---|---|
| Class Name | SA1 | SA2 | SA3 | SA4 | ||||
| PA | UA | PA | UA | PA | UA | PA | UA | |
| Evergreen broadleaf forest | 95.21% | 94.78% | 95.75% | 95.66% | 95.12% | 95.20% | 95.84% | 95.32% |
| Deciduous broadleaf forest | 86.65% | 90.05% | 86.75% | 92.75% | 88.56% | 89.91% | 88.20% | 90.64% |
| Evergreen coniferous forest | 95.22% | 95.53% | 95.63% | 95.63% | 95.47% | 97.44% | 95.55% | 97.76% |
| Coniferous and broadleaved mixed forest | 89.36% | 85.21% | 89.36% | 85.56% | 88.56% | 87.76% | 89.09% | 87.92% |
| Evergreen broadleaf shrubland | 95.07% | 96.89% | 95.65% | 96.63% | 95.94% | 97.21% | 96.08% | 97.35% |
| Deciduous broadleaf shrubland | 80.90% | 82.02% | 89.28% | 81.64% | 89.67% | 87.45% | 92.98% | 88.17% |
| Grassland | 89.36% | 92.92% | 90.00% | 94.21% | 90.85% | 94.26% | 90.00% | 95.70% |
| Meadow | 90.96% | 92.07% | 92.17% | 94.44% | 92.17% | 96.23% | 93.67% | 97.19% |
| Water bodies | 89.91% | 95.48% | 91.70% | 96.46% | 91.03% | 92.91% | 92.83% | 95.83% |
| Farmland | 90.29% | 86.41% | 90.40% | 88.19% | 93.01% | 90.27% | 93.63% | 90.33% |
| Artificial land | 79.48% | 84.25% | 82.88% | 84.65% | 84.49% | 83.81% | 84.01% | 82.80% |
| Kappa | 88.29% | 89.39% | 89.96% | 90.43% | ||||
| OA | 89.71% | 90.67% | 91.17% | 91.58% | ||||
Table 7.
PA, UA, Kappa, and OA for each class in the classification results for the mountain shadow areas.
Table 7.
PA, UA, Kappa, and OA for each class in the classification results for the mountain shadow areas.
| Accuracy Assessment | Different Data Combinations of Autumn Imagery | |||||||
|---|---|---|---|---|---|---|---|---|
| Class name | M1 | M2 | M3 | M4 | ||||
| PA | UA | PA | UA | PA | UA | PA | UA | |
| Evergreen broadleaf forest | 96.18% | 82.44% | 96.40% | 85.43% | 94.79% | 91.63% | 95.37% | 95.37% |
| Deciduous broadleaf forest | 88.25% | 92.35% | 89.54% | 91.11% | 90.69% | 93.50% | 91.98% | 94.27% |
| Evergreen coniferous forest | 73.65% | 95.82% | 82.26% | 98.31% | 89.20% | 96.66% | 89.59% | 97.35% |
| Coniferous and broadleaved mixed forest | 78.19% | 79.67% | 81.44% | 84.99% | 89.21% | 85.83% | 91.42% | 87.07% |
| Kappa | 80.24% | 84.30% | 88.38% | 89.83% | ||||
| OA | 85.76% | 88.65% | 91.54% | 92.59% | ||||
Disclaimer/Publisher’s Note: The statements, opinions and data contained in all publications are solely those of the individual author(s) and contributor(s) and not of MDPI and/or the editor(s). MDPI and/or the editor(s) disclaim responsibility for any injury to people or property resulting from any ideas, methods, instructions or products referred to in the content. |
© 2025 by the authors. Licensee MDPI, Basel, Switzerland. This article is an open access article distributed under the terms and conditions of the Creative Commons Attribution (CC BY) license (http://creativecommons.org/licenses/by/4.0/).
Copyright: This open access article is published under a Creative Commons CC BY 4.0 license, which permit the free download, distribution, and reuse, provided that the author and preprint are cited in any reuse.


