Submitted:
10 June 2025
Posted:
11 June 2025
You are already at the latest version
Abstract
With the development of intelligent manufacturing, factory environment monitoring is gradually moving toward automation and intelligence. As a critical system for maintaining comfort and energy efficiency in production environments, the operational status and temperature control of central HVAC (Heating, Ventilation, and Air Conditioning) systems are critical. This paper proposes a real-time central HVAC temperature detection system based on the WCA-YOLO object detection algorithm, aiming to enhance temperature monitoring efficiency and coverage in intelligent production and office environments through autonomous inspection robots. Firstly, an HVAC temperature detection dataset was constructed, including 20 categories: 19 temperature levels corresponding to adjustable settings and a panel-off state. All images are meticulously annotated to ensure high-quality training data. Secondly, the WCA-YOLO model is built upon the YOLOv8 architecture, incorporating Wavelet Pooling to enhance sensitivity to edge information in images and adopting the Cross Stage Partial (CSP) mechanism to improve the detection performance for complex backgrounds and fine details. Finally, experimental results demonstrate that WCA-YOLO achieves superior performance in HVAC air conditioner detection tasks, establishing it as the optimal approach for this application.
Keywords:
target detection
; deep learning
; wavelet pool
; WCA-YOLO
1. Introduction
Automation and unmanned operation in manufacturing and office environments have steadily advanced in recent years. These developments have raised the demand for higher levels of intelligence and real-time capability in environmental monitoring and safety management [1]. As a core component of industrial infrastructure, the Heating, Ventilation, and Air Conditioning (HVAC) system plays a vital role in maintaining environmental stability and ensuring worker comfort. Its operating condition and temperature control directly impact both production quality and energy consumption. Traditional inspection of HVAC systems mainly relies on manual labor, which often results in low efficiency and limited coverage. Continuous and comprehensive monitoring under such conditions remains difficult. This paper presents an autonomous inspection robot system based on the YOLO object detection algorithm. The system performs real-time identification of preset HVAC temperature values and helps maintain thermal stability in the workplace. By enhancing the level of automation in monitoring processes and enabling early identification of irregular HVAC behavior, the system supports creating a safer and more efficient operating environment in smart factories.
The main contributions of this study are as follows:
- a)
- This study builds an HVAC temperature detection dataset containing 19 temperature categories and one category for device shutdown, supporting real-time recognition of set environmental temperatures.
- b)
- A YOLO-based detection network with Wavelet Pool enhances multi-scale feature fusion and improves accuracy in recognizing digital HVAC temperature values.
- c)
- Performance comparison experiments use the custom dataset and include several conventional lightweight YOLO models. The proposed network shows the best overall performance across all metrics.
- d)
- Ablation experiments examine the influence of each improved module on detection accuracy and stability.
2. Related Works
The YOLO algorithm demonstrates outstanding performance in real-time object detection with limited computational resources [2]. It has attracted significant attention in academic research and has also achieved widespread deployment in industrial applications. Unlike traditional two-stage detection methods, YOLO adopts a one-stage structure that simultaneously performs object classification and localization over the entire image. This design greatly enhances detection speed and enables efficient operation under constrained hardware conditions [3]. As a result, YOLO has been widely used in latency-sensitive scenarios such as autonomous inspection, security surveillance, and industrial automation. Substantial research progress on YOLO-based object detection has been made within the academic community.
Gündüz, M. Ş. et al. proposed a real-time indoor crowd counting and space capacity evaluation method based on the YOLO object detection model. This method is designed to support population density control during the COVID-19 pandemic. It identifies and counts individuals within predefined areas in video frames while estimating the area size and calculating the maximum number of people that can be accommodated. The YOLO model is used for person detection, with pretrained weights from the Microsoft COCO dataset. Several YOLO versions are evaluated. The results showed that YOLOv3 achieved the highest accuracy and mAP (0.50 and 0.75), while YOLOv5s offered the best frame rate among non-Tiny models [4]. Shen, X. et al. proposed a deep learning approach that modifies the vertical grid quantity in the YOLO network for object detection in high-resolution zoomed remote sensing images. The method extracts texture features using the gray-level co-occurrence matrix. It applies SLIC super-pixel segmentation to divide images into bright and dark scenes, enabling the localization of salient regions. Based on this process, a segmentation model is constructed to enhance the adaptability of recognition in high-resolution remote sensing data. The edge detection process for object contours is refined to address the blurred object boundaries caused by light refraction and imaging distortion. Furthermore, the authors designed an improved YOLO structure comprising 20 convolutional layers and five max-pooling layers. By adjusting the aspect ratio and increasing the number of vertical grids, the model achieved better suitability for detecting short and wide objects. Experimental results demonstrated that this method outperforms the original YOLO and other mainstream algorithms across various complex scenarios, showing strong real-time performance and detection accuracy [5]. Agarwal, V. et al. developed a layout-independent and efficient automatic license plate detection system based on the YOLO architecture. The system integrates license plate detection and layout classification into a unified framework and incorporates normalization and denormalization strategies to enhance recognition performance. The model maintains an effective balance across stages by refining both accuracy and inference speed. Training is conducted on images from several public datasets, and various data augmentation techniques were applied to improve robustness under complex conditions. Experimental results confirmed the superiority of the proposed system over existing research methods and commercial solutions across multiple benchmarks, including Automobile, Stanford Cars, CCPD, used car datasets, and real-time acquisition scenarios [6]. Mimura, K. et al. proposed a deep learning-based automatic recognition method for microscopic images to detect ichthyoliths, including fish teeth and denticles. The approach employed the YOLOv7 object detection architecture and involved model training under various conditions. The best-performing model trained on the original dataset achieved an F1 score of 0.87. The authors then utilized the pretrained model to expand the dataset efficiently. A comparison with manual counting results confirmed the model’s practicality in identifying triangular teeth, denticles, and irregular tooth structures. This method significantly reduced human intervention and demonstrated the potential of deep learning in broader applications involving microfossil detection, offering improvements in the temporal and spatial resolution of ichthyolith records [7]. Zhu, X et al. proposed a deep learning model based on YOLOv7 for automatically detecting pine wilt disease. The model incorporates an attention mechanism to improve the recognition accuracy of diseased pine trees in forest areas. It is trained and tested using high-resolution helicopter remote sensing images. Experimental results show that the improved YOLOv7-SE model achieves the best detection performance, with a precision of 0.9281, a recall of 0.8958, and an F1 score of 0.9117. This study demonstrates the significant role of attention mechanisms in enhancing object detection performance and provides strong technical support for efficient monitoring and control of pine wilt disease [8].
Industrial scenarios impose strict requirements on object recognition efficiency, typically at the millisecond level. However, the temperature digits displayed on HVAC panels are small targets, and some digits have minor differences that easily confuse. Especially against low-contrast backgrounds, digits such as 6 and 8 or 6 and 2 are prone to misdetection. Although classical lightweight networks can meet industrial real-time speed requirements, their false positive and false negative rates are generally high, failing to meet practical application standards. To address these issues, this paper proposes a small-target multi-scale feature fusion detection network based on YOLOv8, combined with Wavelet Pool. This approach improves detection accuracy and recall while maintaining detection efficiency, thus balancing detection speed and precision.
3. Data Resources and Platform
3.1. Inspection Robot Platform
This paper constructs a real-time object detection platform using the SIASUN inspection robot. The platform achieves recognition and monitoring of temperature digits on HVAC instrument panels. The system integrates motion control, image acquisition, and safety alerts. An autonomous mobile inspection robot performs platform motion tasks. The robot carries an embedded mainboard, which utilizes RTOS for task scheduling and navigation control. A high-definition camera mounted on the robot captures HVAC instrument images, and an onboard wireless network connects with a cloud server for detection purposes. During autonomous inspections, the robot photographs HVAC instrument panels along its route. The platform detects the displayed temperature values in real time and records instances of temperature-setting violations.
Figure 1 presents the inspection robot platform. It adopts a dual-wheel differential structure.
3.2. HVAC Temperature Detection Dataset
This paper presents a self-built HVAC temperature detection dataset. The dataset focuses on temperature digit detection of HVAC instrument panels in smart factories and office buildings. All image annotations follow the official YOLO format, ensuring compatibility with mainstream object detection frameworks. The dataset includes 3,499 images after data augmentation. These images cover various HVAC temperature digits under different backgrounds. The LabelImg tool provides annotations for the collected images. The dataset contains 20 categories, including temperatures from 17℃ (open17) to 35℃ (open35) and one category indicating HVAC turned off (close).
3.3. Loss Function and Evaluation Metrics
This study adopts loss functions and evaluation metrics. These are used to assess the detection performance of the model. The selected indicators reflect performance under multiple IoU thresholds [9,10,11,12]. This ensures a balanced and reliable evaluation. The optimization methods improve the accuracy of WCA-YOLO. They also enhance their generalization ability in object detection tasks. The loss function in object detection includes several components which contribute to the training process and influence the final detection performance:
1. Box Loss
Where, S refers to the grid size, B represents the number of bounding boxes predicted by each grid cell, represents the weighing factor and denotes indicates whether the bounding box matches the target. In addition, and denote the center coordinates of the bounding box, while and denotes its width and height.
2. Classification Loss
Where, S refers to the grid size, is the predicted probability that the object in the i-th grid cell belongs to class c, is the ground truth label.
3. Distribution Focal Loss
Where denotes is the probability that sample iii belongs to class c, N is the number of samples, nc is the number of classes. is the ground truth label, is the balancing factor, and is the focusing parameter.
The evaluation metrics of object detection algorithms typically include the following components [13,14,15,16]:
1. Precision Curve
The precision curve represents the proportion of correctly predicted positive samples among all samples predicted as positive. It is defined as:
Where TP (True Positives) represents the number of samples correctly predicted as positive. FP (False Positives) represents the number of samples incorrectly predicted as positive.
Precision demonstrates the proportion of correct detections among all predicted targets. Higher precision suggests fewer false predictions..
2. Recall Curve
The recall curve represents the proportion of correctly identified positive samples relative to the total number of positive samples. It is defined as:
Where FN(False Negative) represents the number of positive samples incorrectly predicted, known as missed detections.
This metric reflects the model’s capability to detect as many true targets as possible. A higher recall suggests fewer missed detections.
3. F1 Score Curve
The F1 score is the harmonic mean of precision and recall. It is defined as:
F1 score balances precision and recall. A high F1 score means the model detects most true targets while maintaining a low false detection rate. A low F1 score suggests that A low F1 score indicates that either the missed detection or the false detection rate is high.
4. Mean Average Precision (mAP):
The mAP is a key metric for evaluating overall model performance in object detection tasks. It is computed as the area's mean under the PR curves across all object classes.
mAP evaluates the average precision across all classes and different IoU thresholds. This metric shows the overall performance of the model.
6. Frames Per Second (FPS):
In real-time tasks such as object detection, image recognition, and video analysis, FPS is a critical metric for evaluating the inference speed of a model. It is defined as:
FPS refers to the number of frames processed in one second. A higher FPS means the model works faster. This metric shows capability of the model to meet real-time detection requirements. In time-sensitive tasks, FPS is an important metrics.
4. Design of Detection Network
4.1. Model Enhancement Strategies
In YOLOv8, the CBS module downsamples and adjusts channel dimensions, maintaining stability and representation quality during feature extraction. The C2f module learns deeper semantic information through residual blocks and retains part of the original features via cross-layer connections, reducing information loss. The multi-scale detection heads support recognition of targets at various sizes within the image. In addition, the lightweight design of the network makes it well-suited for real-time detection tasks in industrial applications.
The temperature digits on HVAC displays appear thin and blurred at the edges, with grayscale values close to the dark background of the panel. This visual similarity places higher demands on the feature extractor’s sensitivity to subtle edge and intensity variations. YOLOv8 relies heavily on CBS modules, which lack frequency-domain processing capability. As a result, it shows limited adaptability when handling blurred edges and background noise, often leading to confusion between similar digits. In typical HVAC panels, as illustrated in Figure 2, the set and room temperature values appear on the display. These two readings, located symmetrically on the left and right sides of the inner ring, use identical fonts and exhibit close grayscale levels. This layout increases the risk of misidentifying one value as the other. A detection network must therefore maintain strong responsiveness to local details. The C2f module in YOLOv8 offers insufficient detail extraction, making it prone to blurred digit contours, misaligned bounding boxes, and missed targets.
This study replaces the CBS module with Wavelet Pool to enhance edge and texture information capture. The C3k2 module, supporting variable kernel sizes, replaces C2f to improve responsiveness to targets with different spatial characteristics. The backbone also introduces the C2PSA module, which integrates CSP structure with spatial attention to refine positional focus and strengthen robustness in visually complex scenes. Multi-scale convolution and channel weighting improve the network’s focus on critical regions. The resulting architecture is named Wavelet Pool-based CSP Attention YOLO (WCA-YOLO).
4.2. Architecture of WCA-YOLO
The structure of the WCA-YOLO network is shown in Figure 3. The model enhances sensitivity to edge features and fine-grained visual details while improving multi-scale feature representation. These enhancements strengthen the detection of HVAC temperature digits and reduce errors caused by similar or interfering targets. In addition, the model lowers the risk of missed detections in the presence of background noise.
The backbone network extracts features from the input image. It consists of a series of convolutional layers, Wavelet Pool modules, and dedicated feature structures such as C3k2 and C2PSA.
- (1)
- Wavelet Pool module
Wavelet Pool serves as a downsampling method based on the wavelet transform. It reduces spatial resolution while preserving richer multi-scale information from the input features compared to traditional max pooling and average pooling [17,18,19]. By applying the discrete wavelet transform (DWT), this module decomposes the input feature map into four frequency sub-bands: a low-frequency component (LL) and three directional high-frequency components (LH, HL, and HH). This decomposition captures the image's edge structures, textures, and other fine details. Along with dimensionality reduction, it enhances the model’s ability to represent local detail and contextual relationships, particularly in tasks involving structural sensitivity or small-object detection [20,21,22,23,24]. The module can retain only the LL component to reduce computational load or combine all sub-bands for a more comprehensive representation. Incorporating Wavelet Pool into deep neural networks improves feature discrimination and generalization, mitigates the information loss common in conventional pooling, and strengthens the model's overall performance in object detection tasks.
- (2)
- C3k2 Module
The C3k2 module represents a structurally refined convolutional block, designed to enhance feature extraction and representation efficiency while maintaining a lightweight architecture. Based on the original C3 structure, this module introduces smaller receptive fields by replacing standard large-kernel convolutions with multiple 2×2 convolutional layers. This design improves the modeling of local detail and reduces both parameter count and computational cost. By stacking several 2×2 convolutions, the module expands the effective receptive field and enables multi-scale feature fusion, supporting faster inference without sacrificing accuracy [25,26]. The C3k2 module retains the core concept of the Cross Stage Partial (CSP) structure by splitting the input feature map into two paths—one for transformation and the other for information preservation, followed by feature fusion. This design promotes smoother gradient flow, enriches feature diversity, and mitigates degradation issues in deeper networks. Well-suited for building efficient convolutional neural networks, the C3k2 module performs reliably in object detection and scene understanding tasks, especially under conditions involving complex backgrounds or multiple overlapping targets. Its design improves recognition robustness and practical utility in environments constrained by computational resources.
- (3)
- SPPF Module
The SPPF (Spatial Pyramid Pooling - Fusion) module is an optimized variant of the spatial pyramid pooling structure, aiming to enhance multi-scale feature perception while maintaining computational efficiency. This module stacks several fixed-size max pooling layers in sequence, allowing feature maps with varying receptive fields to be aggregated. This design allows the network to capture contextual information across multiple spatial scales. Unlike the traditional SPP module, SPPF adopts a streamlined stacking approach that reduces the overhead associated with repeated feature replication and channel concatenation, significantly improving inference speed and computational efficiency. During the output stage, the module fuses multi-scale features into a unified representation, strengthening the model’s ability to recognize small objects and targets under complex backgrounds. This structure avoids the limitations caused by reliance on a single receptive field. Including SPPF improves detection accuracy and network robustness without substantially increasing model complexity, demonstrating a strong balance between performance and practical deployment [27].
- (4)
- C2PSA Module
The C2PSA (Cross-Stage Partial with Self-Attention) module integrates attention mechanisms with an efficient feature representation structure. It aims to strengthen the model’s focus on critical information while enhancing spatial resolution and channel-wise expressiveness. Based on the C2 framework, this module incorporates the Pyramid Squeeze Attention (PSA) mechanism. Through pixel rearrangement, PSA increases the spatial granularity of the feature map, enabling more refined spatial enhancement and preserving fine-grained details. By converting low-resolution, high-channel features into high-resolution, low-channel representations, the attention mechanism can concentrate more effectively on salient regions, improving responsiveness to small targets and edge information. C2PSA benefits from the Cross-Stage Partial structure by allowing partial feature transmission across stages. This design helps alleviate gradient vanishing and model degradation while maintaining a lightweight structure and stable training dynamics. The module adapts well to scenarios with high spatial precision and attention demands, significantly improving perception accuracy and discriminative capability in complex visual tasks [28].
- (5)
- Upsample Module
The Upsample module is a key component for restoring spatial resolution in object detection and image segmentation tasks. Its primary function involves expanding low-resolution feature maps to higher resolutions, enabling the model to capture fine-grained information more effectively. In typical detection architectures, repeated convolution and downsampling compress the spatial details of the original image, which weakens the preservation of small objects and high-frequency edge features. By enlarging feature maps, the Upsample module allows subsequent layers to access richer contextual cues for more precise localization and classification. This operation often combines skip connections to merge shallow high-resolution features with deeper semantic features, promoting complementary integration between spatial detail and semantic understanding. The Upsample module improves adaptability to targets of varying sizes and plays a vital role in designing high-performance, lightweight detection networks.
- (6)
- Detect
Based on the features extracted from the backbone, the detection head performs further processing and generates the final predictions. These outputs include class labels, bounding box coordinates, and confidence scores. The head involves a combination of upsampling, concatenation, and convolutional operations, producing detection results at multiple resolutions.
5. Experimental Results and Analysis
The experimental server environment is shown in Table 1.
The hyperparameter configurations used in the experiments are shown in Table 2.
5.1. HVAC Temperature Image Detection
WCA-YOLO was trained on the HVAC temperature detection dataset for 500 epochs to evaluate its detection performance. A comparison is conducted against classical YOLO networks under identical dataset and configuration settings. The experimental results are presented in Figure 4. The numerical values displayed within the detection boxes represent confidence scores, which are an important metric for assessing the accuracy of object recognition in the image. These scores reflect the model’s estimated probability for the presence of a given object, with values ranging from 0 to 1. A higher confidence score indicates a greater degree of certainty in the model’s prediction regarding the existence of the detected object.
As shown in Figure 5, the WCA-YOLO model approaches convergence within 50 epochs during the 500-epoch training process. The evaluation metrics, including precision, recall, mAP@0.5, and mAP@0.5:0.95, exceeded 90%. It indicates strong detection accuracy across different temperature classes. These results also demonstrate the model’s robust adaptability to varying background conditions.
WCA-YOLO’s performance across all temperature categories is illustrated through the precision curve, recall curve, F1 score curve, and PR curve, as shown in Figure 6. These curves present the model’s behavior from multiple perspectives. The results indicate that WCA-YOLO achieves strong performance across various evaluation metrics, confirming its practical reliability. In order to clearly reflect false positives and false negatives in each temperature category, a confusion matrix is presented in Figure 7. The results show three notable cases of misclassification among the 20 categories:
(1) 3% of open19 samples were identified as open18;
(2) 3% of open20 samples were identified as open19;
(3) 3% of open20 samples were identified as open28.
A small number of false detections also occurred in background regions, but the false detection rate remains low.
5.2. Performance Comparison of Different Detection Models
This study evaluates WCA-YOLO alongside YOLOv8, YOLOv7-tiny, YOLOv5s, YOLOv5n, and YOLOv3-Tiny under identical experimental settings. Each model runs 500 training epochs on the same dataset. Table 3 presents the results.
YOLOv7-tiny, YOLOv5s, YOLOv5n, and YOLOv3-Tiny show relatively low detection accuracy, with a clear performance gap compared to YOLOv8 and WCA-YOLO. YOLOv8 reaches a high level across all evaluation metrics, while WCA-YOLO achieves improvements of 1.2% in precision and 1.1% in recall. The mAP@0.5 and mAP@0.5:0.95 values remain nearly the same for both models. These results confirm that WCA-YOLO performs best on the HVAC temperature detection dataset.
5.3. Ablation Experiment
The above experiments confirm that WCA-YOLO demonstrates a clear advantage over mainstream lightweight YOLO networks on the HVAC temperature detection dataset. Building on this, a series of ablation studies are conducted to examine the contribution of the backbone and individual modules to performance improvements.
As shown in Table 4, replacing the backbone with HGNetv2 and introducing C3k2 for feature enhancement in the neck yields only marginal gains compared to the baseline. A different configuration that modifies the C3k2 bottleneck using the FasterBlock from FasterNet and applies Wavelet Pool in the neck improves detection speed, but causes a slight drop in accuracy. This outcome suggests that inserting Wavelet Pool in the neck contributes little to detection precision. To preserve edge features effectively, Wavelet Pool needs to be integrated into the backbone's early stages of feature extraction.
Overall, WCA-YOLO achieves the best accuracy in HVAC temperature detection datasets by replacing CBS with Wavelet Pool and enhancing feature representation using C3k2. Applying Wavelet Pool in the backbone proves more effective than simply substituting the backbone with HGNetv2.
6. Conclusions
Manual HVAC temperature inspection in modern industrial environments remains inefficient and lacks the capacity for continuous monitoring. This study introduces WCA-YOLO, a detection network developed on the YOLOv8 framework with improved core feature modules. On the HVAC temperature detection dataset, WCA-YOLO achieves 161 FPS, a precision of 99.4%, a recall of 99.3%, and scores of 99.5% at mAP@0.5 and 96.7% at mAP@0.5:0.95. These results align well with the demands of autonomous temperature inspection in smart manufacturing and office environments.
The model replaces the standard CBS module with Wavelet Pool, which enhances sensitivity to edge-dominant targets such as digital temperature digits. Using the C3k2 module further strengthens the network’s ability to represent fine-grained visual information, reducing false detections involving visually similar digits. Under low-contrast conditions, the network maintains stable and accurate detection performance. Results from ablation experiments demonstrate that combining Wavelet Pool with C3k2 provides an effective structure for tasks that require strong representation of detailed and edge features, particularly in HVAC inspection scenarios.
Although WCA-YOLO meets the practical needs of HVAC temperature monitoring, the current detection range depends on the category distribution in the dataset. Future work will focus on reducing annotation workload and improving adaptability to broader temperature conditions.
Author Contributions
Conceptualization, R.S. and B.Z.; methodology, C.W.; software, R.S. and B.Z.; validation, R.S. and B.Z.; formal analysis, C.W.; investigation, R.S. and X.Q.; resources, C.W.; writing—original draft preparation, R.S.; writing—review and editing, B.Z. and Z.F.; funding acquisition, R.S. and C.W. All authors have read and agreed to the published version of the manuscript.
Funding
This research was funded by the Ministry of Industry and Information Technology Project under grant (TC220H05X-04).
Institutional Review Board Statement
Not applicable for studies not involving humans or animals.
Informed Consent Statement
Not applicable for studies not involving humans.
Data Availability Statement
Data are contained within the article.
Conflicts of Interest
The authors declare no conflicts of interest.
References
- Ahmed, A; Imran, A S; Manaf, A, et al. Enhancing wrist abnormality detection with yolo: Analysis of state-of-the-art single-stage detection models. Biomedical Signal Processing and Control, 2024, 93: 106144. [CrossRef]
- Moussaoui, H; Akkad, N E; Benslimane, M, et al. Enhancing automated vehicle identification by integrating YOLO v8 and OCR techniques for high-precision license plate detection and recognition. Scientific Reports, 2024, 14(1): 14389. [CrossRef]
- Lu M, Sheng W, Zou Y, et al. WSS-YOLO: An improved industrial defect detection network for steel surface defects. Measurement, 2024, 236: 115060.
- Gündüz, M. Ş., & Işık, G. A new YOLO-based method for real-time crowd detection from video and performance analysis of YOLO models. Journal of Real-Time Image Processing, 2023, 20(1), 5.
- Shen, X., Shi, G., Ren, H., & Zhang, W. Biomimetic vision for zoom object detection based on improved vertical grid number YOLO algorithm. Frontiers in Bioengineering and Biotechnology, 2022, 10, 905583. [CrossRef]
- Agarwal, V., & Bansal, G. Automatic number plate detection and recognition using YOLO world. Computers and Electrical Engineering, 2024, 120, 109646.
- Mimura, K., Nakamura, K., Yasukawa, K., Sibert, E., Ohta, J., Kitazawa, T., & Kato, Y. Applicability of object detection to microfossil research: Implications from deep learning models to detect microfossil fish teeth and denticles using YOLO-v7. Earth and Space Science, 2024, 11(1), e2023EA003122. [CrossRef]
- Zhu, X.; Wang, R.; Shi, W.; Liu, X.; Ren, Y.; Xu, S.; Wang, X. Detection of Pine-Wilt-Disease-Affected Trees Based on Improved YOLO v7. Forests, 2024, 15, 691. https://doi.org/10.3390/f15040691.
- Zhou Z, Hu Y, Yang X, et al. YOLO-based marine organism detection using two-terminal attention mechanism and difficult-sample resampling. Applied Soft Computing, 2024, 153: 111291.
- Kusetogullari H, Yavariabdi A, Hall J, et al. Digitnet: a deep handwritten digit detection and recognition method using a new historical handwritten digit dataset. Big Data Research, 2021, 23: 100182. [CrossRef]
- Lu J, Yu R, Zhang H, et al. Highly reflective metal industrial parts surface detection with polarization vision and modified YOLO. Digital Signal Processing, 2025, 163: 105238.
- Zhang Y, Zhao H, Li X, et al. MERS-Net: A Lightweight And Efficient Remote Sensing Image Object Detector. IEEE Geoscience and Remote Sensing Letters, 2025. https://doi.org/10.1109/LGRS.2025.3569672.
- Cai S, Zhang X, Mo Y. A Lightweight underwater detector enhanced by Attention mechanism, GSConv and WIoU on YOLOv8. Scientific Reports, 2024, 14(1): 25797. [CrossRef]
- Qu Y, Zhang F. FWL-YOLO: a lightweight model for barcode detection and recognition in express delivery waybills. Signal, Image and Video Processing, 2025, 19(3): 261.
- Li W, Xiao L, Yao S, et al. ED-YOLO: an object detection algorithm for drone imagery focusing on edge information and small object features. Multimedia Systems, 2025, 31(3): 1-15.
- Lan X, Liu L, Wang X. Dal-yolo: a multi-target detection model for UAV-based road maintenance integrating feature pyramid and attention mechanisms. Journal of Real-Time Image Processing, 2025, 22(3): 105.
- Bhavana N, Kodabagi M M, Kumar B M, et al. POT-YOLO: Real-Time Road Potholes Detection using Edge Segmentation based Yolo V8 Network. IEEE Sensors Journal, 2024. [CrossRef]
- Pan W, Sun X, Wang Y, et al. Enhanced photovoltaic panel defect detection via adaptive complementary fusion in YOLO-ACF. Scientific Reports, 2024, 14(1): 26425.
- Han Y, Wang F, Wang W, et al. EDN-YOLO: Multi-scale traffic sign detection method in complex scenes. Digital Signal Processing, 2024, 153: 104615.
- Zhou S, Zhou H, Qian L. A multi-scale small object detection algorithm SMA-YOLO for UAV remote sensing images. Scientific Reports, 2025, 15(1): 9255.
- Lei Y, Wang X, An A, et al. Deeplab-YOLO: a method for detecting hot-spot defects in infrared image PV panels by combining segmentation and detection. Journal of Real-Time Image Processing, 2024, 21(2): 52. [CrossRef]
- Liu Z, Zhang Y, He J, et al. Enhancing Infrared Small Target Detection: A Saliency-Guided Multi-Task Learning Approach. IEEE Transactions on Intelligent Transportation Systems, 2025. 26, (3):3603-3618. [CrossRef]
- Zhang Q, Guo W, Lin M. LLD-YOLO: a multi-module network for robust vehicle detection in low-light conditions. Signal, Image and Video Processing, 2025, 19(4): 1-11. [CrossRef]
- Wang, Yu, and Xiaodong Xiang. GMS-YOLO: an enhanced algorithm for water meter reading recognition in complex environments. Journal of Real-Time Image Processing, 2024, 21(5): 173.
- Jiao B, Wang Y, Wang P, et al. RS-YOLO: An efficient object detection algorithm for road scenes. Digital Signal Processing, 2025, 157: 104889. [CrossRef]
- Karaca Aydemir B K, Telatar Z, Güney S, et al. Detecting and classifying breast masses via YOLO-based deep learning. Neural Computing and Applications, 2025: 1-28.
- Mela, Jose Luis, and Carlos García Sánchez. Yolo-based power-efficient object detection on edge devices for USVs. Journal of Real-Time Image Processing, 2025,22(3): 1-14. [CrossRef]
- Mao G, Wang K, Du H, et al. SRS-YOLO: Improved YOLOv8-Based Smart Road Stud Detection. IEEE Transactions on Intelligent Transportation Systems, 2025. https://doi.org/10.1109/TITS.2025.3545942.
- Zhao Y, Lv W, Xu S, et al. Detrs beat yolos on real-time object detection. //Proceedings of the IEEE/CVF conference on computer vision and pattern recognition. 2024: 16965-16974.
- Chen J, Kao S, He H, et al. Run, Don’t Walk: Chasing Higher FLOPS for Faster Neural Networks. //Proceedings of the IEEE/CVF conference on computer vision and pattern recognition. 2023: 12021-12031.
Figure 1.
Inspection Robot Platform.
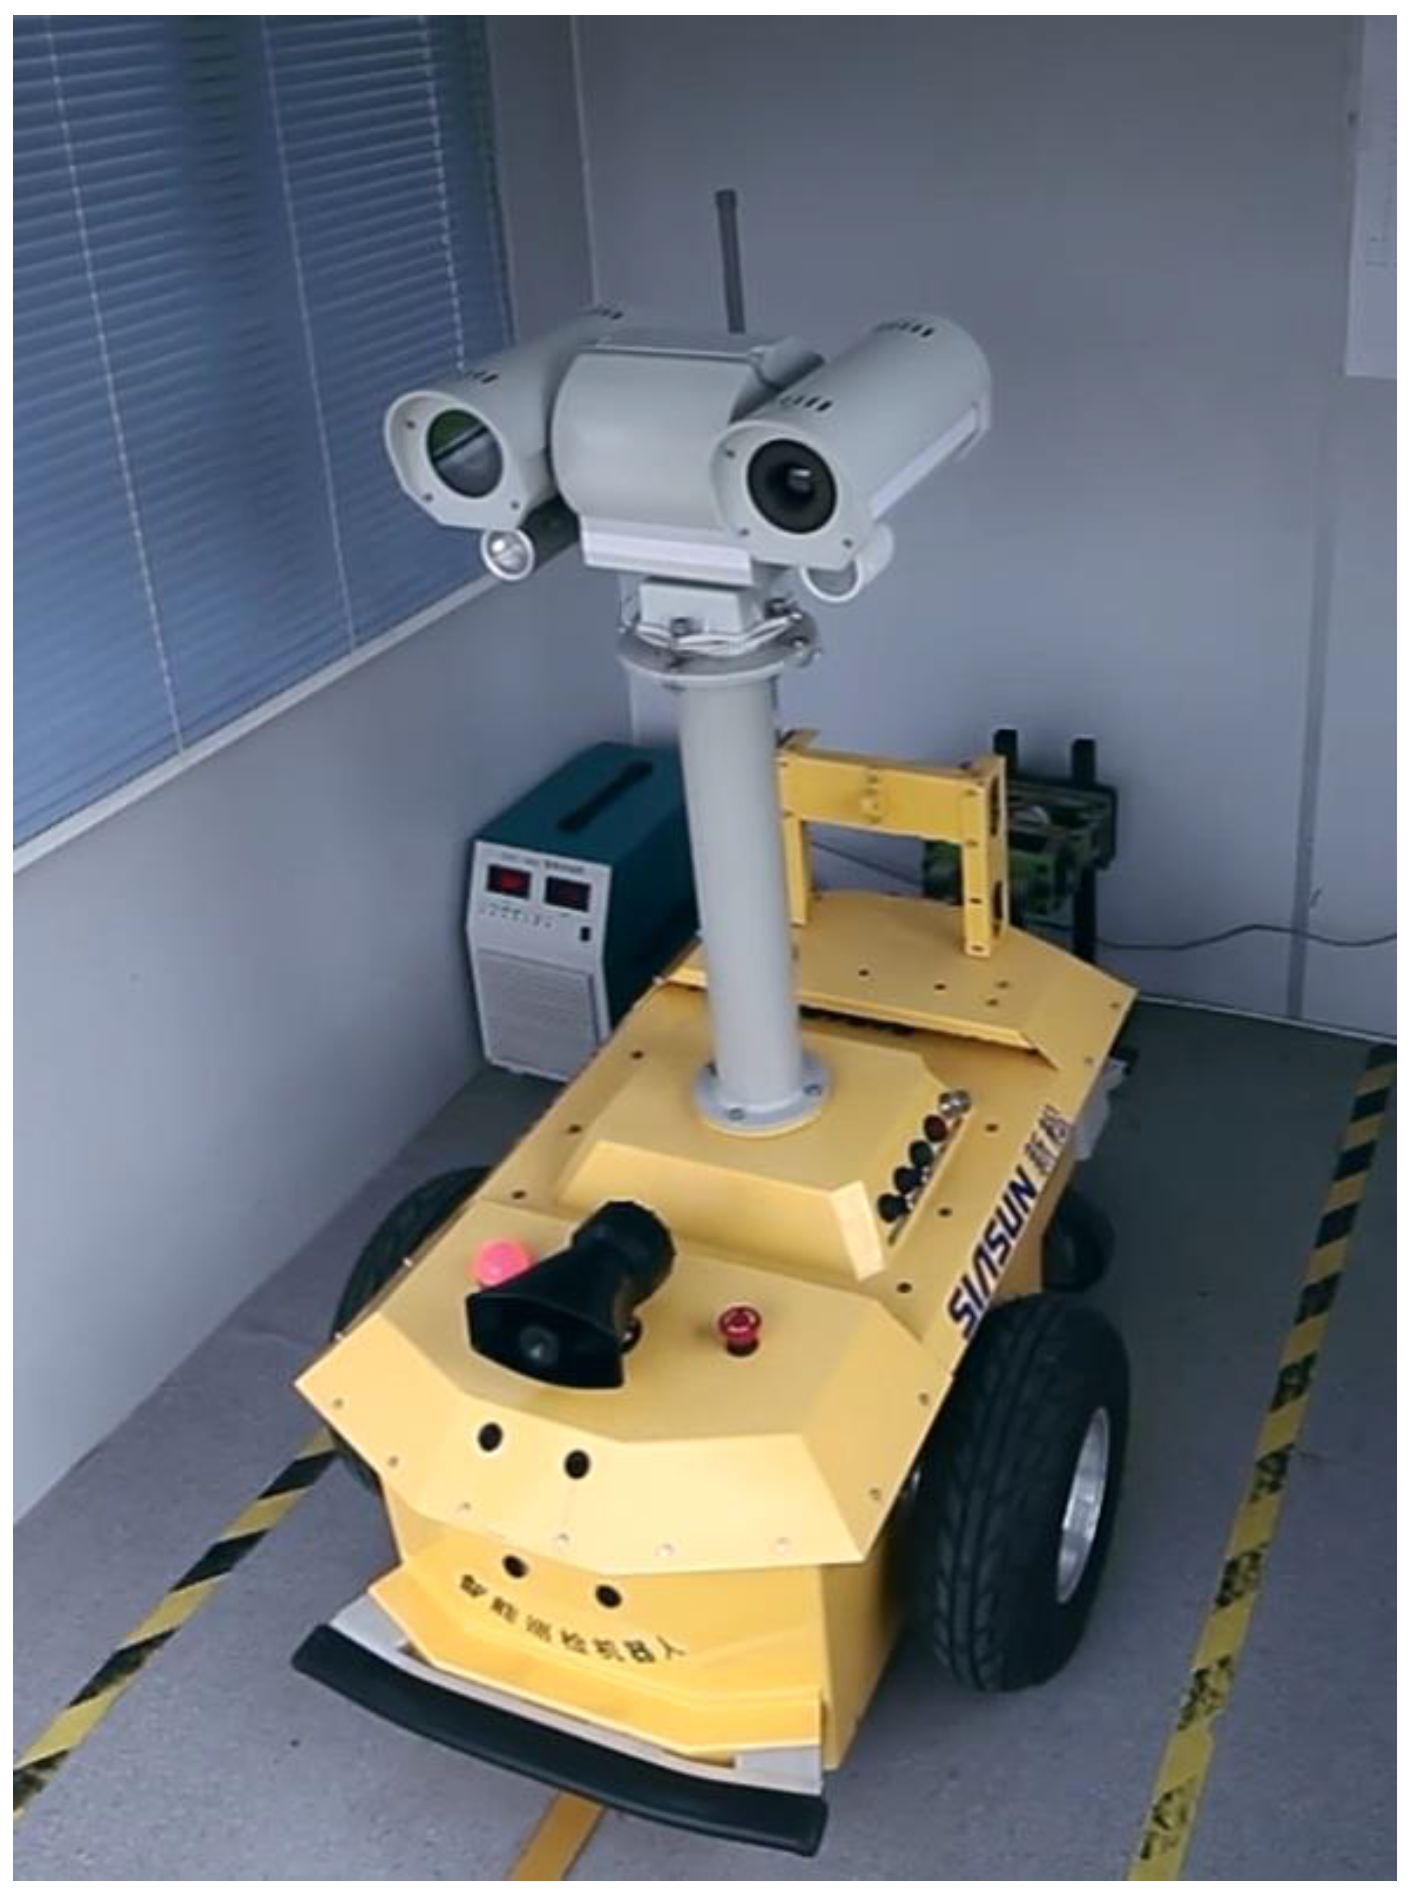
Figure 2.
HVAC temperature detection dataset.
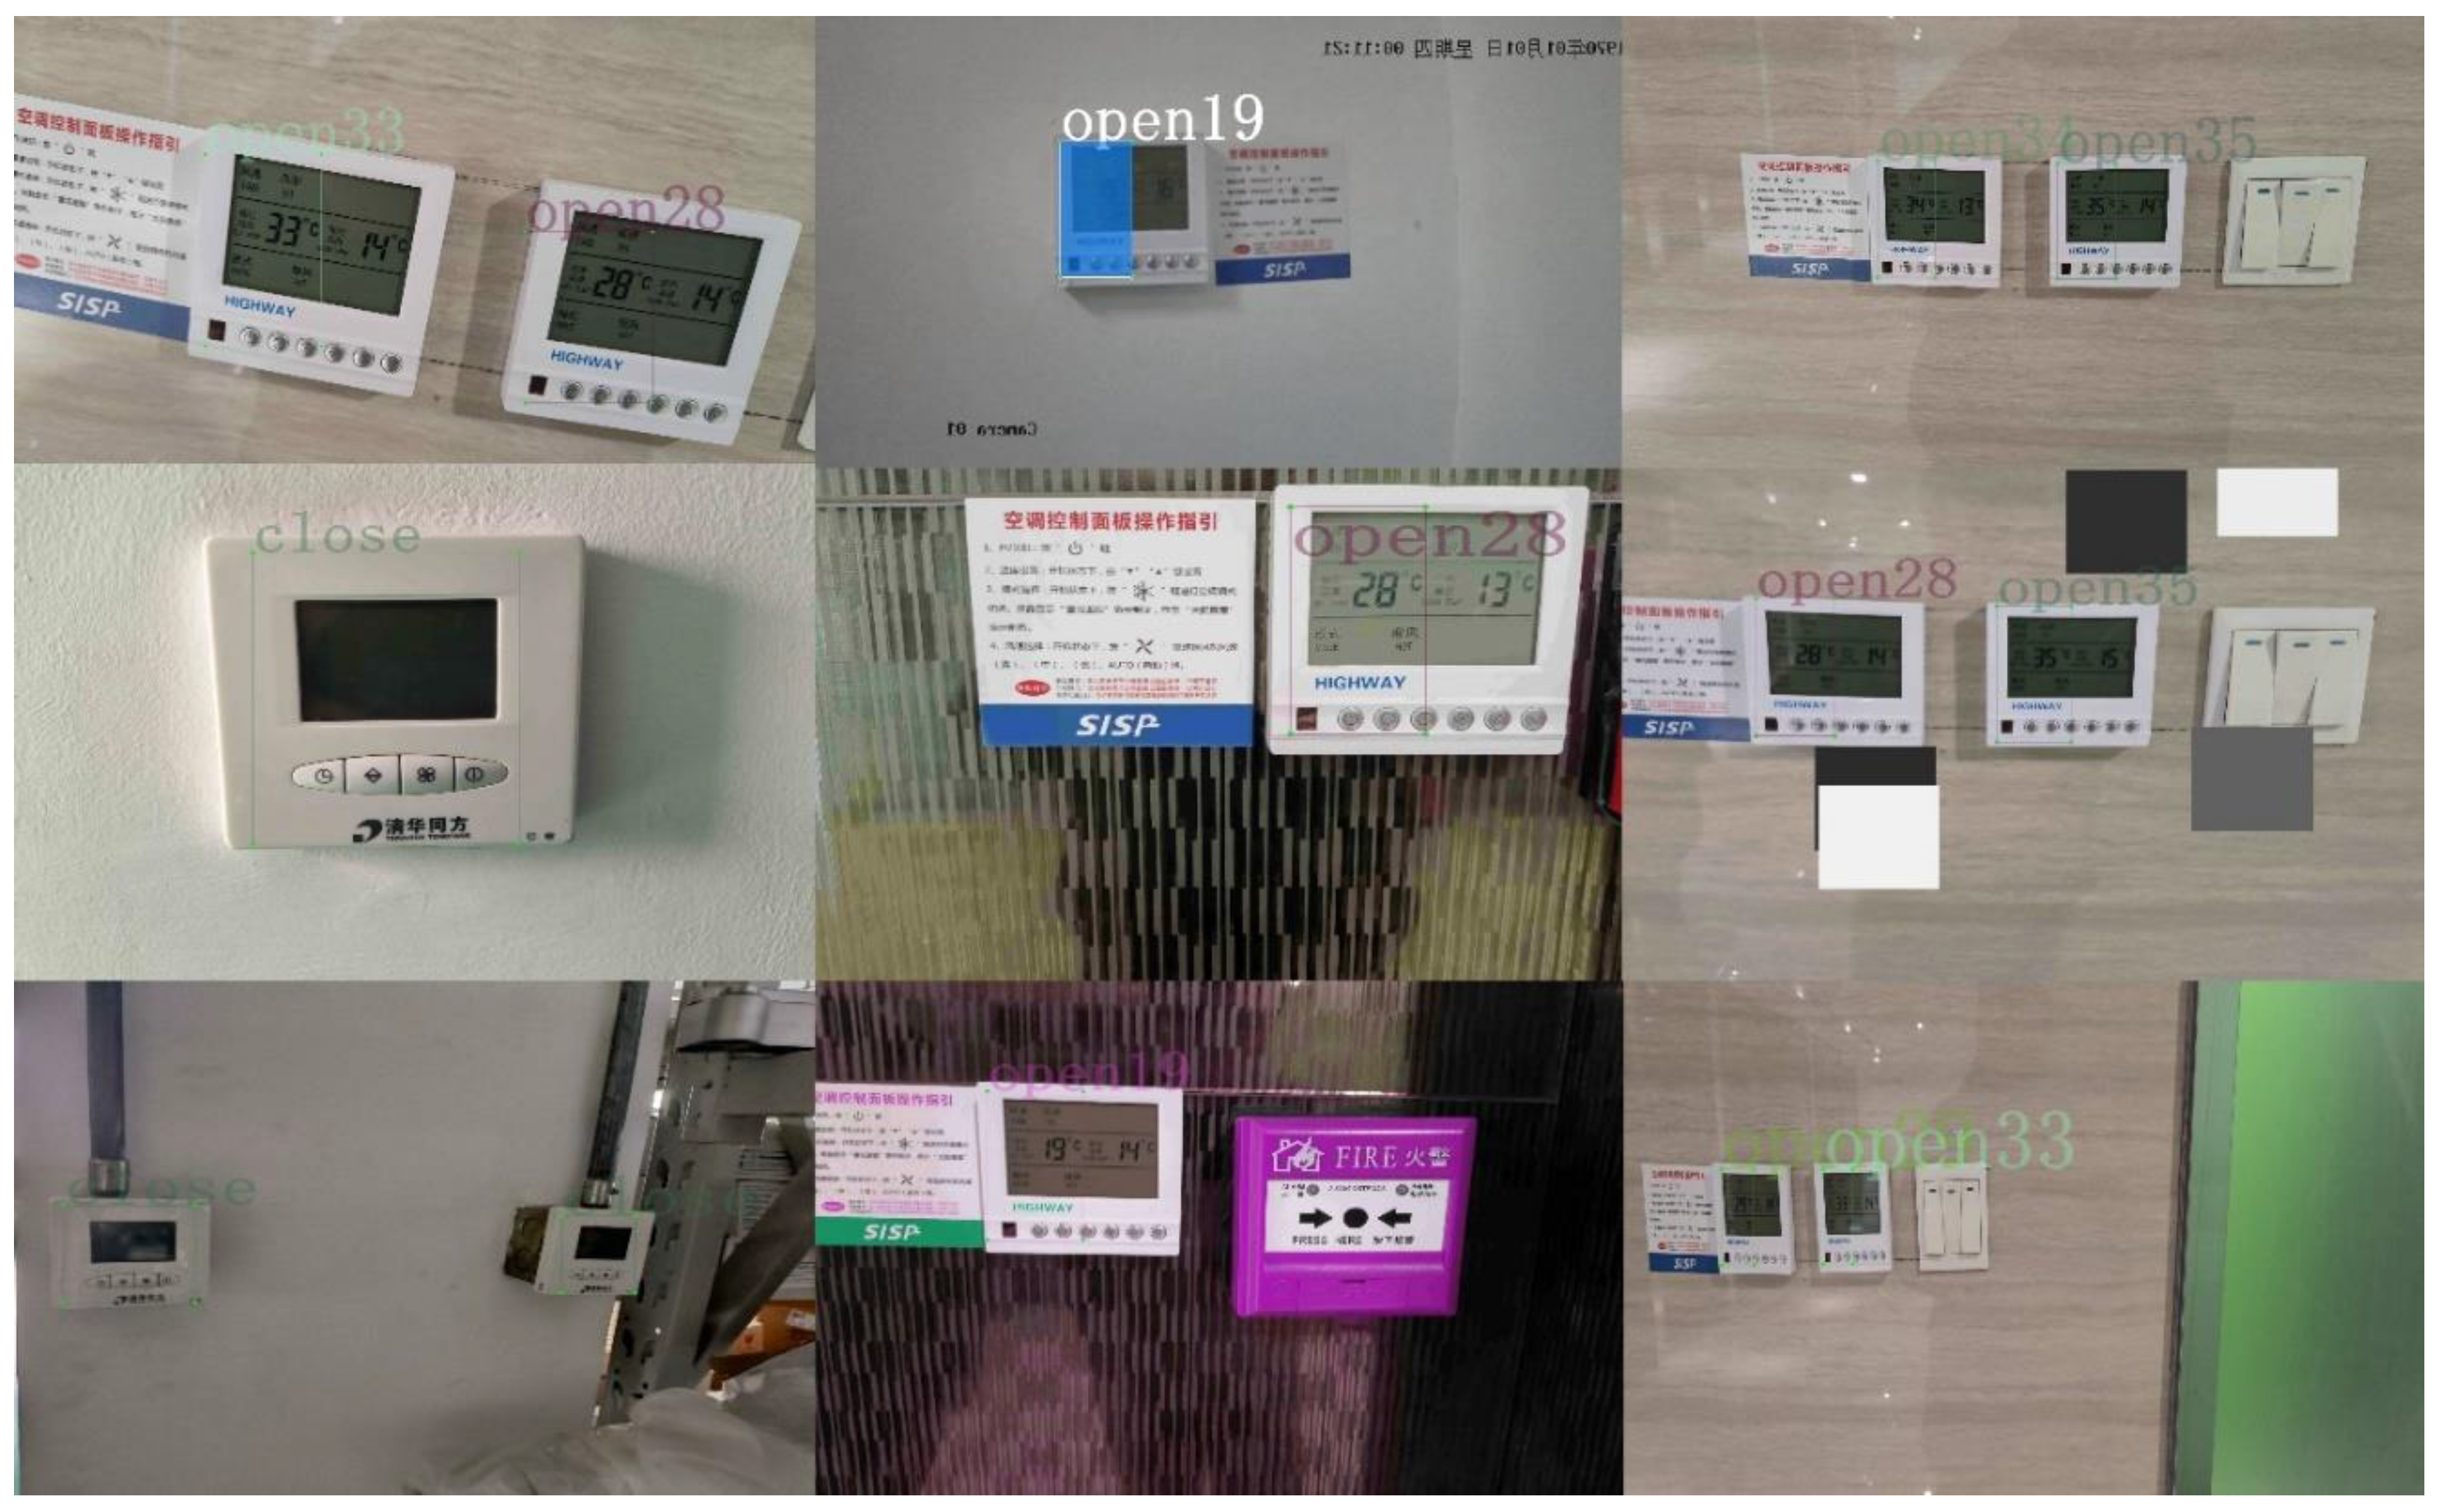
Figure 3.
Structure of WCA-YOLO.
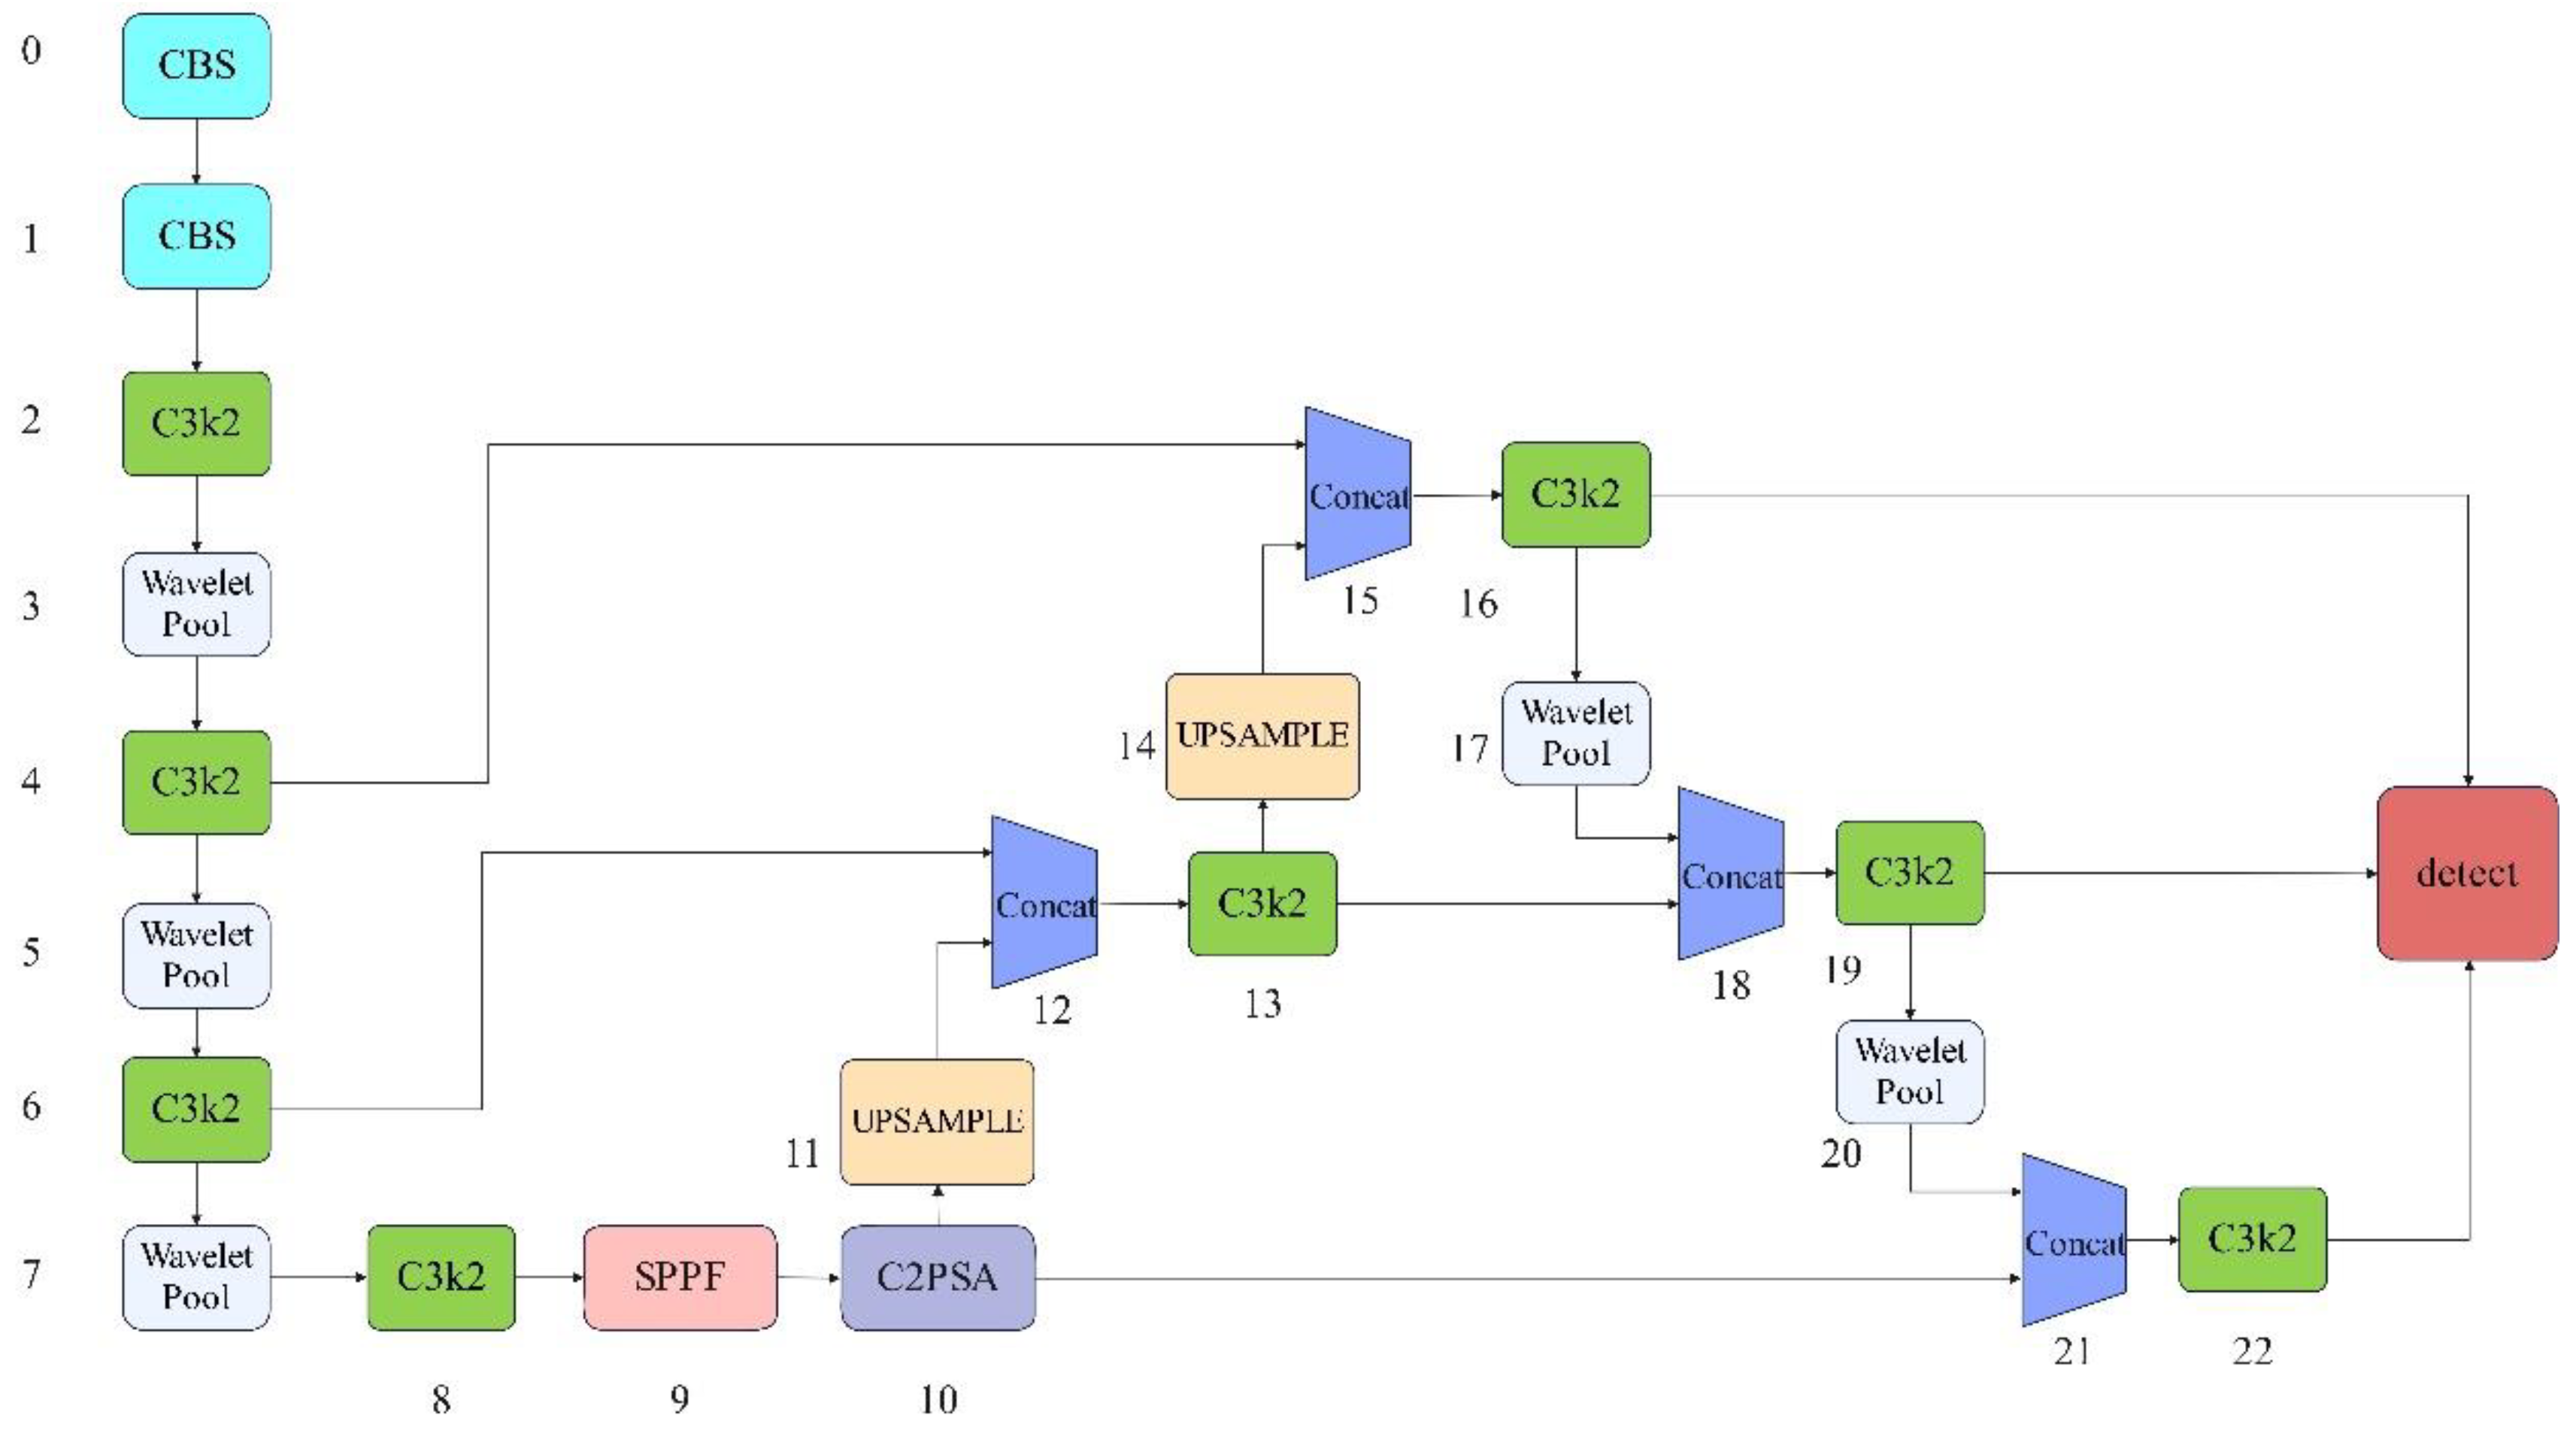
Figure 4.
HVAC Temperature Detection Experiment.
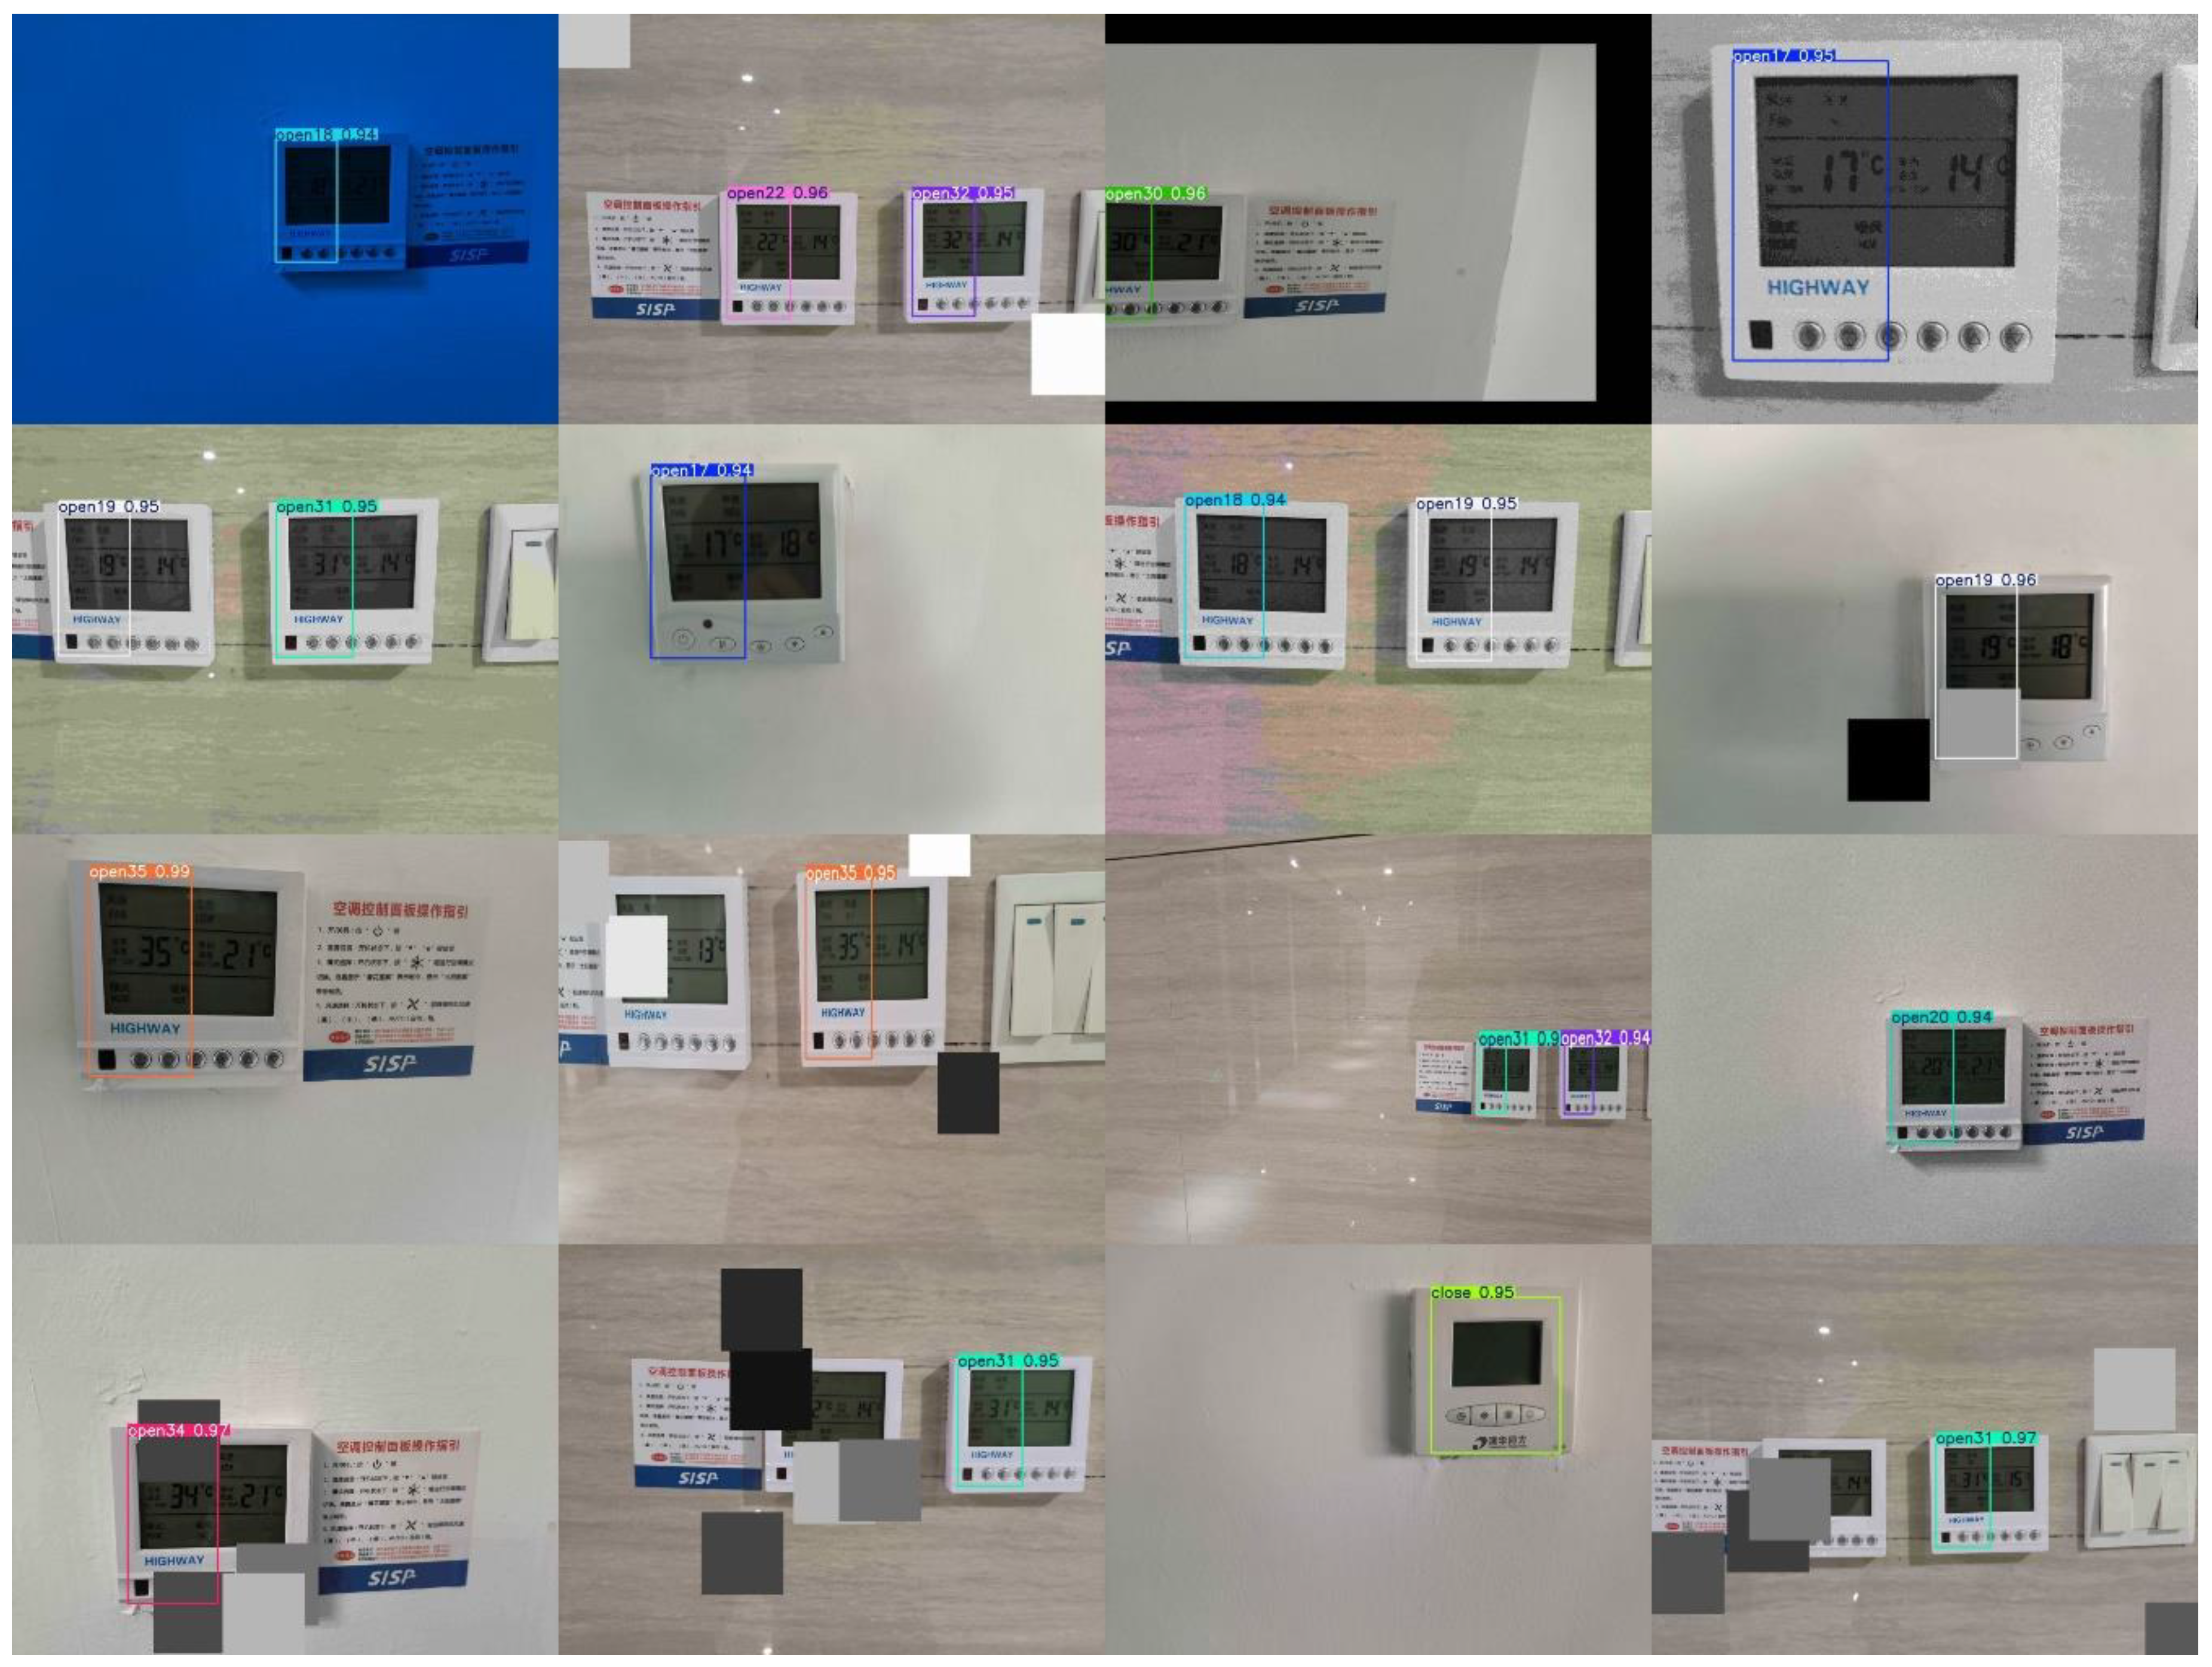
Figure 5.
Training process of WCA-YOLO algorithm.
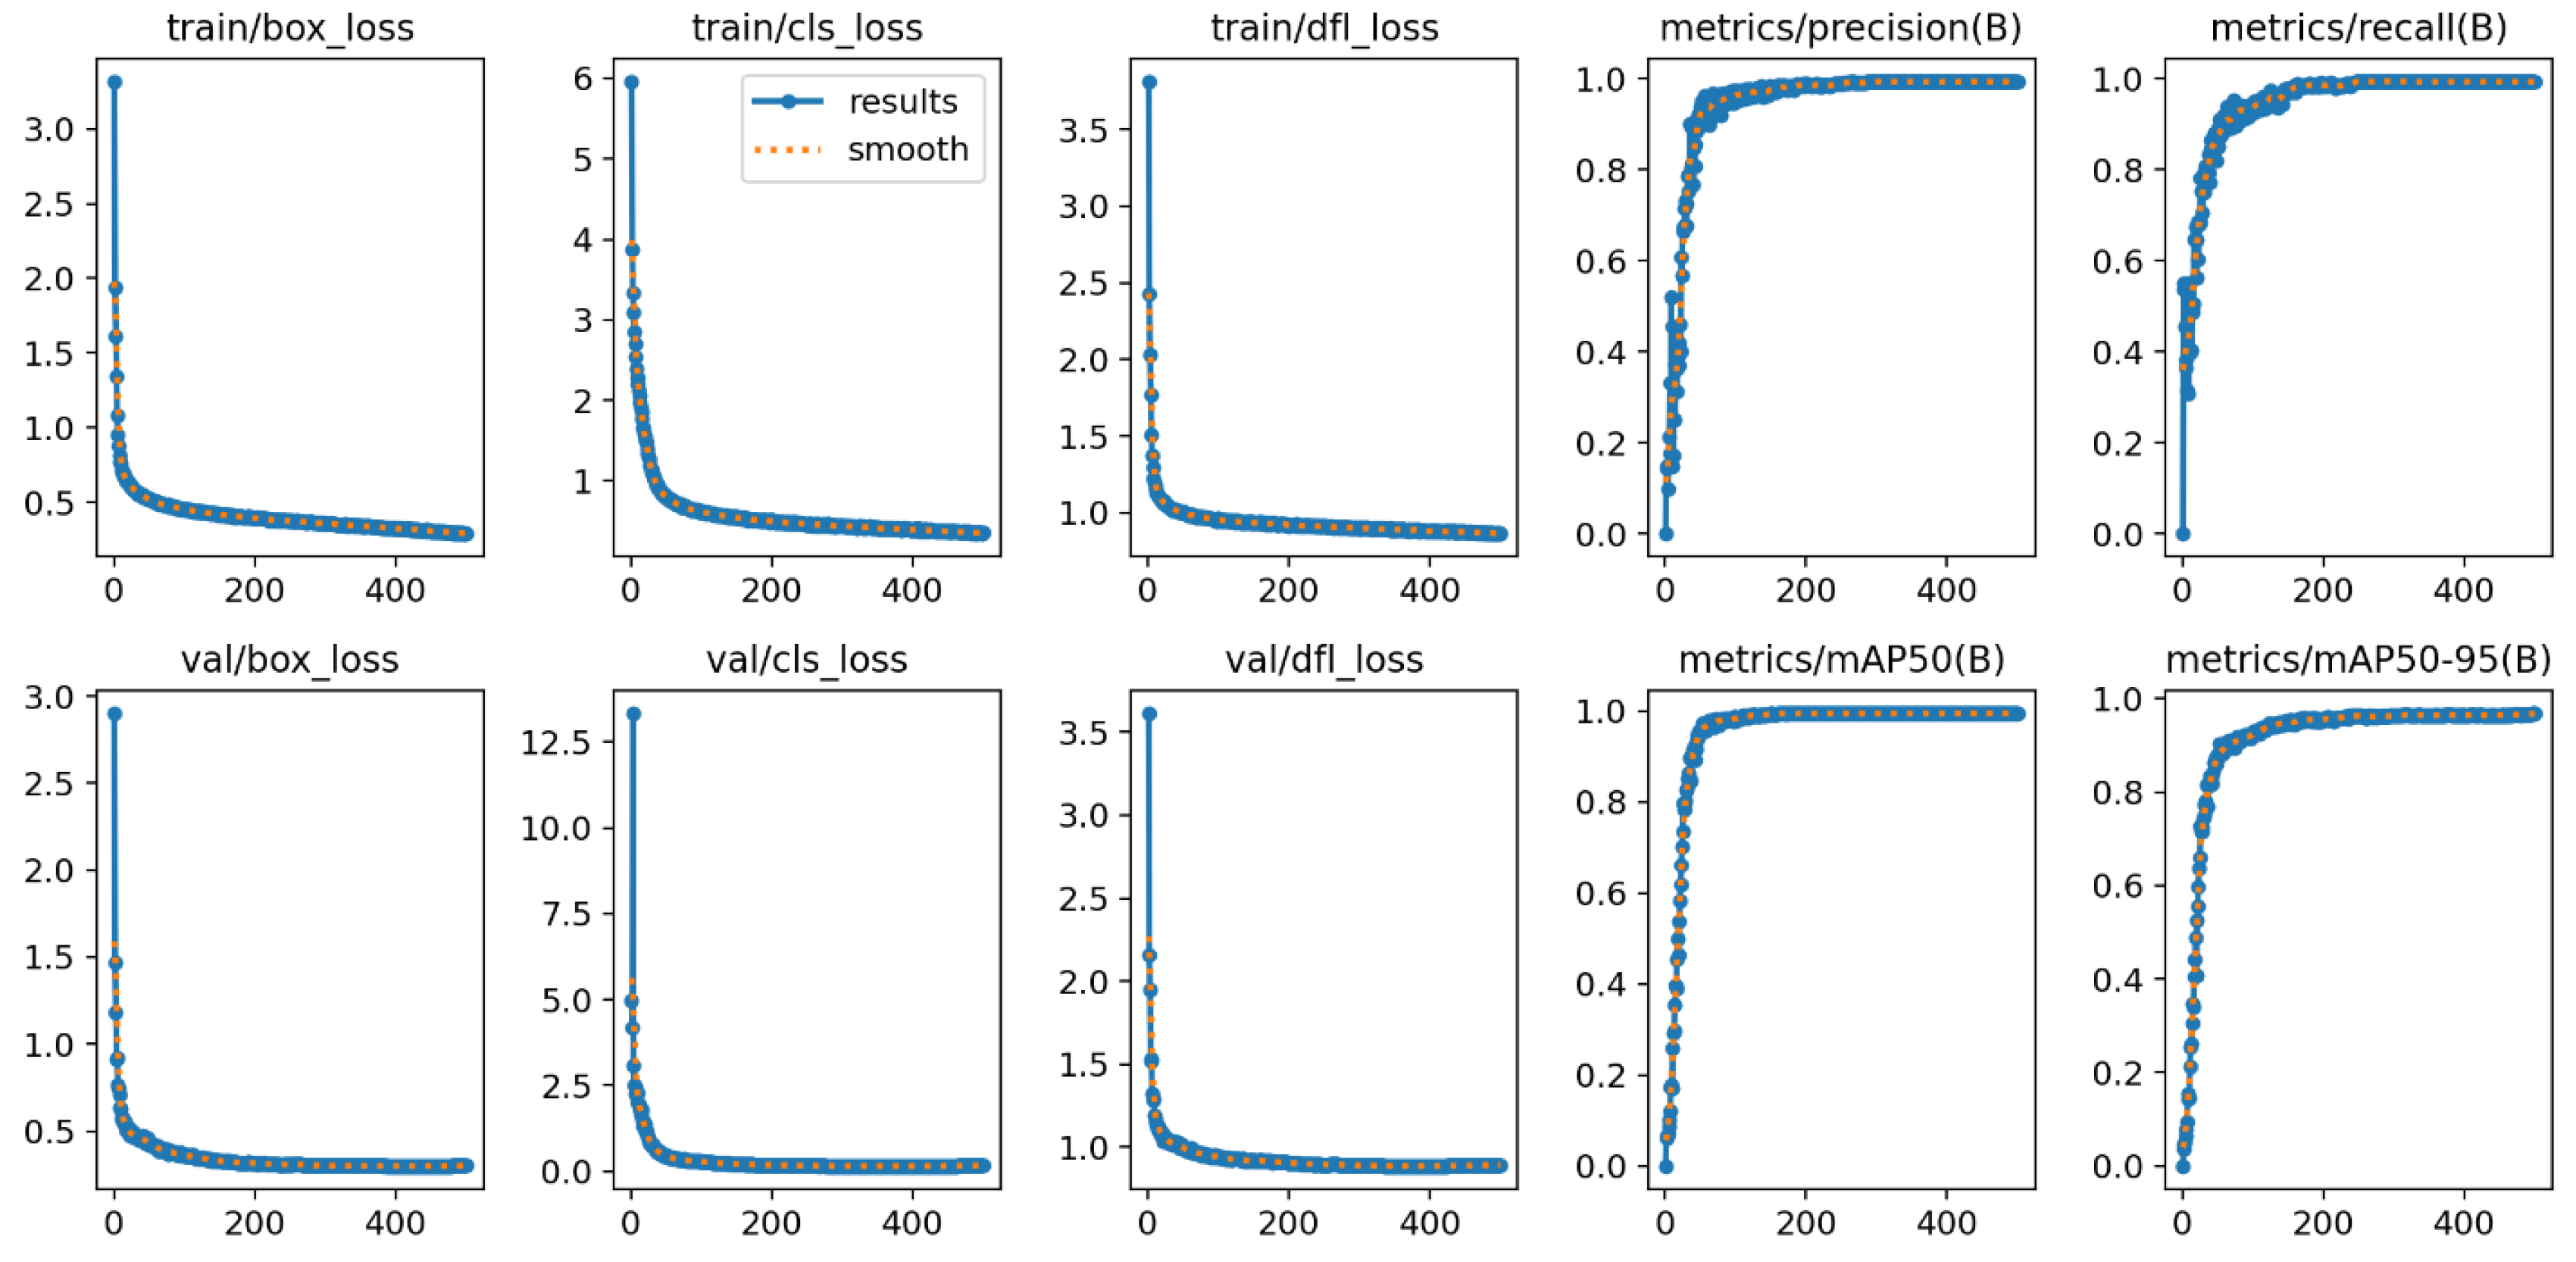
Figure 6.
P curve, R curve, F1 curve and PR curve Performance indicators.
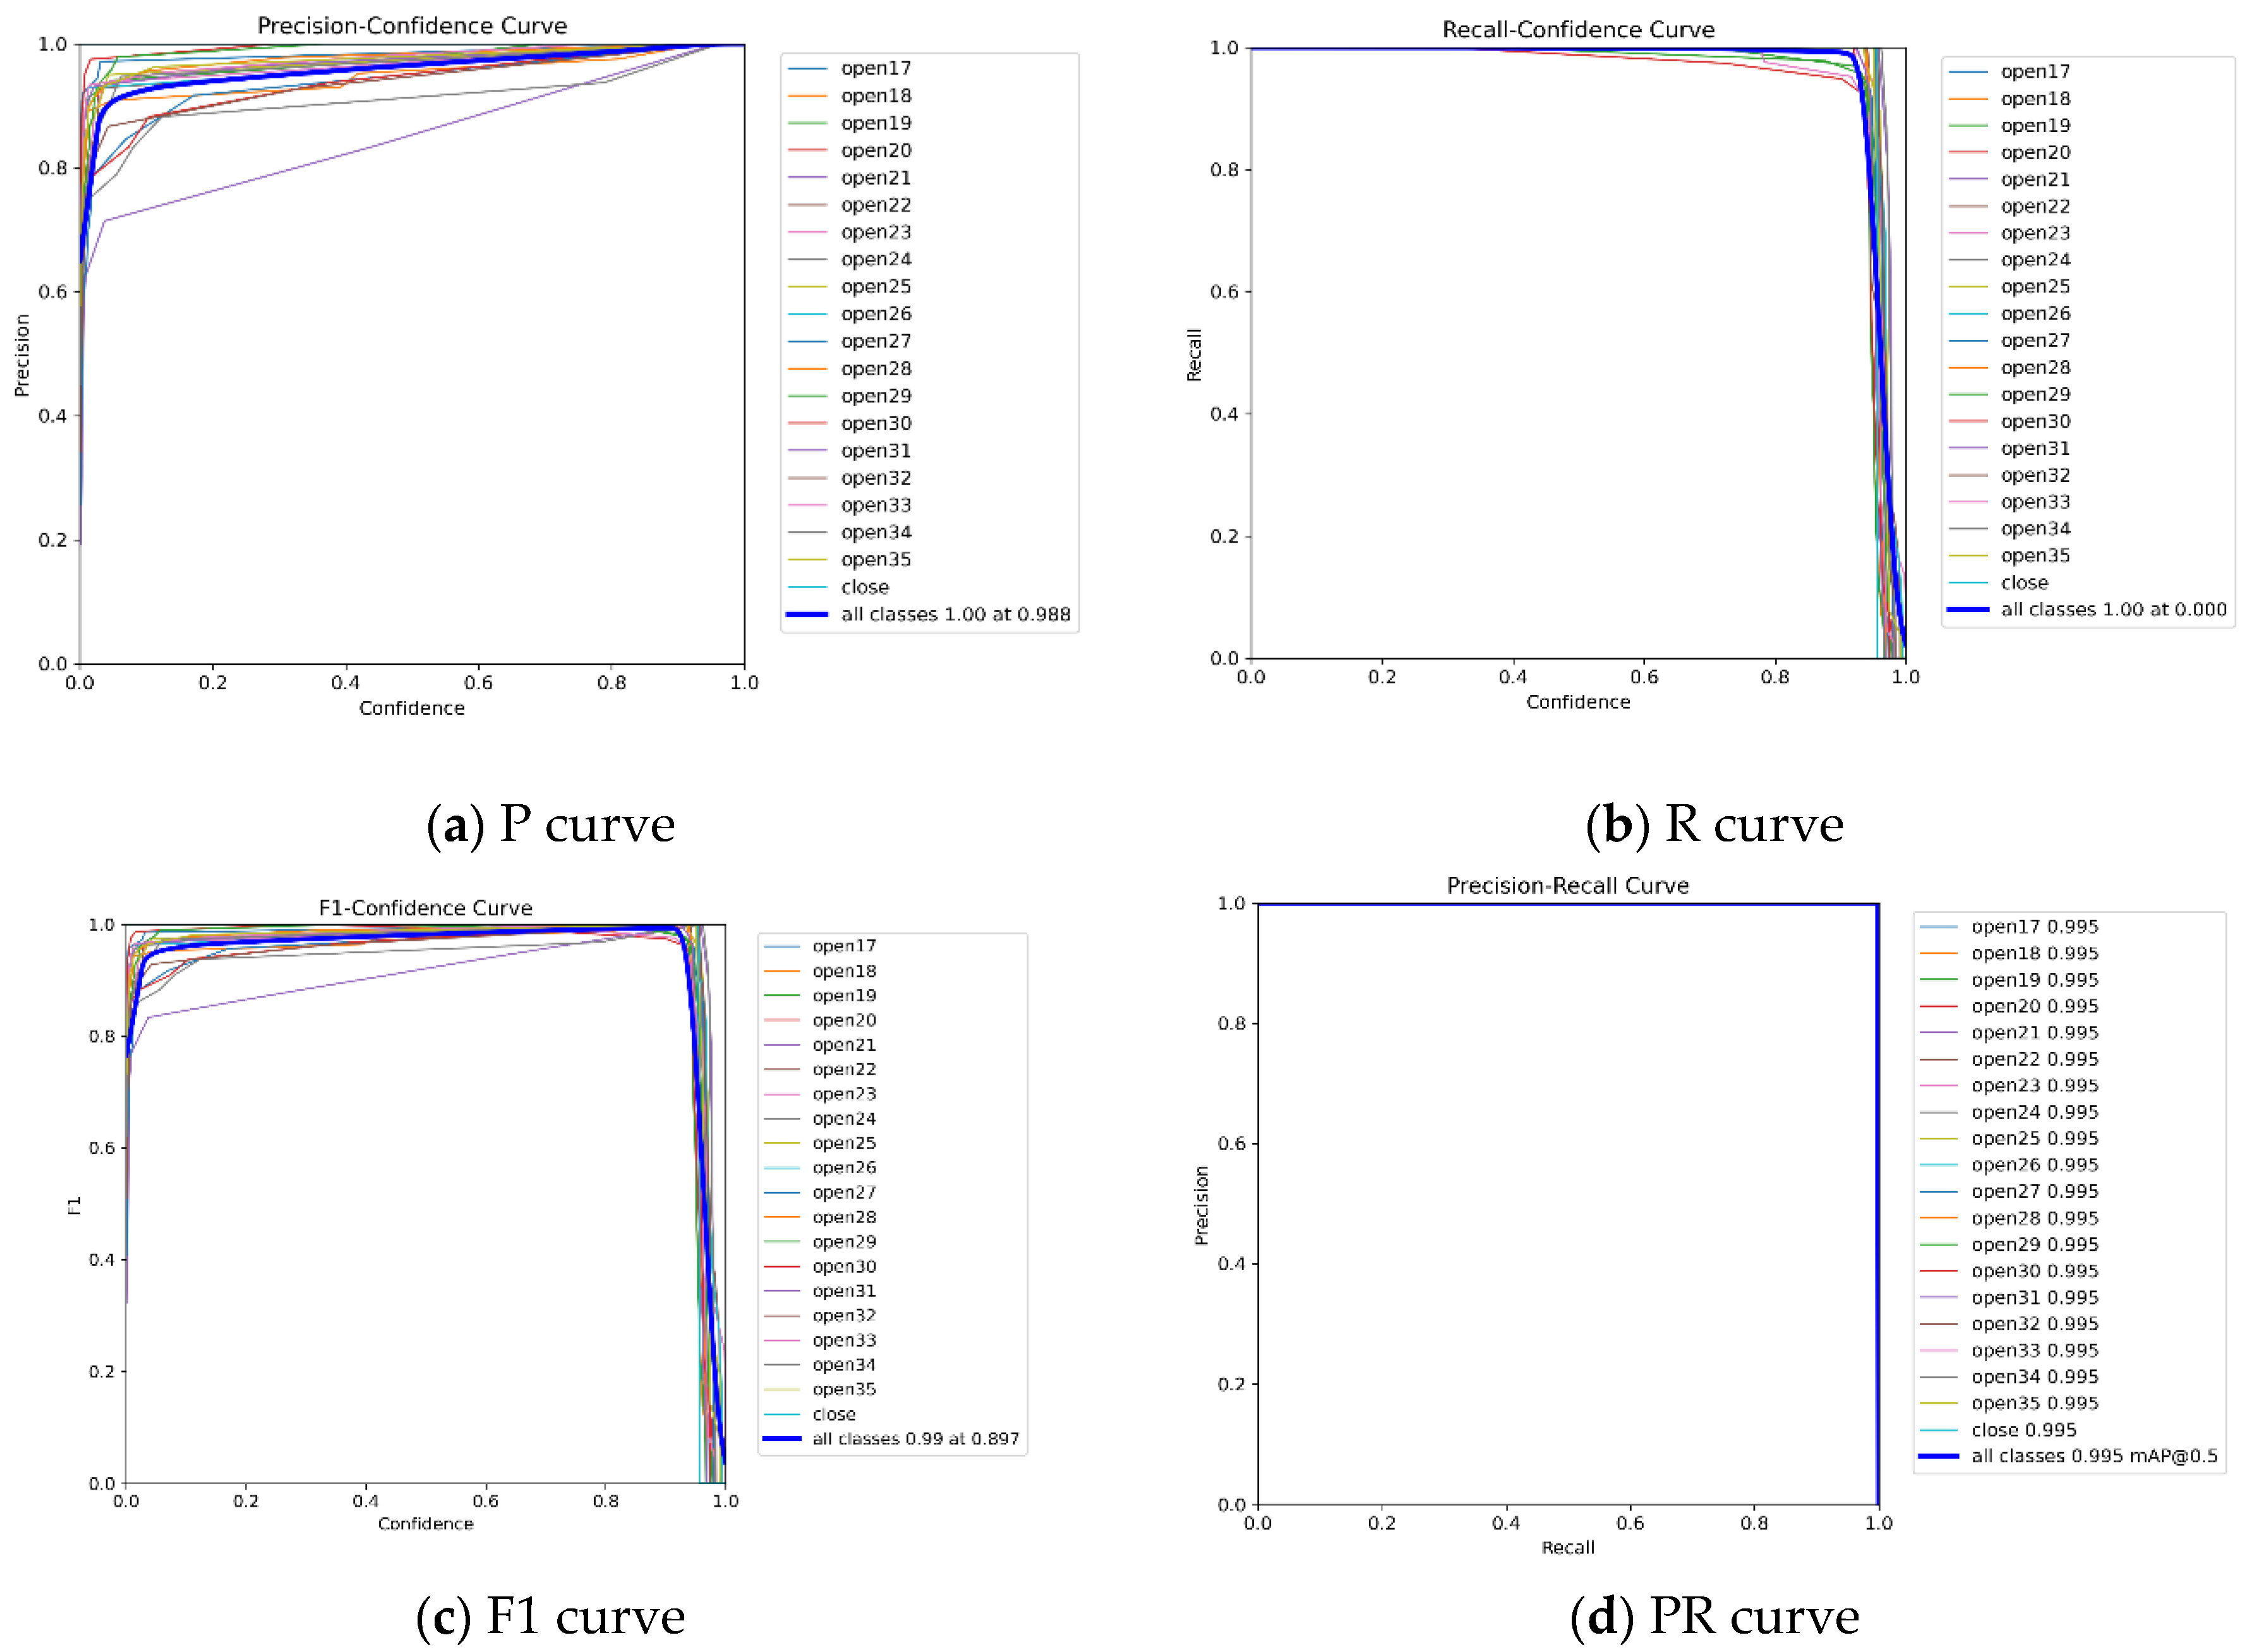
Figure 7.
Confusion Matrix of WCA-YOLO on the HVAC Temperature Detection Dataset.
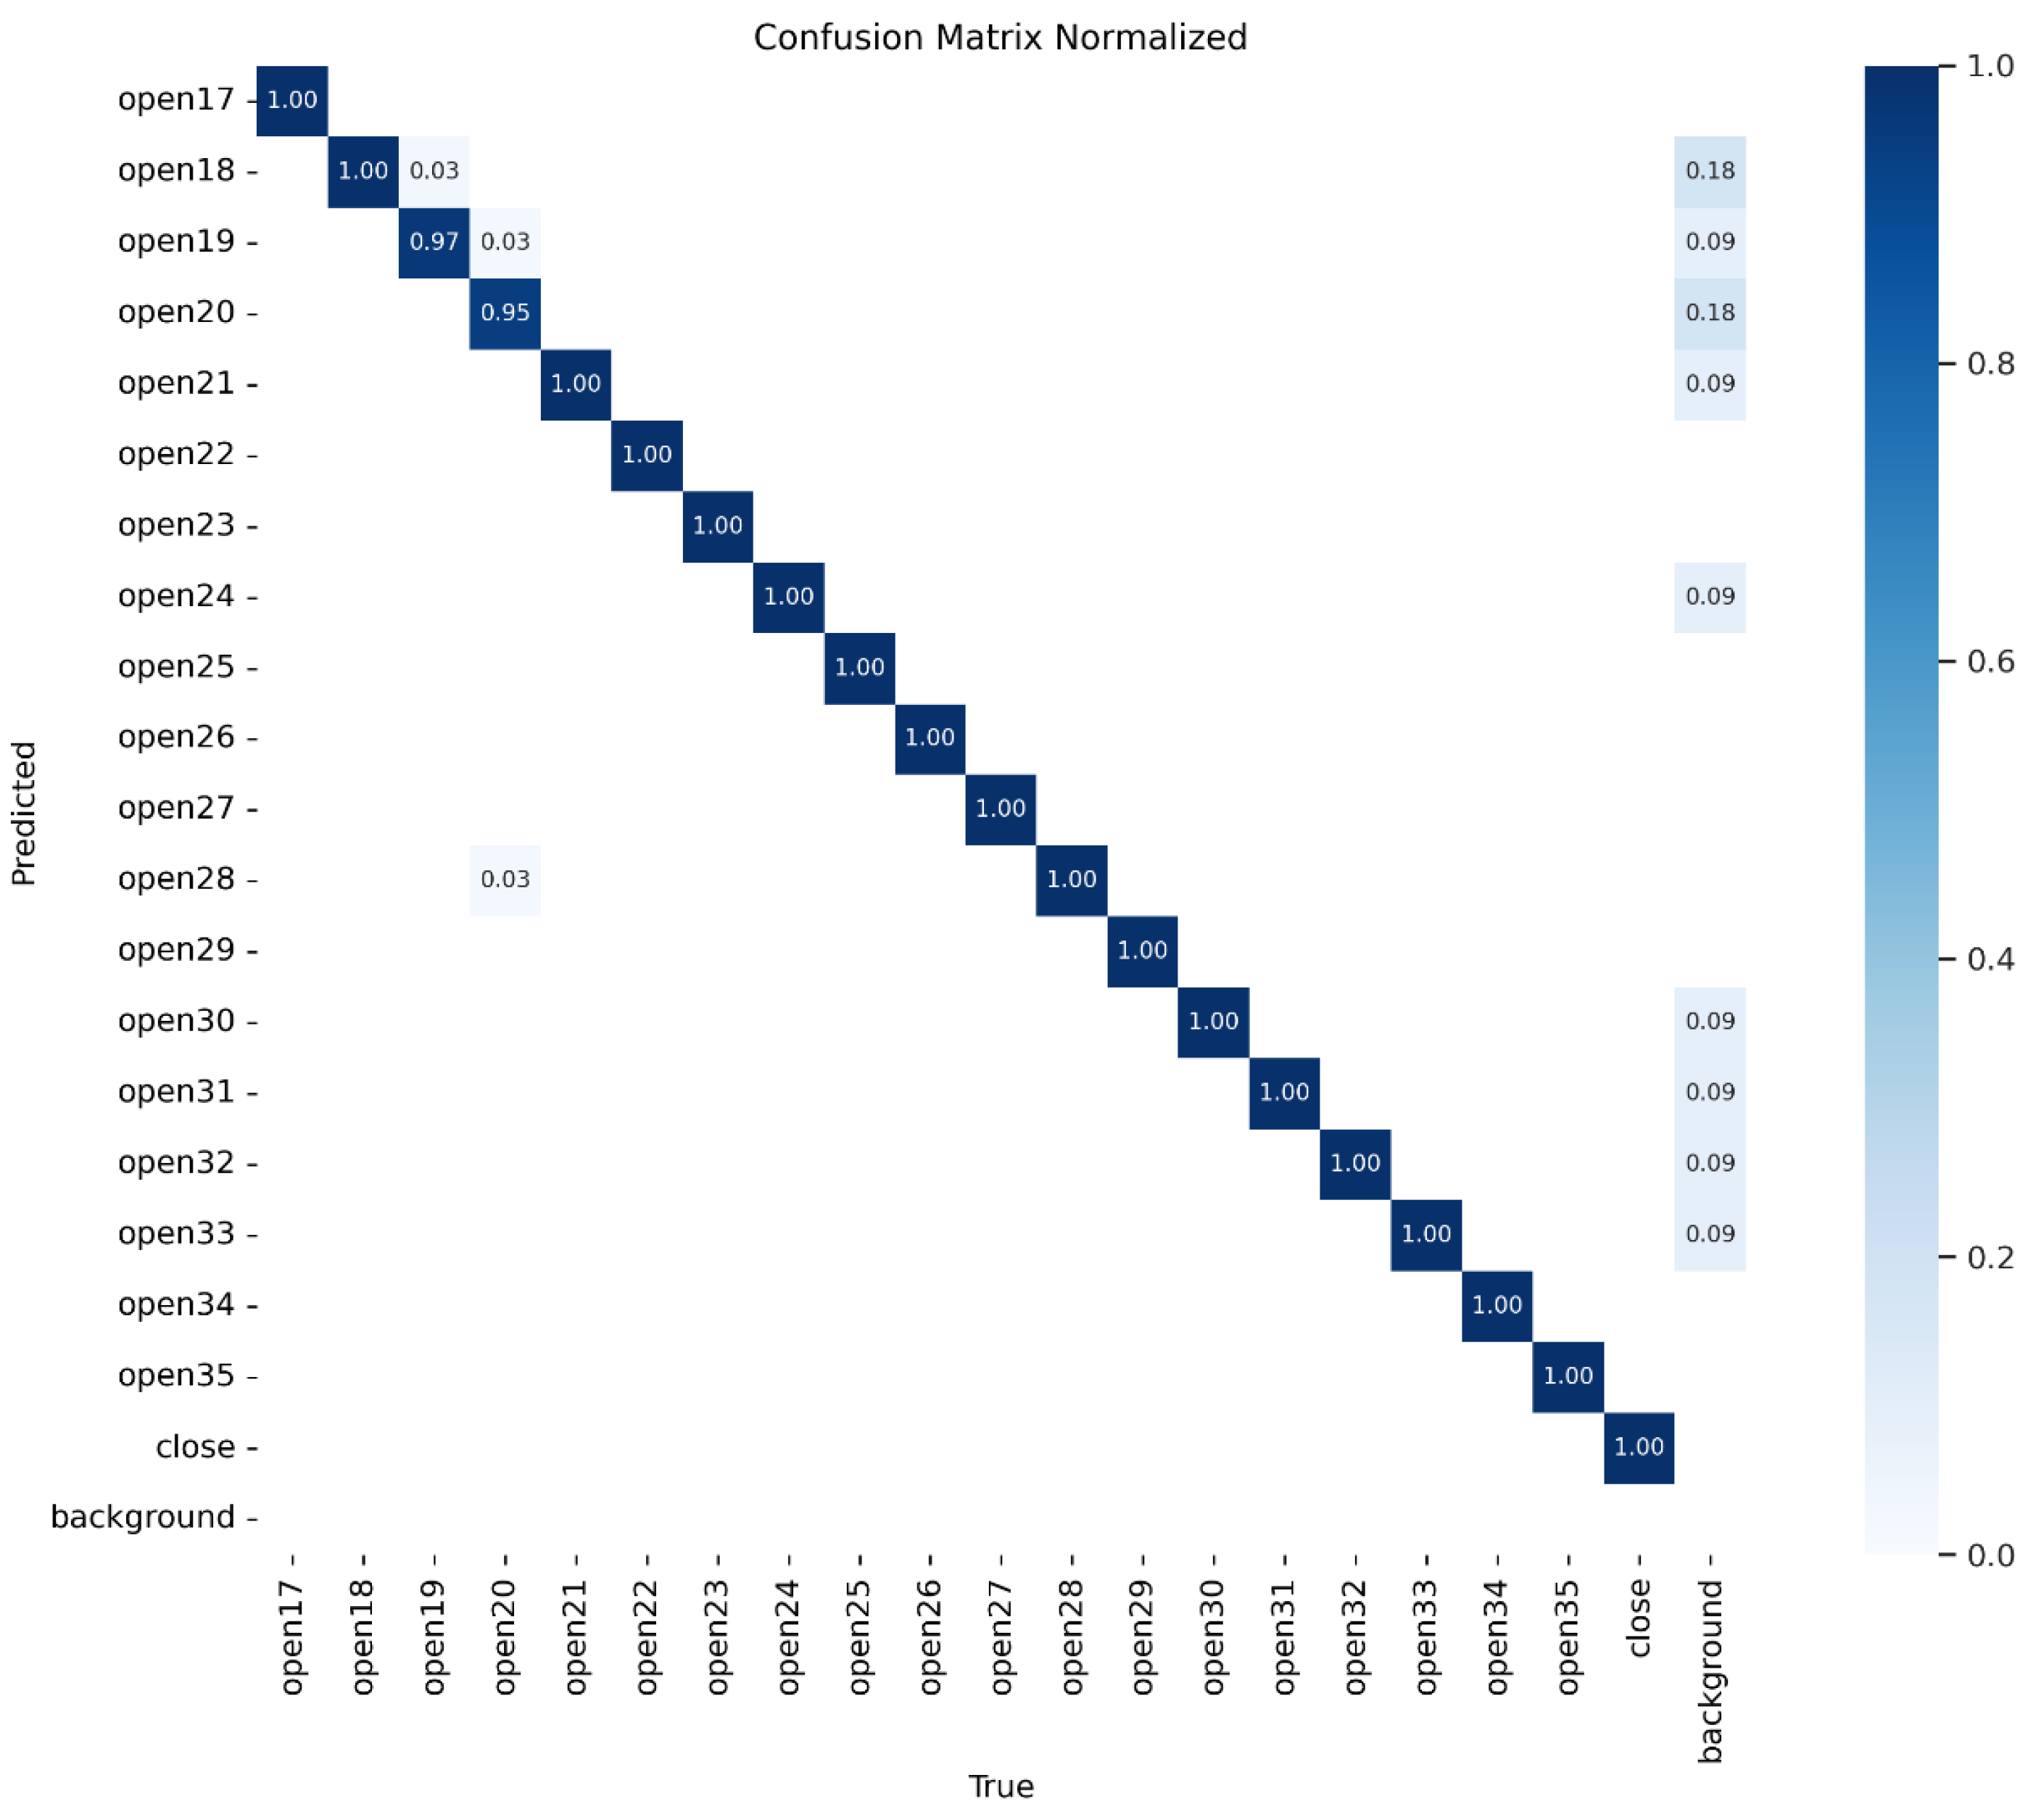

Table 1.
Experimental server operating environment.
| Name | Version |
|---|---|
| OS | Ubuntu 16.04 |
| CPU | Intel(R) Core(TM) i5-12400F |
| RAM | 32GB |
| GPU | Nvidia RTX 3060 |
| Driver | 515.65.01 |
| CUDA | 11.3.1 |
| python | 3.9 |
| torch | 1.10.1+cu111 |
| torchvision | 0.11.2++cu111 |
Table 2.
WCA-YOLO experiment hyperparameter configuration.
| Args | Value | Args | Value |
|---|---|---|---|
| epochs | 500 | imgsz | 640 |
| Lr0 | 0.01 | lrf | 0.01 |
| box | 7.5 | batch | 16 |
| optimizer | SGD | mosaic | 1.0 |
Table 3.
The performance comparison of the different algorithms.
| Algorithms | FPS | Precision(%) | recall(%) | mAP@0.5(%) | mAP@0.5:0.95(%) |
|---|---|---|---|---|---|
| YOLOv3-Tiny | 286 | 63.1 | 61.5 | 69.7 | 63.5 |
| YOLOv5n | 270 | 51.0 | 46.8 | 48.9 | 45.0 |
| YOLOv5s | 200 | 73.5 | 66.9 | 74.8 | 69.2 |
| YOLOv7-Tiny | 222 | 54.7 | 59.2 | 62.7 | 57.1 |
| YOLOv8n | 185 | 98.2 | 98.2 | 99.4 | 96.7 |
| WCA-YOLO | 161 | 99.4 | 99.3 | 99.5 | 96.7 |
Table 4.
Performance of different modules.
| Modules used | FPS | Precision(%) | recall(%) | mAP@0.5(%) | mAP@0.5:0.95(%) |
|---|---|---|---|---|---|
| Base | 185 | 98.2 | 98.2 | 99.4 | 96.7 |
| HGNetv2 [29]+C3k2 | 147 | 98.6 | 98.4 | 99.5 | 96.6 |
| HGNetv2+C3k2+FasterBlock [30]+Wavelet Pool | 154 | 98.2 | 98.0 | 99.3 | 96.3 |
| C3k2+gCONV | 159 | 98.8 | 98.0 | 99.5 | 96.0 |
| C3k2+DynamicCONV+HGNetv2 | 141 | 98.1 | 98.8 | 99.5 | 96.5 |
| WCA-YOLO(Wavelet Pool+C3k2) | 161 | 99.4 | 99.3 | 99.5 | 96.7 |
Disclaimer/Publisher’s Note: The statements, opinions and data contained in all publications are solely those of the individual author(s) and contributor(s) and not of MDPI and/or the editor(s). MDPI and/or the editor(s) disclaim responsibility for any injury to people or property resulting from any ideas, methods, instructions or products referred to in the content. |
© 2025 by the authors. Licensee MDPI, Basel, Switzerland. This article is an open access article distributed under the terms and conditions of the Creative Commons Attribution (CC BY) license (http://creativecommons.org/licenses/by/4.0/).
Copyright: This open access article is published under a Creative Commons CC BY 4.0 license, which permit the free download, distribution, and reuse, provided that the author and preprint are cited in any reuse.


