
Submitted:
09 June 2025
Posted:
10 June 2025
You are already at the latest version
Abstract
Sugar production generates wastewater rich in dissolved solids and organic matter, and improper disposal poses severe environmental risks, exacerbates water scarcity, and creates regulatory challenges. Conventional treatment methods, such as evaporation and chemical precipitation, are energy-intensive and often ineffective at removing fine particulates and dissolved impurities. This study evaluates membrane-based separation as a sustainable alternative for water reclamation and sugar recovery from sugar industry effluents, focusing on replacing evaporation with membrane processes, ensuring high permeate quality, and mitigating membrane fouling. Cross-flow filtration experiments were conducted on a lab-scale membrane system at 70 °C to suppress microbial growth, comparing direct reverse osmosis (RO) of the raw effluent to an integrated ultrafiltration (UF)–RO process. Direct RO resulted in rapid membrane fouling, which was characterized via SEM, EDS, and FTIR to elucidate the fouling mechanisms. A tight UF (5 kDa) pre-treatment before RO significantly mitigated fouling and improved performance, enabling 75 % water recovery, maintaining permeate conductivity below 0.5 mS/cm, sustaining stable flux, and reducing membrane blocking.
Keywords:
sugar production by-product streams
; membrane processes
; water treatment
; water quality
1. Introduction
Water plays a pivotal role in the beet sugar industry, being indispensable across multiple stages of production, including sugar beet washing, juice extraction, purification, evaporation, crystallization, and equipment cleaning [1,2]. However, the industry is also a significant generator of wastewater, often referred to as raffinate or by-product streams, which contain high concentrations of organic matter, residual sugars, and dissolved salts [3,4]. Improper disposal of these effluents can result in elevated chemical oxygen demand (COD), biological oxygen demand (BOD), and total dissolved solids (TDS), leading to severe pollution of receiving water bodies [5,6]. In addition, increasing global concerns regarding water scarcity and environmental pollution have placed the sugar industry under mounting pressure to implement more sustainable water management and wastewater treatment solutions [7,8].
Conventional treatment methods in the sugar sector, such as sedimentation, chemical coagulation, evaporation, and biological treatment, have been widely employed [9,10]. However, these methods typically suffer from limited efficiency in removing dissolved organic matter and fine particulates, high energy consumption, and suboptimal water recovery [11,12]Consequently, there is growing interest in membrane-based separation processes as an alternative for advanced wastewater treatment and high-quality water reclamation [13,14,15].
Membrane filtration technologies such as ultrafiltration (UF), nanofiltration (NF), and reverse osmosis (RO) are increasingly recognized for their ability to produce permeate of superior quality while offering modularity, scalability, and reduced chemical usage [16,17]. Reverse osmosis, in particular, provides high rejection rates of dissolved salts, sugars, and organic contaminants, making it well-suited for reclaiming water from sugar processing effluents [18,19,20]. However, when treating raffinate streams directly, RO membranes are prone to rapid fouling due to the accumulation of organic matter, scaling, biofouling, and colloidal deposition [21,22]. Such fouling not only compromises membrane performance but also leads to increased operational costs, frequent cleaning, and shortened membrane lifespan.
To address these challenges, pre-treatment using UF is widely employed to remove suspended solids, colloidal particles, and high molecular weight organic compounds prior to RO [23,24]. UF membranes with tight molecular weight cut-offs (such as 5 kDa) have demonstrated significant potential in reducing the fouling propensity of RO membranes, improving overall system efficiency, and enabling sustainable long-term operation [25].
Moreover, understanding the nature and distribution of membrane fouling is critical for optimizing membrane processes in industrial applications. Advanced characterization techniques such as Fourier-transform infrared spectroscopy (FTIR), Raman spectroscopy, energy-dispersive X-ray spectroscopy (EDX), and scanning electron microscopy (SEM) offer powerful tools for identifying foulant composition and spatial distribution along membrane modules [26,27,28,29]. Evaluating fouling at different locations within the membrane element—namely, the entrance, middle, and end—provides valuable insights into fouling mechanisms and informs the development of improved system design and cleaning protocols [30].
This study investigates a combined membrane filtration approach for recovering high-quality water from beet sugar industry raffinate streams. Specifically, a two-stage process comprising tight ultrafiltration (UF, 5 kDa cut-off) followed by reverse osmosis (RO) is employed to overcome the limitations of direct RO treatment. Furthermore, the study systematically characterizes membrane fouling along the membrane length using FTIR, Raman spectroscopy, EDX, and SEM to elucidate fouling mechanisms and enhance process performance for sustainable water reuse in sugar production.
2. Materials and Methods
2.1. Feed Composition
The by-product stream from the beet sugar industry was sourced from an Austrian sugar refinery. This feed solution exhibits a high conductivity of approximately 18 mS/cm and has a concentration of 1.5 °Brix. The stream contains raffinose, sucrose, and sulphate, and it has a dark brown color. The size exclusion chromatography (SEC) profile of the stream is illustrated in Figure 1.
2.2. Experimental Setup and Procedure
The by-product stream was treated using an integrated membrane process. Initially, the stream passed through a UF membrane with a molecular weight cutoff (MWCO) of 5 kDa. The permeate from this stage was then processed through an RO membrane, both supplied by Alfa Laval. These membranes were capable of operating at temperatures of up to 75 °C. The characteristics of the two membranes were detailed in Table 1.
The experiments were conducted at laboratory scale using a cross-flow membrane filtration system from Osmo (Germany), model OS-MC-01 (see Figure 1). The system includes a 2 L stainless steel jacketed feed tank. The feed solution is directed into a rectangular flat sheet cross-flow membrane module with an effective membrane area of 0.008 m² (dimensions: 0.04 m by 0.2 m). This process is powered by a CAT high-pressure piston pump, model 231, which can deliver a 3.7 L/min flow rate and achieve pressures of up to 60 bar. Throughout the experiments, the setup operated in batch concentration mode, wherein the retentate was recirculated back into the feed tank while the permeate was continuously discharged from the system.
Both UF and RO membranes were soaked in DI water for 2 h to ensure thorough hydration and achieve optimal swelling. After that, they were subjected to high-pressure compaction for 30 min to enhance their structural integrity and mechanical properties.
The water permeability was assessed both before and after the filtration process to determine the degree of membrane fouling.
All experiments were conducted at 70 °C to inhibit microbial growth in the feed solution and at a fixed cross-flow of around 3.7 L/min. The operating pressure for the UF process was 8 bar, while for the RO process, it was set at 32 bar.
2.3. Analysis
The conductivity of the feed, retentate, and permeate streams was measured to assess the rejection of salts quickly. Conductivity was measured with a WTW TetraCon 925 conductivity probe coupled to a WTW Multi 3430. Ion chromatography was employed to determine the rejection of anions and cations.
To determine the quantities of sucrose and raffinose, samples were collected from each experimental stage: feed, permeate, and retentate. These samples were subsequently analyzed using high-performance liquid chromatography (HPLC). For all measurements, the HPLC method utilized a Shimadzu UFLC system; 0.6 mL/min was adjusted for the flow rate, and the injection volume was 10 µL. The mobile phase was 5 mM of H₂SO₄, and the analysis was performed under isocratic conditions. The temperature was maintained at 50 °C. Detection was carried out using a RID-10A refractive index detector. The separation was achieved using a Shodex SH1011 column (8 × 300 mm), accompanied by an SH-G Sugar guard column.
To investigate the phenomenon of membrane fouling and to determine surface functional groups present on the membrane, the fresh RO and UF membrane and used RO and UF membrane at different positions of the membrane (entrance (0-5 cm), middle (5-15 cm), and end (15-20 cm)) were tested by Fourier Transform Infrared spectroscopy (FTIR). FTIR spectral data were collected using a BRUKER VERTEX 70 spectrometer, which enabled measurements over a wavelength range of 4000 to 400 cm⁻1. To improve the signal quality, a total of 64 individual scans were performed and averaged, with a spectral resolution set at 2 cm⁻1.
Raman spectroscopy was used to analyze fouling on the reverse osmosis (RO) membrane. Due to the high surface roughness and opacity of the active layer, Raman measurements could not be performed from the feed side; therefore, spectra were collected from the permeate (back) side of the membrane. Raman spectroscopy provides complementary information to Fourier Transform Infrared (FTIR) spectroscopy, as it relies on inelastic light scattering rather than infrared absorption, making it particularly sensitive to non-polar bonds and crystalline phases. Additionally, Raman spectroscopy can probe through semi-transparent materials, enabling effective analysis from the membrane’s reverse side, where FTIR is limited by penetration depth and sample geometry.
To characterize the extent and composition of fouling on both RO and UF membranes along the length of membrane at different position (entrance (0-5 cm), middle (5-15 cm), and end (15-20 cm)), Scanning Electron Microscopy (SEM) and Energy-Dispersive X-ray Spectroscopy (EDX) were employed. A FEI Quanta FEG250 microscope was used to perform SEM imaging. Membrane samples were mounted on aluminum stubs with a carbon adhesive tape. Also, a Q150T S sputter coater was used to coat the membrane samples with a thin layer of gold, operated at 15 mA for 5–10 minutes to improve surface conductivity. Elemental analysis of the fouling layers was subsequently conducted using EDX on the same SEM instrument, providing complementary information on the inorganic and organic components present on the membrane surfaces.
3. Results and Discussion
3.1. Separation Performance
Size Exclusion Chromatography (SEC) was performed to evaluate the molecular weight distribution of organic compounds in the raffinate stream from the beet sugar industry following treatment with a 5 kDa UF membrane (see Figure 3). The analysis compared the feed (green curve), permeate (black curve), and retentate (red curve) streams. In the low-molecular-weight range (~10²–10³ Da), corresponding primarily to simple sugars (e.g., glucose, fructose, sucrose fragments), the permeate and feed profiles were nearly identical, indicating that these compounds readily passed through the UF membrane.
In contrast, in the intermediate molecular weight region (~10⁴–10⁵ Da), which is likely associated with oligosaccharides, glycoproteins, and melanoidins, partial retention was observed; the retentate was enriched in these species, while their presence in the permeate was significantly reduced. In the high-molecular-weight region (>10⁵ Da), which includes polysaccharides, protein aggregates, and other potential foulants, the membrane demonstrated high retention efficiency, with minimal transmission into the permeate.
These findings confirm that the 5 kDa UF membrane effectively separates high- and intermediate-molecular-weight foulants from low-molecular-weight sugars, providing a helpful pre-treatment step to reduce fouling potential in subsequent membrane processes such as RO.
The separation and purification of water using an RO membrane after pre-treatment of the by-product stream with a UF membrane are analyzed through size exclusion chromatography (SEC). In this process, only water and monovalent ions pass to the permeate side, resulting in a conductivity of approximately 0.462 mS/cm. The SEC results for the permeate, retentate, and feed are illustrated in Figure 4.
The green curve, representing the feed, exhibits a bimodal distribution. The first peak, observed in the molar mass range of approximately 102 to 103 Da, corresponds to the presence of low molecular weight sugars, specifically sucrose (342 Da) and raffinose (504 Da). The second major peak, appearing near 104 Da, is attributed to higher molecular weight species, including brown-colored compounds and proteins typically present in beet sugar processing by-products.
The black curve, corresponding to the retentate, closely mirrors the feed profile in the higher molar mass region (~104 Da), indicating effective retention of proteins and brown-colored compounds by the RO membrane. The presence of residual signal in the lower molar mass region suggests partial retention of mono- and oligosaccharides, which is consistent with the known behavior of RO membranes; neutral sugars of this size are only partially rejected.
The red curve, representing the permeate, shows a low overall signal, with a small peak evident below 103 Da. This indicates that a portion of the low molecular weight sugars, such as sucrose and raffinose, is able to pass through the membrane. Importantly, there is no detectable contribution from the high molar mass region (> 104 Da), confirming that the membrane provides excellent rejection of proteins and brown-colored compounds.
The observed data confirms that the RO membrane is performing as expected for this application. High molecular weight species, which contribute to color and fouling potential, are effectively retained. Partial passage of sucrose and raffinose through the membrane is characteristic of RO operation, as complete rejection of small neutral sugars is challenging even for tight membranes.
In summary, the RO process applied to this beet sugar by-product stream achieves excellent removal of high molecular weight contaminants while allowing partial transmission of desirable sugars. The current membrane performance appears well-suited for applications aiming at decolorization or purification of the feed stream. Further optimization, such as selection of higher rejection RO membranes or adjustment of operating parameters, may be considered if the goal is to maximize sugar retention or water purity.
Figure 5 illustrates the flux performance of an integrated membrane filtration system used for the treatment of raffinate. In this process, a UF membrane, specifically the UF GR 90 PP membrane from Alfa Laval, serves as a pre-treatment stage prior to reverse osmosis (RO) processing. The raffinate feed stream first undergoes UF filtration, which effectively removes suspended solids and high-molecular-weight compounds.
The UF membrane operates with a permeate flux of 153 kg/m²·h, generating a permeate stream that is subsequently directed to the RO system. Meanwhile, the UF retentate is discharged at a flux of 47 kg/m²·h.
The permeate from the UF unit, containing dissolved salts and sugars, is then treated using an RO 98PHt membrane, also from Alfa Laval. This RO stage achieves further purification, producing two separate streams: an RO permeate with a flux of 56 kg/m²·h, representing purified water, and an RO retentate with a flux of 97 kg/m²·h, which contains the concentrated solutes.
The sequential combination of UF and RO membranes is designed to optimize the removal of both particulate and dissolved contaminants. The pretreatment role of UF not only improves the efficiency and longevity of the RO membranes but also ensures higher quality permeate, aligning with the objective of obtaining purified water free from salts and sugars.
The rejection performance of the UF GR90 PP membrane with a 5 kDa (MWCO) was evaluated for various solutes, including sugars and inorganic ions, as summarized in the presented Figure 6.
The membrane demonstrated substantial rejection of neutral sugars, with 77.2 % rejection for sucrose (molecular weight ~342 Da) and 66.7 % for raffinose (~504 Da), despite both being smaller than the nominal MWCO. This indicates that the membrane may exhibit an effective MWCO lower than 5 kDa or that additional factors such as steric hindrance, solute shape, and hydrophilic-hydrophobic interactions influence transport.
Furthermore, no rejection was observed for monovalent ions, given that UF membranes are generally not designed for salt separation. The rejection of bivalent ions was also noteworthy: Mg²⁺ and Ca²⁺ were rejected at 45.7 % and 39.6 %, respectively, consistent with the known tendency of bivalent ions with larger hydration shells to experience greater steric and electrostatic repulsion. The SO₄²⁻ rejection was zero.
Overall, the observed performance indicates that the UF GR90 PP membrane operates with a combination of size-based and electrostatic exclusion mechanisms. It is also possible that membrane surface properties, fouling, or operational conditions (e.g., pH, ionic strength) contributed to the higher-than-expected ion rejection. These findings suggest that this membrane, although classified as ultrafiltration, displays behaviors partially characteristic of tight UF or loose nanofiltration (NF) membranes.
3.2. Qualitative and Quantitative Fouling Analysis
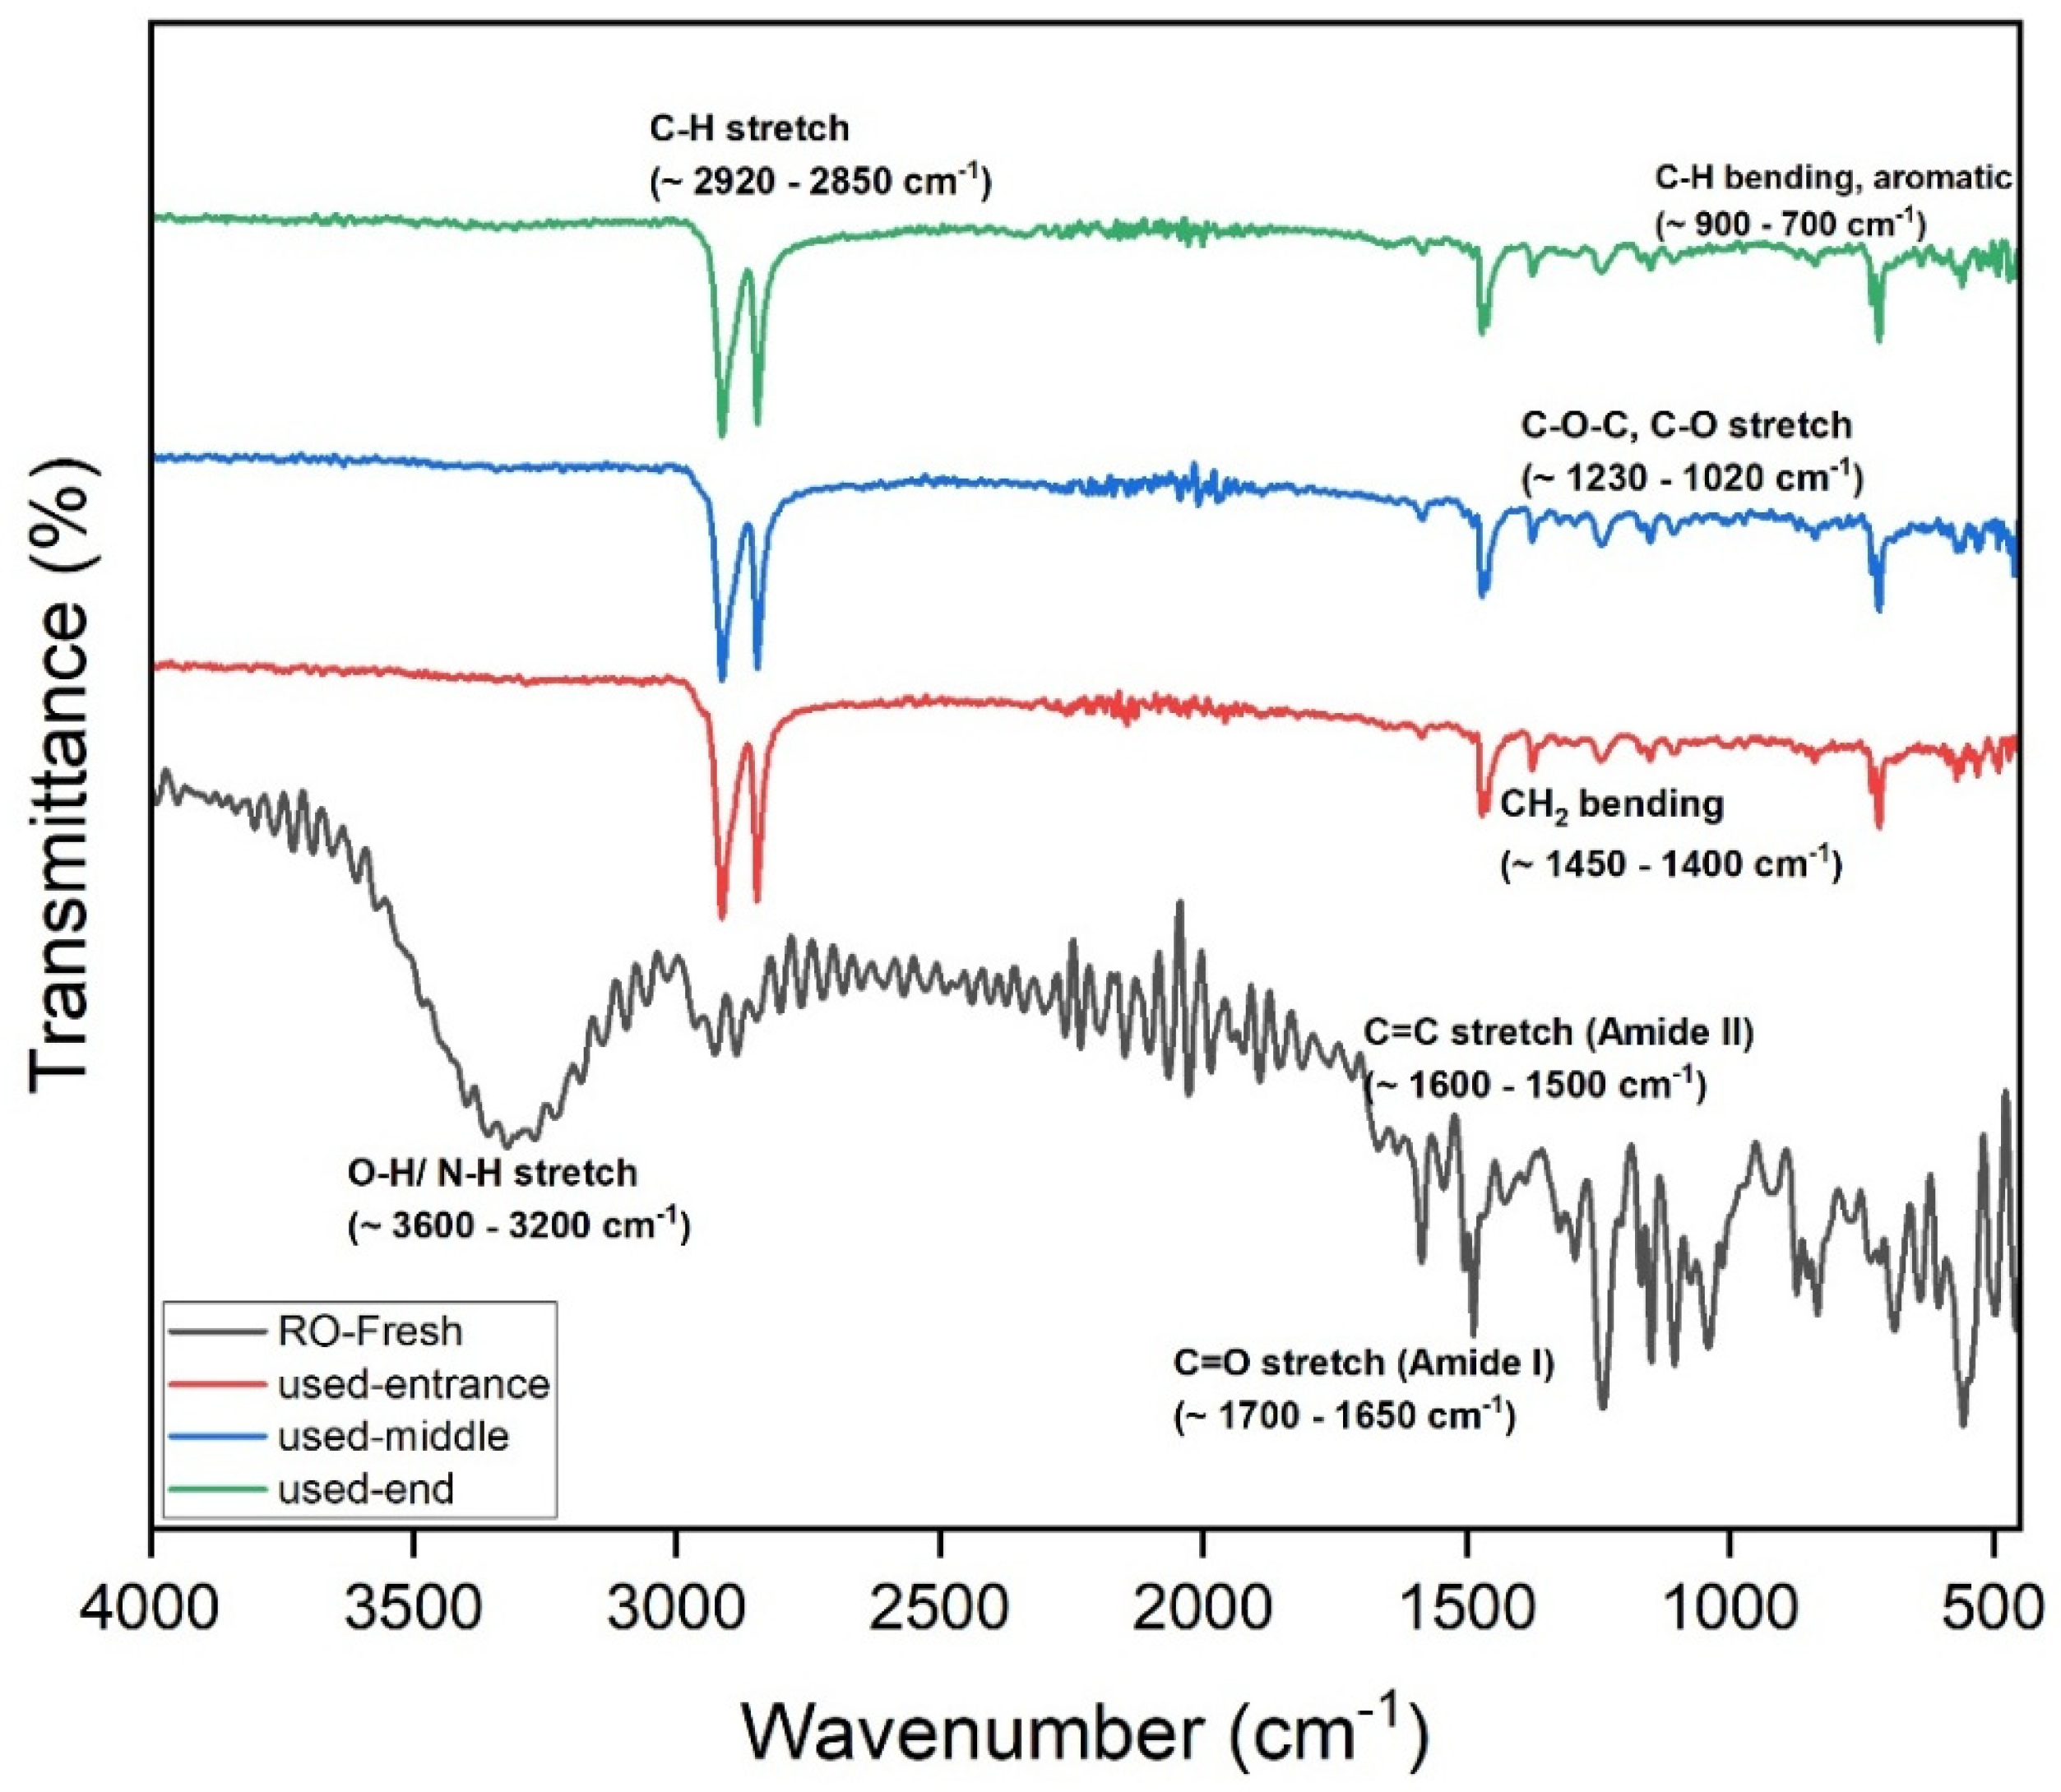
The FTIR of the UF membrane (GR90PP, 5 kDa) reveals notable changes in membrane chemistry after use, providing insights into the fouling behavior during treatment of the raffinate solution. In the fresh membrane, the prominent broad O–H/N–H stretching band (~3600–3200 cm⁻1) and the sharp C–H stretching band (~2920–2850 cm⁻1) are clearly visible. In the used membranes, these bands show noticeable attenuation, particularly at the membrane end, which indicates surface coverage or chemical modification by fouling layers, likely composed of organic materials and biofilm components.
The Amide I and II regions (~1700–1500 cm⁻1) exhibit broadening and reduced intensity in the used samples, again suggesting the accumulation of proteinaceous substances or chemical interactions between foulants and the membrane material. The C–O–C and C–O stretching region (~1230–1020 cm⁻1), though less pronounced than in the RO membrane, also shows some increase in absorbance in the used membrane, which points to the deposition of polysaccharides or sugar-derived materials from the raffinate.
A progressive fouling pattern is evident across the membrane length. The spectra show that fouling increases from the entrance to the middle and is most pronounced at the membrane end, where concentration polarization would be most significant. Additionally, the baseline shift and increased absorbance across the entire fingerprint region suggest the formation of a heterogeneous fouling layer comprising both organic and inorganic components. UF membrane experienced significant organic fouling, dominated by polysaccharides and biofilm constituents, with contributions from proteins and potential inorganic interactions.
The FTIR spectra provide valuable insights into the fouling behavior of the RO membrane used for treating raffinate from the beet sugar industry. Comparing the fresh membrane to the used membrane at various positions (entrance, middle, and end), several key changes are evident. The broad O–H/N–H stretch (~3600–3200 cm⁻1) is significantly reduced in the used membranes, suggesting the formation of a fouling layer that masks or alters these functional groups. Similarly, the C–H stretch (~2920–2850 cm⁻1) diminishes, consistent with the deposition of hydrophilic substances, such as polysaccharides and biofilm materials. In the Amide I (~1700–1650 cm⁻1) and Amide II (~1600–1500 cm⁻1) regions, peak broadening and intensity changes indicate chemical interactions with organic foulants and possible oligo-peptide or protein accumulation.
Notably, the C–O–C and C–O stretch region (~1230–1020 cm⁻1) shows increased absorbance in the used membranes, a strong indicator of polysaccharide fouling. This is expected given the raffinate’s high content of residual sugars and polysaccharides, which can readily deposit on the membrane surface. Additionally, distortions and elevated absorbance in the fingerprint region (< 700 cm⁻1) suggest the presence of complex inorganic-organic fouling, potentially involving metal-organic complexes or scaling components.
Fouling intensity increases from the entrance to the middle and is most severe at the end of the membrane. This pattern aligns with the expected effects of concentration polarization, which intensifies toward the membrane outlet, promoting greater foulant accumulation. The fouling is particularly comprised of polysaccharides and biofilm components, with contributions from proteins and inorganic species. These results highlight the need for pre-treatment and cleaning strategies to maintain the membrane.
Figure 8.
FITR of RO membrane.
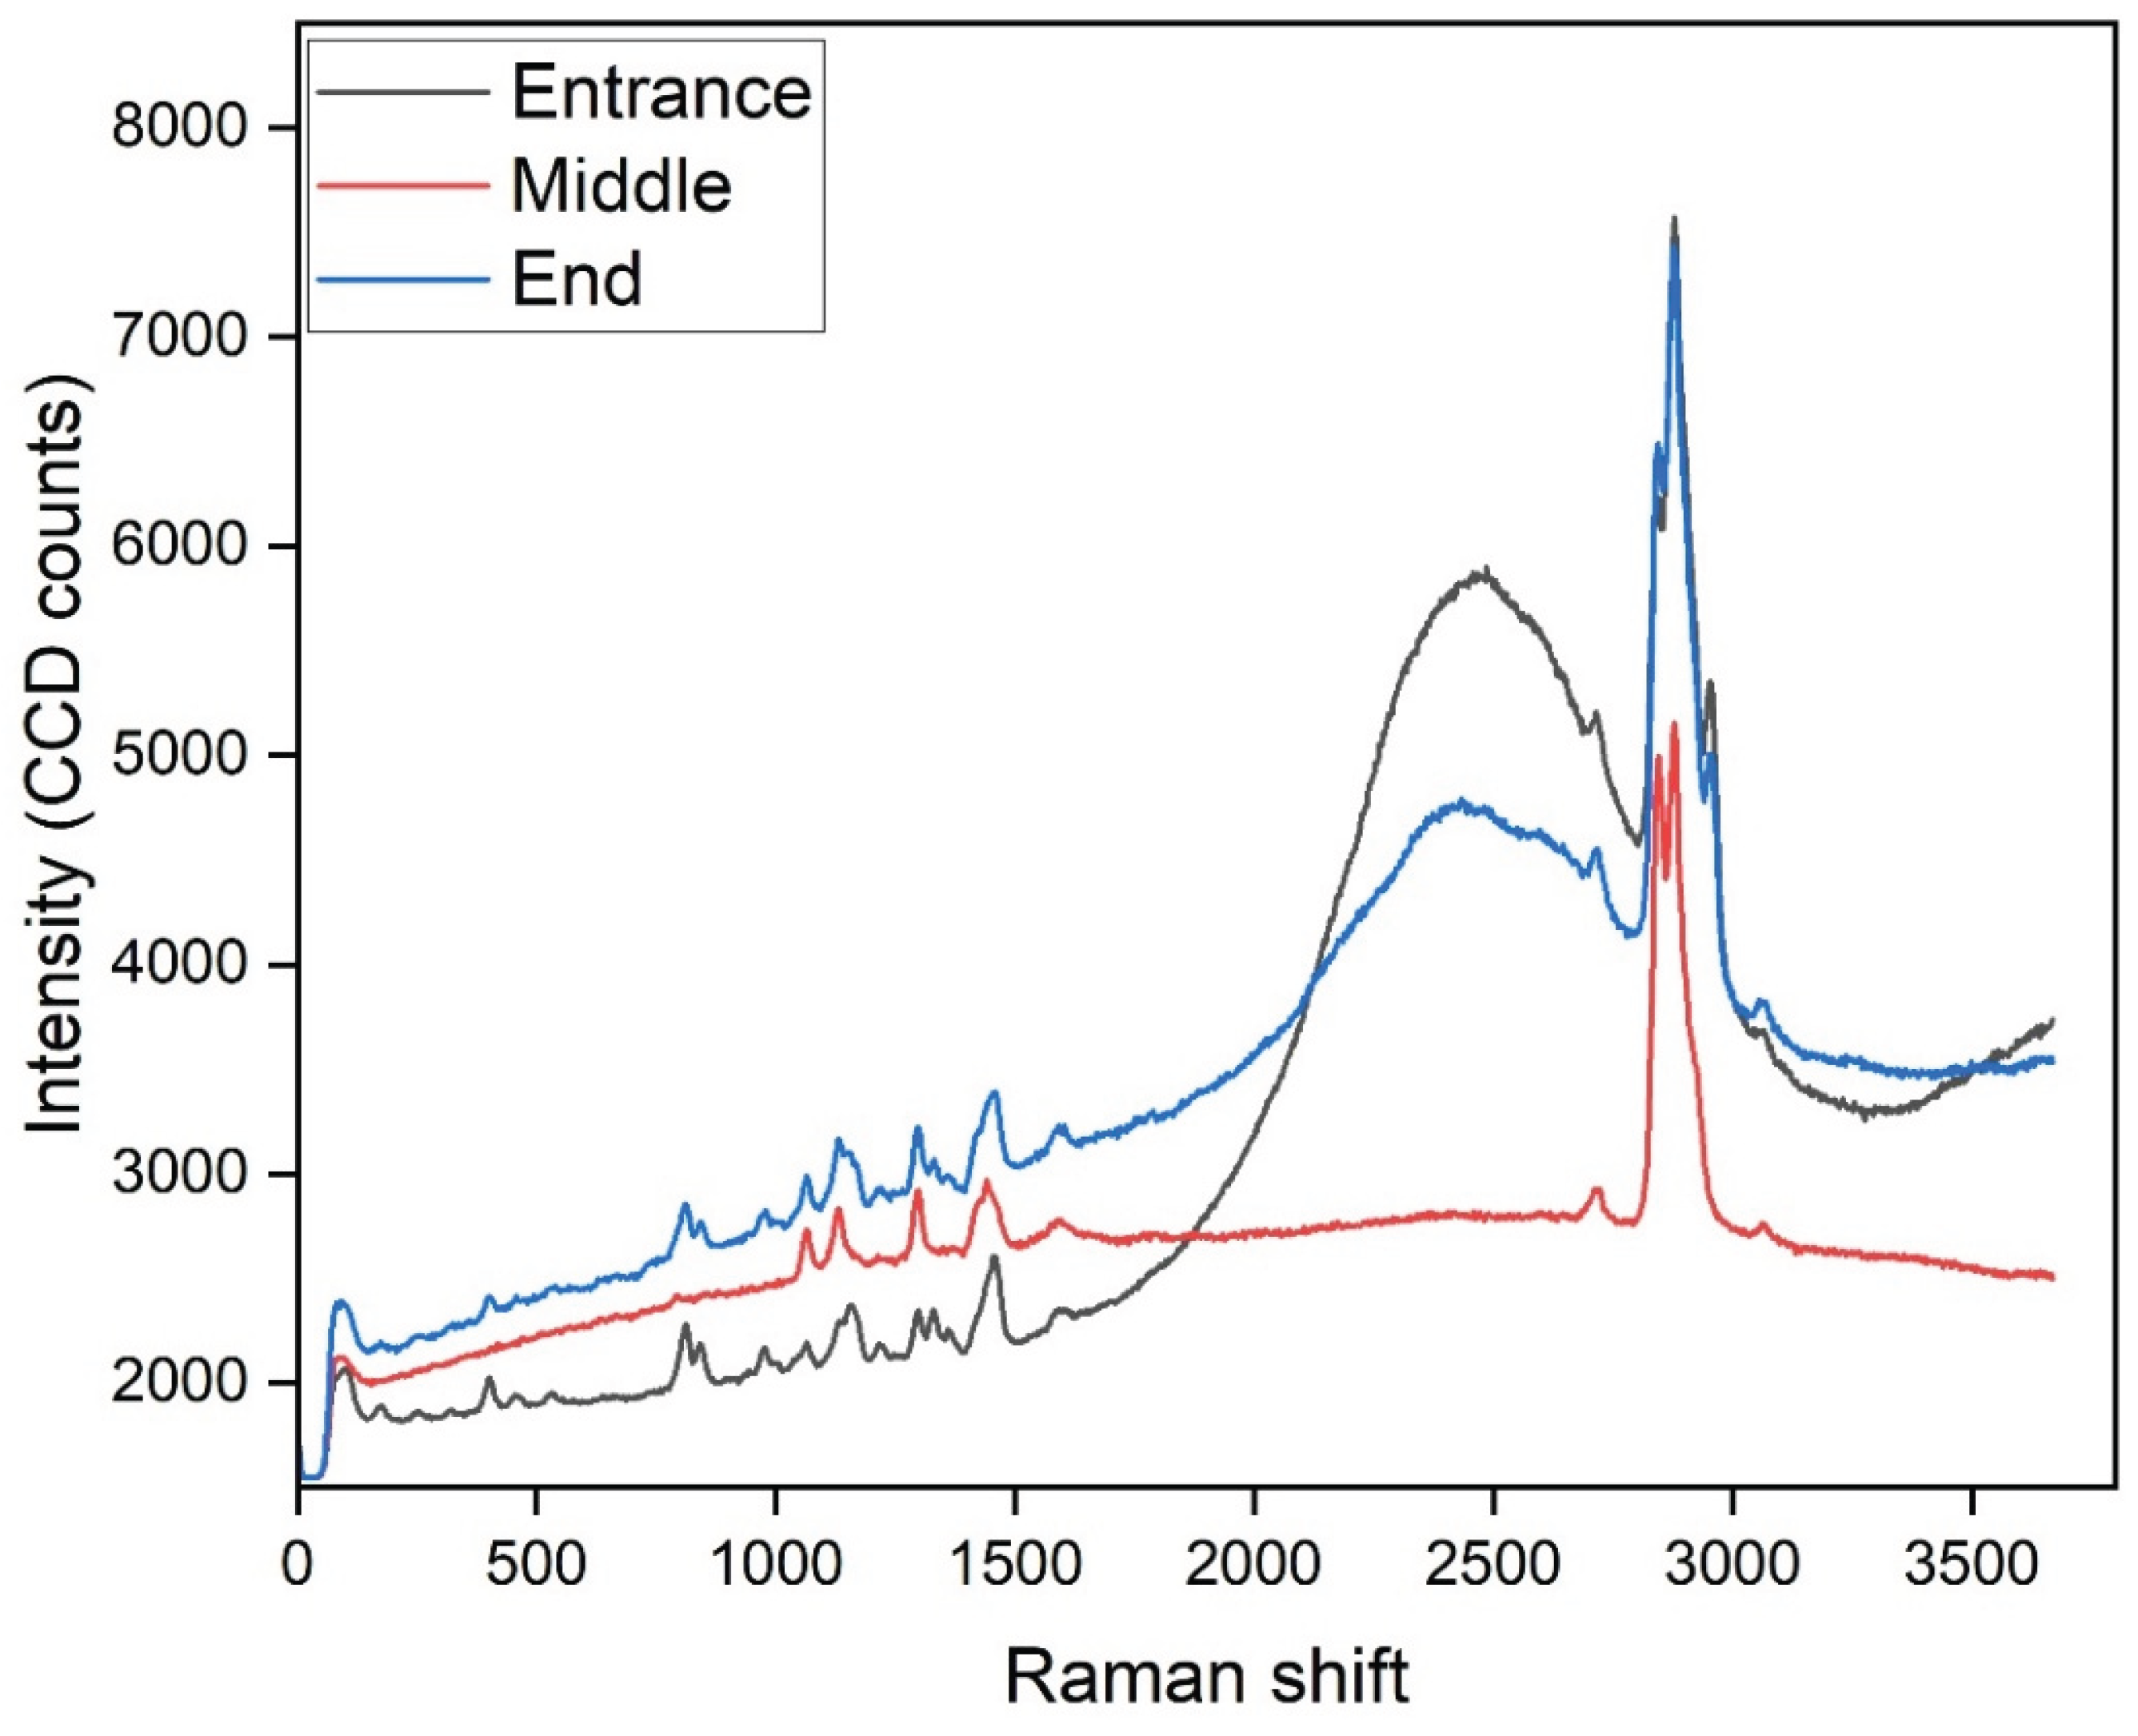
Also in this study, Raman spectroscopy was employed to analyze used Alfa Laval RO 98pHt membranes that had been operated for the treatment of byproduct stream in the beet sugar industry. Given the challenging composition of this feed stream—rich in organic matter, polysaccharides, proteins, and salts—membranes used in this application are highly susceptible to various forms of fouling. The Raman spectra collected from the back side of the membranes (support layer) reveal important insights into the nature of the fouling present. In particular, the spectrum exhibits a broad, elevated baseline as well as a strong peak around 2900 cm⁻1, corresponding to C–H stretching vibrations. Such spectral features are characteristic of organic fouling and biofouling, likely originating from residual sugars, microbial extracellular polymeric substances (EPS), and proteins associated with biofilm formation. Typical Raman signatures of biofouling include bands near 1600 cm⁻1 (aromatic C=C, proteins), 1450 cm⁻1 (CH₂ bending from lipids), 1330 cm⁻1 (amide III from proteins), and around 1000–1100 cm⁻1 (C–O–C vibrations from polysaccharides). In contrast, inorganic scaling, such as calcium carbonate or gypsum, would be identified by distinct sharp peaks at approximately 1085 cm1 or 980 cm1, which were slightly observed in this dataset, suggesting that scaling was not a dominant fouling mechanism in this case.
Raman spectroscopy can be incorporated into a cleaning validation method to enable systematic monitoring and validation of membrane cleaning protocols. This involves collecting spectra both before and after cleaning cycles and comparing key spectral features. Effective cleaning should result in a significant reduction of the baseline and the disappearance or substantial reduction of peaks associated with organic matter and biofilm components, particularly those near 1600, 1100, and 2900 cm⁻1. The implementation of such an approach would provide a rapid, non-destructive means of verifying the efficacy of cleaning-in-place (CIP) procedures.
Finally, it is recommended that future Raman analyses focus on the active layer of the membranes, where fouling most directly impacts membrane performance. To optimize Raman measurements of this thin polyamide layer, careful control of laser power and acquisition settings is required to prevent sample damage while maximizing signal quality. Additionally, spectral subtraction techniques can be applied to remove background signals from the support layer, enhancing the detection of subtle changes in the active layer’s chemistry.
Figure 9.
Raman spectroscopy Alfa Laval RO 98pHt membrane.
3.3. Membrane Surface Characterization by SEM-EDX and Fouling Profiling
To analyze the mechanisms of spatial fouling, scanning electron microscopy combined with energy-dispersive X-ray spectroscopy (SEM-EDX) was conducted on membrane samples taken from three different locations along the length of the membrane. The fouling profile was obtained from the EDX spectra, and a fouling index (FI) was calculated to quantify the severity of fouling.
The SEM micrographs in Figure 10 show the surface morphology of a UF membrane (GR90PP, 5 kDa MWCO) used for treating byproduct stream from the beet sugar industry, taken at three positions along the membrane length: (A) entrance, (B) middle, and (C) end.
Image A (entrance) reveals a relatively clean membrane surface with limited deposition. Only a few scattered particles and a small localized foulant cluster are visible. This suggests that early-stage fouling is minimal and primarily consists of loosely attached particulates or organic residues present in the raffinate.
Image B (middle) shows an increase in surface deposition. Several small particles (including e. g. microorganisms like bacteria) and isolated deposits are now more visible across the membrane surface, indicating the onset of fouling accumulation, likely due to concentration polarization effects that promote the deposition of soluble and colloidal components as the feed progresses along the membrane.
In contrast, Image C (end) displays significant fouling, with a large, dense deposit and evidence of surface coverage and scaling. This pronounced localized fouling at the end of the membrane is consistent with typical trends in pressure-driven membrane systems, where decreased cross-flow velocity and increased concentration polarization toward the membrane outlet enhance fouling and scaling.
The feed solution from beet sugar processing is known to contain a complex mixture of organic matter (polysaccharides, proteins, colorants) and inorganic ions (calcium, magnesium, silica), which likely contribute to the formation of these deposits.
Overall, the SEM results confirm a progressive fouling profile along the membrane length, transitioning from light fouling at the entrance to severe deposition at the outlet. These observations underline the importance of optimizing pretreatment and operating conditions to control fouling in UF applications that are treating challenging industrial streams such as the beet sugar byproduct stream.The SEM micrographs in Figure 11 show the surface morphology of the RO membrane (RO 98PHt) after processing the permeate stream from an upstream UF membrane treating beet sugar raffinate. The images capture three distinct positions along the membrane: (A) the entrance, (B) the middle, and (C) the end.
Image A (entrance) reveals a relatively smooth and clean membrane surface, with only minor textural features and no significant fouling layers. This suggests that the UF pre-treatment was effective in removing larger particulates, colloids, and high-molecular-weight organics from the feed, resulting in low initial fouling at the RO membrane entrance.
Image B (middle) shows a slight increase in surface roughness and the presence of small, evenly distributed deposits. This pattern is indicative of early-stage fouling, likely caused by residual low-molecular-weight organics, salts, or fine colloidal material that passed through the UF membrane and began to accumulate due to concentration polarization effects in the RO process.
Image C (end) displays a more pronounced fouling layer, with noticeable surface roughening and localized deposits. The observed morphology suggests the formation of inorganic scaling and/or bio-organic fouling near the outlet of the RO membrane, where solute concentration and osmotic pressure are highest. This is a common phenomenon in RO systems, particularly when treating complex industrial streams, as the solubility limits of salts can be exceeded at the membrane end, leading to precipitation and scaling.
Overall, the SEM results demonstrate a progressive fouling trend along the RO membrane, though the severity of fouling is relatively moderate, likely due to the beneficial effect of upstream UF pre-treatment. The data highlight the importance of maintaining effective pre-treatment and considering antiscalant dosing or optimized cleaning protocols to mitigate downstream scaling and preserve reverse osmosis (RO) membrane performance during long-term operation.
Figure 12 presents the longitudinal fouling profile of the RO membrane based on SEM-EDX analysis, showing how the type and intensity of fouling vary along the membrane length. At the membrane entrance (0–5 cm), fouling is predominantly composed of organic matter (represented by carbon) and silica-based compounds, with smaller contributions from sulfur and sodium.
This is typical, as larger organic molecules and colloidal silica tend to accumulate at the front of the membrane due to size exclusion and initial interactions with the membrane surface. In contrast, the middle section of the membrane (5–15 cm) exhibits the highest overall fouling intensity, with a noticeable increase in inorganic components such as chloride, potassium, and aluminum, alongside continued contributions from organic matter and silica. This pattern suggests that concentration polarization effects are stronger in the middle of the membrane, leading to localized precipitation and scaling of ionic species.
Finally, at the membrane end (15–20 cm), the overall fouling intensity decreases, but there is a significant presence of aluminum, indicating possible localized precipitation of alumina or related compounds. Organic fouling at this point is minimal, likely due to either the depletion of organic material along the flow path or flow dynamics that reduce deposition at the end of the membrane.
3.4. Fouling Index (FI) and Operational Implications
Table 2 presents the fouling index (FI) and dominant fouling types across different sections of the RO membrane, derived from the sum of normalized EDX intensities for key foulants.
The data reveal a distinct spatial variation in fouling behavior along the membrane length. The entrance section (0–5 cm) exhibits an FI of 230, with fouling primarily attributed to organic matter (carbon and oxygen), accompanied by silica and sulfate scaling. This is characteristic of the initial interaction between feedwater organics and the membrane surface. In contrast, the middle section (5–15 cm) shows the highest FI of 300, indicating a convergence zone where both organic and inorganic foulants accumulate.
Here, mixed fouling is observed, consisting of organics alongside sodium, chloride, potassium, silica, and sulfur. This suggests that concentration polarization effects are most pronounced in this region, promoting precipitation and scaling. The outlet section (15–20 cm) sees a return to an FI of 230, dominated by inorganic scaling—particularly sodium, silica, and aluminum deposits—while organic fouling diminishes.
Operationally, these findings highlight the importance of optimizing pretreatment to reduce organic and colloidal load at the membrane entrance and implementing targeted cleaning strategies to address the combined fouling observed in the middle section. Enhanced antiscalant dosing or pH adjustment may also be necessary to mitigate inorganic scaling toward the outlet.
Based on the observed fouling profile, a two-stage cleaning protocol is proposed to effectively address the spatial variation in foulant composition along the membrane. The first stage should involve an alkaline cleaning step (e.g., using sodium hydroxide-based solutions) to remove organic fouling predominantly accumulated at the membrane entrance. This should be followed by an acid cleaning stage (e.g., using citric acid or hydrochloric acid-based solutions) to target and dissolve inorganic scales, which are more prevalent in the downstream sections of the membrane.
In addition, the application of silica-specific antiscalants and the optimization of upstream ultrafiltration (UF) pre-treatment processes are recommended to mitigate the formation of silica-based scaling and reduce the overall fouling load on the membrane in future operations.
4. Conclusions
The potential of membrane-based processes, particularly the integrated UF and RO approach, in addressing the challenges of wastewater management within the sugar production industry was investigated at lab scale with native byproduct stream from a sugar refinery.
The results demonstrated that pre-treatment with tight UF membranes with a MWCO of 5 kDa significantly improved RO performance, allowing for a remarkable reduction in permeate conductivity with 0,428 mS/cm and stable flux conditions at around 60 kg/m2.h, which represents a water yield of 25 % based on the feed stream even with a first try—further optimization can be considered.
The fouling along the length of the flat membrane surface during RO membrane (at the entrance, middle, and end) was analyzed by FTIR, RAMAN, and EDX to understand the type and location of fouling. Understanding the type and location of fouling is crucial for developing strategies that mitigate its impact and optimize membrane performance in industrial applications.
Overall, the results highlight a shift in fouling mechanisms along the membrane: from organic and colloidal fouling at the entrance to predominantly inorganic scaling in the middle and end sections. This information can be used to optimize pre-treatment processes and cleaning strategies, such as targeting organic removal before the membrane and using antiscalants or pH adjustment to mitigate scaling along the membrane length.
Acknowledgments
The authors would like to express sincere gratitude to Alexander Trischack for his valuable assistance in editing and formatting this manuscript. His meticulous attention to detail and support contributed significantly to the final version of the paper. Also, the authors would like to express sincere gratitude to Bernhard Seidl for his support in analysis of the samples with SEM and EDX.
References
- Žbontar Zver L, Glavič P. Water minimization in process industries: case study in beet sugar plant. Resour Conserv Recycl. 2005 Jan 1;43(2):133–45. [CrossRef]
- Uygan D, Cetin O, Alveroglu V, Sofuoglu A. Improvement of water saving and economic productivity based on quotation with sugar content of sugar beet using linear move sprinkler irrigation. Agric Water Manag. 2021 Sep 1;255:106989. [CrossRef]
- Schmid MT, Song H, Raschbauer M, Emerstorfer F, Omann M, Stelzer F, et al. Utilization of desugarized sugar beet molasses for the production of poly(3-hydroxybutyrate) by halophilic Bacillus megaterium uyuni S29. Process Biochemistry. 2019 Nov 1;86:9–15. [CrossRef]
- Hassan N, Henke S, Hinková A, Pour V, Bubník Z. Molasses separation using improved SMB distributor. J Food Eng. 2016 Mar 1;172:19–24. [CrossRef]
- Magowo WE, Sheridan C, Rumbold K. Global Co-occurrence of Acid Mine Drainage and Organic Rich Industrial and Domestic Effluent: Biological sulfate reduction as a co-treatment-option. Journal of Water Process Engineering. 2020 Dec 1;38:101650. [CrossRef]
- Blagojev N, Kukić D, Vasić V, Šćiban M, Prodanović J, Bera O. A new approach for modelling and optimization of Cu(II) biosorption from aqueous solutions using sugar beet shreds in a fixed-bed column. J Hazard Mater. 2019 Feb 5;363:366–75. [CrossRef]
- He JT, Xia SX, Li W, Deng J, Lin QL, Zhang L. Resource recovery and valorization of food wastewater for sustainable development: An overview of current approaches. J Environ Manage. 2023 Dec 1;347:119118. [CrossRef]
- Urbaniec K, Klemeš J. Water and energy management in the sugar industry. Handbook of Water and Energy Management in Food Processing. 2008 Jan 1;863–84. [CrossRef]
- Fida S, Yasmeen M, Adnan R, Zeeshan M. Treatment methods for sugar rich wastewater: A review. Cleaner Water [Internet]. 2025 Jun 1 [cited 2025 Jun 3];3:100067. Available from: https://linkinghub.elsevier.com/retrieve/pii/S2950263225000055. [CrossRef]
- Fida S, Yasmeen M, Adnan R, Zeeshan M. Treatment methods for sugar rich wastewater: A review. Cleaner Water [Internet]. 2025 Jun 1 [cited 2025 Jun 4];3:100067. Available from: https://linkinghub.elsevier.com/retrieve/pii/S2950263225000055. [CrossRef]
- Gonçales Filho M, Nunhes TV, Barbosa LCFM, de Campos FC, de Oliveira OJ. Opportunities and challenges for the use of cleaner production to reduce water consumption in Brazilian sugar-energy plants. J Clean Prod. 2018 Jun 10;186:353–63. [CrossRef]
- Hanumanthappa S, Eshanna MS, Dinakar RH, Babu D V., Kannan DA. Treatment of sugar industry wastewater by two dimensional (2D) ECC and sono-ECC (US-ECC): Sludge analyses. Journal of Water Process Engineering. 2024 Sep 1;66:106095. [CrossRef]
- Chen TH, Kao YH, Shen YY, Fan CS, Hou CH. Pilot-scale membrane capacitive deionization for water reclamation: Commissioning, performance benchmarking, and long-term assessment. Desalination. 2025 Apr 15;599:118428. [CrossRef]
- Prihartini Aryanti PT, Nugroho FA, Lugito G, Khoiruddin K. Tight ultrafiltration membranes: Advancing separation technologies for water and wastewater treatment. Sep Purif Technol. 2025 Sep 7;367:132892. [CrossRef]
- Xie Y, Yuan K, Luo B, Feng H, Bao X, Ma J. Osmotic membranes for municipal wastewater reclamation: Insights into applications, transmembrane diffusion mechanisms and prospects. Chinese Chemical Letters. 2025 Jul 1;36(7):110443. [CrossRef]
- Li J, Cheng W, Wang H, Luo Y, Liu Q, Wang X, et al. Reverse osmosis and nanofiltration processes in industrial wastewater treatment: The recent progress, challenge, and future opportunity. Sep Purif Technol. 2025 Jul 30;362:131687. [CrossRef]
- Cassano A, Basile A. Membranes for industrial microfiltration and ultrafiltration. Advanced Membrane Science and Technology for Sustainable Energy and Environmental Applications. 2011 Jan 1;647–79. [CrossRef]
- Chu HC, Campbell JS, Light WG. High-temperature reverse osmosis membrane element. Desalination. 1988 Nov 1;70(1–3):65–76. [CrossRef]
- Hinkova A, Bubník Z, Kadlec P, Pridal J. Potentials of separation membranes in the sugar industry. Sep Purif Technol. 2002 Jan 1;26(1):101–10. [CrossRef]
- Gul S, Ahmed AEG, Harasek M. Beet Sugar Pulp-Press Water Treatment: A Comparison of Nanofiltration and Reverse Osmosis Processes. Procedia Eng. 2012 Jan 1;44:634. [CrossRef]
- Tayeh YA, Alazaiza MYD, Alzghoul TM, Bashir MJ. A comprehensive review of RO membrane fouling: Mechanisms, categories, cleaning methods and pretreatment technologies. Journal of Hazardous Materials Advances. 2025 May 1;18:100684. [CrossRef]
- Najid N, Hakizimana JN, Kouzbour S, Gourich B, Ruiz-García A, Vial C, et al. Fouling control and modeling in reverse osmosis for seawater desalination: A review. Comput Chem Eng. 2022 Jun 1;162:107794. [CrossRef]
- Hatziantoniou D, Howell JA. Influence of the properties and characteristics of sugar-beet pulp extract on its fouling and rejection behaviour during membrane filtration. Desalination. 2002 Sep 10;148(1–3):67–72. [CrossRef]
- Alonso-Vázquez P, Isola A, Sánchez-Arévalo CM, Cuartas-Uribe B, Vincent-Vela MC, Álvarez-Blanco S. Concentration of phenolic compounds from an orange peel waste extract using a combination of ultrafiltration and forward osmosis. Sep Purif Technol. 2025 Jul 8;360:131228. [CrossRef]
- Moreira VR, Moser PB, Guimarães RN, Amaral MCS. Ultrafiltration and reverse osmosis integrated to conventional drinking water treatment to ensure human right to water in dam break scenarios: From bench- to pilot-scale. Sep Purif Technol. 2025 Jan 19;353:128429. [CrossRef]
- Wen T, Huang Q, Fang T, Xie C, Li M, Liu W, et al. Fouling of reverse osmosis membrane in sugar mill condensate purification under sub- and super-boundary flux conditions. J Environ Chem Eng [Internet]. 2024 Apr 1 [cited 2025 Jun 4];12(2):111974. Available from: https://www.sciencedirect.com/science/article/abs/pii/S2213343724001040. [CrossRef]
- Li W, Ling G, Lei F, Li N, Peng W, Li K, et al. Ceramic membrane fouling and cleaning during ultrafiltration of limed sugarcane juice. Sep Purif Technol. 2018 Jan 8;190:9–24. [CrossRef]
- Vrijenhoek EM, Hong S, Elimelech M. Influence of membrane surface properties on initial rate of colloidal fouling of reverse osmosis and nanofiltration membranes. J Memb Sci. 2001 Jun 30;188(1):115–28. [CrossRef]
- Yuan W, Chen X, Yu Z, Wan Y, Lin J, Ye W. Critical review of membrane fouling in reverse osmosis treatment: Characterizations, models, mechanisms, and controls. Sep Purif Technol. 2025 Aug 14;363:132119. [CrossRef]
- Jang D, Kim M, Choi H, Im S, Jang A. Fouling characteristics and cleaning strategies of reverse osmosis membranes at different stages in a wastewater reclamation process. Chemosphere. 2025 May 1;377:144352. [CrossRef]
- Salem M. Investigation of the presence of minerals on the lactic acid recovery using membrane technology. Wien; 2022. [CrossRef]
Figure 1.
Size exclusion chromatography (SEC) analysis of the by-product stream from the beet sugar industry.
Figure 1.
Size exclusion chromatography (SEC) analysis of the by-product stream from the beet sugar industry.
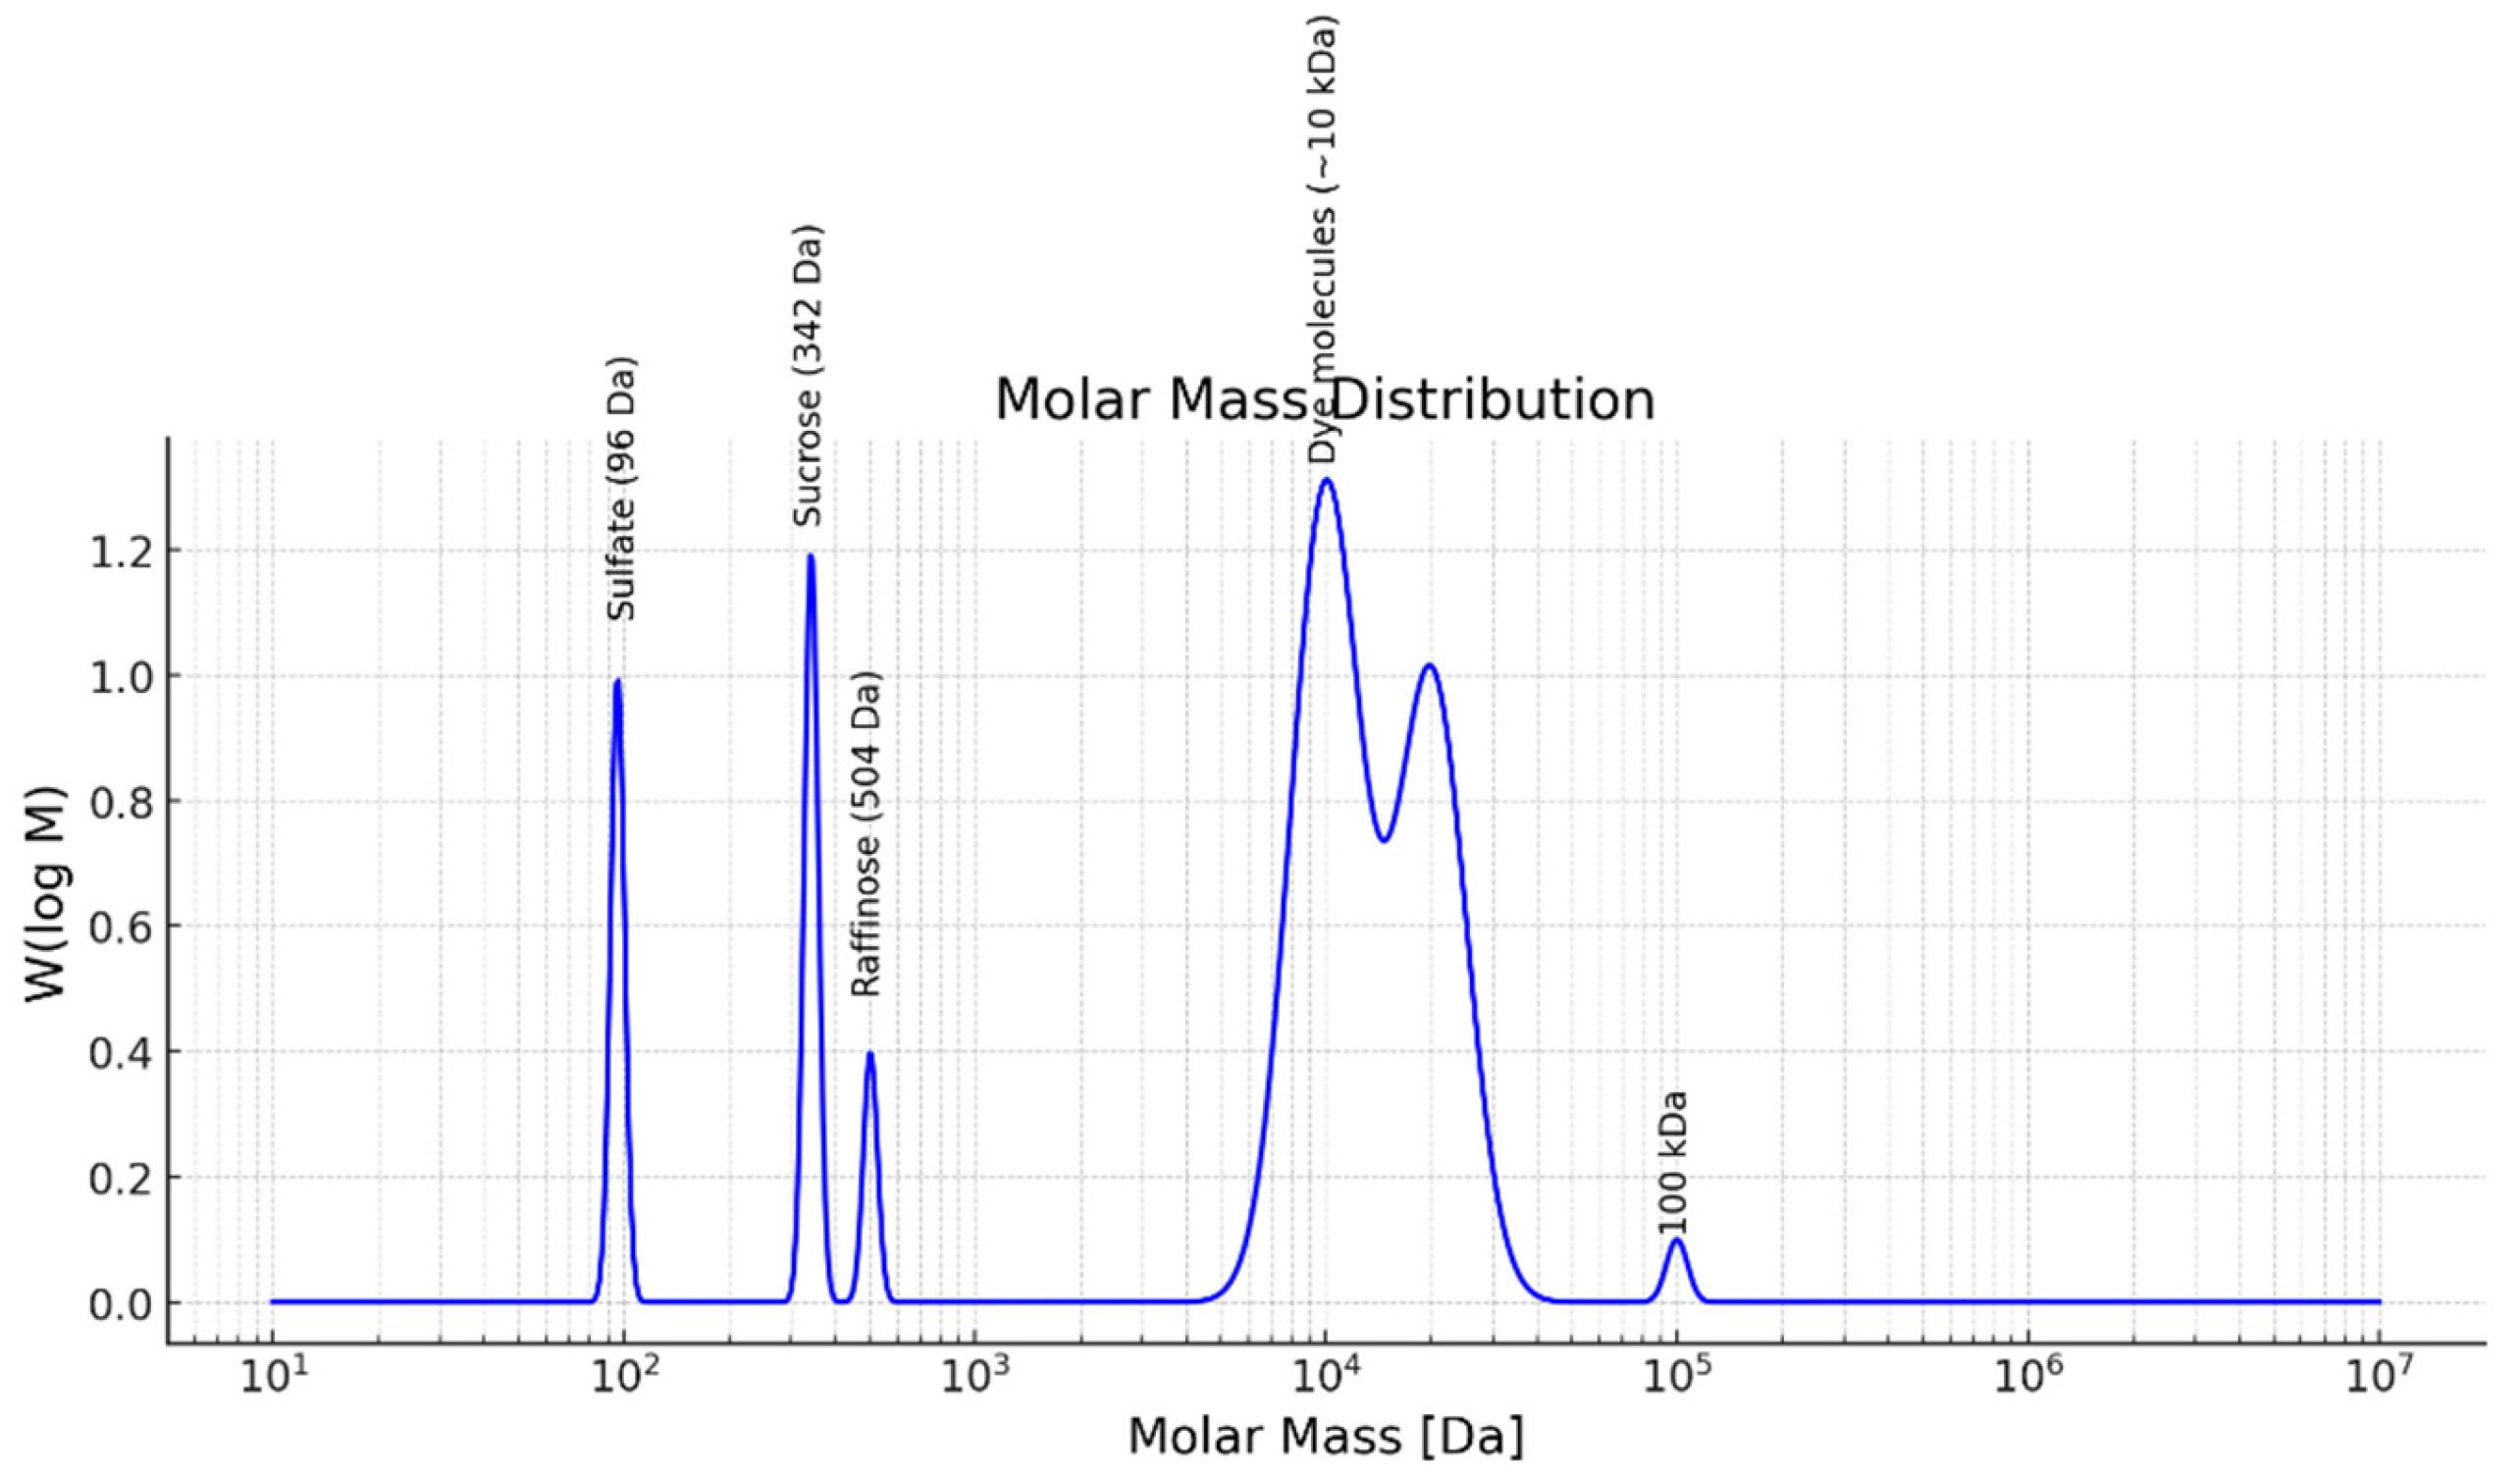
Figure 2.
Schema of membrane filtration unit (model OS-MC-01) [31].
Figure 2.
Schema of membrane filtration unit (model OS-MC-01) [31].
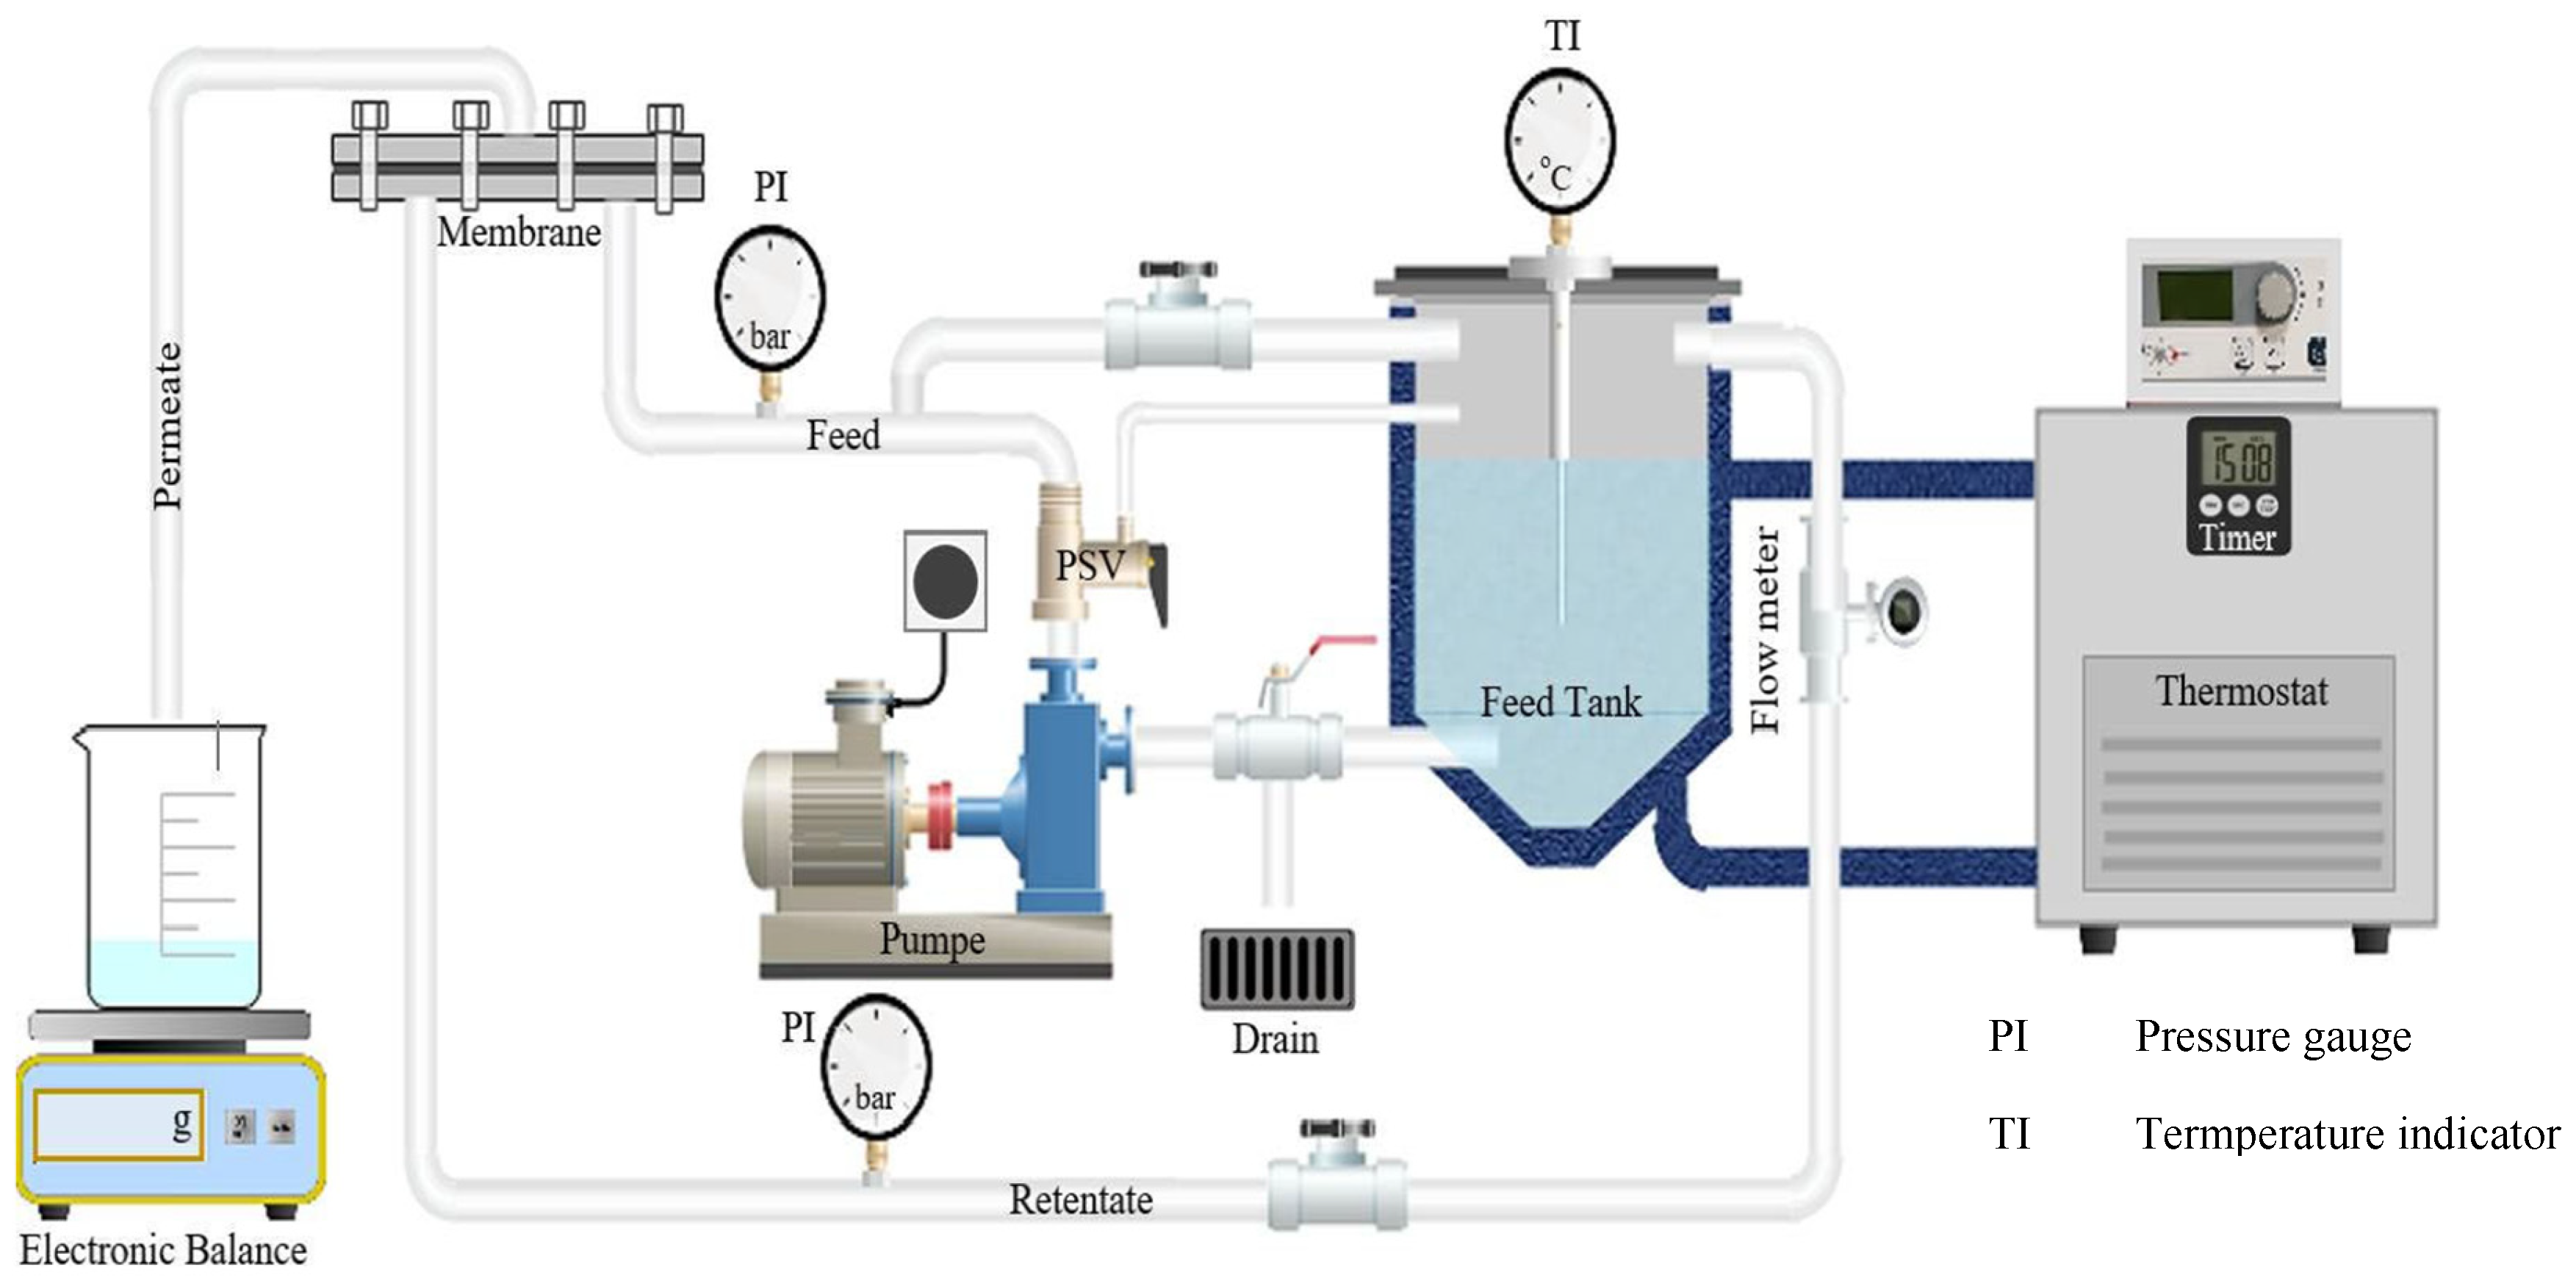
Figure 3.
SEC of UF membrane (Feed-Permeate-Retentate)—green line: feed, red line: retentate, black line: permeate.
Figure 3.
SEC of UF membrane (Feed-Permeate-Retentate)—green line: feed, red line: retentate, black line: permeate.
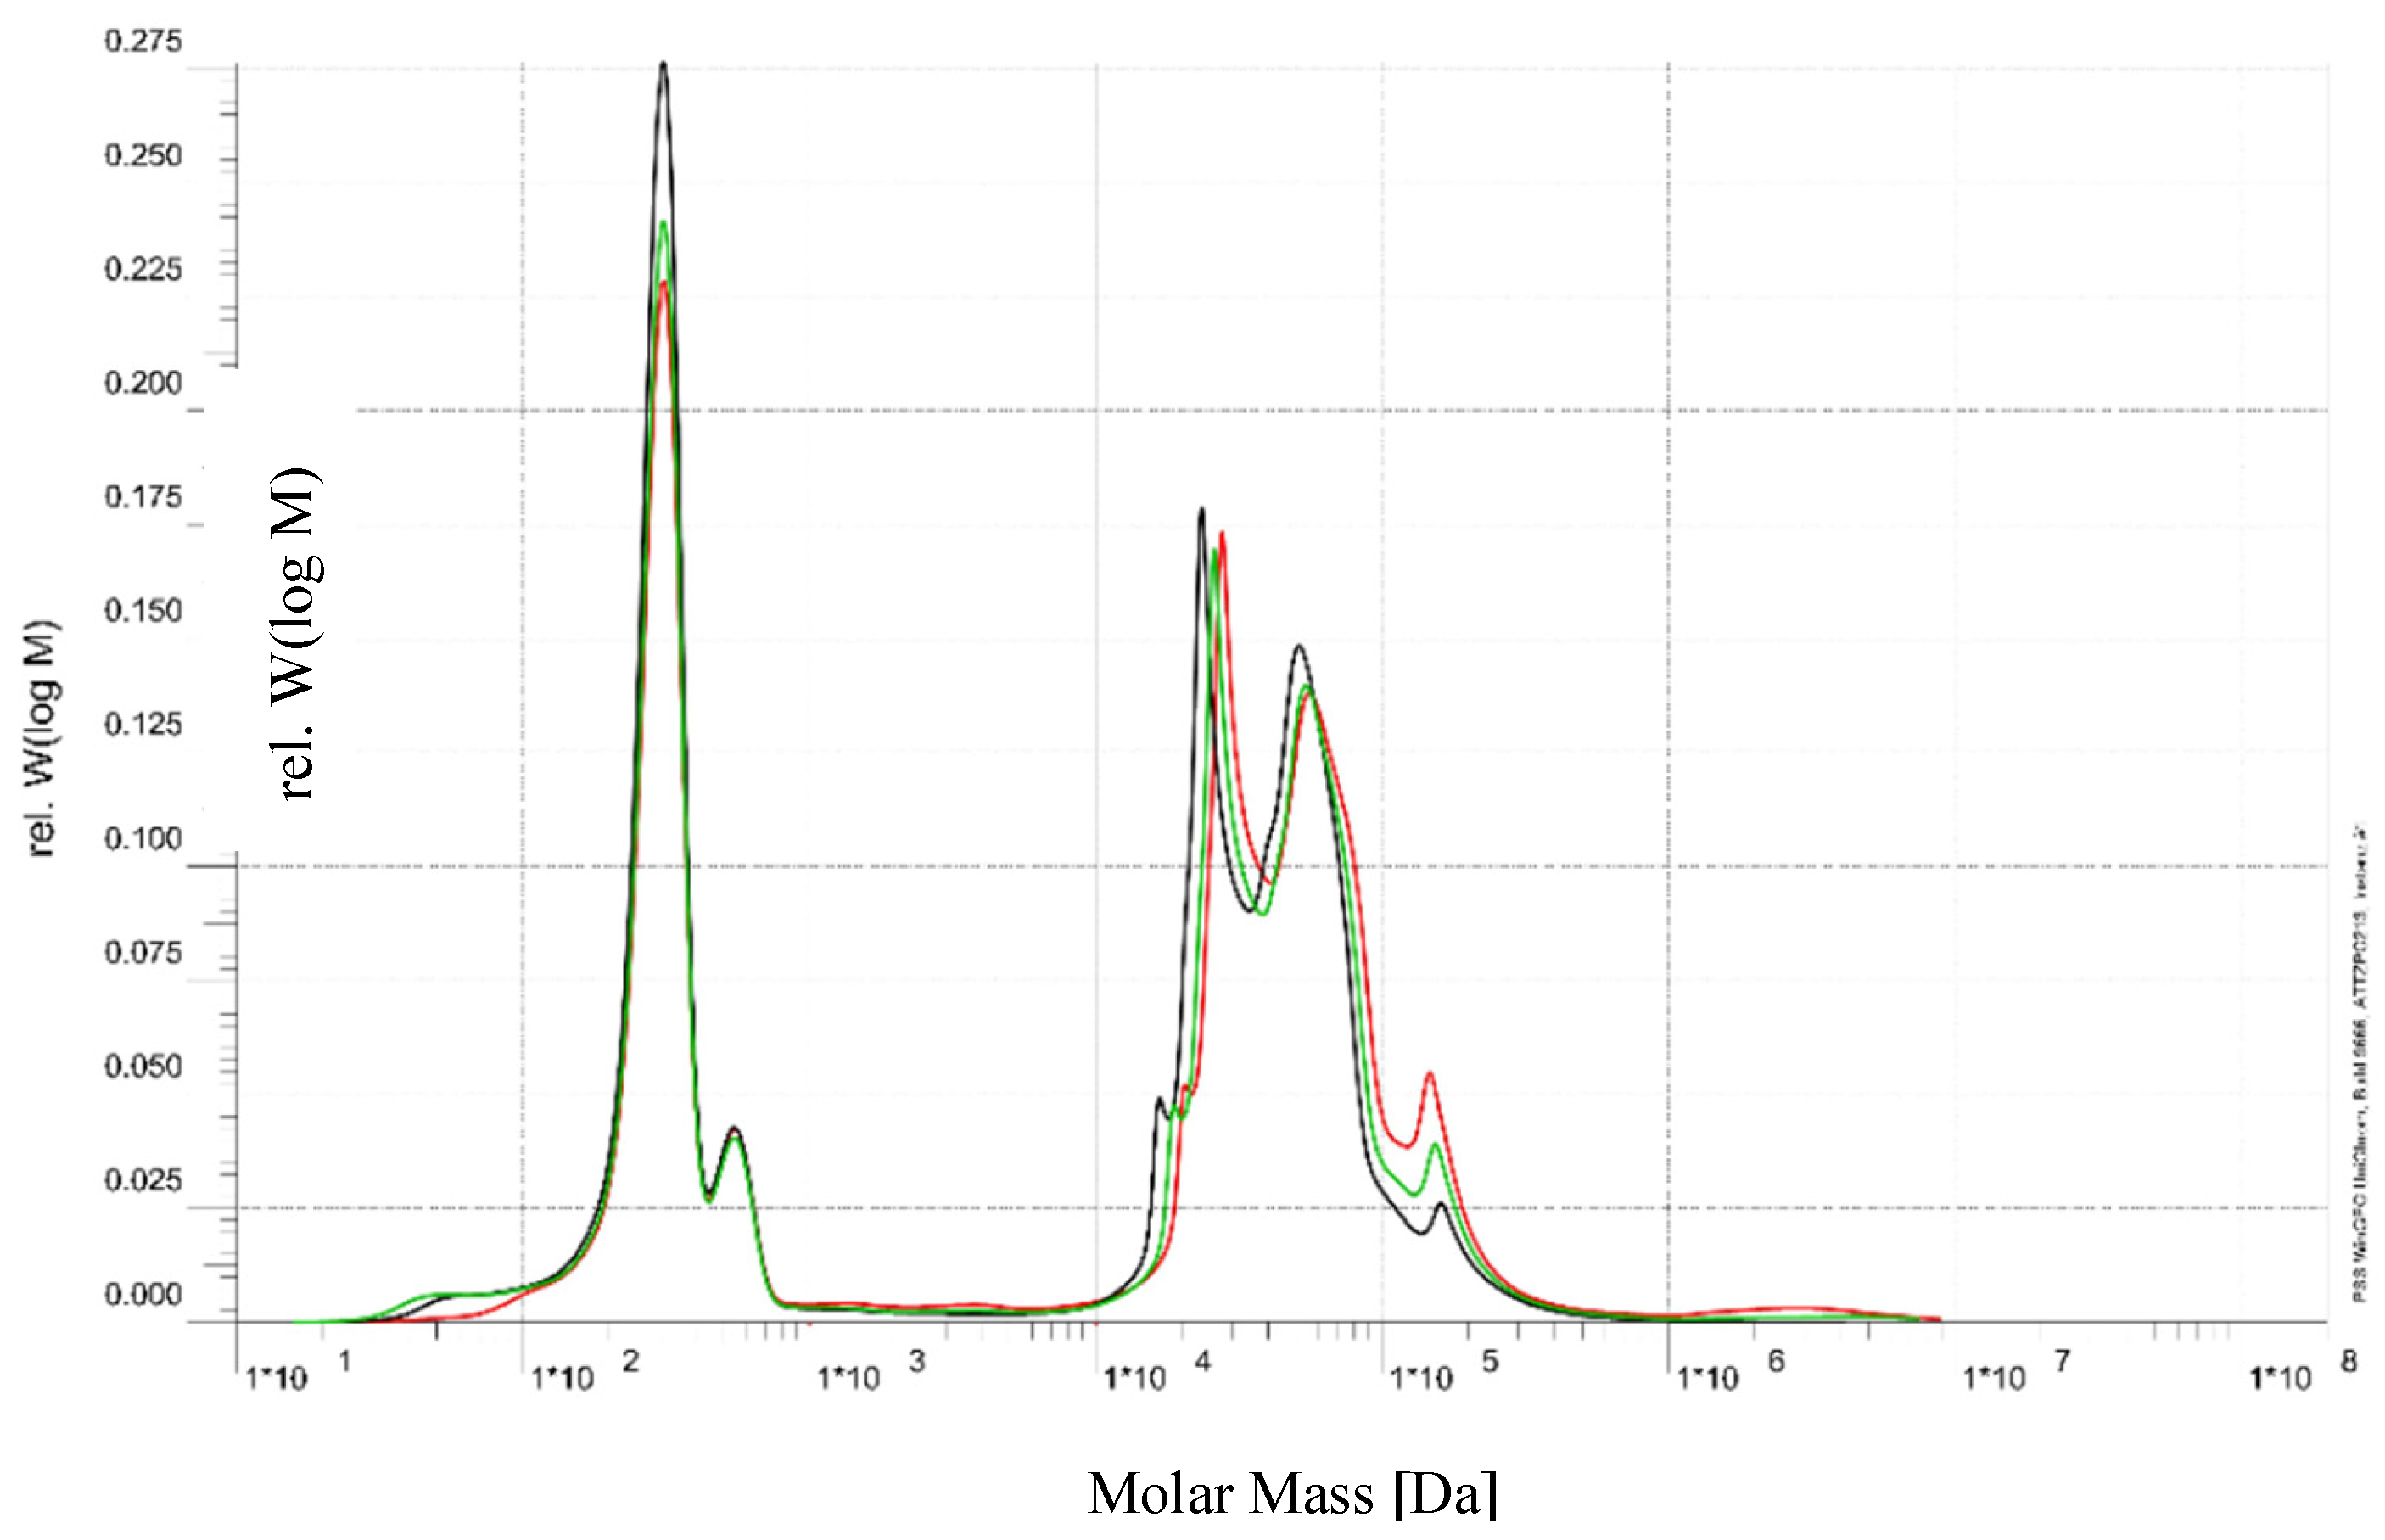
Figure 4.
Size exclusion chromatography (SEC) of RO membrane (Feed-Permeate-Retentate)—green line: feed, red line: permeate, black line: retentate.
Figure 4.
Size exclusion chromatography (SEC) of RO membrane (Feed-Permeate-Retentate)—green line: feed, red line: permeate, black line: retentate.
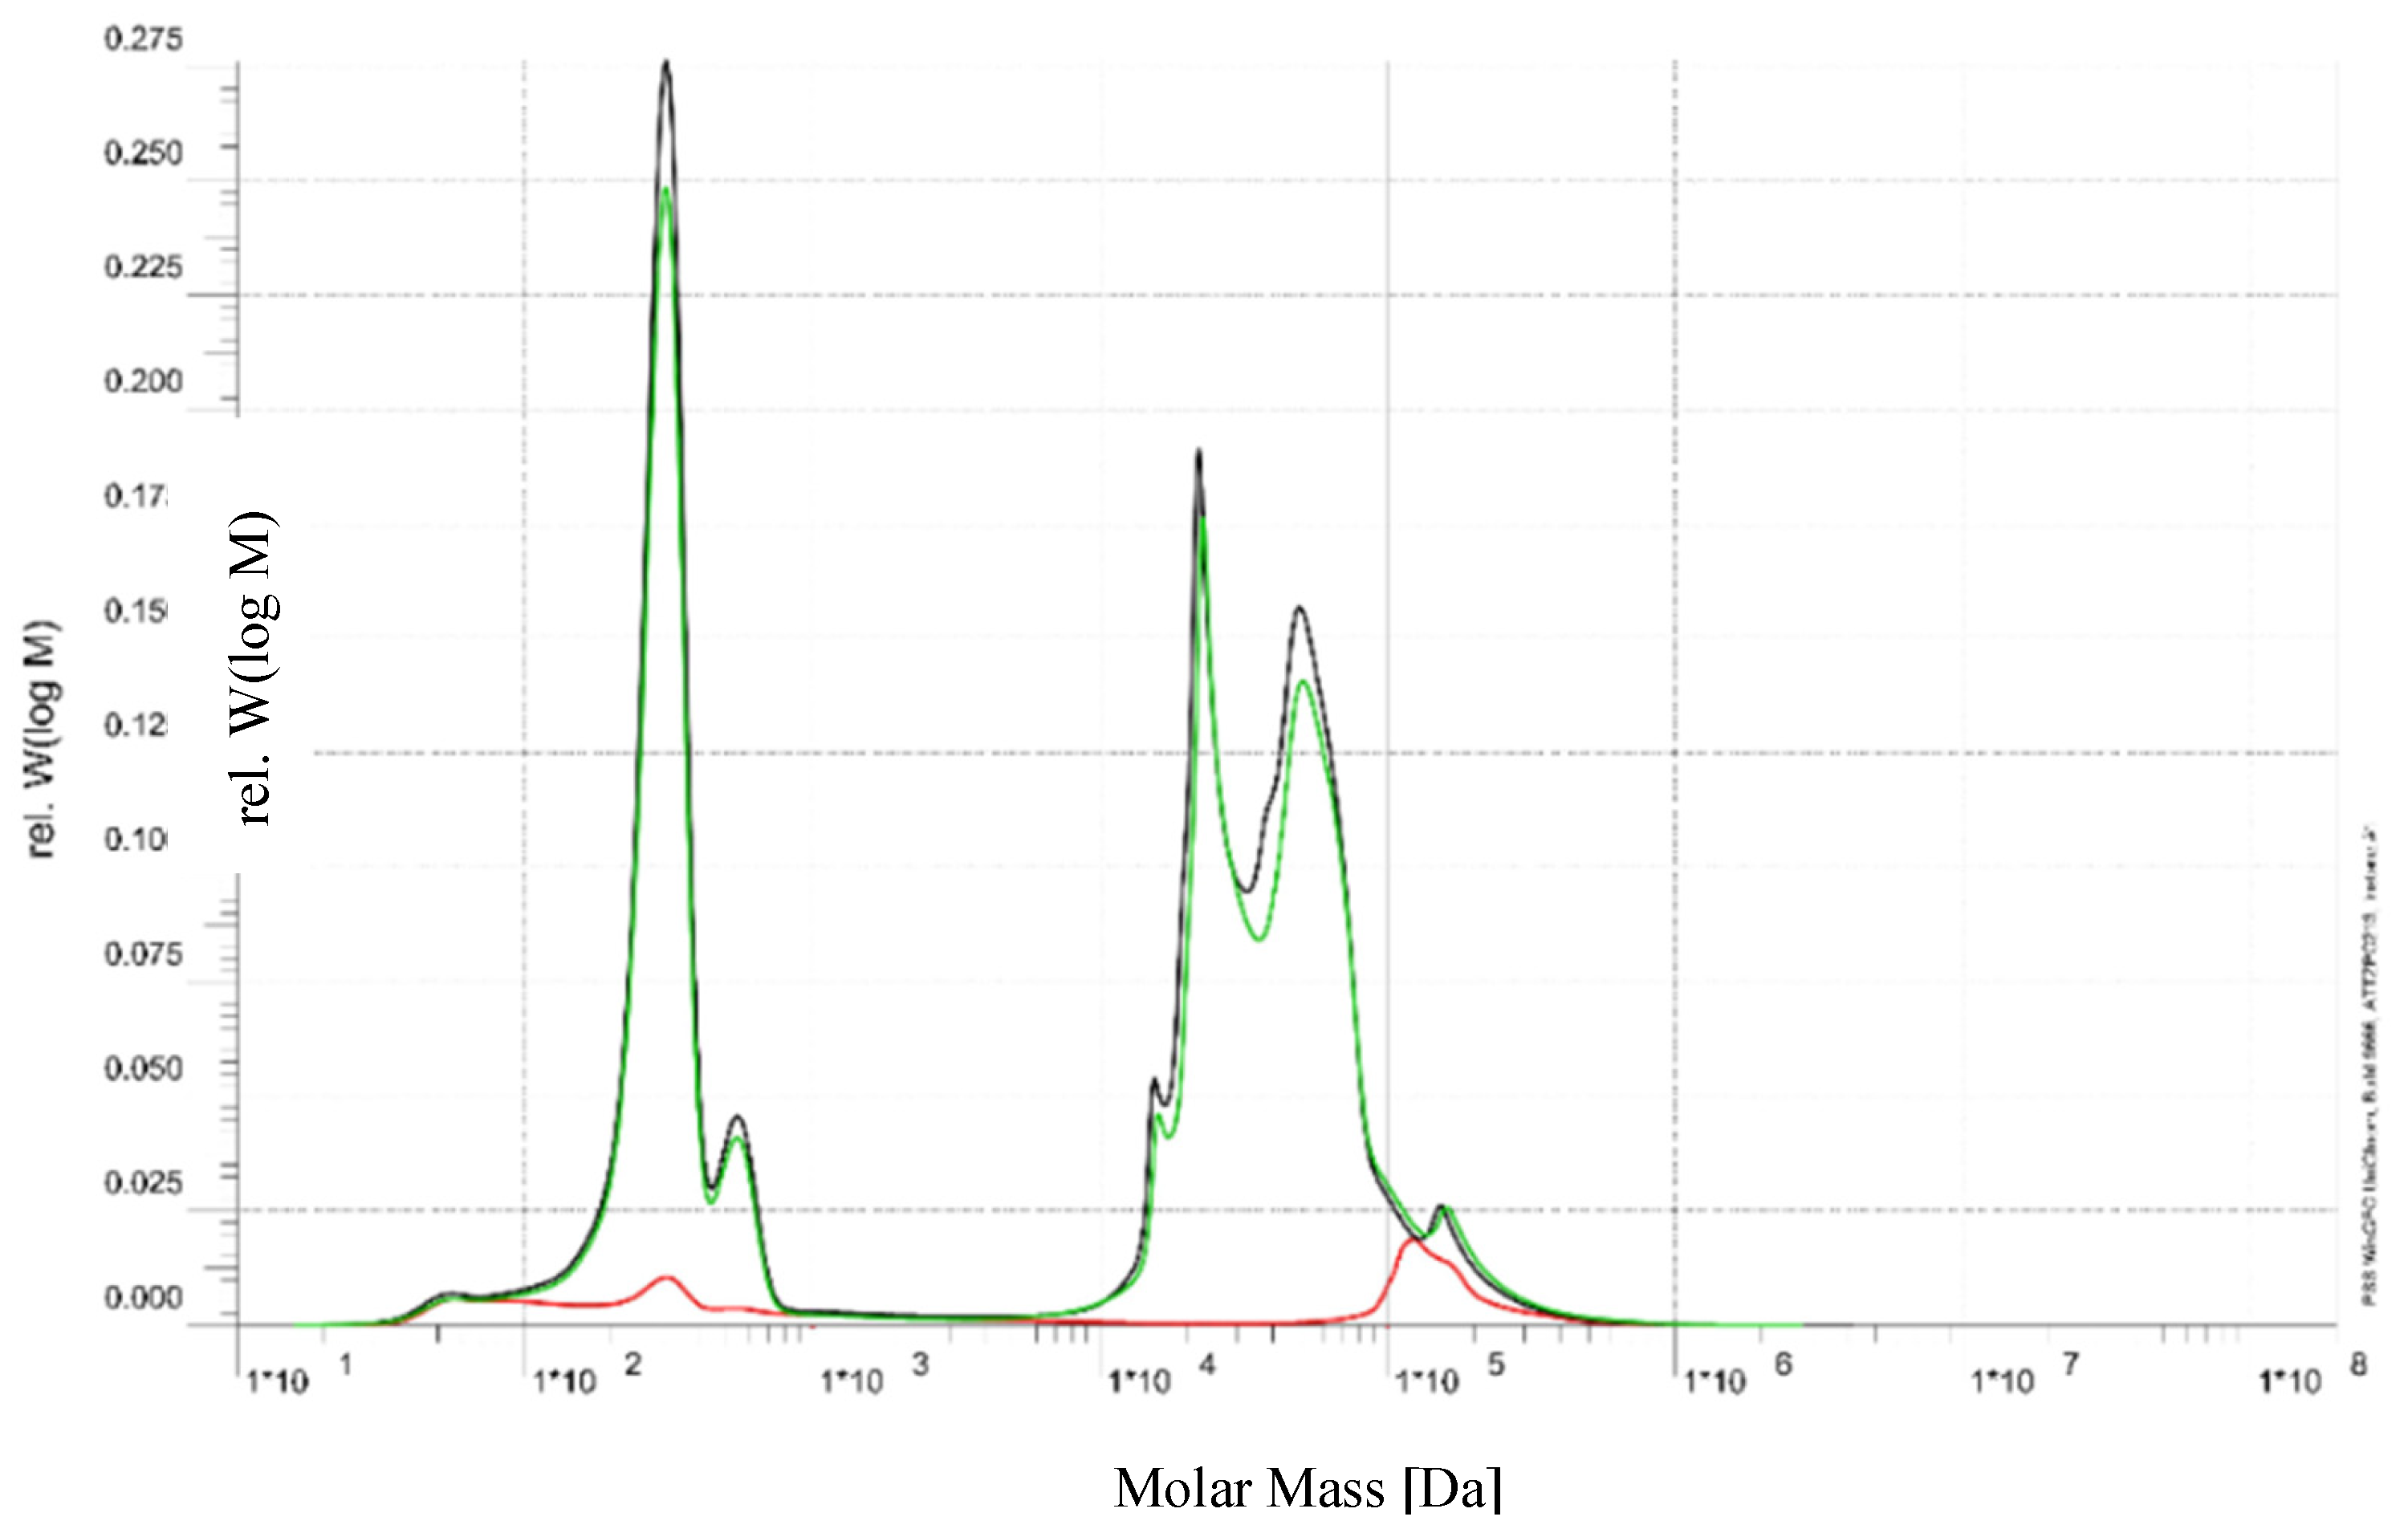
Figure 5.
The flux performance of an integrated membrane filtration system.
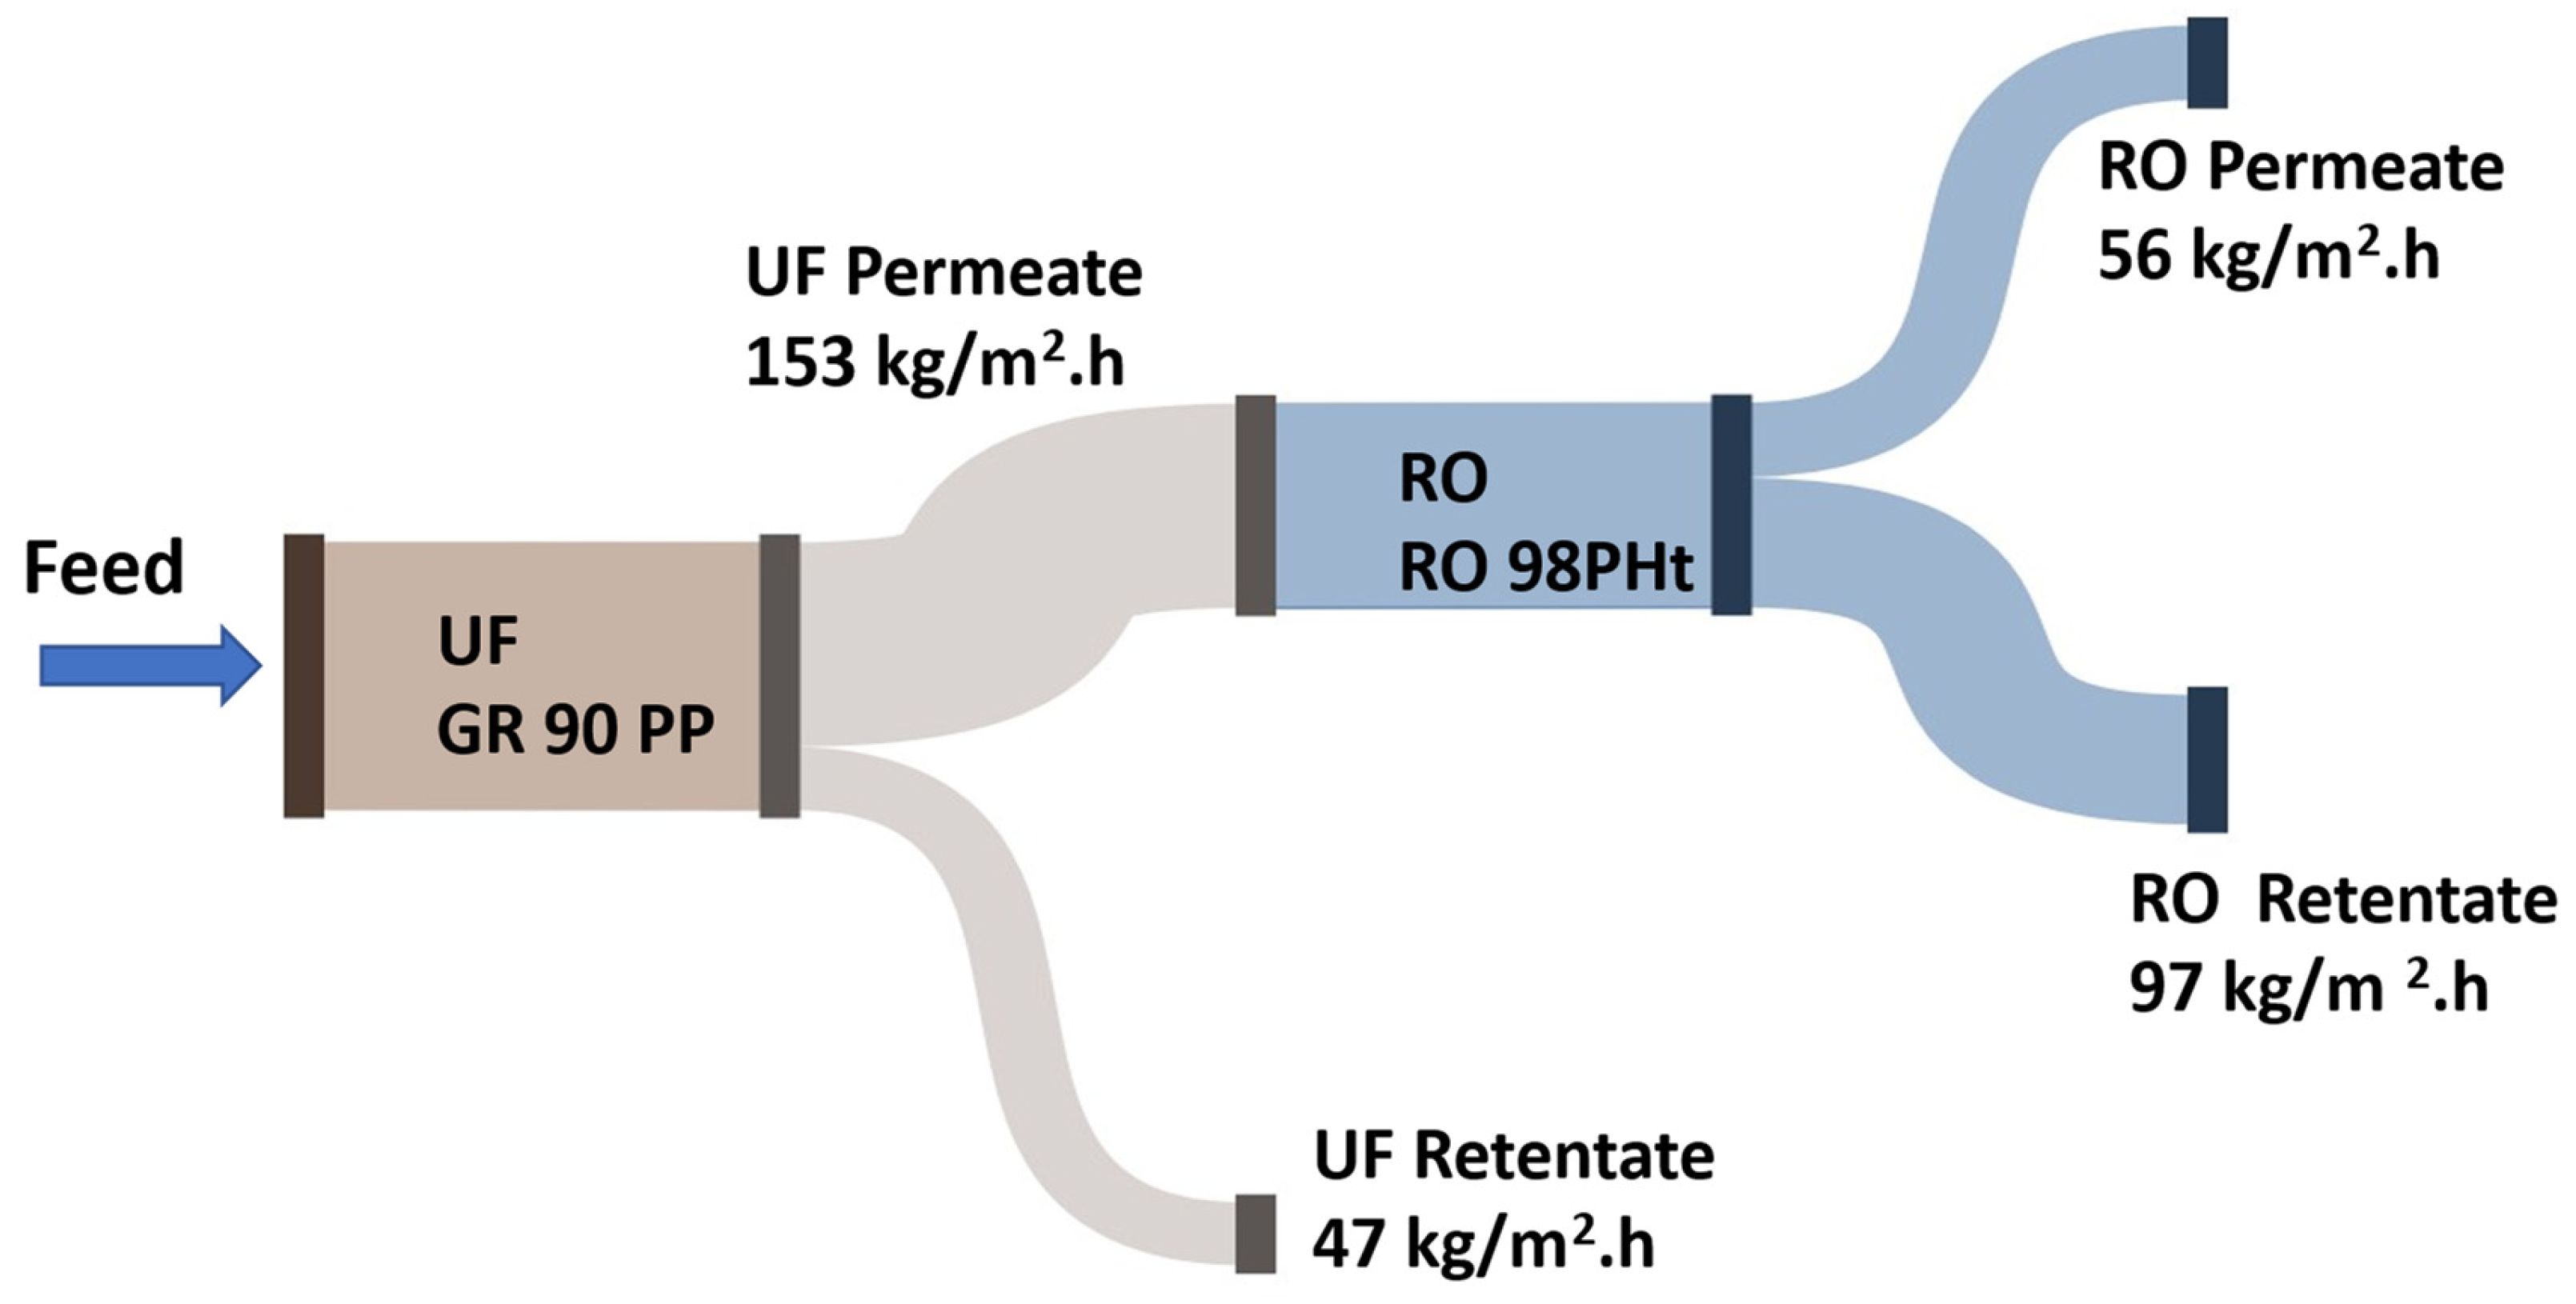
Figure 6.
Rejection of sugars and monovalent and bivalent ions by UF membrane.
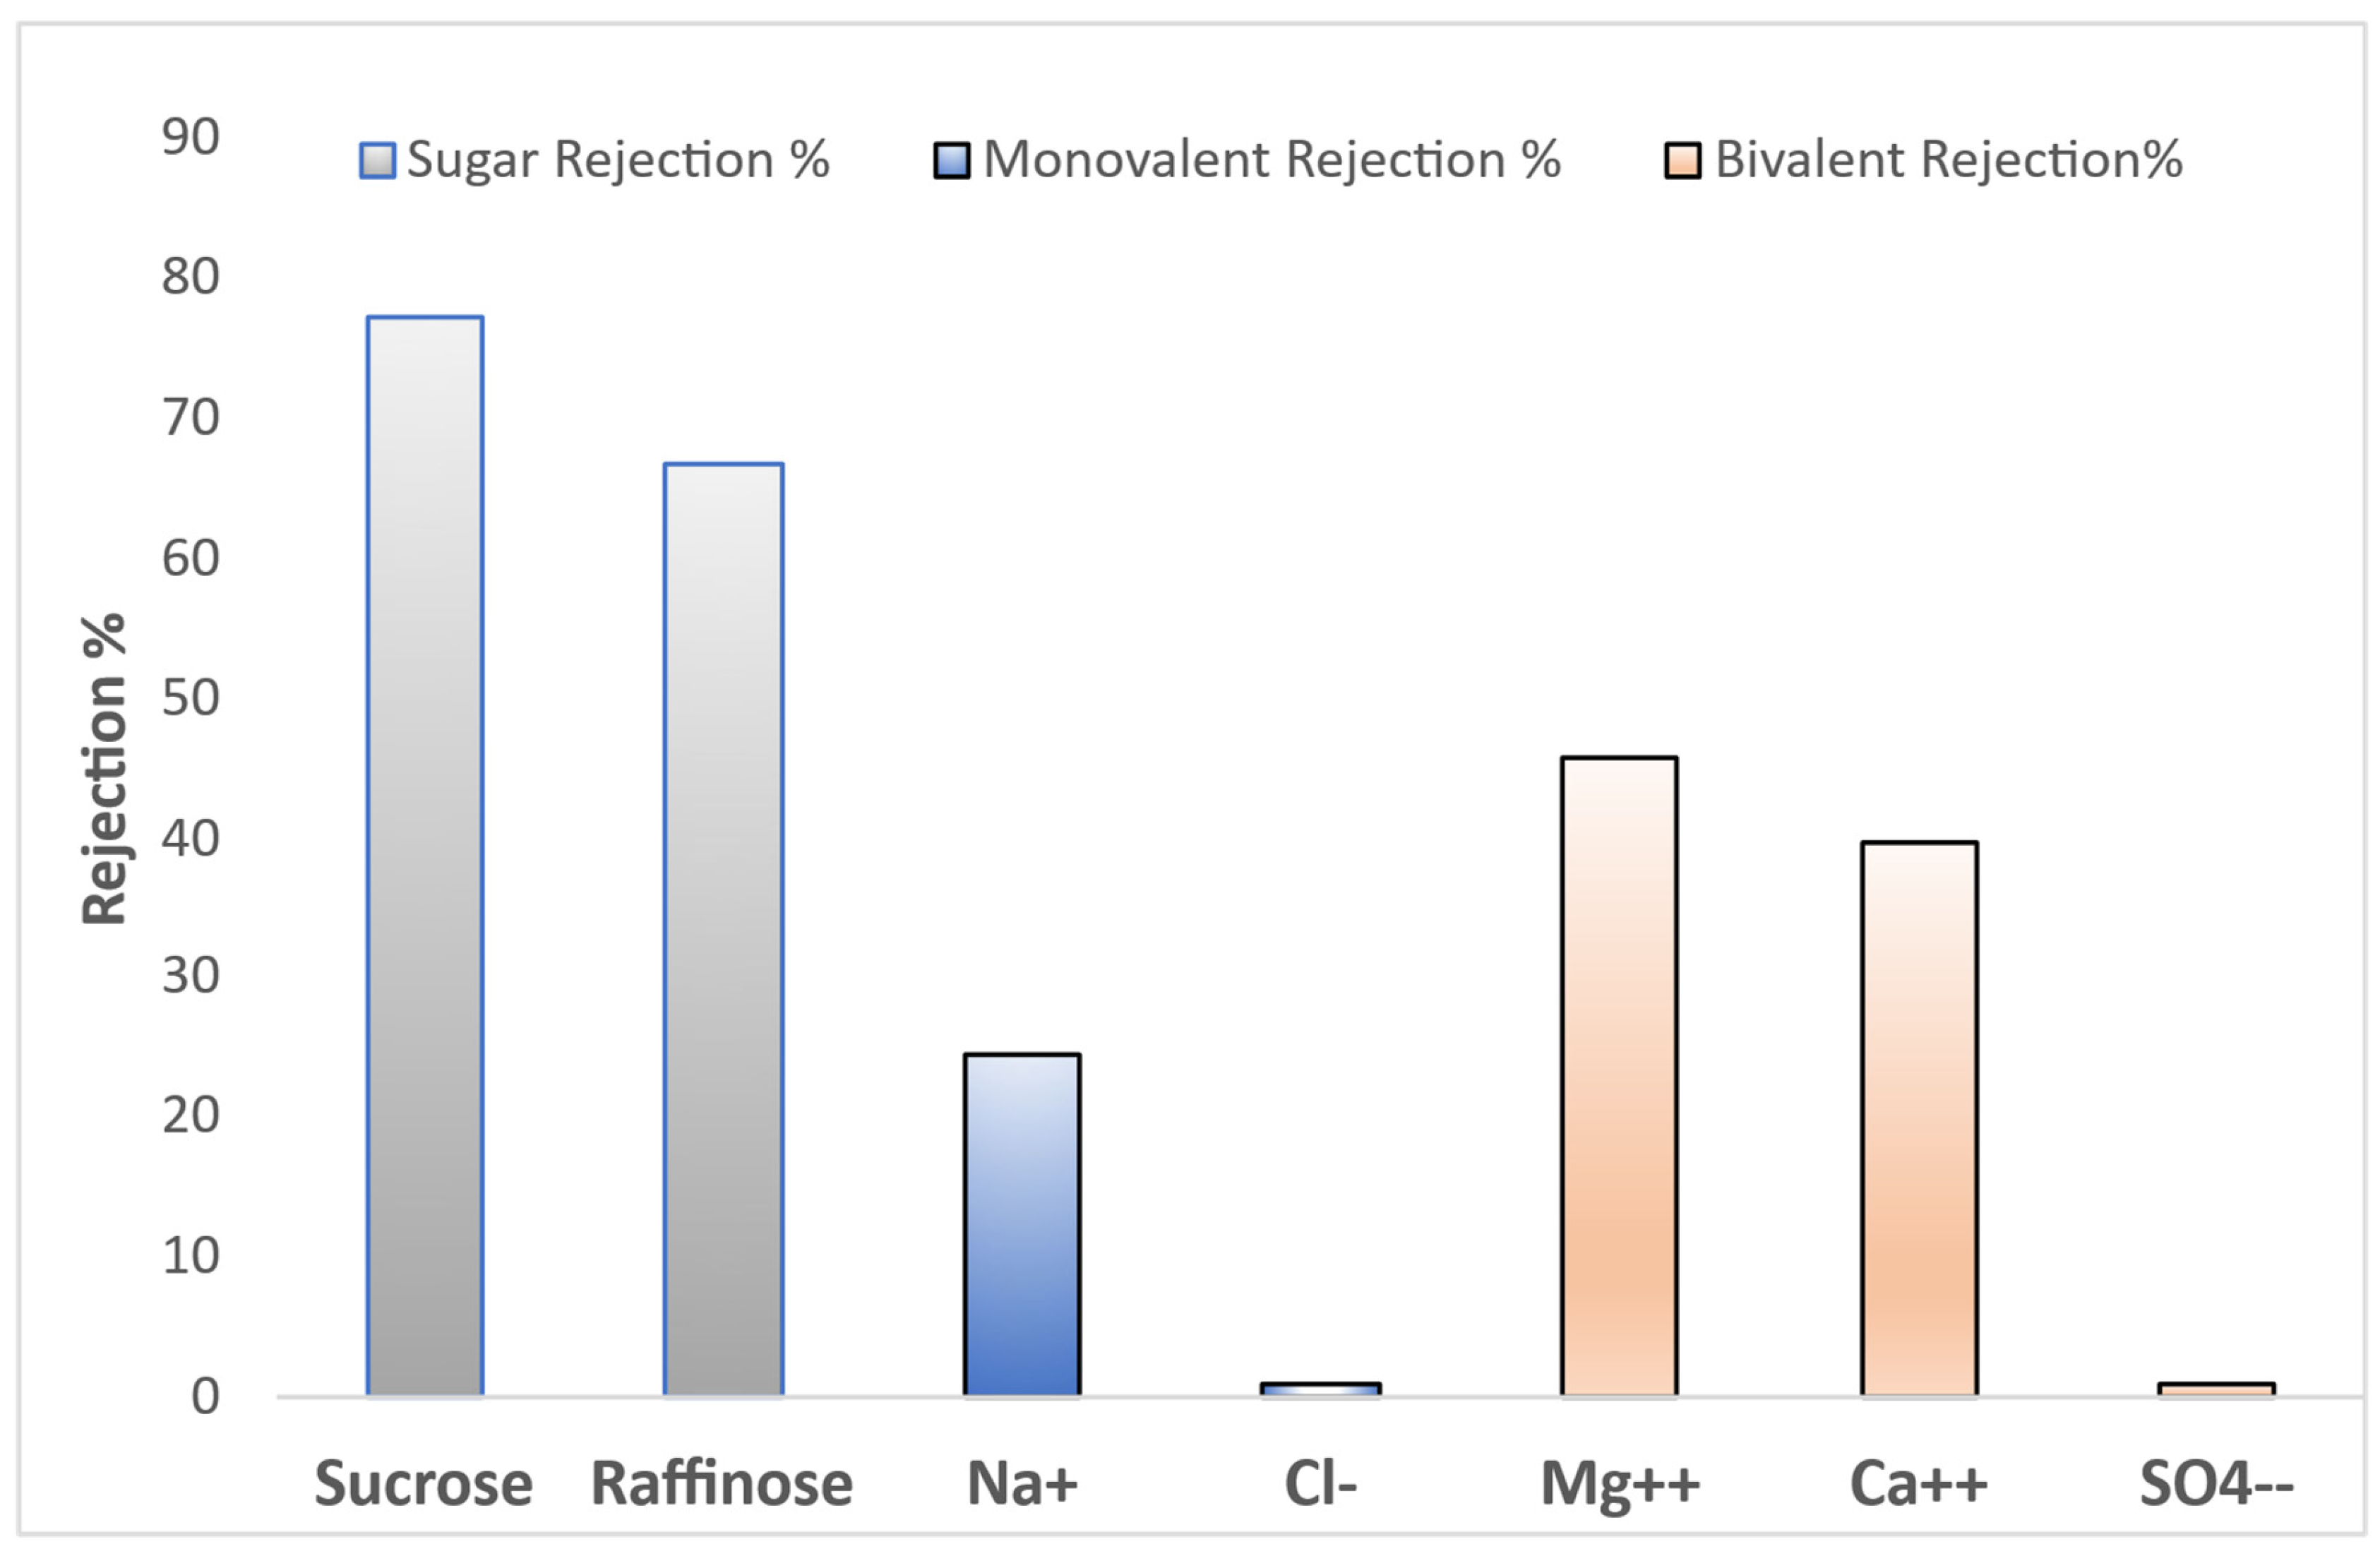
Figure 7.
FITR of UF membrane.
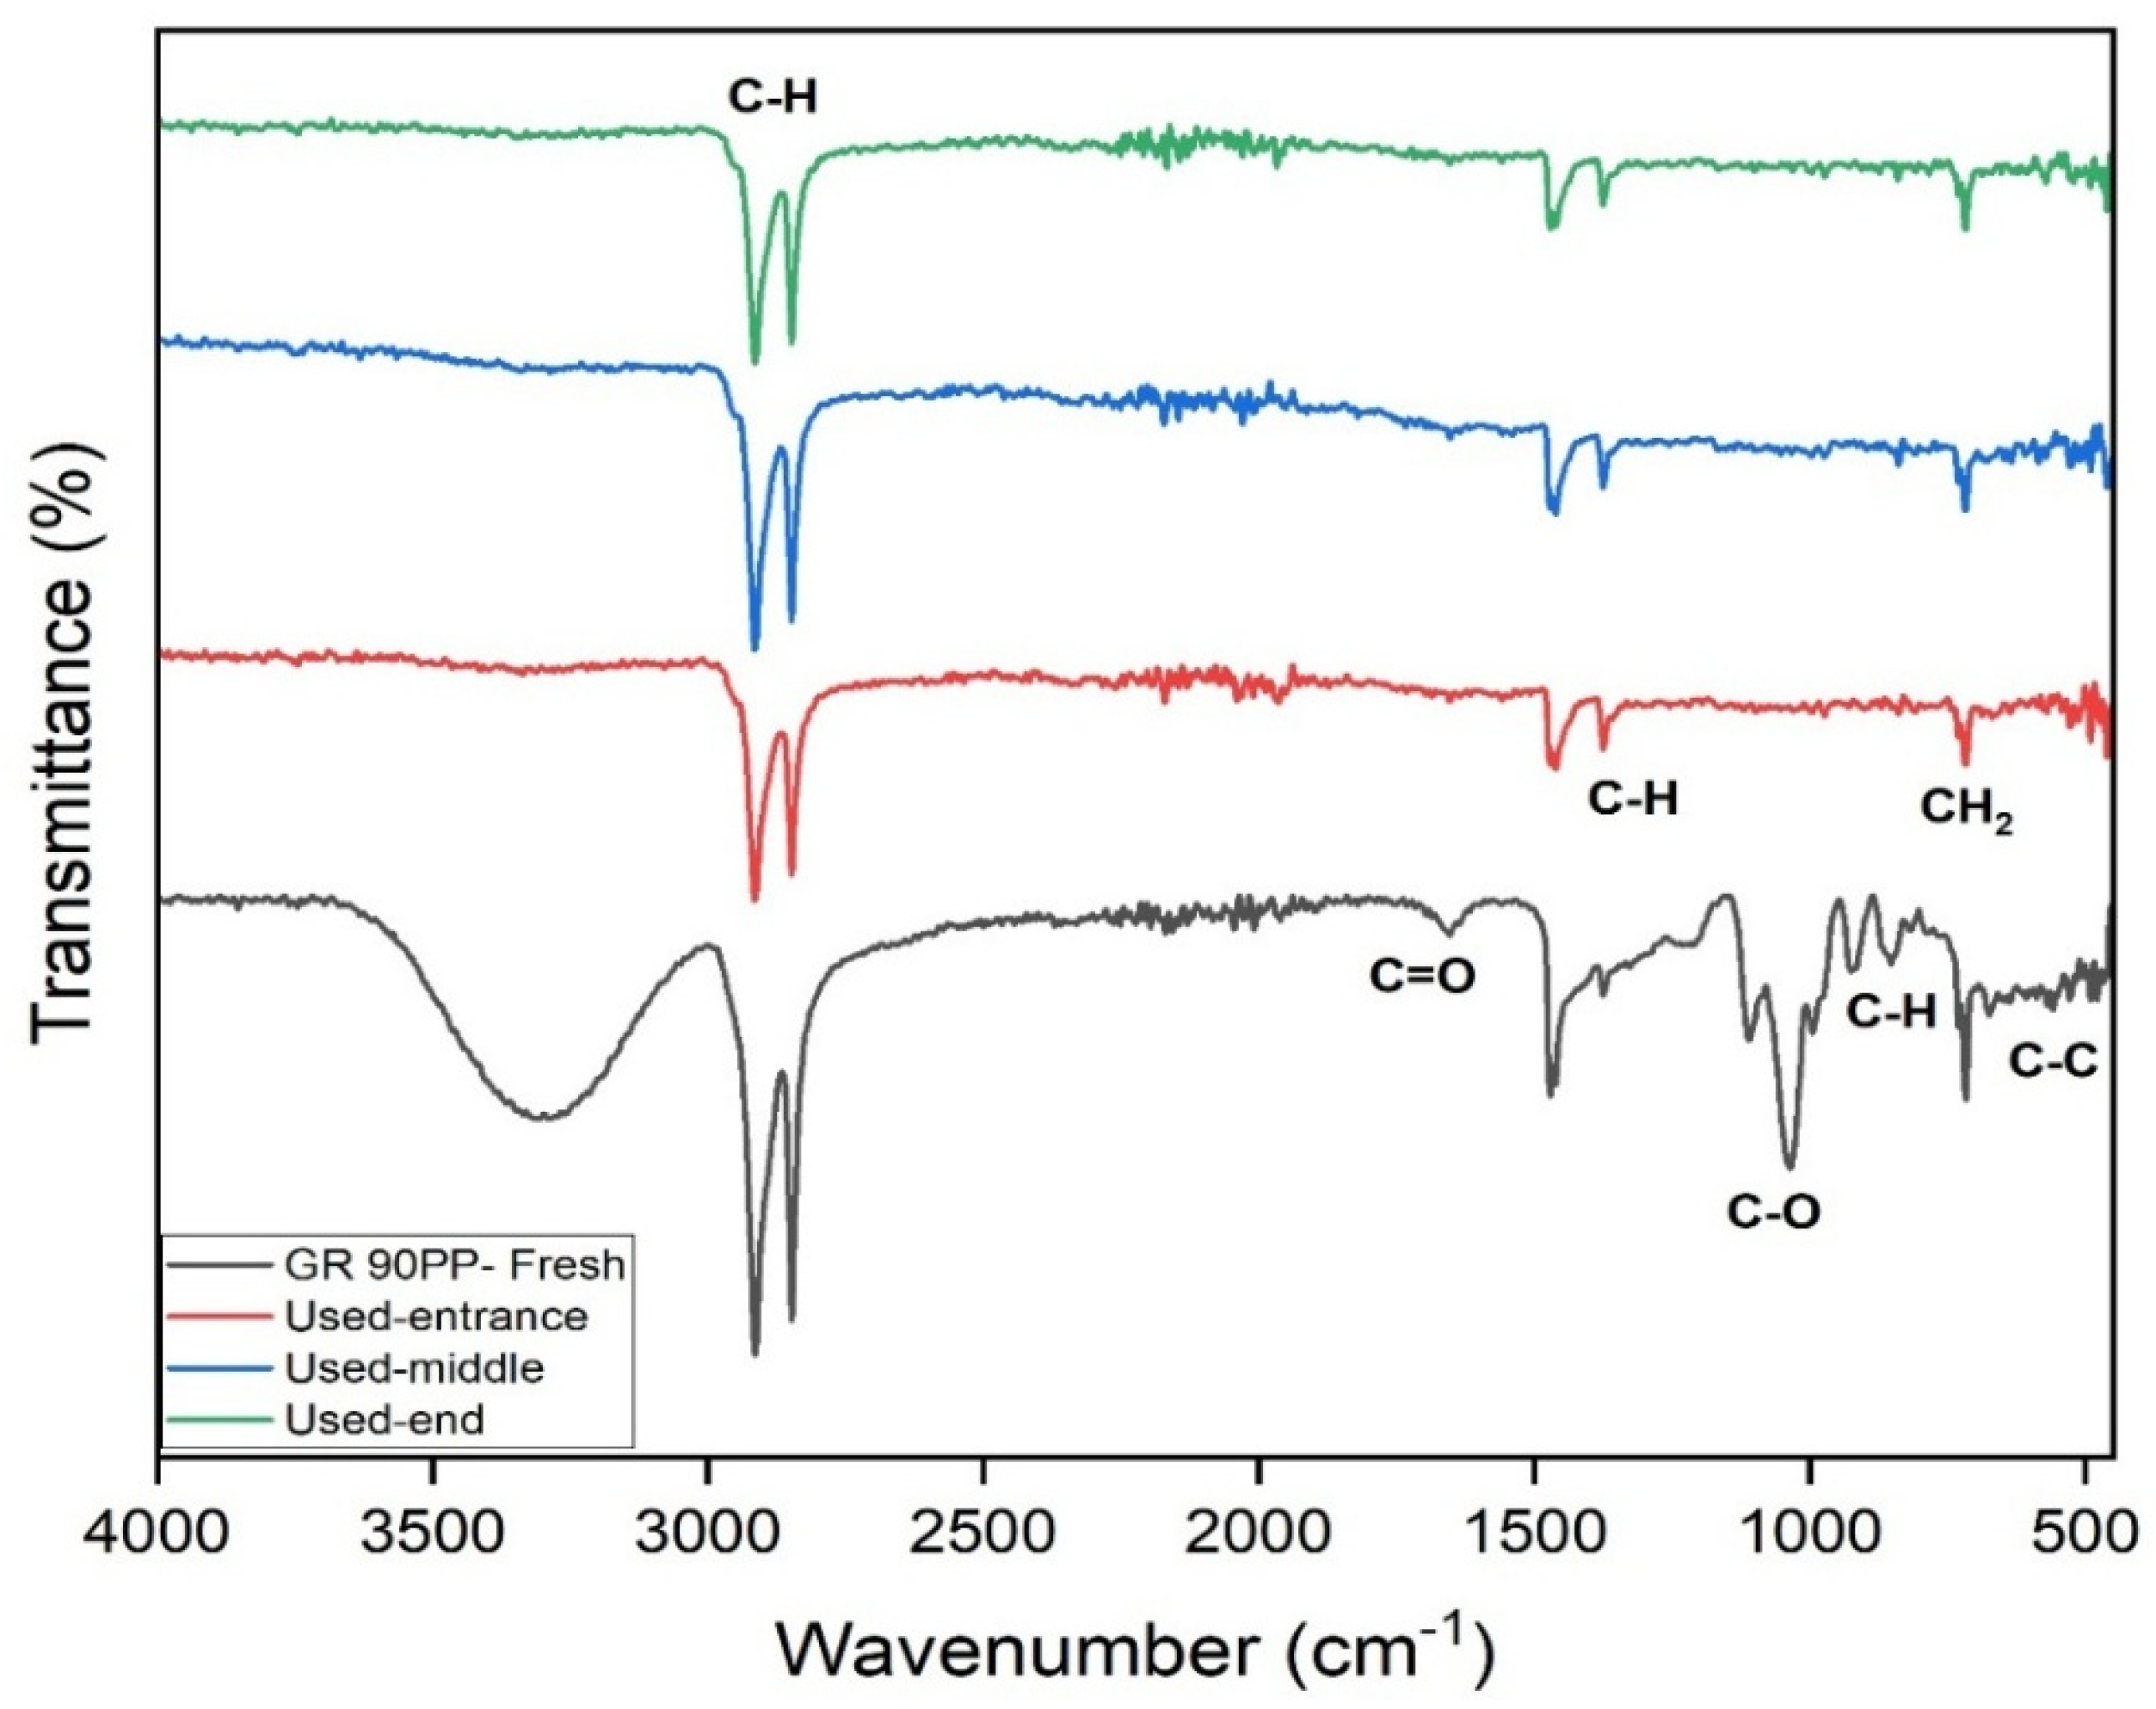
Figure 10.
SEM micrographs of UF membrane (GR90PP, 5 kDa) surface after treatment of beet sugar raffinate: (A) entrance section, (B) middle section, (C) end section.
Figure 10.
SEM micrographs of UF membrane (GR90PP, 5 kDa) surface after treatment of beet sugar raffinate: (A) entrance section, (B) middle section, (C) end section.
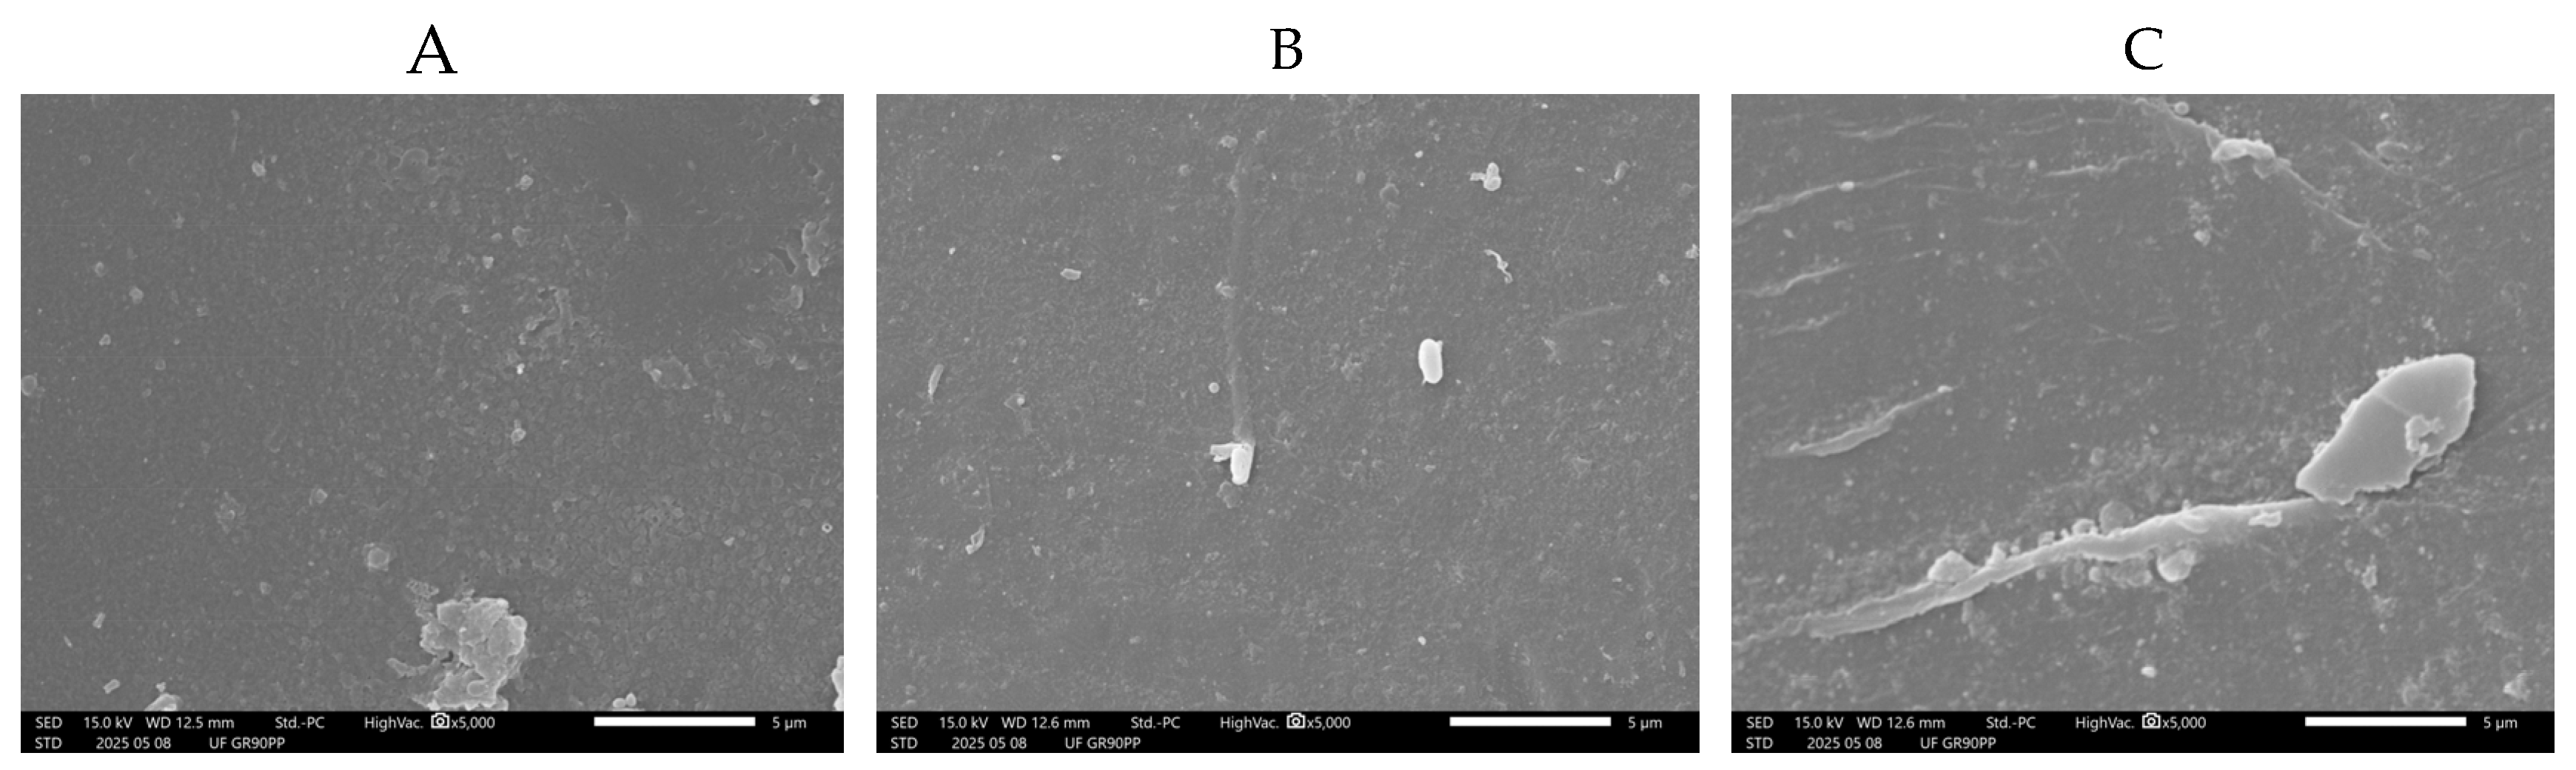
Figure 11.
SEM micrographs of RO membrane (RO 98PHt) surface after treatment of UF permeate derived from beet sugar industry effluent: (A) entrance section, (B) middle section, (C) end section.
Figure 11.
SEM micrographs of RO membrane (RO 98PHt) surface after treatment of UF permeate derived from beet sugar industry effluent: (A) entrance section, (B) middle section, (C) end section.
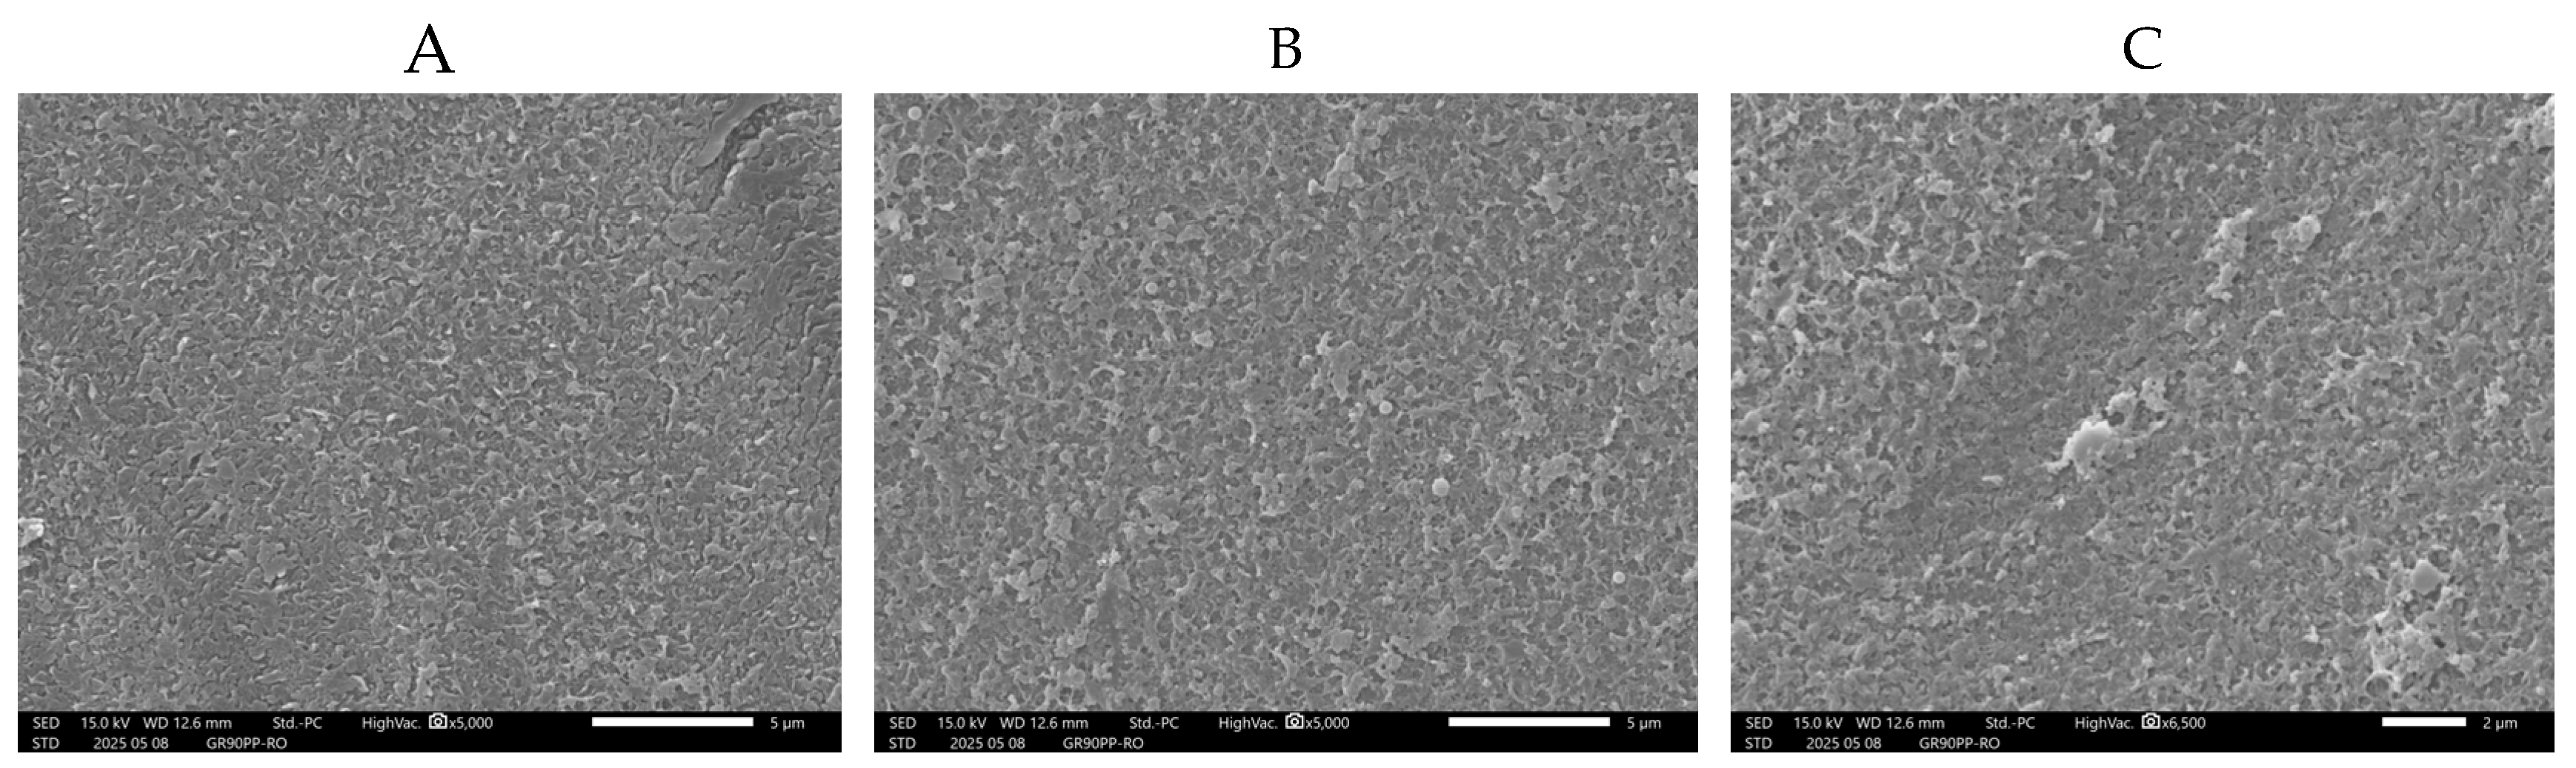
Figure 12.
Longitudinal fouling profile along RO membrane length based on SEM-EDX analysis.
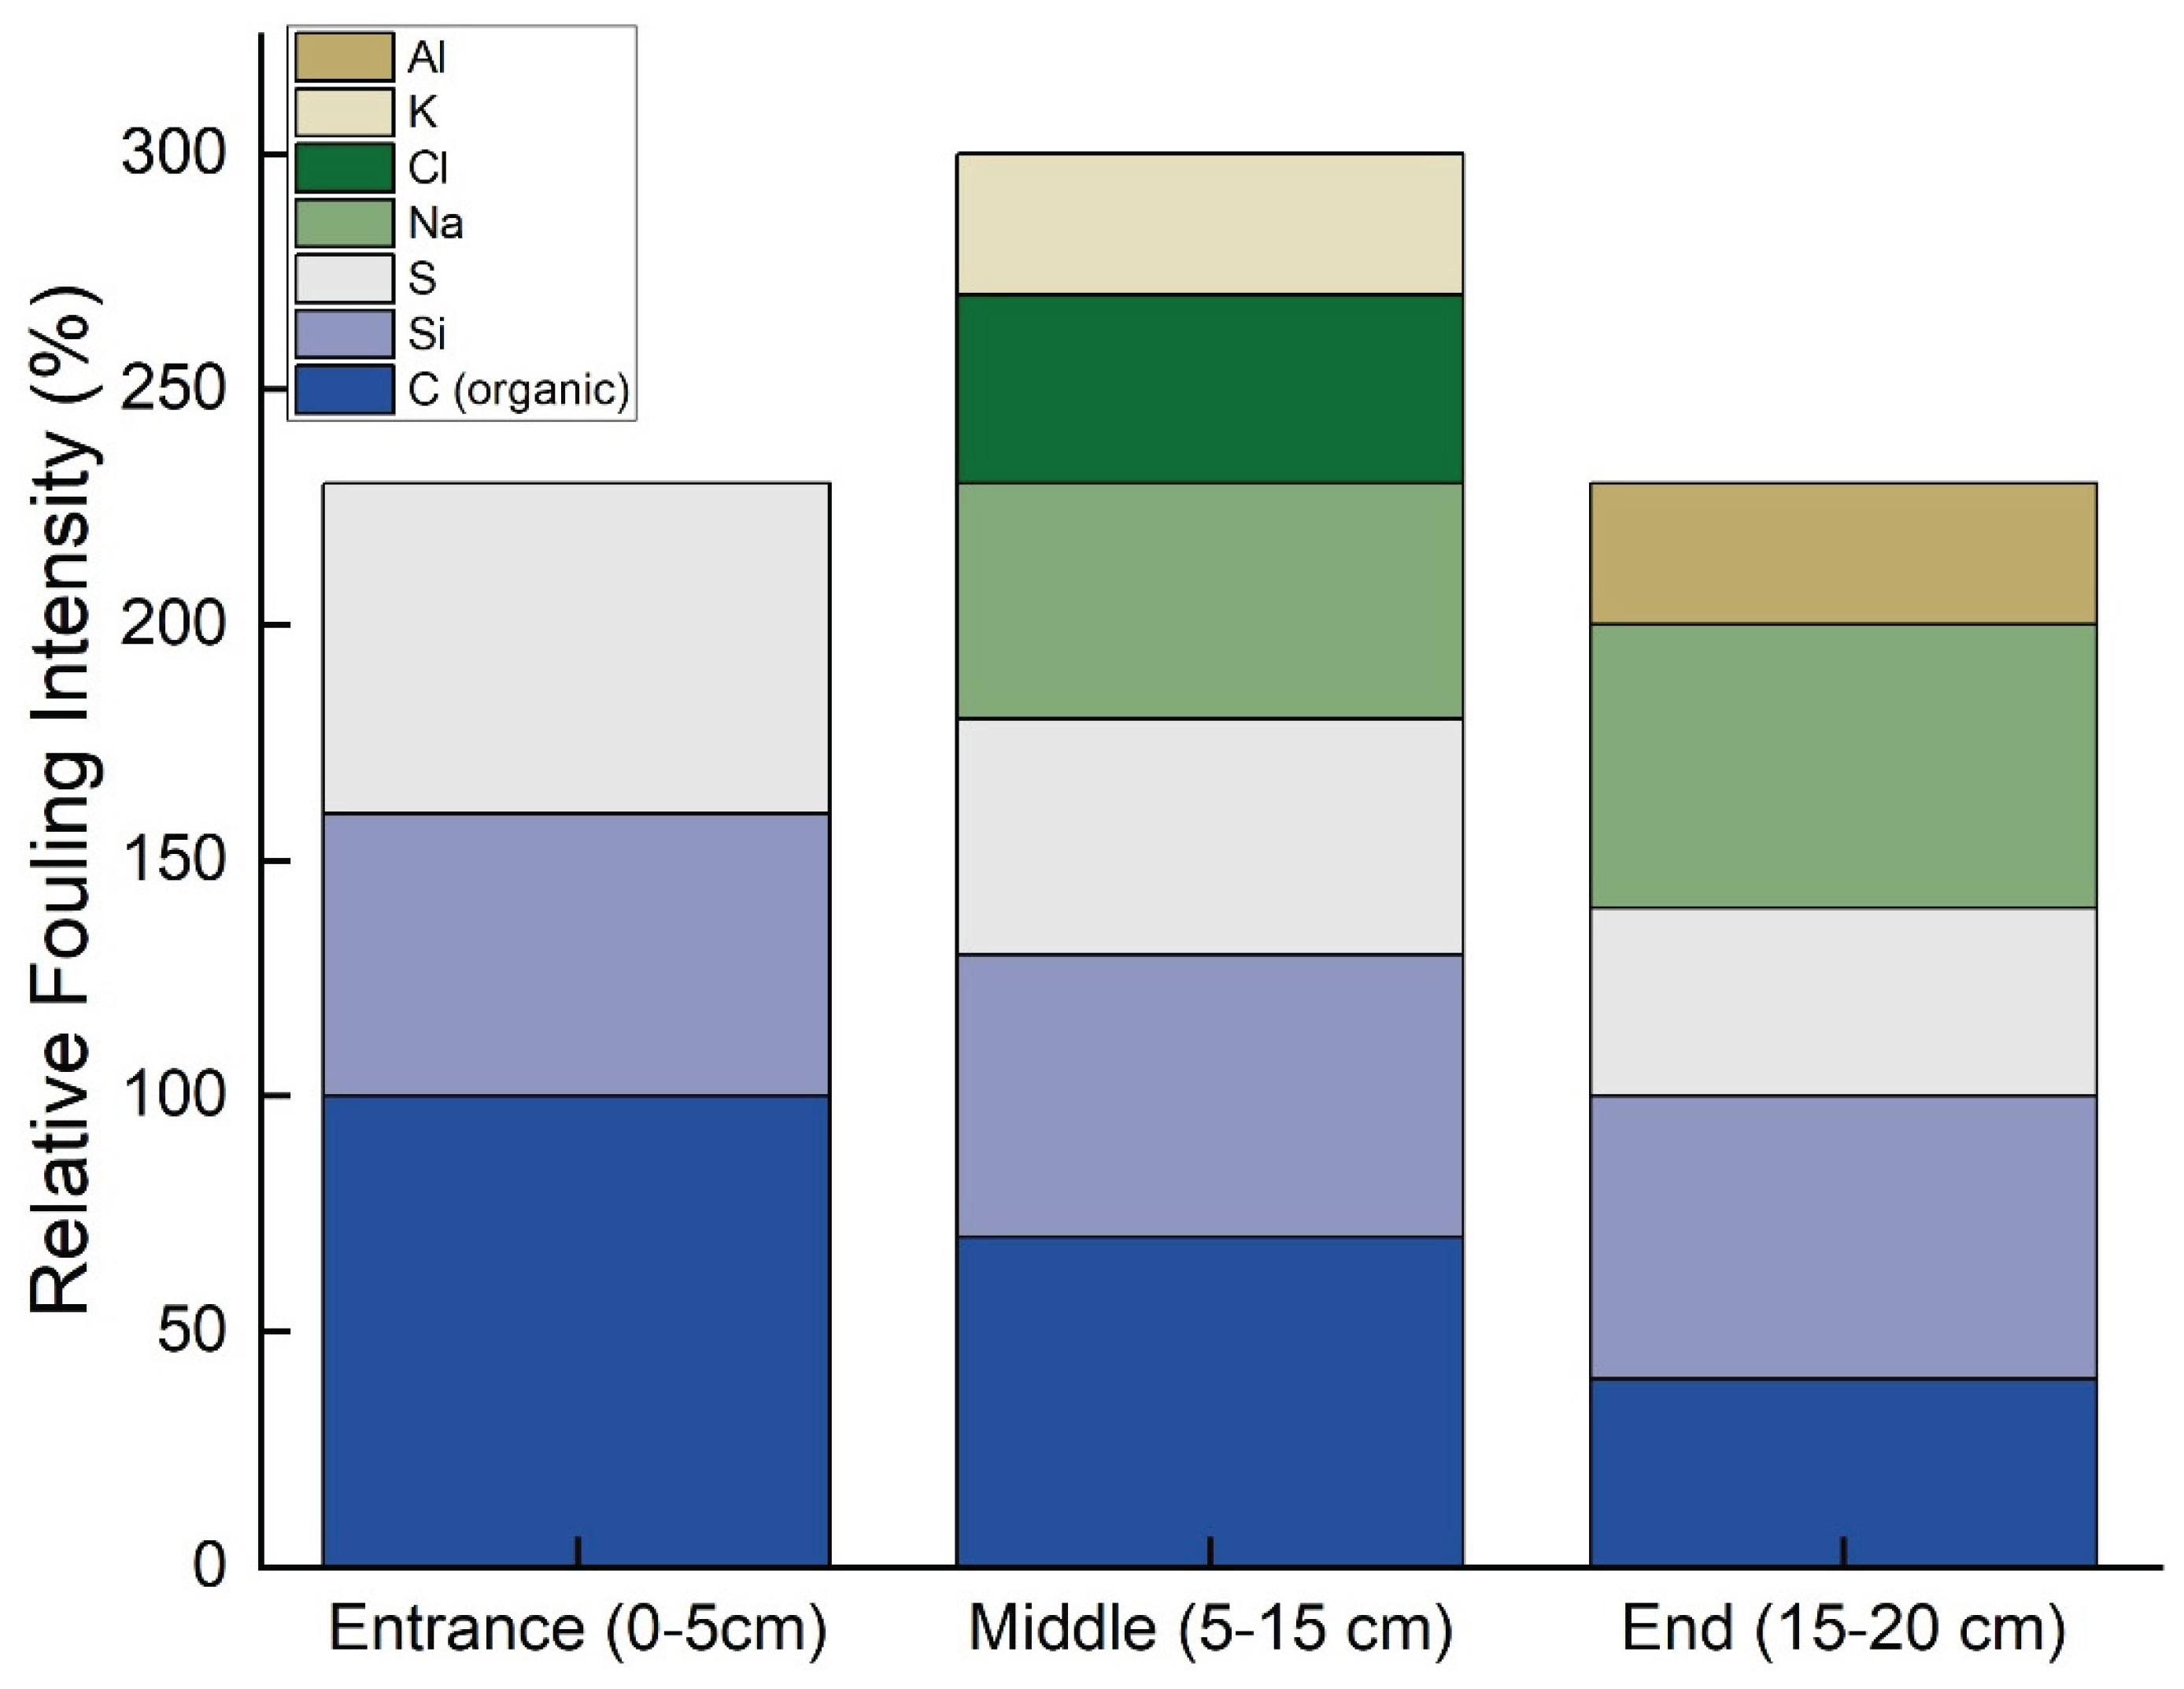

Table 1.
Charatrisation of Ro membrane and UF membrane.
| Membrane | Manufacture | Material | Max Temp | Max pressure |
|---|---|---|---|---|
| UF-GR90PP | Alfa Laval | Polysulfone | 75 °C | 10 bar |
| RO-RO98PHt | Alfa Laval | Thin-film composite | 75 °C | 40 bar |
Table 2.
Fouling Index.
| Membrane Section | Fouling Index (FI, a.u.) | Dominant Fouling Type |
|---|---|---|
| Entrance (0–5 cm) | 230 | Organic fouling (C, O) with silica and sulfate scaling |
| Middle (5–15 cm) | 300 | Mixed fouling (organics + Na, Cl, K, Si, S) |
| Outlet (15–20 cm) | 230 | Inorganic scaling (Na, Si, Al) |
Disclaimer/Publisher’s Note: The statements, opinions and data contained in all publications are solely those of the individual author(s) and contributor(s) and not of MDPI and/or the editor(s). MDPI and/or the editor(s) disclaim responsibility for any injury to people or property resulting from any ideas, methods, instructions or products referred to in the content. |
© 2025 by the authors. Licensee MDPI, Basel, Switzerland. This article is an open access article distributed under the terms and conditions of the Creative Commons Attribution (CC BY) license (http://creativecommons.org/licenses/by/4.0/).
Copyright: This open access article is published under a Creative Commons CC BY 4.0 license, which permit the free download, distribution, and reuse, provided that the author and preprint are cited in any reuse.


