
Submitted:
09 June 2025
Posted:
10 June 2025
You are already at the latest version
Abstract
Higher education institutions are increasingly compelled to adapt to the demands of digital transformation. Students expect flexible, personalised, and technology-enhanced learning environments; academics require advanced infrastructure to support teaching and research; and administrators seek efficient, data-driven systems for institutional management. The smart campus paradigm has emerged as a strategic response to these evolving needs, offering a framework for digitally transforming university ecosystems. However, most existing smart campus assessment frameworks have been developed in high-income contexts and remain largely untested in the Global South, where infrastructural, financial, and technological challenges differ significantly. This study addresses this gap by evaluating the contextual relevance of a comprehensive smart campus assessment framework in a developing country setting. Focusing on the Papua New Guinea University of Technology (PNGUoT), the research uses a questionnaire survey of 278 participants to investigate their perspectives on the importance and prioritisation of performance indicators across four key dimensions: smart economy, smart society, smart environment, and smart governance. The findings affirm the overall applicability of the framework while revealing notable variations in stakeholder priorities, emphasising the need for context-sensitive and adaptable assessment tools. The study contributes to the refinement of smart campus frameworks, supporting more inclusive and responsive digital transformation strategies for higher education institutions in the Global South.
Keywords:
smart campus
; smart learning environments
; higher education institute
; university
; digital transformation
; technology adoption
; user preferences
; developing country context
; assessment framework
; Global South
; Papua New Guinea
1. Introduction and Background
1.1. Rise of Smart Campuses in Higher Education
The accelerated advancement of digital technologies such as artificial intelligence (AI) and the Internet of Things (IoT) has significantly influenced diverse sectors, including higher education [1,2,3]. Universities are increasingly adopting these technologies to create smart campuses—digitally connected environments that facilitate efficient operations, personalised learning experiences, and data-informed decision-making. Emerging from smart city discourse, the smart campus concept has evolved as a compact, university-scale application of intelligent urban systems [4,5]. Within academic institutions, IoT technologies have enabled improved infrastructure management, while AI has transformed pedagogical practices and administrative processes [6,7]. This paradigm shift is further reinforced by efforts in educational informatization, where institutions seek to enhance competitiveness, institutional branding, and governance capabilities [8]. The progression from traditional digital campuses to smart campuses is underpinned by big data analytics, integrated information systems, and automated services [9].
1.2. Defining the Smart Campus
At the core of smart campus initiatives is smart education, which transforms digital teaching and learning through the integration of mobile technologies, interactive platforms, AI-enabled systems, gamified learning tools, and augmented reality [10,11]. These innovations have the potential to improve teaching quality and student outcomes while enhancing knowledge management through IoT-based systems [12,13]. A smart campus also contributes to broader institutional goals by promoting liveability, workability, sustainability, and inclusive learning environments [14]. Advances in digital twin technologies allow campuses to visualise and simulate operations in real time, improving security, stakeholder experience, and system optimisation [15,16,17]. Complementary developments, such as intelligent maintenance systems combining computer-based data processing with geographic information systems (GIS), further support operational efficiency [18]. As the higher education sector aligns with Industry 4.0, smart campuses are increasingly viewed as essential for sustainable innovation, data-driven governance, and resilient infrastructure [19,20,21].
1.3. Evolution of Smart Campus Frameworks
Over the past decade, a range of frameworks have emerged to conceptualise and guide the development of smart campuses. Early examples, such as the iCampus and SC2 models, introduced broad, multidimensional structures encompassing governance, environment, mobility, and energy [22,23]. These foundational models were soon followed by approaches such as the Technically Driven Model and the Socio-technical 4DStock framework, which incorporated stakeholder involvement, infrastructure, and user engagement into assessments of energy and system performance [24,25]. The Smart Education Hub further expanded these concepts, integrating elements such as smart learning environments, mobility systems, hybrid instruction, and digital security [26].
More recent innovations introduced modular and ontology-based frameworks that offer structured and scalable components. These include the Smart Campus Modular Ontology framework—which classifies entities such as buildings, tools, and actors—and Augmented Reality frameworks that blend virtual and physical environments through key dimensions like smart governance and smart society [27,28,29]. In response to the disruptions caused by COVID-19, the field shifted toward resilience planning. Notable frameworks such as the Resilience Project Team and Smart Campus 4.0 were developed to guide universities in navigating post-pandemic recovery, ensuring continuity, and strengthening digital infrastructure [30,31,32,33].
Subsequent models have focused on integrating advanced technologies such as digital twins, cloud platforms, and Industry 4.0 and 5.0 systems to improve service quality, strategic alignment, and campus adaptability [34,35,36]. Among these, the Smart Campus Assessment Framework [37] presents a comprehensive structure composed of four primary dimensions—smart economy, smart society, smart environment, and smart governance—comprising a total of 48 operational indicators (Table 1).
1.4. Knowledge and Research Gaps
Current smart campus research can be broadly grouped into three thematic categories: conceptual, technical, and sustainability-focused studies. Conceptual research investigates stakeholder perceptions and the definitional evolution of smart campuses, emphasising the varied interpretations across institutional roles [38,39]. Technical research explores specific digital innovations such as IoT-based knowledge systems, energy optimisation, digital twin platforms, and immersive learning laboratories [40,41]. Sustainability-focused research addresses the integration of smart campus principles with the United Nations Sustainable Development Goals (SDGs), including commitments to environmental stewardship and social responsibility [42,43].
Despite an expanding body of literature, few studies have developed comprehensive smart campus assessment frameworks that include clearly defined performance indicators [37]. Moreover, most existing frameworks are tailored to high-income settings, where advanced digital infrastructure and strong institutional capacity are typically present. As a result, their applicability in lower-resource environments—characterised by constrained funding, infrastructural limitations, and distinct stakeholder needs—remains uncertain, particularly for performance assessment in developing country universities—or universities within the context of the Global South. To date, no study has systematically evaluated the applicability of smart campus frameworks in these contexts, representing a critical gap in both knowledge and research.
1.5. Research Aim and Question
This study addresses a critical and underexplored gap in the smart campus literature by evaluating the relevance and adaptability of the Smart Campus Assessment Framework within the context of the Global South. While smart campus frameworks are increasingly used to guide digital transformation in higher education, they are typically developed for high-income settings, where strong digital infrastructure, institutional capacity, and resource availability are taken for granted. These frameworks often assume conditions that do not reflect the realities faced by universities in developing countries.
Institutions in the Global South contend with a distinct set of challenges, including limited technological infrastructure, financial constraints, and diverse socio-cultural contexts. These factors can shape both the implementation and perceived value of smart campus initiatives. Despite this, few studies have examined whether existing assessment frameworks are fit for purpose in such environments. The lack of contextual validation reduces the relevance and effectiveness of these tools when applied beyond their original design contexts.
This study seeks to explore the central question: To what extent is the Smart Campus Assessment Framework relevant and adaptable for assessing smart campus development in the Global South? In doing so, it contributes to the reframing of smart campus assessment by supporting the development of more inclusive, flexible, and context-sensitive frameworks for universities in developing country settings.
2. Research Design
The research is a descriptive single-case study focussing on both single and multiple units of analysis comprising the university campus and its sections, following uses Yin’s [44] “linear but reiterative” plan (Figure 1).
The research follows four key stages as shown in Figure 2 below.
2.1. Theoretical Framework: Relevance Theory and Perception
Relevance theory involves a person’s cognitive interaction with the surrounding world of contextual settings [45] expressed in perceptions [46]. Perception is argued to be a unit of relevance defined as, ‘to have knowledge through the mind’ or ‘become conscious of or understand’ something (Longman Dictionary of Contemporary English). In addition, Gilbert [47] described it as a characteristic of an agent-based model within environments undergoing a cognitive (knowledge) process by which an individual gives meaning to the environment. It is the acquisition of specific knowledge about objects or events at any moment including the interpretation of objects, symbols, and people in the light of pertinent experiences [48]. A person is motivated to improve his or her state within a context [49] and express their thoughts for their benefit [50] pursuing meanings that meet their expectations [51].
Following recent studies on relevance were conducted to measure peoples’ perceptions of ideas and innovations in the education and business sector pertaining to the context of the study. Relevance studies in the education sector measured level of perception in the ethics of university graduates [52], user satisfaction and adoption of AI models of smart campus framework [53], science camps school learning environments [54], content relevance of online professional-development courses [55], and reforms in teaching and learning of science [54]. In the business sector relevance studies investigated consumer reactions to business policies and practices [56], consumers' attitudes toward marketing and marketing-related practices of business system [57], perceived quality of consumers [58,59], industrial customer expectations and performance [60], and promotional material for tourism [61].
The Likert-scale is an effective tool for measuring attitudes including perceptions. Likert-scale, was developed by Rensis Likert [62], designed to measure attitudes using a typical 5 or 7-pointordinal scale, allowing respondents to indicate their level of agreement or disagreement with the presented statement. The scale can intuitively measure people’s attitudes in various contexts, with responses ranging from strongly agree to strongly disagree. However, it has limitations, such as the inability to determine individual scores on an attitude continuum. Response reliability is addressed through assigning weighting [63]. In addition, it only provides ordinal scales which is limited only to rating and ranking and lacks the ability to measure the distance between the scales.
Data that is normally distributed can allow descriptive statistics such as means, standard deviations, and parametric statistics to be calculated with the median measuring the central tendency for the Likert scale [64]. Ordinal responses on Likert-type scales require non-parametric test for analysis. Parametric tests are more robust for testing the reliability of the data [65] however, they are usually used for continuous data whereas the study’s data are ordinal and discrete. Continuous data gives a changing variance between each reading, whereas ordinal data is limited in variance between each level where nonparametric tests are used [66].
2.2. Case Study Context
As the case study from the Global South context, Papua New Guinea University of Technology (PNGUoT) is selected. This is due to its representative characteristics as a public higher education institution operating within a developing country context, where infrastructural, financial, and digital limitations pose significant barriers to the implementation of smart campus initiatives. PNGUoT offers a relevant and insightful site to examine the contextual applicability of global smart campus assessment frameworks, particularly in settings that lack the robust technological infrastructure typically assumed by such models. Its campus comprises diverse academic, administrative, and support units, making it suitable for evaluating the multi-dimensional indicators of smart campus performance.
Additionally, PNGUoT has expressed institutional interest in digital transformation and sustainability, providing a timely context for stakeholder engagement on the relevance of smart campus indicators. The university’s mix of students, academic staff, and professional personnel allows for triangulated insights across different roles and responsibilities. This diversity enhances the study’s capacity to assess perception-driven relevance of performance indicators, supporting the need for contextual adaptation. By focusing on PNGUoT, this study addresses a critical empirical gap and provides a grounded contribution to the refinement of inclusive and responsive smart campus strategies in the Global South.
2.3. Data Collection Instruments and Participant Sampling
The study is designed to collect data on the perspectives of key stakeholders on the relevance of 48 indicators. Three groups of stakeholders were targeted comprising: students, scholars and professional staff. Their respective perspectives may provide a more comprehensive understanding of smart campus adoption.
The single-case, descriptive study to assess the 48 indicators of the smart campus framework. A structured questionnaire based on the indicators was administered to students and staff at the selected case study university. To ensure participant comprehension and facilitate effective participation, a 5-point Likert scale question was chosen with scales ranging from 1 (Very low), 2 (Low), 3 (Neither high or low), 4 (High), to 5 (Very high). The questionnaire’s primary objective was to obtain the level of participants perceptions of the relevance of the 48 indicators. A single guiding question was asked: “How relevant do you feel the (indicator) is to the university?”. Participants then responded by indicating their perceived level of relevance. The questionnaire was designed to be completed within a 20-minute time frame.
The questionnaire was developed and distributed using Qualtrics as the online survey tool, through the university’s email system to reach all students. Anonymity was encouraged to attract a wide range of response from students across the university. For staff participants, a targeted survey was conducted with two groups: academic and professional. A total of 24 staff members were selected from the university’s human resource database based on the criteria of position (including qualifications), responsibility and length of service. Of these participants 13 were from the schools while 11 were from service sections. The three criteria were established to ensure a suitable representation of both school and sections while minimizing potential bias. focus on middle ranking positions with a wider responsibility allowed for a better understanding of the university’s operations and structure. Prioritizing individuals with longer employment periods ensured that participants had sufficient experience and a comprehensive understanding of the university’s context.
The online survey attracted over 500 student participants, with 254 providing complete responses, that were included in the data analysis. The survey interviews with the 24 staff members were executed with a few instances of confusion regarding the comprehension of the specificity of the dimensions. The issues were promptly addressed, by the interviewer, allowing the interviews to progress uninterrupted. the face-to-face interview format permitted the interviewees to extensively discuss the pros and cons of the indicators, leading to well informed response which benefited the study.
Data was sought from targeted staff [67] using survey interviews [68]. The survey approach was adopted using structured questionnaire on the forty-eight indicators of the smart campus framework due to the large number of the indicators. A 5-point Likert scale questionnaire was designed for participants to indicate their perception of the level of relevance on each of the indicators: (shown in Table 2 below). Two methods were adopted for the survey: an open online survey involving students (anonymous) campus-wide, and a targeted survey interview on selected staff in both the academic and non-academic (administration and service).
The online campus-wide questionnaire survey was produced in Qualtrics and launched through the university’s email to all stakeholders. A link and QR Code on the survey was attached on the campus-wide email launched by the Director of ICT. It provided an open, anonymous and voluntary approach removing any biases towards a group or person to generalize the survey for the case study. It ran for a period of two months where a total of 254 participants responded.
A face-to-face survey using semi-structured interview was conducted targeting academic and non-academic staff representing the functions of the university comprising, 13 schools and 11 sections, a total of 24 staff.
3. Analysis and Results
3.1. Weighting Framework
The study uses the Best-Worst Method (BWM) to assign weights to the framework's broad dimensions and categories, and Public Opinion (PO) data to estimate the relative relevance of specific indicators. The hybrid approach guarantees strategic top-down weighting while utilizing expert judgment at the indicator level, resulting in a comprehensive set of weights for each of the 48 indicators. Figure 3 displays the hierarchy of main dimensions, categories, and indicators included in the smart campus framework. The framework consists of four dimensions, 16 categories, and 48 indicators. It should be noted that for the indicator level, 278 participants scored the indicators based on a 5-point Likert scale. For the dimension and category levels, pairwise BWM questionnaires were distributed among 5 Decision-makers (DMs), and all categories and dimensions were scored using a 9-point Likert scale from a previous Delphi study [37] for relative comparison. The detailed procedure of the Hybrid BWM + PO method is as follows.
3.2. Group Best-Worst Method
The Best-Worst Method (BWM) is a widely used weighting approach that derives criteria weights through pairwise comparison. The BWM determines weights based on DMs' preferences similar to the Analytic Hierarchy Process (AHP). BWM, however, has significant benefits: it needs less comparison - only 2n-3 for n criteria as opposed to AHP's more comprehensive requirements - and it performs more consistent results [68]. The complete BWM methodology is presented as a single objective programming model (1) to simultaneously incorporate all DMs’ preferences, with detailed implementation steps available in [69]:
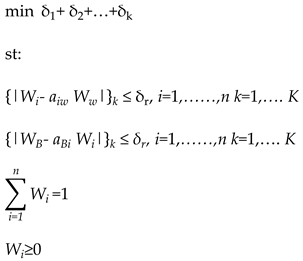
For the r-th DM, represents the preference of the best criterion over the i-th criterion, while denotes the preference of the i-th criterion over the worst criterion. indicates the constraints that pertain specifically to the k-th DM. The output of Model (1) consists of indicator weights determined by the DMs' judgments based on BWM questionnaires. In this model, is the weight of the i-th criterion, is the weight of the worst (least important) criterion, and is the weight of the best (most important) criterion.
3.3. Public Opinion Method
The PO method is a participatory approach used to gather and analyse expert or stakeholder judgments for weighting, ranking, or decision-making [70]. PO relies on subjective inputs from experts to assess the importance of criterion/indicators. In general, PO-based weights can be obtained by opinion polling, which is both simple and cost-effective [71]. Weights can be derived from expert surveys, Likert-scale ratings, or direct scoring rather than mathematical optimization. Based on the PO method, the normalized weight for i-th criterion/indicator can be calculated using Equation (2):
3.4. Results
The Hybrid BWM + PO method is applied to calculate the importance weights of dimensions, categories, and indicators within the smart campus framework. As previously stated, the group BWM approach is used for determining weights at the dimension and category levels, whereas the PO method is used for indicator-level weighting. We distribute two types of questionnaires for pairwise comparisons - a BWM questionnaire based on a 9-point Likert scale system (with responses from 5 DMs) and PO rating questionnaires based on a 5-point Likert scale system (with responses from 278 experts). The weighting results for each level will be discussed individually in the following sections.
3.4.1. Dimension-Level Weighting
In general, at this level, the 5 DMs compared “Smart Economy” (Criterion 1), “Smart Society” (Criterion 2), “Smart Environment” (Criterion 3), and “Smart Governance” (Criterion 4) with each other using the 9-point Likert scale system. According to Model 1, we have the following Problem (3):
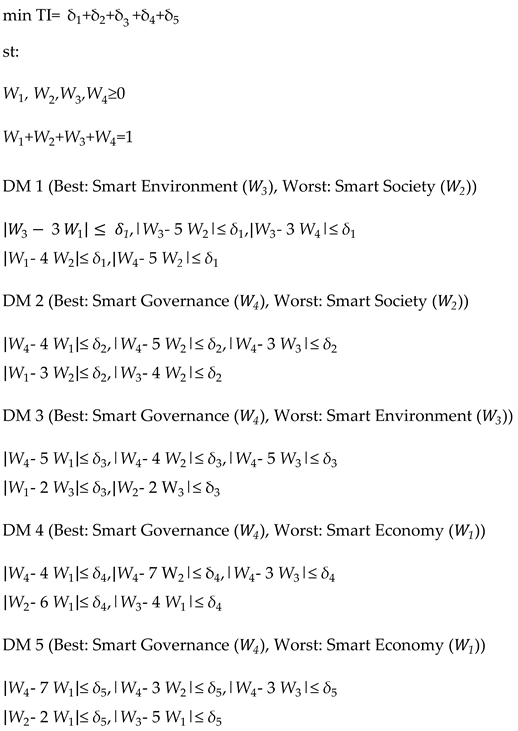
We implemented the above problem in a Python environment using the Pyomo library. The importance weights of each dimension in the smart campus framework were obtained by minimizing the Total Inconsistency (TI) via Problem (3). Table 4 and Figure 4 show the importance weights of each dimension in the smart campus framework. Accordingly, “Smart Governance” has the highest weight and importance, followed by “Smart Environment”. For “Smart Economy” and “Smart Society”, equal weight importance was achieved.
Similar to the previous section, all categories within each dimension of the Smart Campus framework were separately compared based on the questionnaires from five decision-makers (DMs). The weights for each group were derived using the BWM model. Note that all weights obtained in these groups are calculated within their respective dimensions. To determine the overall weight of a specific category relative to all categories across all dimensions, we must also consider the dimension weights calculated in the previous section. The overall weights will be computed for obtaining subgroup weights within each dimension is as follows:
3.4.2. Smart Economy Weighting
At this level, the 5 DMs compared “Business services” (Criterion 1), “Business efficiency” (Criterion 2), “Utility cost savings” (Criterion 3), and “Innovation ecosystem” (Criterion 4) with each other using the 9-point Likert scale system. According to Model 1, we have the following Problem (4):
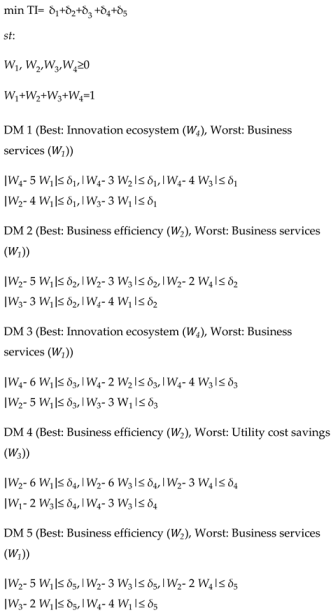
Table 5 and Figure 5 display the relative importance weights of the categories in the Smart Economy dimension. "Business efficiency" ranks highest with a weight of 0.4417, followed by "Innovation ecosystem" at 0.3655. Conversely, "Business services" has the lowest weight at just 0.0763, indicating its minimal impact in this category.
3.4.3. Smart Society Weighting
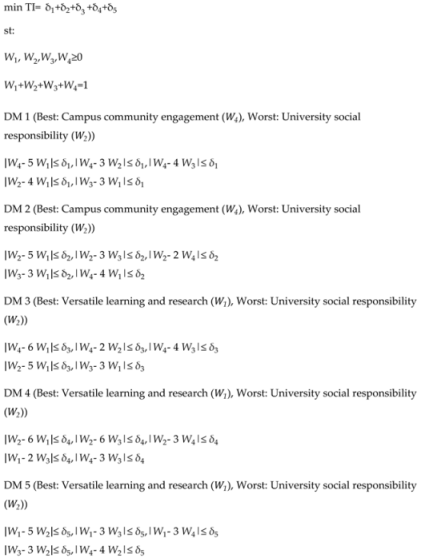
At this stage, the five DMs evaluated and compared four key criteria: “Versatile learning and research” (Criterion 1), “University social responsibility” (Criterion 2), “Utility cost savings” (Criterion 3), and “Campus community engagement” (Criterion 4). The comparison was conducted using a 9-point Likert scale system. Based on Model 1, we derive the following optimization problem (Problem (5)):
Table 6 and Figure 6 present the importance weights of categories within the Smart society dimension. Among these, "Versatile learning and research" holds the highest weight (0.4615), indicating its dominant role. "Utility cost savings" and "Campus community engagement" share equal weights, suggesting comparable significance. In contrast, "University social responsibility" has the lowest weight (0.0769), reflecting its relatively minor influence in this dimension.
3.4.4. Smart Environment Weighting
At this level, the five DMs evaluated and compared four key categories: “Environmentally friendly services” (Criterion 1), “Renewable energy” (Criterion 2), “Sustainable development” (Criterion 3), and “Zero waste” (Criterion 4). The comparison was conducted using a 9-point Likert scale system. Based on Model 1, we derive the following optimization problem (Problem (6):
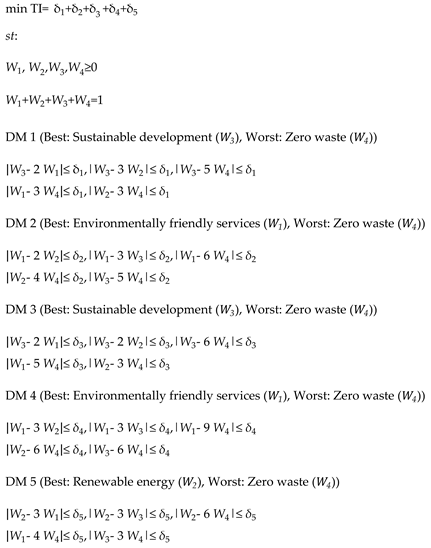
The relative importance of each category in the Smart Environment dimension is shown in Table 7 and Figure 7. The top-weighted factors are "Environmentally friendly services," "Renewable energy," and "Sustainable development," each scoring 0.3. On the other hand, "Zero waste" has the lowest weighting (0.1), indicating its limited impact within this dimension.
3.4.5. Smart Governance Weighting
At this stage, the five DMs assessed and ranked four critical categories: (1) "Cybersecurity", (2) "Data governance", (3) "Decision-making", and (4) "Service management". Following the framework of Model 1, we formulate the optimization challenge presented in Problem (7).
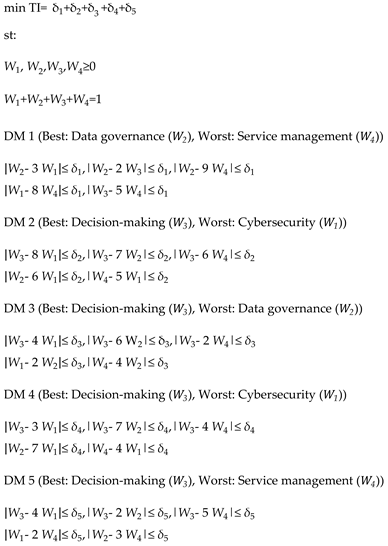
The relative importance of categories in the Smart Governance dimension is illustrated in Table 8 and Figure 8. "Decision-making" emerges as the most influential factor with a weight of 0.6410, demonstrating its predominant role. The secondary categories, "Service management" and "Data governance," show nearly identical weights (ranking second and third respectively), indicating similar levels of importance. Conversely, "Cybersecurity" carries the lowest weight (0.07796), suggesting it plays a substantially smaller role within this governance framework.
3.4.6. Indicator-Level Weighting
In this stage, we calculate the importance weights of all 48 indicators within their respective categories. As previously mentioned, the study employs the PO (Prioritization and Optimization) method for these calculations. A total of 278 respondents scored each indicator using a 5-point Likert scale system. Note that all weights are calculated relative to their specific categories. To determine the overall weights of indicators across all categories (accounting for both category and dimension weights), additional calculations are required. Table 9 shows the mean scores and the corresponding calculated weights for all indicators, derived using the PO method. The weight for each individual indicator was determined by dividing its mean score by the total mean score of its respective category. For example, the weight for the "Relevance Levels of Art Services" indicator is calculated by dividing its score of 1.6942 by the Total mean category score of 7.0935, resulting in a weight of 0.2388.
3.4.7. Overall Category and Indicator Weights
The overall weights are now calculated for both categories and indicators, making it possible to compare the relative importance of all indicators and categories with respect to each other. Table 10 presents the overall weights of all criteria at each level. For the calculations, the overall weights of categories are obtained using Equation (8): we multiply each category’s weight by the weight of its respective dimension. For example, to calculate the overall weight of the Business Services category, we multiply its category weight (0.0763) by the weight of the dimension it belongs to - Smart Economy (0.0909) - which results in 0.0069. To calculate the overall weight of an indicator, based on Equation (9), we multiply the indicator's weight by the weights of its respective category and dimension. For example, to calculate the overall weight of the Relevance Levels of Retail Services indicator, we multiply its weight (0.3722) by the weights of the Business Services category (0.0763) and the Smart Economy dimension (0.0909), which results in 0.0026. Table 11 ranks the categories and indicators by overall weight. Based on this, the results for all participants across the three levels of the Smart Campus framework are summarised below.
Category overall weight = Weight Dimension × Weight Category
Indicator overall weight = Weight Dimension × Weight Category × Weight Indicator
Dimension-Level
In the Smart Campus framework, at the dimension level, it can be observed that Smart Governance is the most important dimension, followed by Smart Environment. Both Smart Economy and Smart Society dimensions are equally important but rank lower in significance compared to the other dimensions.
Category-Level
Within the Smart Campus framework's category-level analysis, Decision-making (from the Smart Governance dimension) emerges as the most significant category. This is followed in importance by Environmentally Friendly Services, Renewable Energy, and Sustainable Development from the Smart Environment category. In contrast, Business Services (under Smart Economy) demonstrates relatively lower importance compared to other categories.
Indicator-Level
At the indicator level of the Smart Campus framework, "Relevance Levels of Communication Practices in Decision-making" (Decision-making category) ranks as the most significant indicator. The subsequent highest-ranking indicators are "Relevance Levels of Consultation and Collaboration in Decision-making" and "Relevance Levels of Monitoring and Evaluation in Decision-making". Conversely, "Relevance Levels of Art Services" (Business Services category) shows comparatively lower importance among all indicators.
4. Findings and Discussion
The results of the study highlight the potential of applying a comprehensive smart campus framework that addresses a broader range of campus features, in contrast to prior studies that have focused primarily on specific algorithms or limited aspects of campus infrastructure. Using a smart campus assessment framework comprising 48 indicators, the study demonstrated consistent relevance across the indicators, with weights ranging from 0.001 to 0.011. Notably, the combined results from the three sample groups revealed that the highest aggregated weight—approximately 0.42—was attributed to Communication Practices under the Smart Governance dimension. In contrast, the lowest weightings, around 0.01, were shared by Art Services in the Smart Economy dimension and Researching Social Responsibility in the Smart Society dimension. A general consensus among the groups indicated alignment in the perceived relevance of smart campus indicators. Figure 9 presents the aggregated relevance weights for each group, offering insights into shared and differing institutional priorities.
4.1. Smart Governance: Highest Priority Dimension
Among all four dimensions, Smart Governance emerged as the most relevant. The highest-ranking indicators—Communication Practices, Consultation and Collaboration, and Monitoring and Evaluation—belong to the “Decision-Making” category and were consistently rated the most important across all stakeholder groups. As illustrated in Figure 9, these three indicators substantially outweighed the remaining 45 in perceived importance.
This finding reflects the centrality of formal governance processes in a state-owned, bureaucratic institution like PNGUoT, where transparency, compliance, and accountability are critical [72,73,74,75]. Communication and collaborative mechanisms serve as the operational backbone, enabling routine functions such as task delegation, reporting, and institutional oversight. The strong stakeholder consensus on these indicators underscores their relevance in ensuring organisational continuity and institutional legitimacy. These results align with previous studies emphasising the foundational role of governance capabilities in digital transformation strategies within public-sector institutions [30,37,73].
4.2. Smart Environment: Sustainability as a Pragmatic Priority
Smart Environment was the second-highest rated dimension. Key indicators—Energy Transformation Culture, Sustainable Lifestyle, and Social Equity—received high relevance scores from all stakeholder groups. These indicators reflect an awareness of sustainability, energy management, and inclusive development in the face of infrastructural and financial constraints.
In the PNGUoT context, energy-saving practices and renewable energy adoption are not just environmental choices but a necessary response to limited resources [76,77,78]. Participants acknowledged the economic imperative of conserving energy and maintaining a sustainable campus lifestyle, particularly given the growing availability of off-grid systems and small-scale renewable solutions [77]. The high relevance of Social Equity also highlights concerns about inclusion and fairness in institutional development. This suggests that sustainability, when framed through the lenses of affordability and access, holds significant appeal—even in developing country settings [48,49].
4.3. Smart Economy: Emerging Relevance, Limited Capacity
Smart Economy was rated lowest among the four dimensions overall, but select indicators showed moderate relevance. These included Workforce Productivity, Lean Principles, and Industry Engagement from the “Business Efficiency” and “Innovation Ecosystem” categories. These findings suggest that while economic innovation is not yet a primary institutional focus, there is growing recognition of its potential.
The relatively low relevance of indicators such as Retail Services and Art Services points to the limited commercial infrastructure and entrepreneurial culture on campus. However, the moderate scores for business efficiency indicators imply a desire to improve institutional performance through streamlined processes and partnerships [79,80,81]. These results support literature highlighting the challenges and opportunities of innovation systems in the Global South, where institutional readiness often lags behind ambition [36,37,49].
4.4. Smart Society: Educational Relevance, Social Disconnect
Smart Society also scored relatively low overall, but with a few notable exceptions. The “Versatile Learning and Research” category received higher relevance scores, especially for Living Labs, Collaborative Learning, and Responsive Curriculum. These indicators reflect the institution’s core function as a centre for teaching and research, and stakeholder responses affirmed their value.
Despite this, indicators under the “University Social Responsibility” and “Campus Community Engagement” categories were rated less relevant. This suggests a gap between the university’s educational mission and its broader community engagement efforts, including the perceived relevance and applicability of emerging technologies such as AI for social good. Factors such as resource scarcity, weak institutional-community linkages, limited outreach infrastructure, and nascent AI awareness or capacity may contribute to this perception [82,83,84,85].
4.5. Stakeholder Consensus: Alignment Across Institutional Roles
One of the most significant findings of this study is the strong alignment in responses across the three stakeholder groups. As shown in Figure 9, students, academics, and administrative staff demonstrated consistent prioritisation of the top indicators, particularly those related to governance and environment. This convergence enhances the robustness of the findings and suggests shared institutional understanding of the university’s strategic priorities.
The observed consensus across organisational roles also indicates that stakeholders experience and interpret smart campus indicators in similar ways, increasing the framework’s credibility as a planning and assessment tool. In environments with limited resources, such alignment is critical for coordinated digital transformation and reinforces the importance of inclusive stakeholder engagement in smart campus planning [37,40].
4.6. Relevance of Framework in Global South Context
While the results affirm the overall structure and applicability of the Smart Campus Assessment Framework, they also point to the importance of contextual adaptation. Governance and sustainability dimensions, which scored highest, are institutionally embedded and operationally necessary. In contrast, dimensions related to economic and social innovation require more tailored approaches.
For instance, indicators developed in high-income contexts may assume a baseline of digital infrastructure, institutional autonomy, or community integration that may not exist in lower-income settings. As a result, tools such as the framework analysed in this study must remain flexible, allowing institutions to recalibrate dimensions and indicators based on their own development stage and strategic goals [37,38,49].
This study supports calls for more inclusive and adaptive approaches to smart campus planning, especially in the Global South. The combination of top-down weighting via BWM and bottom-up validation through stakeholder perceptions offers a replicable model for other institutions aiming to contextualise global frameworks for local application.
5. Conclusion
This study critically examined the relevance and adaptability of an established Smart Campus Assessment Framework within the context of the Global South, using PNGUoT as a case study. Recognising the limitations of frameworks developed in high-income countries, this research addressed an important gap by empirically testing the framework’s indicators in a setting characterised by constrained resources, infrastructural challenges, and unique sociocultural conditions. The study suggested that while the framework appears applicable, there are notable variations in stakeholder perceptions across its dimensions, highlighting the potential value of contextual adaptation.
The analysis found that Smart Governance emerged as the most relevant dimension, driven primarily by strong stakeholder consensus around decision-making processes, especially in communication practices, consultation and collaboration, and monitoring and evaluation. These results are consistent with the governance-heavy nature of PNGUoT as a public institution with a bureaucratic structure and strong accountability obligations. The high weighting of decision-making indicators reflects the institutional need for structured and transparent processes, aligning with broader expectations in developing-country universities that often operate within tight regulatory frameworks.
Smart Environment followed in perceived importance, with indicators such as energy transformation culture, sustainable lifestyle, and social equity receiving high relevance scores. This reflects a growing awareness among university stakeholders of environmental sustainability, energy efficiency, and equity, particularly in settings where financial and infrastructure limitations demand cost-saving and socially inclusive practices. The prioritisation of these environmental indicators highlights a strategic orientation towards long-term sustainability, even in resource-constrained contexts.
In contrast, Smart Economy and Smart Society were rated as equally less relevant by participants. The relatively lower emphasis on business services, retail operations, and university social responsibility suggests that economic and social innovation functions may be less developed or perceived as lower priorities within the operational realities of PNGUoT. However, several indicators—such as workforce productivity, industry engagement, and versatile learning environments—did attain moderate levels of relevance, suggesting that foundational capabilities exist that can be scaled with the right support mechanisms.
Importantly, the study found broad alignment among the three surveyed stakeholder groups—students, academics, and professional staff—in their prioritisation of indicators. This convergence enhances the reliability of the findings and indicates shared institutional values around governance and sustainability. Nonetheless, the study also acknowledges several limitations: it focused on a single case institution, did not include broader external stakeholders (e.g., government, community, suppliers), and concentrated only on perceptual data related to indicator relevance. Future research should extend this approach across diverse institutions in the Global South, integrate additional variables (e.g., technological maturity, digital literacy), and explore longitudinal dynamics of smart campus adoption.
Overall, this study contributes a much-needed empirical perspective to the literature on smart campus development in the Global South. By contextualising assessment indicators and elevating stakeholder voices, it offers a path forward for more inclusive, adaptable, and sustainable digital transformation strategies in higher education. These findings reinforce the importance of tailoring smart campus frameworks to local needs—bridging the gap between global innovation agendas and regional implementation realities.
Author Contributions
K.P.: Data collection, processing, investigation, analysis, and writing—original draft; T.Y.: Super-vision, conceptualization, writing—review and editing; M.L., T.W.: Supervision, writing—review and editing; F.G., A.P.: Methodology, formal analysis. All authors have read and agreed to the published version of the manuscript.
Funding
This research received no external funding.
Data Availability Statement
The data will be made available upon request.
Conflicts of Interest
The authors declare no conflicts of interest.
References
- Rotta, M.; Sell, D.; Pacheco, R.; Yigitcanlar, T. Digital commons and citizen coproduction in smart cities: Assessment of Brazilian municipal e-government platforms. Energies. 2019; 12(14): 2813. [CrossRef]
- Faisal, A.; Yigitcanlar T, Kamruzzaman M, Paz A. Mapping two decades of autonomous vehicle research: A systematic scientometric analysis. Journal of Urban Technology. 2021, 28(3-4): 45-74. [CrossRef]
- Yigitcanlar T, Li, R.; Beeramoole, P.; Paz, A. Artificial intelligence in local government services: Public perceptions from Australia and Hong Kong. Government Information Quarterly. 2023, 40(3): 101833. [CrossRef]
- Baba, K.; Elfaddouli, N.; Cheimanoff, N. The role of information and communication technologies in developing a smart campus with its four pillars’ architectural sketch Educ. and Info. Tech. 2024, 29:14815–14833. [CrossRef]
- Kumar, B.; Padmanabha, V.; Josephmani P.; Dwivedi, R. Utilizing Packet Tracer Simulation to Modern Smart Campus Initiatives for a Sustainable Future. In Proceedings of 2024 IEEE 12th International Conference on Smart Energy Grid Engineering.
- Kandil, O.; Rosillo, R.; Aziz, R.; Fuente, D. Investigating the impact of the Internet of Things on higher education: a systematic literature review Jour. App. Res. in High. Educ. 2025, 17, 1:254-273.
- Wang, K.; Pan, H.; Wu, C. Smart Campus Innovative Learning Model for Social Practitioners of Universities’ Third Mission: To Promote Good Health and Well-Being. Sust. 2024, 16, 6017. [CrossRef]
- Jing, L.; Manta. O. Research on Digital Campus Construction Based on SOA Service Architecture. In Proceedings of 3rd International Symposium on Big Data and Artificial Intelligence (ISBDAI 2022), December 09, 10, 2022, Singapore, Singapore. ACM, New York, NY, USA.
- Lian, J; Chen, J.; Research and Practice of Data Governance in Universities Based on Data Middleware. In Proceedings of International Conference on Cloud Computing and Big Data (ICCBD2024), July26–28, 2024, Dali, China. ACM, NewYork, NY, USA, 5pages.
- Wang, Y; Report on Smart Education in China in Smart Education in China and Central & Eastern European Countries. In Lecture Notes in Educational Technology R. Zhuang et al. (eds.), Springer Nature Singapore Pte Ltd., 2023.
- Alam, A; Mohanty, A. Learning on the Move: A Pedagogical Framework for State-of-the-Art Mobile Learning Data Management, Analytics and Innovation. In Lecture Notes in Networks and Systems N. Sharma et al. (eds.), Springer Nature Singapore Pte Ltd. 2023 662, pp.735-748.
- Alam, A. Intelligence Unleashed: An Argument for AI-Enabled Learning Ecologies with Real World Examples of Today and a Peek into the Future. In Proceedings of International Conference on Innovations in Computer Science, Electronics & Electrical Engineering 2022 AIP Conf. Proc. 2717.
- Alblaihed, M.; Ibrahem U.; Altamimi A.; Alqirnas, H.; Salem M. Infosphere Is Reshaping: How the Internet of Things Leads Smart Campuses for Knowledge Management. Sust. 2022, 14, 13580. [CrossRef]
- Afaneh, A.; Alshafei, I. The influence of smart technologies: A comparative study on developing Large to small scale smart cities and smart campuses. IOP Conf. Ser.: Earth Environ. Sci. 2023, 1210, 012015.
- Hussain, K.; Parandhaman, V.; Rohini, V.; Ravichandran, A.; Bhat. K.; Murugesan. G. Analysis of Developing IoT and Cloud Computing Based Smart Campuses and its Applications. In Proceedings of International Conference on Advances in Computing, Communication and Applied Informatics 2024 IEEE.
- Xie, Y.; Zhan, N.; Xu, B. Multimodal data visualization method for digital twin campus construction Int. Jour. Dig. Ear. 2024, 17, 1, 2431624. [CrossRef]
- Chen. S.; Li, Q.; Wang, T. Smart Campus and Student Learning Engagement Int. Jour. Info. Com. Tech. Edu. 2024, 20, 1. [CrossRef]
- Liu, Y.; Zhang, Y.; Ji, X. Intelligent Campus Management System Combining Computer Data Processing and GIS Technology. In Proceedings of the 3rd International Conference on Electronic Information Technology and Smart Agriculture (ICEITSA 2023), Sanya, China. 2023 December pp:8–10.
- Imbar, R. Approaches that Contribute to a New Definition of the “Smart Campus” based on Smart Systems. In Proceedings of the 2024 International Conference on ICT for Smart Society (ICISS) 2024 IEEE.
- Mahariya, A.; Kumar, A.; Singh, R.; Gehlot, A.; Akram, A.; Twala, B.; Iqbal, M.; Priyadarshi, N. Smart Campus 4.0: Digitalization of University Campus with Assimilation of Industry 4.0 for Innovation and Sustainability, Jour. Adv. Res. App. Sci. Eng. Tech. 2023 32, 1:120-138. [CrossRef]
- García-Mongea, M.; Zalbaa, B.; Casasb, R.; Canoc, E.; Guillén-Lambeaa, S.; Martínez, B. Is IoT monitoring key to improve building energy efficiency? Case study of a smart campus in Spain Ener. Build. 2023, 285, 112882.
- Aion, N.; Helmandollar, L.; Wang, M.; Ng, J. Intelligent campus (iCampus) impact study. In Proceedings of the 2012 IEEE/WIC/ACMInternational Conferences on Web Intelligence and Intelligent Agent Technology, Macau, China, 4–7 December 2012; pp. 291–295.
- Pagliaro, F.; Mattoni, B.; Gugliermenti, F.; Bisegna, F.; Azzaro, B.; Tomei, F.; Catucci, S. A roadmap toward the development of Sapienza Smart Campus. In Proceedings of the 2016 IEEE 16th International Conference on Environment and Electrical Engineering (EEEIC), Florence, Italy, 7–10 June 2016.
- Dong, Z.Y.; Zhang, Y.; Yip, C.; Swift, S.; Beswick, K. Smart campus: Definition, framework, technologies, and services. IET Smart Cities 2020, 2:43–54. [CrossRef]
- Janda, K.; Ruyssevelt, P.; Liddiard, R. 4DStock: Adding an organisational dimension to a 3D building stock model, Efficiency and Beyond: Innovative Energy Demand Pol. ECEEE Sum. Stu. Proc. 2022.
- Khatun, S.; Khan, M.; Kadir, K.; Paul, A.; Hassan, S.; Aziz, A.; Taj, M. A Comparative Analysis of Smart Education Hub in terms of Cost-effective Infrastructure Remodelling and System Design Jour. Eng. Sci. Tech. 2022:239-254.
- Djakhdjakha, L.; Cisse, H.; Farou, B. A modular ontology for Smart Campus. In Proceedings of RIF’23: The 12th Seminary of Computer Science Research at Feminine, March 09, 2023, Constantine, Algeria, CEUR workshop proceedings pp.17-26.
- Rahman, E.F.; Erlangga, R. A systematic literature review on augmented reality in smart campus research. In proceedings of the International Seminar on Mathematics, Science, and Computer Science Education (MSCEIS) AIP Conf. Proc. 2023, 2734, 060004.
- Prasetyaningtyas, S.; Meliala, J.; Pratiwi, C.; Peranginangin, E. A Smart Campus Framework in Developing Countries: Systematic Literature Approach. In Proceedings of 10th International Conference on ICT for Smart Society (ICISS) IEEE 2023.
- Regehr, C.; Rule, N. Addressing challenges to recovery and building future resilience in the wake of COVID-19 Jour. Bus. Cont. Emerg. Plan. 2023, 17, 3:284-297. [CrossRef]
- Afaneh, A.; Alshafei, I. The influence of smart technologies: A comparative study on developing Large to small scale smart cities and smart campuses. IOP Conf. Ser.: Ear. Environ. Sci. 2023, 1210 012015.
- Akbar, H.; Faturrahman, M.; Sidharta, S. Guidance in Designing a Smart Campus: A Systematic Literature Review. Proceedings in the 8th International Conference on Computer Science and Computational Intelligence (ICCSCI 2023) Proc. Comp. Sci. 2023, 227:83–91.
- Bellaj, M.; Bendahmane, A.; Younes, A.; Boudra, S.; Ennakra, M. A systematic review of smart campus technologies to improve students' educational experiences. In Proceedings of the Mediterranean Smart Cities Conference (MSCC 2024) 2-4 May, 2024, Martil, Morocco 2024.
- Wei, X.; Yang, C. A study on the technology of reviewing smart campus construction under energy consumption limit constraints Int. J. Env. Sust. Dev. 2024, 23, 2/3.
- Hussain, K.; Parandhaman, V.; Rohini, V.; Ravichandran, A.; Bhat. K.; Murugesan, G. Analysis of Developing IoT and Cloud Computing Based Smart Campuses and its Applications. In Proceedings of the 2024 International Conference on Advances in Computing, Communication and Applied Informatics IEEE 2024.
- Izourane, F.; Ardchir, S.; Ounacer, S.; Azzouazi, M. Smart Campus Based on AI and IoT in the Era of Industry 5.0: Challenges and Opportunities pp39-57 in Studies in Systems, Decision and Control 565 Eds Aziza Chakir Rohit Bansal Mohamed Azzouazi Industry 5.0 and Emerging Technologies Transformation Through Technology and Innovations Springer Switzerland 2024.
- Polin, K.; Yigitcanlar, T; Limb, L.; Washington, T. Smart Campus Performance Assessment: Framework Consolidation and Validation Through a Delphi Study. Build. 2024, 14, 4057. [CrossRef]
- Jawwad, A.; Turab, N.; Al-Mahadin, G.; Owida, H.; Al-Nabulsi, J. A perspective on smart universities as being downsized smart cities: a technological view of internet of thing and big data, Ind. Jour. Elect. Eng. Comp. Sci. 2024, 35, 2:1162-1170 . [CrossRef]
- Das, D.; Nathaniel Dylan Lim; P Aravind Developing a Smart and Sustainable Campus in Singapore. Sust. 2022, 14, 14472.
- Ahmed, V.; Saboor, S.; Ahmad, N.; Ghaly, M. A multi-attribute utility decision support tool for a smart campus—UAE as a case study. Front. Built Environ. 2022, 8:1044646. [CrossRef]
- Samancioglu, N.; Nuere, S. A determination of the smartness level of university campuses: the Smart Availability Scale. Jour. Eng. App. Sci. 2023, 70:10 . [CrossRef]
- Moraes, P.; Pisani, F.; Borin, J. Smart University: A pathway for advancing Sustainable Development Goals Int. Thi. 2024, 27, 101246. [CrossRef]
- Winarno, A.; Gadzali, S.; Kisahwan, D.; Hermana, D. Leadership and employee environmental performance: mediation test from model job demands-resources dan sustainability perspective in micro level, Cog. Bus. Man. 2025, 12:1, 2442091. [CrossRef]
- Yin, R. Case Study Research and Applications Design and Methods, 6th ed, Sage, Publications, Inc. 2018.
- Baba, K.; Elfaddouli, N.; Cheimanoff, N. The role of information and communication technologies in developing a smart campus with its four pillars’ architectural sketch Ed. Inf. Tec. 2024, 29:14815–14833. [CrossRef]
- Sperber, D.; Wilson, D. Pragmatics. UCL Wor. Pap. Ling. 2005, 17:353-388.
- Gilbert, N. Agent-based Models, Sage Research Methods Sage Publications, Thousand Oaks 2020. [CrossRef]
- Ivancevich J.; Matterson M. Organizational behavior and management; USA; Richard D. Irwin, Inc. 1990; pp71 -72.
- Kolaiti, P. Perceptual relevance and art: Some tentative suggestions, Jour. Lit. Sem. 2020, 49, 2:99-117. [CrossRef]
- Díaz-Pérez, F. Relevance Theory and translation: Translating puns in Spanish film titles into English Jour. Prag. 2014, 70:108–129. [CrossRef]
- Marcet, E.; Sasamoto, R. Examining interlanguage pragmatics from a relevance-theoretic perspective: Challenges in L2 production, Int. Prag. 2023; 20, 4:405–427. [CrossRef]
- Víctor, M.; Galván-Vela, E.; Ravina-Ripoll, R.; Popescu, C. A Focus on Ethical Value under the Vision of Leadership, Teamwork, Effective Communication and Productivity. Jour. Risk Fin. Man. 2021, 14: 522. [CrossRef]
- Li, N.; Palaoag, L.; Du, H.; Guo, T. (2023). Design and Optimization of Smart Campus Framework Based on Artificial Intelligence. Jo. Inf. Sys. Eng. Man., 2023, 8, 3, 23086. [CrossRef]
- Stuckey, M.; Hofstein, A.; Mamlok-Naaman, R.; Eilks, I. The meaning of ‘relevance’ in science education and its implications for the science curriculum Stu. Sci. Ed. 2013, 49, 1:1–34.
- Herranen, J.; Aksela, M.; Kaul, M.; Lehto, S. Teachers’ Expectations and Perceptions of the Relevance of Professional Development MOOCs. Educ. Sci. 2021, 11, 240. [CrossRef]
- Bearden, W.; Netemeyer, R. Attitudes, About the Performance of Business Firms, Satisfaction and Post-Purchase Behavior, Consumer Attitudes toward Business Practices and Marketing Social Agencies, and the Marketplace 2011 Product: Sage Research Methods.
- Lundstrom, W., Lamont, L. The Development of a Scale to Measure Consumer Discontent. Jour. Mar. Res. 1976, 13:373–381.
- Parasuraman, A.; Zeithaml, V.; Berry, L. SERVQUAL: A Multiple-Item Scale for Measuring Consumer Perceptions of Service Quality. Jour. Ret.1988, 64:12–40.
- Polin, K.; Yigitcanlar, T.; Limb, M.; Washington, T. The making of smart campus: A review and conceptual framework. Buildings. 2023 13(4): 891. [CrossRef]
- Bienstock, C.; Mentzer, J.; Bird, M. Measuring Physical Distribution Service Quality. Jour. Aca. Mar. Sci. 1997, 25, 1: 31–44.
- Rodríguez, C.V. Relevance and creativity and the translation of multimedia tourist material. Cult. Len. Rep. 2023 XXXI, 189–214.
- Likert, R. A technique for the measurement of attitudes. Arch Psy. 1932, 22, 140:55.
- McIver, J.; Carmines, E. Likert Scaling Sage Res. Met. 2011. [CrossRef]
- Jamieson, S. Likert scales: how to (ab)use them. Med Educ. 2004, 38, 12:1217-1218. [CrossRef]
- Norman, G. Likert scales, levels of measurement and the ‘‘laws’’ of statistics. Adv Heal. Sci Educ Theo. Pract. 2010 15, 5:625–632.
- Bishop, P.; Herron, R. Use and Misuse of the Likert Item Responses and Other Ordinal Measures Article July 2015. [CrossRef]
- Rubin, H.; Rubin, I. Qualitative interviewing the art of hearing data. (3rd ed.) SAGE Publishing 2012.
- Omrani, H.; Amini, M.; Alizadeh, A. An integrated group best-worst method – Data envelopment analysis approach for evaluating road safety: A case of Iran. Meas. 2020, 152, 107330. [CrossRef]
- Rezaei, J. Best-worst multi-criteria decision-making method: Some properties and a linear model. Omega, 2016, 64:126-130. [CrossRef]
- Gan, X.; Fernandez, I.; Guo, J.; Wilson, M., Zhao, W.; Zhou, B.; Wu, J. When to use what: Methods for weighting and aggregating sustainability indicators. Ecol. Ind. 2017, 81:491-502. [CrossRef]
- Parker, J., Environmental reporting and environmental indices. University of Cambridge. 1991.
- Fazeli, H.; Attarzadeh, B. Problematizing Iranian university autonomy: a historical-institutional perspective Int. Jo. Cul. Pol. 2024, 30, 7:877–898. [CrossRef]
- Alsharif, M. The structural modelling of significant organisational and individual factors for promoting sustainable campus in Saudi Arabia. Front. Sust. 2024, 5:1231468. [CrossRef]
- Kristinsson, S. Constructing Universities for Democracy, Stu. Phil. Edu. 2023, 42:181–200.
- Pruvot, E.; Estermann, T. University Governance: Autonomy, Structures and Inclusiveness. In European Higher Education Area: The Impact of Past and Future Policies; Curaj, A., Deca, L., Pricopie, R., Eds.; Springer Open: Cham, Switzerland, 2021; pp. 619–638.
- Paspatis, A.; Fiorentzis, K.; Katsigiannis, Y.; Karapidakis, E. Smart Campus Microgrids towards a Sustainable Energy Transition— The Case Study of the Hellenic Mediterranean University in Crete. Mat. 2022, 10, 1065. [CrossRef]
- Sugiarto, A.; Lee, C.; Huruta, A. A Systematic Review of the Sustainable Campus Concept. Behav. Sci. 2022, 12, 130. [CrossRef]
- Wang, J.; Zhang, W.; Zhao, M.; Lai, X.; Chang, L.; Wang, Z. Efficiency of higher education financial resource allocation from the perspective of ‘double first-class’ construction: A three-stage global super slacks-based measure analysis. Edu. Inf. Tech., 2024, 29:12047–12075.
- Ganshina, E. Static and dynamic approaches in industrial metrology in the framework of measuring enterprise productivity. J. Phys. Conf. Ser. 2021, 1889, 042053.
- Eklund,J. Theknowledge-incentive tradeoff: Understanding the relationship between research and development decentralization and innovation. Strat. Manag. J. 2022, 43, 2478–2509. [CrossRef]
- Salvadorinho, J.; Teixeira, L. Stories Told by Publications about the Relationship between Industry 4.0 and Lean: Systematic Literature Review and Future Research. Agenda Publ. 2021, 9, 29. [CrossRef]
- Dehbozorgi, M.; Rossi, M.; Terzi, S.; Carminati, L.; Sala, R.; Magni, F.; Pirola, F.; Pozz, R.; Strozzi, F.; Rossi, T. AI Education for Tomorrow's Workforce: Leveraging Learning Factories for AI Education and Workforce Preparedness. 2024 IEEE 8th Forum on Research and Technologies for Society and Industry Innovation (RTSI), 2024, IEEE pp677-682.
- Konstantinidis, E.; Petsani, D.; Bamidis, P. Teaching university students co-creation and living lab methodologies through experiential learning activities and preparing them for RRI. Health Inform. J., 2021, 27, 1460458221991204. [CrossRef]
- Nhem, D. Quality in higher education: what do students in Cambodia perceive? Tert. Edu. Man, 2022, 28, 43–59. [CrossRef]
- Yigitcanlar, T.; Agdas, D.; Degirmenci, K. Artificial intelligence in local governments: perceptions of city managers on prospects, constraints and choices. AI & Society, 2023, 38(3), 1135-1150. [CrossRef]
Figure 1.
Case study plan.
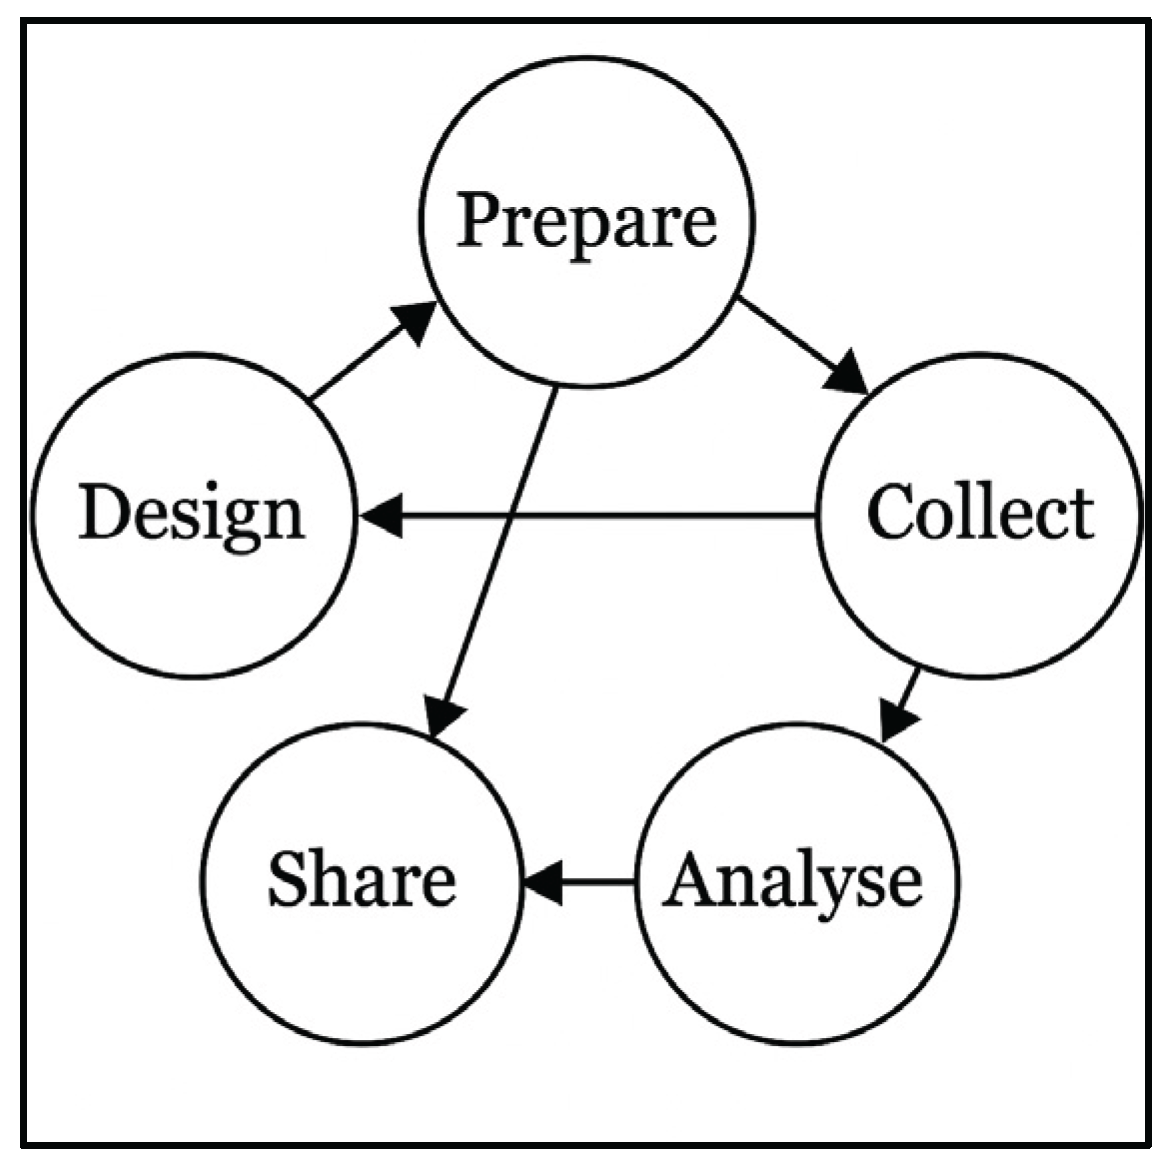
Figure 2.
Descriptive case study path.
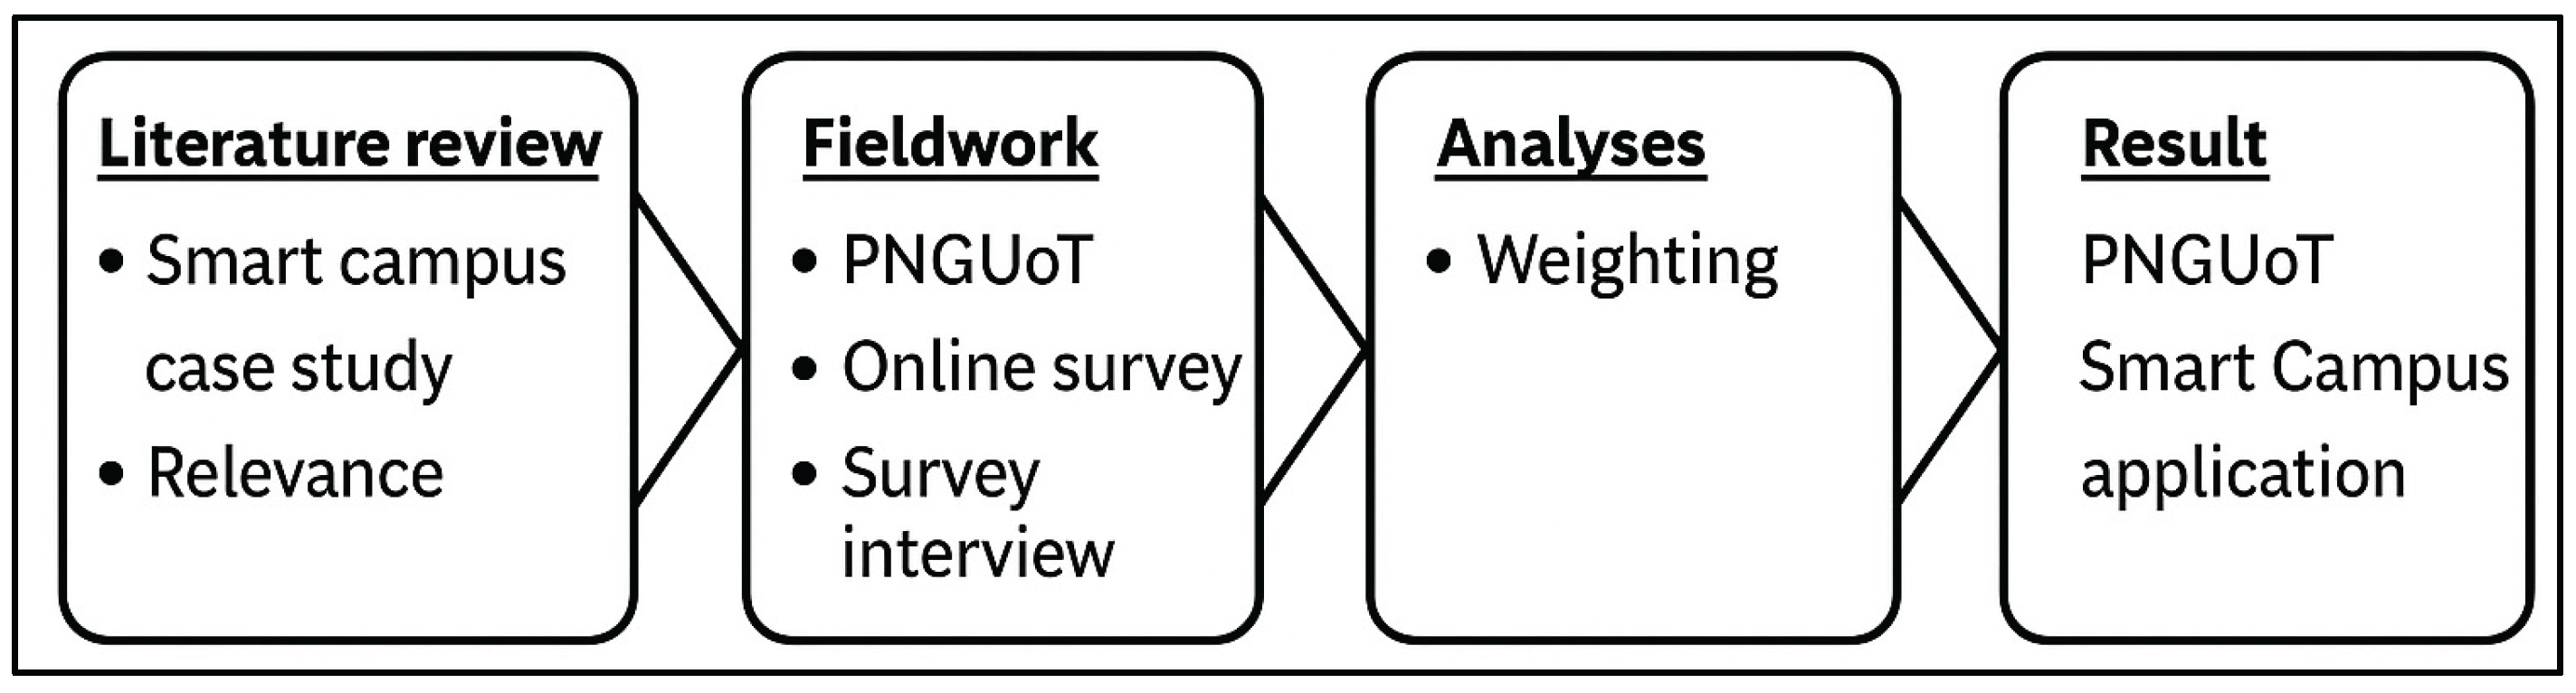
Figure 3.
Smart campus framework.
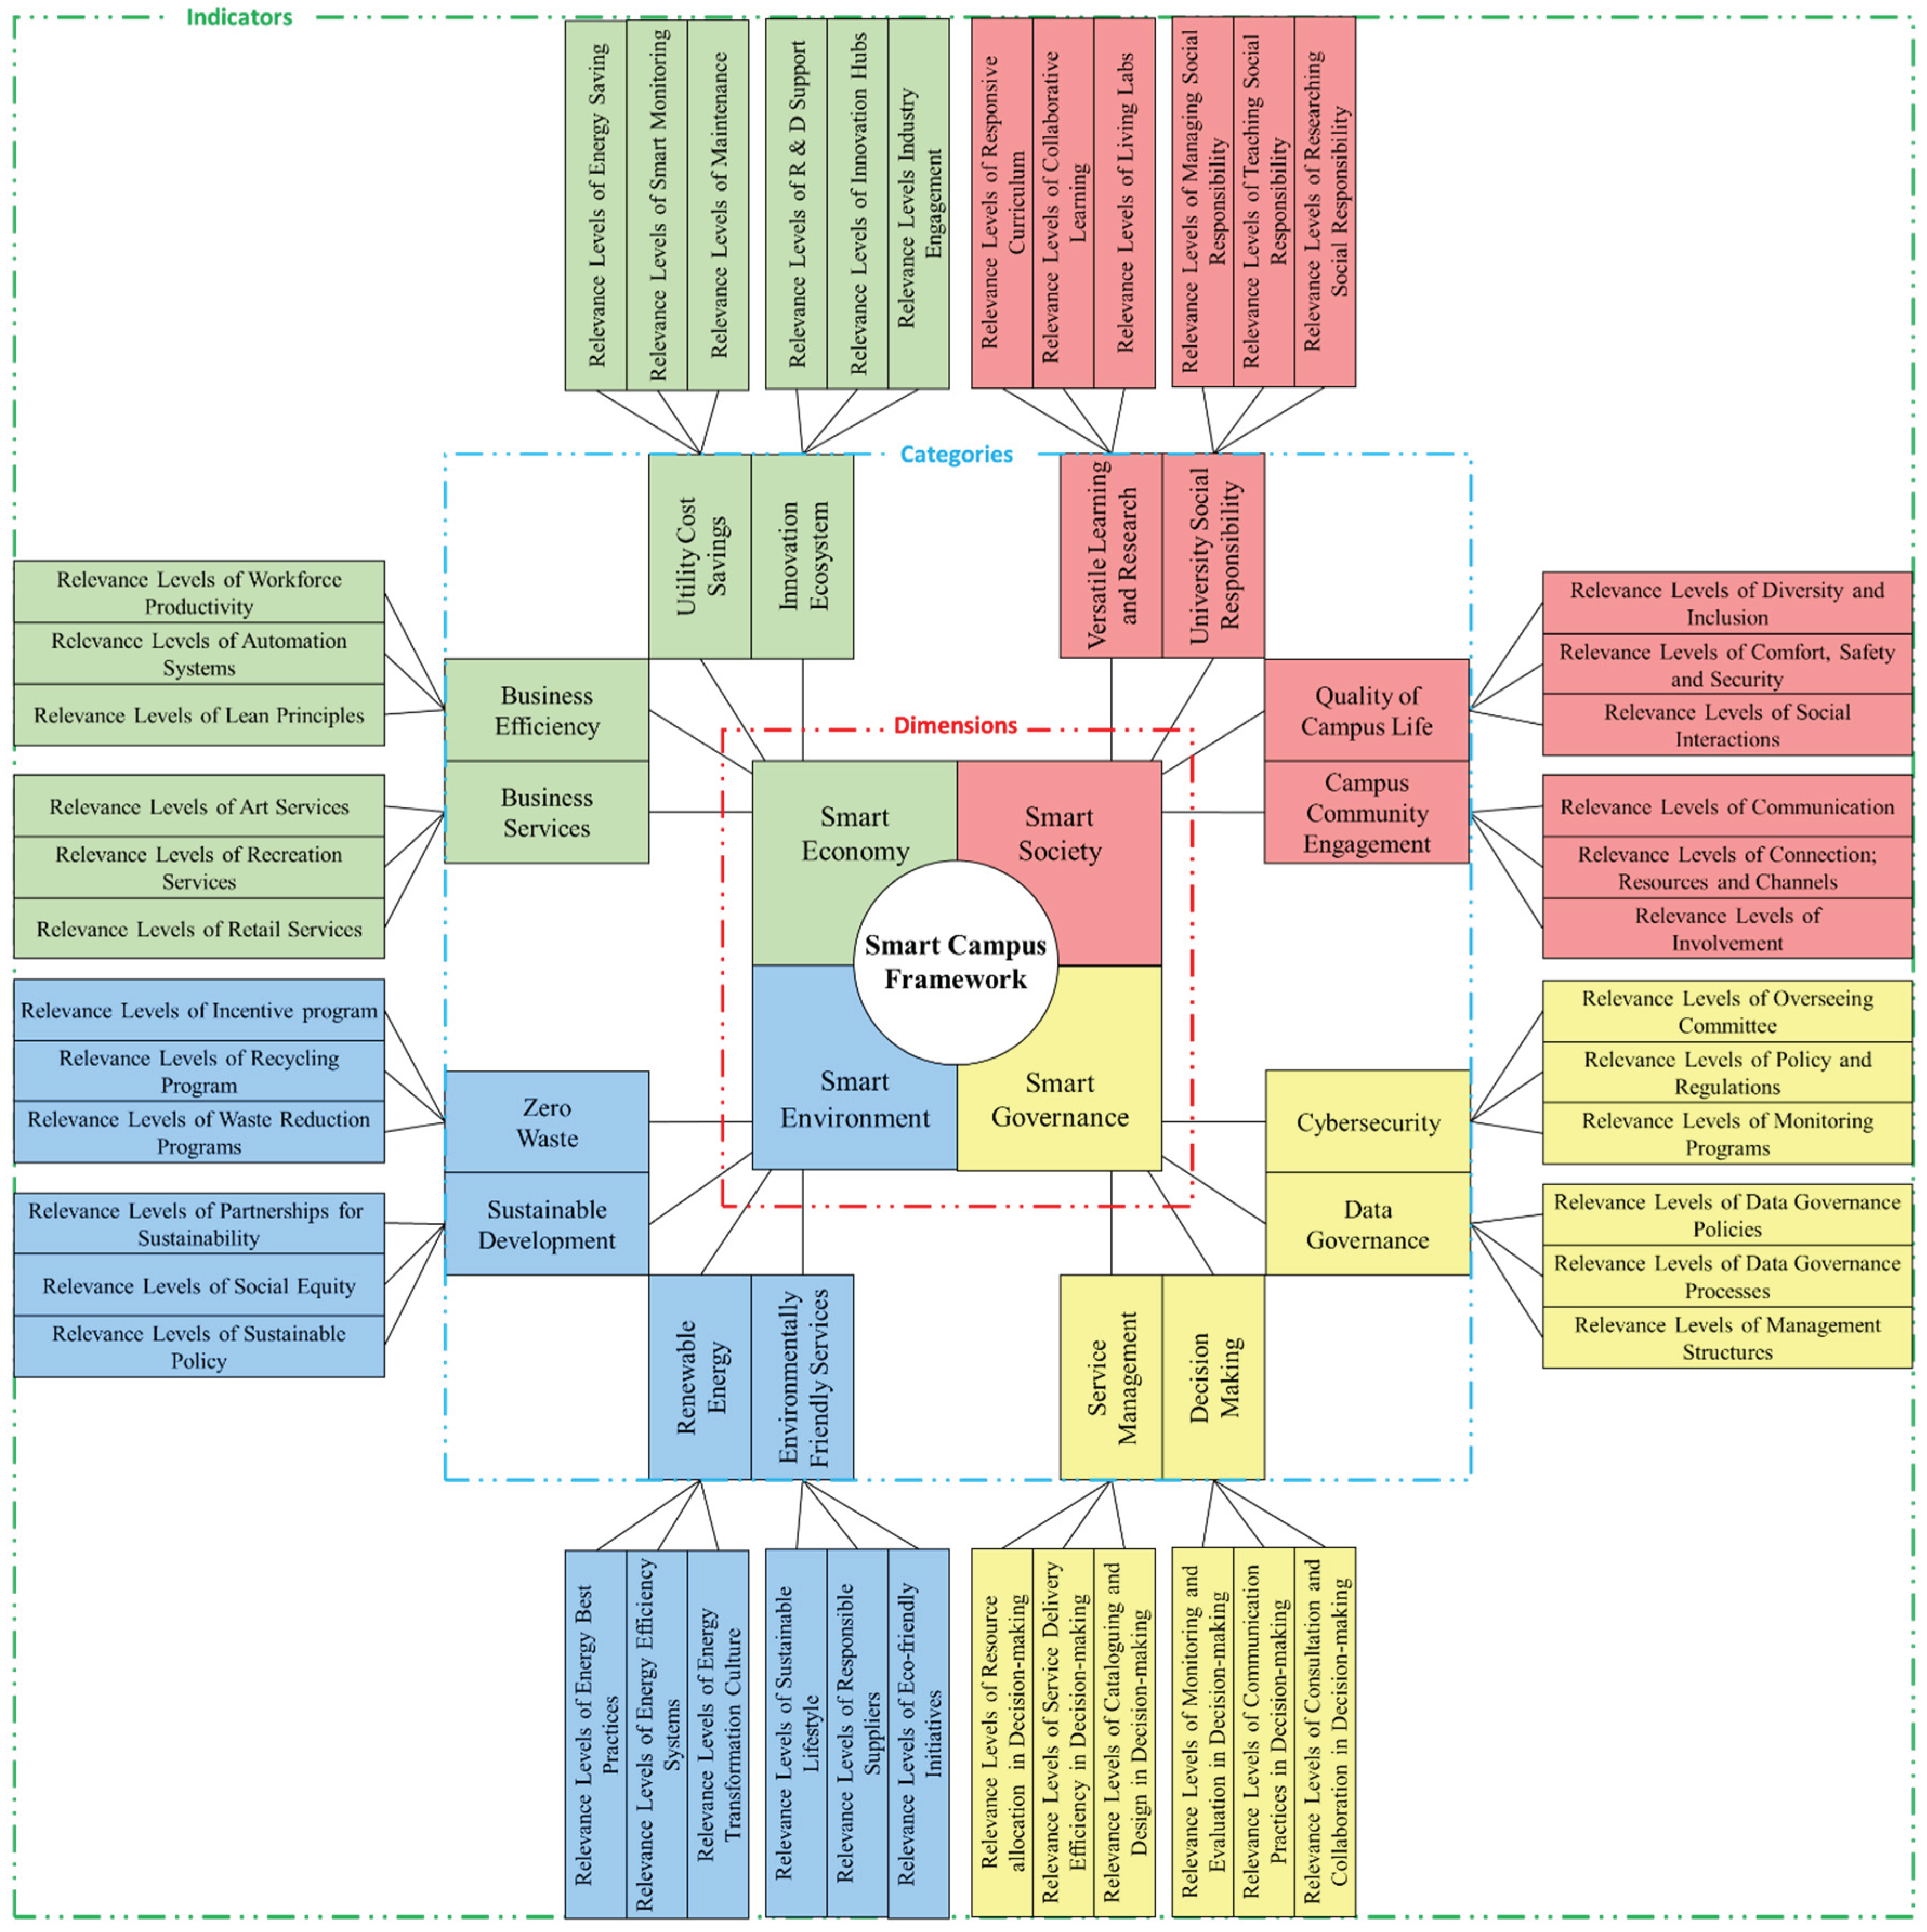
Figure 4.
The relative importance of smart campus dimensions.
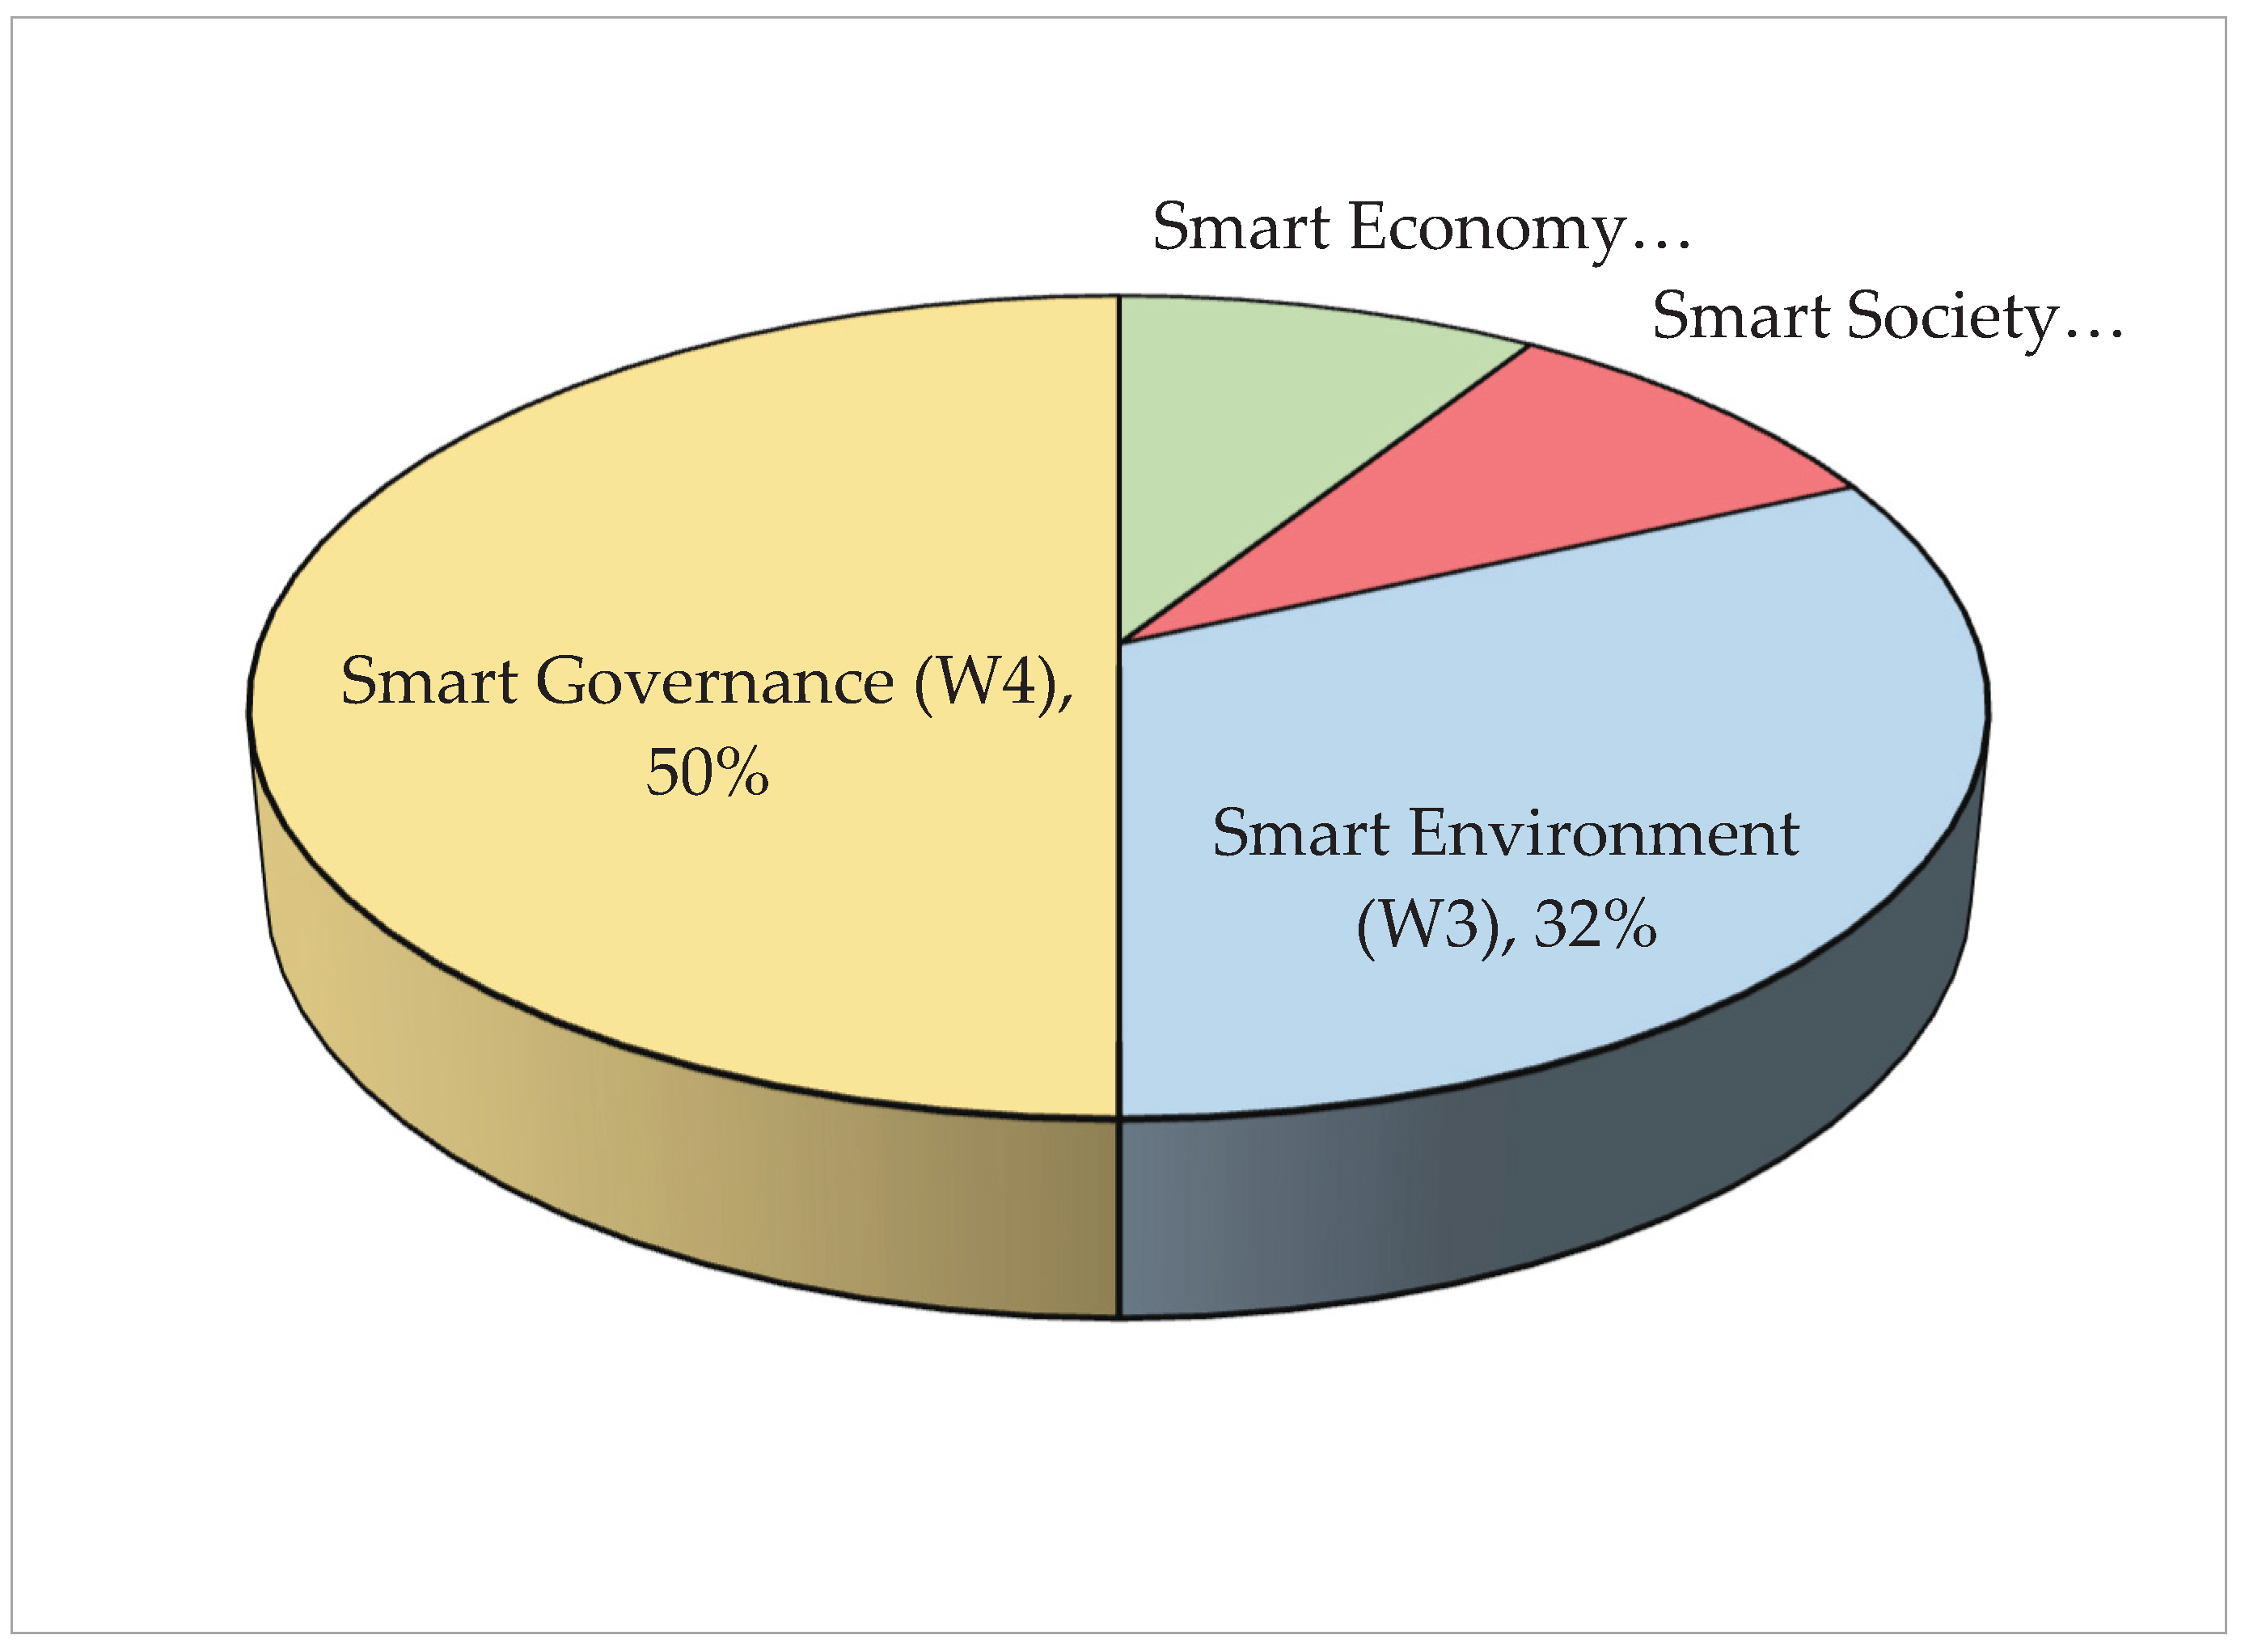
Figure 5.
The relative importance of smart economy categories. .
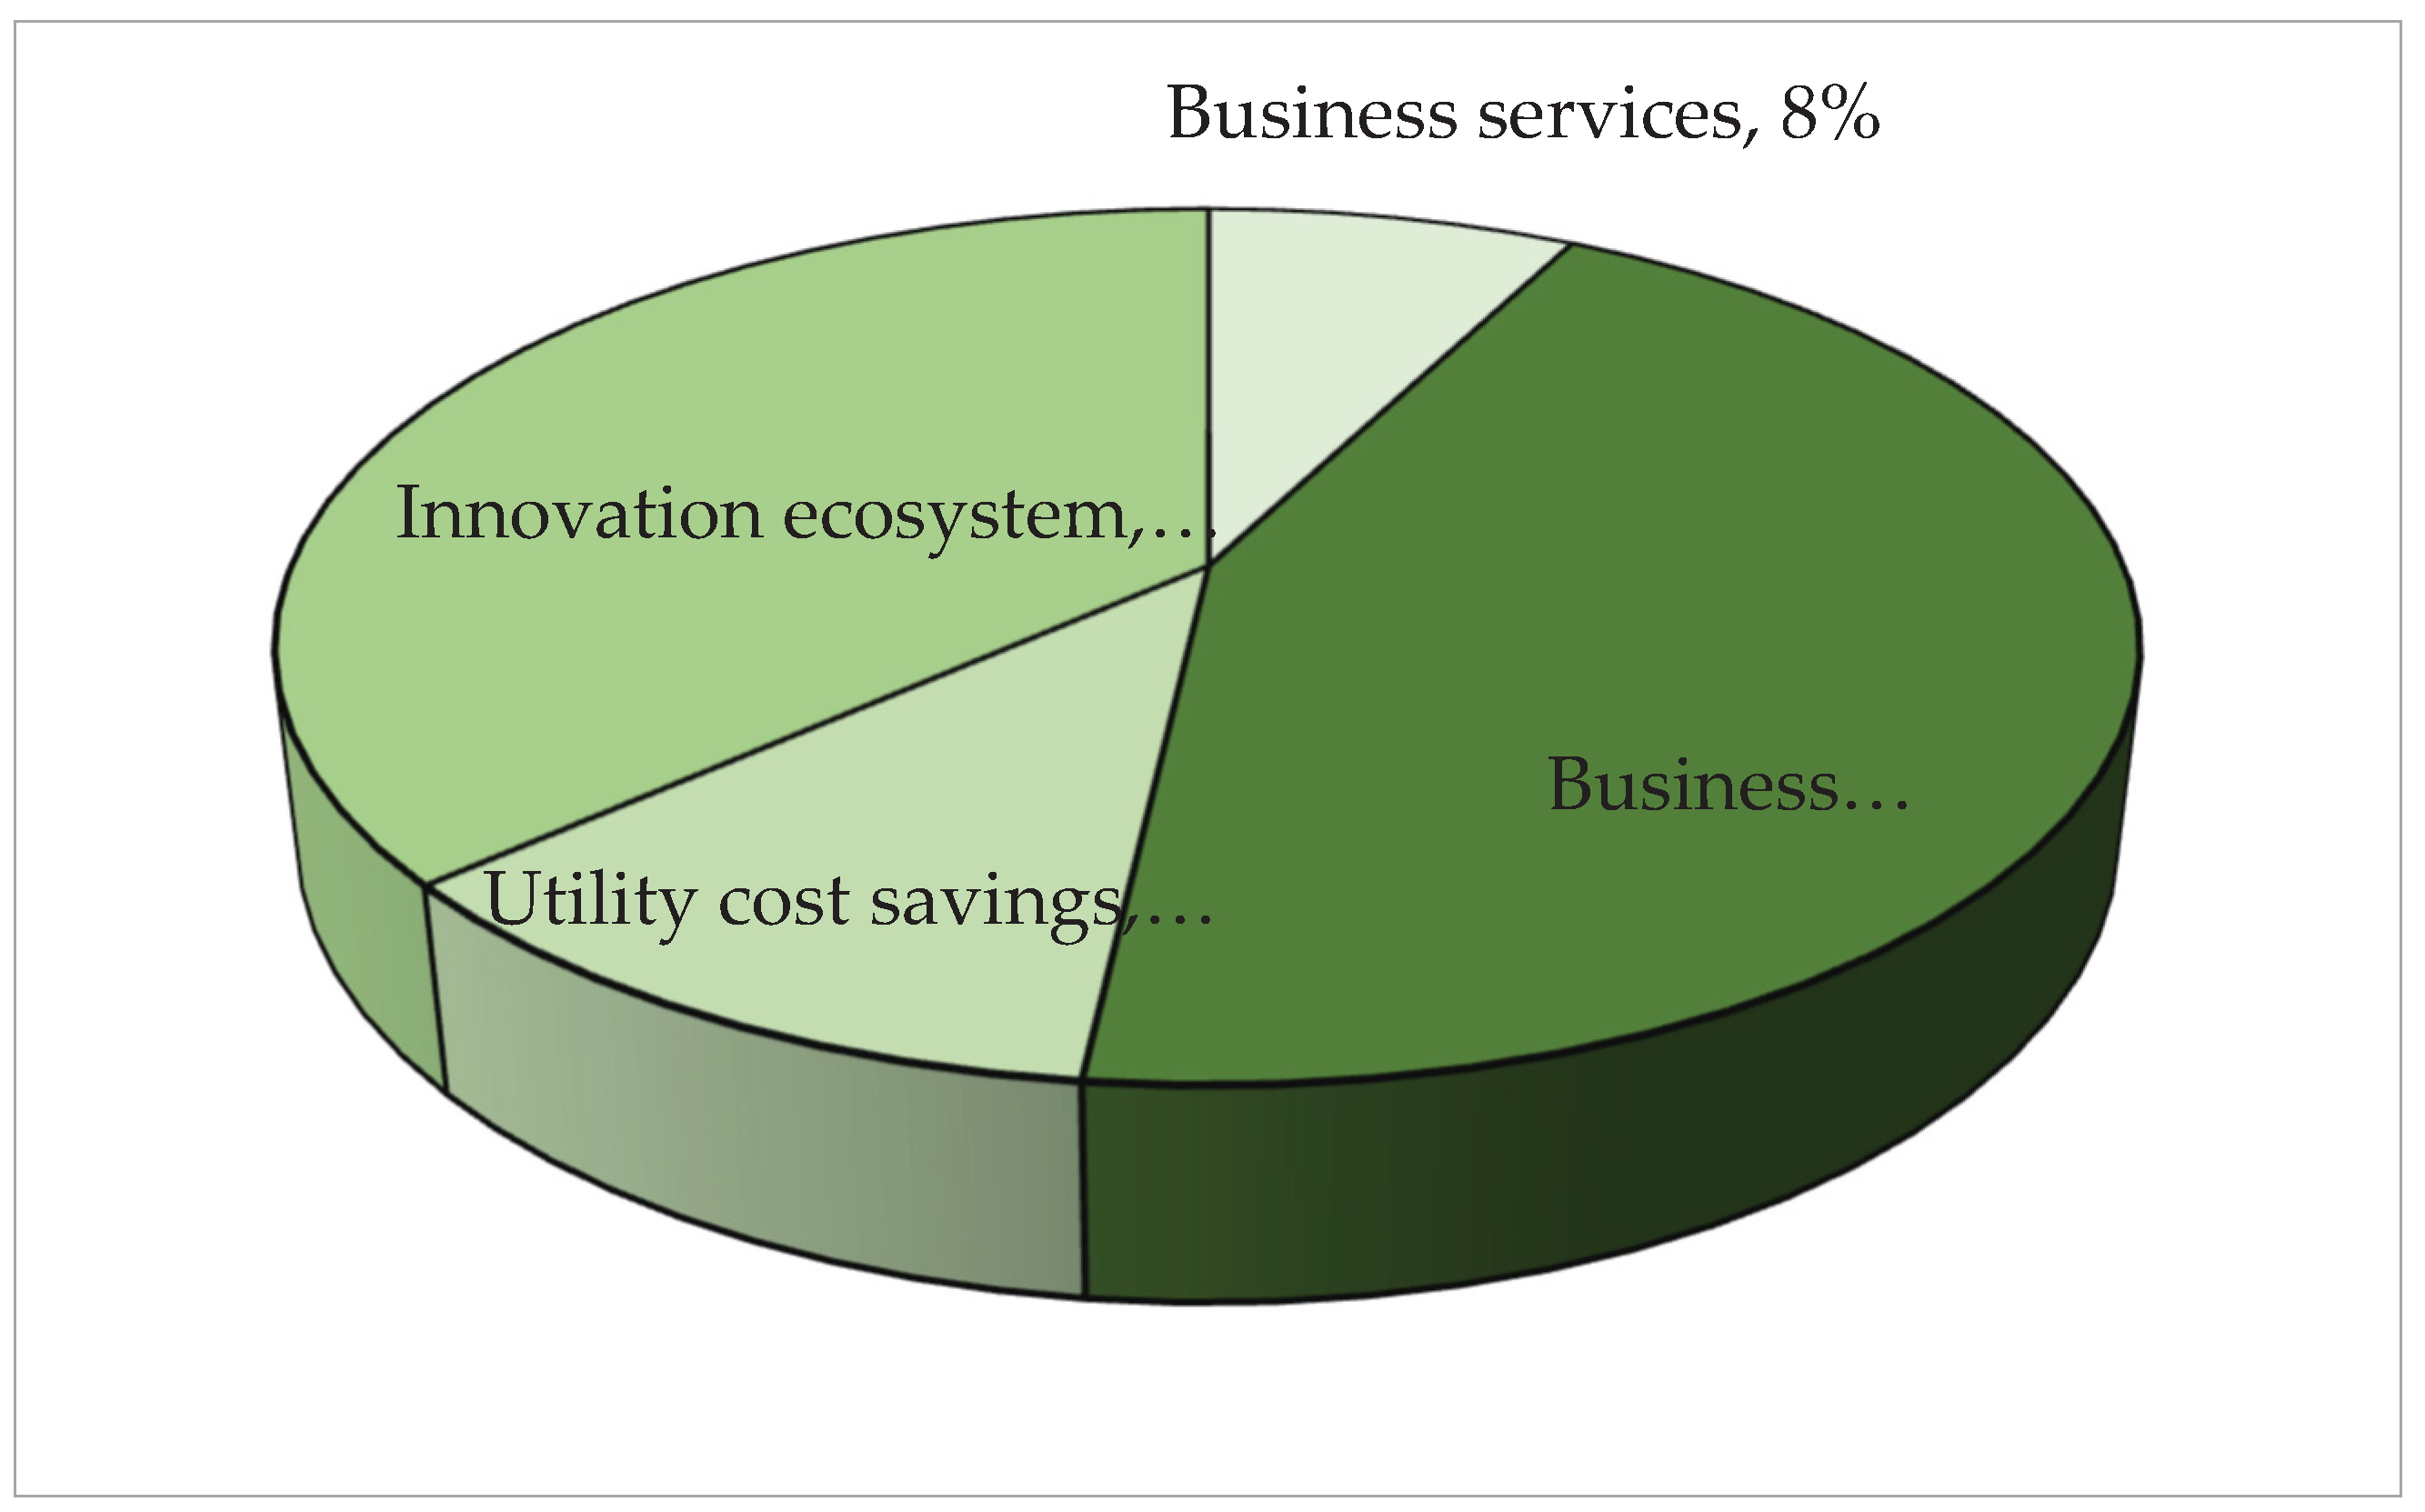
Figure 6.
The relative importance of smart society categories.
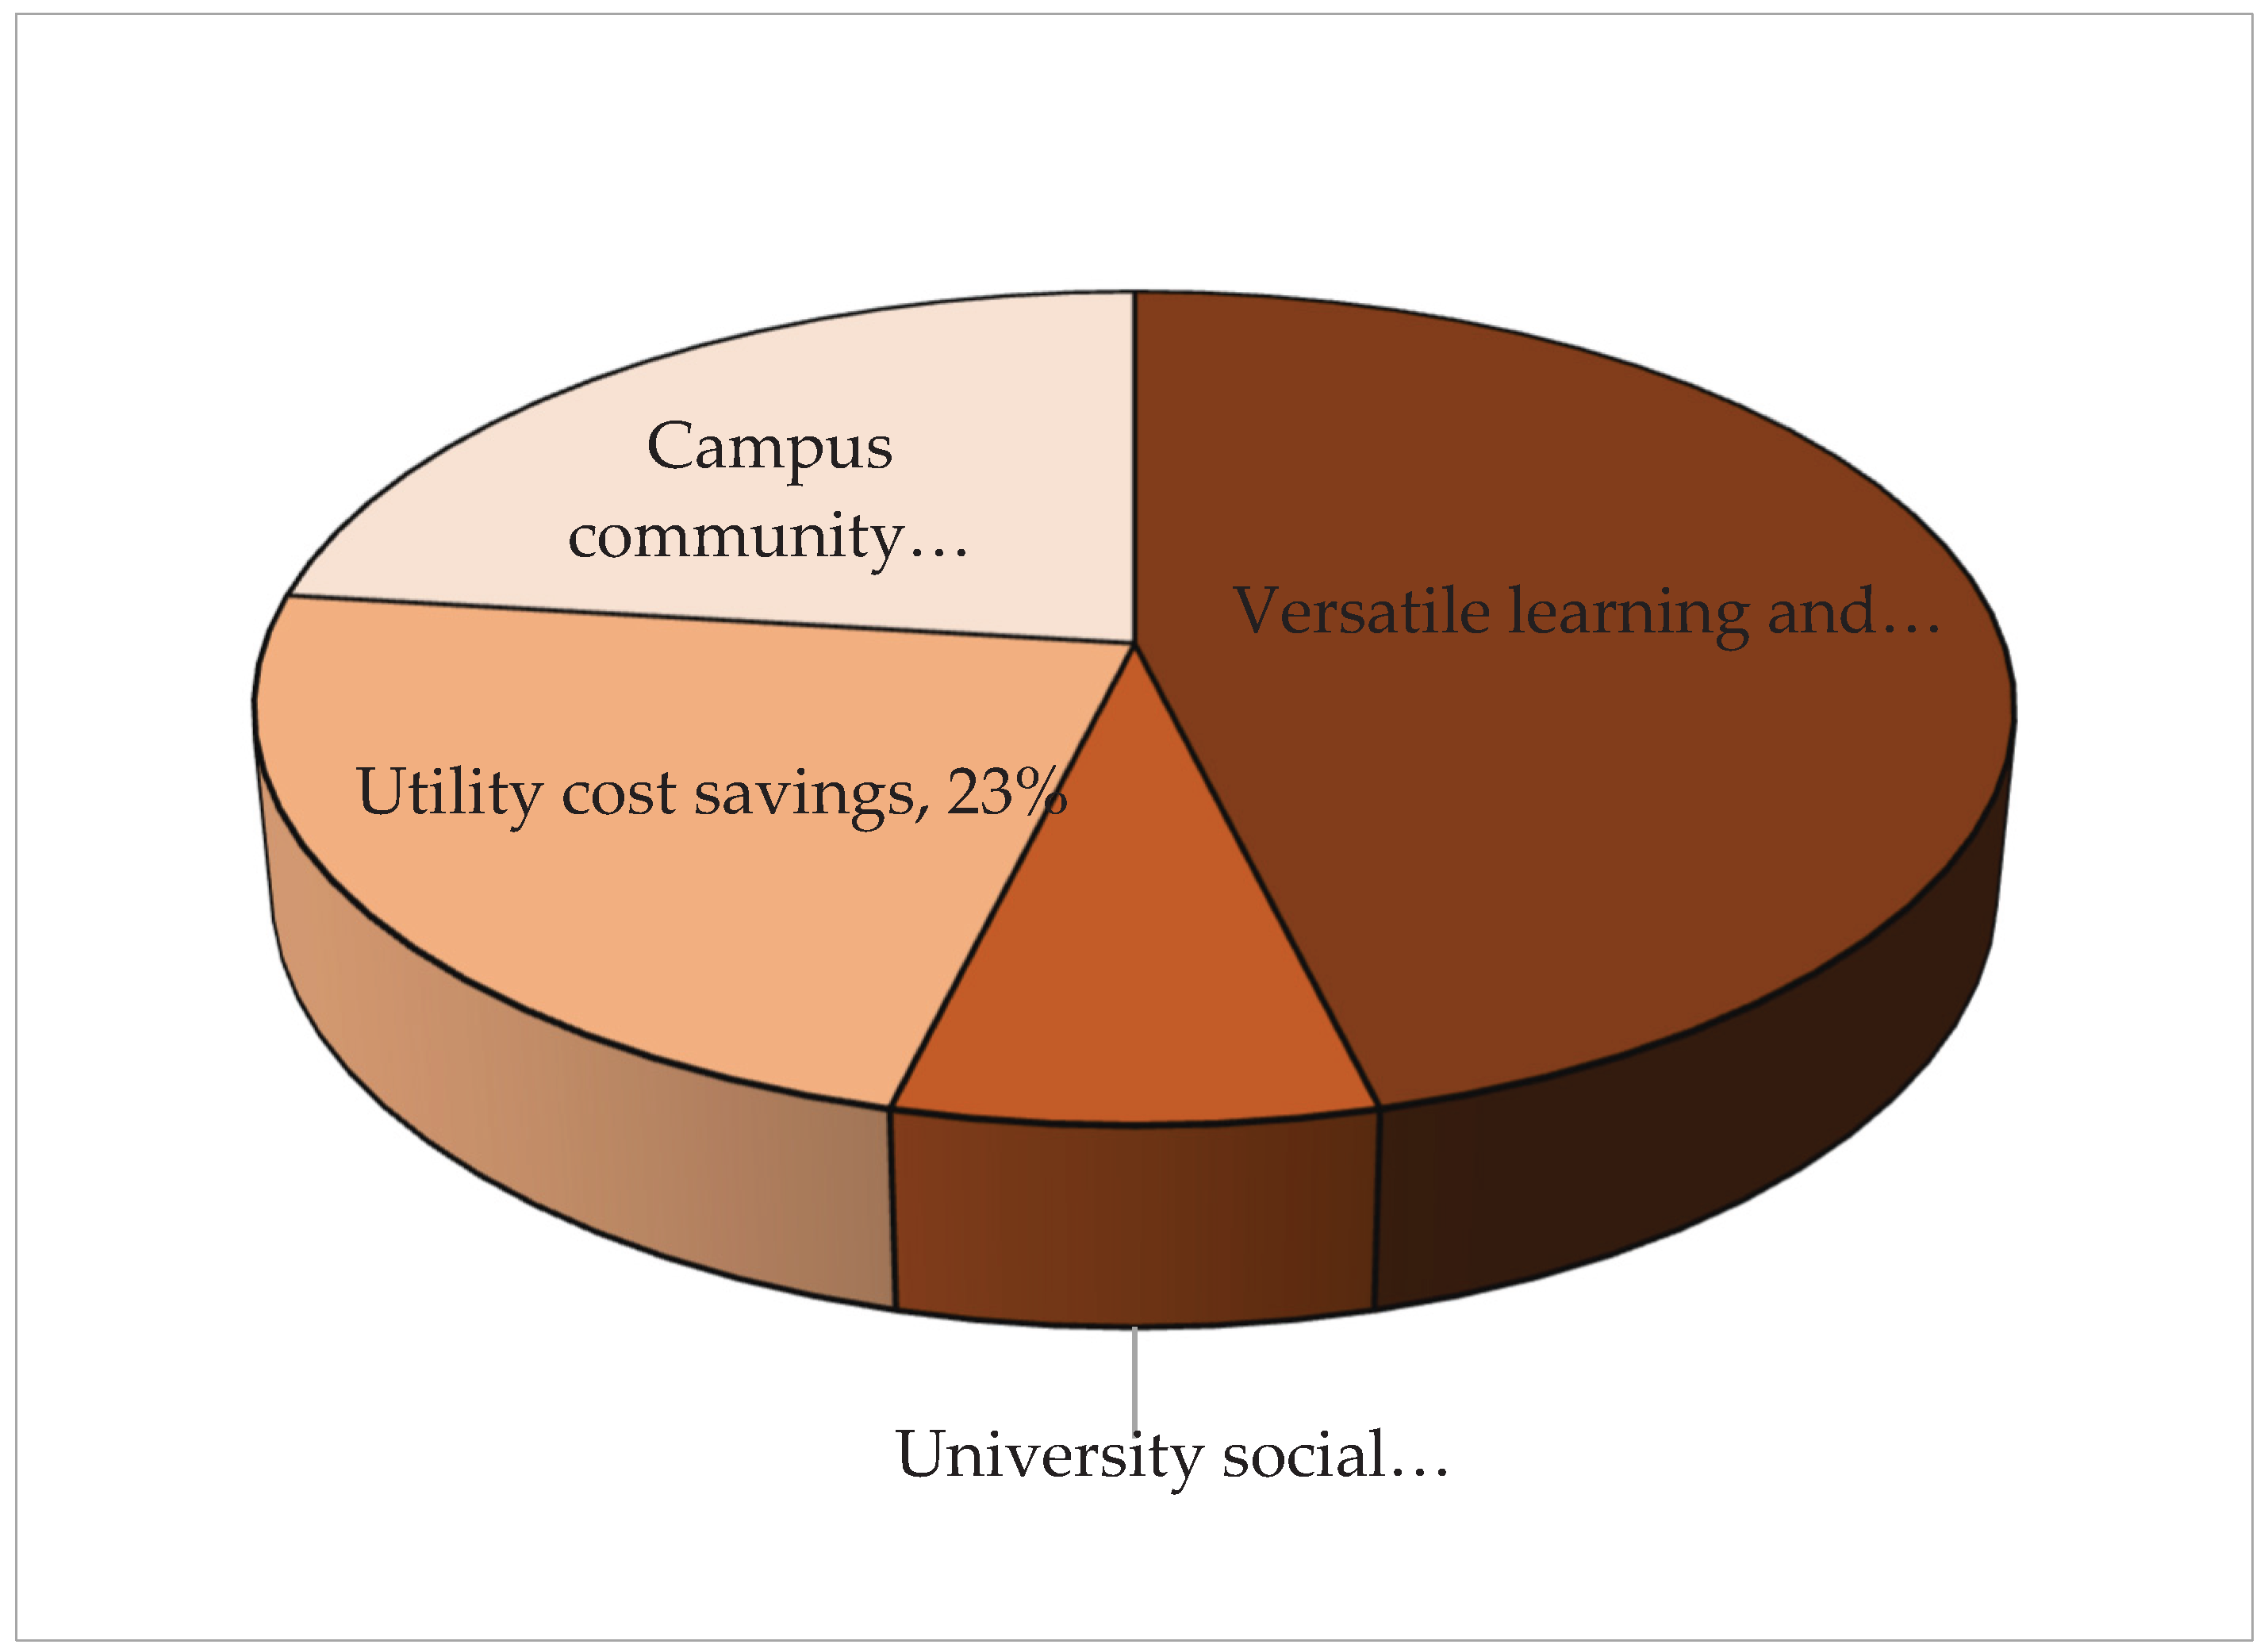
Figure 7.
The relative importance of smart environment categories.
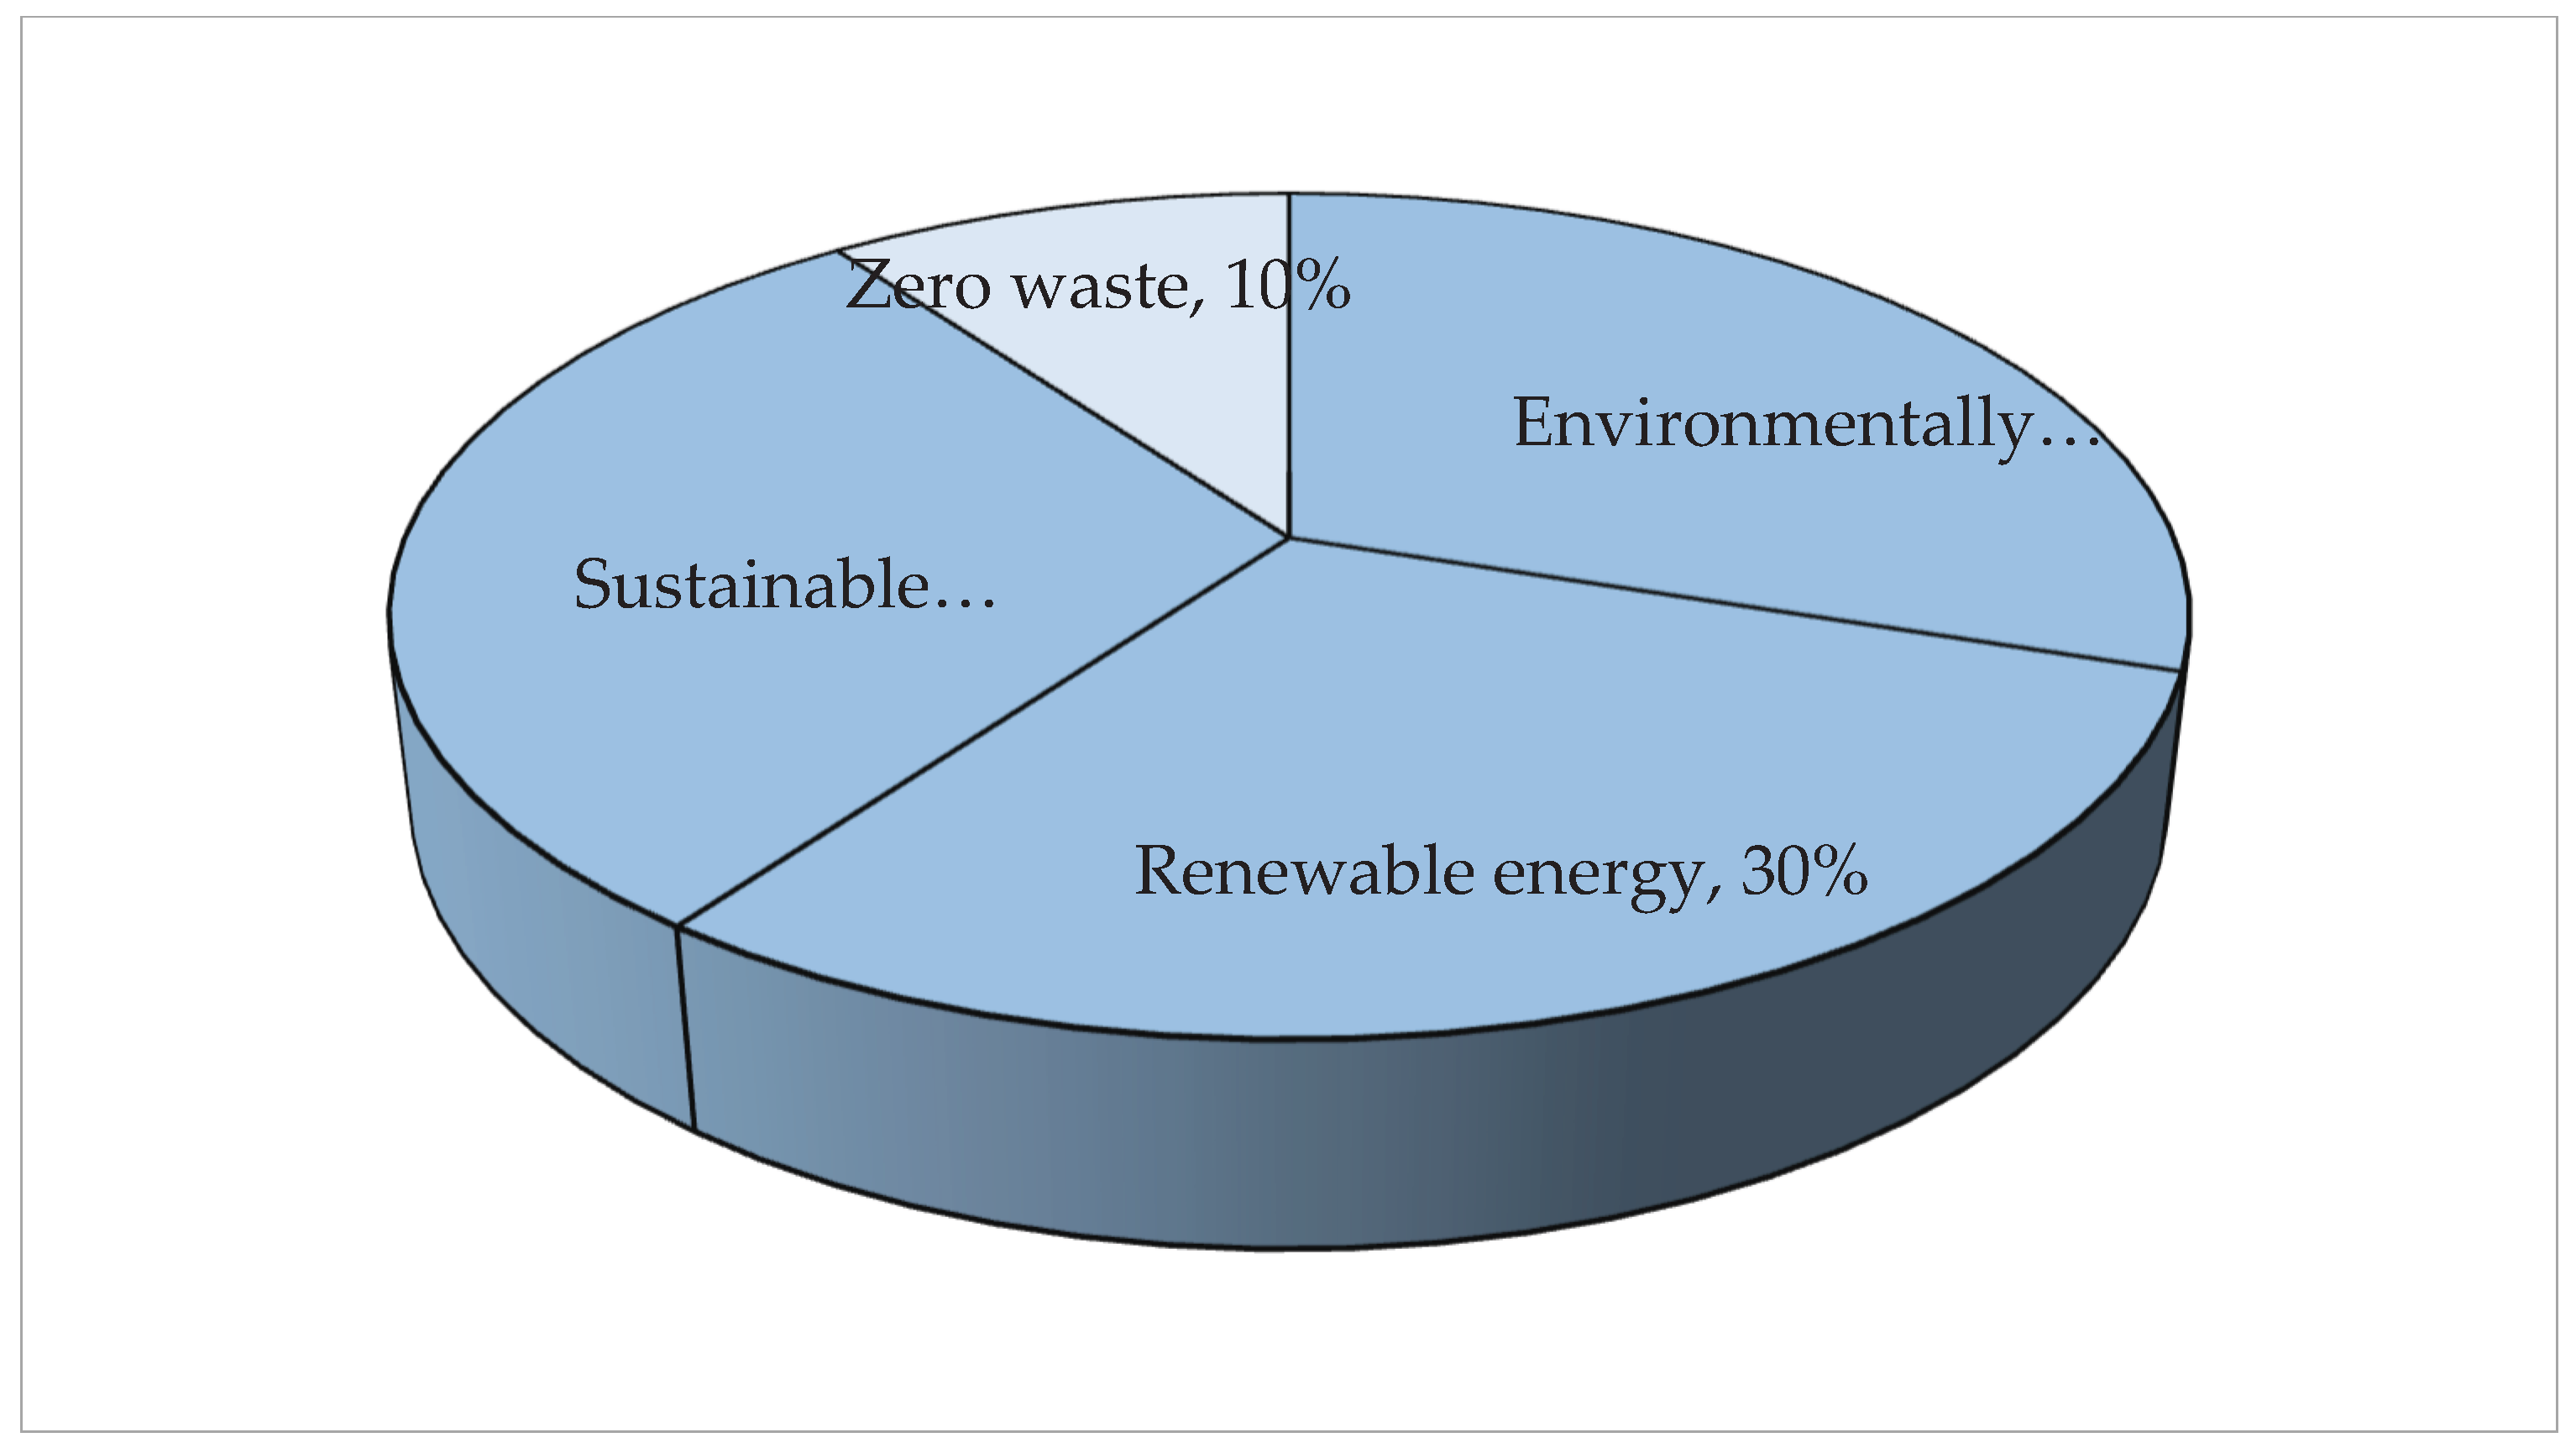
Figure 8.
The relative importance of smart governance categories.
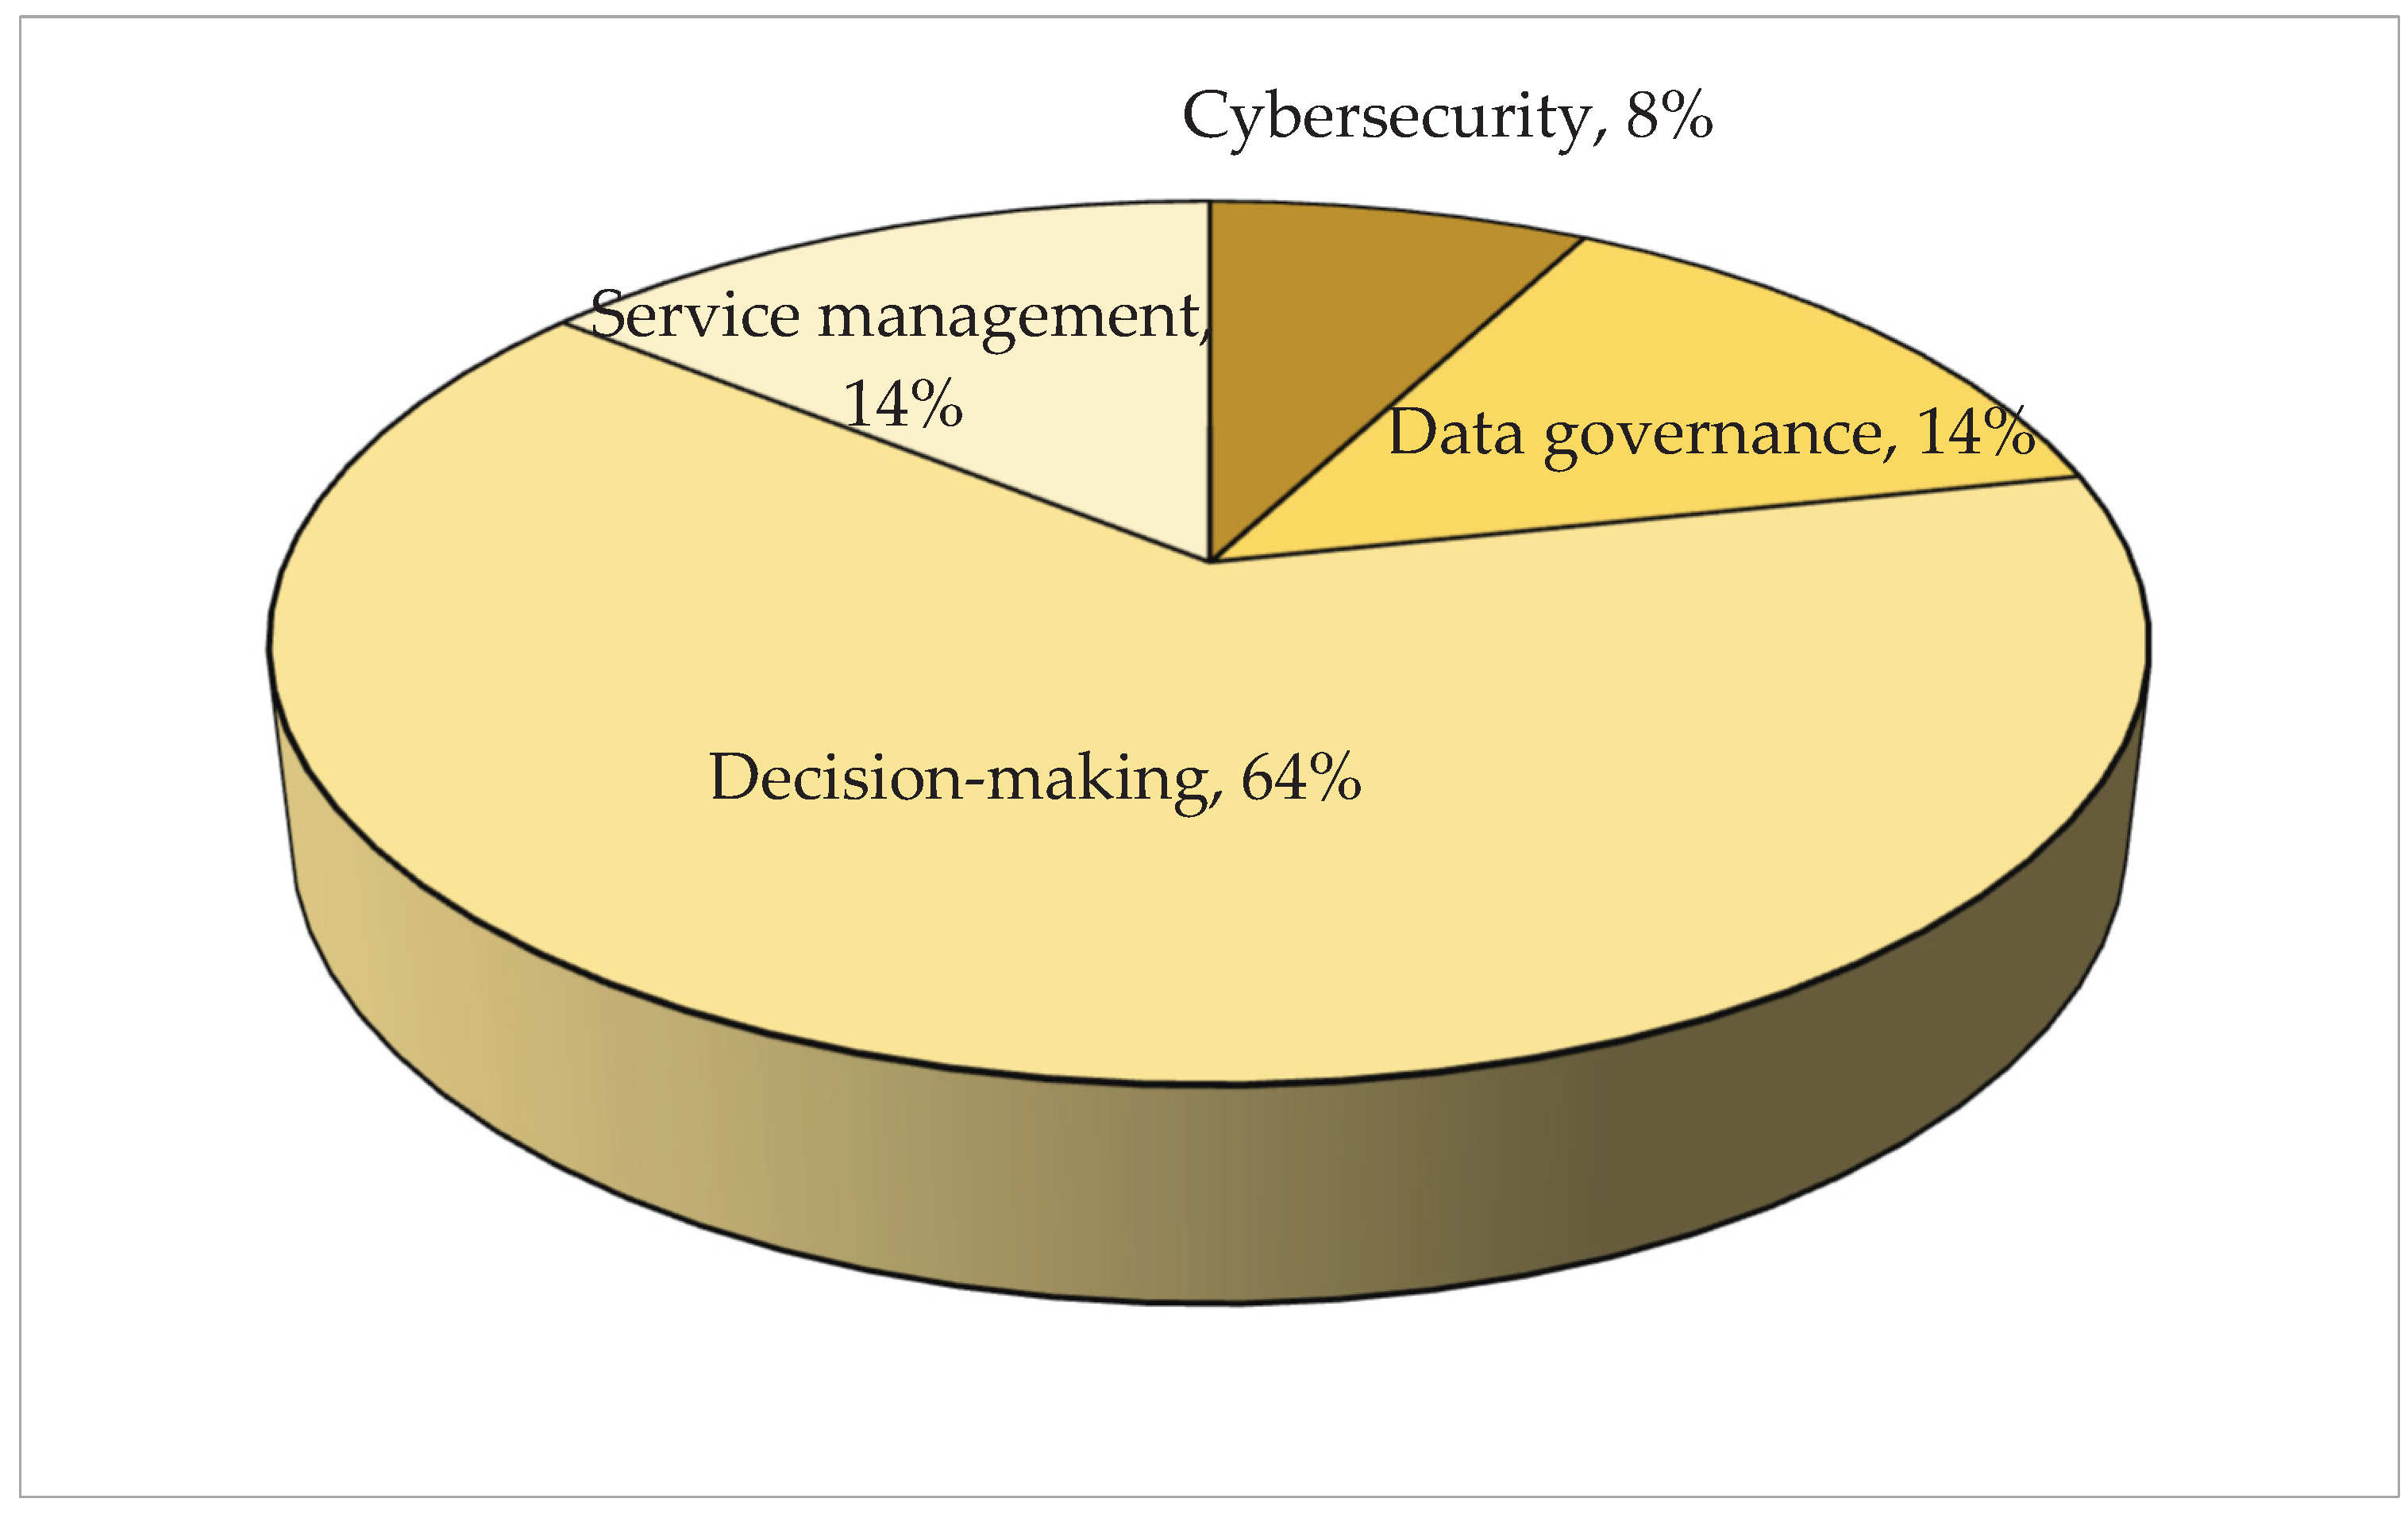
Figure 9.
Groups aggregated weights. Nonetheless, the stronger performance of pedagogical indicators signals possible entry points for improvement. Curriculum reform, interdisciplinary learning environments, and lab-based pedagogy can serve as low-cost, high-impact strategies to enhance academic outcomes and graduate employability—goals consistent with sustainable smart campus development [19,21].
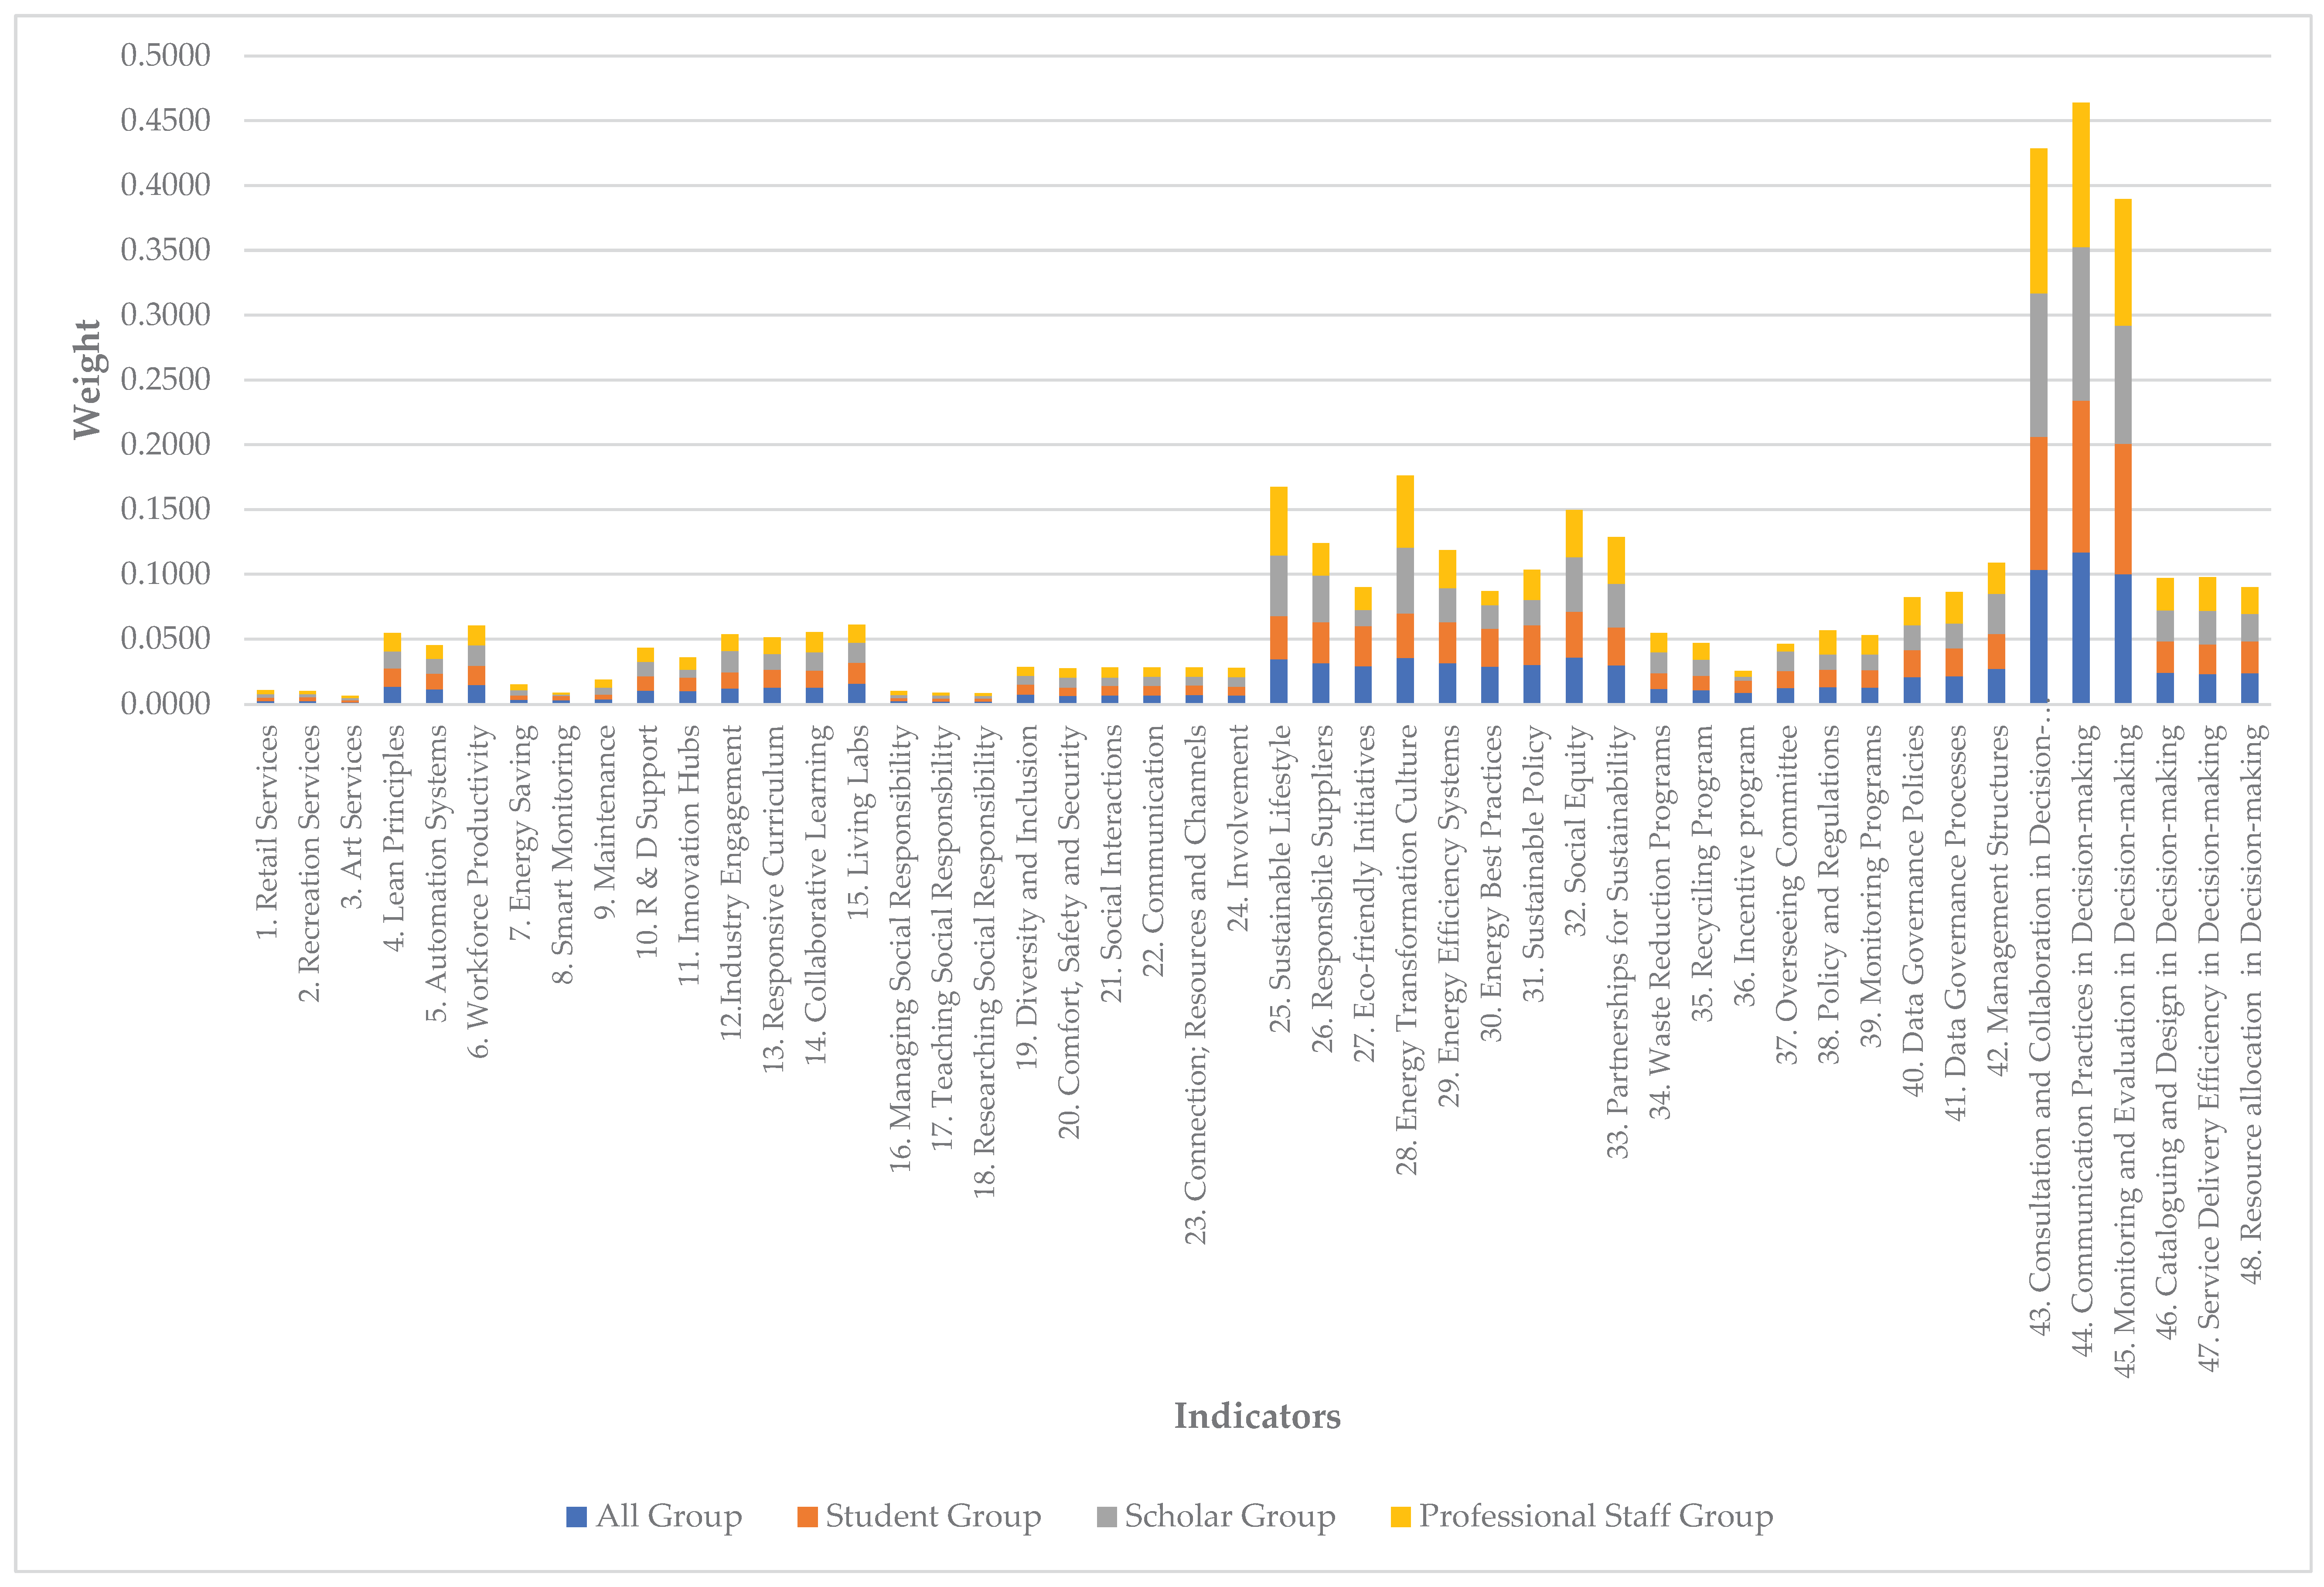

Table 1.
Smart campus assessment framework.
| Dimension | Category | Indicator |
| Smart Economy | Business Services |
Retail Services |
| Recreation Services | ||
| Art Services | ||
| Business Efficiency |
Lean Principles | |
| Automation Systems | ||
| Workforce Productivity | ||
| Utility Cost Savings |
Energy Saving | |
| Smart Monitoring | ||
| Maintenance | ||
| Innovation Ecosystem |
R&D Support | |
| Innovation Hubs | ||
| Industry Engagement | ||
| Smart Society |
Versatile Learning and Research |
Responsive Curriculum |
| Collaborative Learning | ||
| Living Labs | ||
| University Social Responsibility |
Managing Social Responsibility | |
| Teaching Social Responsibility | ||
| Researching Social Responsibility | ||
| Quality Of Campus Life |
Diversity and Inclusion | |
| Comfort, Safety and Security | ||
| Social Interactions | ||
| Campus Community Engagement |
Communication | |
| Connection; Resources and Channels | ||
| Involvement | ||
| Smart Environment |
Environmentally Friendly Services |
Sustainable Lifestyle |
| Responsible Suppliers | ||
| Eco-friendly Initiatives | ||
| Renewable Energy |
Energy Transformation Culture | |
| Energy Efficiency Systems | ||
| Energy Best Practices | ||
| Sustainable Development |
Sustainable Policy | |
| Social Equity | ||
| Partnerships for Sustainability | ||
| Zero Waste | Waste Reduction Programs | |
| Recycling Program | ||
| Incentive program | ||
| Smart Governance | Cybersecurity |
Overseeing Committee |
| Policy and Regulations | ||
| Monitoring Programs | ||
| Data Governance |
Data Governance Policies | |
| Data Governance Processes | ||
| Management Structures | ||
| Decision-Making |
Consultation and Collaboration | |
| Communication Practices | ||
| Monitoring and Evaluation | ||
| Service Management | Cataloguing and Design | |
| Service Delivery Efficiency | ||
| Resource allocation |
Table 2.
Typical 5-point online Likert scale question.
| Indicator | 0 (not available) | 1 (Very irrelevant) | 2 (Irrelevant) | 3 (Neither relevant or irrelevant) | 4 (Relevant) | 5 (Very relevant) |
| Retail services: Variety of food, retail and other business services |  |
|
|
|
|
|
Table 3.
Target interview survey questions.
| School / section: Estates and services |
0 (not available) | 1 (Very irrelevant) | 2 (Irrelevant) | 3 (Neither relevant or irrelevant) | 4 (Relevant) | 5 (Very relevant) |
| Retail services: Variety of food, retail and other business services | |
|
|
|
|
|
Table 4.
The importance weights of smart campus dimensions.
| Dimension | Weight |
| Smart Economy | W₁: 0.0909 |
| Smart Society | W₂: 0.0909 |
| Smart Environment | W₃: 0.3182 |
| Smart Governance | W₄: 0.5000 |
Table 5.
The importance weights of smart economy categories.
| Category | Weight |
| Business services | W₁: 0.0763 |
| Business efficiency | W₂: 0.4417 |
| Utility cost savings | W₃: 0.1165 |
| Innovation ecosystem | W₄: 0.3655 |
Table 6.
The importance weights of smart society categories.
| Category | Weight |
| Versatile learning and research | W₁: 0.4615 |
| University social responsibility | W₂: 0.0769 |
| Utility cost savings | W₃: 0.2308 |
| Campus community engagement | W₄: 0.2308 |
Table 7.
The importance weights of smart environment categories.
| Category | Weight |
| Environmentally friendly services | W₁: 0.3000 |
| Renewable energy | W₂: 0.3000 |
| Sustainable development | W₃: 0.3000 |
| Zero waste | W₄: 0.1000 |
Table 8.
The importance weights of smart governance categories.
| Category | Weight |
| Cybersecurity | W₁: 0.077960 |
| Data governance | W₂: 0.138595 |
| Decision-making | W₃: 0.641001 |
| Service management | W₄: 0.142445 |
Table 9.
The importance weights of indicators within their subgroups.
| Dimensions | Categories | Indicators | All participants | Students | Scholars | Administrative/ professional staff | ||||
| Mean score | Indicator weight | Mean score | Indicator weight | Mean score | Indicator weight | Mean score | Indicator weight | |||
| 1. Smart economy | 1. Business services | 1. Relevance Levels of Retail Services | 2.6403 | 0.3722 | 2.6102 | 0.3679 | 2.7692 | 0.3871 | 3.1818 | 0.4545 |
| 2. Relevance Levels of Recreation Services | 2.7590 | 0.3889 | 2.7874 | 0.3929 | 2.6923 | 0.3763 | 2.1818 | 0.3117 | ||
| 3. Relevance Levels of Art Services | 1.6942 | 0.2388 | 1.6969 | 0.2392 | 1.6923 | 0.2366 | 1.6364 | 0.2338 | ||
| 2. Business efficiency | 4. Relevance Levels of Lean Principles | 2.2419 | 0.3426 | 2.2016 | 0.3428 | 2.2308 | 0.3258 | 3.1818 | 0.3535 | |
| 5. Relevance Levels of Automation Systems | 1.9029 | 0.2908 | 1.8819 | 0.2930 | 1.9231 | 0.2809 | 2.3636 | 0.2626 | ||
| 6. Relevance Levels of Workforce Productivity | 2.3993 | 0.3666 | 2.3386 | 0.3641 | 2.6923 | 0.3933 | 3.4545 | 0.3838 | ||
| 3. Utility cost savings | 7. Relevance Levels of Energy Saving | 1.8597 | 0.3293 | 1.8583 | 0.3255 | 1.7692 | 0.3898 | 2.0000 | 0.3607 | |
| 8. Relevance Levels of Smart Monitoring | 1.7230 | 0.3051 | 1.8346 | 0.3214 | 0.4615 | 0.1017 | 0.6364 | 0.1148 | ||
| 9. Relevance Levels of Maintenance | 2.0647 | 0.3656 | 2.0157 | 0.3531 | 2.3077 | 0.5085 | 2.9091 | 0.5246 | ||
| 4. Innovation ecosystem | 10. Relevance Levels of R & D Support | 2.1619 | 0.3223 | 2.1890 | 0.3218 | 2.0000 | 0.3333 | 1.7273 | 0.3220 | |
| 11. Relevance Levels of Innovation Hubs | 2.0468 | 0.3051 | 2.1181 | 0.3113 | 1.0769 | 0.1795 | 1.5455 | 0.2881 | ||
| 12.Relevance Levels Industry Engagement | 2.5000 | 0.3727 | 2.4961 | 0.3669 | 2.9231 | 0.4872 | 2.0909 | 0.3898 | ||
| 2. Smart society | 5. Versatile learning and research | 13. Relevance Levels of Responsive Curriculum | 2.5576 | 0.3128 | 2.5787 | 0.3143 | 2.6154 | 0.2931 | 2.0000 | 0.3014 |
| 14. Relevance Levels of Collaborative Learning | 2.5360 | 0.3102 | 2.5157 | 0.3066 | 3.0000 | 0.3362 | 2.4545 | 0.3699 | ||
| 15. Relevance Levels of Living Labs | 3.0827 | 0.3770 | 3.1102 | 0.3791 | 3.3077 | 0.3707 | 2.1818 | 0.3288 | ||
| 6. University social responsibility | 16. Relevance Levels of Managing Social Responsibility | 2.6835 | 0.3531 | 2.6496 | 0.3509 | 3.0000 | 0.3391 | 3.0909 | 0.4250 | |
| 17. Relevance Levels of Teaching Social Responsibility | 2.4281 | 0.3195 | 2.3976 | 0.3175 | 3.3077 | 0.3739 | 2.0909 | 0.2875 | ||
| 18. Relevance Levels of Researching Social Responsibility | 2.4892 | 0.3275 | 2.5039 | 0.3316 | 2.5385 | 0.2870 | 2.0909 | 0.2875 | ||
| 7. Quality of campus life | 19. Relevance Levels of Diversity and Inclusion | 3.0216 | 0.3540 | 2.9528 | 0.3583 | 3.8462 | 0.3311 | 3.6364 | 0.3101 | |
| 20. Relevance Levels of Comfort, Safety and Security | 2.6691 | 0.3127 | 2.5394 | 0.3082 | 4.1538 | 0.3576 | 3.9091 | 0.3333 | ||
| 21. Relevance Levels of Social Interactions | 2.8453 | 0.3333 | 2.7480 | 0.3335 | 3.6154 | 0.3113 | 4.1818 | 0.3566 | ||
| 8. Campus community engagement | 22. Relevance Levels of Communication | 2.8165 | 0.3355 | 2.7283 | 0.3352 | 3.6923 | 0.3357 | 3.8182 | 0.3415 | |
| 23. Relevance Levels of Connection; Resources and Channels | 2.8381 | 0.3381 | 2.7638 | 0.3395 | 3.5385 | 0.3217 | 3.7273 | 0.3333 | ||
| 24. Relevance Levels of Involvement | 2.7401 | 0.3264 | 2.6482 | 0.3253 | 3.7692 | 0.3427 | 3.6364 | 0.3252 | ||
| 3. Smart environment | 9. Environmentally friendly services | 25. Relevance Levels of Sustainable Lifestyle | 2.4604 | 0.3629 | 2.3622 | 0.3484 | 3.6923 | 0.4898 | 3.2727 | 0.5538 |
| 26. Relevance Levels of Responsible Suppliers | 2.2410 | 0.3305 | 2.2402 | 0.3304 | 2.8462 | 0.3776 | 1.5455 | 0.2615 | ||
| 27. Relevance Levels of Eco-friendly Initiatives | 2.0791 | 0.3066 | 2.1772 | 0.3211 | 1.0000 | 0.1327 | 1.0909 | 0.1846 | ||
| 10. Renewable energy | 28. Relevance Levels of Energy Transformation Culture | 2.0755 | 0.3706 | 2.0906 | 0.3602 | 1.9231 | 0.5319 | 1.9091 | 0.5833 | |
| 29. Relevance Levels of Energy Efficiency Systems | 1.8453 | 0.3295 | 1.9252 | 0.3318 | 1.0000 | 0.2766 | 1.0000 | 0.3056 | ||
| 30. Relevance Levels of Energy Best Practices | 1.6799 | 0.2999 | 1.7874 | 0.3080 | 0.6923 | 0.1915 | 0.3636 | 0.1111 | ||
| 11. Sustainable development | 31. Relevance Levels of Sustainable Policy | 2.1223 | 0.3141 | 2.1693 | 0.3235 | 1.3846 | 0.2045 | 1.9091 | 0.2414 | |
| 32. Relevance Levels of Social Equity | 2.5288 | 0.3743 | 2.4843 | 0.3705 | 3.0000 | 0.4432 | 3.0000 | 0.3793 | ||
| 33. Relevance Levels of Partnerships for Sustainability | 2.1047 | 0.3115 | 2.0514 | 0.3060 | 2.3846 | 0.3523 | 3.0000 | 0.3793 | ||
| 12. Zero waste | 34. Relevance Levels of Waste Reduction Programs | 1.9101 | 0.3753 | 1.9252 | 0.3679 | 1.6154 | 0.5122 | 1.9091 | 0.4667 | |
| 35. Relevance Levels of Recycling Program | 1.7590 | 0.3456 | 1.7913 | 0.3424 | 1.2308 | 0.3902 | 1.6364 | 0.4000 | ||
| 36. Relevance Levels of Incentive program | 1.4209 | 0.2792 | 1.5157 | 0.2897 | 0.3077 | 0.0976 | 0.5455 | 0.1333 | ||
| 4. Smart governance | 13. Cybersecurity | 37. Relevance Levels of Overseeing Committee | 1.6799 | 0.3273 | 1.7874 | 0.3290 | 0.7692 | 0.3846 | 0.2727 | 0.1429 |
| 38. Relevance Levels of Policy and Regulations | 1.7338 | 0.3378 | 1.8268 | 0.3362 | 0.6154 | 0.3077 | 0.9091 | 0.4762 | ||
| 39. Relevance Levels of Monitoring Programs | 1.7194 | 0.3350 | 1.8189 | 0.3348 | 0.6154 | 0.3077 | 0.7273 | 0.3810 | ||
| 14. Data governance | 40. Relevance Levels of Data Governance Policies | 2.1367 | 0.3006 | 2.1496 | 0.3012 | 1.4615 | 0.2754 | 2.6364 | 0.3085 | |
| 41. Relevance Levels of Data Governance Processes | 2.2014 | 0.3097 | 2.2047 | 0.3089 | 1.4615 | 0.2754 | 3.0000 | 0.3511 | ||
| 42. Relevance Levels of Management Structures | 2.7698 | 0.3897 | 2.7835 | 0.3900 | 2.3846 | 0.4493 | 2.9091 | 0.3404 | ||
| 15. Decision-making | 43. Relevance Levels of Consultation and Collaboration in Decision-making | 2.7410 | 0.3230 | 2.6339 | 0.3199 | 3.4615 | 0.3462 | 4.3636 | 0.3478 | |
| 44. Relevance Levels of Communication Practices in Decision-making | 3.0971 | 0.3650 | 3.0118 | 0.3659 | 3.6923 | 0.3692 | 4.3636 | 0.3478 | ||
| 45. Relevance Levels of Monitoring and Evaluation in Decision-making | 2.6475 | 0.3120 | 2.5866 | 0.3142 | 2.8462 | 0.2846 | 3.8182 | 0.3043 | ||
| 16. Service management | 46. Relevance Levels of Cataloguing and Design in Decision-making | 2.6871 | 0.3383 | 2.6142 | 0.3377 | 3.2308 | 0.3387 | 3.7273 | 0.3475 | |
| 47. Relevance Levels of Service Delivery Efficiency in Decision-making | 2.5899 | 0.3261 | 2.4882 | 0.3215 | 3.4615 | 0.3629 | 3.9091 | 0.3644 | ||
| 48. Relevance Levels of Resource allocation in Decision-making | 2.6655 | 0.3356 | 2.6378 | 0.3408 | 2.8462 | 0.2984 | 3.0909 | 0.2881 | ||
Table 10.
Overall importance weights of criteria in smart campus framework.
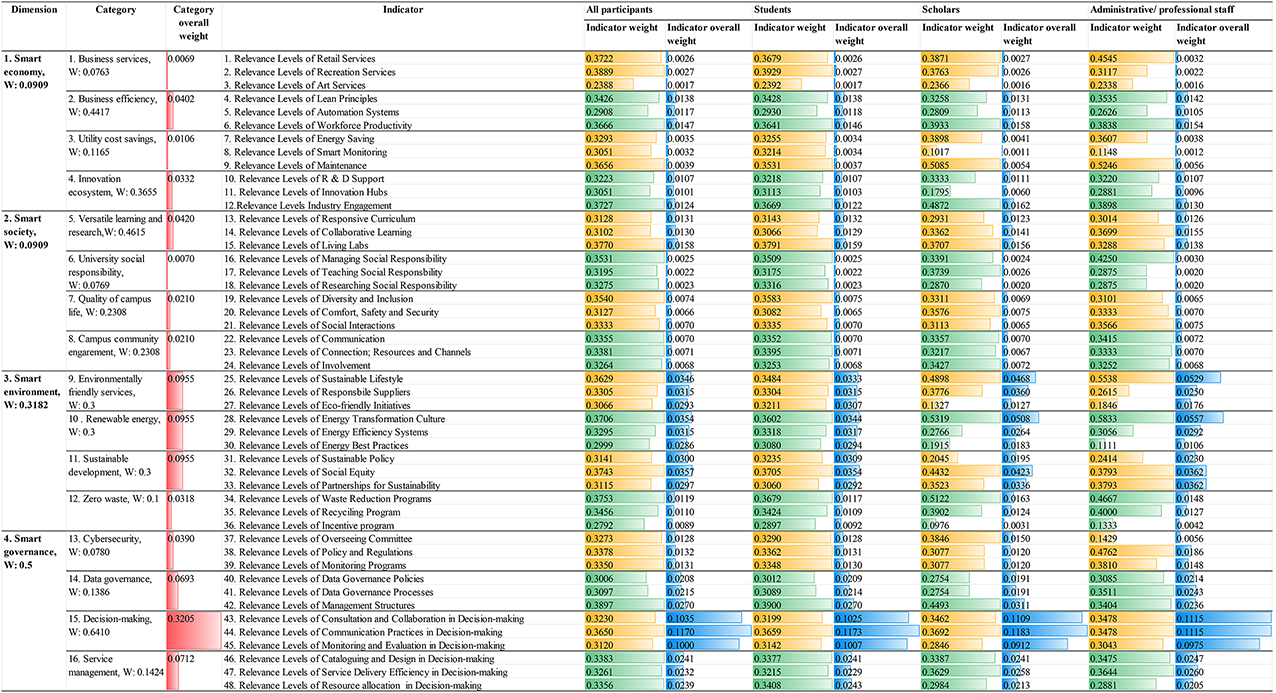
Table 11.
Ranking of weights for indicators.
| Indicator | All participants | Students | Scholars | Administrative/ professional staff | ||||
| Overall weight | Rank | Overall weight | Rank | Overall weight | Rank | Overall weight | Rank | |
| Relevance Levels of Communication Practices in Decision-making | 0.11698 | 1 | 0.11726 | 1 | 0.11834 | 1 | 0.11148 | 1 |
| Relevance Levels of Consultation and Collaboration in Decision-making | 0.10353 | 2 | 0.10254 | 2 | 0.11094 | 2 | 0.11148 | 2 |
| Relevance Levels of Monitoring and Evaluation in Decision-making | 0.10000 | 3 | 0.10070 | 3 | 0.09122 | 3 | 0.09754 | 3 |
| Relevance Levels of Social Equity | 0.03573 | 4 | 0.03537 | 4 | 0.04231 | 6 | 0.03621 | 6 |
| Relevance Levels of Energy Transformation Culture | 0.03538 | 5 | 0.03439 | 5 | 0.05078 | 4 | 0.05569 | 4 |
| Relevance Levels of Sustainable Lifestyle | 0.03464 | 6 | 0.03326 | 6 | 0.04676 | 5 | 0.05287 | 5 |
| Relevance Levels of Responsible Suppliers | 0.03155 | 7 | 0.03154 | 8 | 0.03604 | 7 | 0.02497 | 10 |
| Relevance Levels of Energy Efficiency Systems | 0.03145 | 8 | 0.03167 | 7 | 0.02640 | 10 | 0.02917 | 8 |
| Relevance Levels of Sustainable Policy | 0.02999 | 9 | 0.03088 | 9 | 0.01953 | 14 | 0.02304 | 14 |
| Relevance Levels of Partnerships for Sustainability | 0.02974 | 10 | 0.02921 | 12 | 0.03363 | 8 | 0.03621 | 7 |
| Relevance Levels of Eco-friendly Initiatives | 0.02927 | 11 | 0.03066 | 10 | 0.01266 | 25 | 0.01762 | 18 |
| Relevance Levels of Energy Best Practices | 0.02863 | 12 | 0.02940 | 11 | 0.01828 | 17 | 0.01061 | 29 |
| Relevance Levels of Management Structures | 0.02700 | 13 | 0.02702 | 13 | 0.03113 | 9 | 0.02359 | 13 |
| Relevance Levels of Cataloguing and Design in Decision-making | 0.02410 | 14 | 0.02405 | 15 | 0.02412 | 12 | 0.02475 | 11 |
| Relevance Levels of Resource allocation in Decision-making | 0.02390 | 15 | 0.02427 | 14 | 0.02125 | 13 | 0.02052 | 16 |
| Relevance Levels of Service Delivery Efficiency in Decision-making | 0.02322 | 16 | 0.02290 | 16 | 0.02585 | 11 | 0.02595 | 9 |
| Relevance Levels of Data Governance Processes | 0.02146 | 17 | 0.02140 | 17 | 0.01908 | 15 | 0.02433 | 12 |
| Relevance Levels of Data Governance Policies | 0.02083 | 18 | 0.02087 | 18 | 0.01908 | 16 | 0.02138 | 15 |
| Relevance Levels of Living Labs | 0.01582 | 19 | 0.01590 | 19 | 0.01555 | 21 | 0.01379 | 24 |
| Relevance Levels of Workforce Productivity | 0.01472 | 20 | 0.01462 | 20 | 0.01579 | 20 | 0.01541 | 20 |
| Relevance Levels of Lean Principles | 0.01375 | 21 | 0.01376 | 21 | 0.01308 | 24 | 0.01419 | 23 |
| Relevance Levels of Policy and Regulations | 0.01317 | 22 | 0.01311 | 23 | 0.01199 | 28 | 0.01856 | 17 |
| Relevance Levels of Responsive Curriculum | 0.01312 | 23 | 0.01318 | 22 | 0.01230 | 27 | 0.01264 | 27 |
| Relevance Levels of Monitoring Programs | 0.01306 | 24 | 0.01305 | 24 | 0.01199 | 29 | 0.01485 | 21 |
| Relevance Levels of Collaborative Learning | 0.01301 | 25 | 0.01286 | 25 | 0.01410 | 23 | 0.01552 | 19 |
| Relevance Levels of Overseeing Committee | 0.01276 | 26 | 0.01282 | 26 | 0.01499 | 22 | 0.00557 | 38 |
| Relevance Levels Industry Engagement | 0.01238 | 27 | 0.01219 | 27 | 0.01619 | 19 | 0.01295 | 25 |
| Relevance Levels of Waste Reduction Programs | 0.01194 | 28 | 0.01171 | 29 | 0.01630 | 18 | 0.01485 | 22 |
| Relevance Levels of Automation Systems | 0.01167 | 29 | 0.01177 | 28 | 0.01128 | 30 | 0.01054 | 30 |
| Relevance Levels of Recycling Program | 0.01100 | 30 | 0.01089 | 30 | 0.01242 | 26 | 0.01273 | 26 |
| Relevance Levels of R & D Support | 0.01071 | 31 | 0.01069 | 31 | 0.01107 | 31 | 0.01070 | 28 |
| Relevance Levels of Innovation Hubs | 0.01014 | 32 | 0.01034 | 32 | 0.00596 | 38 | 0.00957 | 31 |
| Relevance Levels of Incentive program | 0.00888 | 33 | 0.00922 | 33 | 0.00310 | 41 | 0.00424 | 40 |
| Relevance Levels of Diversity and Inclusion | 0.00743 | 34 | 0.00752 | 34 | 0.00695 | 35 | 0.00651 | 37 |
| Relevance Levels of Connection; Resources and Channels | 0.00709 | 35 | 0.00712 | 35 | 0.00675 | 36 | 0.00699 | 35 |
| Relevance Levels of Communication | 0.00704 | 36 | 0.00703 | 36 | 0.00704 | 34 | 0.00716 | 33 |
| Relevance Levels of Social Interactions | 0.00699 | 37 | 0.00700 | 37 | 0.00653 | 37 | 0.00748 | 32 |
| Relevance Levels of Involvement | 0.00685 | 38 | 0.00683 | 38 | 0.00719 | 33 | 0.00682 | 36 |
| Relevance Levels of Comfort, Safety and Security | 0.00656 | 39 | 0.00647 | 39 | 0.00750 | 32 | 0.00699 | 34 |
| Relevance Levels of Maintenance | 0.00387 | 40 | 0.00374 | 40 | 0.00538 | 39 | 0.00556 | 39 |
| Relevance Levels of Energy Saving | 0.00349 | 41 | 0.00345 | 41 | 0.00413 | 40 | 0.00382 | 41 |
| Relevance Levels of Smart Monitoring | 0.00323 | 42 | 0.00340 | 42 | 0.00108 | 48 | 0.00122 | 48 |
| Relevance Levels of Recreation Services | 0.00270 | 43 | 0.00273 | 43 | 0.00261 | 44 | 0.00216 | 44 |
| Relevance Levels of Retail Services | 0.00258 | 44 | 0.00255 | 44 | 0.00268 | 42 | 0.00315 | 42 |
| Relevance Levels of Managing Social Responsibility | 0.00247 | 45 | 0.00245 | 45 | 0.00237 | 45 | 0.00297 | 43 |
| Relevance Levels of Researching Social Responsibility | 0.00229 | 46 | 0.00232 | 46 | 0.00201 | 46 | 0.00201 | 46 |
| Relevance Levels of Teaching Social Responsibility | 0.00223 | 47 | 0.00222 | 47 | 0.00261 | 43 | 0.00201 | 45 |
| Relevance Levels of Art Services | 0.00166 | 48 | 0.00166 | 48 | 0.00164 | 47 | 0.00162 | 47 |
Disclaimer/Publisher’s Note: The statements, opinions and data contained in all publications are solely those of the individual author(s) and contributor(s) and not of MDPI and/or the editor(s). MDPI and/or the editor(s) disclaim responsibility for any injury to people or property resulting from any ideas, methods, instructions or products referred to in the content. |
© 2025 by the authors. Licensee MDPI, Basel, Switzerland. This article is an open access article distributed under the terms and conditions of the Creative Commons Attribution (CC BY) license (http://creativecommons.org/licenses/by/4.0/).
Copyright: This open access article is published under a Creative Commons CC BY 4.0 license, which permit the free download, distribution, and reuse, provided that the author and preprint are cited in any reuse.


