
Submitted:
06 June 2025
Posted:
09 June 2025
You are already at the latest version
Abstract
This study examined how different lighting characteristics of conventional and eco-friendly lighting and environmental conditions, particularly snow cover, influenced the luminous environment and, in relation to that, pedestrian perception of faces on footpaths. The analysis was based on a dataset comprising both subjective evaluations and objective measurements. The spatial and directional light field above a footpath was measured for the two types of road lighting, of which the “eco-centric” luminaire had lower light levels and reduced blue-light component, under snowy and non-snowy conditions. Snow cover significantly increased light diffuseness and density, resulting in more uniform light and higher subjective ratings. Also, face visibility ratings were generally higher and more uniform, while non-snowy conditions led to more pronounced differences between positions and luminaire types. Regression analysis revealed that vertical illuminance at eye height was the strongest predictor of perceived facial friendliness and well-lightedness, and contributed to more favorable ratings for the environment lighting too. The eco-centric luminaire was found to positively influence face lighting ratings but received lower ratings for environmental visibility. Increased horizontal illuminance did not consistently result in enhanced subjective evaluations, which points to limitations of traditional illuminance-based lighting standards, often considering horizontal illuminance at ground level as one of the main metrics. The "social light field" concept emphasizes a holistic approach to urban lighting design that integrates social perception and environmental sustainability by considering the distribution of the actual, resulting light throughout the urban space, especially vertical illuminance at the face and its effects on visual appearance, as well as contributing interactions with the environment and materials in it.
Keywords:
light field
; cubic light measurements
; light modelling
; social light field
; footpath lighting
1. Introduction
A wide range of studies show the negative impact on nature from Artificial Light at Night (ALAN) [1,2,3,4]. As awareness of these impacts increases, lighting designers and lighting engineers are challenged to develop solutions to minimize the negative effects on nature while sustaining the beneficial effects associated with artificial light (Stone, 2018). ALAN facilitates our urban mobility by fostering a sense of security, thereby encouraging walking and cycling [5]. Notably, the appearance and visibility of the faces of other pedestrians is an important cue for the experienced sense of security. Edensor [7] also points to the importance of creating atmosphere by a balanced relation between light and dark.
We studied how two real road lighting setups shape the 3d light field on footpaths and its effect on faces’ appearance. Measurements in snowy and non-snowy conditions (winter vs. autumn) were compared. We analyzed optical, image, and subjective data for the standard and eco-centric lighting, to assess its impacts on light field structure, face visibility, and perception of face and environment appearance. By integrating optical measurements, image analyses, and subjective evaluations, this transdisciplinary research aims to assess how lighting design and environmental context affect perceived face illumination and the overall pedestrian experience.
2. Background
2.1. Nighttime Walks
Humans are a diurnal species, which entails that our sensory system is adapted to move around under daylight conditions. Our visual system also allows us to see in dim or dark conditions, yet with restricted visual acuity and color discrimination, resulting in a less detailed perception of the environment. In the context of walking on footpaths at night, our visual perception operates under suboptimal conditions due to low light levels, and this can create a sense of unease when walking at night. The sense of safety is an internal physiological state, regulated by the autonomic nervous system, assessed on a subconscious level through neuroception [8]. It’s the unconscious assessment of safety versus danger [9]. Optimizing the visual conditions with the help of artificial light at night can relieve an alerted nervous system and enhance our conscious sense of security. Lighting also contributes to obstacle detection and visual orientation and enables interpersonal judgement and social security [10,11,12,13,14,15]. Bille and Sørensen (2007) argue that light socially illuminates places, people and things and hence affects experiences and materiality. The spatial distribution of the light is important when judging three-dimensional targets, like faces. Likewise, the formation of shadows and face-to-background contrast varies between two light poles [12]. The quality of the light and its distribution impact how the surroundings and objects in them appear [17]. Certain light qualities, like its diffuseness, light vector direction, and vertical illumination, were in a previous study found to influence judgments of how friendly a face looked (Wåseth, 2024). In the present study, we address the relationship between the actual light (optics and photometric light field metrics), the appearance of the environment (luminance-based metrics), and how this affects human observers (perceived luminous environment and faces in it), using a framework we call “the social light field”.
2.2. The Social Light Field
In the book “Cities for People”, architect Jan Gehl addresses the concept of “the social field of vision”, which refers to the visual perception of a person at varying distances and how this relates to social interaction. [18]. Gehl's work is based on daylight conditions, but the “social field of vision” will naturally change at night when electric street lighting becomes the main light source. The characteristics of light influence the appearance of other persons (Wåseth et al., 2024; Wåseth et al., 2022; Zaikina et al., 2015) thereby affecting social interactions, a concept we termed “the social light field”. The social light field derives from the light field concept, which was originated by Gershun (1939) and further developed into a practical framework by [17,23,24,25] and describes the luminance as a function of position and direction. The light field of a perceived scene, whether indoor or outdoor, in daylight or artificial light, depends on the light source, but also the certain characteristics of the scene - the geometry of the space and the objects in it, the color and materials and even the light scattering in the air (fog, dust, etc.). These effects are partly optical (objective) and partly perceptual (subjective), where the latter form the visual light field [17]. In a recent study, it was found that light diffuseness, light vector, and vertical illumination at a face correlated with the perception of friendliness, how well the faces were judged to be lit, and how the light environment was rated (Wåseth et al., 2025). The light’s modelling qualities were found to be crucial, e.g. direction and diffuseness of the actual light with respect to the face. The light modelling refers to the degree to which the light renders the 3d shape of objects. Those are essential to reveal three-dimensional objects' contour distinctness, shape, and details [21,24,25]. Creating optimal illumination for social light fields can help reduce excessive lighting and thus decrease light pollution, while also enhancing visibility, minimizing visual discomfort, and supporting social interaction and dynamics during walking.
2.3. The Light Field
The advantage of the light field framework is that it systematically and qualitatively addresses the spatial and form-giving aspects of lighting [17,27]. The light field is composed of and shaped by various sources, including the light coming directly from light sources and the reflected light from the surroundings [17]. It represents the variations of light within the three-dimensional space, emphasizing key characteristics related to appearance, such as light density, direction, diffuseness, and light texture, as well as their spectral, spatial, and temporal variations [17,23,24,25,28,29]. A first-order description of the light at a point in space can be measured with cubic illuminance measurements in six directions perpendicular to the planes of a cube, from which the light density, light vector, and diffuseness can be calculated [24]. These metrics define the modelling properties and their variation across the three-dimensional space [23,30], and suffice to describe the main part of the appearance of a scene and the objects in it, e.g. contrasts, colors, materials, surface structures and spatial layouts to first order [21,24,31,32,33,34]. The modelling characteristics of light vary according to primary lighting (the sources) and environmental scattering (Xia et al., 2017a). Normalized diffuseness quantifies the distribution of light around a point in space, ranging from fully collimated or directed light (with a diffuseness value of 0) to completely diffuse light (with a diffuseness value of 1) [24,25]. Traditional lighting approaches for footpaths set the requirements for the light levels on the pavement. Additionally, for zones requiring face recognition, vertical and semi-cylindrical illuminance should also be ensured [35]. Modelling and appearance are indirectly related to these metrics.
The negative effects on nature from extensive artificial light at night (ALAN) entail that lighting designers and engineers have a responsibility to illuminate the surroundings mindfully to reduce the negative effects of light [36]. Enhancing the light quality in the social light field, instead of focusing on horizontal light levels, can help to address this problem.
We aim to fill this research gap by exploring the connection between the measurable light above the footpath (social light field) and its impact on how pedestrians perceive their surroundings and others. We compared the effects of two road lighting luminaires, an “alternative” luminaire being considered more eco-friendly due to lower CCT, narrow road optics, and lower illuminance levels. The luminaires are referred to as 'alternative' and 'conventional', they differ across multiple factors shown in Table 1. The luminaires were studied under two different environmental reflective conditions, with and without a snow cover. We studied how the characteristics of the lighting, on the one hand, and the snow cover, on the other hand, affected the actual distribution of light by performing cubic light measurements. This “distal stimulus” was related to the “proximal stimulus” for the observer via measurements with a luminance camera, for which we analyzed contrast. These metrics were then again analyzed in relation to data of the perceived expression of a face and the environment, using a face-shaped light probe as a stimulus. We hypothesize that the social light field, as a method to assess lighting design effects, provides a reliable framework for urban eco-centric lighting design.
3. Method
3.1. Experiment Design and Procedure
The study was conducted in a rural area, on the pavement alongside road FV325 in Tønsberg municipality, Norway, during full night conditions. The sun's altitude was more than 18 degrees below the horizon, which corresponds to astronomical dawn. The experiment was performed along a road’s 250 m long and 3.4 m wide footpath, frequently used by pedestrians, joggers, and commuters on bikes. No other light sources apart from the street lighting were visible in the area. The experiment was done in two conditions, with and without snow. In January 2024, the experiment was conducted with a snow cover on both the pedestrian path’s pavement and the surrounding area, at -16°C. In October 2024, it was repeated in non-snowy conditions (dry pavement) at +4°C. The area beside the chosen road is a logging area, meaning that the height of the vegetation is low, except for some tall trees, Figure 1.
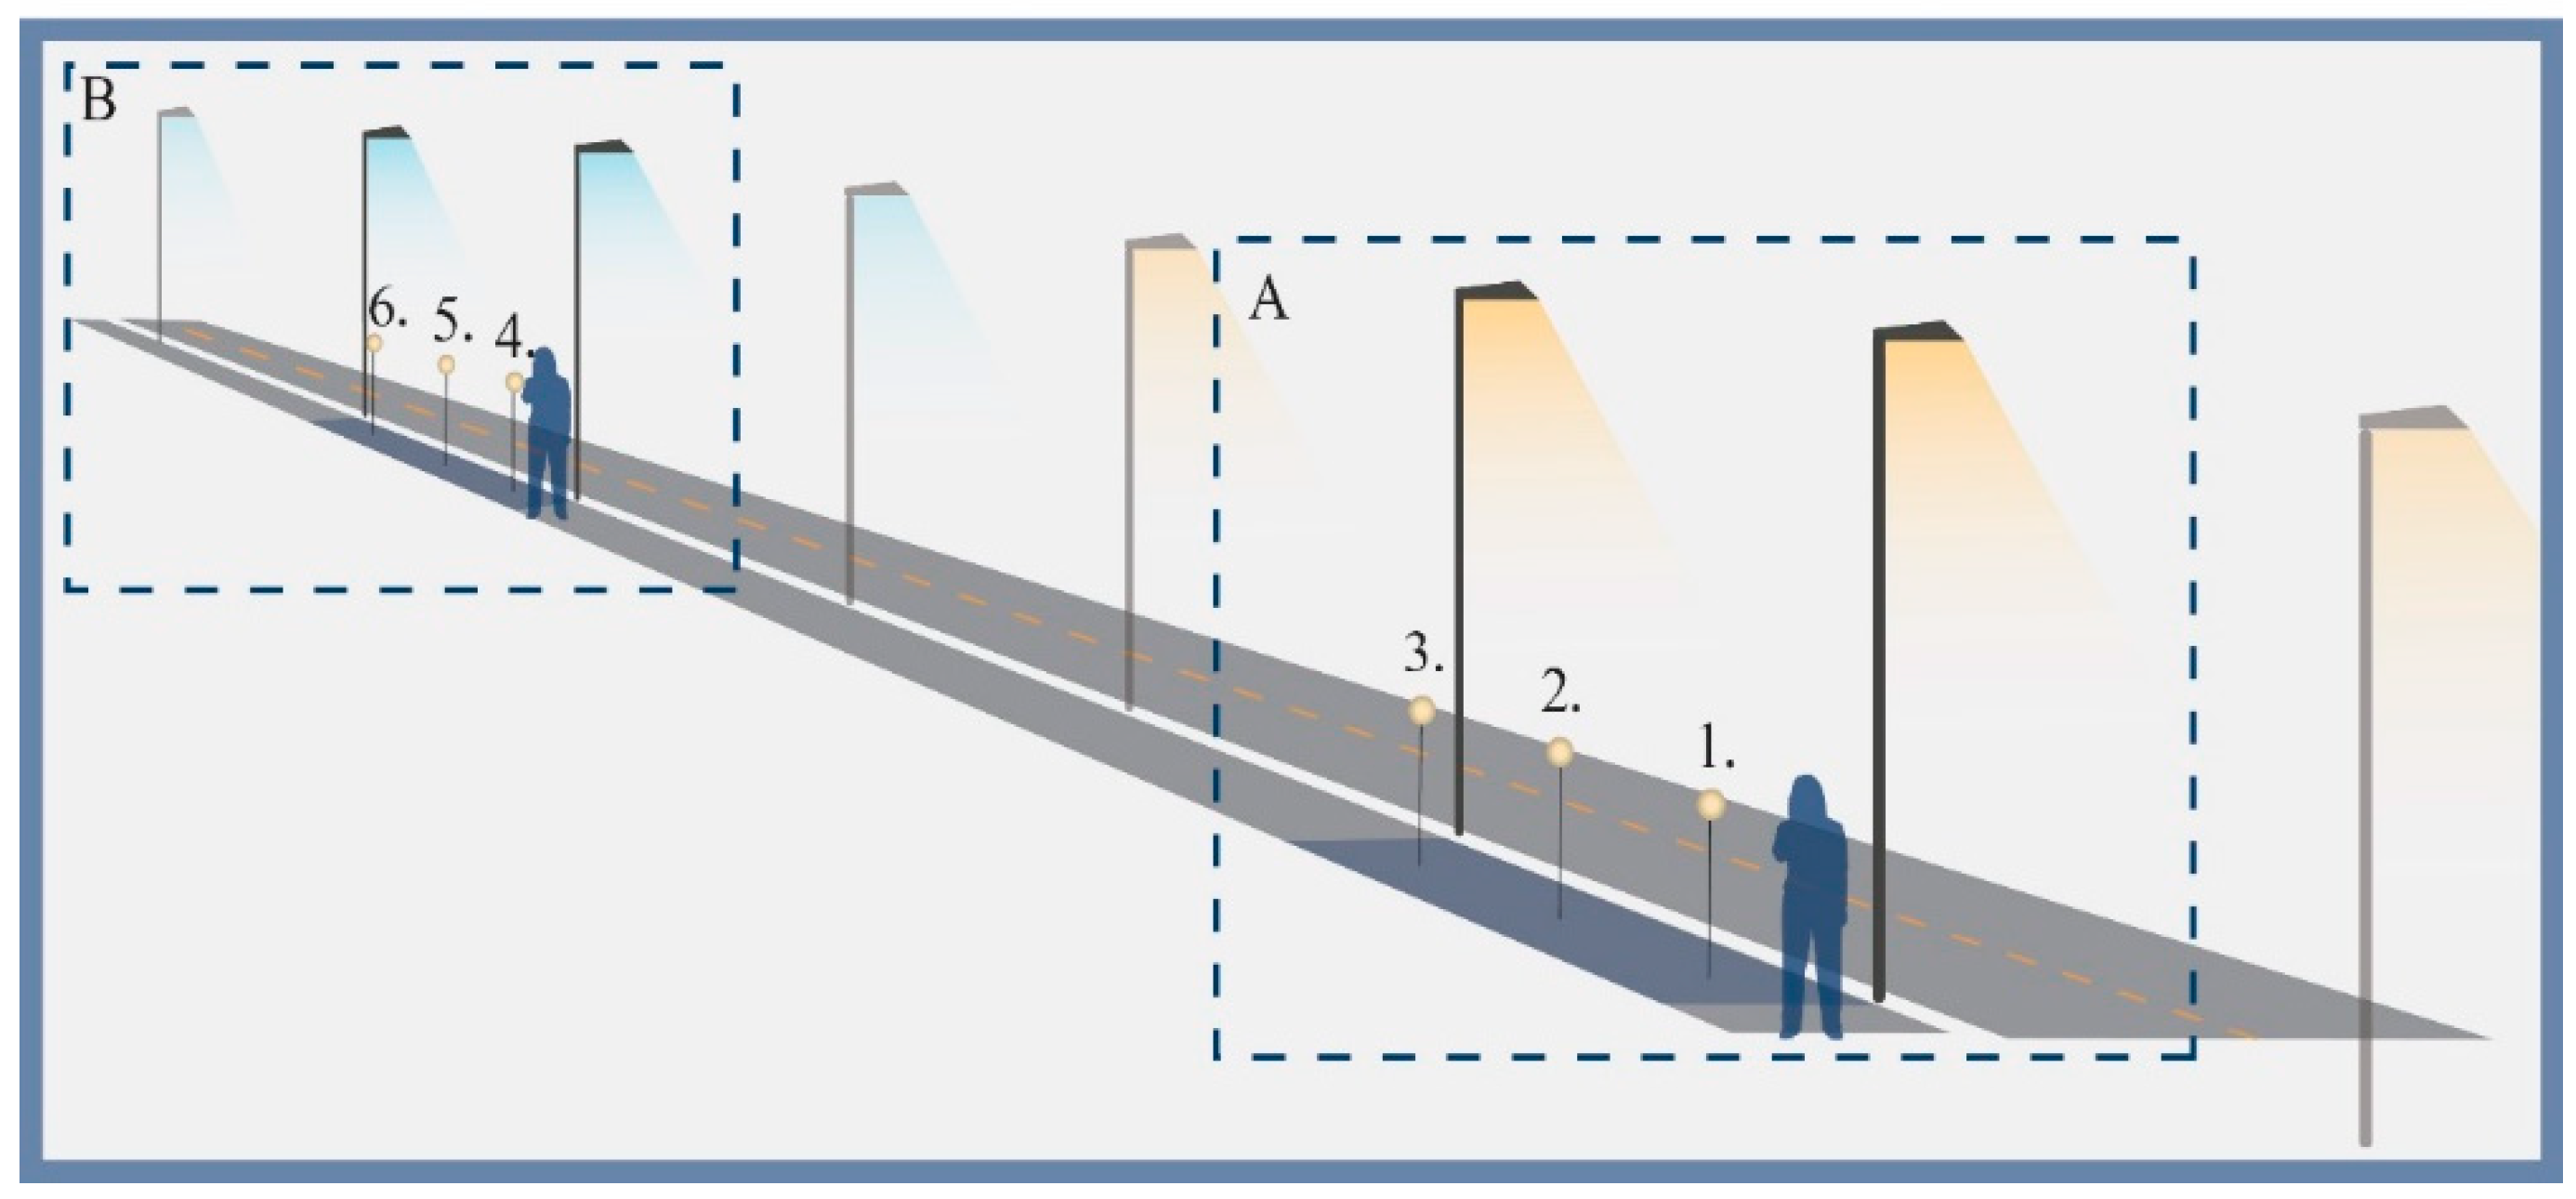
The lampposts stand between the road lane and the footpath, spaced 30 meters apart (Figure 1). Two luminaire types were used in the study. Luminaire A (alternative) has reduced lumen output and narrower spectral power distribution, its energy consumption was disregarded in this study (Table 1). Luminaire B (conventional) represents a conventional luminaire type typically deployed for this roadway classification, as can be seen from Table 1. Each of the two luminaire groups included four units.
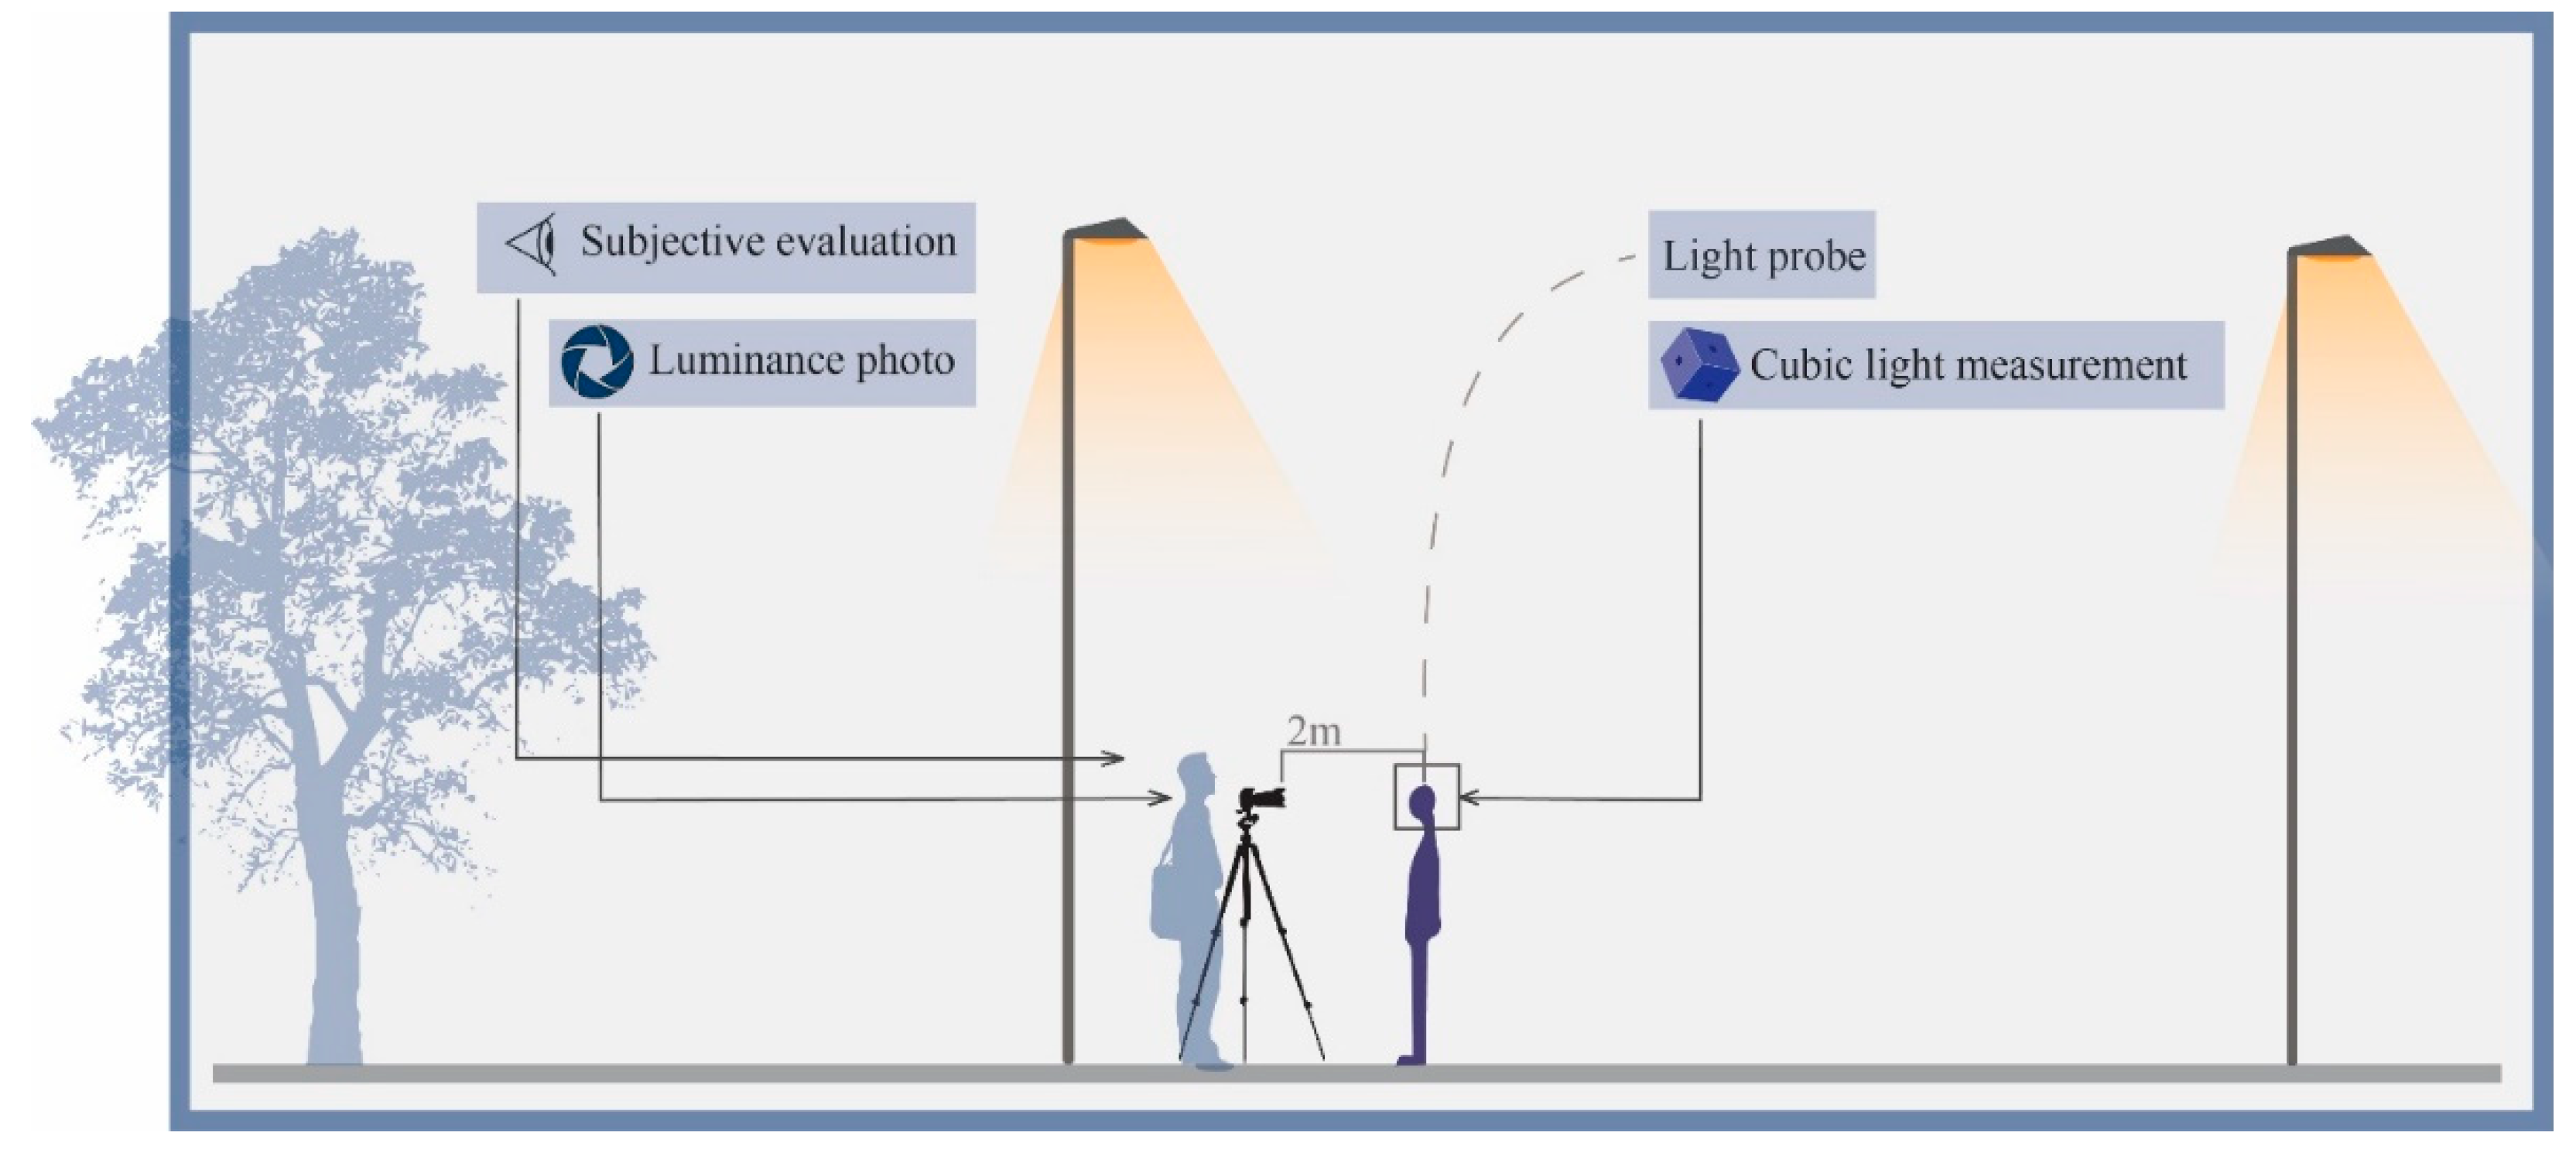
Measurements were done at six positions (P1–P6), that is, three between each two central sets of lampposts in both luminaire groups, at distances of 5, 15, and 25 meters from the first of the two lampposts, positioned at a height of 1.5 meters above the pavement surface (see Figure 1). At each position, a face-shaped light probe was placed sequentially for the perception testing and a cubic measurement was conducted. Observers assessed appearance at a position two meters in front of each position P1-6. Luminance images were taken from exactly the same points.
Figure 2.
Illustration of the experimental site and two groups of the luminaires (A and B). Three measurement positions (P1–P3 for luminaire A, and P4–P6 for luminaire B) were defined between the two central lighting poles for each luminaire type. At each position, cubic illuminance measurements and luminance images were captured, accompanied by perceptual ratings from observers. During perceptual evaluations, a light probe was sequentially placed at positions P1 through P6. Participants moved alongside the probes, standing two meters away and facing it directly at each measurement point.
3.2. Participants
The participants were recruited through social media and mailing lists of the nearest university campus. 29 participants (16 females, 13 males; age range: 18–65 years, median of 38) attended the study in snowy conditions (January 11, 2024), and 37 participants (21 females, 16 males; age range: 16–69 years, median of 41) in non-snowy conditions (October 23 and 24, 2024). All participants self-reported normal or corrected-to-normal visual acuity. However, one participant in the non-snowy group reported a color vision deficiency while maintaining normal visual acuity.
The study was carried out according to the rules and regulations laid down by the Norwegian National Committee for Research Ethics in Science and Technology. Information about the aim of the study was given, and written informed consent was obtained from all the participants. For the 5 participants under the age of 18, informed consent was obtained from their parents, who were present at the experiment site. All the participants were informed of their right to withdraw at any time, within one month, without explanation. No personal data was gathered. Participants received a voucher worth 150 NOK as compensation for their participation.
3.3. Experimental Procedure
Upon arrival, the participants were instructed on the procedure of the study and the questions they would be asked. They were instructed to walk along the two sequences of four lampposts to evaluate the two sets of face-shaped light probes. To balance potential order effects, half of the participants started at luminaire type A, and the second half began at luminaire type B. For each probe, the participants were instructed to stop at markings two meters in front of the probe and were asked to fill in the form. Four questions were asked, the same as previously used by the authors for a survey in an on-screen test in laboratory conditions (Wåseth et al., 2025). These were Q1) The face is well-lit, Q2) The face looks friendly, Q3) The environment is well-lit, and Q4) I feel comfortable in this lit environment. Answers were given on the 7-step Likert scale. The term “well-lit” was chosen to describe the visual appearance of the light probe and the surrounding environment. The term “friendly” was taken from [13], who propose friendly and non-friendly as categorization criteria for identifying emotions. The term “comfortable” from Q4 was chosen based on a study by Johansson et al. (2014), emphasizing how public lighting should facilitate comfort. After finishing, the participants were instructed to return to the starting point, where they were debriefed and thanked.
Figure 3.
The social light field was evaluated using cubic light measurements, luminance measurements and subjective ratings of the probe.
Figure 3.
The social light field was evaluated using cubic light measurements, luminance measurements and subjective ratings of the probe.
3.4. Objective Measurements
Cubic light measurements were conducted, using the light spectrometer Spectis 1.0 Touch + Flicker, from GL Optics, equipped with a Salli diffusor to allow for measurements at low light levels. The light meter was sequentially oriented to the six directions of a gauge cube at a height of 1,5 m above the footpath, at P1-6. The height of the probe and corresponding measurements were determined based on the standard for calculating semi-cylindrical illumination on footpaths [37]. The light field metrics were later derived from these measurements using the methods specified in Xia et al. [24].
Luminance images were captured using an LMK 6 luminance camera calibrated with a V(λ) filter and equipped with an 8 mm lens, capturing images of 55° by 45°. The camera was placed in the same position as the observers’ eyes.
3.5. Analysis
For the cubic illuminance measurements, Mathematica was used to calculate the light density (mean illuminance in a point (Escalar)), light diffuseness (D), mean illuminance, light vector (Ex, Ey, Ez) and its magnitude |E|, vertical illumination (Ex+), and horizontal illumination (Ez+) [24,25,29,31], using the following equations:
The luminance images were analyzed using the company software for the luminance camera, obtaining the standard deviation of the selected image region of the face.
4. Results
The results from the cubic illuminance measurements (Figure 4, Figure 5 and Figure 6) showed a strong variation between the two luminaire types and between snowy and non-snowy conditions. Figure 4 demonstrates the variations in horizontal and vertical illuminance at positions 1-6, where positions 1-3 correspond to the luminaire type A and positions 4-6 to the type B. As expected, based on the poles’ positions, the horizontal illuminance was lower for positions P2 and P5 than in P1, P3 and P4, P6, respectively.
The vertical illuminance showed a non-symmetric pattern for both A and B, that is, a continuous decrease, because this was measured facing towards the pole in front of P1 and P3. The effects of snow seem not to be systematic in these plots.
Figure 5 shows the variation in light density and Ez. Light density was significantly higher under snowy than non-snowy conditions, as confirmed by an independent samples t-test in IBM SPSS 28 (t(10) = 1.943, p = 0.040), likely due to increased reflections from the surroundings. The plot for Ez, calculated by subtracting the upward-facing illuminance from the downward-facing illuminance, reveals how snow cover reduces the average directionality of the light due to the light reflected from the ground. This effect is particularly seen for the conventional luminaire (B).
Snow cover was also found to impact the diffuseness level (Figure 6). Under non-snowy conditions, the two middle positions (P2 and P5), in between two luminaires, exhibited a diffuseness of about 0.8, while for the other four positions (P1, P3, P5 and P6), closer to the luminaires, we measured a diffuseness of 0.3. In snowy conditions, the diffuseness showed reduced variation (0.6 - 0.8) while in non-snow conditions, it showed greater difference (0.2 - 0.8). An independent samples t-test confirmed a significant difference in the light’s diffuseness between snowy and non-snowy conditions (t(10) = 2.246, p = 0.024), while not being significantly affected by the luminaire types (t(10) = 0.220, p = 0.415). A one-way ANOVA confirmed that the distance between light probe and luminaire had a significant effect on diffuseness under non-snowy condition, F(2,3) = 103.234, p = 0.002, effect size (η²=0.986), while for the snowy conditions, no significance was found, F(2,3) = 0.607, p = 0.601 (η²=0,288). These results reveal how strongly diffuseness is affected by variations in the distance to the light pole.
A Pearson correlation analysis showed a statistically significant positive relationship between the standard deviation of the luminance values of the face with light density (r(10)=0.79, p=<0.001), Ez (r(10)=0.77, p=<0.001) and vertical illuminance (r(10)=0.84, p=<0.001). This suggests that the factors light density, Ez, and vertical illuminance affect facial luminance variance, possibly due to more variability in shadows and highlights.
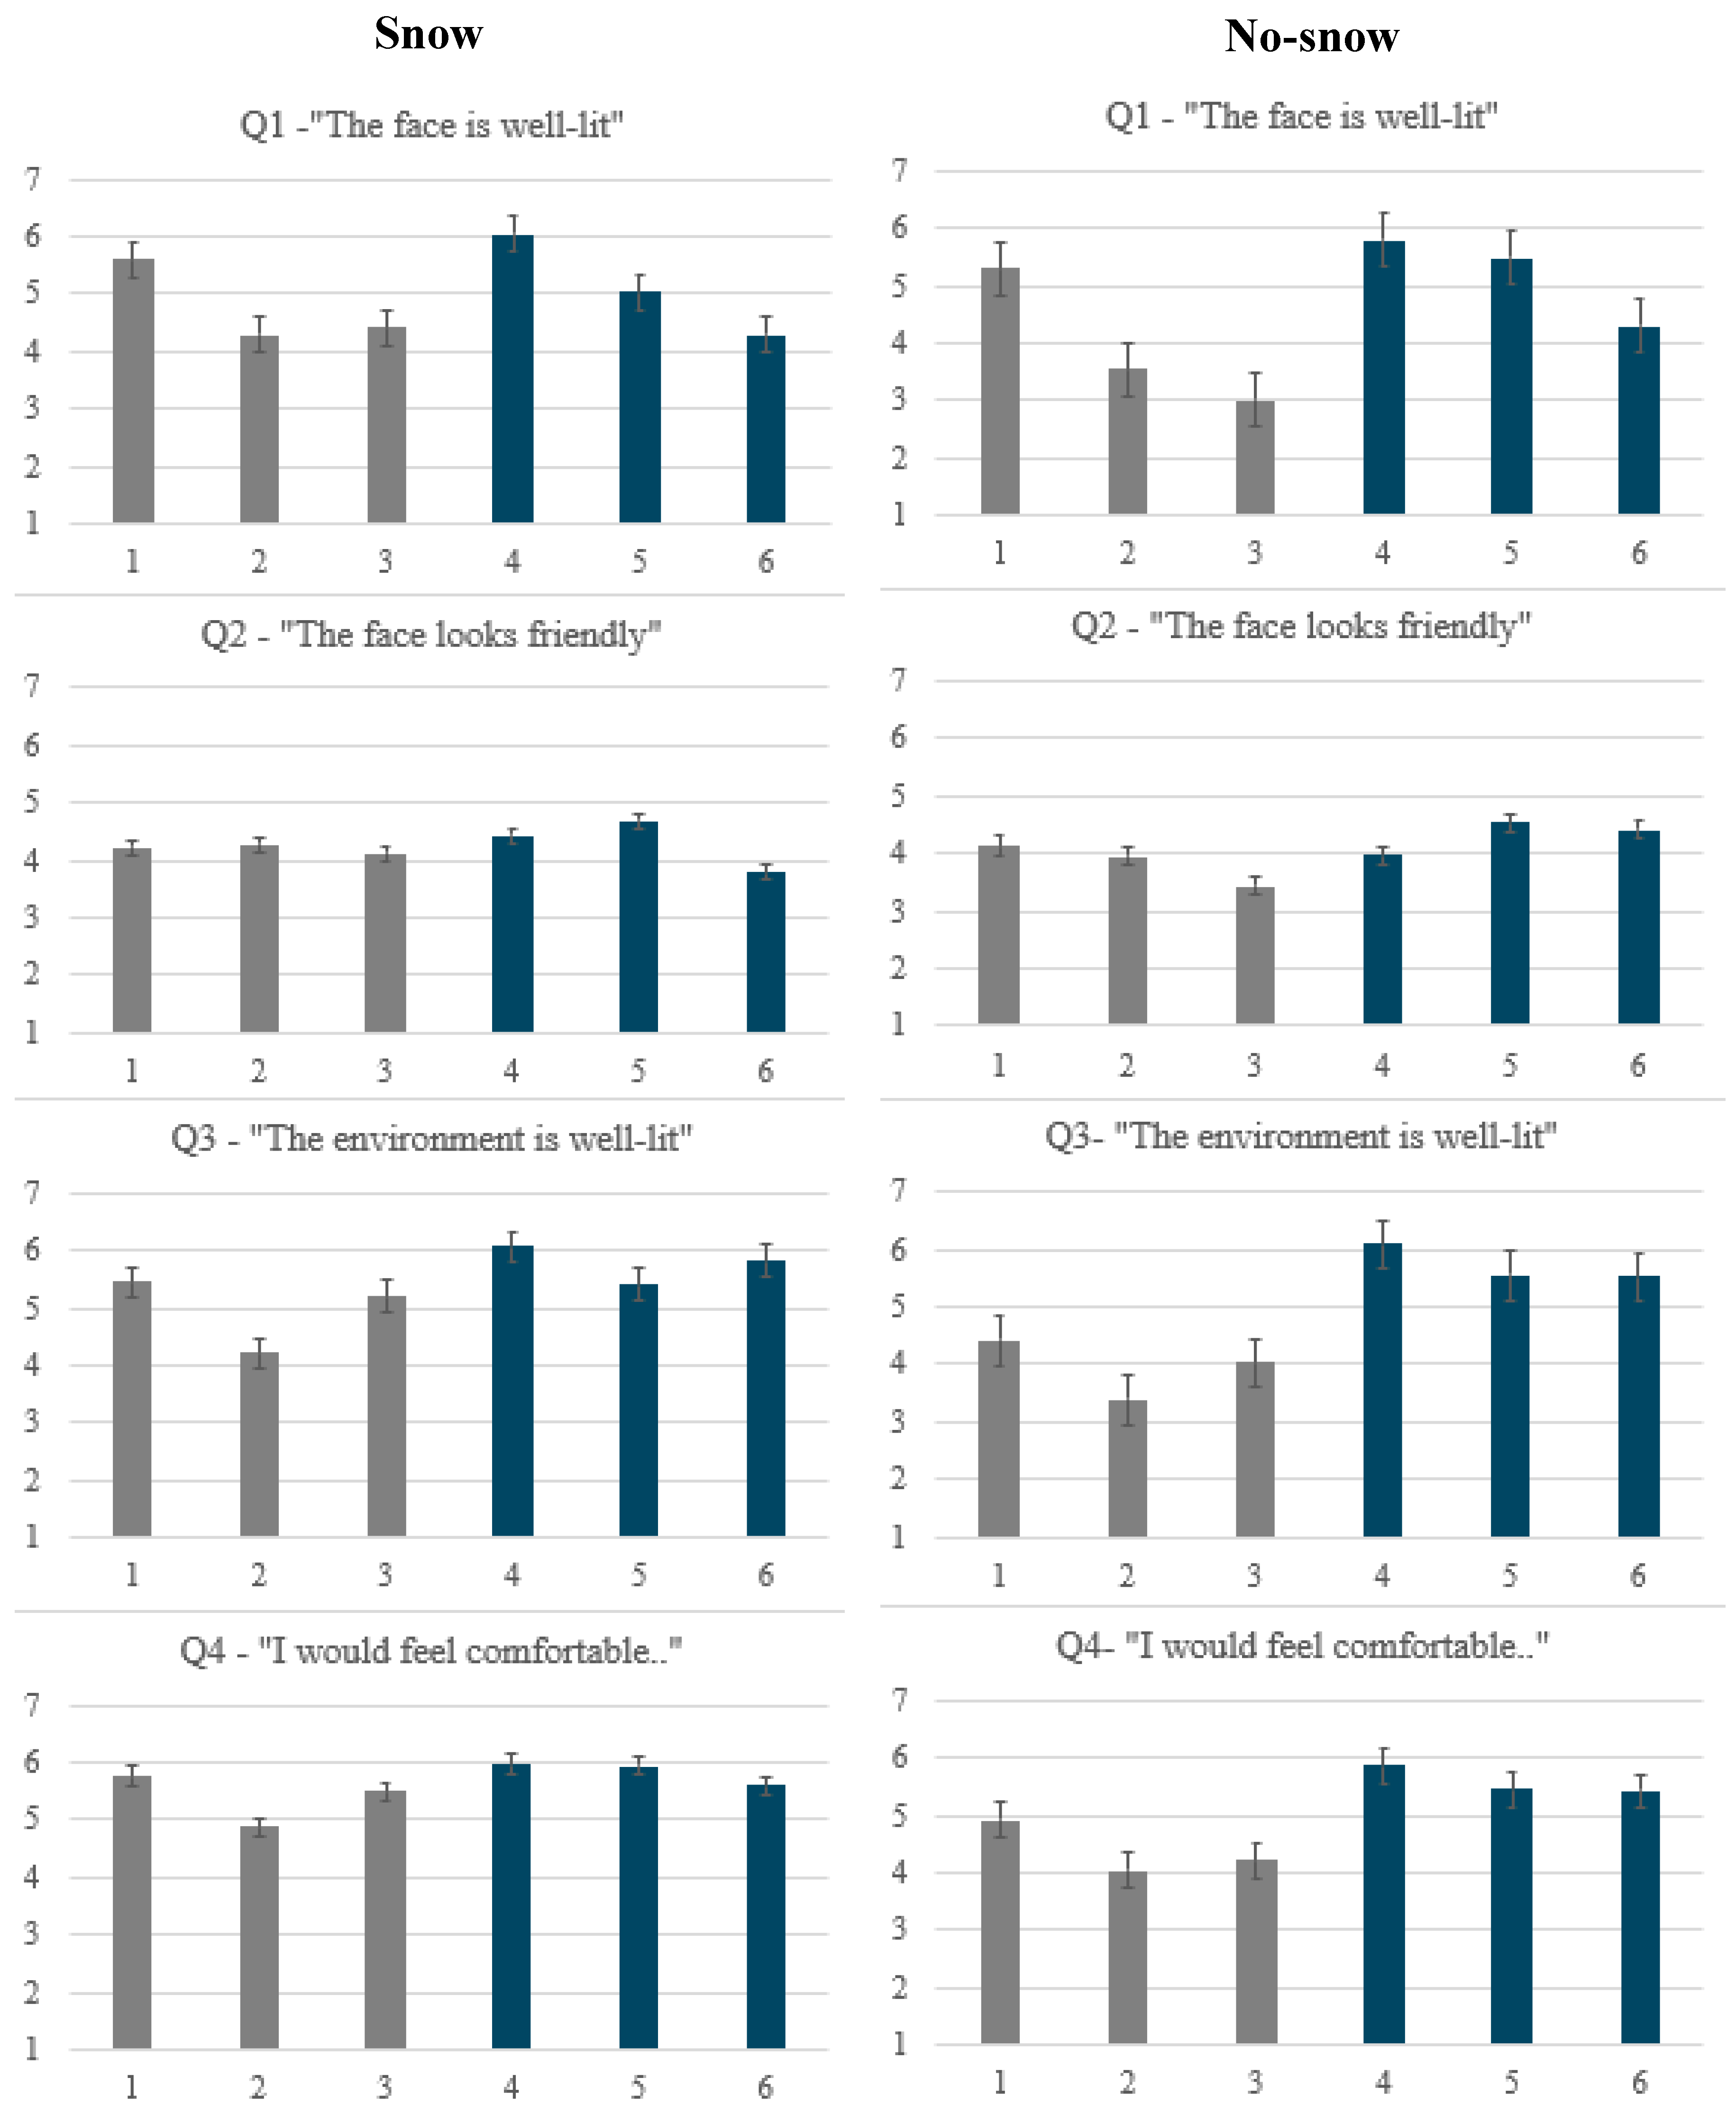
For the subjective data (Figure A1, Appendix), under non-snowy conditions, the differences both between different positions and luminaire types were more pronounced than in snowy conditions. In snowy conditions, the highest average ratings for Q1 (the face is well-lit) were observed at positions P1 (5,6) and P4 (6,0), while the lowest ratings were found at positions P2 (4,3), P3 (4,4) and P6 (4,3).
Figure 7.
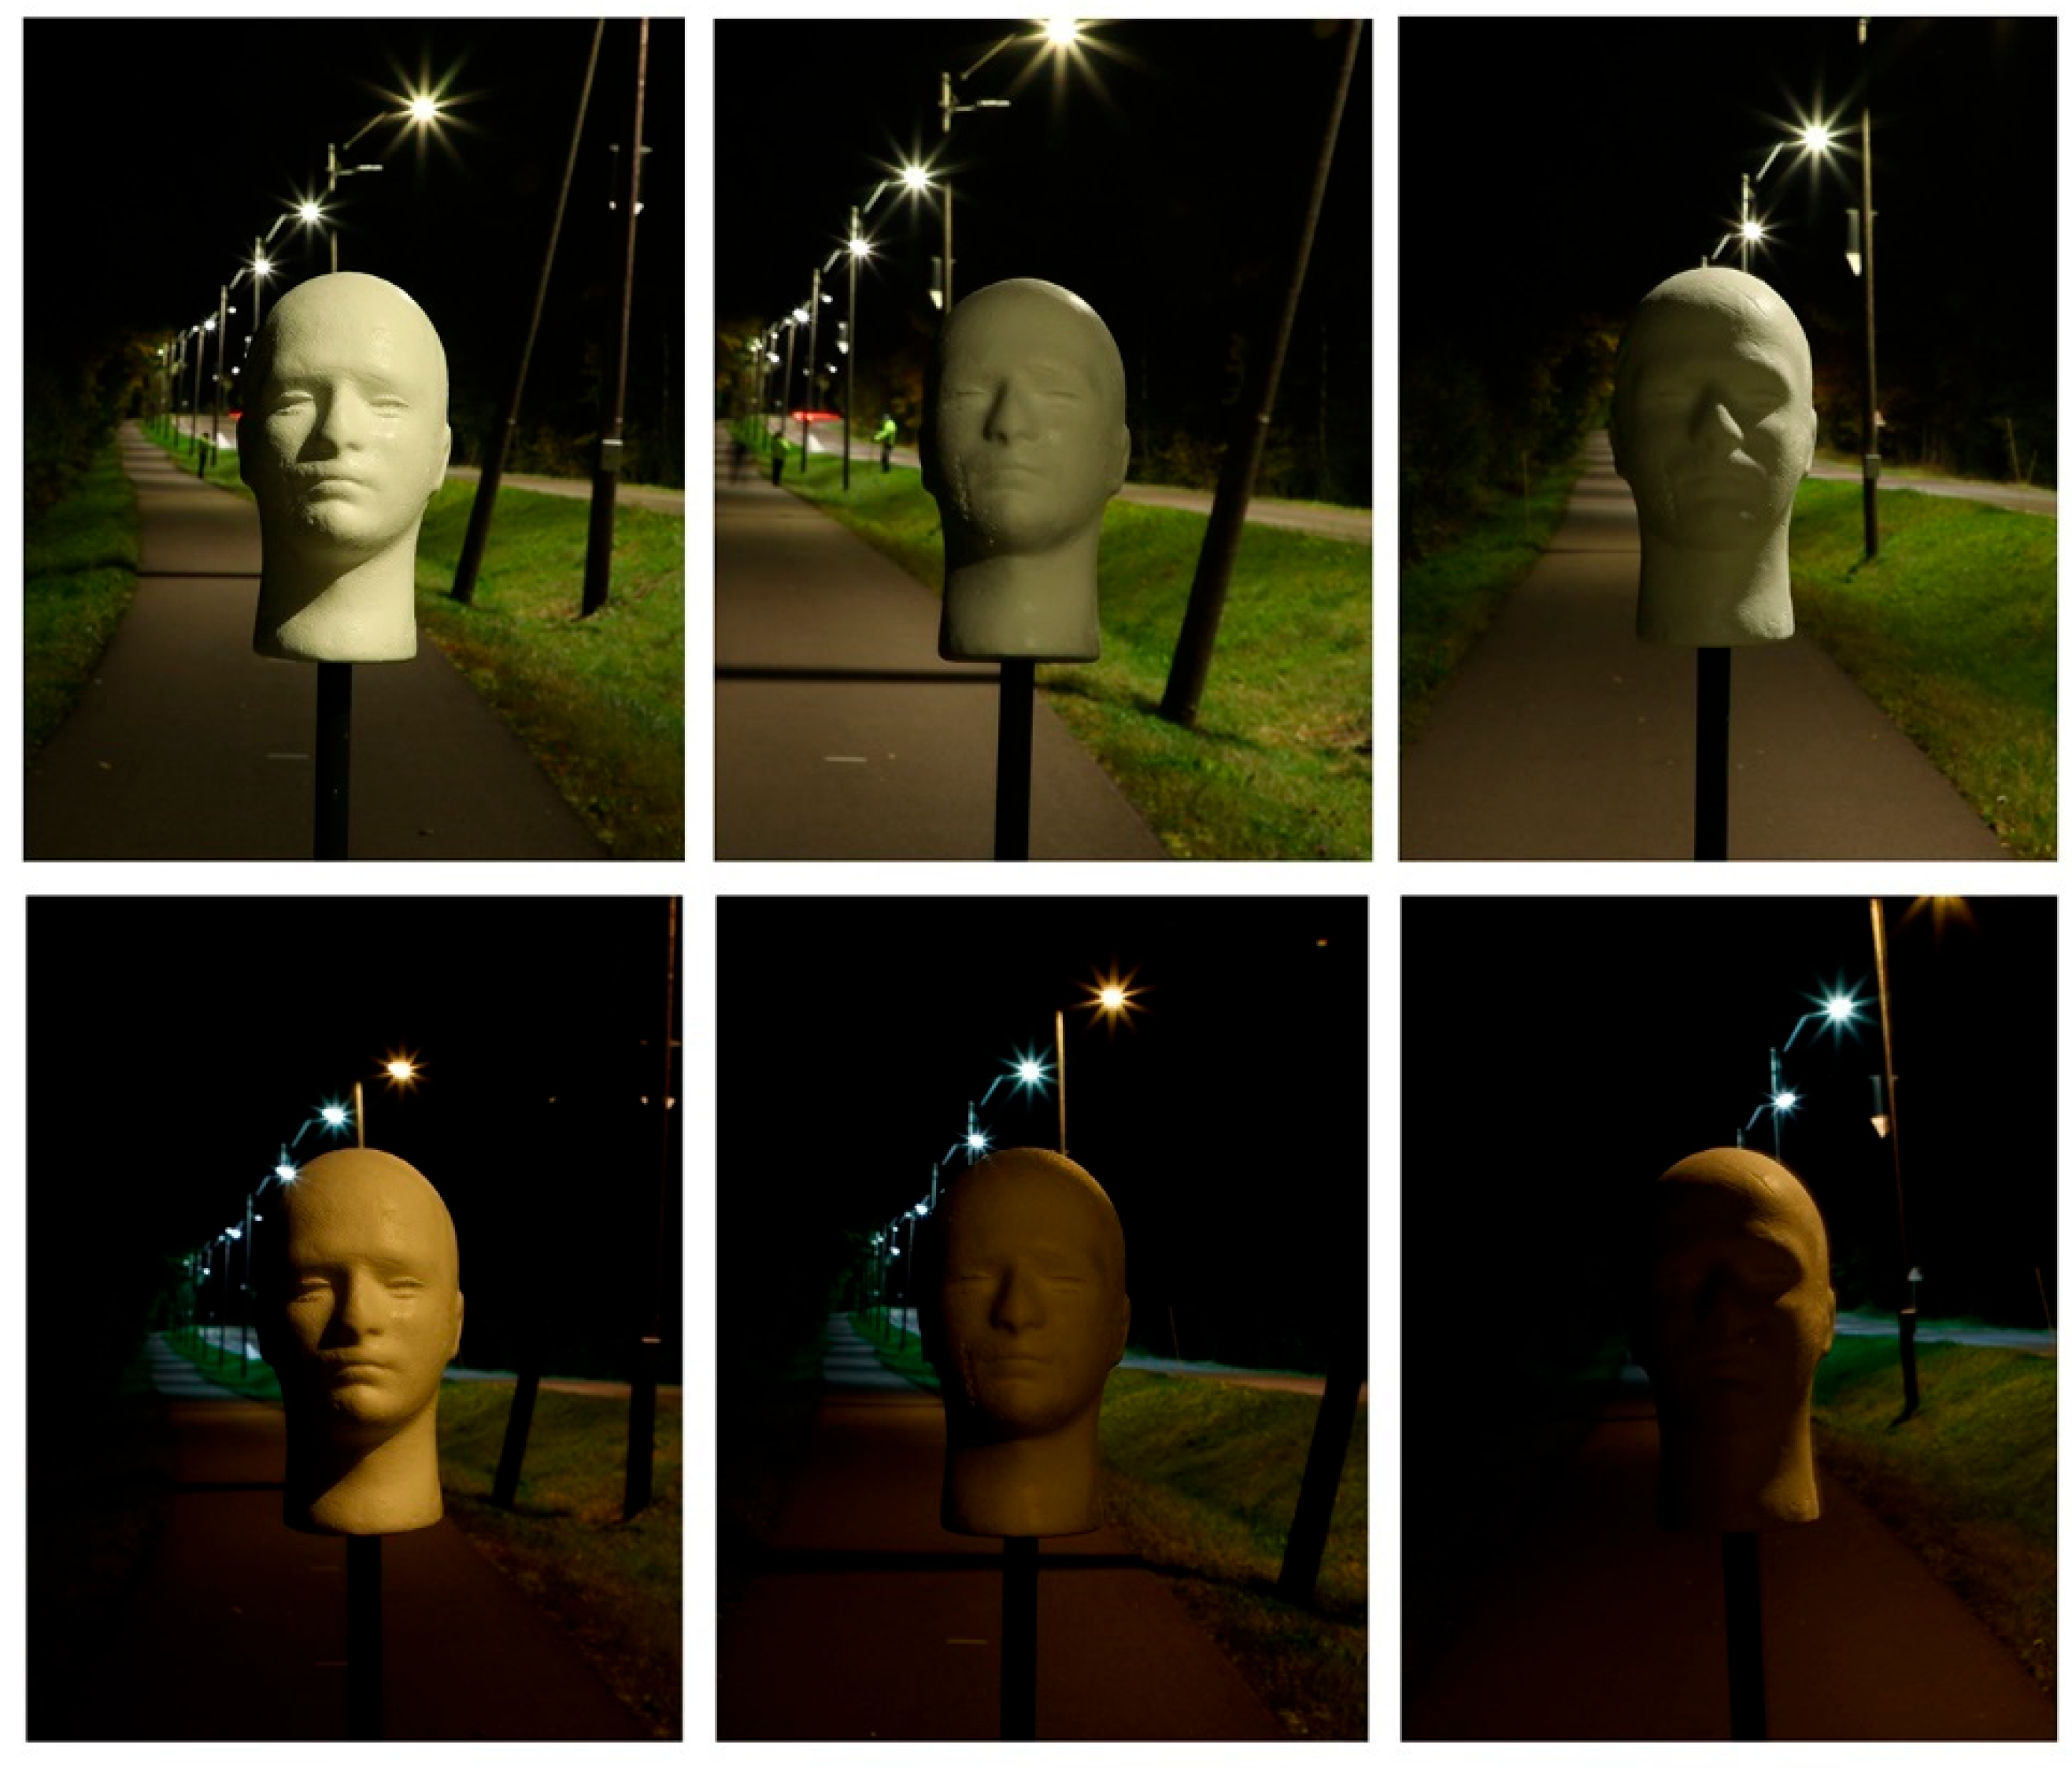
shows the appearance of the heads under the conventional (top) and alternative (bottom) luminaire. The photos were taken on a different day from the actual experiment, using the same shutter speed to simulate the perceived difference in brightness.
Figure 7.
shows the appearance of the heads under the conventional (top) and alternative (bottom) luminaire. The photos were taken on a different day from the actual experiment, using the same shutter speed to simulate the perceived difference in brightness.
For Q2 (the face looks friendly), the lowest average rating was found at position P6 (3,8), while the other positions had a consistent average rating of 4,3. For Q3 (the environment is well-lit) and Q4 (I would feel comfortable in this environment), some differences were observed between the two luminaire types, particularly under non-snowy conditions, luminaire A gave overall lower ratings than luminaire B. Snowy conditions partly mitigated these differences, leading to more uniform results.
To analyze the subjective data further, the Shapiro-Wilk Test was performed. Results showed that the data is not normally distributed, and a non-parametric test was required for data analysis. The Mixed-Effects Ordinal Logistic Regression was therefore applied. Several models were compared to identify the factors (like lighting parameters and luminance measurements) that best explained the responses to Q1-Q4, and demonstrated the highest number of statistically significant predictors, while exhibiting the lowest AIC values. The best model we found examined how luminance-based contrast on the face (Michelson contrast), vertical illuminance (Ev), diffuseness, luminaire type, and snow conditions affected participants’ responses. This model also allowed us to account for repeated measures from the participants by including participants in the model as a random effect.
Vertical illuminance as measured at the face level (Ev) and luminaire type were significant predictors of the face being rated as well-lit (see Table 2). Both increased vertical illuminance and the alternative luminaire were associated with a higher likelihood of faces being evaluated as well-lit. Despite its lower light levels, the regression model shows a subjective preference for the alternative luminaire. No significant effect was found for Q2 evaluating friendliness of the faces observed and predictors included.
Analysis of the responses to Q3 (the environment is well-lit) showed that four predictors were statistically significant, i.e. luminaire type was the strongest predictor (β=-1.485, p=0.00020), indicating that amber light color led to lower ratings of the environment's well-lit evaluation (Table 3). This suggests that the alternative luminaire was less favorable for perceiving the overall environment. Vertical illuminance at the face showed statistically significant and positive correlation with the responses (β=0.15029, p=0.0028), showing that an increase in vertical illuminance was associated with higher rates in answers to this question. The variables snow conditions and diffuseness were also statistically significant (β=-1.03632, p=0.01100 and β=-1.26629, p=0.00280 respectively), indicating that non-snowy conditions and higher diffuseness were associated with lower ratings for Q3. This apparent contradiction arises because the regression models account for multiple predictors simultaneously, as well as individual differences between participants. Thus, effects such as the benefit of snow cover or the disadvantage of diffuse light only become apparent when isolating their contribution from other variables. In other words, these effects only become clear when we use statistical analysis to separate their influence from other factors, for example, vertical illuminance levels or where the measurements were taken. Diffuseness was measured at the location of the face, while the question pertained to the overall environment. This mismatch may account for the negative association observed with this predictor.
The results for Q4 showed that vertical illuminance was the strongest predictor for the space being perceived as comfortable (β=0.19513, p=0.0003), followed by the “snow” variable (β=-1.24688, p=0.0463), which indicated that non-snowy conditions were associated with less perceived comfort than in snowy conditions (Table 4).
No statistically significant effects were observed for snow and the face-related questions (Q1 and 2). However, for the environment-related questions (Q3 and 4), statistical significance was found for a decrease in how well-lit (Q3: β = -1.04, p = 0.011) and comfortable (Q4: β = -1.25, p = 0.046) the environment was perceived under non-snowy conditions, suggesting that a snow cover has a positive effect on how the environment was perceived.
5. Discussion and Conclusion
This study aimed to examine objective lighting metrics (illuminance- and luminance-based) and their variation over a footpath in different environmental conditions (snow) and lighting types (conventional vs. alternative). We investigated how a more eco-centric lighting (A, alternative) affects the light field at a footpath, and how it relates to social aspects, like pedestrians’ perception of observed faces and the surroundings. Since artificial lighting influences the experience of both the surroundings and fellow pedestrians when walking on footpaths after dark [38,39], facial visibility is particularly relevant even if the time observing another pedestrian is limited (Davoudian & Raynham, 2012). The distance between an observed individual and the light pole influences the facial appearance, as the variation in light distribution alters accordingly (Fotios & Raynham, 2011; Wåseth et al., 2022). In winter, snow cover can further influence the light distribution in the face (Kuhn et al., 2013; Wåseth et al., 2025). Our results showed that luminaire type, distance to the luminaire and the reflective environmental conditions (snow) indeed impacted the objective data. The overall pattern of the objective results showed that the distance to the pole and snow conditions systematically influenced the light distribution. Luminaire type affected the light density and horizontal and vertical illuminance, and snow impacted the diffuseness and light vector. The subjective results showed less variation between the two luminaire types and did not consistently align with the measured light intensity. For instance, in snowy conditions, the position with the highest light density (position 6) received the lowest subjective rating for Q1 and Q2. Similarly, position 3 (with the same distance to the light pole) also tended to receive lower ratings. At these two positions (6 and 3), the light vector originated from behind the subject, resulting in negative contrast. These findings imply that a frontal light vector is important for the subjective perception of faces. Regression analysis confirmed that vertical (frontal) illuminance significantly influenced responses to Q1, highlighting its role in perceived facial visibility.
Under non-snowy conditions, light diffuseness varied by position with a notable factor of more than 3 (which is large, certainly considering that diffuseness is defined at a scale of 0-1). Snow cover increased and equalized diffuseness across all positions, likely due to its high albedo, enhancing hemispherical reflectance and upward illumination.
The greater variation seen in the objective data compared to the subjective evaluations indicates that objective data alone is not a sufficient basis for lighting design of the footpath, and that the light environment and the social light field are affected by factors beyond mere illuminance levels. This observation aligns with the human visual system's adaptability to varying light levels [41].
Although visual inspection of the descriptive bar plots (Appendix A1) shows a relatively general overview of the participants’ responses, the regression analysis revealed several significant effects. This was due to the ability of the regression models to provide a more precise understanding of how factors like snow cover, lighting type, and vertical illuminance influence perception by isolating the effect of each factor and showing which ones have a meaningful impact on participants’ ratings.
For luminaire A, with amber light, measured light levels were lower. However, the regression analysis showed that participants rated Q1 higher, both when the vertical illuminance increased and under luminaire A. Although this finding may seem counterintuitive at first, it suggests that luminaire A may have positively influenced face perception through a ‘warmer’ appearance of the face color. Previous studies have also found a preference for warmer lighting [42,43]. For environment evaluation (Q3), the relation was opposite, showing that the surroundings were evaluated as well-lit when the vertical illuminance was higher as well as under the white light (B).
These findings point to limitations in conventional lighting design practices, primarily assessing horizontal illuminance at ground level. Though semicylindrical illuminance standards aim to capture face-level lighting [35], they do not account for the light quality across the space as a pedestrian moves, along with the interplay between the observer and the one being observed. Lindh (2012) found that a more frontal lighting facilitated facial recognition, aligning with our findings of a preference for vertical lighting. Notably, pedestrian path lighting is complex, as illumination optimal for facial visibility can simultaneously cause glare for the observed individual [45]. Therefore, light quality should be assessed across the entire footpath to account for varying visual experiences. In the tested regression models, vertical illuminance exerted a stronger effect than horizontal illuminance on the visual assessment of faces and surroundings. Additionally, the preference for the alternative luminaire, with lower light levels and warmer light, indicates that horizontal light level alone is not sufficient for optimal visual quality.
One limitation of the study includes the use of a static white face-shaped probe, which did not account for different skin tones and details in the face (e.g., contrast between eyes, lips hair. Posture, movement and gait, known to influence interpersonal judgment [12], were not included to limit the study's scope, but are clearly of interest. Observation time of faces in a real-world setting would normally be shorter than in this study [46]. However, the light field above the footpath plays a critical role in interpersonal judgment during walking, as it influences the assessment of approaching persons. The face-shaped probe provides valuable data on the quality of this light field. Social interaction relies on visual cues like orientation, proximity, and motion [47]. McMahon and Isik (2023) argue that recognizing core components of social interactions is, first and foremost visual, and includes distance and facingness (the extent to which the subject is facing), as well as motion and interaction. We propose that the ability to derive these visual cues depends on light, and more specifically, the quality and characteristics of the lighting. Optimizing the visual conditions is thus essential for enhancing the social field of vision. Assessing the light field and its modelling effects offers an evidence-based approach to sustainable and user-oriented urban lighting design. This shift emphasizes light quality over light intensity, enabling design strategies that can enhance social interaction, promote perceived social security, as well as sustainability.
Author Contributions
Conceptualization, H.I.W., V.Z. and S.P.; methodology, H.I.W., V.Z. and S.P.; software, H.I.W., V.Z. and S.P; formal analysis, H.I.W. and V.Z.; investigation, H.I.W. and V.Z.; resources, H.I.W.; data curation, H.I.W.; writing—original draft preparation, H.I.W.; writing—review and editing, H.I.W., V.Z. and S.P.; visualization, H.I.W.; supervision, V.Z. and S.P.; project administration, H.I.W. All authors have read and agreed to the published version of the manuscript.
Funding
This research was funded by The Norwegian Research Council, and Sparebank1 Stiftelsen.
Data Availability Statement
The original data presented in the study are openly available in: 10.23642/usn.29196077.
Acknowledgments
We thank Zumtobel, the Norwegian National Road authorities and Vestfold County municipality for facilitating our research by installing alternative luminaires. We thank Kyungbinn Noh and Terje Christensen for assisting in the experiment.
Conflicts of Interest
The funders had no role in the design of the study; in the collection, analyses, or interpretation of data; in the writing of the manuscript; or in the decision to publish the results.
Appendix A
Appendix A.1
Figure A1.
Means plots of the responses to the four questions for snowy conditions on the left and non-snowy conditions on the right. Error bars depict standard deviations.
Figure A1.
Means plots of the responses to the four questions for snowy conditions on the left and non-snowy conditions on the right. Error bars depict standard deviations.
References
- Hölker, F.; Wolter, C.; Perkin, E.K.; Tockner, K. Light Pollution as a Biodiversity Threat. Trends in Ecology & Evolution 2010, 25, 681–682. [Google Scholar] [CrossRef]
- Jägerbrand, A.; Spoelstra, K. Effects of Anthropogenic Light on Species and Ecosystems. Science 2023, 380, 1125–1130. [Google Scholar] [CrossRef] [PubMed]
- Owens, A.C.S.; Cochard, P.; Durrant, J.; Farnworth, B.; Perkin, E.K.; Seymoure, B. Light Pollution Is a Driver of Insect Declines. Biological Conservation 2020, 241, 108259. [Google Scholar] [CrossRef]
- Sanders, D.; Frago, E.; Kehoe, R.; Patterson, C.; Gaston, K.J. A Meta-Analysis of Biological Impacts of Artificial Light at Night. Nat Ecol Evol 2020, 1–8. [Google Scholar] [CrossRef]
- Boyce, P.R. The Benefits of Light at Night. Building and Environment 2019, 151, 356–367. [Google Scholar] [CrossRef]
- Stone, T. The Value of Darkness: A Moral Framework for Urban Nighttime Lighting. Sci Eng Ethics 2018, 24, 607–628. [Google Scholar] [CrossRef]
- Edensor, T. Light Design and Atmosphere. Visual Communication 2015, 14, 331–350. [Google Scholar] [CrossRef]
- Porges, S.W. Polyvagal Theory: A Science of Safety. Front. Integr. Neurosci. 2022, 16. [Google Scholar] [CrossRef]
- Schroeter, V. Polyvagal Theory: Introduction for Somatic Psychotherapy. CJIIBA 2016, 26, 9–40. [Google Scholar] [CrossRef]
- Caminada, J.F.; van Bommel, W.J.M. New Lighting Criteria for Residential Areas. Journal of the Illuminating Engineering Society 1984, 13, 350–358. [Google Scholar] [CrossRef]
- Fotios, S.; Unwin, J.; Farrall, S. Road Lighting and Pedestrian Reassurance after Dark: A Review. Lighting Research & Technology 2015, 47, 449–469. [Google Scholar] [CrossRef]
- Fotios, S.; Johansson, M. Appraising the Intention of Other People: Ecological Validity and Procedures for Investigating Effects of Lighting for Pedestrians. Lighting Res. Technol. 2019, 51, 111–130. [Google Scholar] [CrossRef]
- Fotios, S.; Raynham, P. Correspondence: Lighting for Pedestrians: Is Facial Recognition What Matters? Lighting Research & Technology 2011, 43, 129–130. [Google Scholar] [CrossRef]
- Johansson, M.; Pedersen, E.; Maleetipwan-Mattson, P.; Kuhn, L.; Laike, T. Perceived Outdoor Lighting Quality (POLQ): A Lighting Assessment Tool. Journal of Environmental Psychology 2014, 14–21. [Google Scholar] [CrossRef]
- van Bommel, W. Road Lighting: Fundamentals, Technology and Application; Springer International Publishing, 2015. ISBN 978-3-319-11465-1.
- Bille, M.; Sørensen, T.F. An Anthropology of Luminosity: The Agency of Light. Journal of Material Culture 2007, 12, 263–284. [Google Scholar] [CrossRef]
- Pont, S.C. Light: Toward a Transdisciplinary Science of Appearance and Atmosphere. Annu Rev Vis Sci 2019, 5, 503–527. [Google Scholar] [CrossRef]
- Gehl, J. Cities for People; Island Press, 2010. ISBN 978-1-59726-573-7.
- Wåseth, H.; Zaikina, V.; Pont, S. The Social Light Field at Illuminated Footpaths. IEEE Sustainable Smart Lighting World Conference & Expo 2024, 3. [CrossRef]
- Wåseth, H.I.; Pont, S.C.; Zaikina, V. Poster: “The Influence of Light Distribution on Face Illumination and Percieved Friendliness.”; June 2 2022.
- Zaikina, V.; Matusiak, B.S.; Klöckner, C.A. Luminance-Based Measures of Contour Distinctness of 3D Objects as a Component of Light Modeling. LEUKOS 2015, 11, 31–45. [Google Scholar] [CrossRef]
- Gershun, A. The Light Field; 1st–4th ed.; Journal of Mathematics and Physics, 1939; Vol. 18.
- Mury, A.A.; Pont, S.C.; Koenderink, J.J. Representing the Light Field in Finite Three-Dimensional Spaces from Sparse Discrete Samples. Appl. Opt., AO 2009, 48, 450–457. [Google Scholar] [CrossRef]
- Xia, L.; Pont, S.; Heynderickx, I. Light Diffuseness Metric Part 1: Theory. Lighting Research & Technology 2017, 49, 411–427. [Google Scholar] [CrossRef]
- Xia, L.; Pont, S.; Heynderickx, I. Light Diffuseness Metric, Part 2: Describing, Measuring and Visualising the Light Flow and Diffuseness in Three-Dimensional Spaces. Lighting Research & Technology 2017, 49, 428–445. [Google Scholar] [CrossRef]
- Wåseth, H.I.; Zaikina, V.; Pont, S.C. Footpath Lighting: Optical, Visual and Perceptual Characteristics of the Social Light Field. Unpublished manuscript, Department of optometry, radiography and lighting design, University of South-Eastern Norway, Norway 2025.
- Cuttle, C. Lighting by Design; Routledge, 2003;
- Mury, A.A.; Pont, S.C.; Koenderink, J.J. Analysis of Second Order Light Fields in Closed 3D Spaces. In Proceedings of the Frontiers in Optics 2008/Laser Science XXIV/Plasmonics and Metamaterials/Optical Fabrication and Testing (2008), paper FMC3; Optica Publishing Group, October 19 2008; p. FMC3.
- Yu, C.; Eisemann, E.; Pont, S. Effects of Inter-Reflections on the Chromatic Structure of the Light Field. Lighting Research & Technology 2023, 55, 218–236. [Google Scholar] [CrossRef]
- Pont, S.C. Spatial and Form-Giving Qualities of Light. In Handbook of Experimental Phenomenology: Visual Perception of Shape, Space and Appearance; Chapter 8; Wiley, 2013.
- Kartashova, T. Structures of Physical and Visual Light Fields: Measurement, Comparison and Visualization. 2018. [CrossRef]
- Michel, L. Light: The Shape of Space; 1st ed.; Wiley, 1996;
- Yot, R. Light for Visual Artists Second Edition: Understanding and Using Light in Art & Design; Laurence King Publishing, 2019;
- Zhang, F.; de Ridder, H.; Barla, P.; Pont, S. A Systematic Approach to Testing and Predicting Light-Material Interactions. J Vis 2019, 19, 11. [Google Scholar] [CrossRef] [PubMed]
- CEN EN 13201-2:2016 – Road Lighting – Part 2: Performance Requirements 2016.
- Jägerbrand, A.; Bouroussis, C. Ecological Impact of Artificial Light at Night: Effective Strategies and Measures to Deal with Protected Species and Habitats. Sustainability 2021, 13, 5991. [Google Scholar] [CrossRef]
- CEN EN 13201-3:2016 Road Lighting Part 3: Calculation of Performance 2016.
- Rahm, J.; Sternudd, C.; Johansson, M. “In the Evening, I Don’t Walk in the Park”: The Interplay between Street Lighting and Greenery in Perceived Safety. Urban Design International 2020. [Google Scholar] [CrossRef]
- Rahm, J.; Johansson, M. Assessment of Outdoor Lighting: Methods for Capturing the Pedestrian Experience in the Field. Energies 2021, 14, 4005. [Google Scholar] [CrossRef]
- Kuhn, L.; Johansson, M.; Laike, T.; Govén, T. Residents’ Perceptions Following Retrofitting of Residential Area Outdoor Lighting with LEDs. Lighting Research & Technology 2013, 45, 568–584. [Google Scholar] [CrossRef]
- Felder-Schmittbuhl, M.-P.; Buhr, E.D.; Dkhissi-Benyahya, O.; Hicks, D.; Peirson, S.N.; Ribelayga, C.P.; Sandu, C.; Spessert, R.; Tossini, G. Ocular Clocks: Adapting Mechanisms for Eye Functions and Health. iovs 2018, 59, 4856–4870. [Google Scholar] [CrossRef]
- Davidovic, M.; Djokic, L.; Cabarkapa, A.; Kostic, M. Warm White versus Neutral White LED Street Lighting: Pedestrians’ Impressions. Lighting Research & Technology 2019, 51, 1237–1248. [Google Scholar] [CrossRef]
- Lund, K.G.; Hvass, M. Socially Inclusive Lighting Design: Exploring a Method to Enhance Freedom of Movement for Marginalised Groups. IOP Conf. Ser.: Earth Environ. Sci. 2024, 1320, 012029. [Google Scholar] [CrossRef]
- Wänström Lindh, U. Light Shapes Spaces: Experience of Distribution of Light and Visual Spatial Boundaries, 2012.
- Villa, C.; Bremond, R.; Saint-Jacques, E. Assessment of Pedestrian Discomfort Glare from Urban LED Lighting. Lighting Research & Technology 2017, 49, 147–172. [Google Scholar] [CrossRef]
- Davoudian, N.; Raynham, P. What Do Pedestrians Look at at Night? Lighting Research & Technology 2012, 44, 438–448. [Google Scholar] [CrossRef]
- McMahon, E.; Isik, L. Seeing Social Interactions. Trends in Cognitive Sciences 2023, 27, 1165–1179. [Google Scholar] [CrossRef]
Figure 1.
Image (a) shows the footpath with the clear-cut area on its left and the road on its right, with luminaires positioned between the road and the footpath. Image (b) shows the head-shaped light probe in one of the luminaire groups and in snowy conditions.
Figure 1.
Image (a) shows the footpath with the clear-cut area on its left and the road on its right, with luminaires positioned between the road and the footpath. Image (b) shows the head-shaped light probe in one of the luminaire groups and in snowy conditions.
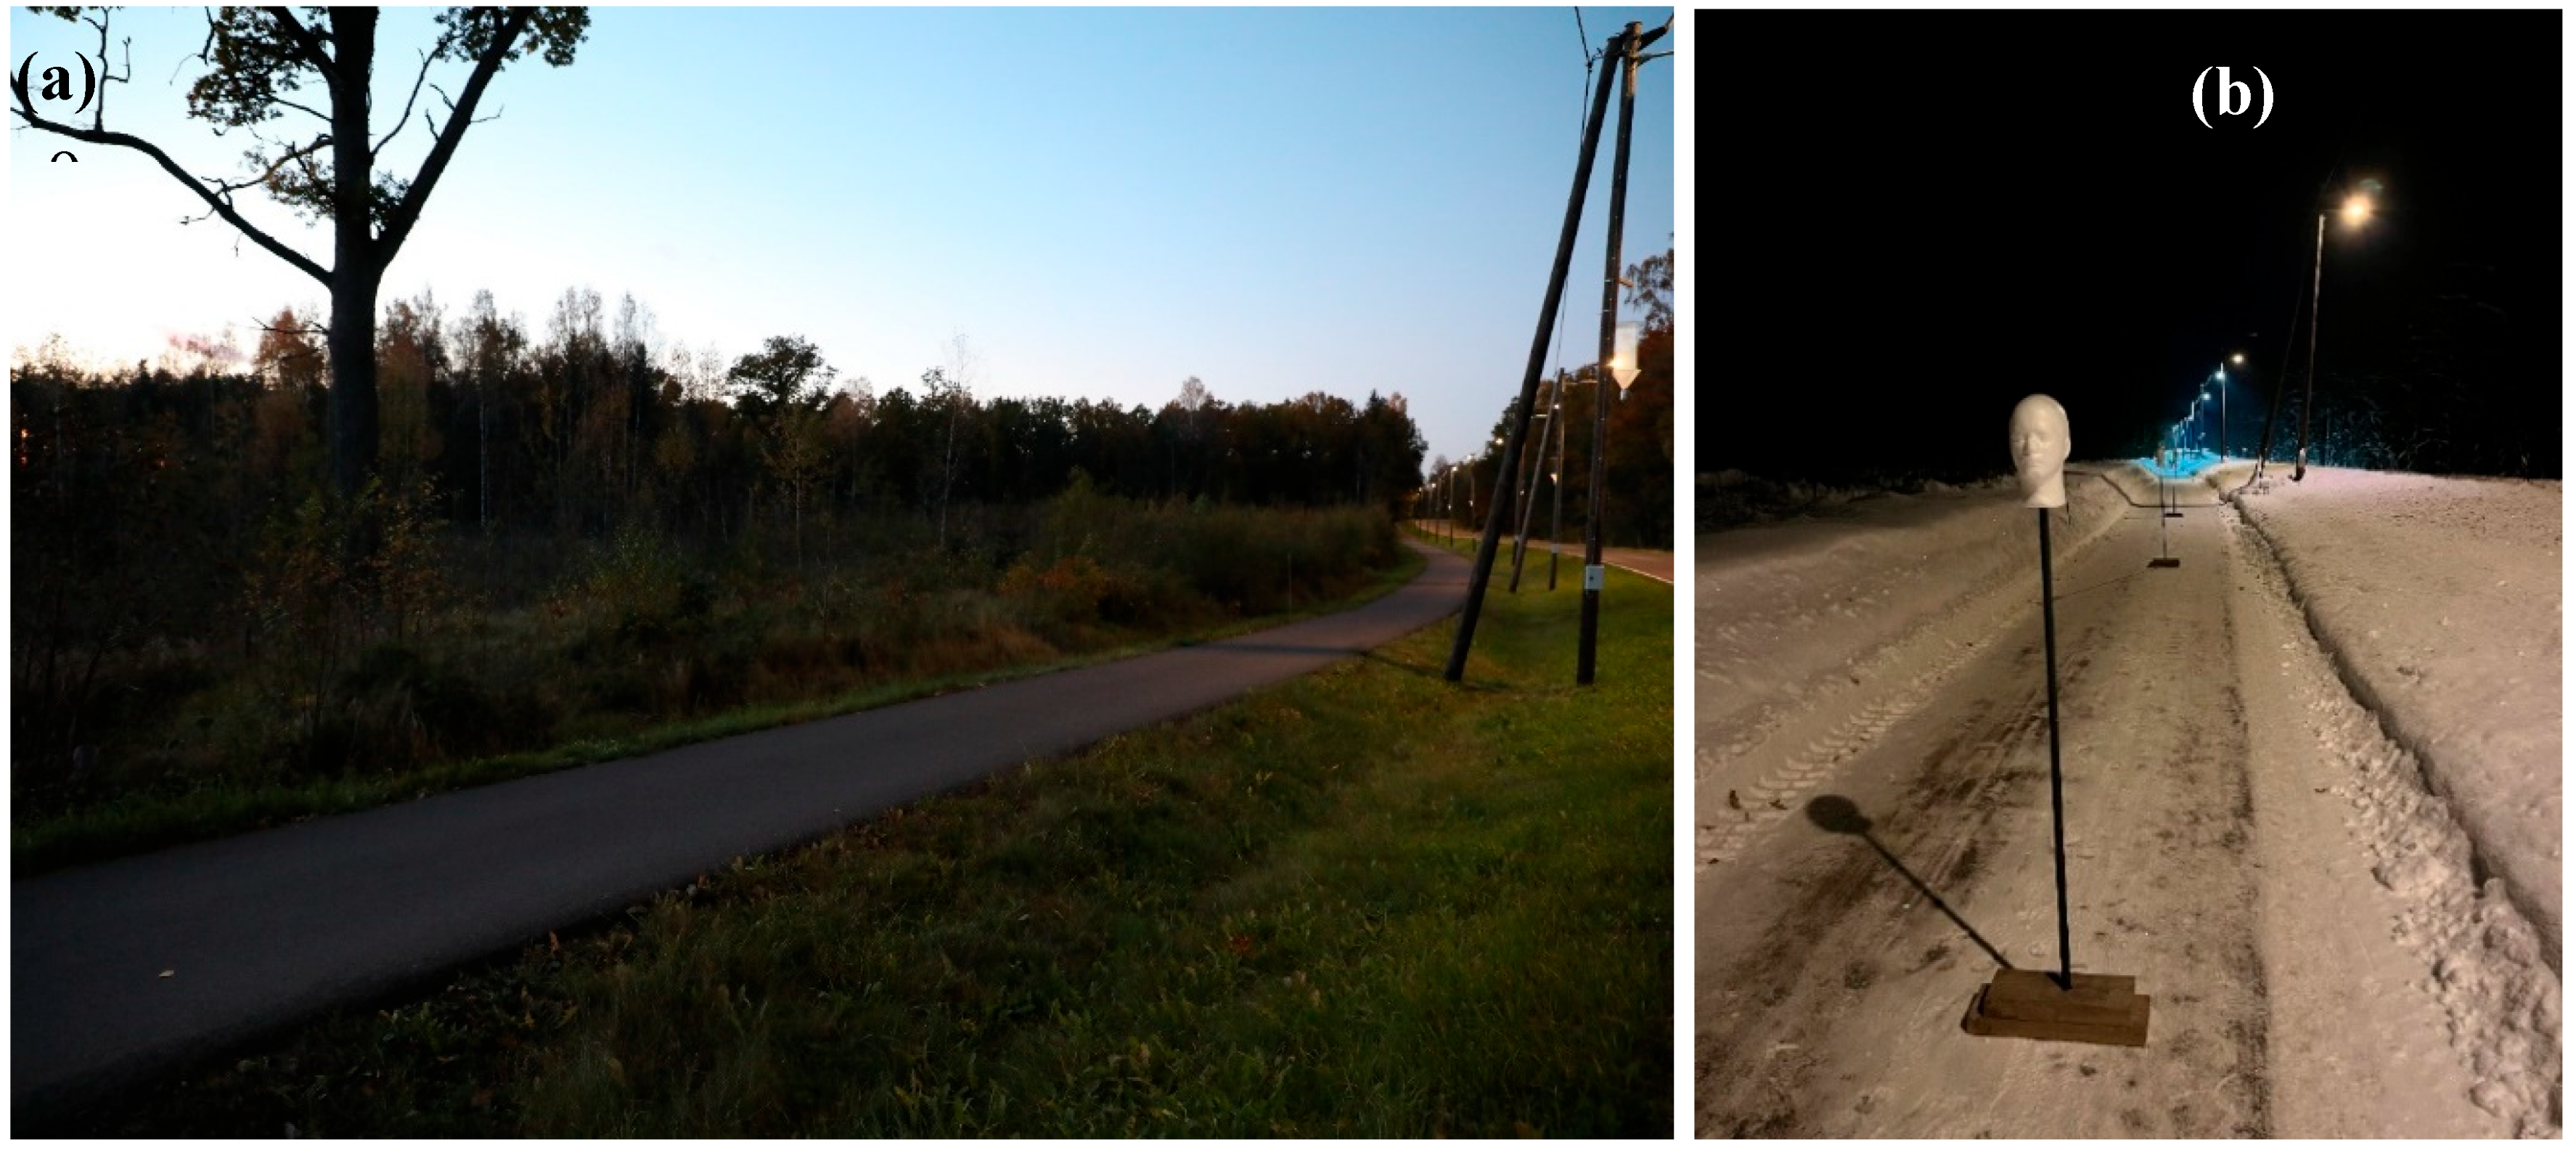
Figure 4.
shows plots for horizontal and vertical illumination for snowy (textured fill) and non-snowy conditions (solid colored fill) for the six different positions, where 1-3 (orange) corresponds to luminaire type A and 4-6 (grey) corresponds to luminaire type B.
Figure 4.
shows plots for horizontal and vertical illumination for snowy (textured fill) and non-snowy conditions (solid colored fill) for the six different positions, where 1-3 (orange) corresponds to luminaire type A and 4-6 (grey) corresponds to luminaire type B.
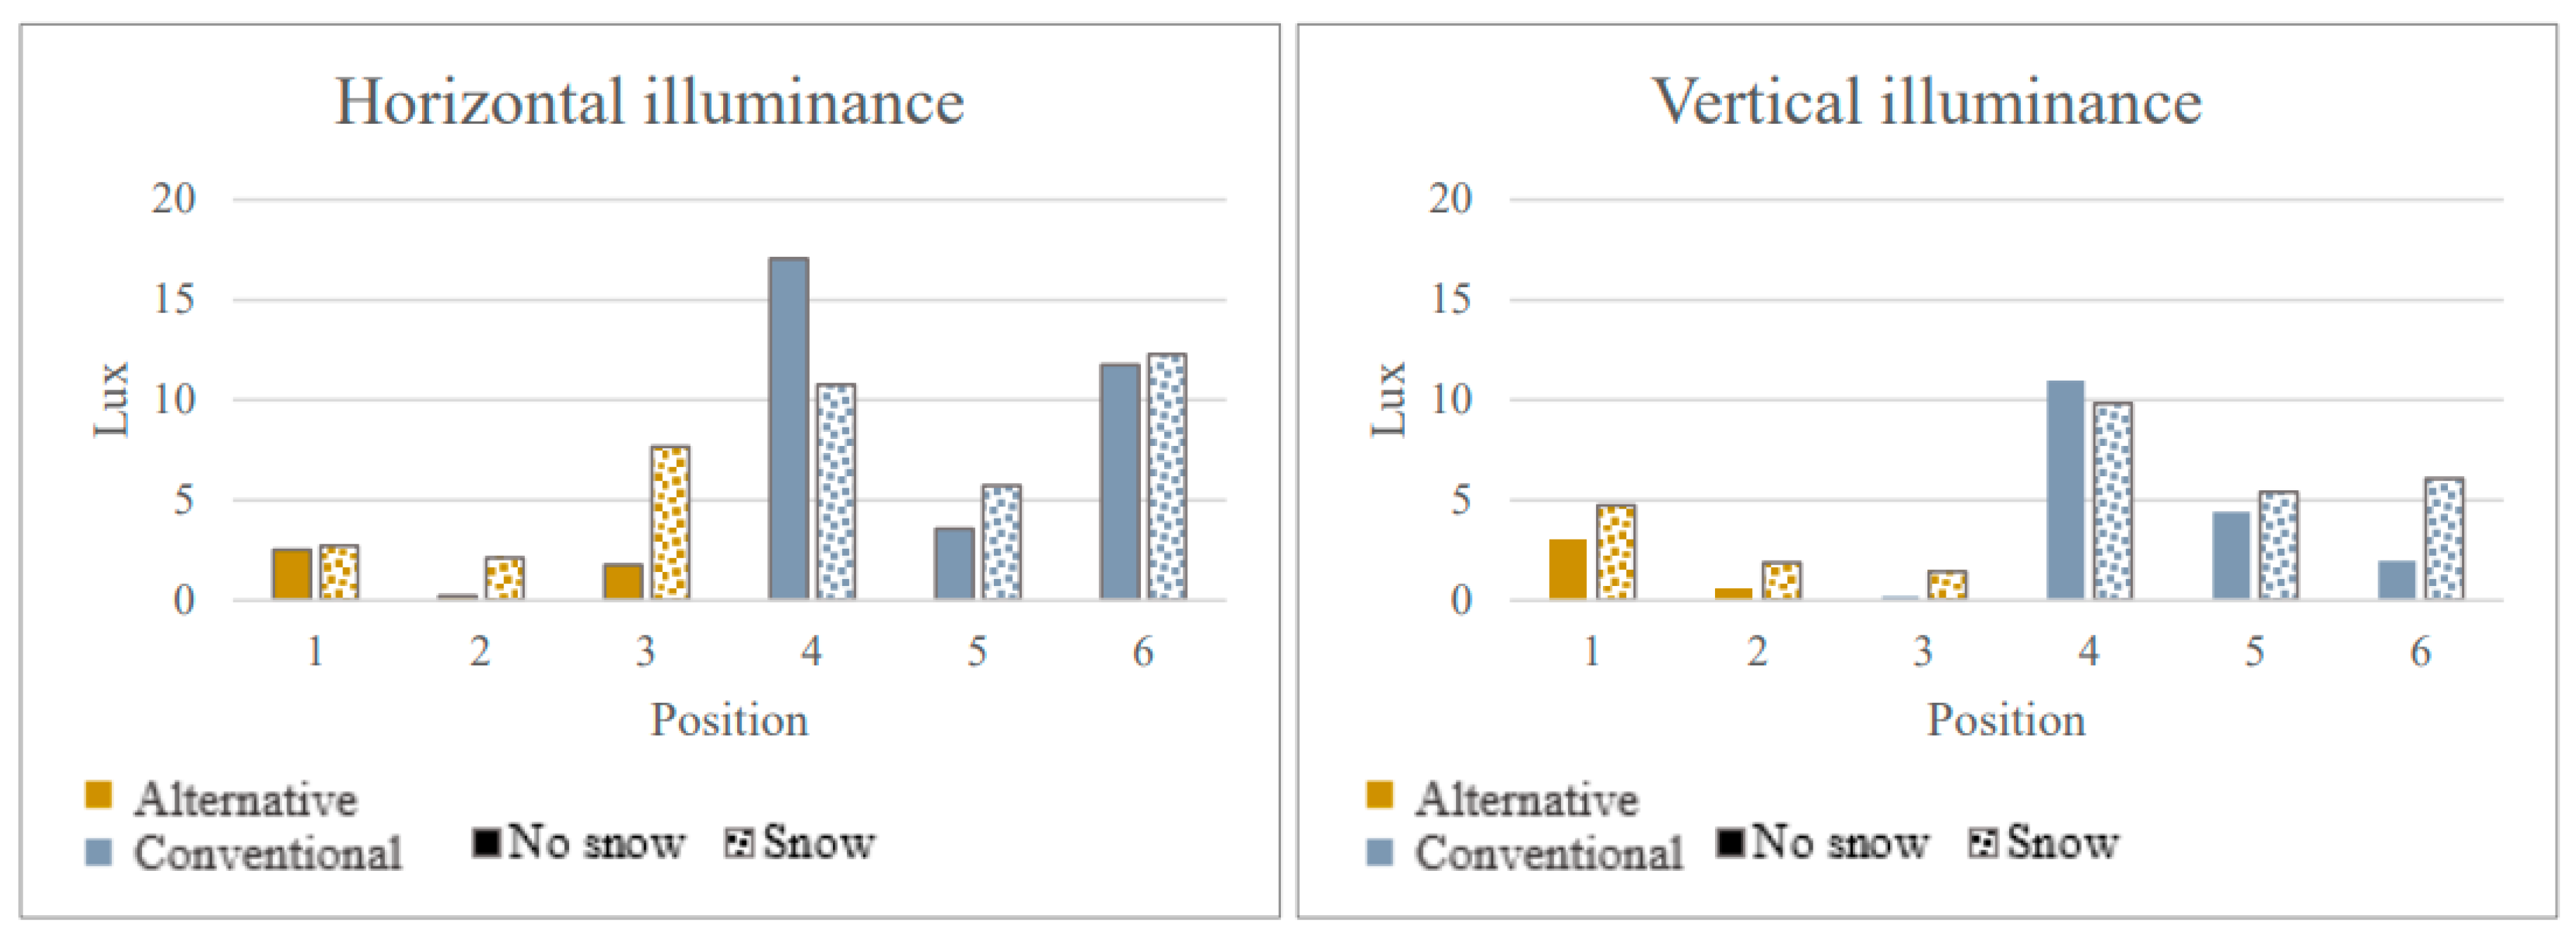
Figure 5.
presents plots for light density and Ez displayed using the same format as the previous figure.
Figure 5.
presents plots for light density and Ez displayed using the same format as the previous figure.
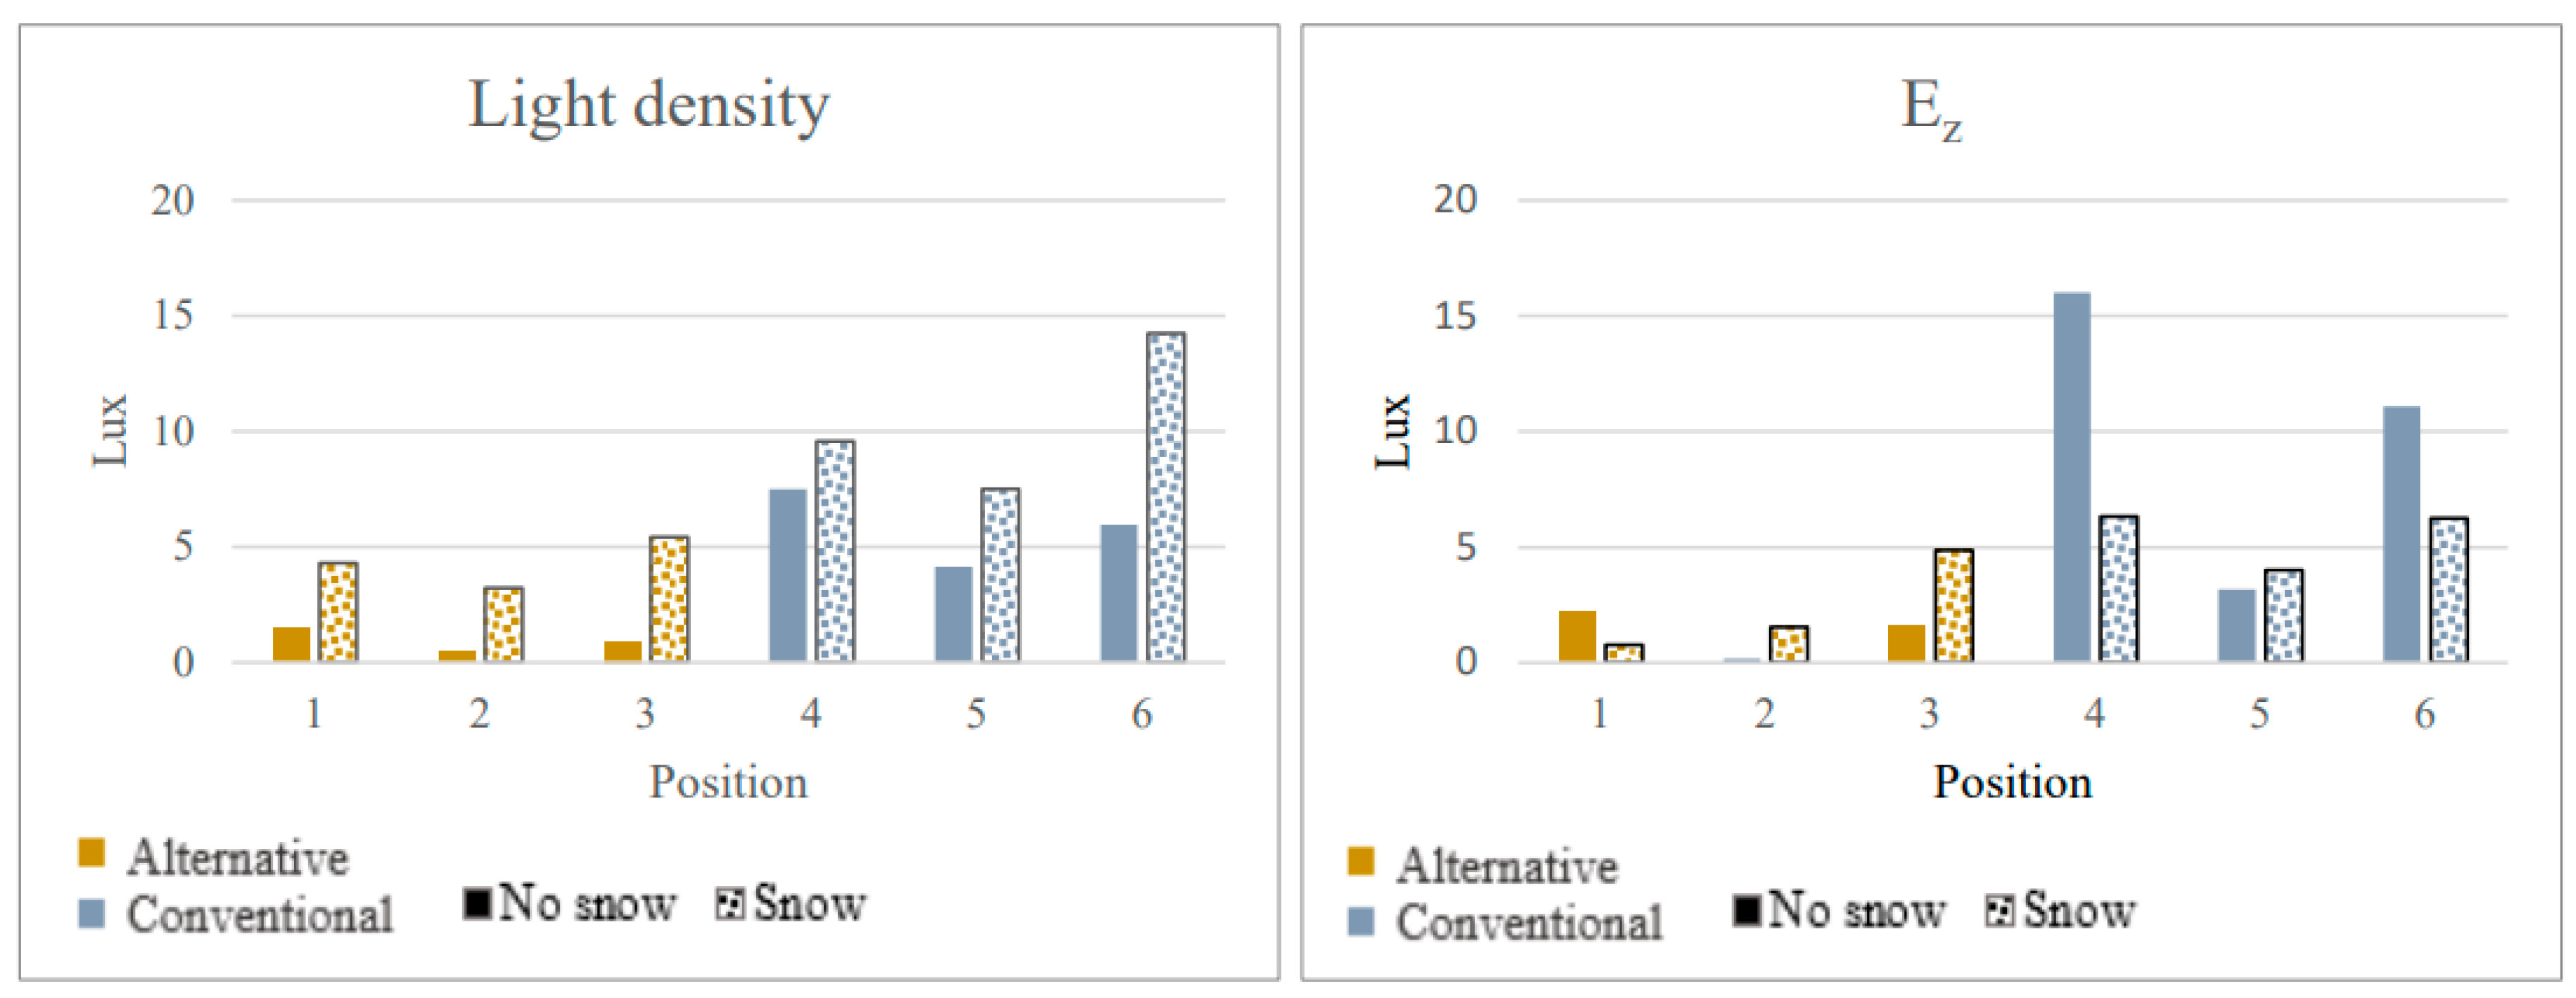
Figure 6.
shows plots for diffuseness and light vector magnitude, displayed using the same format as the previous figure.
Figure 6.
shows plots for diffuseness and light vector magnitude, displayed using the same format as the previous figure.
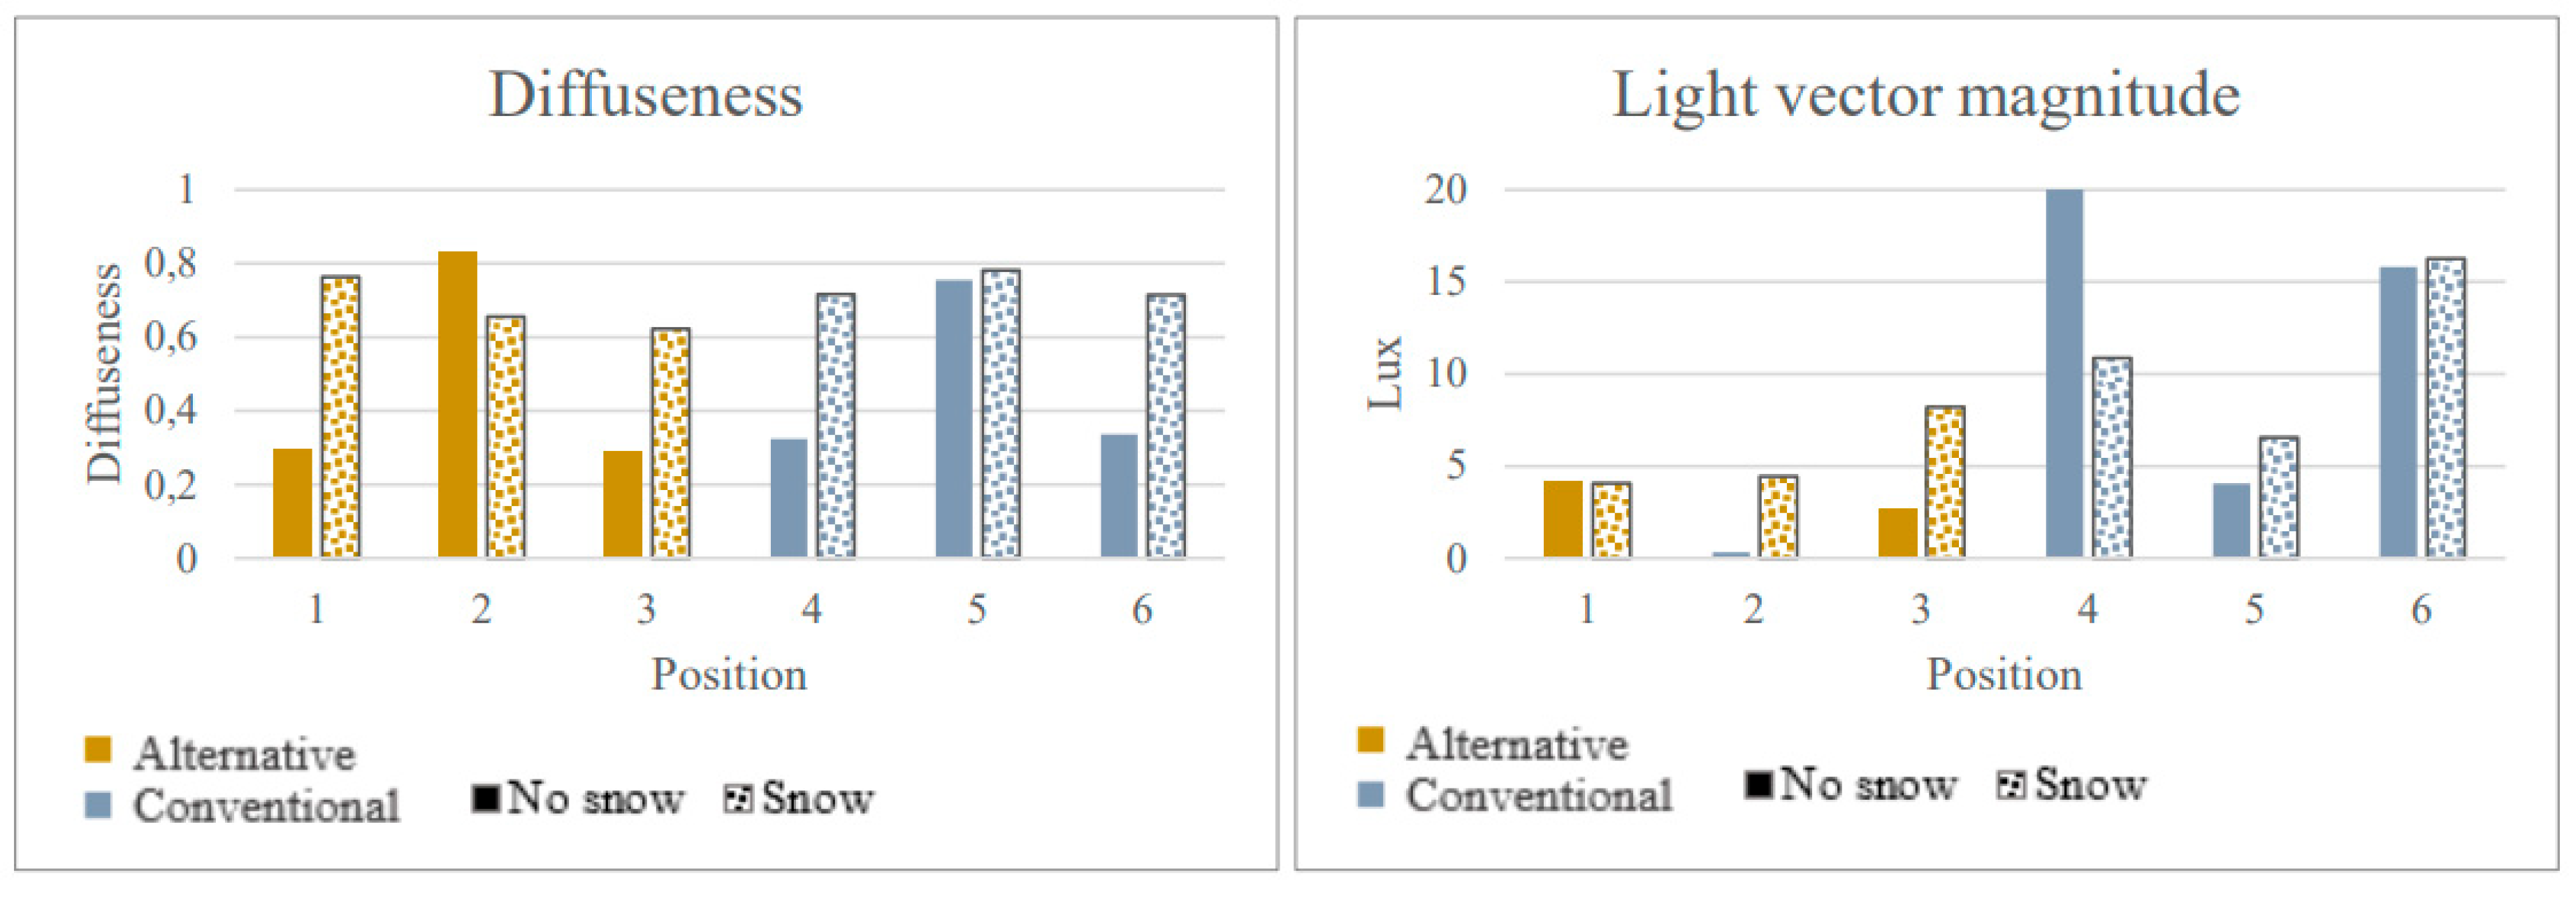

Table 1.
Two luminaire types were used, one conventional road luminaire, Schreder Ampera, and one alternative luminaire, Thorn Isaro, with lower light levels and CCT, thus normally considered more environmentally friendly.
Table 1.
Two luminaire types were used, one conventional road luminaire, Schreder Ampera, and one alternative luminaire, Thorn Isaro, with lower light levels and CCT, thus normally considered more environmentally friendly.
| Luminaire type | CCT (K) | CRI | Lumen output | Distribution | Power (W) | Distance (m) | Height (m) |
|---|---|---|---|---|---|---|---|
| A. alternative | 2200 K | >70 | 4820 | Street comfort | 38 | 30 | 8 |
| B. conventional | 4000 K | >70 | 14 000 | Road optics | 132 | 30 | 9 |
Table 2.
Regression analysis results for Q1 (the face is well-lit).
| Predictor | Estimate | Std. error | z-value | Pr(>|z|) |
|---|---|---|---|---|
| Contrast face (0 = low, 1 = high) | -1.09643 | 1.00788 | -1.08800 | 0.27670 |
| Ev (0 = low, 1 = high) | 0.39245 | 0.05617 | 6.98700 | 0.00000***1 |
| Diffuseness (0 = low, 1 = high) | 0.24914 | 0.57172 | 0.43600 | 0.66300 |
| Luminaire (0 = conventional, 1 = alternative) | 0.77724 | 0.38568 | 2.01500 | 0.04390*1 |
| Snow conditions (0 = snowy, 1 = non-snowy) | 0.77724 | 0.38568 | 2.01500 | 0.04390*1 |
1 Signif. codes: 0 ‘***’ 0.001 ‘**’ 0.01 ‘*’.
Table 3.
Regression analysis results for Q3 (the environment is well-lit).
| Predictor | Estimate | Std. error | z-value | Pr(>|z|) |
|---|---|---|---|---|
| Contrast face (0 = low, 1 = high) | 0.35575 | 1.03446 | 0.34400 | 0.73090 |
| Ev (0 = low, 1 = high) | 0.15029 | 0.05021 | 2.99300 | 0.00280**1 |
| Diffuseness (0 = low, 1 = high) | -1.26629 | 0.59283 | -2.13600 | 0.03270*1 |
| Luminaire (0 = conventional, 1 = alternative) | -1.48513 | 0.40163 | -3.69800 | 0.00020***1 |
| Snow conditions (0 = snowy, 1 = non-snowy) | -1.03632 | 0.40755 | -2.54300 | 0.01100*1 |
1 Signif. codes: 0 ‘***’ 0.001 ‘**’ 0.01 ‘*’.
Table 4.
Regression analysis results for Q4 (I feel comfortable in this environment).
| Predictor | Estimate | Std. error | z-value | Pr(>|z|) |
|---|---|---|---|---|
| Contrast face (0 = low, 1 = high) | -1.31866 | 1.09951 | -1.19900 | 0.23040 |
| Ev (0 = low, 1 = high) | 0.19513 | 0.05337 | 3.65600 | 0.00030*** 1 |
| Diffuseness (0 = low, 1 = high) | -1.11815 | 0.61173 | -1.82800 | 0.06760 |
| Luminaire (0 = conventional, 1 = alternative) | -0.59953 | 0.41859 | -1.43200 | 0.15210 |
| Snow conditions (0 = snowy, 1 = non-snowy) | -1.24688 | 0.62586 | -1.99200 | 0.04630*1 |
1 Signif. codes: 0 ‘***’ 0.001 ‘**’ 0.01 ‘*’.
Disclaimer/Publisher’s Note: The statements, opinions and data contained in all publications are solely those of the individual author(s) and contributor(s) and not of MDPI and/or the editor(s). MDPI and/or the editor(s) disclaim responsibility for any injury to people or property resulting from any ideas, methods, instructions or products referred to in the content. |
© 2025 by the authors. Licensee MDPI, Basel, Switzerland. This article is an open access article distributed under the terms and conditions of the Creative Commons Attribution (CC BY) license (http://creativecommons.org/licenses/by/4.0/).
Copyright: This open access article is published under a Creative Commons CC BY 4.0 license, which permit the free download, distribution, and reuse, provided that the author and preprint are cited in any reuse.


