
Submitted:
05 June 2025
Posted:
06 June 2025
You are already at the latest version
Abstract
Background/Objectives: The regulatory role of miRNAs in cancer is well recognized, but most studies are confined to specific cancer types or individual miRNAs. This study aims to identify miRNAs involved in global oncological mechanisms that transcend individual cancer types.
Methods: We analyzed expression data from all known human miRNAs across all cancer types. A statistical approach was developed and expression distributions to define miRNAs with under- or over-expression patterns. We then studied miRNA-target gene relationships and investigated complementarity between human and plant miRNAs to propose potential therapeutic plant miRNA panels.
Results: Critical miRNAs were identified based on their expression trends and impact on target genes. Plant miRNAs with strong complementarity to underexpressed human miRNAs and weak complementarity to overexpressed miRNAs were selected as candidates for therapeutic panels. Distribution patterns and key correlations were visualized using figures.
Conclusions: The results suggest that an approach for making panels of selected plant miRNAs may offer therapeutic benefits by compensating for deficiencies in human miRNA expression associated with cancer. This work provides a framework for future experimental validation and therapy design.
Keywords:
miRNA
; cancer
; expression analysis
; target genes
; plant miRNAs
; bioinformatics
; statistical distribution
1. Introduction
MicroRNAs (miRNAs) are small non-coding RNAs that modulate gene expression post-transcriptionally, primarily through interaction with messenger RNAs (mRNAs), thereby indirectly influencing DNA replication and protein synthesis[1]. They are evolutionarily conserved across plants and animals, exhibit high stability, and can be transported to specific sites to exert regulatory effects. Recent studies have suggested that exogenous plant miRNAs may compensate for dysregulated human miRNAs, provided sufficient sequence complementarity — typically a minimum of 50% — to ensure mRNA targeting capacity[2]. To substitute one plant miRNA for another, however, a higher similarity threshold of 80–90% is usually required[3,4,5]. This property, termed biological complementarity, underpins the potential interchangeability of miRNAs across species.
Alterations in miRNA concentrations are a hallmark of numerous cancers, yet most investigations have focused on individual miRNAs or small, disease-specific subsets[6,7,8]. Expression levels are typically measured in tissue and circulating blood, comparing diseased and healthy samples. Cancers frequently induce widespread perturbations in miRNA expression, leading to the hypothesis that restoring miRNA homeostasis may influence disease progression[9,10].
To explore global trends in miRNA dysregulation associated with cancer, we analyzed a comprehensive dataset containing miRNA expression profiles across multiple cancer types[11,12]. Employing machine learning, we attempted to predict miRNA expression status (under- or overexpressed) using neural networks. Despite leveraging large-scale data, classification accuracy plateaued at 70–75%, suggesting either insufficient mechanistic understanding or the influence of multiple latent variables. These results highlight the limitations of current predictive models for miRNA expression.
To bypass these constraints, we characterized each miRNA statistically, representing it by two parameters: the number of expression measurements (experiments) and a derived membership ratio (div). This enabled visualization of miRNA distributions across cancers. miRNAs with high absolute div values and extensive experimental coverage were considered strong candidates for functional relevance. These findings offer a basis for prioritizing miRNAs in targeted analyses.
We then assessed the feasibility of correcting aberrant human miRNA expression using plant miRNAs, based on average sequence complementarity. miRNAs with high div values (indicative of consistent dysregulation) were stratified by whether they were over- or underexpressed. For each plant miRNA, we computed average complementarity with both groups and identified candidates with maximal differential affinity — favoring underexpressed targets while avoiding overexpressed ones. These metrics form the foundation for evaluating therapeutic potential.
Given the vast number of dysregulated miRNAs, we further prioritized targets by identifying key genes under miRNA control. We limited our analysis to experimentally validated miRNA–gene interactions. Since one gene may be regulated by multiple miRNAs, we computed, for each gene, the number of regulating miRNAs and the aggregated div metric of these miRNAs. This allowed us to identify genes under robust miRNA-mediated regulation. Parallel expression datasets from cancer samples[17] provided direct gene-level expression data. By comparing miRNA-derived and empirical gene expression patterns, we examined consistency in regulatory trends. While many genes showed discordant profiles, others exhibited concordant regulation, suggesting differential miRNA involvement in gene expression control.
Focusing on the top 200 genes most strongly affected by both direct expression changes and miRNA-derived div metrics, we mapped back to the regulating miRNAs. From this refined miRNA set, we again computed average complementarity with plant miRNAs. Those plant miRNAs showing the largest positive differential (strong affinity for underexpressed miRNAs and weak for overexpressed) emerged as optimal candidates for therapeutic intervention. Conversely, plant miRNAs with the largest negative differential may inform mechanisms of cancer-promoting miRNA overabundance.
We also evaluated average complementarity at the plant-species level but observed minimal variation (<0.05%), suggesting that species-level generalizations are currently infeasible. This may reflect the sensitivity of plant miRNA profiles to cultivar, geography, and growth conditions.
Nevertheless, our framework provides a rational basis for the design of synthetic miRNAs with enhanced specificity — engineered to maximize complementarity with target human miRNAs while minimizing off-target interactions — opening avenues for future miRNA-based therapeutics.
2. Materials and Methods
Statistical analyses of miRNA expression data were performed utilizing a comprehensive database comprising multiple parameters, including cancer type, experimental modality, T-value/B-value metrics, and log fold change (logFC) [12]. The principal variable of interest was logFC, representing the logarithmic deviation of miRNA expression levels relative to baseline in tissue or blood samples. Each miRNA was profiled across numerous experiments, yielding a dataset encompassing 3,174 distinct miRNAs and 155,417 total experimental observations.
Initial analytical steps involved deploying a neural network model to predict both the quantitative logFC values and the qualitative directionality of expression changes (upregulation or downregulation). Predictions were generated for diverse sample representations, including individual miRNA measurements and mean expression profiles. Model performance was evaluated through training on input features comprising miRNA sequence data (mature and precursor forms), disease classification, experimental context, and ancillary variables.
Data processing, sorting, and visualization were conducted using custom software implemented in Python 3 within the PyCharm IDE (version 2022.1). The membership ratio was computed following the formula described in [106].
where num_of_down and num_of_up denote the number of experiments in which the miRNA was significantly down- or upregulated, respectively.
It is established that each miRNA regulates a large number of target genes, and elucidating the specific mechanisms of these interactions is a crucial task, particularly regarding the interdependencies of factors, i.e., correlations of quantitative features. Databases of miRNAs and their target genes, such as miRDB [103] and miRTarBase [104], provide useful resources for this purpose. The former database includes both experimentally validated target genes and predicted miRNA-gene relationships, thereby expanding the dataset. The latter contains only experimentally validated miRNA-gene interactions. We utilized miRTarBase to identify genes associated with varying numbers of critically up- and downregulated miRNAs, as determined by the third (III) nonlinear critical threshold (Figure 2). Gene expression data for multiple cancer types were obtained from the database in [17]. Additionally, the plant miRNA database [105], comprising 10,898 plant miRNAs, was employed.
3. Results
3.1. Identification of Critical miRNAs
Neural network training results indicate that prediction accuracy for the direction of expression achieves a minimum of approximately 50% and does not exceed ~65% when considering all miRNAs. Numerical experiments applying various filters—such as restricting analysis to specific tumor types or experimental modalities—yielded similar accuracy. When focusing solely on individual miRNAs characterized by a predominance of either underexpression or overexpression (based on percentage ratio) and supported by a sufficient number of experiments to establish a trend, accuracy improves to 70–80% [16].
From these findings, several assumptions can be made:
- Input variables—such as miRNA sequences, disease type, and experiment type—play a role but do not fully capture the overall miRNA expression profile, indicating that not all relevant information influencing expression prediction is accounted for.
- The number of distinct miRNAs studied may be insufficient.
- The expression data in the database may contain measurement errors.
Thus, a statistical approach is warranted to identify existing dependencies within the expression data and uncover opportunities to extract useful information about miRNAs, particularly regarding specific miRNA sequences. Given the multitude of parameters influencing miRNA expression, it is necessary to analyze expression data collectively rather than on an experiment-by-experiment basis.
Accordingly, each miRNA was evaluated in the context of all experiments in which it was observed. An “average” expression value for each miRNA was estimated by summing all logFC values across all experiments. The resulting data were organized into a new table containing the following columns: miRNA identifier, cumulative sum of logFC, number of experiments with negative logFC, and number of experiments with positive logFC. This procedure was applied under various filtering conditions, such as specific cancer types or experimental designs. Although the values vary slightly depending on the applied filters, the overall trend remains consistent.
The number of miRNAs predominantly exhibiting overexpression and underexpression was found to be nearly equal (1606 versus 1568). It is important to note that many miRNAs are represented by a small number of experiments. Some miRNAs demonstrate membership values around or above 95%, although the number of associated experiments does not exceed several dozen.
To summarize the classification of miRNAs based on cumulative logFC expressions across all cancer types, the data are presented in the form of a truncated table (Table 1).
It was observed that across all expression data, a pronounced tendency exists for the majority of miRNAs (over 70% of the total distinct miRNAs) to be classified as either predominantly overexpressed or underexpressed, independent of disease type or experimental conditions (e.g., blood-derived or cell-derived samples). This trend remains consistent even when the dataset is restricted by applying various filters.
We further compared the membership ratios derived from high-throughput expression data with those obtained from low-throughput methods [12], revealing an approximate concordance of 90% (±5%), contingent on the applied filters such as total expression counts and membership thresholds.
In the following table, we present a comparative analysis of miRNAs identified in Table 1 alongside those reported in the literature, listing miRNAs classified as overexpressed or underexpressed and comparing their corresponding statistical metrics.
The following Figure 1 illustrates the distribution of all 3,173 miRNAs according to the number of experiments in which they were observed and their respective membership ratios. All miRNAs listed in Table 2 are highlighted within this overall distribution.
As observed, many studied indicators exhibit a clear trend toward either upregulation or downregulation. However, numerous miRNAs remain poorly characterized with respect to the molecular mechanisms in which they participate. Additionally, as the number of experiments per miRNA increases, its position on the distribution converges toward an average value.
A key challenge lies in defining the boundary between "critical" and "non-critical" miRNAs. Multiple factors influence miRNA expression, a conclusion supported by neural network analyses. This underscores the necessity for additional contextual information regarding the experimental conditions under which miRNA expression is measured, including potentially relevant molecular mechanisms and regulatory factors.
It is evident that increasing the number of experiments enhances the robustness of correlations between miRNA expression patterns in diseased versus healthy tissues. Furthermore, a higher ratio between the number of experiments showing negative versus positive miRNA expression strengthens the statistical significance of associations between miRNA dysregulation and cancer. Balancing these parameters is complicated by substantial variability in experiment counts across individual miRNAs.
Figure 2 presents the relationship between the cumulative difference metric (div) and the number of experiments, delineating three boundary regions corresponding to nonlinear thresholds. These critical div values serve to classify general miRNA expression trends across cancer types. A color-coded scheme visually represents miRNA concentration (dots) within distinct graph regions.
Panel (b) of Figure 2 illustrates the upper threshold (I) alongside miRNAs from the table whose expression behaviors have been characterized in greater detail.
It should be noted that only a small subset of miRNAs has been studied in detail (see references in Table 2), indicating that a considerable number of human miRNAs remain insufficiently characterized with respect to their biological functions. Notably, within the nonlinear threshold I, Table 2 lists 17 out of 165 overexpressed miRNAs and only 6 out of 414 underexpressed miRNAs. This suggests that miRNAs with higher abundance have been more extensively investigated compared to those present at lower levels.
Figure 3 presents expression distributions as a function of the number of experiments for the 20 most frequently studied miRNAs within the nonlinear zone I, comprising both underexpressed and overexpressed groups.
It is evident that as the number of experiments assessing miRNA expression increases, the average expression value tends to converge toward a membership ratio of 0. However, there are miRNAs with between 20 and 50 experiments that maintain a membership ratio exceeding 0.7, as illustrated in Figure 4.
Table 3 presents selected statistical parameters for overexpressed and underexpressed miRNAs. For all miRNAs exceeding the nonlinear thresholds, the table reports the number of unique miRNAs (data points), the total number of experiments aggregated across these miRNAs, and the cumulative expression values. Across all metrics, underexpressed miRNAs predominate over overexpressed ones. This disparity is especially pronounced at the primary (I) nonlinear threshold, where miRNAs above the threshold are considered more biologically relevant. Here, the dominance of underexpressed miRNAs is markedly clear.
Overall, these findings suggest that in cancerous conditions, the repertoire of underexpressed miRNAs substantially exceeds that of overexpressed miRNAs. This implies that many miRNAs exhibit markedly reduced concentrations in the presence of cancer compared to those whose levels are elevated. The underlying causes may vary: cancer could impair miRNA biogenesis pathways, reflect a host protective response to tumorigenesis, or result from a complex interplay of these and other factors.
3.2. Statistical Relationship Between miRNA and Target Genes
Statistical associations between miRNAs and their target genes were analyzed by calculating, for each gene, the number of underexpressed and overexpressed miRNAs (according to threshold III), as well as the difference between these counts (see Table 4).
Similarly, a graph depicting the relationship between the membership ratio and the number of targeting miRNAs (rather than the number of experiments as in the previous analysis) was constructed. Only genes targeted by more than 20 miRNAs were included, reducing the dataset from 7,371 to 3,495 genes. A nonlinear threshold, approximating the critical threshold III, was applied to distinguish genes classified as “downregulated” or “upregulated.” The resulting gene distribution is presented in Figure 5. Additionally, the figure highlights a subset of genes (10 per category) from database [8], for which experimentally validated interactions relevant to cancer development have been documented.
Table 5, analogous to the miRNA table, presents numerical parameters derived from the graph, including the number of genes above the nonlinear threshold curve for overexpressed and underexpressed categories, the total number of miRNAs targeting these genes, and the cumulative membership ratio for all genes.
The data presented in Figure 5 can be utilized for various analyses: investigating individual genes, gene sets, gene categories, or providing a general characterization of gene expression patterns in cancer. Genes positioned above the nonlinear critical threshold, exhibiting a high number of targeting miRNAs (either up- or downregulated) and a membership ratio approaching unity, are of particular interest regarding their involvement in cancer-related mechanisms.
To elucidate the influence of miRNA expression on gene regulation in cancer, gene expression data from database [17], encompassing various cancer types, were analyzed. For each gene, the average expression across all cancer types was calculated, yielding a single representative value (mean log_expression). Concurrently, “critical” genes identified through miRNA expression patterns in Figure 5 were assigned a cumulative membership ratio (div), enabling a two-dimensional representation of gene status. This distribution is illustrated in Figure 6.
As illustrated in Figure 6, genes are distributed broadly across the two-dimensional parameter space defined by mean logarithmic expression and membership ratio. Each quadrant corresponds to distinct biological interpretations and potential regulatory mechanisms. Table 6 summarizes the gene counts stratified by cancer type. The first column lists the cancer type, the second column indicates the number of genes with mean log_expression values between –0.1 and 0.1, representing near-zero expression. The third column shows the total number of genes measured for each cancer type, and the fourth column provides the ratio of near-zero expression genes to total measured genes.
These genes exhibit negligible expression changes during cancer but are targeted by miRNAs with non-zero membership ratios, suggesting potential miRNA-mediated regulation that is balanced or compensated by other factors. Alternatively, it may indicate that the miRNAs do not directly regulate these genes under the studied conditions.
The above table provides useful information about genes whose expression remains within the normal range of miRNA concentration. Our main objective is to influence specific genes by modulating the concentration of miRNAs in order to correct the expression levels of a limited set of genes of interest.
At the same time, many genes show clear correlation patterns, as exemplified by the 20 genes located farthest from the origin in the coordinate system.
A subset of 200 individual genes was selected based on having the largest sum of the absolute values of mean log_expression and membership ratio (div). These represent critical genes whose expression may potentially be regulated by changes in the expression of their corresponding miRNAs. Such genes exhibit a clear relationship between their expression in disease and the expression levels of their targeting miRNAs. Of course, it should be noted that gene expression is influenced not only by miRNAs but also by other regulatory factors, so some coincidences may occur.
We then selected miRNAs corresponding to the III non-linear boundary (Figure 2a) that target these 200 critical genes. Among them, there are 634 underexpressed and 462 overexpressed miRNAs, with most miRNAs targeting only one gene from the critical list. For each miRNA from this set, we calculated the number of critical genes it targets. Restricting the analysis to miRNAs targeting at least 10 critical genes, we identified 115 underexpressed and 93 overexpressed miRNAs, which are presented in Table 7 and Figure 7 as examples.
It is assumed that these miRNAs (115 underexpressed and 93 overexpressed) may play a significant role in regulating key mechanisms of cancer development, as they are clearly underexpressed or overexpressed and are likely to influence critical genes whose expression changes have been observed in the presence of cancer and which are targeted by these miRNAs.
We are primarily interested in genes with a positive membership ratio (div), as these correspond to genes targeted by miRNAs that are significantly underexpressed. These genes have greater practical significance because it is generally more feasible to compensate for insufficient miRNA concentrations (underexpression) than to reduce the levels of overexpressed miRNAs. Among the 115 underexpressed miRNAs identified, only 12 appear in Table 2, whereas 35 of the 93 overexpressed miRNAs are present there. This indicates that changes in the expression of miRNAs and their target genes have been studied more extensively for overexpressed miRNAs compared to underexpressed ones (see Table 8).
3.3. Connection with Plant miRNAs
The next step involved investigating the relationship between plant miRNAs and specific human miRNAs identified in the previous section. Using the critical human miRNAs—607 overexpressed and 786 underexpressed miRNAs defined by the (III) nonlinear separation threshold—we performed a complementarity analysis between plant and critical human miRNAs.
Each plant species has a characteristic set of miRNAs. For each plant, we calculated the average complementarity score, defined as the sum of all complementarity scores with critical human miRNAs divided by the total number of these comparisons [105]. Additionally, average complementarity scores were computed separately for critical overexpressed and critical underexpressed human miRNAs.
Our results show that the average complementarity across all 127 plant species analyzed is approximately ±0.5 for both overexpressed and underexpressed miRNAs. The difference in complementarity between the critical overexpressed and underexpressed groups does not exceed 0.07.
Furthermore, we compared all plant miRNAs against the subset of critical human miRNAs that target critical genes identified previously—specifically, 115 underexpressed and 93 overexpressed miRNAs. The average complementarity-similarity for all plant miRNAs, calculated separately for these two groups of human miRNAs, is summarized in Table 9.
If the same complementarity analysis is performed for underexpressed and overexpressed miRNAs defined by the III nonlinear threshold, the difference between their average complementarities with plant miRNAs is significantly smaller — see Table 10.
These plant miRNAs may play a crucial role in compensating for the deficiency of underexpressed human miRNAs observed in cancer. Conversely, many plant miRNAs also show average complementarity to overexpressed human miRNAs. From a therapeutic perspective, targeting the restoration of underexpressed human miRNAs appears more promising, as supplementing deficient miRNAs with exogenous counterparts is generally more feasible than attempting to reduce the levels of overexpressed miRNAs. It is also possible to design synthetic miRNAs that maximize complementarity to underexpressed human miRNAs while minimizing binding to overexpressed ones. Furthermore, some plant miRNAs identified here could be key candidates for replacing deficient human miRNAs, although their therapeutic potential requires experimental validation.
4. Discussion
The question arises as to why, despite using a universal approximator like a neural network, we are unable to reliably predict human miRNA expression based solely on its nucleotide sequence. More precisely, predictions can be made, but with an error margin large enough to cast doubt on their practical utility. This likely reflects the fact that miRNA expression depends not only on its sequence but also on a range of other factors—such as interacting molecules or context-specific mechanisms—that significantly influence its regulation. Consequently, the application of neural networks is limited by the heterogeneity of the training data: both the inputs (features) and outputs (expression profiles) vary across individual miRNAs and their specific regulatory contexts, making it difficult to capture universal patterns. Notably, similar levels of prediction error are observed when using purely statistical analyses of miRNA expression data. However, statistical approaches are often more effective at leveraging heterogeneous datasets to uncover robust parameter relationships with a sufficient degree of confidence.
5. Conclusions
The conducted analysis demonstrates that the use of exogenous miRNAs, particularly those derived from plants, represents a promising approach to compensate for deficiencies in human miRNA expression associated with cancer. Our findings lay the groundwork for the development of targeted microRNA panels designed for therapeutic and diagnostic applications across a broad spectrum of cancer types. These panels consist of carefully selected sets of plant miRNAs that can potentially be introduced into the body of animals or humans with cancer to restore the balance of miRNA expression.
The methodology for compiling these panels is based on identifying differences between critical and non-critical human miRNAs, considering all types of cancer. Critical miRNAs are defined as those whose expression deviates significantly from normal levels in the presence of cancer, reflecting their important regulatory roles. By targeting these critical miRNAs, the proposed panels aim to modulate gene expression more effectively, addressing the imbalance caused by underexpressed or overexpressed endogenous miRNAs.
Furthermore, our study emphasizes that restoring underexpressed miRNAs is a more feasible and promising therapeutic direction than attempting to suppress overexpressed miRNAs. The complementarity analysis between plant and human miRNAs supports the potential for plant miRNAs to serve as functional substitutes or modulators for human miRNAs with diminished expression in cancer.
Overall, this work provides a comprehensive statistical and bioinformatic foundation for advancing miRNA-based interventions and encourages further experimental validation to confirm the therapeutic efficacy of plant miRNA panels in cancer treatment.
Author Contributions
All the authors contributed to the manuscript. Methodology and validation, M.Z., V.C., P.K., M.M. and D.K.; formal analysis, V.C., M.M., R.B., F.M.Z., S.M. and D.K.; investigation, M.Z., V.C. and M.M.; data curation, M.Z., V.C., M.M., P.K. and D.K.; calculation, M.Z. P.K.; writing-original draft preparation, M.Z. and D.K.; writing-review and editing, M.Z. and D.K.; supervision, M.Z., V.C., M.M. and D.K. All authors have read and agreed to the published version of the manuscript.
Funding
This research received no external funding.
Data Availability Statement
Databases that were used in their original form are available at the links indicated in the work. Generated datasets used and analyzed during the current study are available from the corresponding author upon reasonable request.
Acknowledgments
The authors are grateful for the partial support in writing the chapter in the context of the KATY project of the Horizon 2020 research and innovation program of the European Union, under grant agreement No. 101017453.
Conflicts of Interest
The authors declare no conflicts of interest.
Abbreviations
| name | source | name | source | ||
| ahy | Arachis hypogaea | han | Helianthus annuus | ||
| ptc | Populus trichocarpa | mtr | Medicago truncatula | ||
| ppt | Physcomitrella patens | zma | Zea mays | ||
| vvi | Vitis vinifera | lja | Lotus japonicus | ||
| vun | Vigna unguiculata | smo | Selaginella moellendorffii | ||
| tcc | Theobroma cacao | pta | Pinus taeda | ||
| stu | Solanum tuberosum | sof | Saccharum officinarum | ||
| sly | Solanum lycopersicum | tae | Triticum aestivum | ||
| sbi | Sorghum bicolor | ctr | Citrus trifoliata | ||
| rco | Ricinus communis | aqc | Aquilegia caerulea | ||
| osa | Oryza sativa | pvu | Phaseolus vulgaris | ||
| gra | Gossypium raimondii | csi | Citrus sinensis | ||
| gma | Glycine max | cre | Chlamydomonas reinhardtii | ||
| ghr | Gossypium hirsutum | pab | Picea abies | ||
| far | Festuca arundinacea | hvu | Hordeum vulgare | ||
| bra | Brassica rapa | ssp | Saccharum sp. | ||
| bol | Brassica oleracea | rgl | Rehmannia glutinosa | ||
| bna | Brassica napus | peu | Populus euphratica | ||
| bdi | Brachypodium distachyon | ama | Avicennia marina | ||
| ath | Arabidopsis thaliana | gar | Gossypium arboreum | ||
| aly | Arabidopsis lyrata | mdo | Monodelphis domestica | ||
| cpa | Carica papaya | ||||
References
- Kaikkonen, M.U.; Lam, M.T.; Glass, C.K. Non-coding RNAs as regulators of gene expression and epigenetics. Cardiovasc Res. 2011, 90, 430–440. [Google Scholar] [CrossRef] [PubMed] [PubMed Central]
- Kilikevicius, A.; Meister, G.; Corey, D.R. Reexamining assumptions about miRNA-guided gene silencing. Nucleic Acids Research 2022, 50, 617–634. [Google Scholar] [CrossRef]
- Lou, S.; Sun, T.; Li, H.; et al. Mechanisms of microRNA-mediated gene regulation in unicellular model alga Chlamydomonas reinhardtii. Biotechnol Biofuels 2018, 11, 244. [Google Scholar] [CrossRef] [PubMed]
- Axtell, M.J.; Westholm, J.O.; Lai, E.C. Vive la différence: biogenesis and evolution of microRNAs in plants and animals. Genome Biol 2011, 12, 221. [Google Scholar] [CrossRef] [PubMed]
- Narjala, A.; Nair, A.; Tirumalai, V.; Sundar, G.V.H.; Shivaprasad, P.V. A conserved sequence signature is essential for robust plant miRNA biogenesis. Nucleic Acids Research 2020, 48, 3103–3118. [Google Scholar] [CrossRef]
- Pang, L.Y.; Gatenby, E.L.; Kamida, A.; Whitelaw, B.A.; Hupp, T.R.; Argyle, D.J. Global gene expression analysis of canine osteosarcoma stem cells reveals a novel role for COX-2 in tumour initiation. PLoS One 2014, 9, e83144. [Google Scholar] [CrossRef] [PubMed] [PubMed Central]
- Zheng, Y.; Liu, L.; Shukla, G.C. A comprehensive review of web-based non-coding RNA resources for cancer research. Cancer Lett. 2017, 407, 1–8. [Google Scholar] [CrossRef] [PubMed]
- O'Neill, J.R.; Yébenes Mayordomo, M.; Mitulović, G.; Al Shboul, S.; Bedran, G.; Faktor, J.; Hernychova, L.; Uhrik, L.; Gomez-Herranz, M.; Kocikowski, M.; Save, V.; Vojtěšek, B.; Arends, M.; Hupp, T.; Alfaro, J.; OCCAMS consortium. Multi-omic analysis of Esophageal Adenocarcinoma uncovers candidate therapeutic targets and cancer-selective post-transcriptional regulation. Mol Cell Proteomics. 2024, 9, 100764. [Google Scholar] [CrossRef] [PubMed]
- Ali Syeda, Z.; Langden, S.S.S.; Munkhzul, C.; Lee, M.; Song, S.J. Regulatory Mechanism of MicroRNA Expression in Cancer. Int. J. Mol. Sci. 2020, 21, 1723. [Google Scholar] [CrossRef]
- Otmani, K.; Lewalle, P. Tumor Suppressor miRNA in Cancer Cells and the Tumor Microenvironment: Mechanism of Deregulation and Clinical Implications. Front. Oncol. 2021, 11, 708765. [Google Scholar] [CrossRef]
- Zheng, Y.; Zhu, Z. Editorial: Retrieving meaningful patterns from big biomedical data with machine learning approaches. Front Genet. 2023, 14, 1177996. [Google Scholar] [CrossRef] [PubMed] [PubMed Central]
- Xu, F.; Wang, Y.; Ling, Y.; Zhou, C.; Wang, H.; Teschendorff, A.E.; Zhao, Y.; Zhao, H.; He, Y.; Zhang, G.; Yang, Z. dbDEMC 3.0: Functional exploration of differentially expressed miRNAs in cancers of human and model organisms. Genomics, Proteomics & Bioinformatics 2022, 20, 446–454. [Google Scholar] [CrossRef]
- Przybyszewski, J.; Malawski, M.; Lichołai, S. GraphTar: applying word2vec and graph neural networks to miRNA target prediction. BMC Bioinformatics 2023, 24, 436. [Google Scholar] [CrossRef]
- Hu, H.; Zhao, H.; Zhong, T.; Dong, X.; Wang, L.; Han, P.; Li, Z. Adaptive deep propagation graph neural network for predicting miRNA–disease associations. Briefings in Functional Genomics 2023, 22, 453–462. [Google Scholar] [CrossRef]
- Min, S.; Lee, B.; Yoon, S. TargetNet: functional microRNA target prediction with deep neural networks. Bioinformatics 2022, 38, 671–677. [Google Scholar] [CrossRef] [PubMed]
- Koroliouk, D.; Mattei, M.; Zoziuk, M.; Montesano, C.; Bernardini, R.; Potestà, M.; Wondeu, L.D.; Pirrò, S.; Galgani, A.; Colizzi, V. Artificial Intelligence and MicroRNA: Role in Cancer Evolution, Ch.11 in Collective Monograph "Applied AI: Machine Learning, Neural Networks, and Deep Learning. Applications and potentials", Ser.LNEE, Springer. https://link.springer.com/book/9783031612206 (to appear in September 2024).
- Tang, G.; Cho, M.; Wang, X. OncoDB: an interactive online database for analysis of gene expression and viral infection in cancer. Nucleic Acids Research 2022, 50, D1334–D1339. [Google Scholar] [CrossRef]
- Cadieux, Z.; Lewis, H.; Esquela-Kerscher, A. Role of Nutrition, the Epigenome, and microRNAs in Cancer Pathogenesis; The Royal Society of Chemistry: London, UK, 2019; Volume 1, pp. 1–35. [Google Scholar]
- Dhar, S.; Hicks, C.; Levenson, A.S. Resveratrol and prostate cancer: Promising role for microRNAs. Mol. Nutr. Food Res. 2011, 55, 1219–1229. [Google Scholar] [CrossRef] [PubMed]
- Maleki Dana, P.; Sadoughi, F.; Asemi, Z.; Yousefi, B. The role of polyphenols in overcoming cancer drug resistance: A comprehensive review. Cell Mol. Biol. Lett. 2022, 27, 1. [Google Scholar] [CrossRef]
- Dhawan, A.; Scott, J.G.; Harris, A.L.; Buffa, F.M. Pan-cancer characterisation of microRNA across cancer hallmarks reveals microRNA-mediated downregulation of tumour suppressors. Nat Commun 2018, 9, 1–13. [Google Scholar] [CrossRef]
- Melnik, B.C. Synergistic Effects of Milk-Derived Exosomes and Galactose on α-Synuclein Pathology in Parkinson’s Disease and Type 2 Diabetes Mellitus. Int. J. Mol. Sci. 2021, 22, 1059. [Google Scholar] [CrossRef]
- Melnik, B.C. Lifetime Impact of Cow’s Milk on Overactivation of mTORC1: From Fetal to Childhood Overgrowth, Acne, Diabetes, Cancers, and Neurodegeneration. Biomolecules 2021, 11, 404. [Google Scholar] [CrossRef]
- Melnik, B.C.; Schmitz, G. Exosomes of pasteurized milk: Potential pathogens of Western diseases. J. Transl. Med. 2019, 17, 3. [Google Scholar] [CrossRef]
- Roessler, C.; Kuhlmann, K.; Hellwing, C.; Leimert, A.; Schumann, J. Impact of Polyunsaturated Fatty Acids on miRNA Profiles of Monocytes/Macrophages and Endothelial Cells-A Pilot Study. Int. J. Mol. Sci. 2017, 18, 284. [Google Scholar] [CrossRef]
- Cannataro, R.; Carbone, L.; Petro, J.L.; Cione, E.; Vargas, S.; Angulo, H.; Forero, D.A.; Odriozola-Martнnez, A.; Kreider, R.B.; Bonilla, D.A. Sarcopenia: Etiology, Nutritional Approaches, and miRNAs. Int. J. Mol. Sci. 2021, 22, 9724. [Google Scholar] [CrossRef] [PubMed]
- El-Sayed, N.S.; Elatrebi, S.; Said, R.; Ibrahim, H.F.; Omar, E.M. Potential mechanisms underlying the association between type II diabetes mellitus and cognitive dysfunction in rats: A link between miRNA-21 and Resveratrol’s neuroprotective action. Metab. Brain Dis. 2022, 37, 2375–2388. [Google Scholar] [CrossRef] [PubMed]
- Wang, X.; Hang, Y.; Liu, J.; Hou, Y.; Wang, N.; Wang, M. Anticancer effect of curcumin inhibits cell growth through miR-21/PTEN/Akt pathway in breast cancer cell. Oncol. Lett. 2017, 13, 4825–4831. [Google Scholar] [CrossRef]
- Li, H.; Jia, Z.; Li, A.; Jenkins, G.; Yang, X.; Hu, J.; Guo, W. Resveratrol repressed viability of U251 cells by miR-21 inhibiting of NF-κB pathway. Mol. Cell Biochem. 2013, 382, 137–143. [Google Scholar] [CrossRef] [PubMed]
- Rendina, D.; D Elia, L.; Abate, V.; Rebellato, A.; Buondonno, I.; Succoio, M.; Martinelli, F.; Muscariello, R.; De Filippo, G.; D Amelio, P.; et al. Vitamin D Status, Cardiovascular Risk Profile, and miRNA-21 Levels in Hypertensive Patients: Results of the HYPODD Study. Nutrients 2022, 14, 2683. [Google Scholar] [CrossRef]
- Melnik, B.C.; John, S.M.; Carrera-Bastos, P.; Cordain, L.; Leitzmann, C.; Weiskirchen, R.; Schmitz, G. The Role of Cow’s Milk Consumption in Breast Cancer Initiation and Progression. Curr. Nutr. Rep. 2023, 12, 122–140. [Google Scholar] [CrossRef]
- Baier, S.R.; Nguyen, C.; Xie, F.; Wood, J.R.; Zempleni, J. MicroRNAs are absorbed in biologically meaningful amounts from nutritionally relevant doses of cow milk and affect gene expression in peripheral blood mononuclear cells, HEK-293 kidney cell cultures, and mouse livers. J. Nutr. 2014, 144, 1495–1500. [Google Scholar] [CrossRef]
- Wang, L.; Sadri, M.; Giraud, D.; Zempleni, J. RNase H2-Dependent Polymerase Chain Reaction and Elimination of Confounders in Sample Collection, Storage, and Analysis Strengthen Evidence That microRNAs in Bovine Milk Are Bioavailable in Humans. J. Nutr. 2018, 148, 153–159. [Google Scholar] [CrossRef] [PubMed]
- Zan, L.; Chen, Q.; Zhang, L.; Li, X. Epigallocatechin gallate (EGCG) suppresses growth and tumorigenicity in breast cancer cells by downregulation of miR-25. Bioengineered 2019, 10, 374–382. [Google Scholar] [CrossRef]
- Wang, Y.; Chen, X.; Li, J.; Xia, C. Quercetin Antagonizes Esophagus Cancer by Modulating miR-1-3p/TAGLN2 Pathway-Dependent Growth and Metastasis. Nutr. Cancer 2022, 74, 1872–1881. [Google Scholar] [CrossRef] [PubMed]
- Farooqi, A.A.; Khalid, S.; Ahmad, A. Regulation of Cell Signaling Pathways and miRNAs by Resveratrol in Different Cancers. Int. J. Mol. Sci. 2018, 19, 652. [Google Scholar] [CrossRef] [PubMed]
- Kronski, E.; Fiori, M.E.; Barbieri, O.; Astigiano, S.; Mirisola, V.; Killian, P.H.; Bruno, A.; Pagani, A.; Rovera, F.; Pfeffer, U.; et al. miR181b is induced by the chemopreventive polyphenol curcumin and inhibits breast cancer metastasis via down-regulation of the inflammatory cytokines CXCL1 and -2. Mol. Oncol. 2014, 8, 581–595. [Google Scholar] [CrossRef]
- Norouzi, S.; Majeed, M.; Pirro, M.; Generali, D.; Sahebkar, A. Curcumin as an Adjunct Therapy and microRNA Modulator in Breast Cancer. Curr. Pharm. Des. 2018, 24, 171–177. [Google Scholar] [CrossRef]
- Al-Ansari, M.M.; Aboussekhra, A. miR-146b-5p mediates p16-dependent repression of IL-6 and suppresses paracrine procarcinogenic effects of breast stromal fibroblasts. Oncotarget 2015, 6, 30006–30016. [Google Scholar] [CrossRef]
- Javaid, A.; Zahra, D.; Rashid, F.; Mashraqi, M.; Alzamami, A.; Khurshid, M.; Ali Ashfaq, U. Regulation of micro-RNA, epigenetic factor by natural products for the treatment of cancers: Mechanistic insight and translational association. Saudi J. Biol. Sci. 2022, 29, 103255. [Google Scholar] [CrossRef]
- Song, J.; Jun, M.; Ahn, M.R.; Kim, O.Y. Involvement of miR-Let7A in inflammatory response and cell survival/apoptosis regulated by resveratrol in THP-1 macrophage. Nutr. Res. Pract. 2016, 10, 377–384. [Google Scholar] [CrossRef]
- Tili, E.; Michaille, J.J.; Adair, B.; Alder, H.; Limagne, E.; Taccioli, C.; Ferracin, M.; Delmas, D.; Latruffe, N.; Croce, C.M. Resveratrol decreases the levels of miR-155 by upregulating miR-663, a microRNA targeting JunB and JunD. Carcinogenesis 2010, 31, 1561–1566. [Google Scholar] [CrossRef]
- Ma, F.; Liu, F.; Ding, L.; You, M.; Yue, H.; Zhou, Y.; Hou, Y. Anti-in㎸ammatory effects of curcumin are associated with down regulating microRNA-155 in LPS-treated macrophages and mice. Pharm. Biol. 2017, 55, 1263–1273. [Google Scholar] [CrossRef]
- Su, N.; Li, L.; Zhou, E.; Li, H.; Wu, S.; Cao, Z. Resveratrol Downregulates miR-155-5p to Block the Malignant Behavior of Gastric Cancer Cells. BioMed Res. Int. 2022, 2022, 6968641. [Google Scholar] [CrossRef] [PubMed]
- de la Parra, C.; Castillo-Pichardo, L.; Cruz-Collazo, A.; Cubano, L.; Redis, R.; Calin, G.A.; Dharmawardhane, S. Soy Isoflavone Genistein-Mediated Downregulation of miR-155 Contributes to the Anticancer Effects of Genistein. Nutr. Cancer 2016, 68, 154–164. [Google Scholar] [CrossRef] [PubMed]
- Javed, Z.; Khan, K.; Herrera-Bravo, J.; Naeem, S.; Iqbal, M.J.; Sadia, H.; Qadri, Q.R.; Raza, S.; Irshad, A.; Akbar, A.; et al. Genistein as a regulator of signaling pathways and microRNAs in different types of cancers. Cancer Cell Int. 2021, 21, 388. [Google Scholar] [CrossRef]
- Marques-Rocha, J.L.; Milagro, F.I.; Mansego, M.L.; Zulet, M.A.; Bressan, J.; Martнnez, J.A. Expression of inflammation-related miRNAs in white blood cells from subjects with metabolic syndrome after 8 wk of following a Mediterranean diet-based weight loss program. Nutrition 2016, 32, 48–55. [Google Scholar] [CrossRef]
- Gulei, D.; Raduly, L.; Broseghini, E.; Ferracin, M.; Berindan-Neagoe, I. The extensive role of miR-155 in malignant and non-malignant diseases. Mol Aspects Med 2019, 70, 33–56. [Google Scholar] [CrossRef]
- Lei, Q.Q.; Huang, Y.; Li, B.; Han, L.; Lv, C. MiR-155-5p promotes metastasis and epithelial-mesenchymal transition of renal cell carcinoma by targeting apoptosis-inducing factor. Int J Biol Markers 2020, 36, 20–27. [Google Scholar] [CrossRef] [PubMed]
- Polytarchou, C.; Iliopoulos, D.; Hatziapostolou, M.; Kottakis, F.; Maroulakou, I.; Struhl, K.; et al. Akt2 regulates all akt isoforms and promotes resistance to hypoxia through induction of miR-21 upon oxygen deprivation. Cancer Res 2011, 7113, 4720–4731. [Google Scholar] [CrossRef]
- Jafarifar, F.; Yao, P.; Eswarappa, S.M.; Fox, P.L. Repression of VEGFA by CA-rich element-binding microRNAs is modulated by hnRNP l. EMBO J 2011, 307, 1324–1334. EMBO J 2011, 307, 1324–1334. [Google Scholar] [CrossRef]
- Wang, M.; Liu, K.; Bu, H.; Cong, H.; Dong, G.; Xu, N.; Li, C.; Zhao, Y.; Jiang, F.; Zhang, Y.; et al. Purple sweet potato delphinidin-3-rutin represses glioma proliferation by inducing miR-20b-5p/Atg7-dependent cytostatic autophagy. Mol. Ther. Oncolytics 2022, 26, 314–329. [Google Scholar] [CrossRef]
- Nakano, T.; Chen, I.-H.; Wang, C.-C.; Chen, P.-J.; Tseng, H.-P.; Huang, K.-T.; et al. Circulating exosomal miR-92b: Its role for cancer immunoediting and clinical value for prediction of posttransplant hepatocellular carcinoma recurrence. Am J Transplant. 2019, 19, 3250–3262. [Google Scholar] [CrossRef]
- Chiyomaru, T.; Yamamura, S.; Fukuhara, S.; Hidaka, H.; Majid, S.; Saini, S.; Arora, S.; Deng, G.; Shahryari, V.; Chang, I.; et al. Genistein up-regulates tumor suppressor microRNA-574-3p in prostate cancer. PLoS ONE 2013, 8, e58929. [Google Scholar] [CrossRef]
- Ji, X.; Liu, K.; Li, Q.; Shen, Q.; Han, F.; Ye, Q.; Zheng, C. A Mini-Review of Flavone Isomers Apigenin and Genistein in Prostate Cancer Treatment. Front. Pharmacol. 2022, 13, 851589. [Google Scholar] [CrossRef]
- Giangreco, A.A.; Vaishnav, A.; Wagner, D.; Finelli, A.; Fleshner, N.; Van der Kwast, T.; Vieth, R.; Nonn, L. Tumor suppressor microRNAs, miR-100 and -125b, are regulated by 1,25-dihydroxyvitamin D in primary prostate cells and in patient tissue. Cancer Prev. Res. 2013, 6, 483–494. [Google Scholar] [CrossRef]
- Stephan, C.; Ralla, B.; Bonn, F.; Diesner, M.; Lein, M.; Jung, K. Vitamin D Metabolites in Nonmetastatic High-Risk Prostate Cancer Patients with and without Zoledronic Acid Treatment after Prostatectomy. Cancers 2022, 14, 1560. [Google Scholar] [CrossRef]
- Margolis, L.M.; Carrigan, C.T.; Murphy, N.E.; DiBella, M.N.; Wilson, M.A.; Whitney, C.C.; Howard, E.E.; Pasiakos, S.M.; Rivas, D.A. Carbohydrate intake in recovery from aerobic exercise differentiates skeletal muscle microRNA expression. Am. J. Physiol Endocrinol. Metab. 2022, 323, E435–E447. [Google Scholar] [CrossRef]
- Benameur, T.; Soleti, R.; Porro, C. The Potential Neuroprotective Role of Free and Encapsulated Quercetin Mediated by miRNA against Neurological Diseases. Nutrients 2021, 13, 1318. [Google Scholar] [CrossRef]
- Benameur, T.; Soleti, R.; Porro, C. The Potential Neuroprotective Role of Free and Encapsulated Quercetin Mediated by miRNA against Neurological Diseases. Nutrients 2021, 13, 1318. [Google Scholar] [CrossRef]
- Min, D.; Lv, X.B.; Wang, X.; Zhang, B.; Meng, W.; Yu, F.; Hu, H. Downregulation of miR-302c and miR-520c by 1,25(OH)2D3 treatment enhances the susceptibility of tumour cells to natural killer cell-mediated cytotoxicity. Br. J. Cancer 2013, 109, 723–730. [Google Scholar] [CrossRef]
- Muсoz, A.; Grant, W.B. Vitamin D and Cancer: An Historical Overview of the Epidemiology and Mechanisms. Nutrients 2022, 14, 1448. [Google Scholar] [CrossRef] [PubMed]
- Wan Mohd Tajuddin, W.N.B.; Lajis, N.H.; Abas, F.; Othman, I.; Naidu, R. Mechanistic Understanding of Curcumin’s Therapeutic Effects in Lung Cancer. Nutrients 2019, 11, 2989. [Google Scholar] [CrossRef]
- Wang, N.; Feng, T.; Liu, X.; Liu, Q. Curcumin inhibits migration and invasion of non-small cell lung cancer cells through up-regulation of miR-206 and suppression of PI3K/AKT/mTOR signaling pathway. Acta Pharm. 2020, 70, 399–409. [Google Scholar] [CrossRef]
- Pan, Y.; Sun, Y.; Liu, Z.; Zhang, C. miR-192-5p upregulation mediates the suppression of curcumin in human NSCLC cell proliferation, migration and invasion by targeting c-Myc and inactivating the Wnt/β-catenin signaling pathway. Mol. Med. Rep. 2020, 22, 1594–1604. [Google Scholar] [CrossRef]
- Monraz-Mendez, C.A.; Escutia-Gutierrez, R.; Rodriguez-Sanabria, J.S.; Galicia-Moreno, M.; Monroy-Ramнrez, H.C.; Sanchez-Orozco, L.; Garcia-Baсuelos, J.; De la Rosa-Bibiano, R.; Santos, A.; Armendariz-Borunda, J.; et al. Moringa oleifera Improves MAFLD by Inducing Epigenetic Modifications. Nutrients 2022, 14, 4225. [Google Scholar] [CrossRef]
- Chai, R.; Xu, C.; Lu, L.; Liu, X.; Ma, Z. Quercetin inhibits proliferation of and induces apoptosis in non-small-cell lung carcinoma via the lncRNA SNHG7/miR-34a-5p pathway. Immunopharmacol. Immunotoxicol. 2021, 43, 693–703. [Google Scholar] [CrossRef]
- Hsieh, P.L.; Liao, Y.W.; Hsieh, C.W.; Chen, P.N.; Yu, C.C. Soy Isoflavone Genistein Impedes Cancer Stemness and Mesenchymal Transition in Head and Neck Cancer through Activating miR-34a/RTCB Axis. Nutrients 2020, 12, 1924. [Google Scholar] [CrossRef]
- Cheng, L.; Xia, T.-S.; Shi, L.; Xu, L.; Chen, W.; Zhu, Y.; et al. D rhamnose β-hederin inhibits migration and invasion of human breast cancer cell line MDA-MB-231. Biochem Biophys Res Commun 2018, 495, 775–780. [Google Scholar] [CrossRef] [PubMed]
- Tang, Y.; Cao, Y. Curcumin Inhibits the Growth and Metastasis of Melanoma via miR-222-3p/SOX10/Notch Axis. Dis. Markers 2022, 2022, 3129781. [Google Scholar] [CrossRef]
- Yamada, S.; Tsukamoto, S.; Huang, Y.; Makio, A.; Kumazoe, M.; Yamashita, S.; Tachibana, H. Epigallocatechin-3-O-gallate up-regulates microRNA-let-7b expression by activating 67-kDa laminin receptor signaling in melanoma cells. Sci. Rep. 2016, 6, 19225. [Google Scholar] [CrossRef] [PubMed]
- Mlotshwa, S.; Pruss, G.J.; MacArthur, J.L.; Endres, M.W.; Davis, C.; Hofseth, L.J.; Peсa, M.M.; Vance, V. A novel chemopreventive strategy based on therapeutic microRNAs produced in plants. Cell Res. 2015, 25, 521–524. [Google Scholar] [CrossRef] [PubMed]
- Xu, J.; Tan, Y.L.; Liu, Q.Y.; Huang, Z.C.; Qiao, Z.H.; Li, T.; Hu, Z.Q.; Lei, L. Quercetin regulates fibrogenic responses of endometrial stromal cell by upregulating miR-145 and inhibiting the TGF-β1/Smad2/Smad3 pathway. Acta Histochem. 2020, 122, 151600. [Google Scholar] [CrossRef]
- Wei, D.; Yang, L.; Lv, B.; Chen, L. Genistein suppresses retinoblastoma cell viability and growth and induces apoptosis by upregulating miR-145 and inhibiting its target ABCE1. Mol. Vis. 2017, 23, 385–394. [Google Scholar] [PubMed]
- Liu, H.; Guan, H.; Tan, X.; Jiang, Y.; Li, F.; Sun-Waterhouse, D.; Li, D. Enhanced alleviation of insulin resistance via the IRS-1/Akt/FOXO1 pathway by combining quercetin and EGCG and involving miR-27a-3p and miR-96-5p. Free Radic. Biol. Med. 2022, 181, 105–117. [Google Scholar] [CrossRef]
- Regis, S.; Caliendo, F.; Dondero, A.; Casu, B.; Romano, F.; Loiacono, F.; et al. TGF-ß1 downregulates the expression of CX3CR1 by inducing miR-27a-5p in primary human NK cells. Front Immunol 2017, 8, 868. [Google Scholar] [CrossRef] [PubMed]
- Donatelli, S.S.; Zhou, J.-M.; Gilvary, D.L.; Eksioglu, E.A.; Chen, X.; Cress, W.D.; et al. TGF-β-inducible microRNA-183 silences tumor-associated natural killer cells. Proc. Natl. Acad Sci USA 2014, 111, 4203–4208. [Google Scholar] [CrossRef]
- Chen, W.T.; Yang, M.J.; Tsuei, Y.W.; Su, T.C.; Siao, A.C.; Kuo, Y.C.; Huang, L.R.; Chen, Y.; Chen, S.J.; Chen, P.C.; et al. Green Tea Epigallocatechin Gallate Inhibits Preadipocyte Growth via the microRNA-let-7a/HMGA2 Signaling Pathway. Mol. Nutr. Food Res. 2023, 67, e2200336. [Google Scholar] [CrossRef]
- Soheilifar, M.H.; Vaseghi, H.; Seif, F.; Ariana, M.; Ghorbanifar, S.; Habibi, N.; et al. Concomitant overexpression of mir-182-5p and mir-182-3p raises the possibility of IL-17–producing treg formation in breast cancer by targeting CD3d, ITK, FOXO1, and NFATs: A metaanalysis and experimental study. Cancer Sci 2021, 112, 589–603. [Google Scholar] [CrossRef]
- Kang, Q.; Tong, Y.; Gowd, V.; Wang, M.; Chen, F.; Cheng, K.W. Oral administration of EGCG solution equivalent to daily achievable dosages of regular tea drinkers effectively suppresses miR483-3p induced metastasis of hepatocellular carcinoma cells in mice. Food Funct. 2021, 12, 3381–3392. [Google Scholar] [CrossRef]
- Tang, Y.; Yang, J.; Wang, Y.; Tang, Z.; Liu, S.; Tang, Y. MiR-19b-3p facilitates the proliferation and epithelial-mesenchymal transition, and inhibits the apoptosis of intrahepatic cholangiocarcinoma by suppressing coiled-coil domain containing 6. Arch Biochem Biophys 2020, 6866, 108367. [Google Scholar] [CrossRef]
- Duchnik, E.; Kruk, J.; Tuchowska, A.; Marchlewicz, M. The Impact of Diet and Physical Activity on Psoriasis: A Narrative Review of the Current Evidence. Nutrients 2023, 15, 840. [Google Scholar] [CrossRef]
- Saini, S.K.; Singh, A.; Saini, M.; Gonzalez-Freire, M.; Leeuwenburgh, C.; Anton, S.D. Time-Restricted Eating Regimen Differentially Affects Circulatory miRNA Expression in Older Overweight Adults. Nutrients 2022, 14, 1843. [Google Scholar] [CrossRef] [PubMed]
- Melnik, B.C. Lifetime Impact of Cow’s Milk on Overactivation of mTORC1: From Fetal to Childhood Overgrowth, Acne, Diabetes, Cancers, and Neurodegeneration. Biomolecules 2021, 11, 404. [Google Scholar] [CrossRef]
- Ghosh, S.; Bhowmik, S.; Majumdar, S.; Goswami, A.; Chakraborty, J.; Gupta, S.; et al. The exosome encapsulated microRNAs as circulating diagnostic marker for hepatocellular carcinoma with low alpha-fetoprotein. Int J Cancer 2020, 147, 2934–2947. [Google Scholar] [CrossRef]
- Luan, G.; Wang, M.; Yuan, J.; Bu, X.; Song, J.; Wang, C.; et al. Regulatory network identified by pulmonary transcriptome and proteome profiling reveals extensive change of tumor − related genes in microRNA − 21 knockout mice. J Cancer Res Clin Oncol 2022, 148, 1919–1929. [Google Scholar] [CrossRef]
- Hu, Y.; Wang, C.; Li, Y.; Zhao, J.; Chen, C.; Zhou, Y.; et al. MiR-21 controls in situ expansion of CCR6 + regulatory T cells through PTEN/AKT pathway in breast cancer. Immunol Cell Biol 2015, 93, 753–764. [Google Scholar] [CrossRef] [PubMed]
- Levens, D. Disentangling the MYC web. Proc Natl Acad Sci USA 2002, 999, 5757–5759. [Google Scholar] [CrossRef]
- Liang, Y.K.; Lin, H.-Y.; Dou, X.-W.; Chen, M.; Wei, X.-L.; Zhang, Y.-Q.; et al. MiR-221/222 promote epithelial-mesenchymal transition by targeting Notch3 in breast cancer cell lines. NPJ Breast Cancer 2018, 4, 20. [Google Scholar] [CrossRef] [PubMed]
- Zhang, Y.; Zhang, D.; Lv, J.; Wang, S.; Zhang, Q. miR-410–3p promotes prostate cancer progression via regulating PTEN/AKT/mTOR signaling pathway. Biochem Biophys Res Commun 2018, 503, 2459–2465. [Google Scholar] [CrossRef]
- Souza, M.F.; Cólus, I.M.S.; Fonseca, A.S.; Antunes, V.C.; Kumar, D.; Cavalli, L.R. MiR-182-5p modulates prostate cancer aggressive phenotypes by targeting EMT associated pathways. Biomolecules 2022, 12, 187. [Google Scholar] [CrossRef]
- Ma, Z.H.; Shi, P.D.; Wan, B.S. MiR-410-3p activates the NF-κB pathway by targeting ZCCHC10 to promote migration, invasion and EMT of colorectal cancer. Cytokine 2021, 1401, 155433. [Google Scholar] [CrossRef]
- Gao, F.; Zhao, Z.-L.; Zhao, W.-T.; Fan, Q.-R.; Wang, S.-C.; Li, J.; et al. MiR-9 modulates the expression of interferon-regulated genes and MHC class I molecules in human nasopharyngeal carcinoma cells. Biochem Biophys Res Commun 2013, 431, 610–616. [Google Scholar] [CrossRef] [PubMed]
- Cheng, W.C.; Liao, T.-T.; Lin, C.-C.; Yuan, L.-T.E.; Lan, H.-Y.; Lin, H.-H.; et al. RAB27B-activated secretion of stem-like tumor exosomes delivers the biomarker microRNA-146a-5p, which promotes tumorigenesis and associates with an immunosuppressive tumor microenvironment in colorectal cancer. Int J Cancer 2019, 145, 2209–2224. [Google Scholar] [CrossRef]
- Xu, D.; Han, Q.; Hou, Z.; Zhang, C.; Zhang, J. MIR-146a negatively regulates NK cell functions via STAT1 signaling. Cell Mol Immunol 2017, 14, 712–720. [Google Scholar] [CrossRef] [PubMed]
- Yang, W.; Yang, S.; Zhang, F.; Cheng, F.; Wang, X.; Rao, J. Influence of the hippo-YAP signaling pathway on tumor associated macrophages (TAMs) and its implications on cancer immunosuppressive microenvironment. Ann Transl Med 2020, 8, 399–9. [Google Scholar] [CrossRef]
- Liu, J.; Fan, L.; Yu, H.; Zhang, J.; He, Y.; Feng, D.; et al. Endoplasmic reticulum stress causes liver cancer cells to release exosomal miR-23a-3p and up-regulate programmed death ligand 1 expression in macrophages. Hepatology 2019, 70, 241–258. [Google Scholar] [CrossRef] [PubMed]
- Stern-Ginossar, N.; Gur, C.; Biton, M.; Horwitz, E.; Elboim, M.; Stanietsky, N.; et al. Human microRNAs regulate stress-induced immune responses mediated by the receptor NKG2D. Nat Immunol 2008, 9, 1065–1073. [Google Scholar] [CrossRef]
- Breunig, C.; Pahl, J.; Küblbeck, M.; Miller, M.; Antonelli, D.; Erdem, N.; et al. MicroRNA-519a-3p mediates apoptosis resistance in breast cancer cells and their escape from recognition by natural killer cells. Cell Death Dis 2017, 8, e2973. [Google Scholar] [CrossRef]
- Chen, W.X.; Cheng, L.; Pan, M.; Qian, Q.; Zhu, Y.-L.; Xu, L.-Y.; et al. D rhamnose β-hederin against human breast cancer by reducing tumor-derived exosomes. Oncol Lett 2018, 16, 5172–5178. [Google Scholar] [CrossRef]
- Ning, T.; Li, J.; He, Y.; Zhang, H.; Wang, X.; Deng, T.; et al. Exosomal miR-208b related with oxaliplatin resistance promotes treg expansion in colorectal cancer. Mol Ther 2021, 29, 2723–2736. [Google Scholar] [CrossRef]
- Kahroba, H.; Samadi, N.; Mostafazadeh, M.; Hejazi, M.S.; Sadeghi, M.R.; Hashemzadeh, S.; et al. Evaluating the presence of deregulated tumoral onco-microRNAs in serum-derived exosomes of gastric cancer patients as noninvasive diagnostic biomarkers. BioImpacts 2021, 12, 127–38. [Google Scholar] [CrossRef]
- Chen, Y.; Wang, X. miRDB: an online database for prediction of functional microRNA targets. Nucleic Acids Research 2020, 48, D127–D131. [Google Scholar] [CrossRef] [PubMed]
- Huang, H.-Y.; Lin, Y.-C.-D.; Cui, S.; Huang, Y.; Tang, Y.; Xu, J.; Bao, J.; Li, Y.; Wen, J.; Zuo, H.; Wang, W.; Li, J.; Ni, J.; Ruan, Y.; Li, L.; Chen, Y.; Xie, Y.; Zhu, Z.; Cai, X.; Chen, X.; Yao, L.; Chen, Y.; Luo, Y.; LuXu, S.; Luo, M.; Chiu, C.-M.; Ma, K.; Zhu, L.; Cheng, G.-J.; Bai, C.; Chiang, Y.-C.; Wang, L.; Wei, F.; Lee, T.-Y.; Huang, H.-D. miRTarBase update 2022: an informative resource for experimentally validated miRNA–target interactions. Nucleic Acids Research 2022, 50, D222–D230. [Google Scholar] [CrossRef]
- Zhang, Z.; Yu, J.; Li, D.; Zhang, Z.; Liu, F.; Zhou, X.; Wang, T.; Ling, Y.; Su, Z. PMRD: plant microRNA database. Nucleic Acids Research 2010, 38, D806–D813. [Google Scholar] [CrossRef] [PubMed]
- Zoziuk, M.; Colizzi, V.; Krysenko, P.; Mattei, M.; Bernardini, R.; Zanzotto, F.M.; Marini, S.; Koroliouk, D. Plant miRNAs for Improved Gene Regulation in a Wide Range of Human Cancers. Curr. Issues Mol. Biol. 2025, 47, 42. [Google Scholar] [CrossRef] [PubMed]
Figure 1.
Distribution of individual miRNAs according to the number of experiments (X-axis) and membership ratio (“div”) (Y-axis). Data points representing miRNAs observed in five or fewer experiments are excluded, reducing the dataset from 3,171 to 2,607 miRNAs. The plot demonstrates that a substantial proportion of miRNAs listed in Table 2 exhibit a clear tendency toward either overexpression or underexpression. [106].
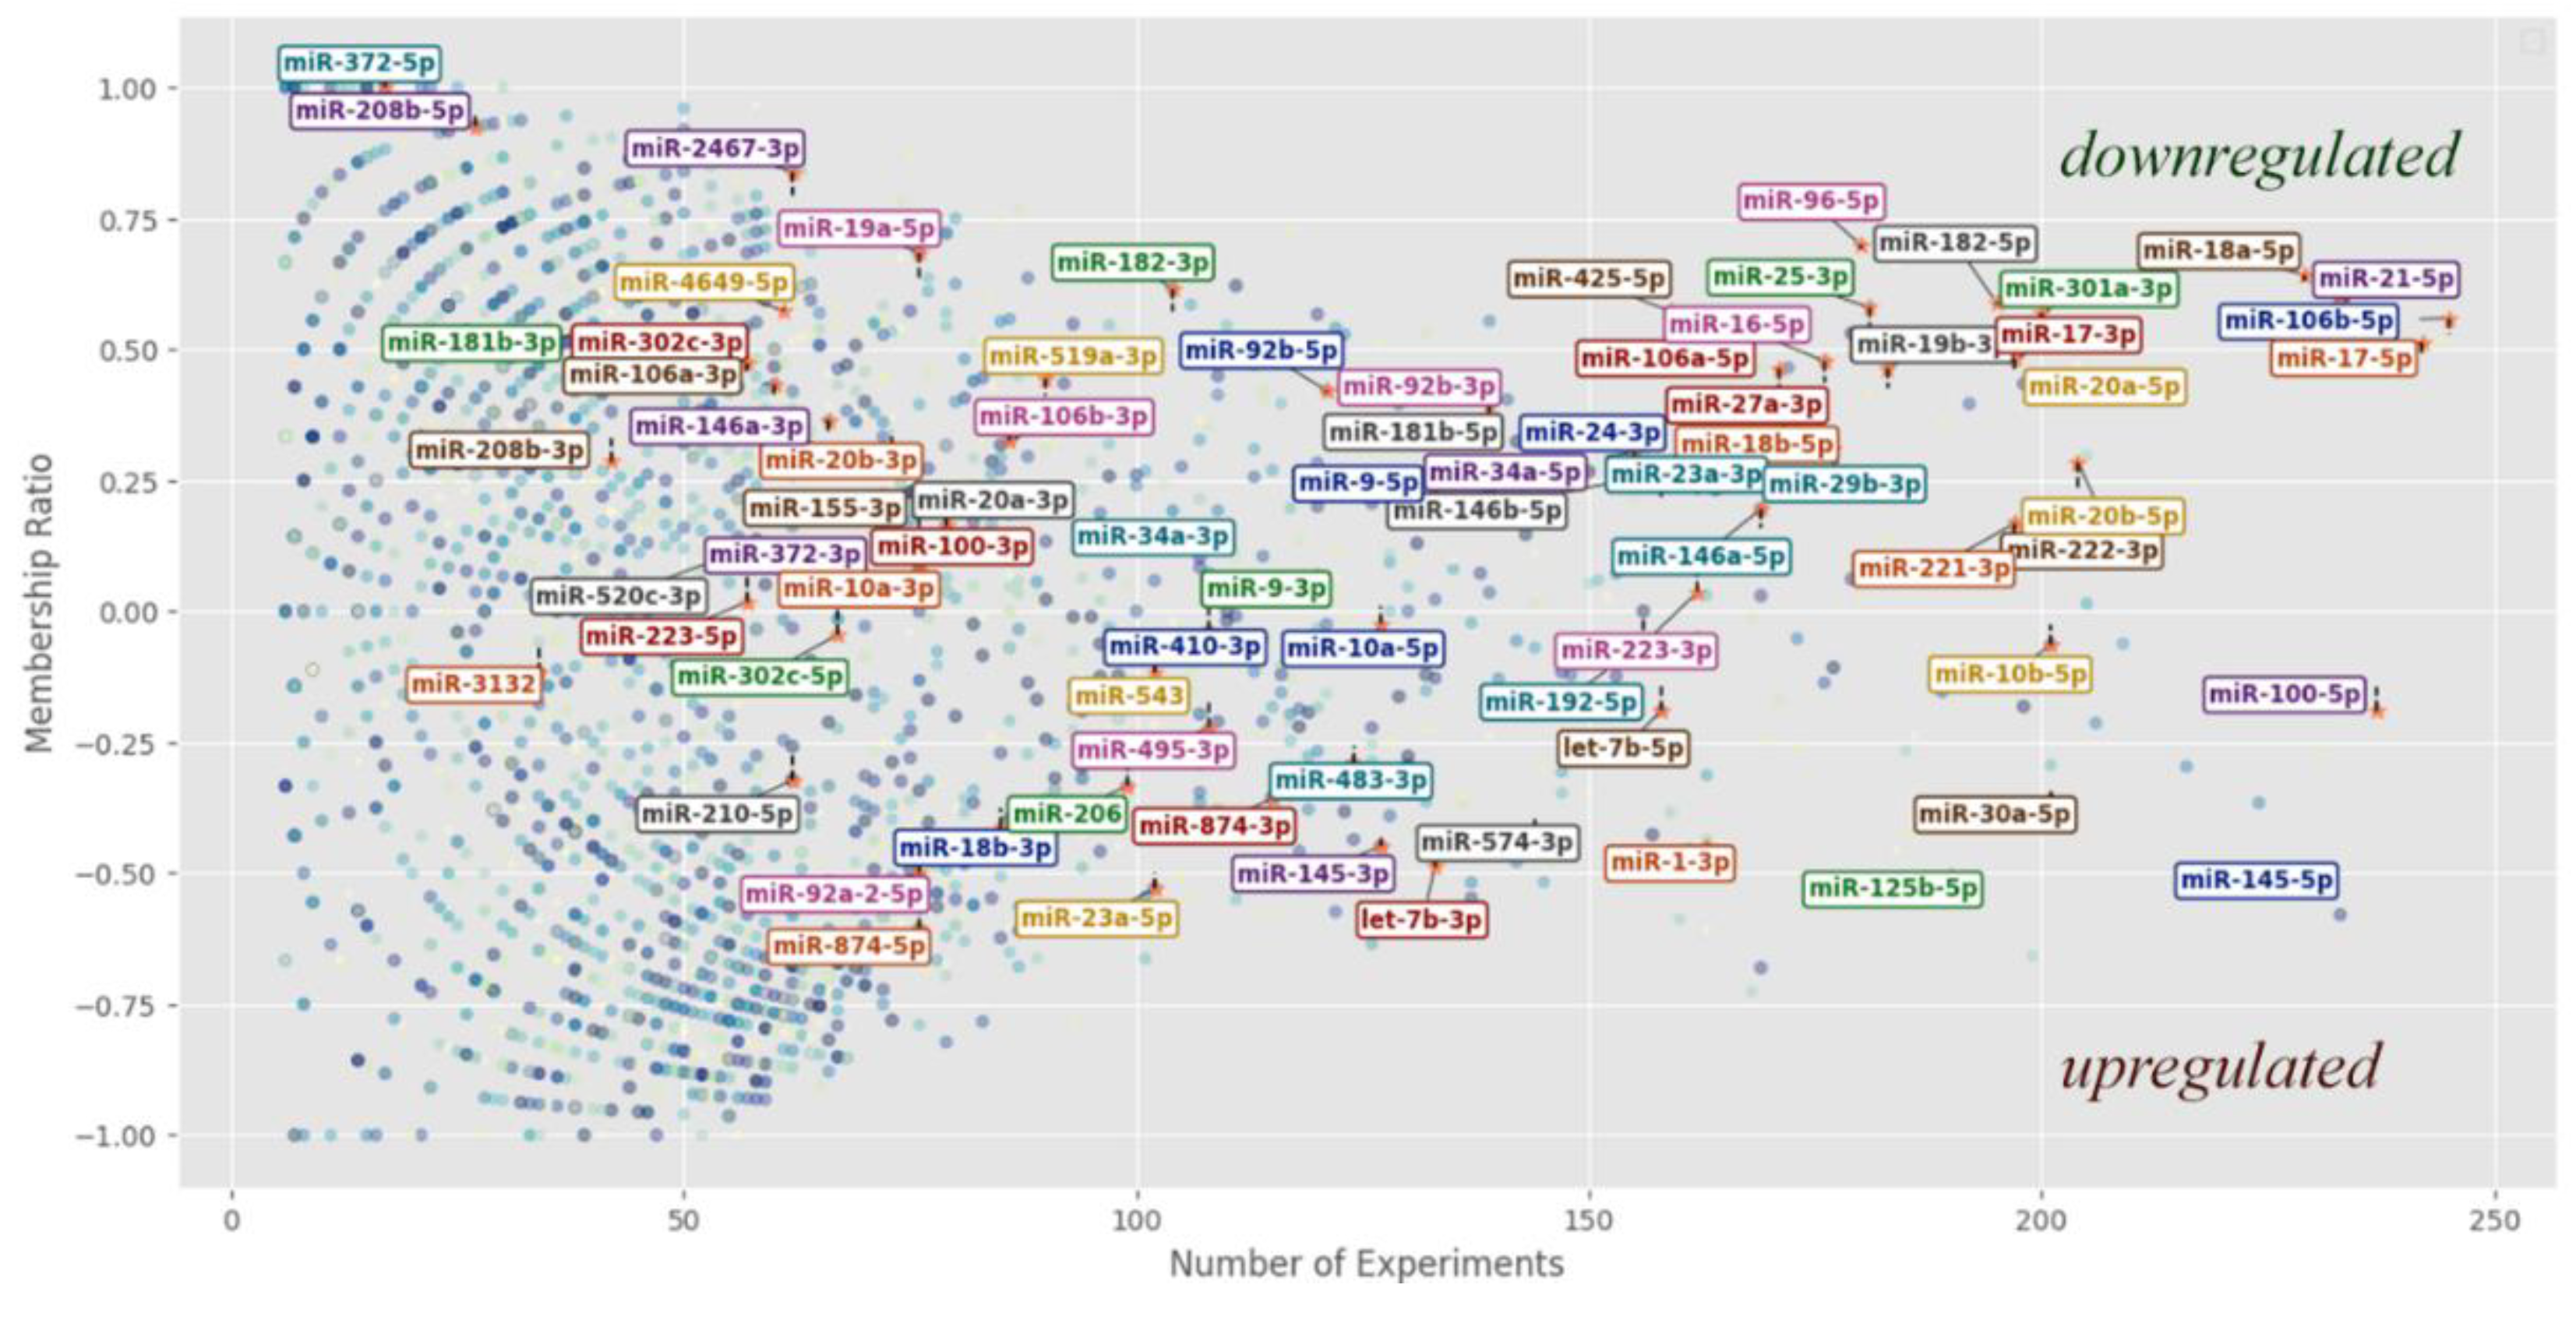
Figure 2.
Non-linear classification of critical miRNAs. (a) Distribution plot depicting three non-linear threshold curves alongside the concentration spectrum of individual miRNAs. (b) Distribution graph showing the upper threshold curve (I) together with miRNAs reported in the literature. All threshold lines were defined based on our analytical criteria. The primary threshold line (I) identifies critical miRNAs that are of particular interest for investigating their association with cancer presence.
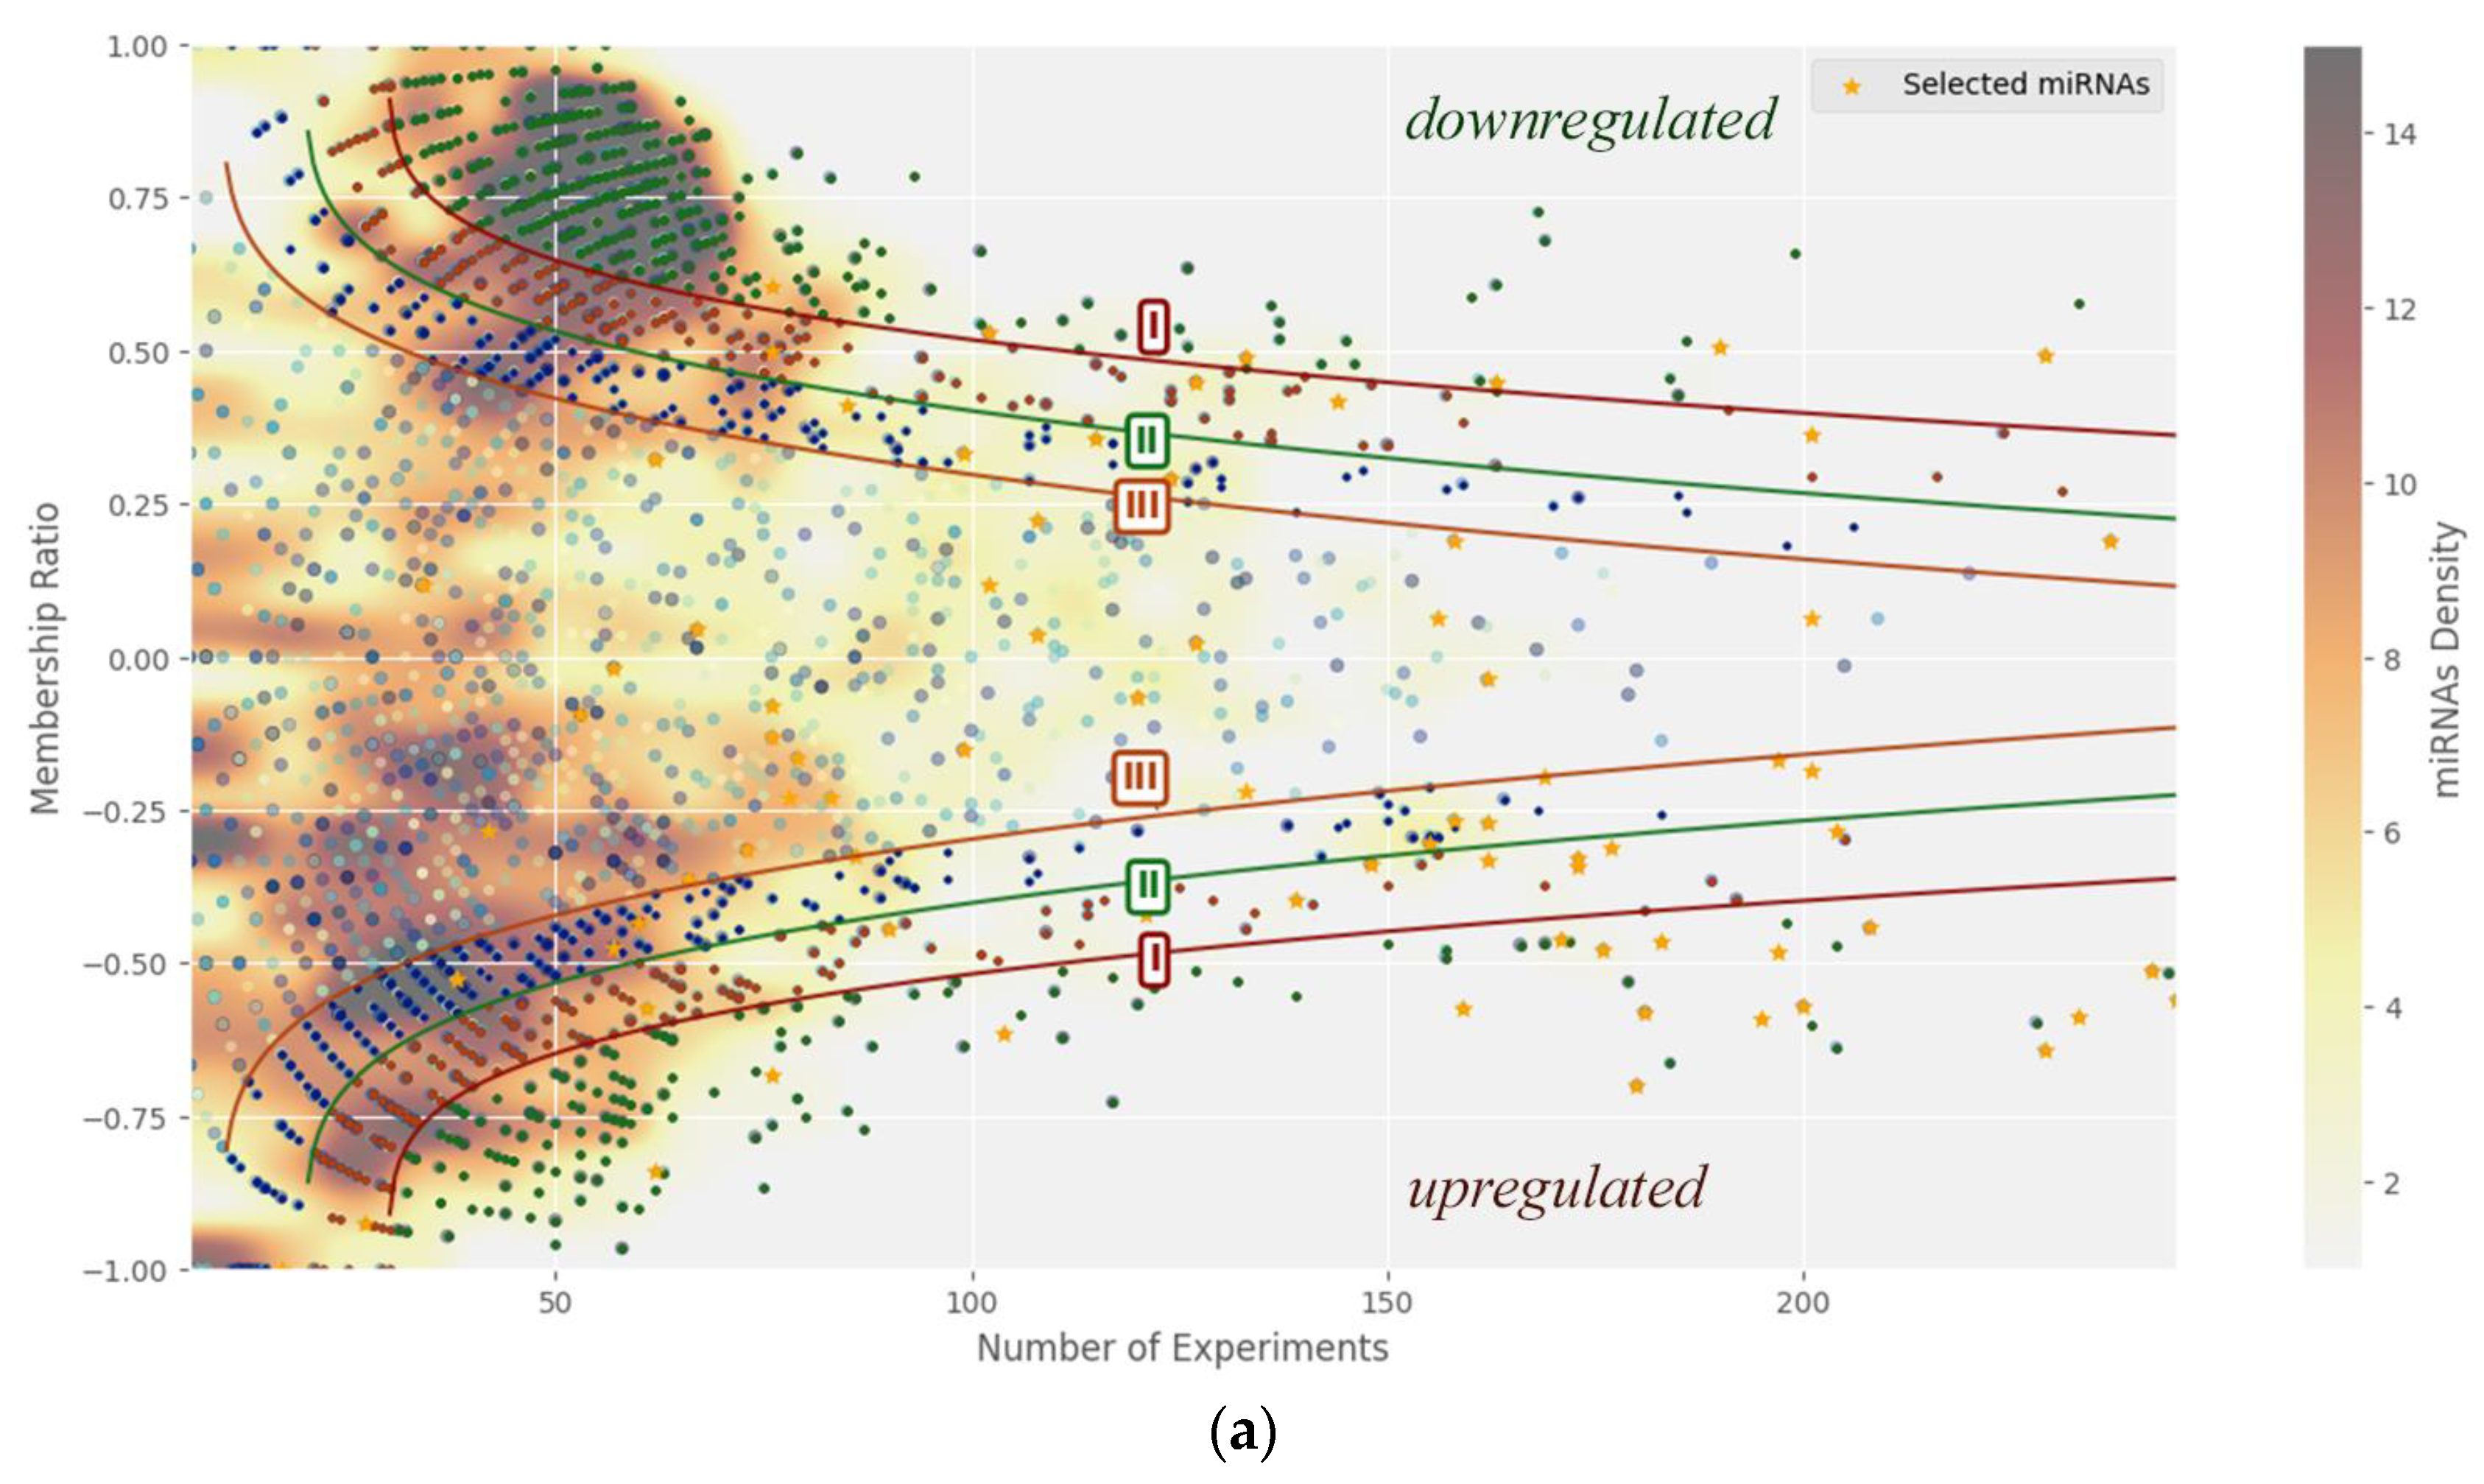
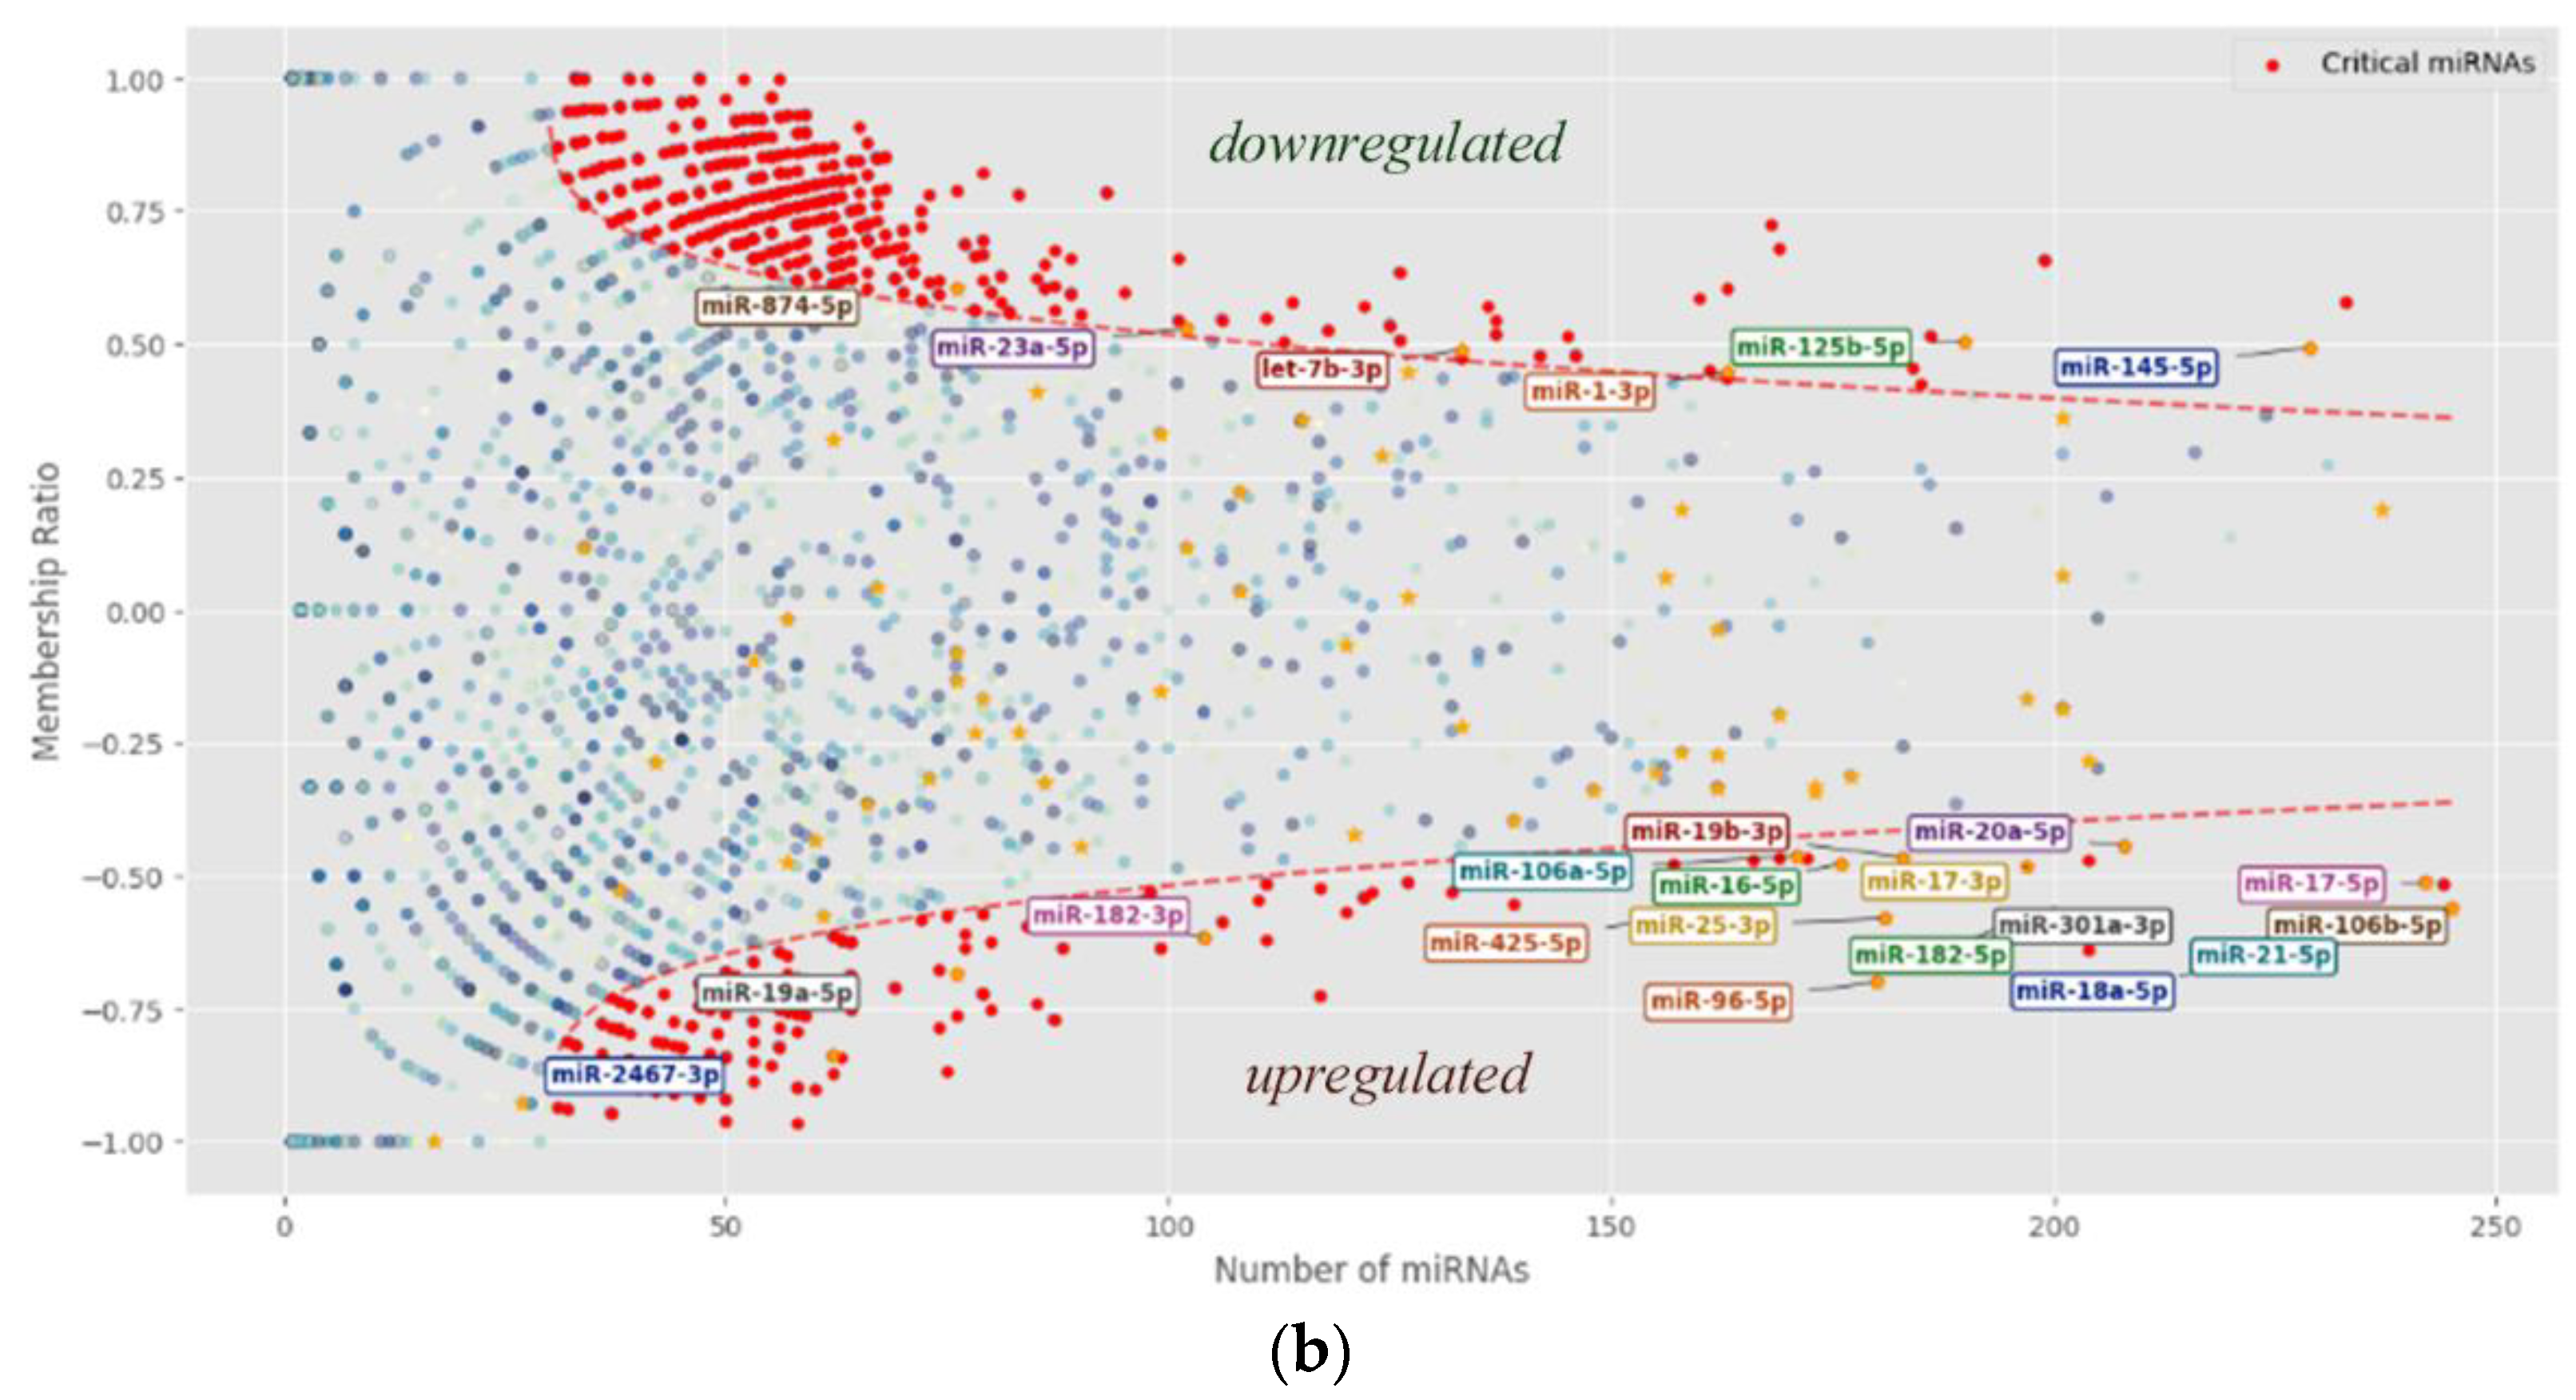
Figure 3.
Box plots representing the distribution of expression values for the 20 underexpressed (a) and 20 overexpressed (b) miRNAs with the highest number of experiments. This selection highlights the most relevant miRNAs exhibiting average expression values significantly greater or less than zero, demonstrating a pronounced tendency toward consistent dysregulation.
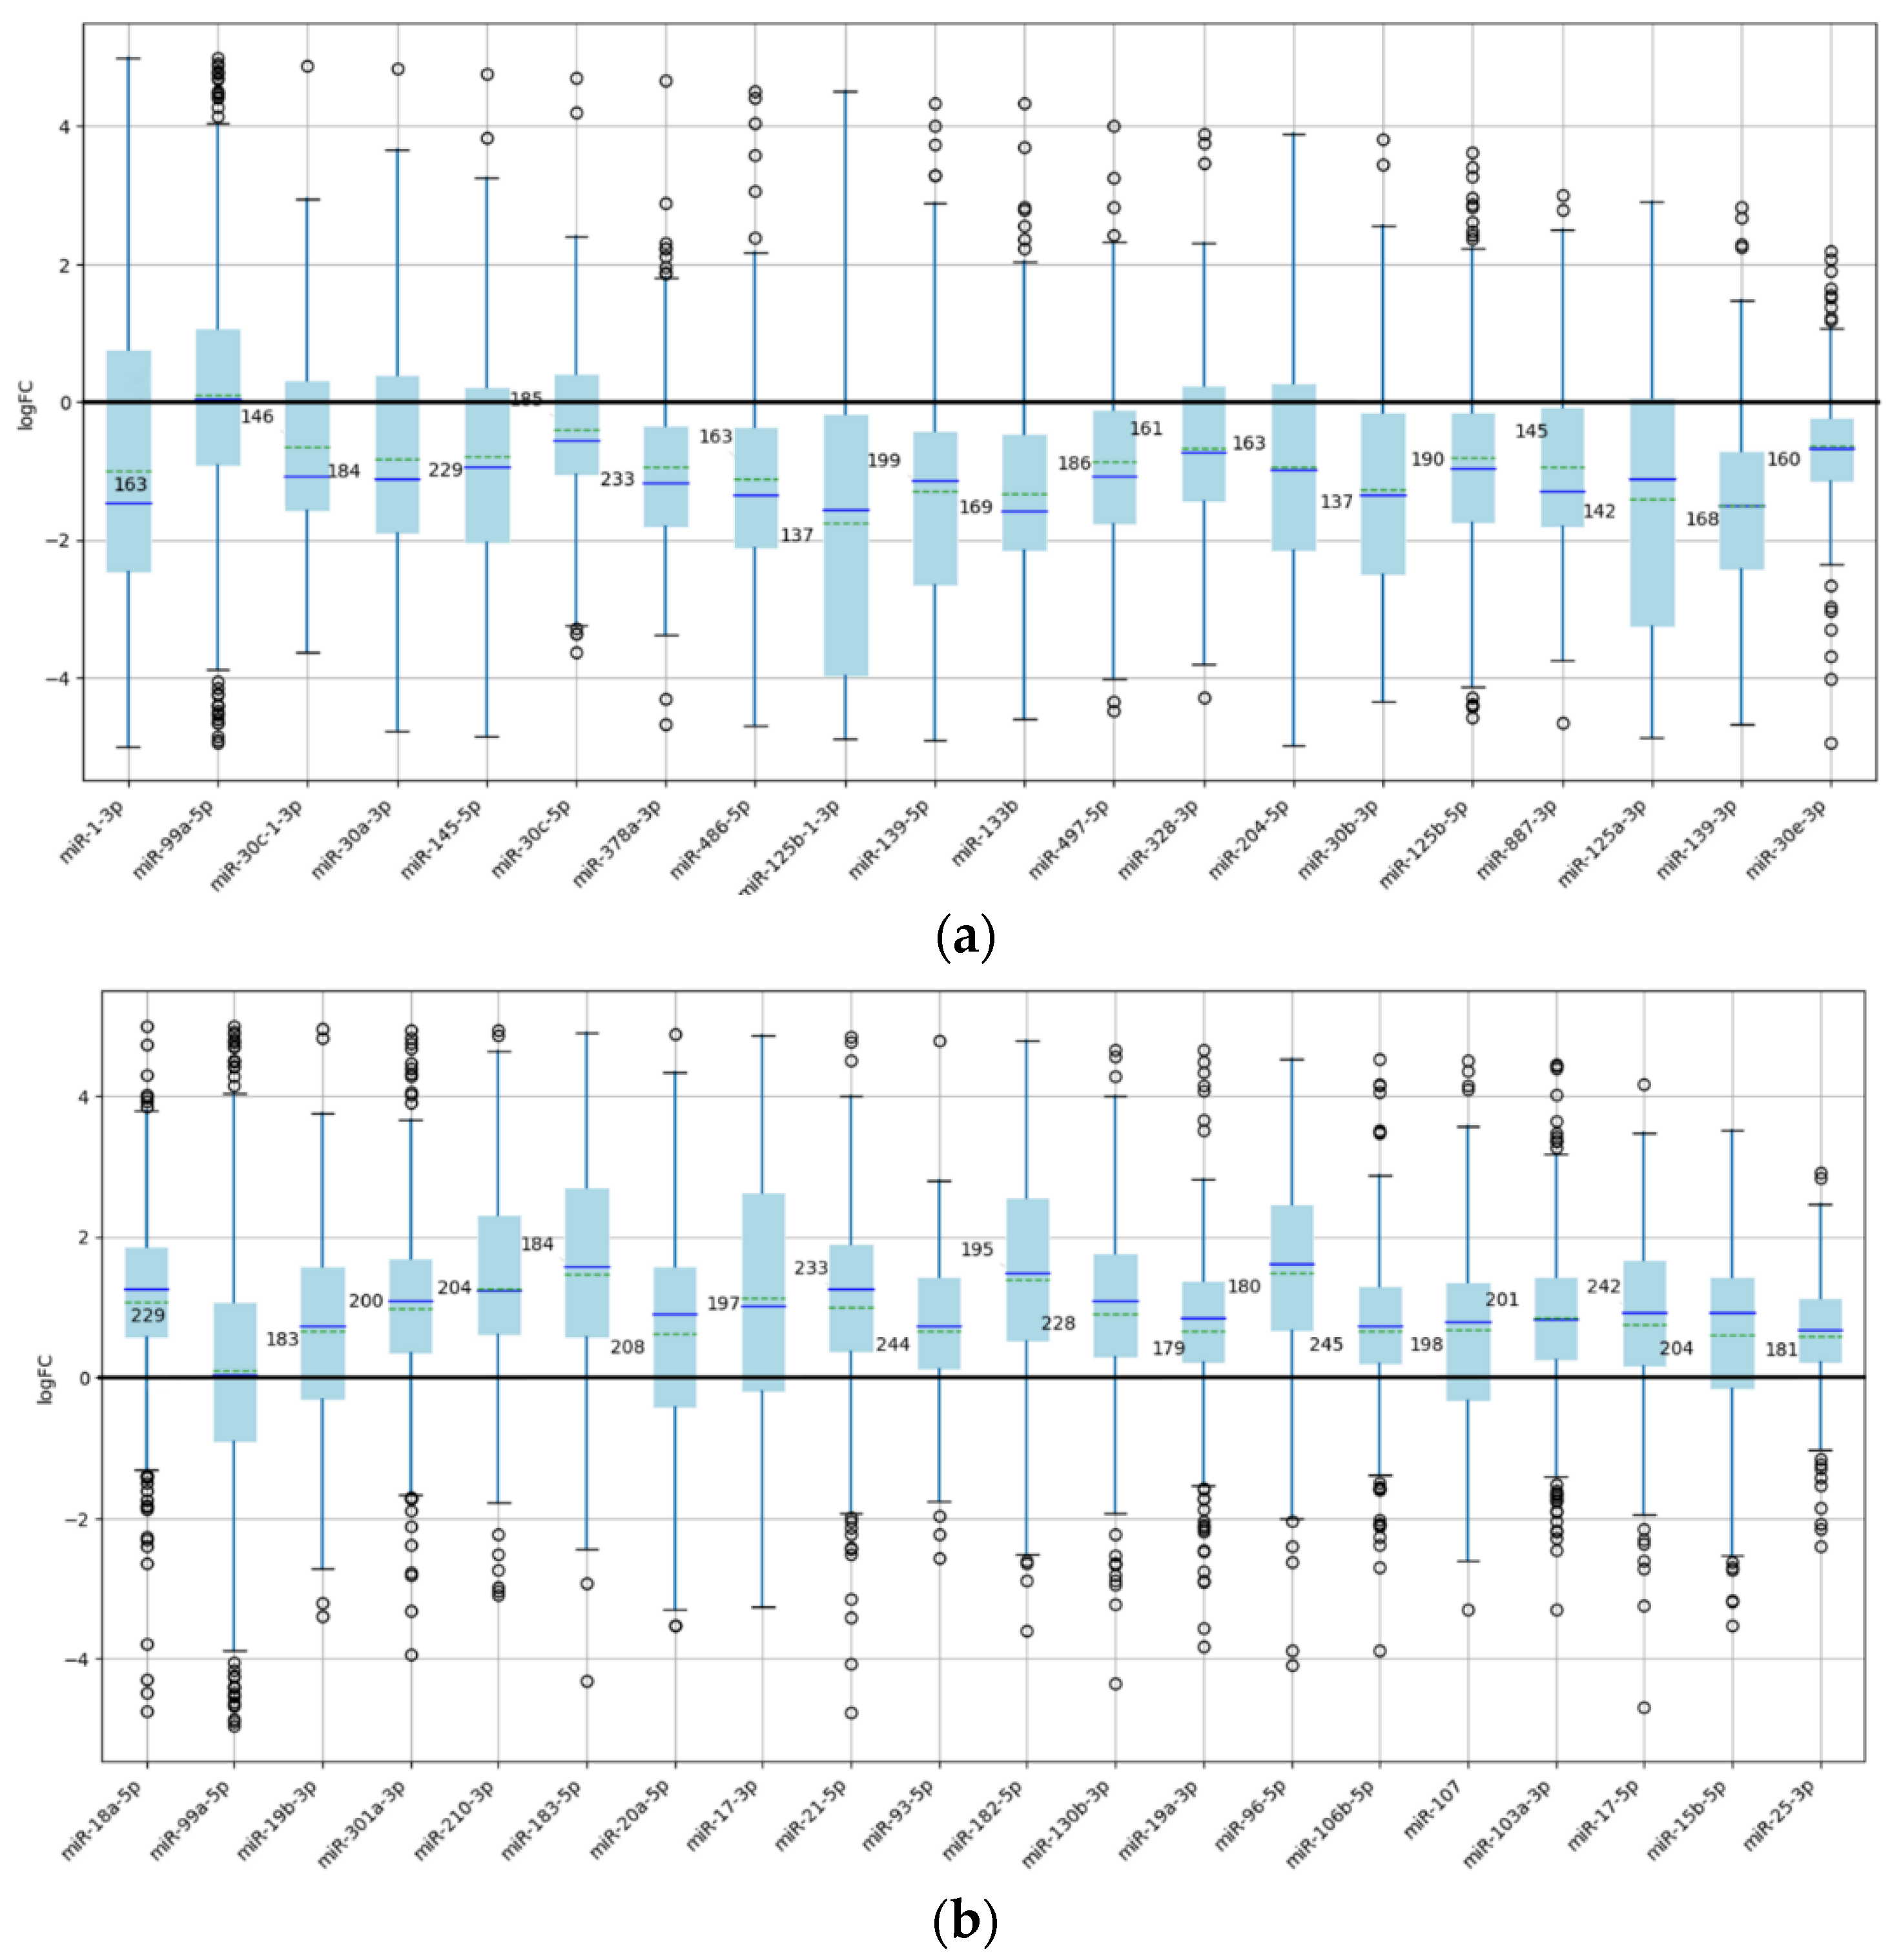
Figure 4.
Box plots of miRNAs exhibiting the highest membership ratios. (a) Twenty underexpressed miRNAs. (b) Twenty overexpressed miRNAs.
Figure 4.
Box plots of miRNAs exhibiting the highest membership ratios. (a) Twenty underexpressed miRNAs. (b) Twenty overexpressed miRNAs.
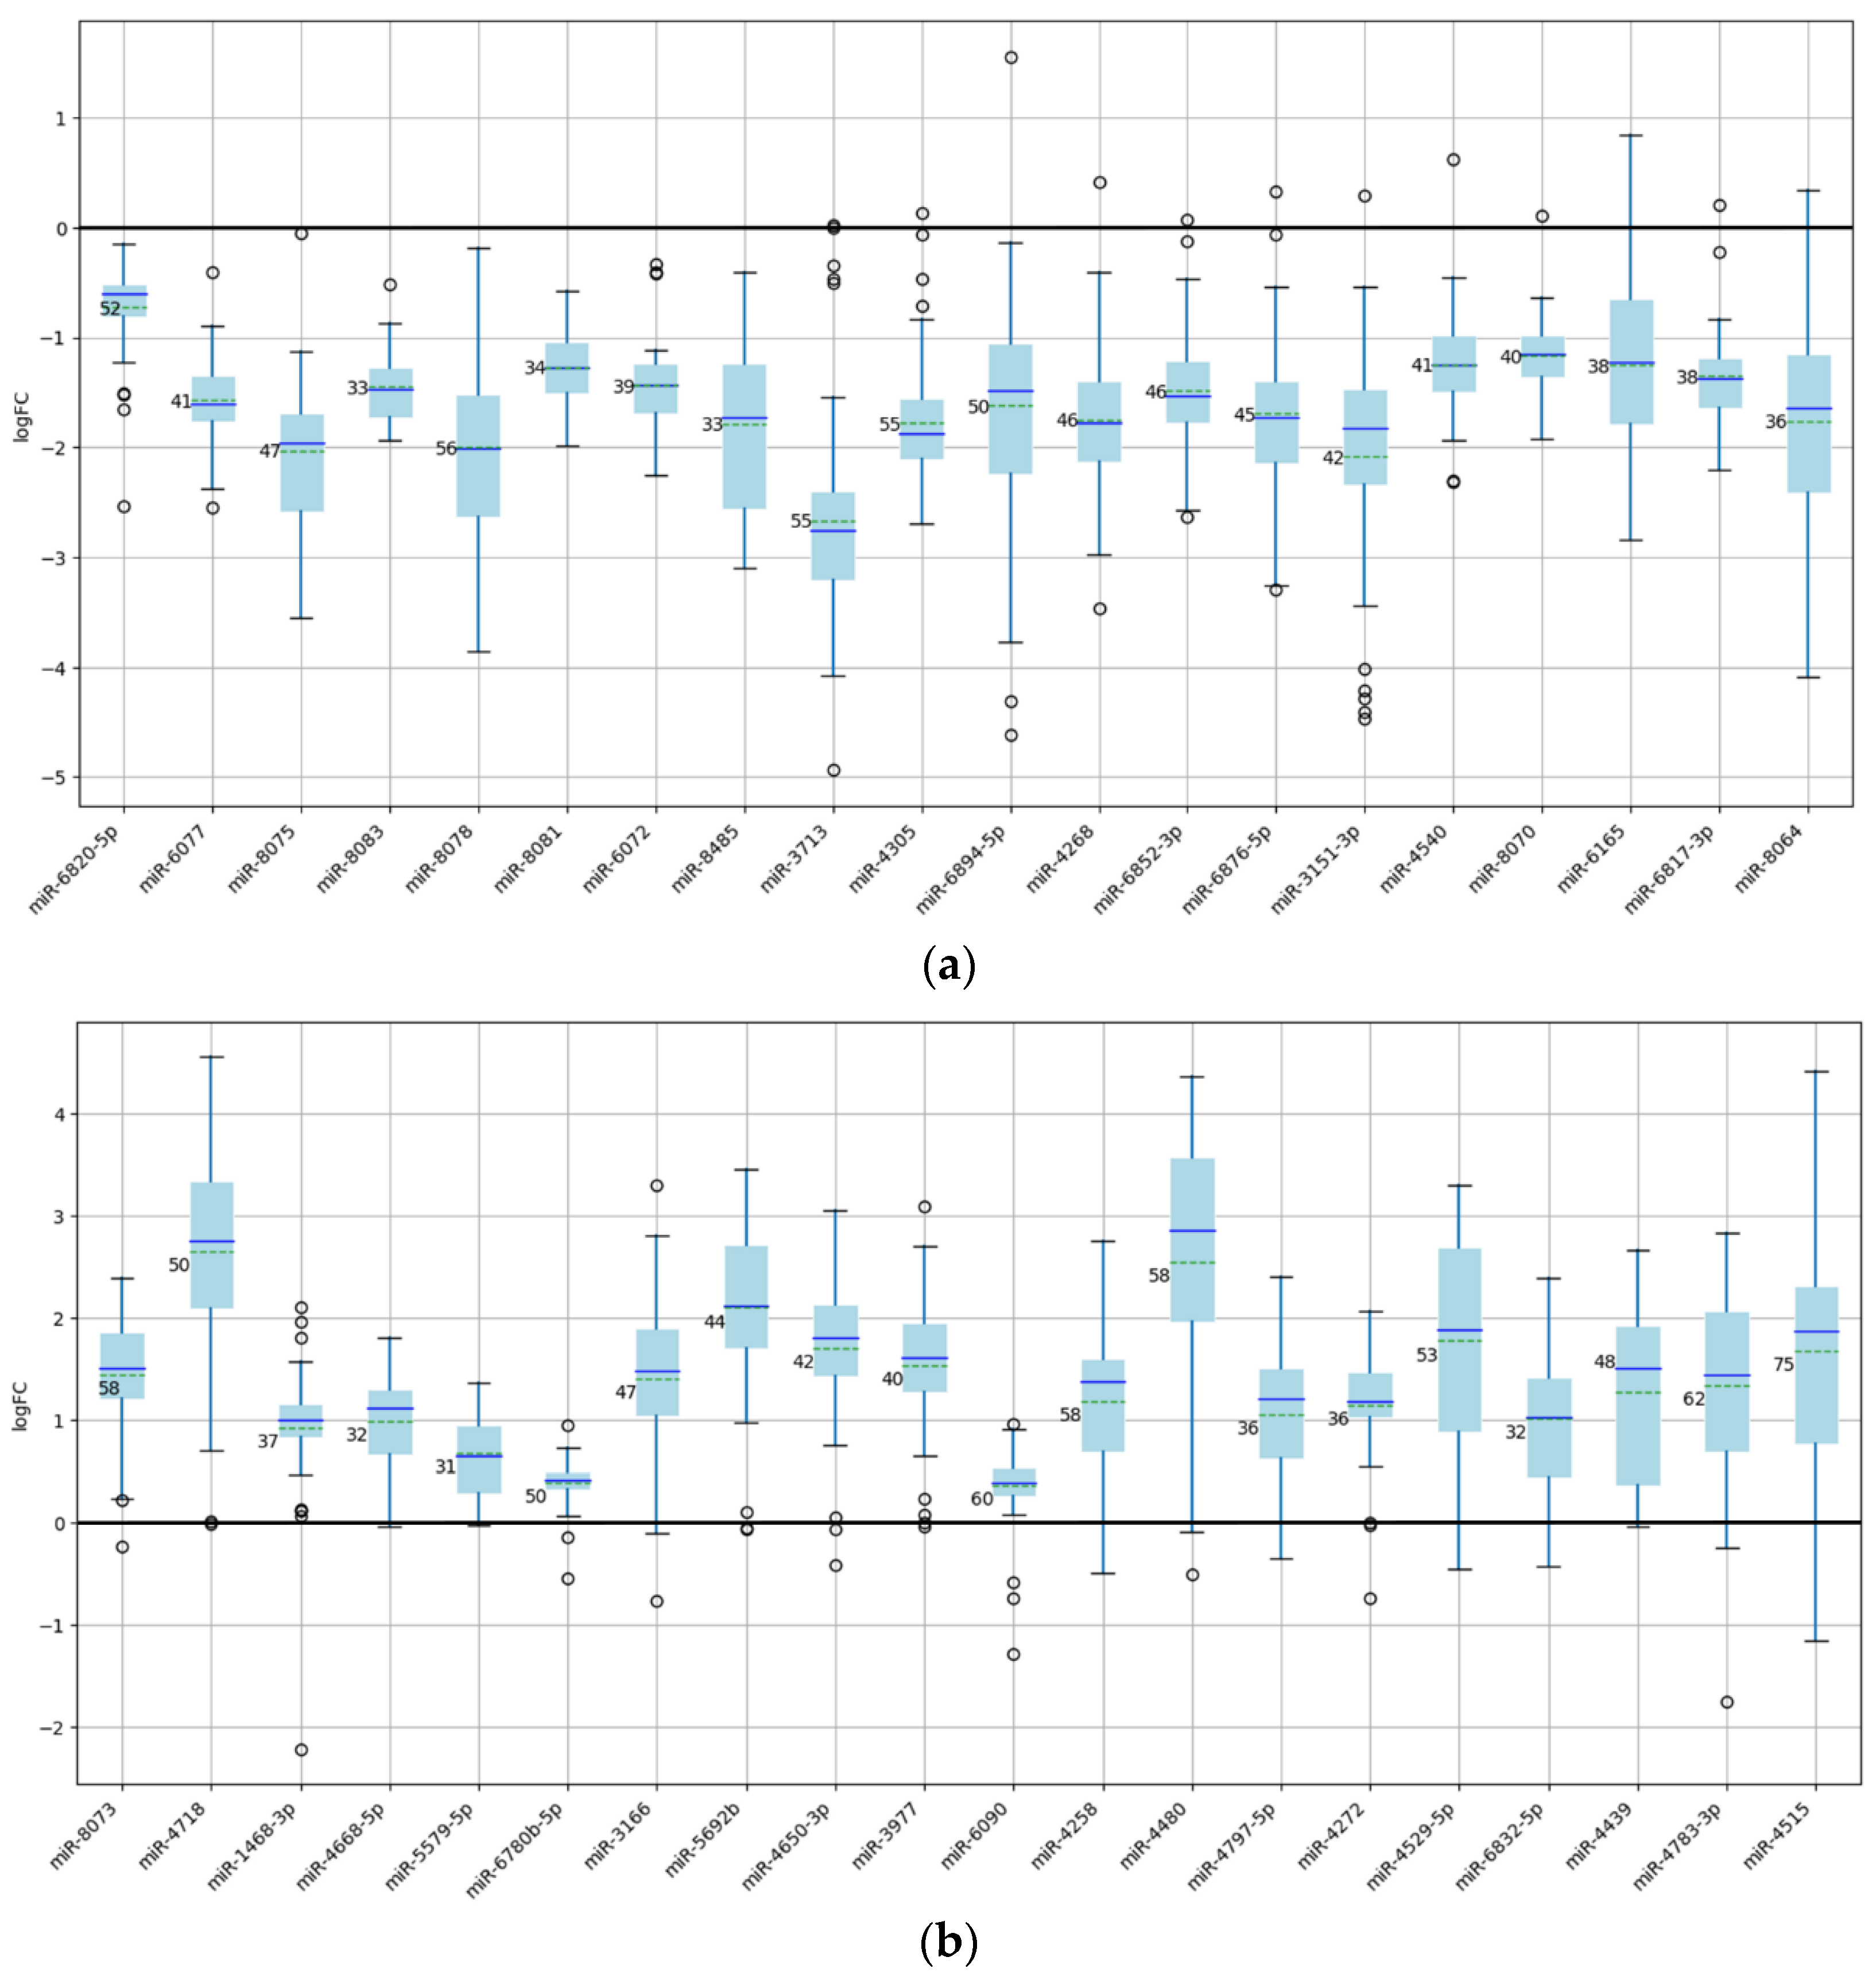
Figure 5.
Graph showing the dependence of the membership ratio on the number of miRNAs targeting genes classified as underexpressed or overexpressed (limited to genes targeted by fewer than 20 miRNAs). Panel (a) displays data for genes targeted by up to 800 miRNAs, while panel (b) focuses on genes targeted by up to 400 miRNAs. A subset of genes with experimentally validated roles in cancer development is highlighted.
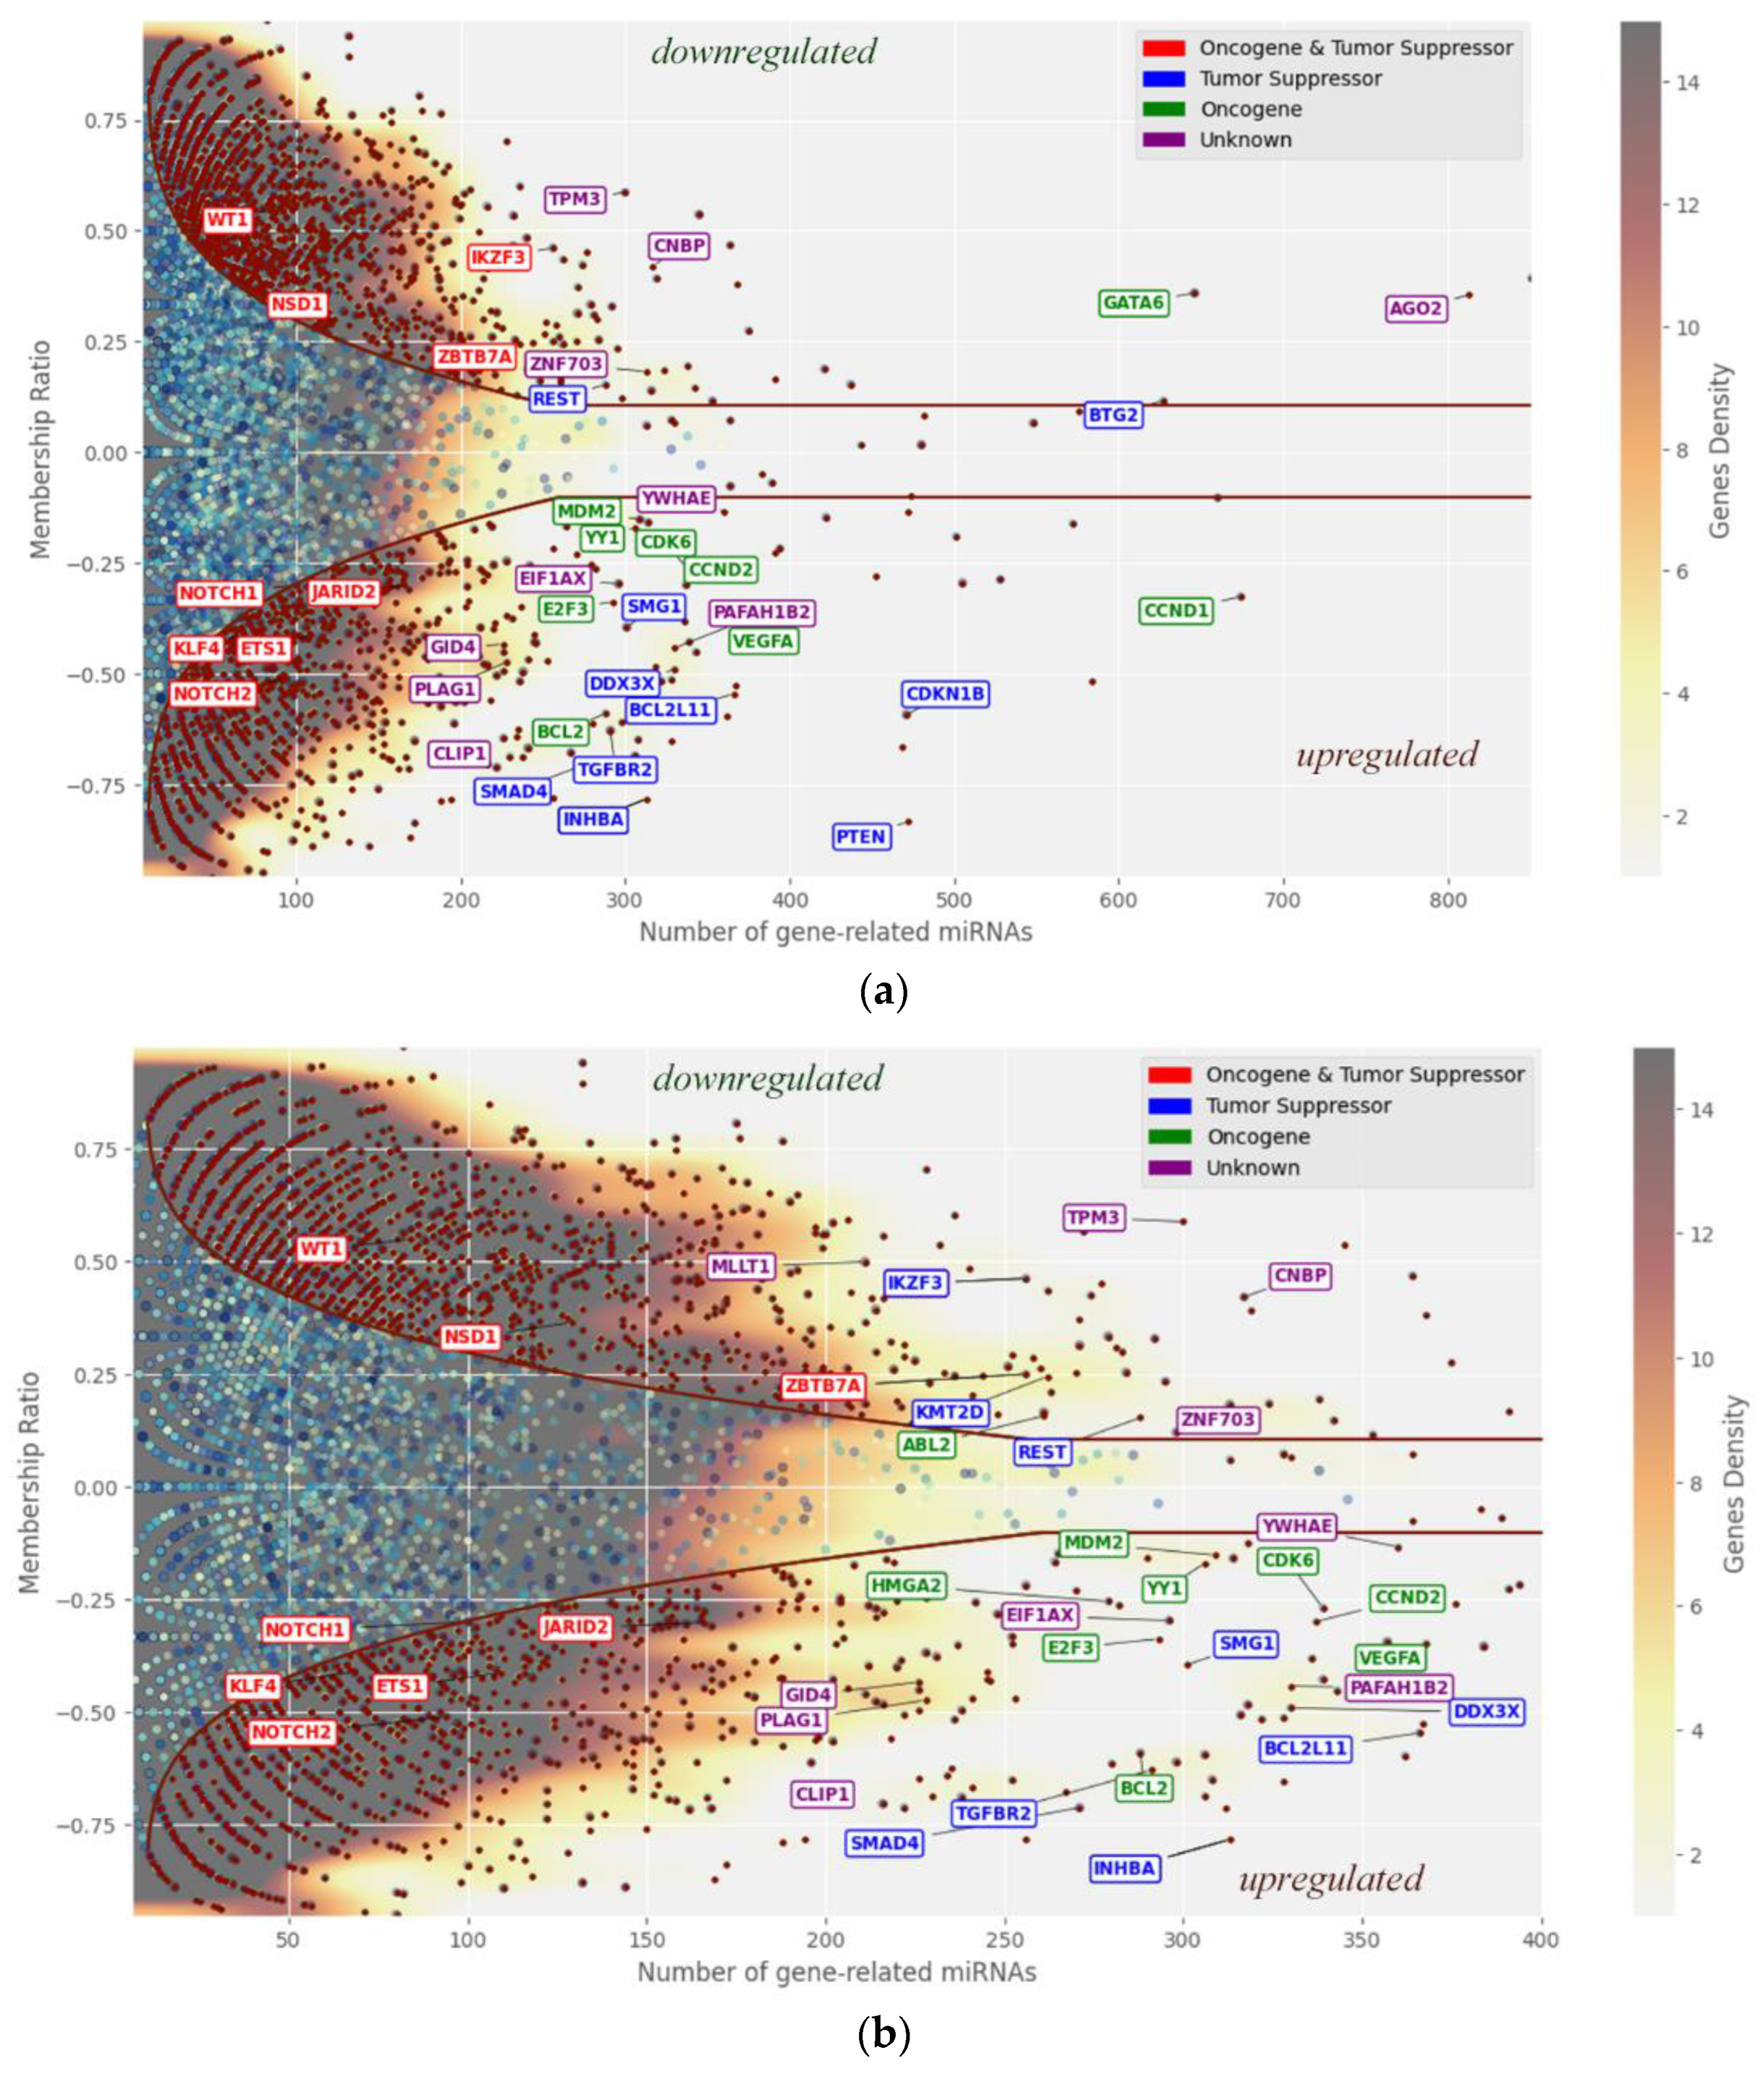
Figure 6.
Distribution of genes based on mean logarithmic expression (mean_logFC) across all cancer types and membership ratio (mean_div) derived from miRNA expression data. The 50 genes most distant from the origin are highlighted as an illustrative subset, although the pool of relevant genes extends beyond this. Each quadrant conveys distinct information: Quadrant I: upregulated miRNAs with downregulated genes. Quadrant II: downregulated miRNAs with upregulated genes. Quadrant III: upregulated miRNAs with downregulated genes. Quadrant IV: upregulated miRNAs with downregulated genes. Genes with mean_logFC values near zero exhibit negligible expression. [106].
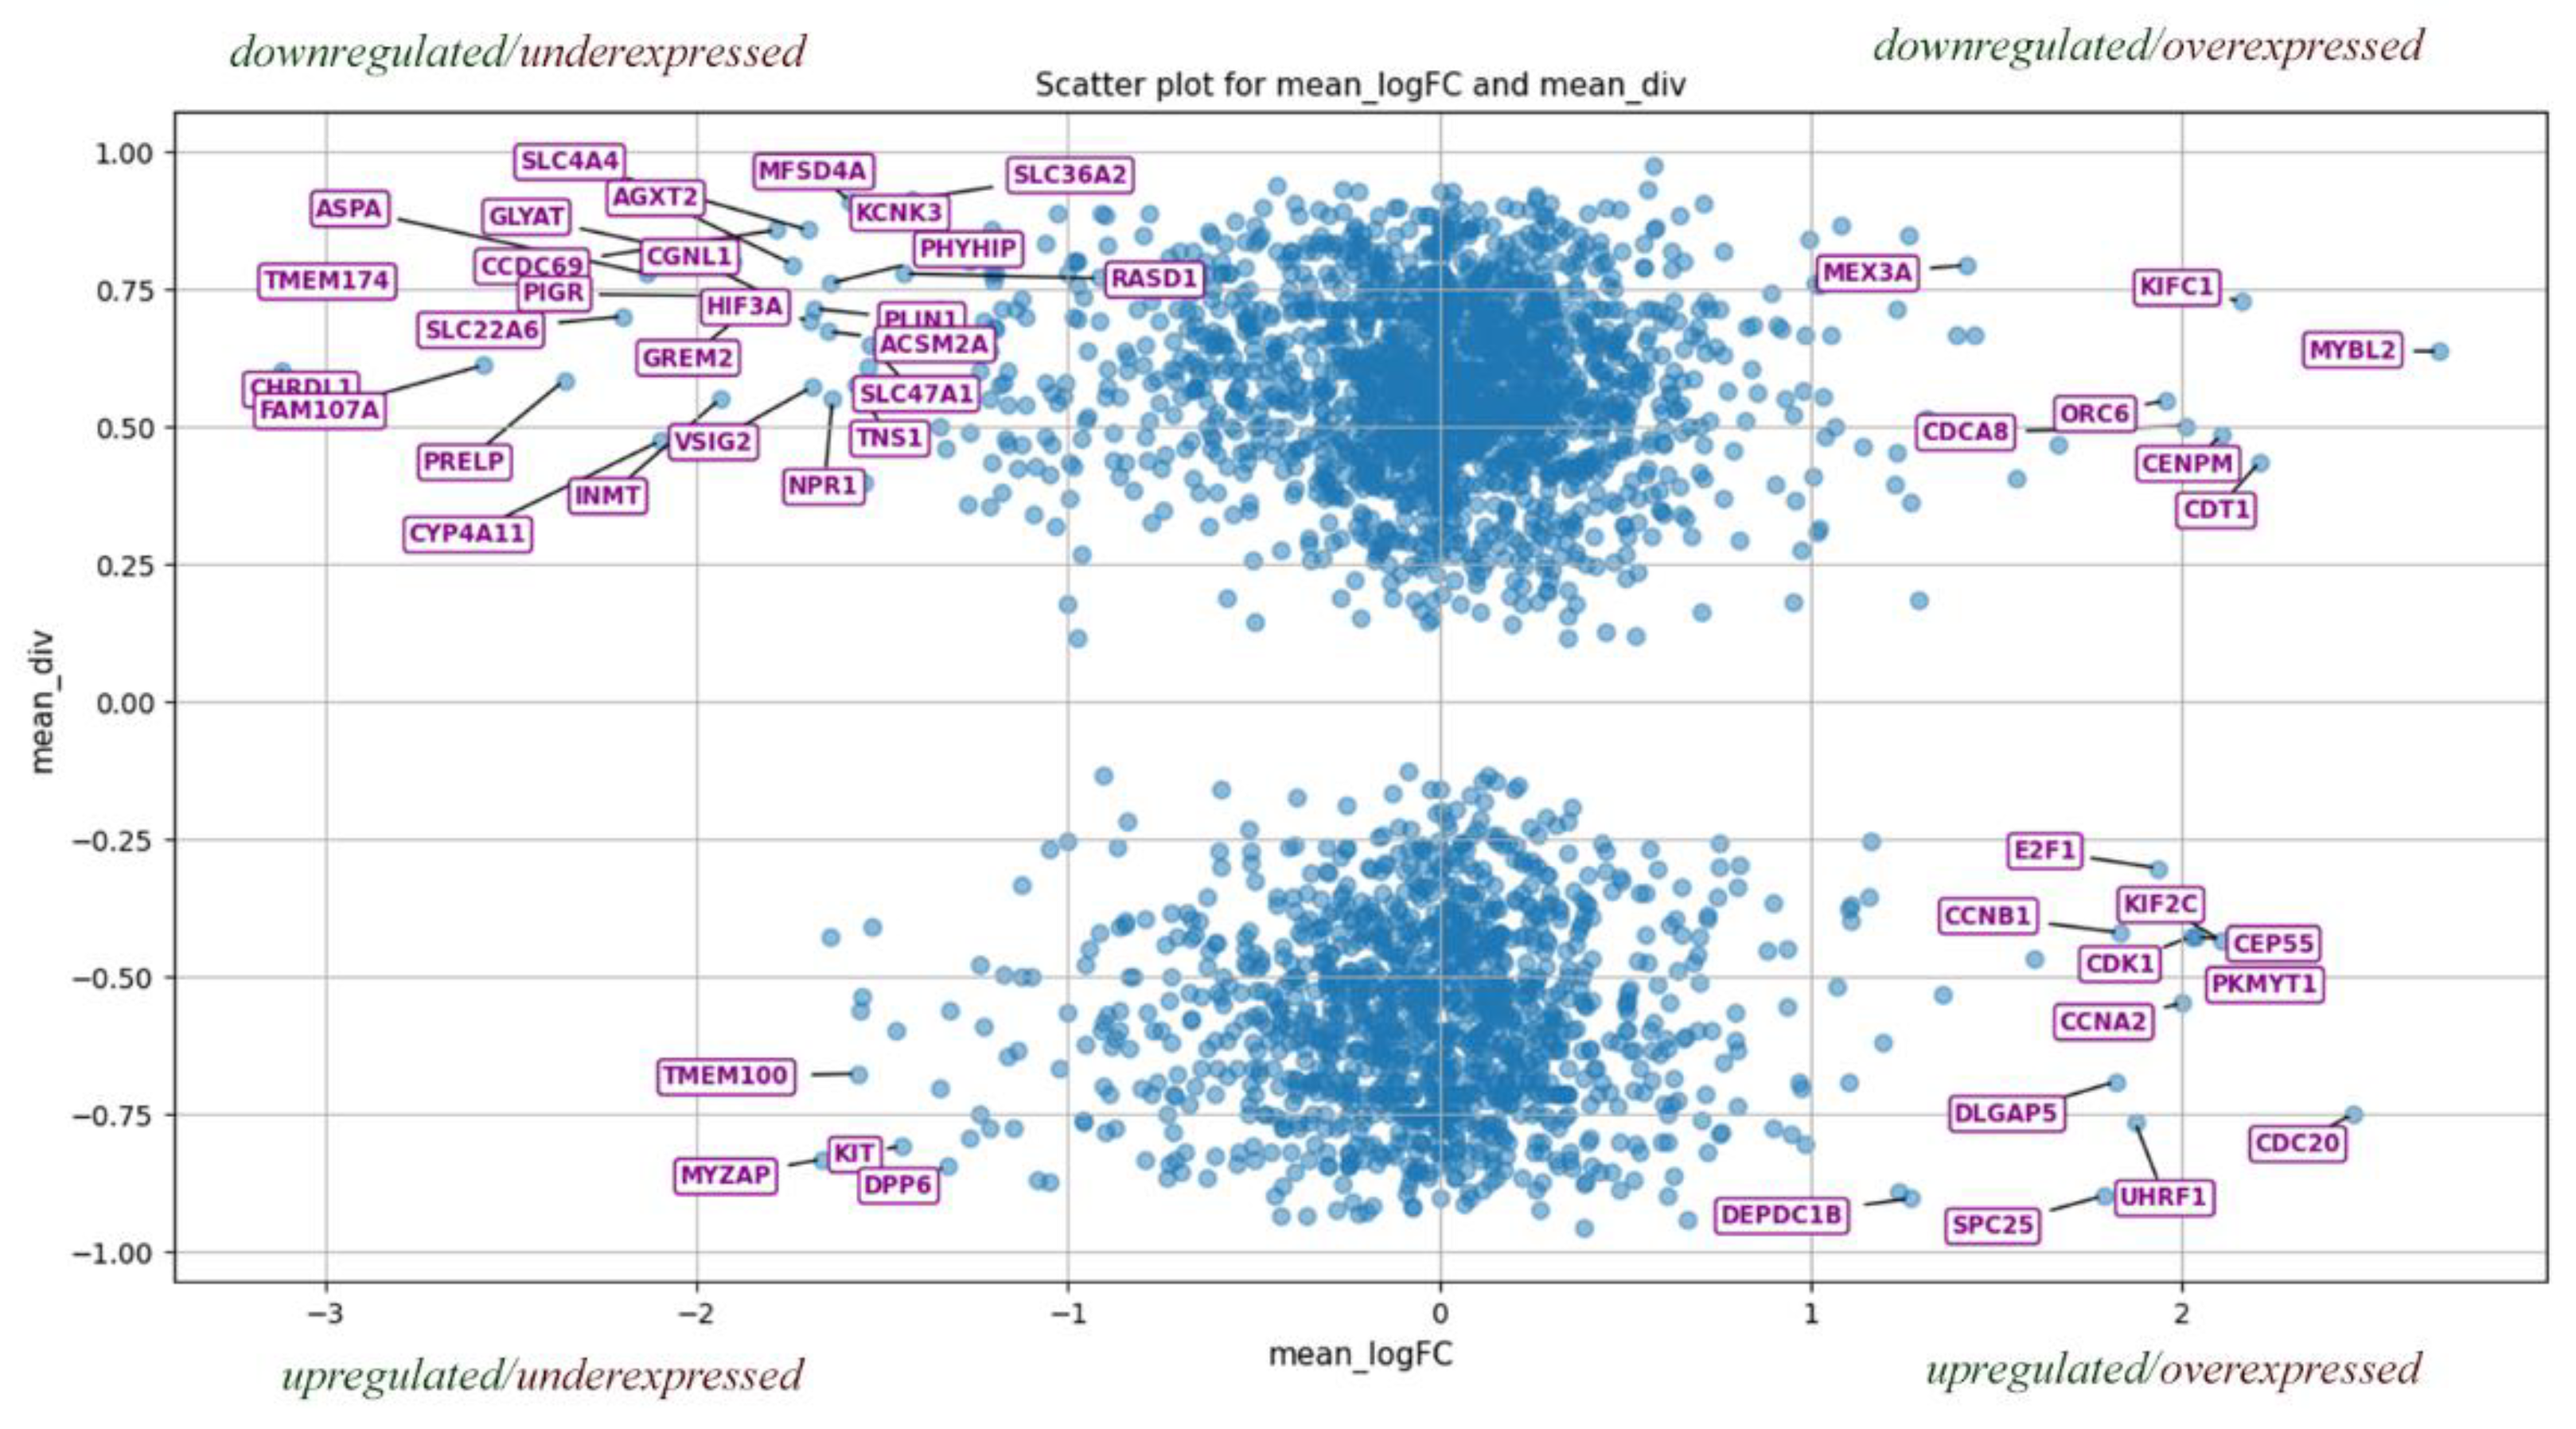
Figure 7.
Boxplots for the first 20 underexpressed (a) and 20 overexpressed (b) miRNAs. These specific human miRNAs are of particular interest because they tend to be underexpressed or overexpressed, and their regulatory role is highlighted by the expression levels of the target genes they control.
Figure 7.
Boxplots for the first 20 underexpressed (a) and 20 overexpressed (b) miRNAs. These specific human miRNAs are of particular interest because they tend to be underexpressed or overexpressed, and their regulatory role is highlighted by the expression levels of the target genes they control.
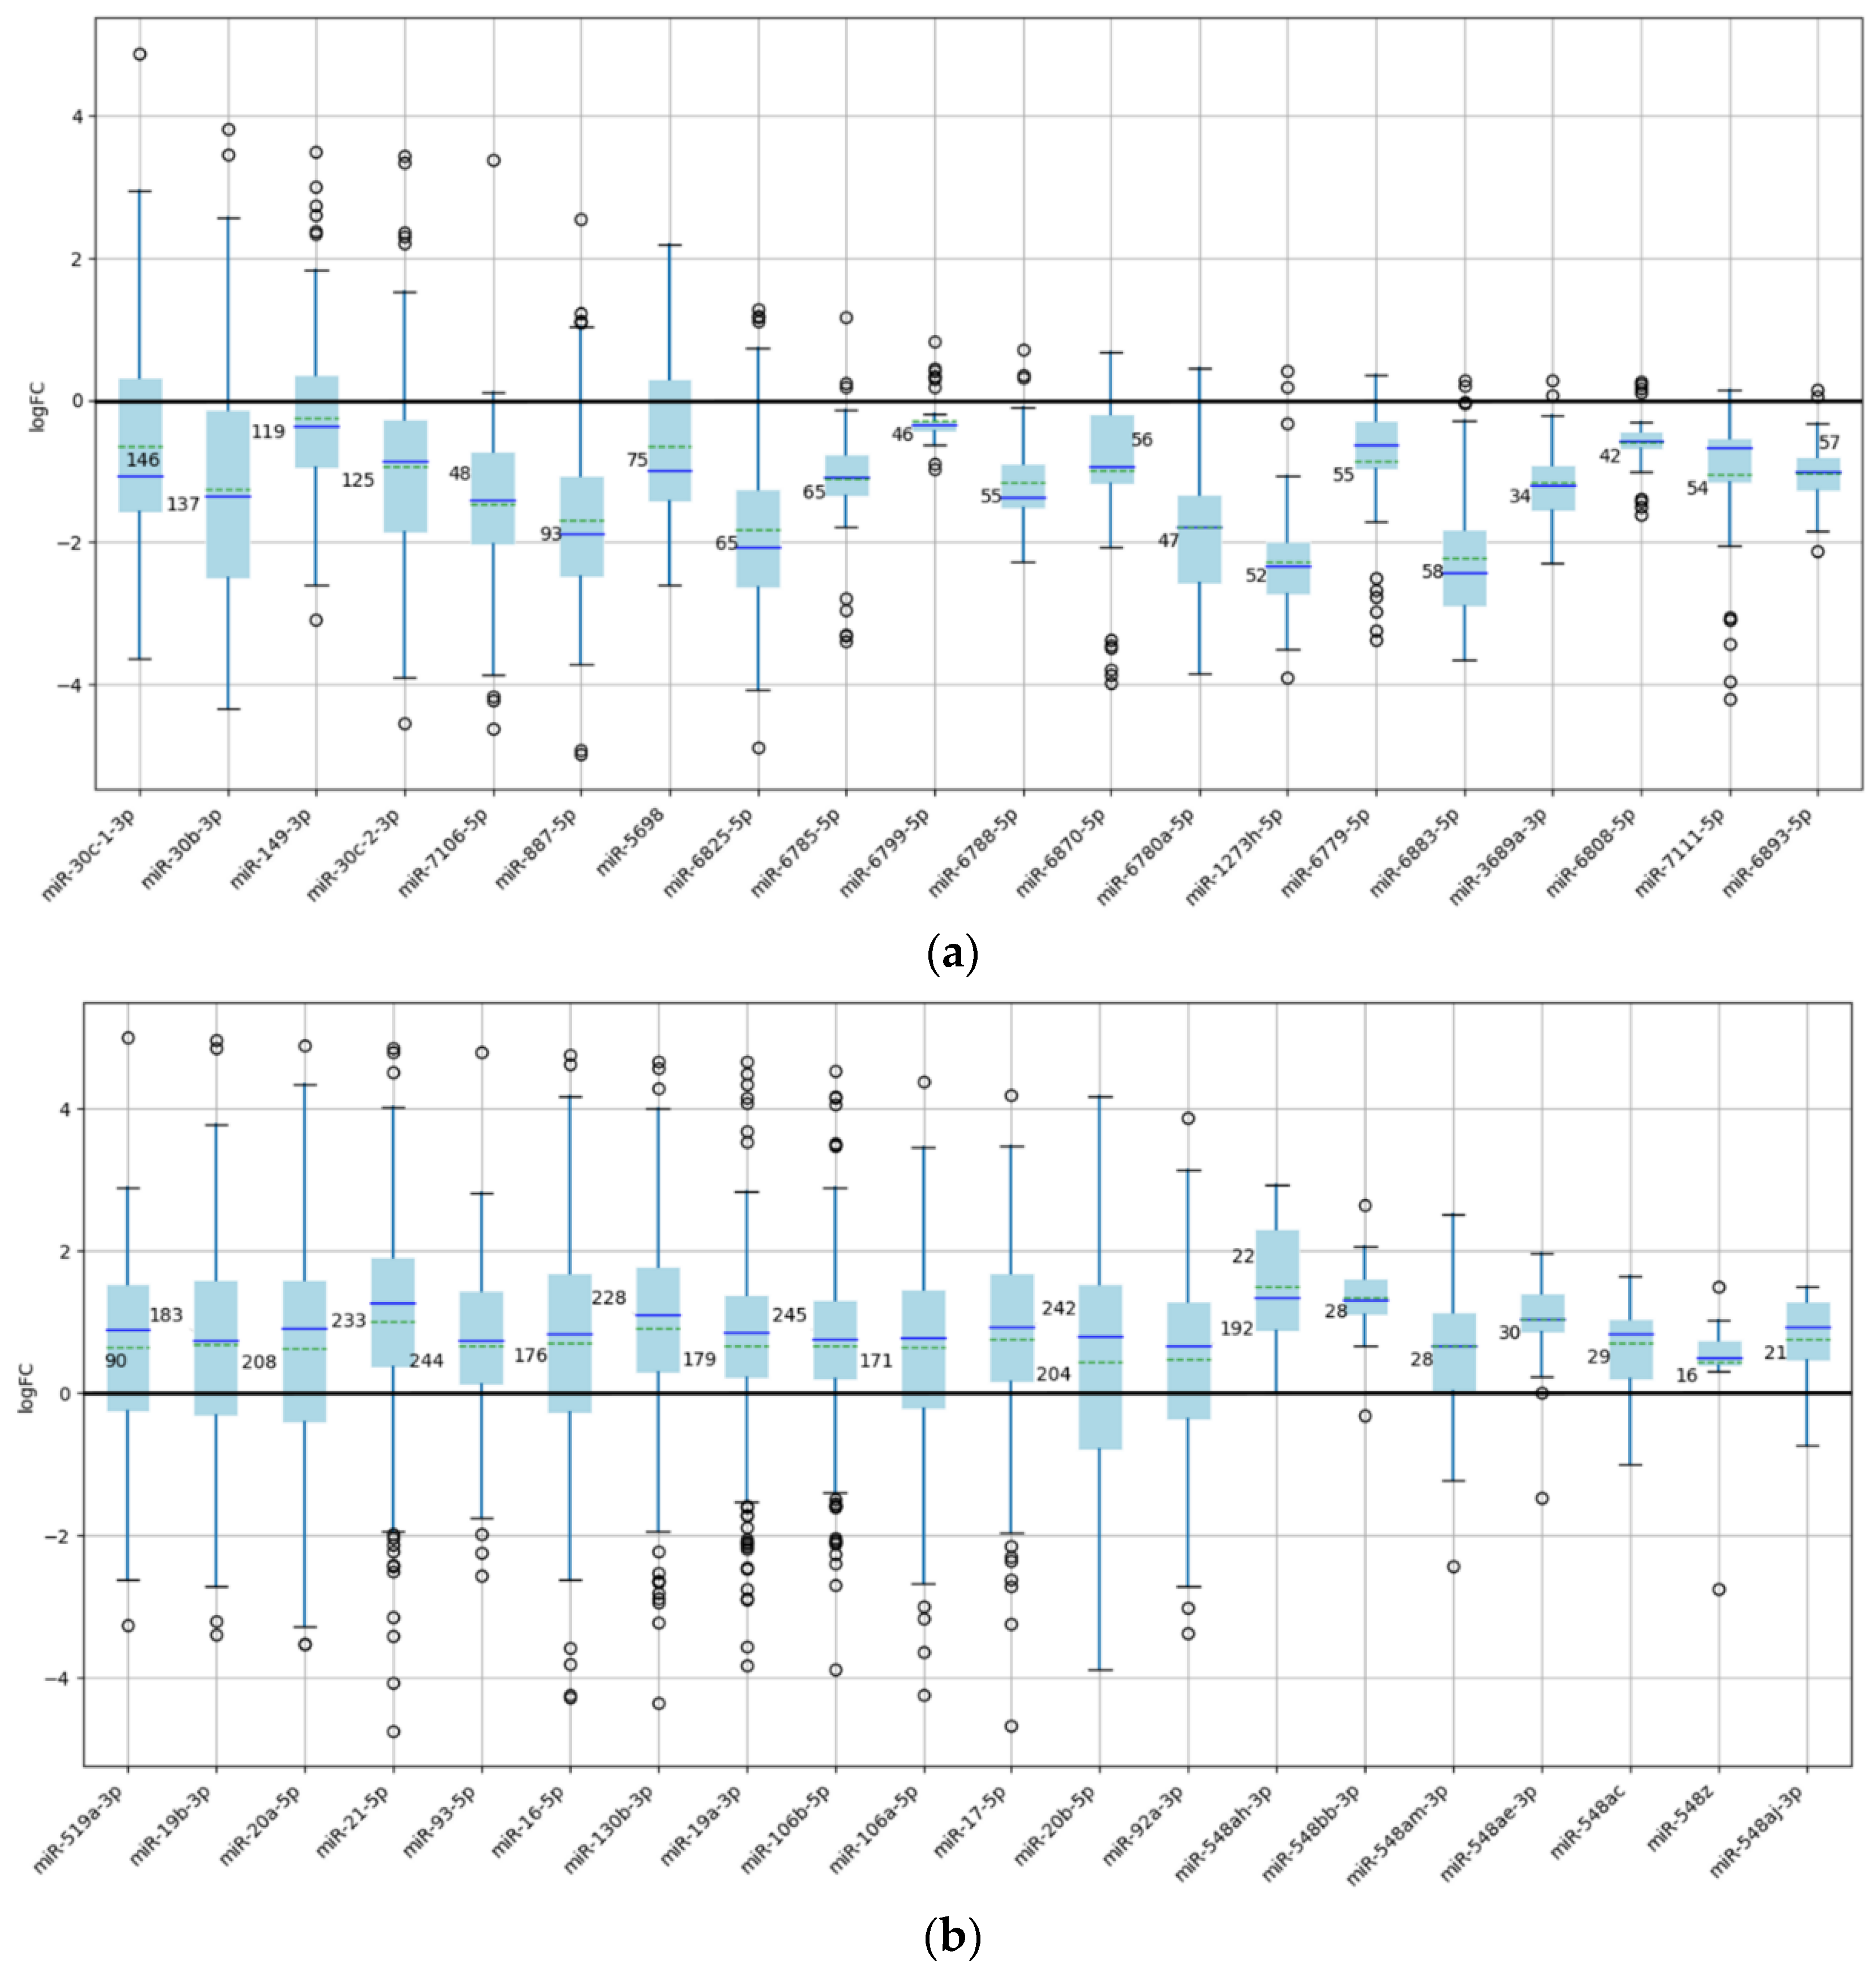

Table 1.
Cumulative miRNA expression values ordered by magnitude. The left section of the table lists the twenty miRNAs with the lowest cumulative expression values (underexpressed), while the right section shows the twenty miRNAs with the highest cumulative expression values (overexpressed). The first column indicates the miRNA identifier; the second column presents the sum of logFC values across all experiments; the third and fourth columns denote the number of experiments in which the miRNA was underexpressed and overexpressed, respectively. These results demonstrate a clear association between cancer presence and widespread miRNA dysregulation, reflected in distinct patterns of over- and underexpression.
| miRNA | sum_log_FC | Down | up | miRNA | sum_log_FC | down | up |
|---|---|---|---|---|---|---|---|
| hsa-miR-139-5p | -256,8886988 | 165 | 34 | hsa-miR-429 | 148,5189271 | 40 | 110 |
| hsa-miR-139-3p | -253,6689636 | 145 | 23 | hsa-miR-93-5p | 161,3206615 | 59 | 185 |
| hsa-miR-125b-1-3p | -239,8640174 | 104 | 33 | hsa-miR-106b-5p | 162,2069637 | 54 | 191 |
| hsa-miR-133b | -224,7014228 | 142 | 27 | hsa-miR-135b-5p | 164,7171991 | 40 | 117 |
| hsa-miR-378a-3p | -218,0534439 | 184 | 49 | hsa-miR-142-3p | 167,0549993 | 45 | 124 |
| hsa-miR-125a-3p | -200,0807663 | 105 | 37 | hsa-miR-191-5p | 167,9664181 | 53 | 116 |
| hsa-miR-486-5p | -183,1454502 | 131 | 32 | hsa-miR-5100 | 168,399075 | 15 | 65 |
| hsa-miR-873-3p | -182,7628861 | 72 | 7 | hsa-miR-7-5p | 168,4722294 | 44 | 122 |
| hsa-miR-145-5p | -181,2865379 | 171 | 58 | hsa-miR-103a-3p | 171,422429 | 40 | 161 |
| hsa-miR-30b-3p | -173,559201 | 106 | 31 | hsa-miR-17-5p | 181,9678752 | 59 | 183 |
| hsa-miR-508-5p | -170,7541897 | 85 | 30 | hsa-miR-99a-5p | 187,435229 | 888 | 912 |
| hsa-miR-4648 | -168,3359797 | 56 | 10 | hsa-miR-1290 | 188,4010193 | 21 | 90 |
| hsa-miR-575 | -165,7760472 | 96 | 35 | hsa-miR-301a-3p | 197,3741224 | 43 | 157 |
| hsa-miR-6501-5p | -164,5701385 | 69 | 16 | hsa-miR-130b-3p | 205,3449082 | 46 | 182 |
| hsa-miR-134-3p | -163,1082517 | 76 | 19 | hsa-miR-17-3p | 221,2149965 | 51 | 146 |
| hsa-miR-1-3p | -163,0672057 | 118 | 45 | hsa-miR-21-5p | 232,0956337 | 48 | 185 |
| hsa-miR-497-5p | -161,7553736 | 141 | 45 | hsa-miR-18a-5p | 246,50339 | 41 | 188 |
| hsa-miR-6127 | -158,2358922 | 51 | 2 | hsa-miR-210-3p | 258,2379838 | 37 | 167 |
| hsa-miR-6751-5p | -157,8749887 | 61 | 7 | hsa-miR-96-5p | 268,8365613 | 27 | 153 |
| hsa-miR-887-5p | -157,4227012 | 83 | 10 | hsa-miR-183-5p | 269,522949 | 31 | 153 |
| hsa-miR-125b-5p | -155,0589238 | 143 | 47 | hsa-miR-182-5p | 269,6076375 | 40 | 155 |
Table 2.
The first column lists miRNA identifiers. The second column reports the cumulative sum of expression values across all experiments. The third and fourth columns indicate the number of experiments in which the miRNA is underexpressed and overexpressed, respectively. The fifth column denotes the overall direction of expression. The sixth column provides selected literature sources reporting on the expression of each miRNA. The seventh column summarizes the established oncogenic or tumor suppressor role of the miRNA. This table demonstrates that many miRNAs have been investigated multiple times, with expression data from our analysis largely consistent with published studies. Additionally, the presence of oncogenic or tumor-suppressive effects for each miRNA is indicated where available.
| miRNA | sum_logFC | num_of_down | num_of_up | expression_rate | references | known_oncomir/ tumor_suppressor |
|---|---|---|---|---|---|---|
| hsa-miR-17-5p | 181.967875163 | 59 | 183 | UP | [18,19,20,21] overexpressed | oncomir |
| hsa-miR-17-3p | 221.214996471 | 51 | 146 | UP | [18,19,20] overexpressed | oncomir |
| hsa-miR-21-3p | 122.420967796 | 39 | 95 | UP | [18,22,23,24,25,26,27,28,29,30] overexpressed | oncomir |
| hsa-miR-21-5p | 232.095633685 | 48 | 185 | UP | [18,22,23,24,25,26,27,28,29,30,31,32,33] overexpressed | oncomir |
| hsa-miR-25-3p | 105.474276835 | 38 | 143 | UP | [18,34] overexpressed | oncomir |
| hsa-miR-92a-2-5p | -96.775839638 | 57 | 19 | DOWN | [18] overexpressed | oncomir |
| hsa-miR-1-3p | -163.06720567600 | 118 | 45 | DOWN | [35] underexpressed | unknown |
| hsa-miR-146b-5p | 83.35547042 | 58 | 100 | UP (EVEN) | [25,36,37,38,39] overexpressed | unknown |
| hsa-miR-210-5p | 138.099992203 | 46 | 126 | UP | [40,41,42,43,44,45,46,47,48,49,50,51] overexpressed | oncomir |
| hsa-miR-155-3p | 26.049729861 | 30 | 48 | UP (EVEN) | [40,41,42,43,45,46,47,48,49,50,51] overexpressed | oncomir |
| hsa-miR-20a-3p | 30.7308478730000 | 32 | 51 | UP (EVEN) | [19,20] overexpressed | oncomir |
| hsa-miR-20a-5p | 128.094901003 | 58 | 150 | UP (EVEN) | [19,20] overexpressed | oncomir |
| hsa-miR-20b-3p | 18.138542252 | 25 | 48 | UP (EVEN) | [19,20] overexpressed | unknown |
| hsa-miR-20b-5p | 89.189273862 | 73 | 131 | UP (EVEN) | [19,20,52] overexpressed | unknown |
| hsa-miR-92b-5p | 33.468787427 | 35 | 86 | UP | [19,20,53] overexpressed | oncomir |
| hsa-miR-92b-3p | 55.903127821 | 42 | 97 | UP (EVEN) | [19,20,53] overexpressed | oncomir |
| hsa-miR-106a-5p | 109.437529666 | 46 | 125 | UP | [19,20] overexpressed | unknown |
| hsa-miR-106a-3p | 55.146269153 | 17 | 43 | UP | [19,20] overexpressed | unknown |
| hsa-miR-106b-5p | 162.206963737 | 54 | 191 | UP | [19,20] overexpressed | oncomir |
| hsa-miR-106b-3p | 28.655181245999 | 29 | 57 | UP (EVEN) | [19,20] overexpressed | oncomir |
| hsa-miR-574-3p | -89.761840835 | 102 | 42 | DOWN (EVEN) | [54,55] underexpressed | unknown |
| hsa-miR-100-5p | -42.845381169 | 141 | 96 | DOWN (EVEN) | [56,57,58] underexpressed | oncomir |
| hsa-miR-100-3p | 18.257709839 | 33 | 46 | EVEN | [56,57] underexpressed | oncomir |
| hsa-miR-125b-5p | -155.058923805 | 143 | 47 | DOWN | [56,57,59] underexpressed | unknown |
| hsa-miR-10a-5p | 18.033378321 | 65 | 62 | EVEN | [60] | oncomir |
| hsa-miR-10a-3p | 33.94121654 | 35 | 41 | EVEN | [60] overexpressed | unknown |
| hsa-miR-302c-3p | 35.479451341 | 15 | 42 | UP | [61,62] overexpressed | unknown |
| hsa-miR-302c-5p | 2.7913214050000 | 35 | 32 | EVEN | [61,62] overexpressed | unknown |
| hsa-miR-520c-3p | 14.080070734 | 24 | 29 | EVEN | [61,62] overexpressed | unknown |
| hsa-miR-181b-3p | 18.138919527 | 9 | 29 | UP | [37,38] overexpressed | unknown |
| hsa-miR-181b-5p | 56.004847604 | 49 | 99 | UP (EVEN) | [37,38] overexpressed | unknown |
| hsa-miR-874-5p | -53.671752358 | 61 | 15 | DOWN | [63] underexpressed | unknown |
| hsa-miR-874-3p | -43.857572139 | 78 | 37 | DOWN | [63] underexpressed | unknown |
| hsa-miR-206 | -43.896241638999 | 66 | 33 | DOWN | [64] underexpressed | unknown |
| hsa-miR-192-5p | -14.939738841999 | 83 | 73 | EVEN | [65] underexpressed | unknown |
| hsa-miR-34a-5p | 78.603195367 | 54 | 101 | UP | [37,38,66,67,68] | tumor suppressor |
| hsa-miR-34a-3p | 32.856116658 | 42 | 57 | EVEN | [37,38,68] | tumor suppressor |
| hsa-miR-16-5p | 122.040722105 | 46 | 130 | UP | [37,38,69] overexpressed | oncomir |
| hsa-miR-222-3p | 79.537077385 | 82 | 119 | UP (EVEN) | [58,70] underexpressed | oncomir |
| hsa-let-7b-3p | -131.509341304 | 99 | 34 | DOWN | [71] underexpressed | unknown |
| hsa-let-7b-5p | -28.172177114 | 94 | 64 | DOWN (EVEN) | [71] underexpressed | unknown |
| hsa-miR-145-5p | -181.286537884 | 171 | 58 | DOWN | [72,73,74] overexpressed | tumor suppressor |
| hsa-miR-145-3p | -124.148339208 | 92 | 35 | DOWN | [72,73,74] overexpressed | tumor suppressor |
| hsa-miR-27a-3p | 73.096939678 | 57 | 116 | UP | [69,75,76,77] overexpressed | oncomir |
| hsa-miR-96-5p | 268.836561293 | 27 | 153 | UP | [78,79] overexpressed | oncomir |
| hsa-miR-483-3p | -67.676136178 | 80 | 44 | DOWN (EVEN) | [80] overexpressed | |
| hsa-miR-19b-3p | 122.182943146 | 49 | 134 | UP | [37,38,81] overexpressed | oncomir |
| hsa-miR-125b-5p | -155.058923805 | 143 | 47 | DOWN | [56,57,59,82], underexpressed | tumor suppressor |
| hsa-miR-4649-5p | 30.756795974 | 13 | 48 | UP | [83] overexpressed | unknown |
| hsa-miR-2467-3p | 109.959427118 | 5 | 57 | UP | [83] overexpressed | unknown |
| hsa-miR-543 | -23.65012842 | 57 | 45 | EVEN | [83] overexpressed | unknown |
| hsa-miR-301a-3p | 197.37412236 | 43 | 157 | UP | [83] overexpressed | unknown |
| hsa-miR-3132 | -6.754301139 | 19 | 15 | EVEN | [83] overexpressed | unknown |
| hsa-miR-19a-5p | 82.647646616 | 12 | 64 | UP | [37,38,83] overexpressed | unknown |
| hsa-miR-495-3p | -27.55630123000 | 66 | 42 | EVEN | [83] overexpressed | unknown |
| hsa-miR-21-5p | 232.095633685 | 48 | 185 | UP | [27,29,30,84,85,86,87] overexpressed | oncomir |
| hsa-miR-30a-5p | -105.284666614 | 137 | 64 | DOWN | [32,33] underexpressed | unknown |
| hsa-miR-10b-5p | 15.380943873 | 107 | 94 | EVEN | [85,88] overexpressed | oncomir |
| hsa-miR-221-3p | 104.840632196 | 82 | 115 | UP (EVEN) | [85,89] overexpressed | oncomir |
| hsa-miR-223-5p | 5.1038718289999 | 28 | 29 | EVEN | [85] overexpressed | oncomir |
| hsa-miR-223-3p | 12.148270143000 | 78 | 84 | EVEN | [85] overexpressed | oncomir |
| hsa-miR-410-3p | -9.0977574719999 | 56 | 52 | EVEN | [90,91,92] overexpressed | oncomir |
| hsa-miR-182-5p | 269.607637527 | 40 | 155 | UP | [79,90,91] overexpressed | oncomir |
| hsa-miR-182-3p | 72.725021519 | 20 | 84 | UP | [90,91] overexpressed | oncomir |
| hsa-miR-29b-3p | 139.840241189 | 61 | 116 | UP | [50,51] overexpressed | oncomir |
| hsa-miR-372-5p | 16.601484109 | 0 | 17 | UP | [50,51] overexpressed | oncomir |
| hsa-miR-372-3p | 7.4439734880000 | 33 | 43 | EVEN | [50,51] overexpressed | oncomir |
| hsa-miR-9-3p | 34.288294366 | 56 | 64 | EVEN | [93] overexpressed | oncomir |
| hsa-miR-9-5p | 96.301540349 | 52 | 81 | UP | [93] overexpressed | oncomir |
| hsa-miR-146a-3p | 48.769518397 | 21 | 45 | UP | [94,95] overexpressed | oncomir |
| hsa-miR-146a-5p | 58.148256963 | 68 | 101 | UP (EVEN) | [94] overexpressed | oncomir |
| hsa-miR-23a-3p | 89.970128176 | 59 | 103 | UP | [69,96,97,98] overexpressed | oncomir |
| hsa-miR-23a-5p | -73.666153025 | 78 | 24 | DOWN | [69,98] overexpressed | oncomir |
| hsa-miR-24-3p | 65.578059129 | 54 | 108 | UP | [69] overexpressed | oncomir |
| hsa-miR-519a-3p | 57.869362816 | 25 | 65 | UP | [99] overexpressed | oncomir |
| hsa-miR-425-5p | 120.239658602 | 34 | 125 | UP | [69,100] overexpressed | oncomir |
| hsa-miR-208b-5p | 23.336730899 | 1 | 26 | UP | [101] overexpressed | oncomir |
| hsa-miR-208b-3p | 10.431775042 | 15 | 27 | UP | [101] overexpressed | oncomir |
| hsa-miR-18a-5p | 246.503390015 | 41 | 188 | UP | [102] overexpressed | oncomir |
Table 3.
Summary of statistical parameters for underexpressed and overexpressed miRNAs categorized according to three nonlinear thresholds (III, II, I). This table provides a concise comparison highlighting the differences between under- and overexpressed miRNAs across these classification levels. Notably, the most pronounced disparity is observed at the primary (I) threshold.
| Parameter | Nonlinear limit | DOWN critical | UP critical |
|---|---|---|---|
| Number of singular miRNAs | III | 786 | 607 |
| II | 615 | 378 | |
| I | 414 | 165 | |
| Number of experiments | III | 51 370 | 38 573 |
| II | 39 853 | 26 254 | |
| I | 26 235 | 13 896 | |
| Total sum of logFC | III | -51 466 | 29 037 |
| II | -45 134 | 23 071 | |
| I | -34 315 | 14 493 |
Table 4.
Summary of gene-targeted miRNA expression statistics. The first column lists gene names; the second column shows the total number of underexpressed miRNAs targeting each gene; the third column indicates the total number of overexpressed miRNAs; the fourth column provides the difference between these two sums for convenience; the fifth column represents the total number of miRNAs targeting the gene; and the sixth column gives the membership ratio (div parameter). The data illustrate how a substantial number of genes exhibit down- or up-regulation driven by the corresponding down- or up-regulation of their targeting miRNAs.
| gene | num_of_app_DOWN | num_of_app_UP | diff | summ | div |
| VAV3 | 593 | 258 | 335 | 851 | 0,393655 |
| AGO2 | 551 | 262 | 289 | 813 | 0,355474 |
| GATA6 | 439 | 207 | 232 | 646 | 0,359133 |
| MED28 | 265 | 80 | 185 | 345 | 0,536232 |
| TPM3 | 238 | 62 | 176 | 300 | 0,586667 |
| HHIP | 267 | 97 | 170 | 364 | 0,467033 |
| ATG2A | 194 | 34 | 160 | 228 | 0,701754 |
| PGPEP1 | 213 | 59 | 154 | 272 | 0,566176 |
| SLC25A45 | 166 | 22 | 144 | 188 | 0,765957 |
| gene | num_of_app_DOWN | num_of_app_UP | diff | summ | div |
| BTBD3 | 54 | 254 | -200 | 308 | -0,64935 |
| FOXN2 | 48 | 258 | -210 | 306 | -0,68627 |
| AKAP11 | 57 | 271 | -214 | 328 | -0,65244 |
| MYLIP | 73 | 289 | -216 | 362 | -0,59669 |
| CCND1 | 227 | 447 | -220 | 674 | -0,32641 |
| RAN | 45 | 267 | -222 | 312 | -0,71154 |
| INHBA | 34 | 279 | -245 | 313 | -0,78275 |
| CDKN1B | 96 | 375 | -279 | 471 | -0,59236 |
| SOX4 | 141 | 443 | -302 | 584 | -0,51712 |
| ANKEF1 | 78 | 390 | -312 | 468 | -0,66667 |
| PTEN | 39 | 433 | -394 | 472 | -0,83475 |
Table 5.
Statistical summary of genes categorized by critical thresholds for underexpressed and overexpressed groups. Notably, the number of downregulated genes is substantially lower than that of upregulated genes.
Table 5.
Statistical summary of genes categorized by critical thresholds for underexpressed and overexpressed groups. Notably, the number of downregulated genes is substantially lower than that of upregulated genes.
| Parameter | DOWN critical | UP critical |
|---|---|---|
| Number of Genes | 1922 | 1281 |
| Number of miRNAs | 151 432 | 118 108 |
| Total sum of Membership Ratios | 1106 | -731 |
Table 6.
Number of genes exhibiting near-zero average expression for each cancer type, based on miRNA expression data. Notably, certain cancer types such as PRAD, THCA, and PAAD show that nearly one-third of measured genes have negligible expression.
Table 6.
Number of genes exhibiting near-zero average expression for each cancer type, based on miRNA expression data. Notably, certain cancer types such as PRAD, THCA, and PAAD show that nearly one-third of measured genes have negligible expression.
| cancer | number_of_zero-expressed genes | sum_of_all_genes | ratio |
|---|---|---|---|
| THYM | 465 | 2890 | 0,1609 |
| KIRP | 678 | 2952 | 0,229675 |
| COAD | 670 | 2962 | 0,226199 |
| CHOL | 361 | 2869 | 0,125828 |
| BRCA | 698 | 2990 | 0,233445 |
| BLCA | 650 | 2969 | 0,218929 |
| UCEC | 620 | 2988 | 0,207497 |
| GBM | 393 | 2918 | 0,134681 |
| KICH | 547 | 2893 | 0,189077 |
| KIRC | 665 | 2988 | 0,222557 |
| HNSC | 664 | 2949 | 0,225161 |
| LIHC | 727 | 2929 | 0,248208 |
| PRAD | 975 | 2954 | 0,330061 |
| THCA | 730 | 2894 | 0,252246 |
| LUAD | 710 | 2973 | 0,238816 |
| READ | 527 | 2861 | 0,184201 |
| SARC | 552 | 2961 | 0,186424 |
| PCPG | 577 | 2894 | 0,199378 |
| PAAD | 858 | 2917 | 0,294138 |
| LUSC | 595 | 2982 | 0,199531 |
Table 7.
List of miRNAs influencing genes whose expression patterns correspond to the regulatory effects of these miRNAs. Presented here are the top 10 underexpressed and top 10 overexpressed miRNAs with the highest number of critical gene targets.
Table 7.
List of miRNAs influencing genes whose expression patterns correspond to the regulatory effects of these miRNAs. Presented here are the top 10 underexpressed and top 10 overexpressed miRNAs with the highest number of critical gene targets.
| miRNA | number_of_genes | miRNA | number_of_genes |
|---|---|---|---|
| hsa-miR-6785-5p | 64 | hsa-miR-17-5p | 61 |
| hsa-miR-149-3p | 64 | hsa-miR-93-5p | 59 |
| hsa-miR-6883-5p | 64 | hsa-miR-106b-5p | 55 |
| hsa-miR-7106-5p | 52 | hsa-miR-20a-5p | 55 |
| hsa-miR-6779-5p | 40 | hsa-miR-20b-5p | 53 |
| hsa-miR-6799-5p | 38 | hsa-miR-106a-5p | 43 |
| hsa-miR-1273h-5p | 37 | hsa-miR-92a-3p | 40 |
| hsa-miR-6825-5p | 37 | hsa-miR-130b-3p | 38 |
| hsa-miR-6780a-5p | 37 | hsa-miR-21-5p | 35 |
Table 8.
The names of miRNAs from Table 2 alongside the number of target genes whose expression is significantly altered in the presence of cancer. Panel (a) lists underexpressed miRNAs, while panel (b) lists overexpressed miRNAs. It is evident that only a small subset of underexpressed miRNAs has been studied in detail compared to a larger number of overexpressed miRNAs.
| miRNA | number_of_genes | miRNA | number_of_genes | |
|---|---|---|---|---|
| hsa-miR-1-3p | 11 | hsa-miR-17-5p | 61 | |
| hsa-miR-92a-2-5p | 10 | hsa-miR-106b-5p | 55 | |
| hsa-miR-125b-5p | 8 | hsa-miR-20a-5p | 55 | |
| hsa-miR-30a-5p | 6 | hsa-miR-20b-5p | 53 | |
| hsa-miR-483-3p | 6 | hsa-miR-106a-5p | 43 | |
| hsa-miR-23a-5p | 6 | hsa-miR-21-5p | 35 | |
| hsa-miR-874-3p | 2 | hsa-miR-16-5p | 35 | |
| hsa-miR-874-5p | 2 | hsa-miR-19b-3p | 35 | |
| hsa-miR-206 | 1 | hsa-miR-519a-3p | 27 | |
| hsa-miR-145-5p | 1 | hsa-miR-92b-3p | 24 | |
| hsa-miR-100-5p | 1 | hsa-miR-301a-3p | 22 | |
| hsa-let-7b-3p | 1 | hsa-miR-34a-5p | 20 | |
| hsa-miR-302c-3p | 17 | |||
| hsa-miR-25-3p | 16 | |||
| hsa-miR-146a-5p | 14 | |||
| hsa-miR-221-3p | 13 | |||
| hsa-miR-222-3p | 13 | |||
| hsa-miR-27a-3p | 12 | |||
| hsa-miR-181b-5p | 11 | |||
| hsa-miR-18a-5p | 10 | |||
| hsa-miR-23a-3p | 9 | |||
| hsa-miR-29b-3p | 8 | |||
| hsa-miR-182-5p | 7 | |||
| hsa-miR-24-3p | 7 | |||
| hsa-miR-106a-3p | 6 | |||
| hsa-miR-17-3p | 5 | |||
| hsa-miR-18b-5p | 5 | |||
| hsa-miR-425-5p | 5 | |||
| hsa-miR-96-5p | 5 | |||
| hsa-miR-146b-5p | 5 | |||
| hsa-miR-2467-3p | 3 | |||
| hsa-miR-19a-5p | 2 | |||
| hsa-miR-372-5p | 2 | |||
| hsa-miR-208b-5p | 2 | |||
| hsa-miR-181b-3p | 1 |
Table 9.
Example of the top ten plant miRNAs showing the largest absolute difference in average complementarity when comparing 115 underexpressed and 93 overexpressed critical human miRNAs. This selection highlights some of the most significant plant miRNAs, which could serve as promising candidates for inclusion in plant miRNA panels.
| miRNA | coefficient_similarity_up | coefficient_similarity_down | diff |
| osa-miR2920 | 0,591405 | 0,439198 | -0,15221 |
| gma-miR5379 | 0,664349 | 0,51555 | -0,1488 |
| osa-miR2921 | 0,63002 | 0,481312 | -0,14871 |
| ath-miR407 | 0,608731 | 0,4602 | -0,14853 |
| osa-miR2122 | 0,598786 | 0,460468 | -0,13832 |
| pci-miR437 | 0,617027 | 0,480315 | -0,13671 |
| aly-miR4237 | 0,59635 | 0,460316 | -0,13603 |
| gma-miR1533 | 0,509647 | 0,379024 | -0,13062 |
| bdi-miR5057 | 0,597394 | 0,467469 | -0,12993 |
| osa-miR2875 | 0,653064 | 0,524499 | -0,12856 |
| miRNA | coefficient_similarity_up | coefficient_similarity_down | diff |
| ptc-miRf12120-akr | 0,567818 | 0,680251 | 0,112433 |
| cre-miR914 | 0,460989 | 0,573858 | 0,11287 |
| ptc-miRf10479-akr | 0,493849 | 0,607797 | 0,113949 |
| ptc-miRf10488-akr | 0,529684 | 0,645046 | 0,115362 |
| ptc-miRf10495-akr | 0,486887 | 0,603567 | 0,11668 |
| osa-miR531b | 0,459638 | 0,576326 | 0,116688 |
| tae-miR2019 | 0,467059 | 0,584464 | 0,117405 |
| peu-miR2911 | 0,412766 | 0,542227 | 0,129461 |
| osa-miR1848 | 0,442845 | 0,57365 | 0,130805 |
| osa-miR531 | 0,495555 | 0,635791 | 0,140237 |
Table 10.
Examples of the top ten and bottom ten plant miRNAs ranked by the largest absolute differences in mean complementarity when comparing 786 underexpressed and 607 overexpressed human miRNAs at the III nonlinear threshold.
Table 10.
Examples of the top ten and bottom ten plant miRNAs ranked by the largest absolute differences in mean complementarity when comparing 786 underexpressed and 607 overexpressed human miRNAs at the III nonlinear threshold.
| miRNA | coefficient_similarity_up | coefficient_similarity_down | diff |
| gma-miR1533 | 0,471812 | 0,380923 | -0,09089 |
| osa-miR2921 | 0,585374 | 0,496244 | -0,08913 |
| gma-miR1528 | 0,607889 | 0,522617 | -0,08527 |
| gma-miR5379 | 0,615216 | 0,530936 | -0,08428 |
| osa-miR2920 | 0,544466 | 0,460315 | -0,08415 |
| osa-miR2923 | 0,484547 | 0,401302 | -0,08325 |
| aly-miR4237 | 0,558946 | 0,476749 | -0,0822 |
| obr-miR812 | 0,530596 | 0,451313 | -0,07928 |
| gma-miR5031 | 0,560691 | 0,481442 | -0,07925 |
| osa-miR2875 | 0,615619 | 0,537362 | -0,07826 |
| miRNA | coefficient_similarity_up | coefficient_similarity_down | diff |
| ptc-miRf10495-akr | 0,540691 | 0,595738 | 0,055046 |
| cre-miR1166.1 | 0,531196 | 0,587853 | 0,056656 |
| sbi-miR5384 | 0,459575 | 0,516659 | 0,057084 |
| cre-miR914 | 0,507068 | 0,564424 | 0,057355 |
| ptc-miRf12120-akr | 0,610406 | 0,669192 | 0,058787 |
| ptc-miRf10625-akr | 0,546155 | 0,605787 | 0,059631 |
| ptc-miRf10488-akr | 0,587835 | 0,649514 | 0,061679 |
| osa-miR531b | 0,504261 | 0,567267 | 0,063006 |
| tae-miR2019 | 0,518621 | 0,582685 | 0,064064 |
| osa-miR1848 | 0,498489 | 0,572689 | 0,0742 |
| osa-miR531 | 0,553041 | 0,627539 | 0,074498 |
Disclaimer/Publisher’s Note: The statements, opinions and data contained in all publications are solely those of the individual author(s) and contributor(s) and not of MDPI and/or the editor(s). MDPI and/or the editor(s) disclaim responsibility for any injury to people or property resulting from any ideas, methods, instructions or products referred to in the content. |
© 2025 by the authors. Licensee MDPI, Basel, Switzerland. This article is an open access article distributed under the terms and conditions of the Creative Commons Attribution (CC BY) license (http://creativecommons.org/licenses/by/4.0/).
Copyright: This open access article is published under a Creative Commons CC BY 4.0 license, which permit the free download, distribution, and reuse, provided that the author and preprint are cited in any reuse.


