
Submitted:
06 June 2025
Posted:
06 June 2025
You are already at the latest version
Abstract
Coastal wetlands, when ecologically intact, can sequester and store large amounts of carbon. Restoring degraded wetlands to full functionality is considered a nature-based solution to climate change. Reinstating ecological functionality may be achieved by installing fences to prevent access to wetlands by hard-hoofed domestic and feral an-imals. This research explores whether ungulate exclusion fencing could represent a viable investment for landholders in the Australian context if such restoration action was to attract carbon payments. Data gleaned through literature review and expert interviews about fencing requirement, contemporary costs and potential blue carbon income are consolidated into scenarios and tested using cost-benefit analysis. Monte Carlo simulations account for uncertainty of ecological and price parameters. The re-sults demonstrate that ungulate exclusion fencing may present a financially viable proposition in some circumstances and is financially risky. Investment payback period and benefit-cost ratio are found to be highly sensitive to wetlands’ carbon sequester potential, fencing costs and the carbon price going forward. Wetland-specific assess-ments are required to support landholder decisions. In general, outcome-based carbon payments on their own are likely insufficient to entice landholders to protect coastal wetlands by installing ungulate exclusion fences unless wetlands achieve high carbon sequestration rates. Measures reducing up-front costs and risk, and remuneration of multiple ecosystem services provided by wetlands are required to up-scale coastal wetland restoration through conservation fencing. The research provides an up-to-date compilation of fencing costs and the findings bear relevance for other conservation and land-use contexts which use exclusion fencing.
Keywords:
blue carbon
; wetland restoration
; landholders
; ungulates
; fencing
; cost-benefit analysis
; Monte Carlo simulations
1. Introduction
Coastal wetlands, including mangroves and salt marshes, when intact, are among the most productive ecosystems and can sequester and store large amounts of carbon (Barbier et al., 2011). “Blue carbon" is the term coined to describe the carbon stored in coastal and marine ecosystems such as mangroves, saltmarshes, seagrasses, and adjoining coastal wetlands (Sheehy et al., 2024).
Globally, and in Australia, large swathes of coastal wetlands have been lost, mostly to agriculture (Murray et al., 2022). For example, in Victoria (Australia), it is estimated that more than 50% of coastal wetlands have been lost (Boon et al., 2014).
Coastal wetlands are now recognised as playing a key role among nature-based climate solution, and restoring the functionality of degraded and historical coastal wetlands is key to upscaling their beneficial climate impact (Jones et al., 2024; Yang et al., 2025). Rehabilitation of coastal wetlands through restoration and regeneration has been shown to effectively improve biomass carbon stocks (Rogers et al., 2022). Rehabilitation can be achieved through protection of existing wetlands, and hydrological and biological restoration of degraded coastal ecosystems (Kelleway et al., 2017).
A large proportion of historical coastal wetlands in Australia are located on private land and the owners’ decisions, including the decision whether or not to restore historical wetlands, are strongly influenced by financial considerations (Bell-James et al., 2023). For wetland restoration to happen at scale, restoration needs to be not only feasible but also financially viable (Yang et al., 2025).
In 2022, the “tidal reinstatement method” was accredited as a blue carbon method under the Australian Carbon Credit Units (ACCUs) Scheme. Accreditation means that landholders who restore wetlands using this method receive ACCUs and have access to the carbon market operated through the Commonwealth Emissions Reduction Fund (DCCEEW 2023). Consequently, landholders can generate income from blue carbon if they adopt this method.
A second method for wetland restoration is “exclusion fencing”. Saltmarshes in particular are amenable for restoration using this method (Araya-Lopez et al., 2025). Exclusion fences are targeted at ungualtes. Ungulates comprise of livestock such as cattle, sheep and horses, as well as invasive hard-hoofed mammals such as feral pigs, deer, goats and water buffalo. These species cause damage to wetlands through grazing, browsing, treading, rooting and wallowing (Rowland & Lovelock, 2024). Their exclusion enables natural or assisted regeneration of wetlands to occur. Exclusion fencing has been shown to be an effective method for saltmarsh restoration in grazing lands including in Victoria. (Araya-Lopez et al., 2025; Duarte de Paula Costa et al., 2024). Exclusion fencing is not currently an accredited method.
The primary aim of the research presented here is to answer the question whether exclusion fencing for blue carbon—if it was to become an accredited method—would present a viable investment option for landholders? The research seeks to make several other contributions to the literature. It seeks to consolidate current understanding of what constitutes effective ungulate exclusion fencing and establish up-to-date cost estimates. Such information is important in other conservation contexts also. The paper also seeks to sensitivity test assumptions and explore the riskiness of investment into ungulate exclusion fencing.
The paper, after eliciting methods in Section 2, presents results in the following order: It establishes the requirements for effective ungulate exclusion fencing before presenting determinants of efficiency of exclsuion fences as a potential blue carbon method. Then in presents the results of firstly, deterministic cost-benefit analysis and, secondly, cost-benefit analysis with random continuous parameters to provide probability distributions of efficiency. Finally, the paper discusses the findings and draws conclusions about policy settings enabling ungulate exclusion fencing to become a viable investment option for private landholders.
2. Materials and Methods
3.1. Literature Review and Semi-Structured Expert Interviews
A literature review was conducted of scientific and grey literature to establish the requirements for and costs of effective exclusion fencing. Additional information was obtained through semi-structured telephone interviews conducted with fencing experts. Experts were professional fencing business operators. The interviews were non-interventionary and were therefore not subject to ethical approval. Questions sought insights into contemporary exclusion fencing practices and costs. No personal or business data were collected. Participation in the interviews was anonymous.
A list of businesses of rural fencing professionals in near-coastal locations was compiled using the fencing contractor directory (RotechRural, 2024). Of fifteen businesses contacted, seven operators were available for telephone interviews between 29-31 October 2024, including one in Tasmania, two in Victoria, two in New South Wales and two in Queensland. The seven experts conducted fencing activities covering the entire east coast of Australia, ranging from Tasmania to Cape York.
After obtaining verbal informed content and confirming that the contractor had expertise in fencing coastal wetland areas, semi-structured interviews were guided by the following questions:
- What type of fences are used in your area to exclude ungulates from riparian areas and coastal wetlands?
- What is the current approximate cost, per km of fence installed?
- What is the approximate cost of levelling / fenceline preparation?
- What factors in particular affect the cost of fencing of wetlands?
- What is the life expectancy of the fence?
- What other factors need to be taken into consideration?
Notes were taken during the interviews. The information was subsequently consolidated into a cohesive narrative.
3.1. Cost-Benefit Analysis
To gauge the economic opportunity potentially provided by an “exclusion fencing” method, cost-benefit analysis was conducted. Cost-benefit analysis is a versatile method and encompasses comparing the projected costs and benefits associated with an investment decision to determine whether the investment yields an economic benefit (OBPR, 2020). Measures obtained from the cost-benefit analysis were the benefit-cost ratio (BCR) and the payback period of investment into exclusion fencing for strategically selected exclusion fencing scenarios.
The premise of this cost-benefit analysis was twofold. Firstly, it assumed that exclusion fencing of degraded coastal wetlands would enable functional restoration of coastal wetland which would go on to achieve their blue carbon potential. Secondly, it assumed that all carbon sequestered by restored wetlands would be remunerated through the sale of ACCUs. While currently hypothetical, this opportunity may exist in the future. Ancillary benefits and costs associated with exclusion fencing were not included in the analysis.
To account for uncertainty associated with potential future income from exclusion fencing, key parameters were defined as random continuous in some scenarios. This resulted in probability functions of the BCR (Kroese & Rubinstein, 2012; Tung, 1992). In particular, the carbon sequestration rate following restoration and the annual increase in the carbon price were treated as random continuous parameters, defines as having a normal distribution ~N(,σ2) with mean value and standard deviation σ.
Probability functions of parameters values in scenarios exploring uncertainty were obtained using 1000 Monte Carlo Simulations (MCS). Dobes et al. (2021) used MCS as part of a cost-benefit analysis of fencing for water quality improvement while Hagger et al. (2024) applied MCS to account for uncertainty in the cost-benefit analysis of tidal reinstatement of coastal wetlands. The specifications of distributions associated with any given scenario are given in the Results section. The cost-benefit analysis was conducted in ©MS Excel.
The BCR achieved by the investment in fencing was calculated as the ratio between the net present value of anticipated blue carbon income (NPV_CI) from the protected wetland at a point in time and the net present value of cost of fence installation and maintenance (NPV_FC) :
Costs consisted of upfront material, machinery and labour costs associated with fence installation, and ongoing fence maintenance costs. Income was defined as the carbon sequestration rate (CSR) in tCO2e ha-1 yr-1 of the wetland multiplied by the wetland area protected by the fence (A) in ha and the carbon price (P) in $/tCO2e : A discount rate r of six percent was applied to future income and expenses.
To glean the payback period of investment, parameters were treated as deterministic. To account for uncertainty as a measure of risk associated with investment in exclusion fencing, further scenarios investigating the effect of wetland CSR on BCR assumed that CSR was a random continuous parameter:
Similarly, the carbon price was assumed to be increasing with the annual carbon increase (cpi) being uncertain. This assumption was based on past performance of the carbon price, which shows a general trend of price increase since the inception of ACCUs but high price volatility (Green Energy Regulator, 2025). The effect of defining carbon price increase as a random continuous variable is illustrated in Figure 1 for μ=10% yr-1 and σ=μ and a starting price of $35.50 per tCO2, which was the ACCU price applicable on 6th May 2025. In comparison, the price had previously exceeded $40 in November 2024 (Core Markets, 2024).
Under the stipulated uncertainty, there was a 50% probability of the nominal carbon price being in the range between $44 to $67/tCO2e after 12 years. There was a 5% probability of the future nominal carbon price experiencing a decline to $31 after 12 years and a similar probability of it exceeding $90 after 12 years. For each scenario under investigation in the cost-benefit analysis, the assumptions defining the parameter uncertainty are stipulated.
3. Results
The effectiveness of a fence is conditional upon “appropriate construction, regular maintenance, frequent monitoring for breaches and quick action to remove any animals that break through” (Braysher, 2017, p. 89).
3.1. Effective Exclusion Fencing
3.1.1. Fence Construction
Exclusion of ungulates species from wetland areas can be achieved through a variety of fence types, with different wire and netting options for different purposes.
- Mesh netting: There are many prefabricated designs that are quick to erect and act as a physical barrier to domestic, feral and native animal movement. Mesh netting can come with skirting (‘apron’) which is designed to stop animals from digging underneath. Mesh netting comes in different heights and mesh openings. Mesh openings tend to be graduated, with larger openings higher on the mesh and smaller vertical openings towards the bottom of the mesh.
- Barb wire: Sharp barbs act as a deterrent if animals push up against the fence. Non-mesh cattle fences often consist of 5-7 strands of barb wire.
- High tensile plain wire is often added above mesh netting to support the strength of mesh fences. It is required where fences span over waterways.
- Electric fencing uses plain wire which carries a sufficient electric current to induce avoidance behaviour in animals. Electric fences are typically arranged as multiple strands of plain wire of which multiple strands carry electricity while the other strands act as earth wires. Insulator posts are required. Electric fences can be combined with mesh or barb wire fences in the form of outriggers. Electric fences need to be continuously charged at between 5000 to 10,000 volts to prevent animals pushing through or rubbing. Electric fences are cheaper to build than wire mesh fences but are less effective in most situations due to vegetation growth; they also require more monitoring effort (Long & Robley, 2004).
Fencing wires and netting require regular posts to hold them up, and strainer posts and stays to tension the wire. Fence posts are typically spaced between three and five meters apart. The material of fence posts is typically timber or steel. Consistency of the ground is important when choosing post materials. Timber is unsuitable for rocky ground. Steel tends to have a longer life expectancy compared to timber in most situations.
3.1.2. Matching Fence Type to Ungulates
Exclusion fences are barrier fences. They are intended to keep out particular species and must therefore be designed with the physical characteristics and abilities of those species in mind, including their size, ability to jump, dig, climb and bite through different fences (Dickman, 2012). The behaviours of species, e.g. whether they bury under, push through or jump over, determine design characteristics of the fence designed to exclude them.
Key design aspects are height of the fence, type of wire and the layout of the fence, e.g. whether an apron is required. Table 1 provides an overview of ungulate-specific fence design recommendations.
Among species-specific fencing requirements deer, goats and pigs have the most demanding requirements (Lemcke, 2017; Macalister & Butler, 2015; Mitchell, 2011; Sailer, 2006):
- Deer have the ability to jump high fences. Where deer are to be excluded, extra fence height is required, with a minimum height of 1.8 to 2.0 m recommended. Maximum mesh size for red deer (Cervus elaphus) is 300 x 200 mm for fallow deer (Dama dama) 200 x 200 mm (Forsyth, 2023).
- Feral goats can pass over, through or under fences. Height recommendations range from 1.1 to 1.3 m. External diagonal bracing posts are to be avoided as they assist goats climbing over fences. Mesh size of 150 x 150 mm is deemed adequate. Any gap between the ground and fence should be no more than 80 mm. A strand of barbed wire on the bottom is recommended to prevent goats getting under the fence. Fences with aprons are also suitable.
- Feral pigs preferably pass through or dig under fences. Fence height recommendations vary from 0.9 to 1.2 m. Posts should be no more than 5 m apart. Mesh fence with aprons is recommended. Pigs will seek to break through fences in particular if a high value food or water resource is on the other side (HCPSL, 2017; Mitchell, 2011).
- Water buffalo are prevalent across coastal areas of the Northern Territory. Most fencing designed for cattle is suitable for buffalo but fences need to be well designed and maintained as buffalo tend to tackle sub-standard fences with their horns.
In Australia, at any given location, one can expect the presence of multiple ungulate species. An ungulate-proof fence therefore “must include a mesh size to exclude the smallest species, a fence height to exclude the most agile jumper or climber, and have the material strength to withstand the most powerful species” (Macalister & Butler, 2015, p. 16). Guidelines for riparian fencing are highly relevant in the context of coastal wetland fencing (DELP, 2015) as are detailed guidelines for exclusion fencing (Giumelli & White, 2016). Fence manufacturers provide detailed technical explanations, specifications and illustrations (e.g., Landmark, 2018; Southern Wire, 2022; Waratah, 2018; Westonfence, 2022).
3.1.3. Measures Supporting the Effectiveness of Exclusion Fences
Key measures supporting effectiveness of fences include siting, fenceline preparation and monitoring, and initial and ongoing removal of ungulates.
Spatial design aspects have a large bearing on the efficiency of exclusion fences. In particular, the perimeter-to-area ratio is an important predictor of efficiency. The shorter the fence perimeter length is in relation to the area protected, the higher the benefit-cost ratio (Bode et al., 2012; Bode & Wintle, 2010). Square or rectangular fence designs are more efficient than fences which meander around an irregularly shaped wetland. Ideal perimeter-to-area ratio is moderated by multiple considerations which come into play regarding where to site an exclusion fence.
Siting of an exclusion fence is ultimately dictated by the terrain surrounding the wetland. Straight lines following ridgelines or along roadsides are preferable. Straight lines are easier to construct than lines with corners, they are more effective (as they can be more highly strained) and more easily maintained. Where possible, fences should be located out of flood zones, especially where there is likely to be fast-flowing water (Carey et al., 2015; DELP, 2015). Soil type and environmental conditions influence the type of post materials to be used. For example, steel posts may be required for rocky areas and post holes may have to be predrilled for wooden posts. In sandy and soft soil, extra-long posts may be required to ensure fence stability. Hot-dipped galvanised steel is significantly more durable than untreated structural steel and only slightly more expensive. In wet and saline conditions the corrosion-resistance of stainless steel ensures superior longevity but at four to five times the cost (GAA, 2022).
Fenceline preparation is essential. Prior to fence installation, a corridor needs to be prepared for the fenceline and for access. Fenceline preparation requires various amounts of land clearing and levelling. “Effective exclusion fences rely on well-prepared and graded fence lines, with no dips or hollows, and a wide cleared area on either side to reduce damage from branches, improve fence visibility and access for maintenance” (Giumelli & White, 2016, p. 7). Clearing and levelling is recommended practice to regulate fence distance to ground level. General recommendations also include the removal of platforms (rocks, stumps) on the outside of the fence which may act as a platform for ungulates to jump the fence. Removal of tree limbs overhanging the fence to prevent foreseeable damage to the fence. State-specific guidelines exist which govern the clearing of native vegetation for this purpose
Monitoring and maintenance are paramount for the long-term effectiveness of a newly constructed ungulate-proof fence (Long & Robley, 2004). “A good maintenance and monitoring program will detect the breach immediately upon its occurrence, will have people and resources in place to make emergency repairs, and will have reduced the likelihood of animals entering when a breach occurs” (Young, 2013, p. 17). When damage to a fence occurs, e.g. through tree fall, flood damage or animal impact, it needs to be swiftly repaired. Once a fence is compromised, ungulates—especially pigs—have been found to quickly reinvade and cause the same level of damage, or potentially worse damage, as if the fence did not exist (Negus et al., 2019).
Adequate ongoing resources need to be available to support monitoring and maintenance, and the control or removal of stray ungulates.
Ungulates need to be eliminated from the protected wetlands after an exclusion fence is first constructed; thereafter an ungulate-free status needs to be maintained. On typical coastal farms in south-eastern Australia, removal of stray farm animals from protected wetlands does not pose a particular problem. Removal of feral ungulates may be more problematic, specifically in large wetland areas (Macalister & Butler, 2015). Depending on the species and the size of the wetland area, ungulate removal techniques may include aerial shooting, ground hunting and trapping (Ens et al., 2016). It may possibly include poisoning of feral pigs(Mitchell, 2011). . Though controversial, aerial shooting remains the key control tool for managing, in particular, water buffalo, feral horses and feral deer in Australia (Brown, 2019; Chung, 2023).
Common areas of interaction are the points where people access or transition fences. These are considered weak points (Long & Robley, 2004). Gates carry a distinct risk of being left open, with open gates facilitating ungulate incursions. Installing cattle grids instead of gates can mitigate against this risk but effective grids are more expensive to install. Damage can be caused by animal interaction with the fence, vandalism, or natural events such as floods and windstorms. Fences also deteriorate over time, particularly in saline coastal conditions and if poorly maintained. Any management plan for ungulate exclusion fences thus needs to include an element addressing the recurring removal of stray ungulates before they cause wetland damage.
3.2. Factors Impacting the Efficiency of Exclusion Fencing
Efficient fencing requires evaluation of firstly, the range of potential fencing options and secondly, whether fencing is the best investment solution within a set of economic, ecological, social and institutional constraints (Bode et al., 2012). For private landholders, the decision whether to implement conservation land uses is strongly influenced by the expected return on investment (Boyd et al., 2015). The question thus arises, under what circumstances would it be efficient for landholders to invest in ungulate exclusion fencing if, subsequently, they were eligible to earn income from carbon credits for the CO2 sequestered? To be economic, at a minimum, income from carbon credits earned by the protected wetland would have to pay back the cost of exclusion fencing within the economic lifetime of the fence.
3.2.1. Monetary Benefits From Blue Carbon
The target benefit of wetland exclusion fencing is to realise the blue carbon potential of coastal ecosystems by selling accredited carbon units. The associated financial benefit could then be quantified as the ACCUs issued for the area protected, multiplied by the ACCU price (equ 2). The second component of blue carbon income is the amount of carbon sequestered from the atmosphere and stored by the wetland. The unit measurement for CSR is tCO2e ha-1 yr-1.
Establishing the ability of coastal wetlands to sequester and retain carbon is the focus of much contemporary research (Duarte de Paula Costa et al., 2022; Hagger et al., 2022; Lovelock et al., 2023; Quevedo et al., 2023; Stewart-Sinclair et al., 2024). Estimates of CSR differ for different types of coastal wetlands and there is high variability within the estimates for each type of ecosystem. International research indicates that carbon sequestrations rates are particularly high for saltmarsh ecosystems globally (RAE, 2024) which achieve an estimated 8.0 ± 8.5 tCO2e ha-1yr-1. In the Australian context, estimates for CSR range from 1.17 tCO2e ha-1 yr-1 in temperate Western Australian saltmarshes (Gorham et al., 2021) to 2.01 tCO2e ha-1 yr-1 in temperate Victorian locations (Macreadie et al., 2017) 9.3 tCO2e ha-1 yr-1 for tropical locations (Ouyang & Lee, 2014).
3.2.2. Monetary Cost of Fencing
Installation of an exclusion fence is a non-trivial and expensive activity. There are initial capital investment costs and ongoing costs after the fence is erected. As evident from the previous exploration, cost categories include:
- Routing of the fenceline and groundwork preparation determine the fence-to-area ratio; they also facilitate access for fence construction and ensure gap-free placement for maximum fence effectiveness.
- Material per-meter costs are principally determined by the choice of the fence design and configuration: Wire, posts and strainers are major components of the material cost aspect. Additional material costs are incurred for gates, cattle grids and swing netting required for waterway crossings.
- Installation costs: It can take a crew of three people two days to erect one km of netted fenceline; specialised machinery or people power may be required to drive posts.
- Maintenance costs are associated with regular inspections to identify any damage or breaches and reinstate fence effectiveness. Vegetation management may be required to retain access to the fence and prevent potential damage to the fence.
- Costs associated with supplementary activities are associated with a suite of integrated control measures for ungulate control. Removal of livestock and feral ungulates straying into the exclusion area is required.
Cost estimates for exclusion fencing in the literature are rare and case specific. For example, Reef Catchments (2023) puts the cost of installing one km of permanent mesh pig exclusion fence at approximately $18,000 km-1 with an additional annual fence maintenance cost of 2% of construction cost ($360 km-1 yr-1). Other sources suggest that the material costs for rural fences can be between $60 to $80 m-1, with prices potentially rising to $150 m-1 when installation is difficult (Fencing Quotes Online, 2024). Dickman (2012), over a decade ago, estimated material cost of conservation fencing to be between $6000 to $30,000 km-1 with cost differences based on fence configuration, location, substrate and topography.
Pertinent cost information obtained from semi-structured interviews conducted with fencing experts is summarized in Table 2.
As a guideline, per-km fencing costs were estimated to be in the range of $20,000 to $50,000 and experts agreed that in coastal conditions, the economic lifetime of an exclusion fence—and consequently investment payback period—was 10 years.
* all costs are in Australian $ and current in October 2024.
3.2.3. Additional Considerations About the Benefits and Costs of Ungulate Exclusion Fences
While ancillary benefits and costs of exclusion fences are not considered in the cost-benefit analysis presented in this research, they do warrant mentioning.
Wetlands provide a multitude of ecosystem services which benefit not only landholders but spill over to benefit society as a whole (Barbier, 2019). Monetary remuneration derived from the ability of wetlands to sequester (more) carbon may provide the financial justification for installing exclusion fences, but diverse additional benefits ensue.
The ‘total economic value’ framework conceives the totality of ecosystem services provided by natural assets such as wetlands through the lens of use values and non-use values (Delle Grazie & Gill, 2022). For any given wetland, use values can encompass extractive uses such as fishing or angling, and non-extractive uses such as bird watching. Non-use values include climate regulation, aesthetic value and existence value. The installation of ungulate exclusion fences is likely to enhance all ecosystem services provided by coastal wetlands and thus generates benefits across multiple use and non-use values.
Wetlands hold particular significance for indigenous peoples (Verschuuren, 2006). Many wetlands have significance as ceremonial and initiation sites, traditional hunting and gathering grounds and as boundary markers (Ens et al., 2016). Groom et al. (2023) explore the sociocultural values in the context of the extensive coastal wetlands which exist in the Northern Territory, where the majority of coastal and near-coastal land is owned, managed or co-managed by Aboriginal people and any benefits from coastal wetland improvement accrue to Aboriginal communities. Here, many ungulate species have invaded coastal wetlands and cause extensive environmental damage. This includes feral pigs, cattle and goats, buffalo, horses and donkeys (Equus asinus). Sociocultural benefits accrue to traditional owners from the improvement of ecological condition of wetlands (Pert et al., 2020). Exclusion fences can safeguard important cultural assets and food sources.
Among the traditional owners of country divergent views exist as ungulates have different cultural, spiritual, financial and food values (Ens et al., 2016). The authors cite research by Robinson et al. (2005) which reports that the Jawoyn people consider buffalo a source of bush meat and horses a bush pet, and thus have a preference for retaining these species in the landscape, while regarding pigs a pest species and wanting to see them removed.
Wellbeing benefits to traditional owners from exclusion fencing projects are maximised when such projects deliver ongoing ecocultural benefits, including employment benefits and associated income. Activities including fence maintenance, and ungulate tracking, removal and culling present an employment opportunity for remotely located traditional owner communities. Income for the provision of such environmental services have been shown to make a large positive contribution to the wellbeing of traditional owner communities (Davies et al., 2010; Greiner & Stanley, 2013; Greiner et al., 2012).
Exclusion fences can have unintended consequences for non-target species, which need to be considered in the design and implementation phase. Commonly reported impact on non-target species include entanglement, barrier to movement or migration, and behavioural change (Mitchell, 2011; Smith et al., 2020). Key ecological considerations regarding exclusion fencing include:
- Fences per se do not reduce the populations of ungulate pest animals. Fencing one area can result in increased grazing pressure and impact in other areas.
- Fences present barriers to the movements of non-target species. Fences can disrupt migration pattern of native fauna and cause behavioural change. Fencing contractors reported options for installing ‘gates’ in the fence or pieces of poly pipes below the fence to facilitate the movement of small native fauna such as fish, platypuses and turtles (Waltham et al., 2022). However, no similar solutions exist for larger marsupials and dingos.
- Flying and gliding fauna such as bats and gliders are particularly prone to getting entangled in barb wire. For this reason, the use of plain top wires is recommended and, according to the fencing contractors, used in most conservation fences.
3.3. Payback Time for Investment in Exclusion Fencing
Fencing incurs up-front costs for materials, machinery and labour, and ongoing costs for maintenance. Potential carbon income only accrues after fences are installed. Cost-benefit analysis explores how key cost and income variables impact the BCR to estimate how quickly income from the carbon sequestered by protected wetlands would repay the investment. Three cost scenarios and three CSR scenarios are explored. Figure 2 illustrates the results.
Three cost scenarios represent the range of stipulations provided by fencing contractors: $20,000, $30,000 and $50,000 km-1 for different types of material requirements depending on ungulate species to be excluded, difficulty of terrain and types of materials used. Annual maintenance costs of 2% of installation costs apply. CSR=5 tCO2e ha-1 yr-1 for the wetland enclosed by the fence. Cpi=5%.
Three CSR scenarios represent the estimates in the literature, ranging from 2 tCO2e ha-1 yr-1 (Macreadie et al., 2017) to 9.3 tCO2e ha-1 yr-1 (Ouyang & Lee, 2014). A further scenario of 5 tCO2e ha-1 yr-1is included. The cost of fencing is assumed to be $30,000 km-1.
If the installation of the exclusion fence costs $30,000 km-1, payback is achieved in year 12, which is just outside the target 10-year range for payback stipulated by fencing experts. If the fence installation cost is reduced to $20,000 km-1, the payback period is reduced to seven years with the BCR>2 in year 13. High installation costs of $50,000 km-1 see the payback period extended to beyond 20 years.
For a fencing cost of $30,000 km-1, scenario CSR=9.3 tCO2e ha-1 yr-1 achieves payback in year 5 with BCR>2 after 13 years. In the scenario with low sequestration rate, at the assumed fencing costs, BCR remains <1 for the entire 25 years shown.
This means that, ceteris paribus, combinations of fencing cost < $30,000 km-1 and CSR>5 tCO2e ha-1 yr-1 are likely to provide for financially viable investment.
3.4. BCRs Under Uncertainty
In reality, landholders are faced with an investment decision under risk and the question thus becomes “What is the likelihood that carbon payments pay back the investment in exclusion fencing within 10 years?” The following scenarios show probability functions of BCR for uncertain future carbon price and uncertain CSR achieved by the protected wetland, as modelled by 1000 MCS.
Figs 3 depicts the probability curves the BCR in year 10 for different CSR levels.
In scenario CSR=2 ± 1 tCO2e ha-1 yr-1 there is zero probability of cost payback after 10 years and a 50% likelihood of paying back 50% of fencing cost.
In scenario CSR=5 ± 3 tCO2e ha-1 yr-1 the probability of payback is 76% and there is a 2% probability of BCR≥2.
In scenario CSR=9 ± 5 tCO2e ha-1 yr-1 cost payback is certain to be achieved after 10 years. This scenario has an 65% likelihood of BCR≥2 after 12 years, a 12% likelihood of BCR≥3 and a 1% likelihood of BCR≥4. This means, such scenario assumptions may represent financially attractive conditions for investment in exclusion fencing for blue carbon..
Fencing costs are upfront costs and thus not subject to future uncertainty. However, it is still important to understand how the BCR for different levels of fencing cost responds to uncertainty of carbon price and CSR. This is achieved by using MCS to test the same three scenarios explored in Section 3.3. The results are illustrated in Figure 4.
Under the given assumptions, there is a 98% probability of cost payback after 10 years for the $20,000 km-1 cost scenario. This scenario is associated with a 39% probability of BCR>2 and 3% probability of BCR>3 after 10 years.
Probability of cost payback after 10 years for the $30,000 km-1 cost scenario is 76%.
Probability of cost payback after 10 years for the $50,000 km-1 cost scenario is 12%, meaning it is unlikely but not impossible for fencing to be viable under this combination of assumptions.
The above results indicate that ceteris paribus fencing cost payback is achievable from carbon payments in situations where protected wetlands achieve medium to high rates of carbon sequestration. However, for low-CSR wetlands the case for investment in exclusion fencing in the scenarios explored above is unfavourable. Australia’s temperate zone saltmarshes have estimated sequestration rates of 2 tCO2e ha- yr1 (Macreadie et al., 2017) and thus fall into this category.
To explore the interrelationship between carbon price and fencing cost for low-CSR wetlands, further scenarios are explored using MCS for CSR=2 ± 1 tCO2e ha-1 yr-1.
Two levels of carbon price rise are investigated, at 10 and 15% yr-1 mean price increase across the 1000 MCS, with σ=μ. The higher level of price increase represents a more optimistic outlook for the carbon price, but also a riskier one.
Low fencing costs of $20,000 km-1 are assumed. A very-low-cost scenario is also introduced: Fencing costs of $10,000 km-1 may apply where only domestic grazing animals such as cattle, sheep and/or horses have to be excluded and where existing fences can be retrofitted to ensure effective exclusion. Figure 5 illustrates the resulting BCR estimates.
More favourable carbon price development (cpi=15%±15%) increases the likelihood of cost payback within 10 years from 11 to 44 percent; halving fencing costs to $10,000 km-1 increases likelihood of cost payback to 95 percent. This means the key to viable exclusion in low-CSR wetlands is to keep fencing costs low.
4. Discussion
The research presented above gauges the economic opportunity which ungulate exclusion fencing for blue carbon may present. The exploration is hypothetical and general in nature and multiple assumptions apply.
The premise of the cost-benefit analysis consists of two parts. Firstly, it assumes that installing ungulate exclusion fencing around degraded coastal wetlands will enable functional restoration and wetlands will subsequently achieve their blue carbon potential. In reality, full recovery of carbon sequestration may take decades to achieve (Yang et al., 2025). Secondly, it assumes that all carbon sequestered by protected wetlands is remunerated through the sale of ACCUs. This premise is also optimistic in that carbon payments—in Australia and elsewhere—are subject to additionality conditions (Assmuth et al., 2024) (Clean Energy Regulator, 2025), meaning that restoring highly degraded wetlands will likely result in more ACCUs issued per area unit than if that same wetland was protected when relatively intact. Additional matters affecting profitability and risk of ungulate exclusion fencing for blue carbon include definitions of property rights, and determinations regarding leakage and permanence (Thamo & Pannell, 2016).
By combining literature research and expert interviews, this research achieves a systematic and comprehensive depiction of factors determining both the effectiveness and efficiency of exclusion fencing. Fencing is a vital element of many conservation activities, whether the primary objective is biodiversity conservation or carbon sequestration. While seemingly banal, there are many factors to consider in the siting of fences, fenceline preparation, choice of fence type and materials, and how to deal with ‘weak points’, all of which determine fence functionality and cost. The up-to-date compilation of costs is useful for other researchers who seek to assess the financial net-benefits of conservation measures or land-use options involving the installation of fences. Recently used fencing cost estimates of $15 m-1 (Araya-Lopez et al., 2025; Carnell et al., 2022) refer to the pre-COVID era and, given large cost increases in intervening years, are no longer generally applicable and overestimate the viability of tested carbon methods.
Within the scope of the analysis, the results illustrate that ungulate fencing for blue carbon may present a viable, even lucrative, investment option under certain circumstances, specifically in the case of wetlands with high carbon sequestration potential (Zhang et al., 2025). In contrast, for wetlands with low carbon sequestration potential, income from blue carbon alone is unlikely to pay back the investment in ungulate exclusion fencing in most situations. Similar findings were made for saltmarshes in Scotland (Muenzel & Martino, 2018). In such situations, to make it financially viable to protect coastal wetlands, landholders will require additional incentive payments so that a business case can be built (Selinske et al., 2022). Additional payments may take the form of grant payments which reduce the up-front cost of fencing and/or additional remuneration for other ecosystem services provided by protected wetlands, such as biodiversity improvements (Fernandez, 1999; Milne et al., 2024). Remunerating multiple ecosystem services is called bundling or stacking (Torabi & Bekessy, 2015). Programs also exist where social co-benefits of wetland restoration and protection are remunerated to generate sustainable livelihoods for traditional owners (Social Carbon, 2025).
When interpreting the results of the cost-benefit analysis it is further important to note that any other costs which may arise from installing ungulate exclusion fencing for blue carbon were considered outside the scope of this analysis. Additional costs result in a lower BCR. Additional private costs may arise, for example, in the form of opportunity costs from lost income in the case where saltmarshes were previously used for agricultural production, e.g. from cattle grazing. There are also transaction costs to consider when participating in carbon sequestration programs, e.g. brokering costs associated with the project being managed by specialised companies (Cacho et al., 2013), with brokers and traders charging between 5 and 20% share of carbon credits as commission.
While the MCS-based simulations account for some elements of risk, there are additional sources of risk which are not considered in the analysis. In particular, with climate change the risk that exclusion fences may be severely impacted, even destroyed, by natural events such as severe flooding or wildfire is increasing (Garcia et al., 2021), resulting in additional cost for fence replacement and threating income streams from carbon.
The scenarios chosen in this analysis and assumptions applied are general in nature and seek to explore a realm of potential situations which broadly represent the Australian coastal context. The resulting BCR estimates are therefore purely illustrative in that they provide insights into the relative importance of key assumptions on the hypothetical efficiency of ungulate exclusion fencing for blue carbon. Anybody who considers undertaking ungulate exclusion fencing for blue carbon—if and when this becomes an approved method for earning ACCUs—is strongly advised to undertake a cost-benefit analysis that is tailored to their individual situation. Landholders should also carefully explore multiple dimensions of uncertainty in their unique business context and give consideration to personal risk preferences, among other things.
5. Conclusions
This research set out to generate insights into the financial viability of exclusion fencing of coastal wetlands for blue carbon in the Australian context. In particular, it sought to answer the question: Would investment in exclusion fencing for blue carbon provide a viable financial proposition for coastal landholders if such a method existed?
The research combines literature review, empirical research and cost-benefit analysis to answer the question. In doing so, it delivered multiple novel insights into exclusion fencing. In particular, the research:
- Defines a conceptual framework for exclusion fencing based on the notions of effectiveness and efficiency;
- Articulates technical and material requirements of effective exclusion fencing for different ungulates;
- Provides insights into the options and complexity of decisions associated with the installation of exclusion fences, and associated costs;
- Compiles a systematic and contemporary understanding of material and installation costs of exclusion fencing in different coastal conditions; and
- Provides quantitative estimates of the BCR of exclusion fencing for blue carbon under uncertainty for a range of scenarios which broadly represent the Australian conditions.
Exclusion of ungulates from coastal wetlands is feasible, provided that fences are effective. What species of ungulates are to be excluded determines many material, design and construction aspects of fences. Effectiveness also requires ongoing monitoring and fence maintenance.
Efficiency of exclusion fencing is determined by income achieved relative to investment cost and ongoing expenses. Income from carbon depends on the carbon price and how much carbon protected wetlands can sequester. Historically, the carbon price has increased but has been volatile. The CSR depends, in particular, on the type of wetland and locality of the wetland, and is subject to variability. Per-kilometer costs associated with exclusion fencing are dependent on multiple variables including, but not limited to, materials required, length of fenceline, and terrain and ground conditions. Ongoing monitoring and maintenance incur further costs. There has been a steep increase in fencing costs and further increases are expected into the future. Efficiency is further determined by variables such as perimeter-to-area ratio. A condition of efficiency is that reinvasion of the wetland by ungulates is avoided.
Ungulate exclusion fencing for blue carbon can, conceivably, be a profitable investment option for landholders. This means ungulate exclusion fencing can be added to a portfolio of nature based solutions which can plausibly generate a viable income stream from blue carbon (Friess et al., 2022). Though, in many situations bundling of ecosystem services may be required for exclusion fencing to be a viable investment for private landholders. Schemes which use common asset trusts can effectively bundle payments, provide more certainty for landholders and aggregate investor interests (Canning et al., 2021).
In terms of risk, it is also important to consider that wetlands themselves are subject to the impacts of climate change, with implications for the expected lifetime of fence infrastructure and ecological functions including carbon sequestration (Saintilan et al., 2019). To de-risk ungulate exclusion fencing and maximise landholder participation in wetland regeneration and protection through ungulate exclusion, additional incentives may be required.
Further research is required to explore provide a more nuanced understanding of ungulate exclusion fencing for blue carbon. It is currently unknown how landholders may think about the potential opportunity. Ex-ante empirical research with landholders (Schulze et al., 2024) can deliver insights into the monetary and non-monetary dimensions associated with participation in such novel environmental programs and critically support policy and incentive design.
Funding
This research was funded by BHP. Deakin University contracted River Consulting Pty Ltd to undertake the research.
Institutional Review Board Statement
N/A.
Informed Consent Statement
Verbal informed consent was obtained from fencing experts contacted before any questions about fencing requirements and costs were asked. Human ethics approval was not required as no information about the respondents or their businesses was collected.
Data Availability Statement
All data used to support the cost-benefit analysis are reported in this paper.
Acknowledgments
Dr Melissa Wartman provided project management in the early phases of the research.
Conflicts of Interest
The author declares no conflicts of interest. The funder had no role in the design of the study; in the collection, analyses, or interpretation of data; in the writing of the manuscript; or in the decision to publish the results.
Abbreviations
The following abbreviations are used in this manuscript:
| ACCU | Australian Carbon Credit Unit, also referred as a carbon credit |
| BCR | Benefit-cost ratio |
| cpi | Carbon price index |
| CSR | Carbon sequestration rate |
| MCS | Monte Carlo Simulations |
References
- Araya-Lopez, R., Possignham, H. P., Wartman, M., Macreadie, P. I., & Duarte de Paula Costa, M. (2025). Prioritizing tidal marsh restoration in grazing lands. Journal of Environmental Management, 380, 124952. [CrossRef]
- Assmuth, A., Autto, H., Halonen, K.-M., Haltia, E., Huttunen, S., Lintunen, J., Lonkila, A., Nieminen, T. M., Ojanen, P., Peltoniemi, M., Pietilä, K., Pohjola, J., Viitala, E.-J., & Uusivuori, J. (2024). Forest carbon payments: A multidisciplinary review of policy options for promoting carbon storage in EU member states. Land Use Policy, 147, 107341. [CrossRef]
- Barbier, E. B. (2019). The Value of Coastal Wetland Ecosystem Services. In G. M. E. Perillo, E. Wolanski, D. R. Cahoon, & C. S. Hopkinson (Eds.), Coastal Wetlands (2nd Edition) (pp. 947-964). Elsevier. [CrossRef]
- Barbier, E. B., Hacker, S. D., Kennedy, C., Koch, E. W., Stier, A. C., & Silliman, B. R. (2011). The value of estuarine and coastal ecosystem services. Ecological Monographs, 81(2), 169-193. [CrossRef]
- Bell-James, J., Fitzsimons, J. A., & Lovelock, C. E. (2023). Land Tenure, Ownership and Use as Barriers to Coastal Wetland Restoration Projects in Australia: Recommendations and Solutions. Environmental management, 72(1), 179-189. [CrossRef]
- Bode, M., Brennan, K. E., Morris, K., Burrows, N., & Hague, N. (2012). Choosing cost-effective locations for conservation fences in the local landscape. Wildlife Research, 39(3), 192-201. [CrossRef]
- Bode, M., & Wintle, B. (2010). How to build an efficient conservation fence. Conservation Biology, 24(1), 182-188. [CrossRef]
- Boon, P., Allen, T., Carr, G., Frood, D., Harty, C., McMahon, A., Mathews, S., Rosengren, N., Sinclair, S., White, M., & Yugovic, J. (2014). Coastal wetlands of Victoria, south-eastern Australia: Providing the inventory and condition information needed for their effective management and conservation. Aquatic Conservation: Marine and Freshwater Ecosystems, 25. [CrossRef]
- Boyd, J., Epanchin-Niell, R., & Siikamäki, J. (2015). Conservation planning: a review of return on investment analysis. Review of Environmental Economics and Policy, 9(1). [CrossRef]
- Braysher, M. (2017). Managing Australia's pest animals: a guide to strategic planning and effective management. CSIRO Publishing.
- Brown, C. (2019). Aerial shoot sets sights on 20,000 feral animals roaming southern Arnhem Land. ABC News. https://www.abc.net.au/news/rural/2019-07-06/first-aerial-shoot-for-south-east-arnhem-land-ipa/11281602?utm_campaign=abc_news_web&utm_content=link&utm_medium=content_shared&utm_source=abc_news_web.
- Cacho, O. J., Lipper, L., & Moss, J. (2013). Transaction costs of carbon offset projects: A comparative study. Ecological Economics, 88, 232-243. [CrossRef]
- Canning, A. D., Jarvis, D., Costanza, R., Hasan, S., Smart, J. C. R., Finisdore, J., Lovelock, C. E., Greenhalgh, S., Marr, H. M., Beck, M. W., Gillies, C. L., & Waltham, N. J. (2021). Financial incentives for large-scale wetland restoration: Beyond markets to common asset trusts [Review]. One Earth, 4(7), 937-950. [CrossRef]
- Carey, B., Stone, B., Norman, P., & Shilton, P. (2015). Chapter 14: Property infrastructure. In Soil conservation guidelines for Queensland. 3rd ed. Department of Science, Information Technology and Innovation. https://www.publications.qld.gov.au/dataset/soil-conservation-guidelines.
- Carnell, P., McLeod, R., Young, M., Gillies, C., Obst, C., Macreadie, P., Ierodiaconou, D., Reeves, S., Eigenraam, M., Janes, H., Kelvin, J., & Nicholson, E. (2022). Prioritising the restoration of marine and coastal ecosystems using ecosystem accounting. https://www.researchsquare.com/article/rs-1617940/v1.
- Chung, L. (2023, October 4, 2023). Why shooting fearal animals from the sky might be the best way to protect ecosystems. The Sydney Morning Herald.
- Clean Energy Regulator. (2025). Using an ACCU Scheme project to meet regulatory requirements. Austrlian Government. Retrieved 03/06/2025 from https://cer.gov.au/schemes/australian-carbon-credit-unit-scheme/how-to-participate/apply-to-participate/newness-regulatory-additionality-and-government-program-requirements/using-accu-scheme-project-to-meet-regulatory-requirements.
- Core Markets. (2024). ACCU spot price chart. Retrieved 4 November 2024 from https://coremarkets.co/resources/market-prices.
- Davies, J., Campbell, D., Campbell, M., Douglas, J., Hueneke, H., LaFlamme, M., Preuss, K., Walker, J., & Walsh, F. (2010). Livelihoods inLand: promoting health and wellbeing outcomes from desert Aboriginal land management (DKCRC Report 78, Issue. Desert Knowledge C. R. Centre.
- Delle Grazie, F. M., & Gill, L. W. (2022). Review of the ecosystem services of temperate wetlands and their valuation tools. Water, 14(9), 1345. [CrossRef]
- DELP. (2015). Guidelines for riparian fencing in flood-prone areas L. Department of Environment, Water & Planning. www.water.vic.gov.au/__data/assets/pdf_file/0040/669595/guidelines-for-riparian-fencing-in-flood-prone-areas.pdf.
- Dickman, R. D. (2012). Fences or ferals? Benefits and costs of conservation fencing in Australia. In M. J. Somers & M. W. Hayward (Eds.), Fencing for conservation: Restrictions of evolutionary potential or a riposte to threatening processes? (pp. 43-64). Springer. [CrossRef]
- Dobes, L., Crane, M., Higgins, T., Van Dijk, A. I., & Lindenmayer, D. B. (2021). Increased livestock weight gain from improved water quality in farm dams: A cost-benefit analysis. PloS one, 16(8), e0256089. [CrossRef]
- Duarte de Paula Costa, M., Lovelock, C. E., Waltham, N. J., Moritsch, M. M., Butler, D., Power, T., Thomas, E., & Macreadie, P. I. (2022). Modelling blue carbon farming opportunities at different spatial scales. Journal of Environmental Management, 301, Article 113813. [CrossRef]
- Duarte de Paula Costa, M., Wartman, M., Macreadie, P. I., Ferns, L. W., Holden, R. L., Ierodiaconou, D., MacDonald, K. J., Mazor, T. K., Morris, R., Nicholson, E., Pomeroy, A., Zavadil, E. A., Young, M., Snartt, R., & Carnell, P. (2024). Spatially explicit ecosystem accounts for coastal wetland restoration. Ecosystem Services, 65, 101574. [CrossRef]
- Ens, E., Daniels, C., Nelson, E., Roy, J., & Dixon, P. (2016). Creating multi-functional landscapes: Using exclusion fences to frame feral ungulate management preferences in remote Aboriginal-owned northern Australia. Biological Conservation, 197, 235-246. [CrossRef]
- Fencing Quotes Online. (2024). Rural fencing services. Retrieved 15 October 2024 from https://fencingquotesonline.com.au/fence-types/rural-fencing/.
- Fernandez, L. (1999). An analysis of economic incentives in wetlands policies addressing biodiversity. Science of the Total Environment, 240(1-3), 107-122. [CrossRef]
- Forsyth, D. M. (2023). Using exclusion fencing to manage feral deer impacts in Australia. O. NSW Department of Primary Industries, for the Centre for Invasive Species Soluations. https://pestsmart.org.au/wp-content/uploads/sites/3/2023/08/Using-Exclusion-Fencing-to-Manage-Feral-Deer.pdf.
- Friess, D. A., Howard, J., Huxham, M., Macreadie, P. I., & Ross, F. (2022). Capitalizing on the global financial interest in blue carbon. PLoS Climate, 1(8), e0000061. [CrossRef]
- GAA. (2022). Galvanised steel versus stainless steel. Galvanizers Association of Australia. Retrieved 3 November 2024 from https://gaa.com.au/2022/11/17/galvanized-steel-versus-stainless-steel/.
- Garcia, L. C., Szabo, J. K., de Oliveira Roque, F., Pereira, A. d. M. M., da Cunha, C. N., Damasceno-Júnior, G. A., Morato, R. G., Tomas, W. M., Libonati, R., & Ribeiro, D. B. (2021). Record-breaking wildfires in the world's largest continuous tropical wetland: Integrative fire management is urgently needed for both biodiversity and humans. Journal of Environmental Management, 293, 112870. [CrossRef]
- Giumelli, J., & White, B. (2016). Exclusion fencing keep fereals at bay (072). (Research Report No. 072, Issue. K. Group. www.wool.com/globalassets/wool/sheep/pest-animals/wild-dog-exclusion-fencing--australian-wool-innovation/kondinin-group-research-report---exclusion-fencing.pdf.
- Gorham, C., Lavery, P. S., Kelleway, J. J., Masque, P., & Serrano, O. (2021). Heterogeneous tidal marsh soil organic carbon accumulation among and within temperate estuaries in Australia. Science of the Total Environment, 787, 147482. [CrossRef]
- Green Energy Regulator. (2025). ACCU volume weighted average spot price September 2019 to November 2024 Australian Government Clean Energy Regulator. Retrieved 08/05/2025 from https://cer.gov.au/markets/reports-and-data/quarterly-carbon-market-reports/quarterly-carbon-market-report-september-quarter-2024/australian-carbon-credit-units-accus.
- Greiner, R., & Stanley, O. (2013). More than money for conservation: Exploring social co-benefits from PES schemes. Land Use Policy, 31, 4-10.
- Greiner, R., Stanley, O., & Austin, B. (2012). Sustainable Indigenous livelihoods from north Australian land and water resources - towards a research and development agenda and implementation strategy (NAILSMA Knowledge Series, Issue. N. A. I. L. a. S. M. A. Ltd.
- Groom, R., Hutley, L., Brown, B., Lovelock, C., & Vickers, R. (2023). Blue carbon in the Northern Territory, Australia. C. D. University. www.inpex.com.au/media/kpybedja/0000-ah-rep-70084_rev0.pdf.
- Hagger, V., Stewart-Sinclair, P., Rossini, R. A., Adame, M. F., Glamore, W., Lavery, P., Waltham, N. J., & Lovelock, C. E. (2024). Lessons learned on the feasibility of coastal wetland restoration for blue carbon and co-benefits in Australia. Journal of Environmental Management, 369, 122287. [CrossRef]
- Hagger, V., Waltham, N. J., & Lovelock, C. E. (2022). Opportunities for coastal wetland restoration for blue carbon with co-benefits for biodiversity, coastal fisheries, and water quality. Ecosystem Services, 55, 101423. [CrossRef]
- HCPSL. (2017). Exclusion fencing for feral pig control. H. C. P. S. Ltd. www.sugarresearch.com.au/sugar_files/2017/02/Exclusion_fencing_for_feral_pig_control.pdf.
- Jones, S. F., Arias-Ortiz, A., Baldocchi, D., Eagle, M., Friess, D. A., Gore, C., Noe, G., Nolte, S., Oikawa, P., Paytan, A., Raw, J. L., Roberts, B. J., Rogers, K., Schutte, C., Stagg, C. L., Thorne, K. M., Ward, E. J., Windham-Myers, L., & Yando, E. S. (2024). When and where can coastal wetland restoration increase carbon sequestration as a natural climate solution? Cambridge Prisms: Coastal Futures, 2, e13, Article e13. [CrossRef]
- Kelleway, J., Serrano, O., Baldock, J., Cannard, T., Lavery, P., Lovelock, C., Macreadie, P., Masque, P., Saintilan, N., & Steven, A. (2017). Technical review of opportunities for including blue carbon in the Australian Government's Emissions Reduction Fund. CSIRO. https://www.researchgate.net/publication/320464538_Technical_review_of_opportunities_for_including_blue_carbon_in_the_Australian_Government's_Emissions_Reduction_Fund_Final_Report_Prepared_for_the_Department_of_the_Environment_and_Energy.
- Kroese, D. P., & Rubinstein, R. Y. (2012). Monte carlo methods. Wiley Interdisciplinary Reviews: Computational Statistics, 4(1), 48-58. [CrossRef]
- Landmark. (2018). Fencing Handbook. In: landmark.com.au.
- Lemcke, B. (2017). The Australian water buffalo manual. N. T. Government. agrifutures.com.au/wp-content/uploads/publications/17-003.pdf.
- Long, K., & Robley, A. (2004). Cost effective feral animal exclusion fencing for areas of high conservation value in Australia: A report (0642549923). V. D. o. S. a. Environment. www.agriculture.gov.au/sites/default/files/documents/fencing.pdf.
- Lovelock, C. E., Adame, M. F., Bradley, J., Dittmann, S., Hagger, V., Hickey, S. M., Hutley, L. B., Jones, A., Kelleway, J. J., Lavery, P. S., Macreadie, P. I., Maher, D. T., McGinley, S., McGlashan, A., Perry, S., Mosley, L., Rogers, K., & Sippo, J. Z. (2023). An Australian blue carbon method to estimate climate change mitigation benefits of coastal wetland restoration [Article]. Restoration Ecology, 31(7), Article e13739. [CrossRef]
- Macalister, A., & Butler, D. (2015). Ungulate-proof fences in the Marlborough Sounds. R. D. E. L. (NZ). www.marlborough.govt.nz/repository/libraries/id:2ifzri1o01cxbymxkvwz/hierarchy/documents/environment/biodiversity/publications-and-reports-list/Ungulate_Pigs_Deer_Goats_Fencing_Report_Sounds.pdf.
- Macreadie, P. I., Ollivier, Q. R., Kelleway, J. J., Serrano, O., Carnell, P. E., Ewers Lewis, C. J., Atwood, T. B., Sanderman, J., Baldock, J., Connolly, R. M., Duarte, C. M., Lavery, P. S., Steven, A., & Lovelock, C. E. (2017). Carbon sequestration by Australian tidal marshes. Scientific Reports, 7(1), 44071. [CrossRef]
- Milne, S., Beaver, S., Baljak, C., Cox, A., & Howden, M. (2024). Carbon farming co-benefits: a review of concepts, policy and potential in Australian landscapes. The Rangeland Journal, 46(3), -. [CrossRef]
- Mitchell, J. (2011). Exclusion fencing of feral pigs. N. Q. D. Tropics. www.sugarresearch.com.au/sugar_files/2017/02/Exclusion_fencing_for_feral_pig_control.pdf.
- Muenzel, D., & Martino, S. (2018). Assessing the feasibility of carbon payments and Payments for Ecosystem Services to reduce livestock grazing pressure on saltmarshes. Journal of Environmental Management, 225, 46-61. [CrossRef]
- Murray, N. J., Worthington, T. A., Bunting, P., Duce, S., Hagger, V., Lovelock, C. E., Lucas, R., Saunders, M. I., Sheaves, M., Spalding, M., Waltham, N. J., & Lyons, M. B. (2022). High-resolution mapping of losses and gains of Earth’s tidal wetlands. Science, 376(6594), 744-749. [CrossRef]
- Negus, P. M., Marshall, J. C., Clifford, S. E., Blessing, J. J., & Steward, A. L. (2019). No sitting on the fence: protecting wetlands from feral pig damage by exclusion fences requires effective fence maintenance. Wetlands Ecology and Management, 27(4), 581-585. [CrossRef]
- OBPR. (2020). Cost-benefit analysis guidance note. https://pmc.gov.au/resource-centre/regulation/cost-benefit-analysis-guidance-note.
- Ouyang, X., & Lee, S. (2014). Updated estimates of carbon accumulation rates in coastal marsh sediments. Biogeosciences, 11(18), 5057-5071. [CrossRef]
- Pert, P. L., Hill, R., Robinson, C. J., Jarvis, D., & Davies, J. (2020). Is investment in Indigenous land and sea management going to the right places to provide multiple co-benefits? Australasian Journal of Environmental Management, 27(3), 249-274. [CrossRef]
- Quevedo, J. M. D., Uchiyama, Y., & Kohsaka, R. (2023). Progress of blue carbon research: 12 years of global trends based on content analysis of peer-reviewed and ‘gray literature’ documents. Ocean and Coastal Management, 236, Article 106495. [CrossRef]
- RAE. (2024). Coastal blue carbon--a new opportunity for coastal conservation. R. A. s. Estuaries. https://oceanfdn.org/sites/default/files/Coastal%20Blue%20Carbon%20Fact%20Sheet%20RAE%20Sept%202012-ilovepdf-compressed.pdf.
- Reef Catchments. (2023). Pig exclusion fencing in the Mackay Whitsunday Isaac NRM Region. R. Catchments. https://reefcatchments.com.au/resources/feral-pig-exclusion-fencing-in-the-mackay-whitsunday-isaac-nrm-region/.
- Robinson, C. J., Smyth, D., & Whitehead, P. J. (2005). Bush tucker, bush pets, and bush threats: Cooperative management of feral animals in Australia's Kakadu National Park [Article]. Conservation Biology, 19(5), 1385-1391. [CrossRef]
- Rogers, K., Lal, K. K., Asbridge, E. F., & Dwyer, P. G. (2022). Coastal wetland rehabilitation first-pass prioritisation for blue carbon and associated co-benefits. Marine and Freshwater Research, 74(3), 177-199. [CrossRef]
- RotechRural. (2024). Fencing Contractors. Retrieved 22/10/2024 from https://rotechrural.com.au/fencing-contractors/.
- Rowland, P. I., & Lovelock, C. E. (2024). Global impacts of introduced ungulates on wetland carbon and biodiversity: A review. Biological Conservation, 290, 110432. [CrossRef]
- Sailer, D. (2006). I Ho'ola I Ka Nahele: To heal a forest. A mesic forest restoration guide for Hawaii. . OANRP. https://manoa.hawaii.edu/hpicesu/DPW/SAILER_2006/default.htm.
- Saintilan, N., Rogers, K., Kelleway, J., Ens, E., & Sloane, D. (2019). Climate change impacts on the coastal wetlands of Australia. Wetlands, 39(6), 1145-1154. [CrossRef]
- Schulze, C., Zagórska, K., Häfner, K., Markiewicz, O., Czajkowski, M., & Matzdorf, B. (2024). Using farmers' ex ante preferences to design agri-environmental contracts: A systematic review. Journal of Agricultural Economics, 75(1), 44-83. [CrossRef]
- Selinske, M. J., Howard, N., Fitzsimons, J. A., Hardy, M. J., & Knight, A. T. (2022). “Splitting the bill” for conservation: Perceptions and uptake of financial incentives by landholders managing privately protected areas. Conservation Science and Practice, 4(4), e12660. [CrossRef]
- Sheehy, J., Porter, J., Bell, M., & Kerr, S. (2024). Redefining blue carbon with adaptive valuation for global policy [Review]. Science of the Total Environment, 908, Article 168253. [CrossRef]
- Smith, D., King, R., & Allen, B. L. (2020). Impacts of exclusion fencing on target and non-target fauna: a global review. Biological Reviews, 95, 1590-1606. [CrossRef]
- Social Carbon. (2025). Resilient planet, sustainable livelihoods. Retrieved 03/06/2025 from socialcarbon.org.
- Southern Wire. (2022). 2022 National rural fencing product guide. In. Bassendean WA: Southern Wire Pty Ltd.
- Stewart-Sinclair, P. J., Bulmer, R. H., Macpherson, E., & Lundquist, C. J. (2024). Enabling coastal blue carbon in Aotearoa New Zealand: opportunities and challenges. Frontiers in Marine Science, 11, Article 1290107. [CrossRef]
- Thamo, T., & Pannell, D. J. (2016). Challenges in developing effective policy for soil carbon sequestration: perspectives on additionality, leakage, and permanence. Climate Policy, 16(8), 973-992. [CrossRef]
- Torabi, N., & Bekessy, S. A. (2015). Bundling and stacking in bio-sequestration schemes: Opportunities and risks identified by Australian stakeholders. Ecosystem Services, 15, 84-92. [CrossRef]
- Tung, Y. K. (1992). Probability Distribution for Benefit/Cost Ratio and Net Benefit. Journal of Water Resources Planning and Management, 118(2), 133-150. [CrossRef]
- Verschuuren, B. (2006). Sociocultural importance of wetlands in northern Australia. Conserving Cultural and Biological Diversity: The Role of Sacred Natural Sitesand Cultural Landscapes, Tokyo.
- Waltham, N. J., Schaffer, J., Walker, S., Perry, J., & Nordberg, E. (2022). Simple fence modification increases land movement prospects for freshwater turtles on floodplains [Article]. Wildlife Biology, 2022(3), Article e01012. [CrossRef]
- Waratah. (2018). Waratah fencing manual. www.fsccmn.com/wp-content/uploads/2018/10/Waratah-Fencing-Manual.pdf.
- Westonfence. (2022). Exclusion fencing. Retrieved 21/10/2024 from https://westonfence.com.au/exclusion-fencing/.
- Yang, W., Tanner, C. C., Holland, P., & Qu, Z. (2025). Dynamic economic valuation of coastal wetland restoration: A nature-based solution for climate and biodiversity. Environmental Challenges, 20, 101182. [CrossRef]
- Young, L. C. (2013). Ungulate fencing and management plan for Lualualei Valley, Oahu, Hawaii. Final Project Report. P. R. Conservation. pacificrimconservation.org/wp-content/uploads/2013/10/Pub-87.pdf.
- Zhang, Y., Zhang, X., Fang, W., Cai, Y., Zhang, G., Liang, J., Chang, J., Chen, L., Wang, H., Zhang, P., Wang, Q., & Zhang, Y. (2025). Carbon sequestration potential of wetlands and regulating strategies response to climate change. Environmental Research, 269, 120890. [CrossRef]
Figure 1.
Nominal future carbon price if assumed price increase (cpi) is defined by μ=10% yr-1 and σ= μ. Summary statistics from 1000 MCS for any given year.
Figure 1.
Nominal future carbon price if assumed price increase (cpi) is defined by μ=10% yr-1 and σ= μ. Summary statistics from 1000 MCS for any given year.
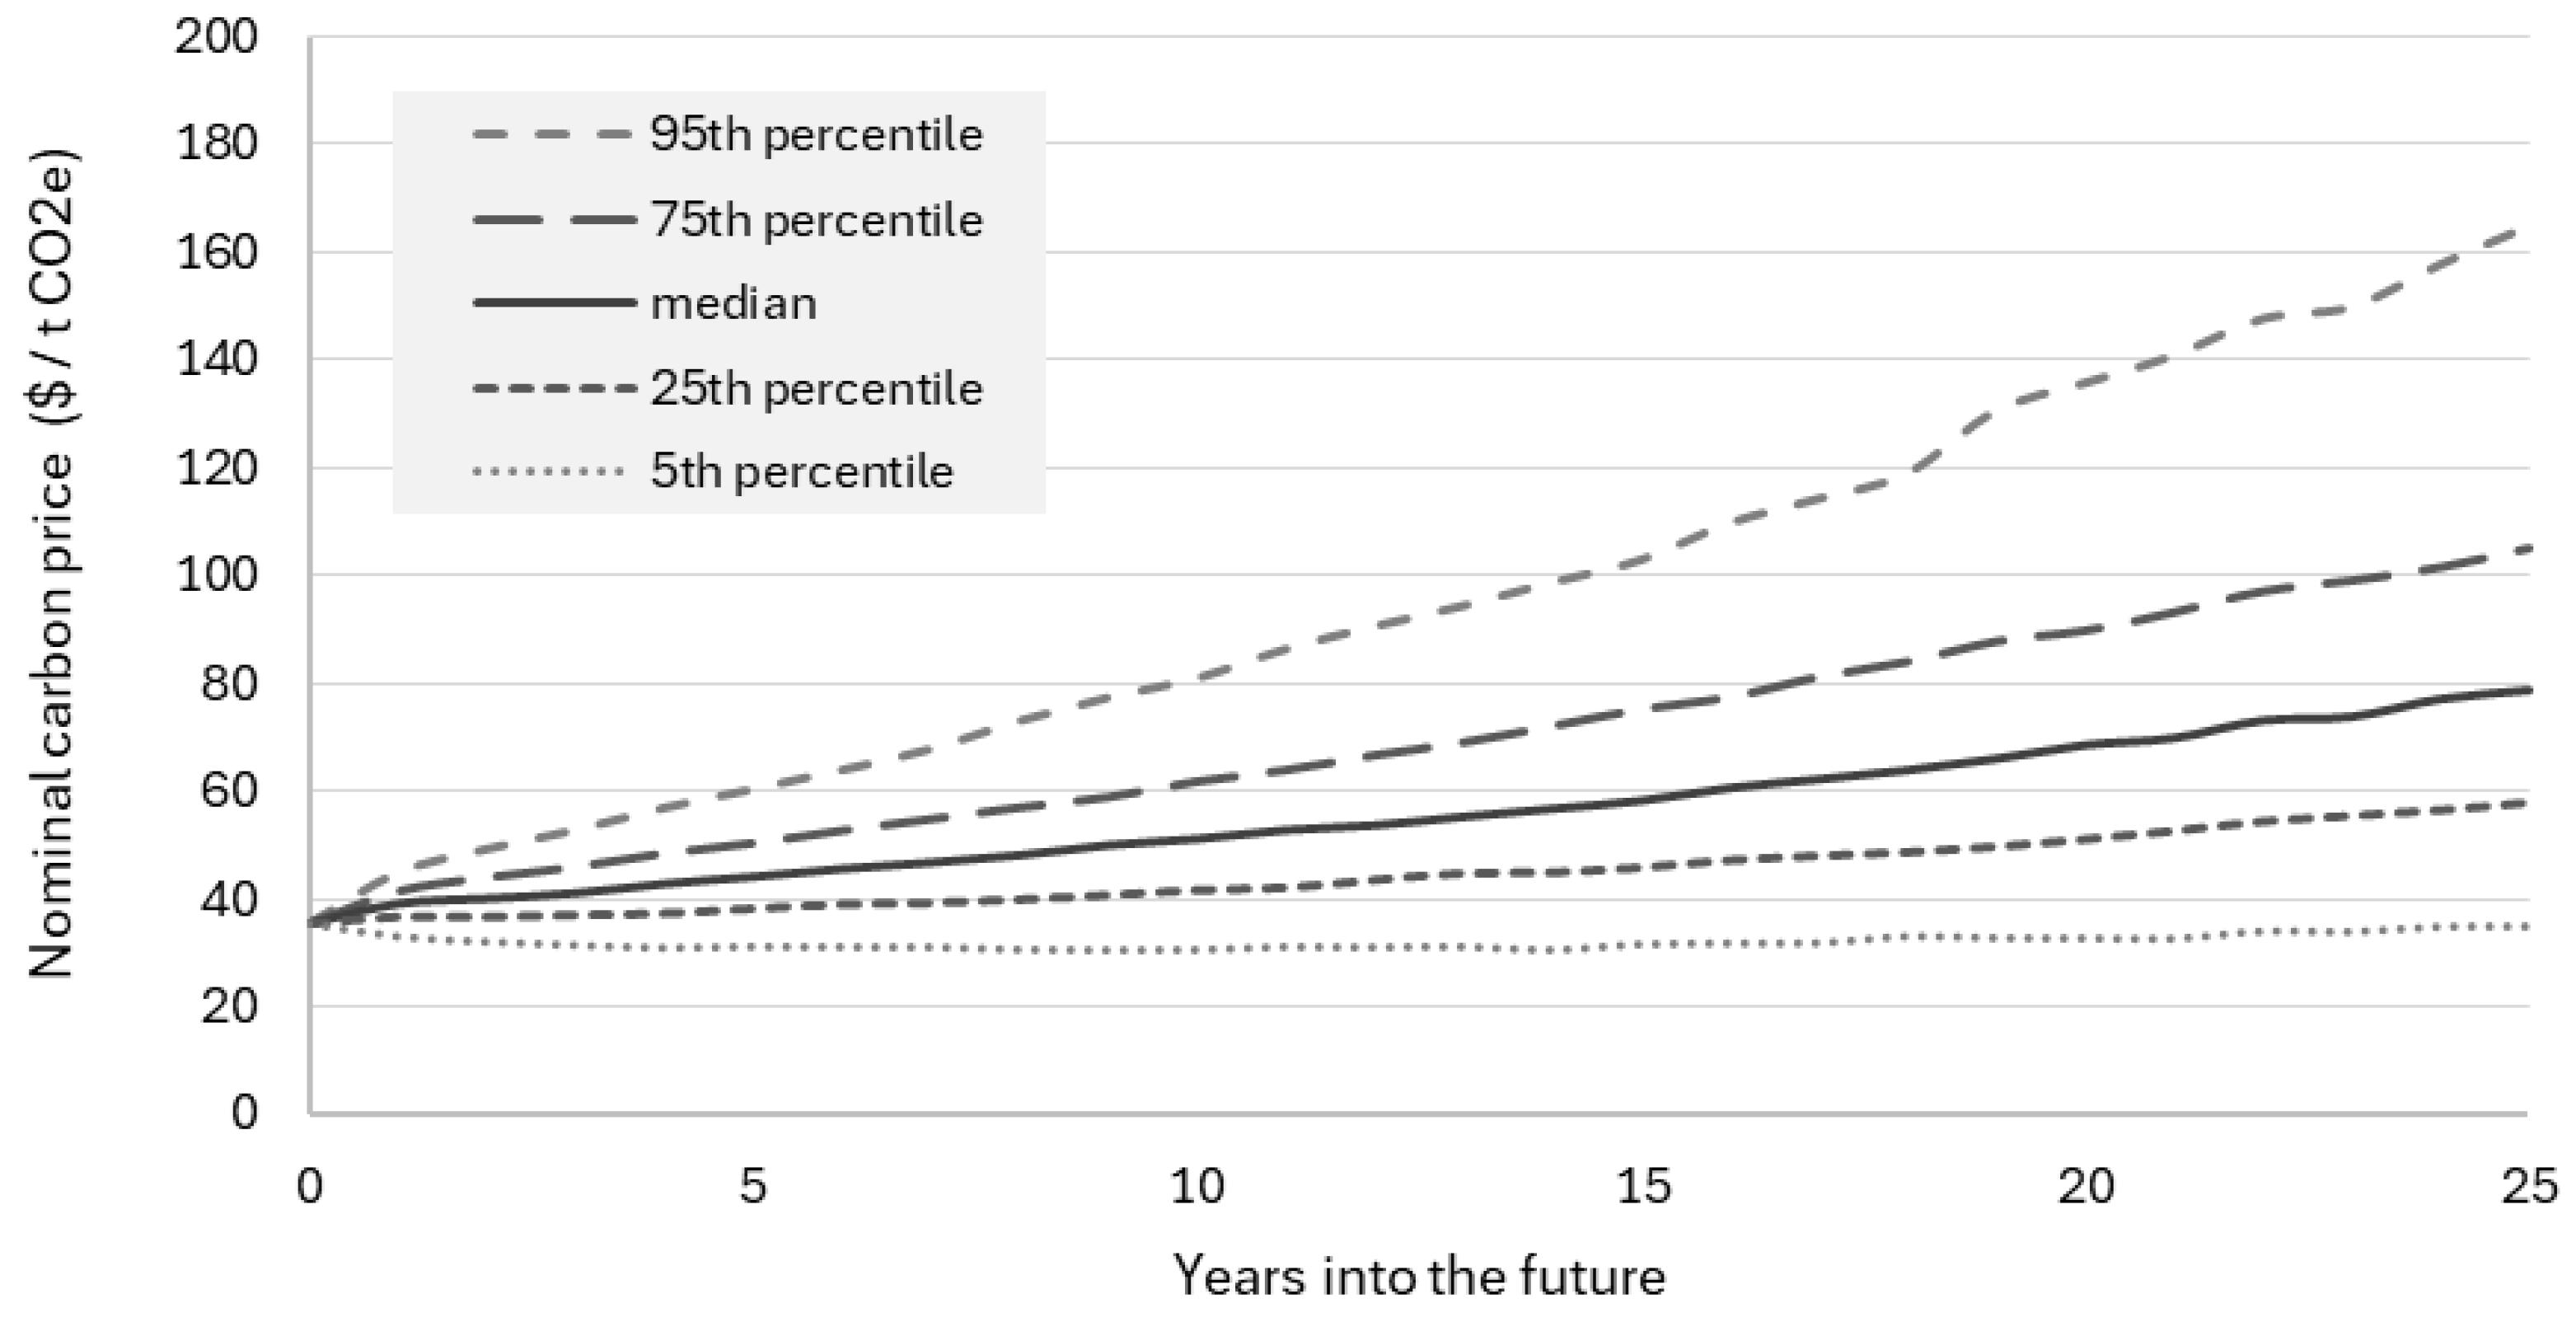
Figure 2.
Estimated BCR of exclusion fencing for (a) different fencing cost scenarios and (b) different carbon sequestration rates of restored wetland. Note: the middle scenario in both figures is identical.
Figure 2.
Estimated BCR of exclusion fencing for (a) different fencing cost scenarios and (b) different carbon sequestration rates of restored wetland. Note: the middle scenario in both figures is identical.
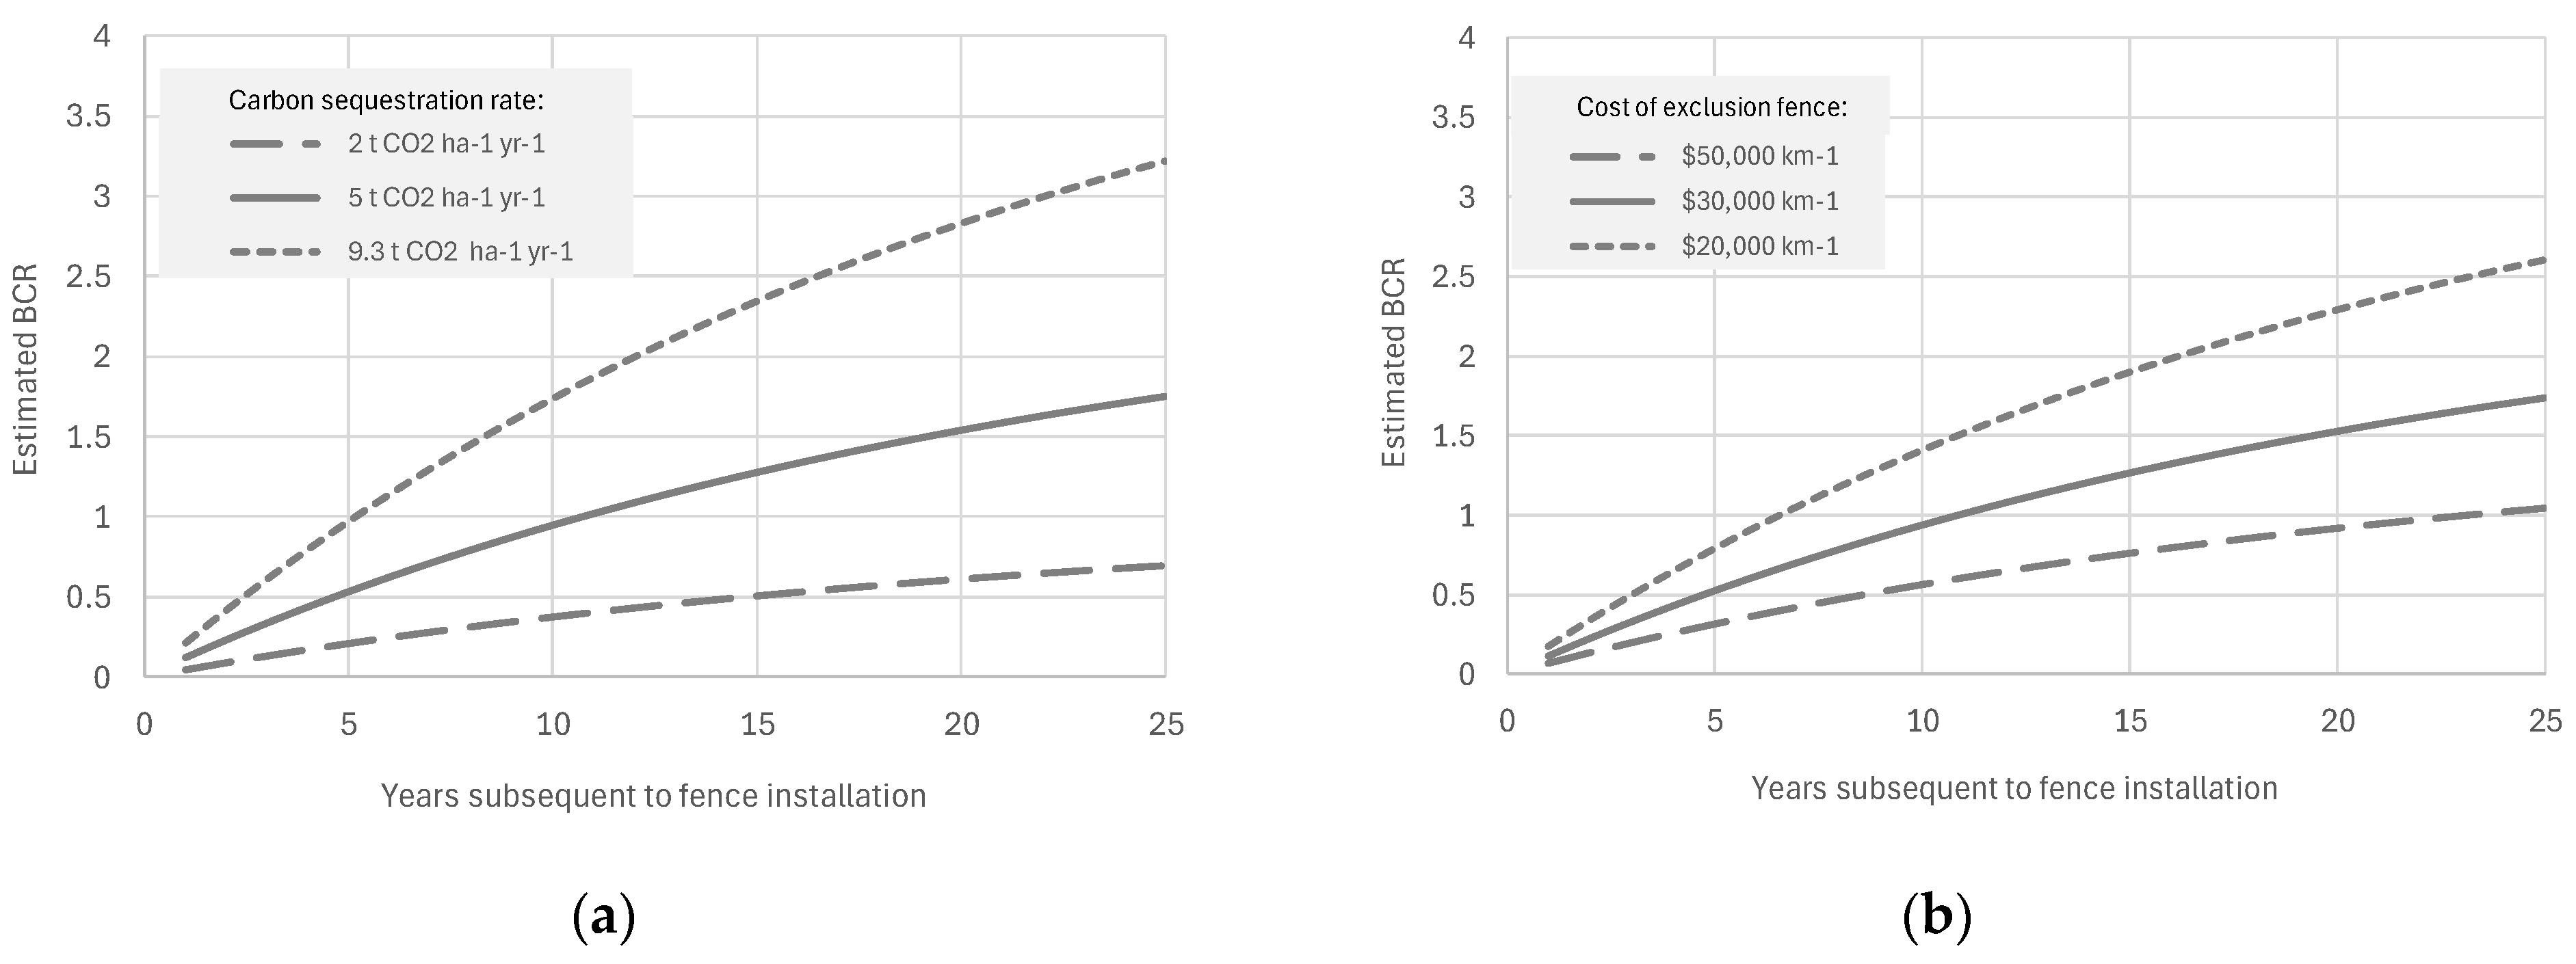
Figure 3.
Probability curves for BCR of exclusion fencing 10 years after fence installation for different CSRs under uncertainty.
Figure 3.
Probability curves for BCR of exclusion fencing 10 years after fence installation for different CSRs under uncertainty.
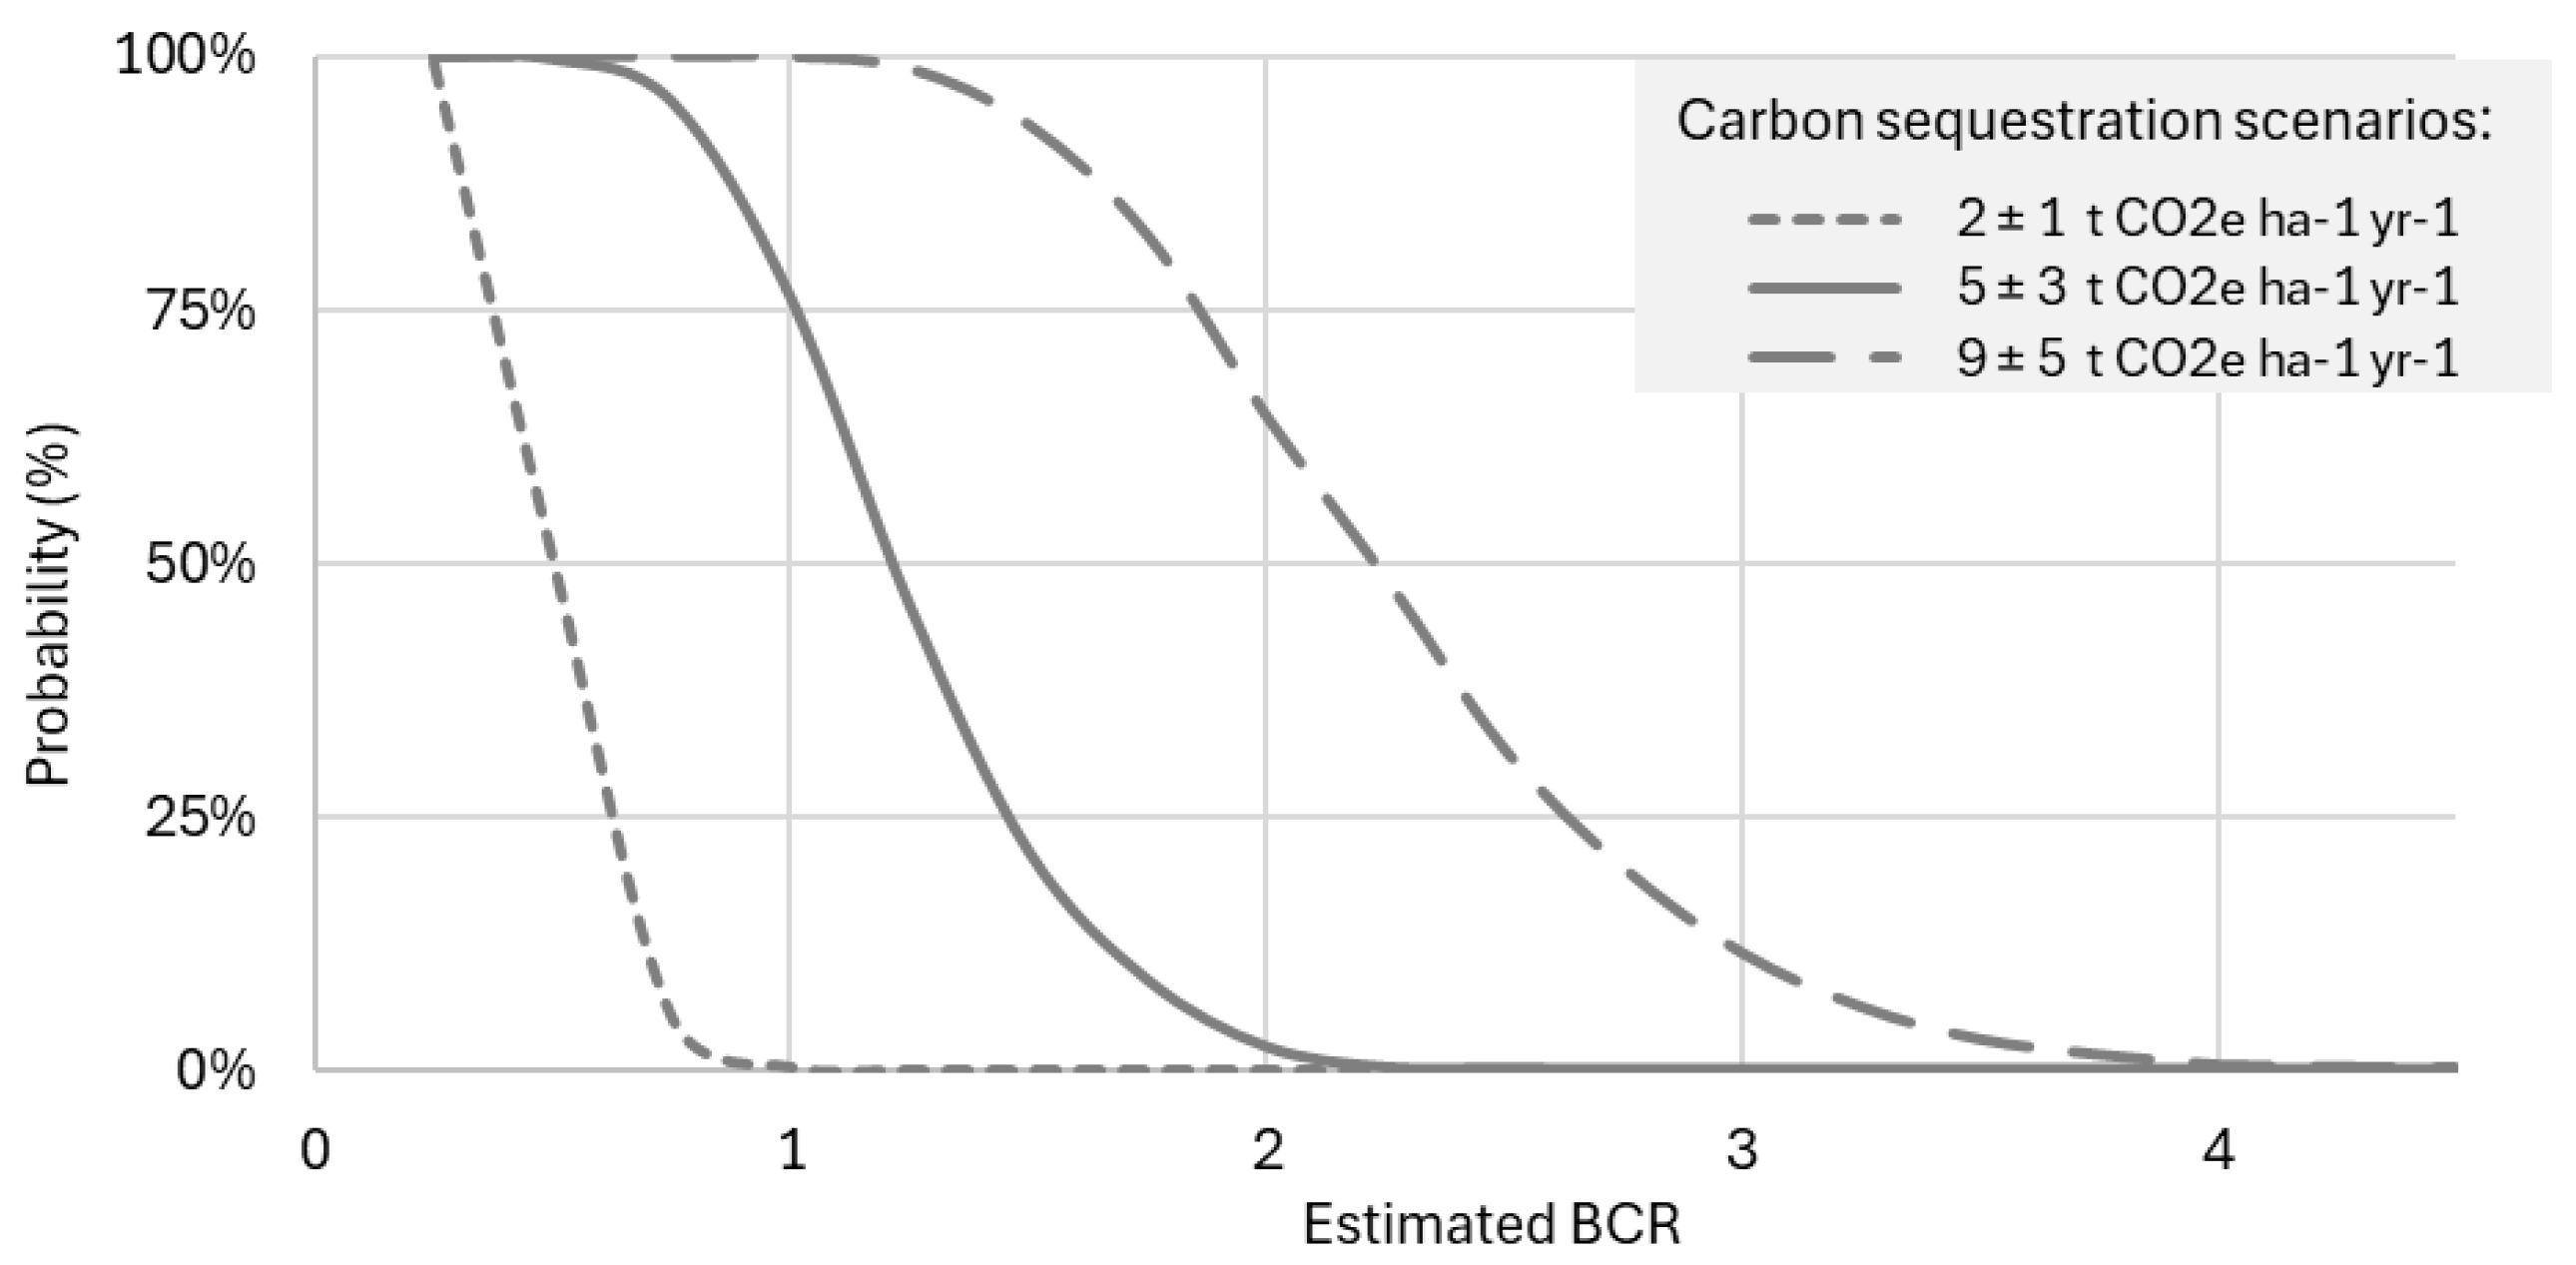
Figure 4.
Probability curves for BCR of exclusion fencing 10 years after fence installation for different fencing cost scenarios under uncertainty.
Figure 4.
Probability curves for BCR of exclusion fencing 10 years after fence installation for different fencing cost scenarios under uncertainty.
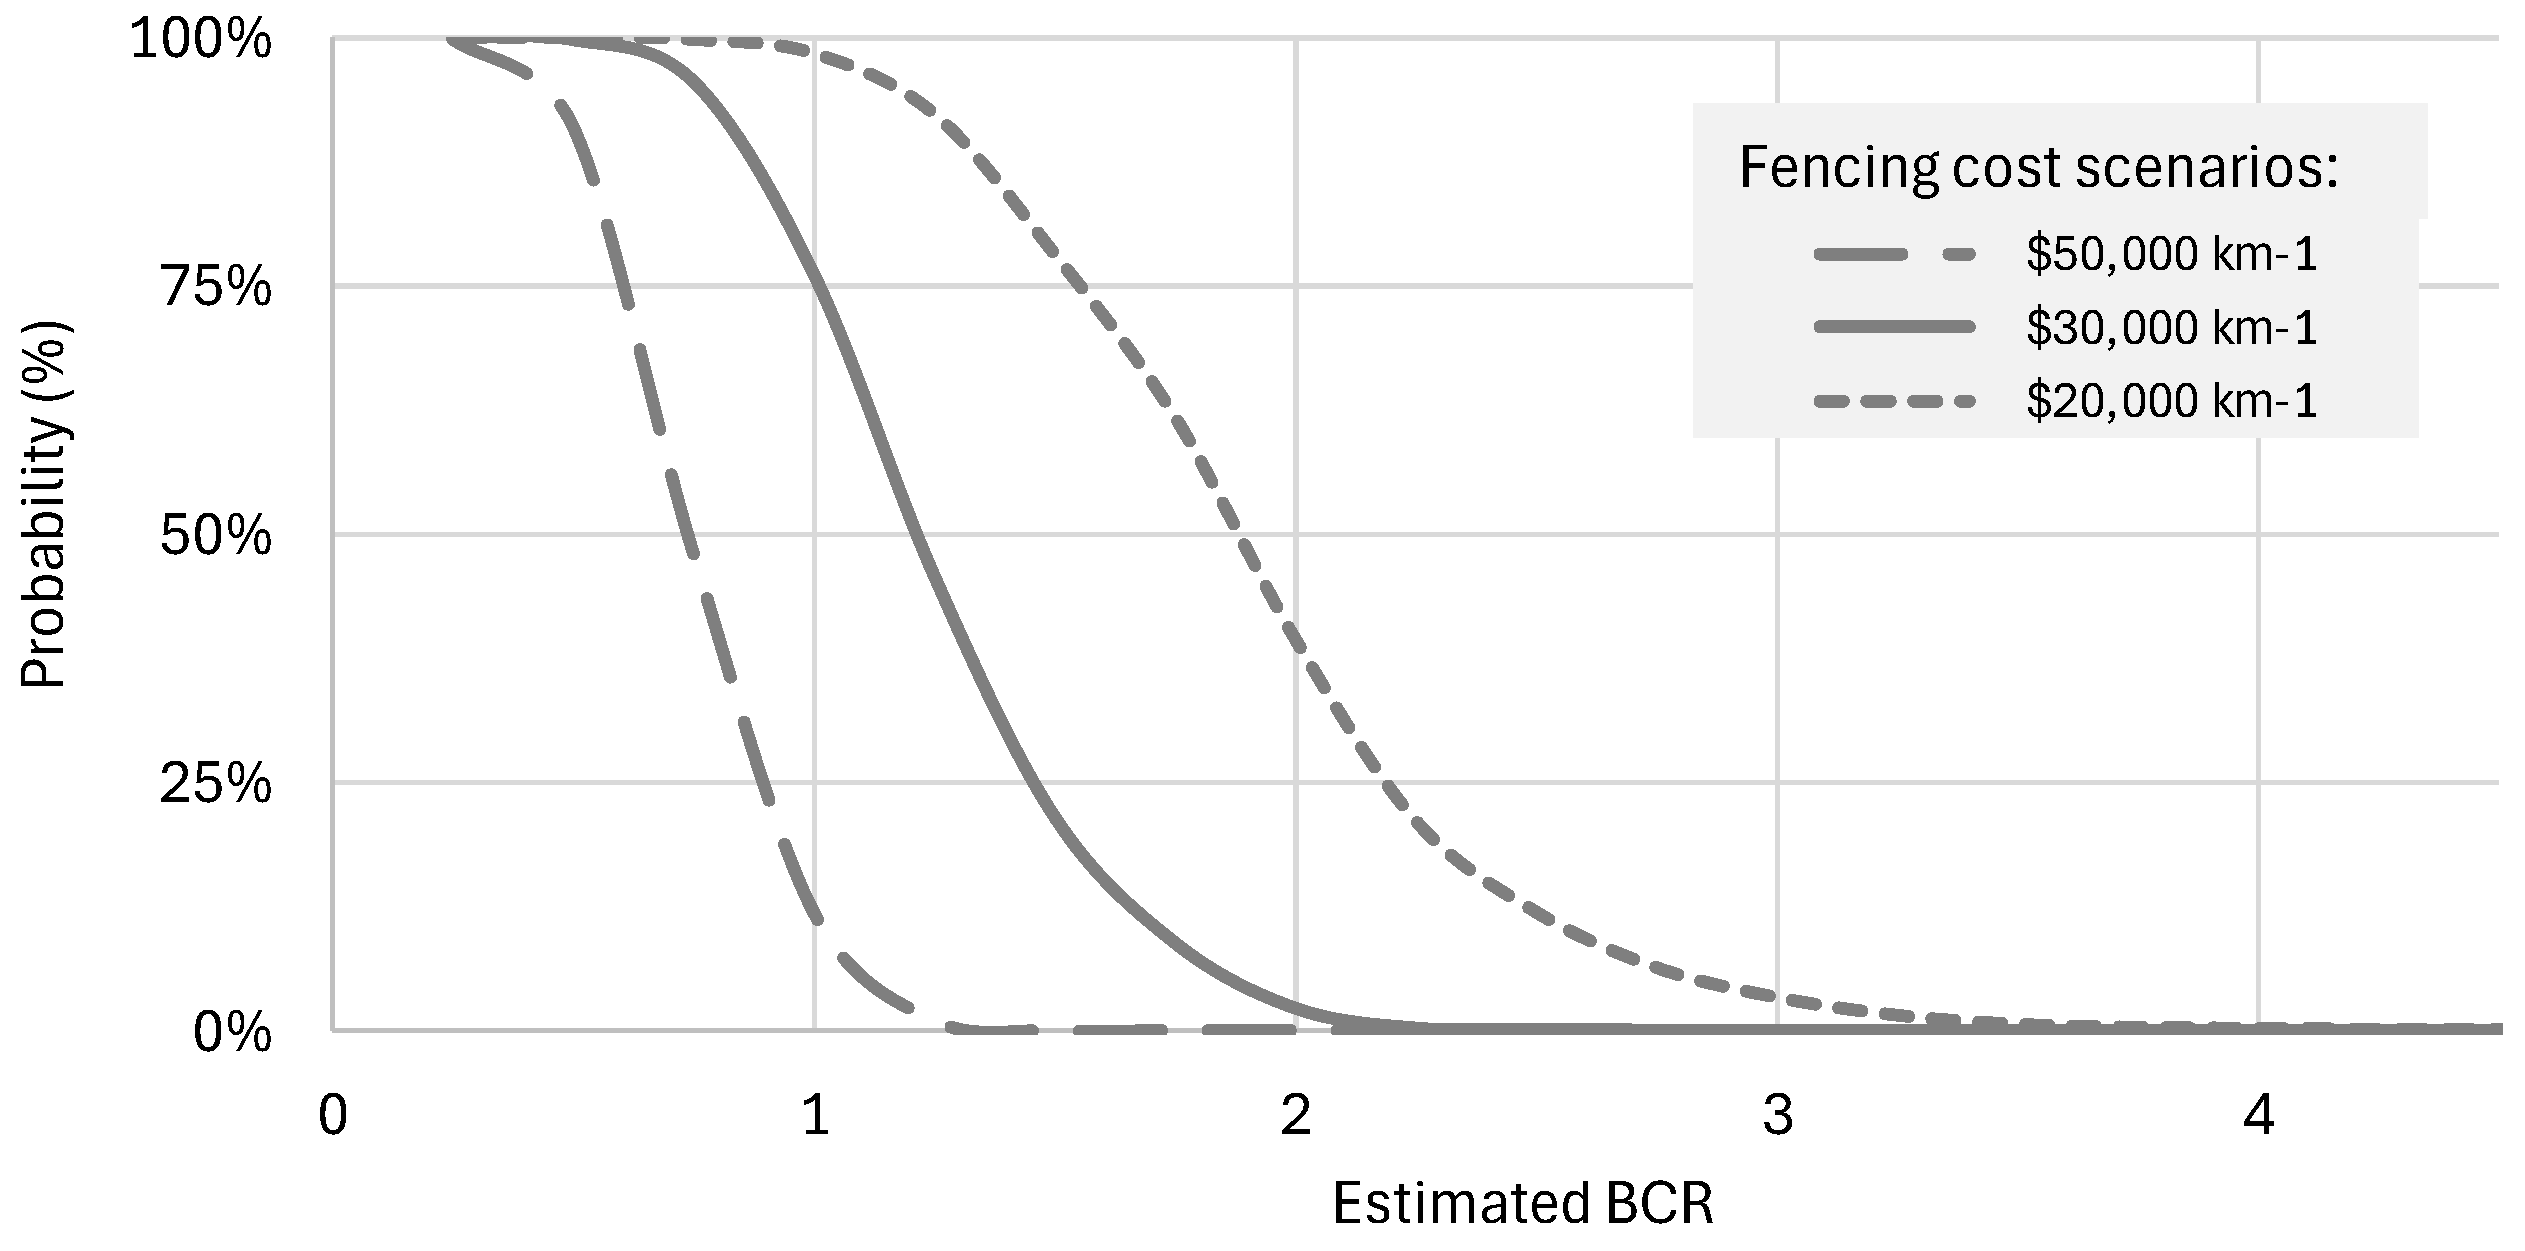
Figure 5.
Probability curves for BCR of low-CSR-wetland exclusion fencing 10 years after fence installation for different fencing cost scenarios under uncertainty.
Figure 5.
Probability curves for BCR of low-CSR-wetland exclusion fencing 10 years after fence installation for different fencing cost scenarios under uncertainty.
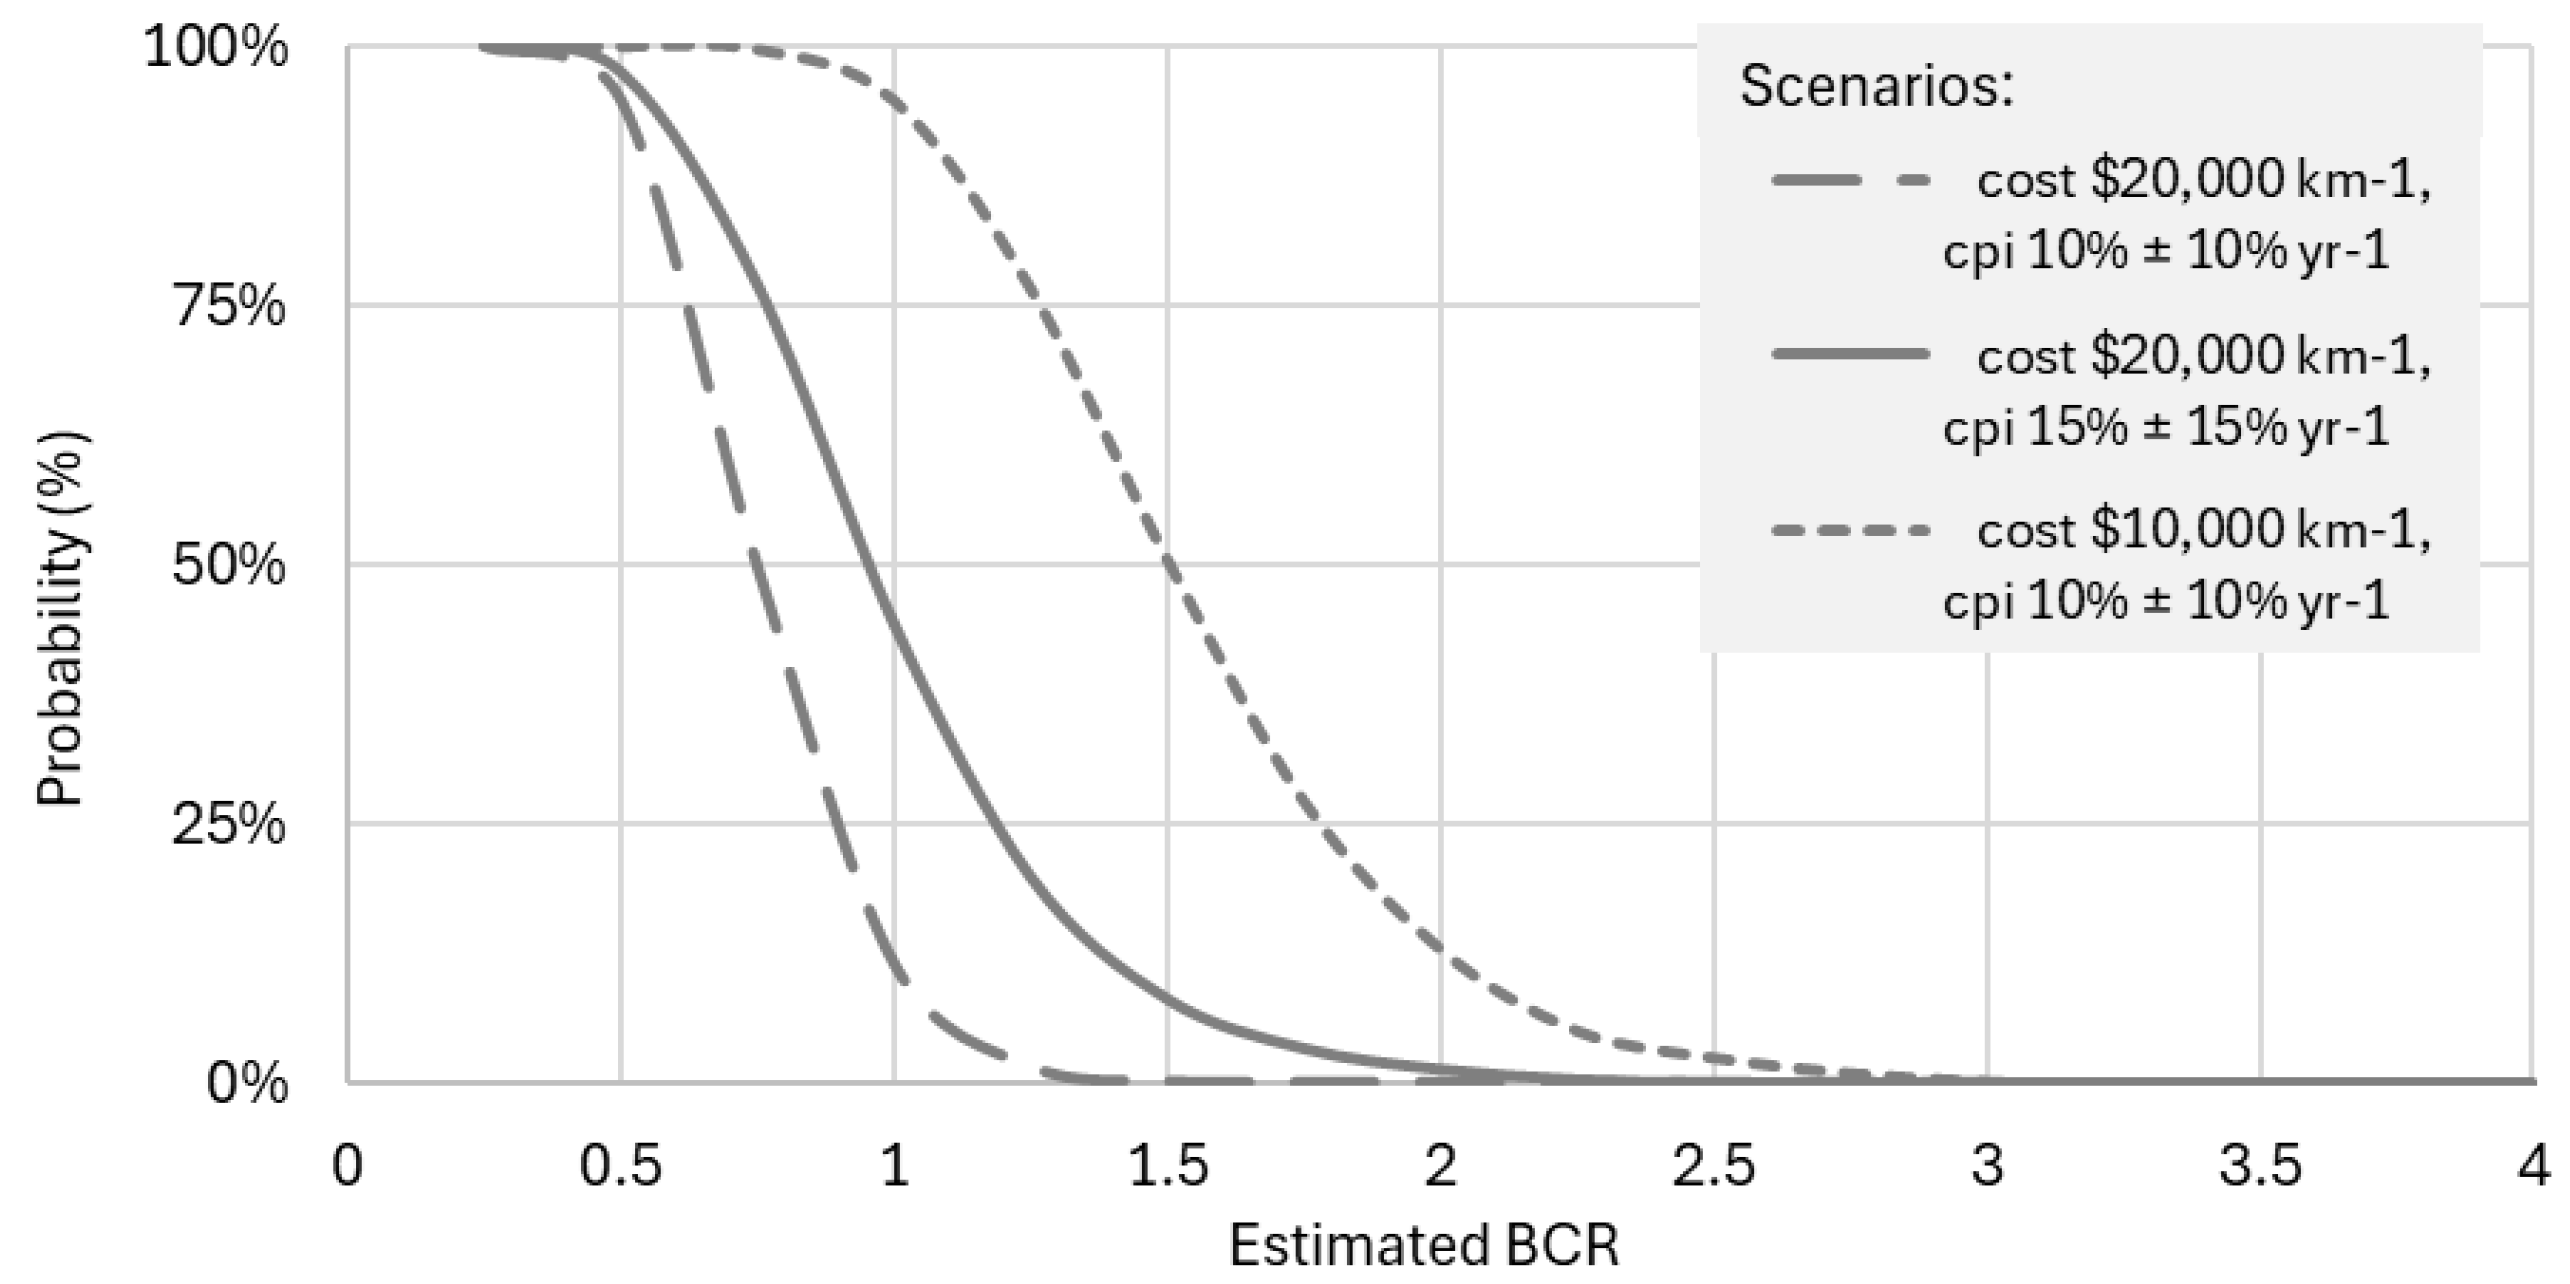

Table 1.
Fencing specifications for different ungulate species.
| Target species | Minimum fence height (cm) | Graduated mesh | Fence skirting recommended (width in cm) |
Electric top wire recommended if feasible |
|
|---|---|---|---|---|---|
| Cattle (Bos taurus, Bos indicus) |
115 | No | No | Yes | |
| Goats (Capra aegagrus hircus) |
115 - 125 | Yes, no gaps at ground | Yes, 60 – 110 | Yes, additional hotwires may be needed to control male goats | |
| Sheep (Ovis aries) |
145 | Yes | No | Yes | |
| Deer (Cervcus elaphus, Dama dama) |
185 - 200 | Yes | No | Yes | |
| Feral pigs (Sus scrofa) |
90 - 120 | Yes, no gaps at ground | Yes, 60 – 110 | No | |
| Water buffalo (Bubalus bubalis) |
120 | No | No | Yes | |
* compiled from: Lemcke, 2017; Sailer, 2006, p. 65.
Table 2.
Empirical cost estimates of ungulate exclusion fencing obtained from expert interviews*.
| Cost elements |
Baseline cost estimates | Cost variations: considerations and comments |
|---|---|---|
| Material and installation cost |
$17 to $25 m-1 for fenceline with combination of timber posts and steel pickets; $42 m-1 for fenceline concrete posts with galvanised pickets or gal posts & pickets $70 m-1 for stainless steel and all-concrete post fences $200 m-1 for gates and assemblies $800 to $1000 m-1 for creek crossings |
Assumes job is local and minimum fence length is 1000m. Approx. 50:50 materials and installation. Cost is dependent on size of job (i.e. length of fence): Double cost (or more) if fence is less than 200m as mobilisation cost is the same no matter the length of fence. Scale-induced cost savings cease upwards of approximately 1 km length of fenceline as long fences typically require longer on-site transport distances. Cost assumes standard high-tensile galvanised mesh from one of the Australian suppliers. There is virtually no difference in installation cost between 5-strand barb wire and mesh fence as barb wire, while the wire is cheaper, is more labour intensive. If pigs are present, the mesh fence requires an apron, which adds up to $5 m-1 to the material cost. If deer need to be controlled, fence height needs to be raised to 1500-1950 mm. Higher fences mean more wire, larger posts, bigger strainers assemblies, which approximately doubles the cost. Floodway installations are required wherever fast flowing water occurs. $10,000 buys a 12m creek crossing with fixed pipe, chains and hanging panels. Gates and waterway crossings each require two strainer assemblies, as do 90-degree corners. Per-unit costs for steel strainer assemblies: approx. $600. Mild corners only require stronger corner post plus support post. If the fence is installed in ecologically sensitive or very wet sites, all posts (steel only) have to be driven by hand, this incurs a (small) cost increase. Fencing jobs that are remote and involve travel incur larger labour cost due to travel time being added. A machinery delivery charge is applicable to get excavator and tractor plus attachments (e.g. post rammer) and tools on-site. Allow $2400/day for an excavator plus a float cost of $4000. Material costs have increased approx. 70% over past 3 years since COVID. Contractors have not as-yet passed on full cost increase to customers. Ongoing freight cost increases and other inflationary pressures are anticipated, adding around 10% yr-1 to costs. |
| Fenceline preparation | $2.50 to $5.00 m-1 | Baseline cost is for minor levelling and clearing. Most exclusion fences require 6 m wide clearing for access for installation of apron mesh and ongoing fence maintenance. An excavator plus operator costs approx. $1600 - $2400/day and clears one km per day in ideal conditions. Float cost for an excavator or bulldozer is around $4000. If country is heavily timbered, clearing may require a bulldozer, which increases per-meter-cost. |
| Maintenance cost | Depreciate fence over 10 years | Rule of thumb is to depreciate an exclusion fence in coastal / saline conditions over 10 years. Timber, treated or untreated, will generally only last 10 years and it is unlikely that there is no event over a 10-year period which severely impacts the fence, e.g. wind storm, flooding or fire. Maintenance costs can be expected to be low in first 10 years, s.t. favourable conditions, as only regular inspections for potential breaches are required. As a guide, annual maintenance costs are 2% of installation costs. High maintenance costs—equivalent to depreciation costs and possibly higher—are likely to occur once the fence starts to deteriorate beyond 10 years. Fences made of stainless steel posts and mesh will last much longer as will fences with all-concrete posts, which withstand fire, termites and also floods. In heavily timbered conditions, maintenance includes the suppression of tree regrowth with long-lasting herbicides to ensure continued access to a fenceline and reduce the risk of damage from fallen trees. |
Disclaimer/Publisher’s Note: The statements, opinions and data contained in all publications are solely those of the individual author(s) and contributor(s) and not of MDPI and/or the editor(s). MDPI and/or the editor(s) disclaim responsibility for any injury to people or property resulting from any ideas, methods, instructions or products referred to in the content. |
© 2025 by the authors. Licensee MDPI, Basel, Switzerland. This article is an open access article distributed under the terms and conditions of the Creative Commons Attribution (CC BY) license (http://creativecommons.org/licenses/by/4.0/).
Copyright: This open access article is published under a Creative Commons CC BY 4.0 license, which permit the free download, distribution, and reuse, provided that the author and preprint are cited in any reuse.


