
Submitted:
05 June 2025
Posted:
05 June 2025
You are already at the latest version
Abstract
Childhood and adolescent obesity often coexist with micronutrient deficiencies and metabolic alterations, particularly in marginalized communities. This cross-sectional study evaluated the biochemical, anthropometric, and dietary characteristics of 55 children and adolescents (ages 4–13) from Tlaltizapán, Mexico, to identify early metabolic risk factors associated with excess weight. Nutritional intake was assessed through six-day dietary recalls and analyzed for adequacy against national reference values. Anthropometric and biochemical indicators—including BMI-for-age Z-score, waist-to-height ratio (WHtR), lipid profile, and plasma amino acid levels—were stratified by age and weight status. Overall, 36.4% of participants were overweight or obese. Alarmingly, 89.4% of children and 94.1% of adolescents had low HDL levels, regardless of BMI. Several participants with normal BMI showed elevated WHtR, triceps skinfold, and plasma branched-chain amino acids, suggesting hidden metabolic risk. Dietary analysis revealed excess intake of sugars, proteins, and fats, alongside insufficient fiber, vitamins, and minerals. Adolescents had poorer adherence to dietary recommendations than children. These findings underscore the limitations of BMI alone and support the use of WHtR, skinfolds, and biochemical markers to detect preclinical obesity. Urgent, targeted nutritional strategies are needed in semi-rural areas to address the double burden of obesity and undernutrition.
Keywords:
pediatric obesity
; micronutrient intake
; dietary adequacy
; early metabolic risk
; anthropometric
1. Introduction
In Mexico, overweight and obesity remain highly prevalent across all age groups and regions, affecting both urban and rural populations. According to the 2020–2023 National Health and Nutrition Survey (ENSANUT), the prevalence of overweight and obesity among school-aged children was 36.5%, and 40.4% among adolescents [1].
Certain populations face compounded challenges related to poverty, malnutrition, and limited access to affordable, nutritious food, often coupled with sedentary lifestyles. This is especially critical in communities with high levels of marginalization. Although these issues are well-documented, studies specifically analyzing the nutritional status and obesity in marginalized Mexican populations remain scarce. The ENSANUT-100K study, for instance, reported that urban residence increases the risk of overweight by 22.4%, compared to 21.4% in rural areas [2].
In the state of Morelos, Mexico, rural and semi-rural communities experience high levels of food insecurity. Data from the 2018 ENSANUT revealed that 67.8% of Morelos residents face food insecurity, with even higher rates in rural areas (81.4%). This includes 43.2% of households with mild food insecurity, 23.1% with moderate, and 15% with severe levels [3].
Tlaltizapán de Zapata, a semi-rural municipality in Morelos, is primarily sustained by agricultural activity and is characterized by widespread poverty. According to the 2021 Municipal Statistical Summary, 59.1% of the local population lives below the poverty line [4]. Previous anthropometric data from Tlaltizapán reported that 20% of children were overweight, 15.6% had obesity, and 9.8% were undernourished, revealing a complex and worrisome nutritional profile [5]. Children and adolescents under 20 years of age exhibit high consumption of low-nutrient-dense food. Those aged 5 to 11 years show the greatest intake of snacks, sweets, sugary cereals, desserts, and sweetened dairy beverages [3]. This situation must be addressed more comprehensively by including biochemical and dietetic parameters to better understand this complex phenomenon in rural communities.
Childhood and adolescence represent critical windows for establishing healthy eating behaviors and effective programmatic interventions [6]. The integral approach of studying anthropometric, biochemical, and dietetic indicators is important due to obesity significantly increases the risk of type 2 diabetes, cardiovascular disease, hypertension, gastrointestinal and respiratory disorders, and psychosocial complications. It is also associated with metabolic alterations such as dyslipidemia, hyperandrogenemia, hyperglycemia, and insulin resistance, all of which can progress to metabolic syndrome [7]. Furthermore, obesity has been linked to various micronutrient deficiencies and altered plasma amino acid profiles, which may result from poor dietary quality, nutrient malabsorption, or chronic low-grade inflammation [8,9]. Elevated blood concentrations of branched-chain amino acids (BCAAs) positively correlate with BMI and are considered early metabolic risk markers [10]. Pediatric obesity is associated with non-communicable diseases that can affect children, adolescents, and eventually adults, leading to increased public healthcare costs. Moreover, it may be linked to lower future income, worsening the situation of poverty in rural and semi-rural areas. Studying these communities is essential to identify at-risk populations and to provide appropriate, multidisciplinary healthcare interventions [11].
This cross-sectional study aims to comprehensively evaluate the biochemical, anthropometric, and dietary profiles of children and adolescents in Tlaltizapán, Mexico, in order to identify early metabolic risk factors associated with overweight and obesity in this vulnerable population. These findings may help inform future efforts to detect and address similar risks in other comparable communities.
2. Materials and Methods
2.1. Study Design and Participants
This cross-sectional study was conducted between November 2023 and July 2024. The study included 55 participants from the semi-rural municipality of Tlaltizapán de Zapata, Morelos, Mexico. Children aged 4–8 years and adolescents aged 9–13 years were eligible for inclusion. A clinical history was obtained from each participant, including information on family history of chronic degenerative diseases and obesity.
All participants and their parents or legal guardians provided written informed consent or assent (in the case of children older than 8 years) and signed a privacy notice to ensure the confidentiality of the data collected.
2.2. Nutritional Evaluation
Parents and caregivers received initial training to complete a three-day, 24-hour dietary recall submitted during the next follow-up visit. Caregivers, children, and adolescents were told to complete the recall together. A single trained dietitian reviewed each dietary record. When information was missing or unclear, the dietitian used food models and standard household utensils (e.g., cups and spoons) to help estimate portion sizes and cooking methods. Dietary data were collected at two time points: baseline and six months later, providing a representative six-day dietary intake profile per participant.
The same dietitian analyzed all reported foods using Metabolic Pro® software [12]. Nutrient intake was averaged across the six days to calculate the Adequacy Percentage (AP) for each nutrient. The AP was calculated by dividing the amount of a nutrient consumed by the Recommended Dietary Allowance (RDA) and multiplying by 100.
Participants were stratified into two age groups (4–8 years and 9–13 years), and nutrient intake was compared against the RDA values for the Mexican population, according to sex and age [13]. The AP was calculated to assess nutritional adequacy (see Supplementary Table S1).
2.3. Anthropometric Evaluation
Anthropometric measurements were obtained at baseline by a single standardized dietitian. All measurements were taken in the morning or early afternoon, with participants wearing underwear and no shoes. Weight was measured using a Tanita® pediatric digital scale (BF-689, Japan), and height was measured with a SECA 206 portable stadiometer (Germany), following World Health Organization (WHO) protocols [14].
Body Mass Index (BMI) was calculated as weight (kg) divided by height squared (m²) using WHO Anthro Plus software (v.1.0.4), and classified according to WHO 2007 BMI-for-age Z-score criteria: underweight (< –2 SD), normal weight (–2 to +1 SD), overweight (> +1 SD), and obesity (> +2 SD) [15]. Stunting was defined as a height-for-age Z-score < –2 SD.
Mid-upper arm circumference (MUAC) and triceps skinfold thickness (TST) were measured in duplicate at the midpoint on the dominant arm using a Gülick fiberglass tape and a Lange skinfold caliper, respectively, according to WHO guidelines [14]. Measurements were interpreted using Frisancho percentiles [16]. MUAC values <5th percentile indicated risk of undernutrition; 5th–95th percentiles were considered normal; and values >95th percentile indicated obesity risk. TST percentiles were interpreted as follows: ≤5th percentile indicated muscle mass depletion, 5th–15th low muscle mass (at risk), 15th–75th average muscle mass, 75th–85th high muscle mass (at risk), and >85th excess muscle mass (obesity).
2.4. Biochemicals
Peripheral blood samples were collected after an 8-hour fast. Tests included complete blood count, fasting glucose, insulin, total cholesterol, LDL, HDL, triglycerides, liver transaminases (AST and ALT), and plasma amino acids. To this end, analysis and processing of blood samples were carried out in a surrogate clinical laboratory under protocols that accomplished internationally recognized standards for quality. Reference ranges are presented in Supplementary Table S2. Abnormal values were defined as those falling outside the reference intervals. Biochemical parameters were categorized according to the participants BMI (underweight, normal weight, overweight, and obesity), to assess statistical significance across these groups.
Plasma Amino Acids
Blood amino acids–including alanine, arginine, citrulline, glycine, XLE-OHPro (a composite of leucine, isoleucine alloisoleucine and hydroxyproline), methionine, ornithine, phenylalanine, proline, tyrosine, and valine–were quantified using tandem mass spectrometry following a standard protocol as described by Ibarra-González [20]. A commercial kit (Neobase, Perkin Elmer, Wallac Oy, Turku, Finland) was used to extract amino acids from blood samples, following the manufacturer’s instructions. The samples were then analyzed using a triple quadrupole tandem mass spectrometer (Quattro micro-API, Waters Inc., Milford, MA, USA) with electrospray ionization to separate, detect, and quantify amino acids.
2.5. Statistical Analysis
Continuous variables are presented as mean ± standard deviation or as median (25th–95th percentile), depending on the distribution. Dichotomous variables are expressed as frequencies. The Kolmogorov–Smirnov test was used to assess the normality of variable distributions. For comparisons, either the paired Student’s t-test or the Wilcoxon signed-rank test was applied, as appropriate. Statistical analyses were performed using SPSS software (version 25, IBM Corp., Armonk, NY, USA), and figures were created using GraphPad Prism (version 9, GraphPad Software, San Diego, CA, USA).
2.6. Ethical Considerations
The study was conducted in accordance with the Declaration of Helsinki, and the protocol was approved by the Research, Ethics, and Biosafety Institutional Committees of the Instituto Nacional de Pediatría (approval number 2023/018, approved on 18 May 2023). All participating families received nutritional and medical follow-up.
3. Results
3.1. Study Population
A total of 55 participants were enrolled: 38 (69%) were children and 17 (31%) were adolescents. The average weight and height were 26.4 ± 8.4 kg and 122.8 ± 8.6 cm in the children group, and 39.5 ± 12.6 kg and 142.2 ± 11.3 cm in the adolescent group, respectively. Based on the BMI-for-age Z-scores of the 55 participants, 60% (33 children and adolescents) were of normal weight, 36.4% (20 children and adolescents) were classified as overweight or obese, and 3.6% (two adolescents) were underweight. Table 1 details the demographic characteristics of the population.
3.2. Biochemical Parameters
In children with elevated LDL levels, 5.2% were overweight and 2.6% were obese. Additionally, 5.3% of children with high triglycerides were obese. A striking 89.4% of children had low HDL cholesterol levels; 63.1% had normal weight, while 26.3% were overweight or obese.
Among adolescents, 11.8% had high triglycerides, equally divided between those with normal weight and those with obesity. Remarkably, 94.1% had low HDL cholesterol levels, while only 5.9% had optimal HDL values. Among adolescents with low HDL, 11.7% were undernourished, 35.4% had normal weight, and 47% were overweight or obese.
3.3. Anthropometric Indicators
Waist circumference above the 90th percentile was observed in 21.1% of children and 23.5% of adolescents. Anthropometric characteristics of the population are detailed in Table 2.
When waist-to-height ratio (WHtR) was compared to participant’s BMI categories, it was found that in the children’s group, 7.8% of participants with a normal BMI already had a WHtR >0.5. Among those classified as obese, 31.5% had a WHtR >0.5. In the adolescent group, 11.7% of participants with overweight and 23.5% of those with obesity also showed a WHtR above 0.5 (Figure 1).
Regarding triceps skinfold thickness (TST), 44.7% of the children had values above the 85th percentile, indicating excess fat mass. Notably, among these children, 18.4% had a normal BMI, 5.3% were overweight, and 21% were obese. In the adolescent group, 41.1% presented TST above the 85th percentile; of these, 17.6% were overweight and 23.5% were obese (Figure 2).
3.4. Family Medical History
Among participants, 61.8% had a family history of type 2 diabetes, 43.6% had a history of obesity, and 16.3% had a history of cardiovascular disease.
3.5. Differences in Adequacy Percentage of Nutrients Between Children and Adolescents
Our analysis revealed notable differences in the adequacy percentage of several nutrients between school-aged children and adolescents. Children met 78% of their recommended daily caloric intake, whereas adolescents met only 55% of their age-specific RDA.
Adequacy protein percentage was significantly higher in children, who reported an ingestion of 226.9% of their RDA for age, compared to 148.2% in adolescents (p < 0.0001). The percentage of energy from protein was 16.5% and 17.4% in children and adolescents, respectively, above the recommended 15%. Amino acid intake was also significantly higher in the 4–8-year-old group (p < 0.05). These differences are summarized in Supplementary Table S3.
Fat intake was similar between groups, averaging 47.2 ± 10.9 g in children and 44.2 ± 10.4 g in adolescents. In both groups, the percentage of energy derived from fat exceeded the recommended limit; children obtained 33.9% and adolescents 34% of their total energy intake from fat, surpassing the 30% recommended by the Mexican Dietary Reference Intakes. Average cholesterol intake also exceeded the RDA of 130 mg per 1000 kcal, reaching 107% in children and 139.9% in adolescents. Intake of Omega-3 and Omega-6 fatty acids was below the recommended levels in both groups.
Carbohydrate intake averaged 156.8 ± 35.2 g in children and 138.9 ± 37.8 g in adolescents, representing 49.6 ± 4.8% and 48.1 ± 5.2% of total energy intake, respectively. Fiber intake was suboptimal in both groups: children met only 56% of their RDA, while adolescents reached just 35.3%. In contrast, both groups consumed significantly more added sugars than recommended, with children exceeding the recommended limit by 147% (total intake: 247%) and adolescents by 140% (total intake: 240%).
Significant differences (p < 0.05) were observed in the intake adequacy of vitamins C, E, A, B6, and B12, with children consistently exhibiting higher adequacy percentages than adolescents. Overall, the AP of most micronutrients and vitamins in both groups remained below the RDA. Key micronutrients such as calcium, iron, and zinc did not meet the RDA in either group. In contrast, phosphorus, selenium, and sodium reached or exceeded 100% of the RDA in children, while among adolescents, only selenium and sodium approached or surpassed the recommended values.
Anemia was detected in approximately one-third of the study population in both age groups. Regarding vitamin intake, children showed adequate or near-adequate intake (≥100% RDA) for vitamin B6, B12, thiamine, riboflavin, and niacin, while vitamins C, D, E, K, A, and folate fell below recommended levels. In adolescents, adequacy percentages were low for vitamins C, B12, D, E, K, thiamine, A, and folate.
3.6. Plasma Amino Acid Levels
Comparisons between normal-weight and excess-weight participants showed that the normal-weight group had higher dietary adequacy percentages for essential amino acids based on RDA values: leucine (182.18%), isoleucine (179.8%), methionine (119.98%), phenylalanine (133.64%), valine (162.10%), and tyrosine (106.74%).In contrast, participants with overweight or obesity had slightly lower adequacy percentages: leucine (177.04%), isoleucine (175.3%), methionine (118.97%), phenylalanine (126.39%), valine (155.61%), and tyrosine (105.26%).
Among children specifically, plasma amino acid analysis revealed significantly higher concentrations of leucine/isoleucine (p = 0.010), valine (p = 0.001), phenylalanine (p = 0.016), tyrosine (p = 0.025), and proline (p = 0.003) in the overweight/obese group compared to those with normal weight (Figure 3). Additional differences in plasma amino acids profiles between normal-weight and overweight/obese children and adolescents are detailed in Supplementary Table S4.
4. Discussion
In this study, we evaluated the biochemical, anthropometric, and dietary profiles of children and adolescents, identifying early metabolic risk factors associated with overweight and obesity such as altered waist-to-height ratio (WHtR) in both obese and normal weight individuals, low HDL cholesterol levels, elevated plasma amino acids, and notably high intake of protein, fat, cholesterol, sodium and sugars, alongside low intake of fiber, key vitamins and minerals in a Mexican semi-rural cohort.
In this cohort, 20% of participants reported hypercholesterolemia, 7.2% hypertriglyceridemia, and 5.4% hyperglycemia. A Mexican study of urban children aged 6-12 years reported higher rates of hypertriglyceridemia (22%), below rates of hypercholesterolemia (12%) and hyperglycemia (4%), highlighting that the differences between rural and urban areas are becoming blurred [21]. Notably, 89.4% of children in our study exhibited low HDL cholesterol levels. This is consistent with existing data indicating that the Mexican population, including children, frequently exhibits a dyslipidemic profile characterized by elevated triglycerides and reduced HDL levels. Previous studies have identified genetic contributors to these alterations. For example, polymorphisms in FTO, MC4R, LEP, and LEPR genes have been significantly associated with obesity and hypertriglyceridemia in Mexican children aged 4–13 years (n=718) [22]. Additionally, gene–gene and gene–diet interactions, such as those involving SIDT2 and ABCA1, influence HDL cholesterol levels. The ABCA1 rs9282541-A variant, for instance, was associated with lower HDL-c levels (OR = 1.34, p = 0.013) in Mexican adults (n=1982) [23]. Further research is warranted to evaluate these genetic variants in the pediatric population of Tlaltizapán and their potential interaction with dietary patterns and ancestry. The observed high intake of dietary fat, protein, and unsaturated fatty acids—along with Mexican ancestry and the multifactorial nature of metabolic risk—may contribute to these metabolic disturbances, even in the absence of obesity.
Plasma amino acid analysis revealed significantly higher concentrations of branched-chain amino acids (BCAAs)—valine and leucine—as well as aromatic amino acids such as tyrosine and phenylalanine, and also proline, in children with excess weight. These findings are consistent with previous literature linking altered amino acid profiles to obesity and insulin resistance [10,24]. The elevated BCAAs and aromatic amino acids may reflect a subclinical pro-inflammatory state, potentially driven by the consumption of foods rich in fat and protein, as suggested by the high intake levels observed in this group. Amino acid elevations have been implicated in the pathophysiology of obesity and are associated with increased metabolic risk, including the future development of insulin resistance [25,26]. In contrast, among adolescents, no statistically significant differences were found in plasma amino acid concentrations between normal-weight and excess-weight participants. This lack of significance is likely attributable to the smaller sample size in the adolescent group, which may have limited the statistical power.
Waist circumference and WHtR are increasingly recognized as key indicators of pediatric metabolic risk. WHtR, an index of central adiposity, is a useful predictor of cardiometabolic complications [27]. In our study, WHtR >0.5 was observed in children with normal BMI, suggesting a possible hidden metabolic risk. One-third of children with obesity showed marked abdominal obesity. Among adolescents, only those who were overweight or obese exhibited elevated WHtR values, indicative of increased cardiometabolic risk. Overall, 38% of participants had a WHtR >0.5 comparable to the 39% reported in a urban mexican children study [21].
To gain a more comprehensive understanding of body composition, we compared waist circumference and triceps skinfold thickness (TST) with BMI. Our findings highlight the limitations of relying solely on BMI to assess cardiometabolic risk. A notable number of children with a normal BMI displayed altered anthropometric and biochemical parameters, including elevated TST, WHtR, and lipid abnormalities. These results highlight the importance of incorporating additional indicators to better evaluate adiposity and metabolic health in pediatric populations.
Based on BMI-for-age Z-score interpretation, 36.4% participants were overweight or obese. These results are consistent with the 2022–2023 National Health and Nutrition Survey (ENSANUT), which reported a prevalence of 36.5% for overweight and obesity among school-aged children and 40.4% among adolescents in Mexico [1]. Similarly, Gatica-Domínguez (2019) reported that in Tlaltizapán, 35.6% of children were overweight or obese (20% overweight and 15.6% obese), a figure comparable to ours, though with a slight increase in total prevalence (36.4%), and a higher proportion of obesity (21.8%) compared to overweight (14.5%) [5].
In this context, the recent redefinition of obesity by The Lancet Diabetes & Endocrinology Commission, which differentiates preclinical and clinical obesity, becomes particularly relevant. Preclinical obesity refers to excess adiposity without current organ damage but with increased metabolic risk, while clinical obesity involves functional impairment [28]. Our results support this distinction, as several children with normal BMI already exhibited early metabolic and anthropometric alterations. Early detection of preclinical obesity is crucial for implementing timely, preventive strategies, especially in semi-rural settings with limited access to specialized healthcare.
Our data also showed that participants with a familial history of obesity had lower adherence to RDA for age, consistent with prior evidence indicating that these individuals may face additional behavioral challenges [1, 29].
Although we used 24-hour dietary recalls instead of food frequency questionnaires—which limits our ability to assess long-term dietary patterns—this method is culturally appropriate, accessible for low-literacy populations, and reliable for estimating average group intake across multiple days [30]. A strength of this study was the thorough analysis of dietary data, which allowed quantitative comparison with RDA values. The low energy intake observed in both children and adolescents may reflect underreporting and could potentially result in overestimation of micronutrient and vitamin deficiencies [31].
Alarmingly 90.9% of our participants exceeded WHO’s recommended limit of ≤5% of total energy intake from added sugars [32]. The macronutrient distribution and AP for micronutrients and vitamins suggest a dietary pattern rich in animal products, saturated fats, and simple sugars, and low in fruits, vegetables, dairy, and whole grains
We also observed that adolescents had poorer adherence to RDA than younger children, which may be influenced by increasing autonomy and media exposure. A study from Andalusia [33] reported similar trends, showing lower intake of calcium, magnesium, zinc, and vitamins B12 and E among adolescents. Likewise, a Brazilian study showed that a healthy dietary pattern was more common among children, while adolescents exhibited a more restrictive and sugar-heavy pattern [34].
Our findings reaffirm that overweight and obesity in children often coexists with macro- and micronutrient deficiencies, as previously described [9]. These deficiencies may be due not only to low intake of nutrient-dense foods, as seen in our study, but also to impaired absorption and chronic low-grade inflammation [8]. Studies have shown that individuals with obesity consuming hypercaloric diets often have poorer micronutrient status than those consuming isocaloric but higher quality diets [35].
Several nutritional metabolic risks were identified in children and adolescents regardless of their BMI Z-Score, including anthropometric (WtHR), biochemical (HDL), and dietary (high fat, protein, less fiber, vitamins, and minerals) indicators. Our study revealed a higher obesity prevalence than previously reported in the same area. Proper detection and treatment of obesity and related metabolic risks is essential. Altogether, our findings contribute to the growing body of evidence supporting a more nuanced and multifactorial approach to pediatric obesity, emphasizing the need for early metabolic screening and personalized dietary interventions, particularly in vulnerable semi-rural communities.
Supplementary Materials
The following supporting information can be downloaded at the website of this paper posted on Preprints.org: Table S1: Recommended Dietary Allowances (RDA), Table S2: Biochemical reference values , Table S3: Total ingestion and differences in adequacy percentage of nutrients between children and adolescents, Table S4: Plasma amino acid levels in children and adolescents.
Author Contributions
Conceptualization: LFH, MERF, NLHM; Methodology: NBT, LFH, SGL, LCM, IMV; Formal analysis: IMV; Investigation: NBT, DGS, CFL, MVA, AKAB, SGL, LCM, LFH; Resources: LFH, MERF, NLHM; Data curation: SGL, LCM, IMV; Writing—original draft preparation: NBT, SGL, LFH; Writing—review and editing: LFH, MERF, NLHM, IMV, CFL, MVA; Supervision: LFH; Project administration: LFH, MERF, NLHM, RCF; Funding acquisition: LFH, MERF, NLHM. All authors have read and agreed to the published version of the manuscript.
Funding
This research was funded by the Instituto Nacional de Pediatría, Secretaría de Salud. (Recursos Fiscales 2022–2024), Programa E022 Investigación y Desarrollo Tecnológico en Salud, Ciudad de México, Mexico. Additional support (biochemical studies) was provided by Laboratorio Clínico del Centro Médico Dalinde, Ciudad de México, México. The funding bodies had no role in the design of the study; in the collection, analysis, or interpretation of data; in the writing of the manuscript; or in the decision to publish the results.
Data Availability Statement
The original contributions presented in this study are included in the article. Further information can be available after inquiries to the corresponding author.
Acknowledgments
We would like to thank Porfirio Zúñiga Mejía for his invaluable assistance in coordinating the processing and analysis of the biochemical studies. Special thanks to Alma Nely Hernández Mercado, Oscar Salazar Soto, and Carlos Ramos for their support in patient recruitment, sample collection, and logistical assistance at CePIC, Tlaltizapán. We are also grateful to the medical and nursing staff at the center for their collaboration. We also acknowledge Carolina Olivera, Abigail Pérez Hernández, and Israel Alvarado for their valuable support in patient recruitment, sample collection, and logistical assistance during fieldwork in Tlaltizapán, Morelos.
Conflicts of Interest
The authors declare no conflicts of interest.
Abbreviations
The following abbreviations are used in this manuscript:
| BMI | Body Mass Index |
| AP | Adequacy Percentage |
| RDA | Recommended Dietary Allowance |
| WHtR | Waist-to-Height Ratio |
| TST | Triceps Skinfold Thickness |
| NW | Normal Weight |
| OW | Overweight |
| WHO | World Health Organization |
References
- Shamah-Levy, T.; Cuevas-Nasu, L.; Morales-Ruan, C.; Humaran, I.M.-G.; A Ávila-Arcos, M.; Gaona-Pineda, E.B.; Valenzuela-Bravo, D.G. Prevalencias de sobrepeso y obesidad en población escolar y adolescente de México. Ensanut Continua 2020-2022. Salud Publica De Mex. 2023, 66, 78–85. [Google Scholar] [CrossRef] [PubMed]
- Shamah-Levy, T.; Cuevas-Nasu, L.; Ávila-Arcos, M.A.; Rodríguez-Ramírez, S.; Morales-Ruán, M.D.C.; Gómez-Acosta, L.M.; García-Feregrino, R.; Gaona-Pineda, E.B.; González-Castell, L.D.; Rivera-Dommarco, J. Desnutrición crónica en población infantil de localidades con menos de 100 000 habitantes en México. Salud Publica De Mex. 2019, 61, 833–840. [Google Scholar] [CrossRef]
- Cuevas-Nasu, L.; Shamah-Levy, T.; Romero-Martínez, M.; Vielma-Orozco, E.; Heredia-Hernández, O.; Mojica-Cuevas, J.; Rivera-Dommarco, J. Encuesta Nacional de Salud y Nutrición 2018-19: metodología y perspectivas. Salud Publica De Mex. 2019, 61, 917–923. [Google Scholar] [CrossRef]
- Servicios de Salud de Morelos. (2021a). Diagnóstico estatal de salud 2021: Fichas técnicas de centros de salud por municipio [PDF file]. Servicios de Salud de Morelos. https://ssm.gob.mx/portal/diagnostico-estatal-en-salud/2021/Diagnostico%20Estatal%20de%20Salud%2C%20Ed%202021.pdf.
- E Moreno-Saracho, J.; Gatica-Domínguez, G.; Cortés, J.D.; Henao-Moran, S.A.; A Rivera, J. Condición física de escolares tras intervención educativa para prevenir obesidad infantil en Morelos, México. Salud Publica De Mex. 2019, 61, 78–85. [Google Scholar] [CrossRef]
- Adeyele, T.K. Food Choice and Nutritional Intake of Children and Adolescents. Int. J. Multidiscip. Res. Anal. 2021, 4. [Google Scholar] [CrossRef]
- Walczak, M.; Petriczko, E.; Raducha, D.; Kostrzeba, E.; Berus, E.; Ratajczak, J. Assessment of Biochemical Parameters in 8- and 9-Year-Old Children with Excessive Body Weight Participating in a Year-Long Intervention Program. J. Clin. Med. 2023, 12, 6560. [Google Scholar] [CrossRef]
- Karjoo, S.; Bradley, M.; Melchor, J.; Carr, R. Obesity and malnutrition in children and adults: A clinical review. Obes. Pillars 2023, 8, 100087. [Google Scholar] [CrossRef]
- Todisco, C.F.; Agostinelli, M.; La Mendola, A.; Verduci, E.; Calcaterra, V.; Zuccotti, G.; Dolor, J.; Tosi, M.; Milanta, C.; Bona, F. Micronutrient Deficiency in Children and Adolescents with Obesity—A Narrative Review. Children 2023, 10, 695. [Google Scholar] [CrossRef]
- Sztefko, K.; Wójcik, M.; Berska, J.; Bugajska, J. Amino acid profile in overweight and obese prepubertal children – can simple biochemical tests help in the early prevention of associated comorbidities? Front. Endocrinol. 2023, 14, 1274011. [Google Scholar] [CrossRef]
- Neumark-Sztainer, D.; Wall, M.; Sherwood, N.E.; Corbeil, T.; French, S.A.; Berge, J.M. Obesity in Adolescence Predicts Lower Educational Attainment and Income in Adulthood: The Project EAT Longitudinal Study. Obesity 2018, 26, 1467–1473. [Google Scholar] [CrossRef]
- Genetic Metabolic Dietitians International. (2025). MetabolicPro. https://www.gmdi.org/MetabolicPro.
- Bourges, H.; Casanueva, E.; Rosado, J. L. (2009). Recomendaciones de ingestión de nutrimentos para la población mexicana (Tomo 1 y 2). Editorial Médica Panamericana.
- World Health Organization. Physical status: The use and interpretation of anthropometry. World Health Organization: Geneva, 1995. [Google Scholar]
- World Health Organization. WHO child growth standards based on length/height, weight and age. Acta Paediatrica. Supplement 2006, 95, 76–85. [Google Scholar] [CrossRef] [PubMed]
- Frisancho, R. Anthropometric standards. An interactive nutritional reference of body size and body composition for children and adults; The University of Michigan Press: Ann Arbor, 2011. [Google Scholar]
- World Health Organization. Waist circumference and waist-hip ratio: Report of a WHO expert consultation. World Health Organization: Geneva, 8–11 December 2011. [Google Scholar]
- International Diabetes Federation. (2007). The IDF consensus definition of the metabolic syndrome in children and adolescents. Brussels: International Diabetes Federation.
- Pietrobelli, A.; Heo, M.; Bedogni, G.; Brambilla, P. Waist circumference-to-height ratio predicts adiposity better than body mass index in children and adolescents. Int. J. Obes. 2013, 37, 943–946. [Google Scholar] [CrossRef]
- Ibarra-González, I.; Belmont-Martínez, L.; Fernández-Lainez, C.; Guillén-López, S.; López-Mejía, L.; Nieto-Carrillo, R.I.; Vela-Amieva, M. Importance of Studying Older Siblings of Patients Identified by Newborn Screening: a Single-Center Experience in Mexico. J. Inborn Errors Metab. Screen. 2021, 9, e20210001. [Google Scholar] [CrossRef]
- Valle-Leal, J.; Abundis-Castro, L.; Hernández-Escareño, J.; Flores-Rubio, S. Índice cintura-estatura como indicador de riesgo metabólico en niños. Revista Chilena de Pediatría 2015, 87, 180–185. [Google Scholar] [CrossRef] [PubMed]
- Tejero, M.E.; Galván, M.; Fernández, J.C.; López-Rodríguez, G.; Suárez-Diéguez, T.; Estrada-Neria, A. Common polymorphisms in MC4R and FTO genes are associated with BMI and metabolic indicators in Mexican children: Differences by sex and genetic ancestry. Gene 2020, 754, 144840. [Google Scholar] [CrossRef]
- Rivera-Paredez, B.; León-Reyes, G.; Argoty-Pantoja, A.D.; Velázquez-Cruz, R.; Flores, Y.N.; Salmerón, J.; Hidalgo-Bravo, A. Interaction between SIDT2 and ABCA1 Variants with Nutrients on HDL-c Levels in Mexican Adults. Nutrients 2023, 15, 370. [Google Scholar] [CrossRef]
- Suzuki, Y.; Nakamura, K.; Kido, J.; Shimizu, K.; Matsumoto, S. Associations among amino acid, lipid, and glucose metabolic profiles in childhood obesity. BMC Pediatr. 2019, 19, 273. [Google Scholar] [CrossRef]
- Coarfa, C.; Sharma, S.; Puyau, M.; Kanchi, R.; Bacha, F.; El-Ayash, H.; Mohamad, M. Distinct Amino Acid Profile Characterizes Youth With or at Risk for Type 2 Diabetes. Diabetes 2024, 73, 628–636. [Google Scholar] [CrossRef]
- Mootha, V.K.; Grinspoon, S.K.; Shaham, O.; McCarthy, M.A.; McCormack, S.E.; Clish, C.B.; Deik, A.A.; Gerszten, R.E.; Fleischman, A.; Wang, T.J. Circulating branched-chain amino acid concentrations are associated with obesity and future insulin resistance in children and adolescents. Pediatr. Obes. 2012, 8, 52–61. [Google Scholar] [CrossRef]
- Yoo, E.-G. Waist-to-height ratio as a screening tool for obesity and cardiometabolic risk. Korean J. Pediatr. 2016, 59, 425–431. [Google Scholar] [CrossRef]
- Endocrinology, T.L.D. &. Redefining obesity: advancing care for better lives. Lancet Diabetes Endocrinol. 2025, 13, 236–285. [Google Scholar] [CrossRef]
- Scott, J.; Holder, S.M.; Schmalz, D.L.; Fipps, D.C. Family history of obesity and the influence on physical activity and dietary adherence after bariatric surgery. J. Perioper. Pr. 2021, 32, 230–233. [Google Scholar] [CrossRef]
- Gibson, R.S.; Bell, W.; Charrondiere, U.R. Measurement Errors in Dietary Assessment Using Self-Reported 24-Hour Recalls in Low-Income Countries and Strategies for Their Prevention. Adv. Nutr. Int. Rev. J. 2017, 8, 980–991. [Google Scholar] [CrossRef] [PubMed]
- Forrestal, S.G. Energy intake misreporting among children and adolescents: a literature review. Matern. Child Nutr. 2010, 7, 112–127. [Google Scholar] [CrossRef] [PubMed]
- World Health Organization. (2015). Guideline: Sugars intake for adults and children. Recommendations and remarks. https://www.ncbi.nlm.nih.gov/books/NBK285525/.
- Gimenez Blasi, N.; Antonio Latorre, J.; Martinez Bebia, M.; Olea Serrano, F.; Mariscal Arcas, M. Comparison of diet quality between young children and adolescents in the Mediterranean basin and the influence of life habits. Nutrición Hospitalaria 2019, 36, 387–393. [Google Scholar] [CrossRef]
- Bosa, V.L.; Vencato, P.H.; Ufrgs, B.; Rockett, F.C.; Corrêa, R.d.S. Padrões alimentares de escolares: existem diferenças entre crianças e adolescentes? Cienc. Saude Coletiva 2017, 22, 553–562. [Google Scholar] [CrossRef]
- Gapparova, K.M.; Lapik, I.A.; Galchenko, A.V. Micronutrient status in obese patients: A narrative review. Obes. Med. 2020, 18, 100224. [Google Scholar] [CrossRef]
Figure 1.
Waist-to-height ratio compared to participants BMI. Panel A (left): Children (4-8 years), Panel B: Adolescents (9-13 years). Abbreviations; NW: normal weight, OB: obese, OW: overweight, WHtR: waist-to-height ratio.
Figure 1.
Waist-to-height ratio compared to participants BMI. Panel A (left): Children (4-8 years), Panel B: Adolescents (9-13 years). Abbreviations; NW: normal weight, OB: obese, OW: overweight, WHtR: waist-to-height ratio.
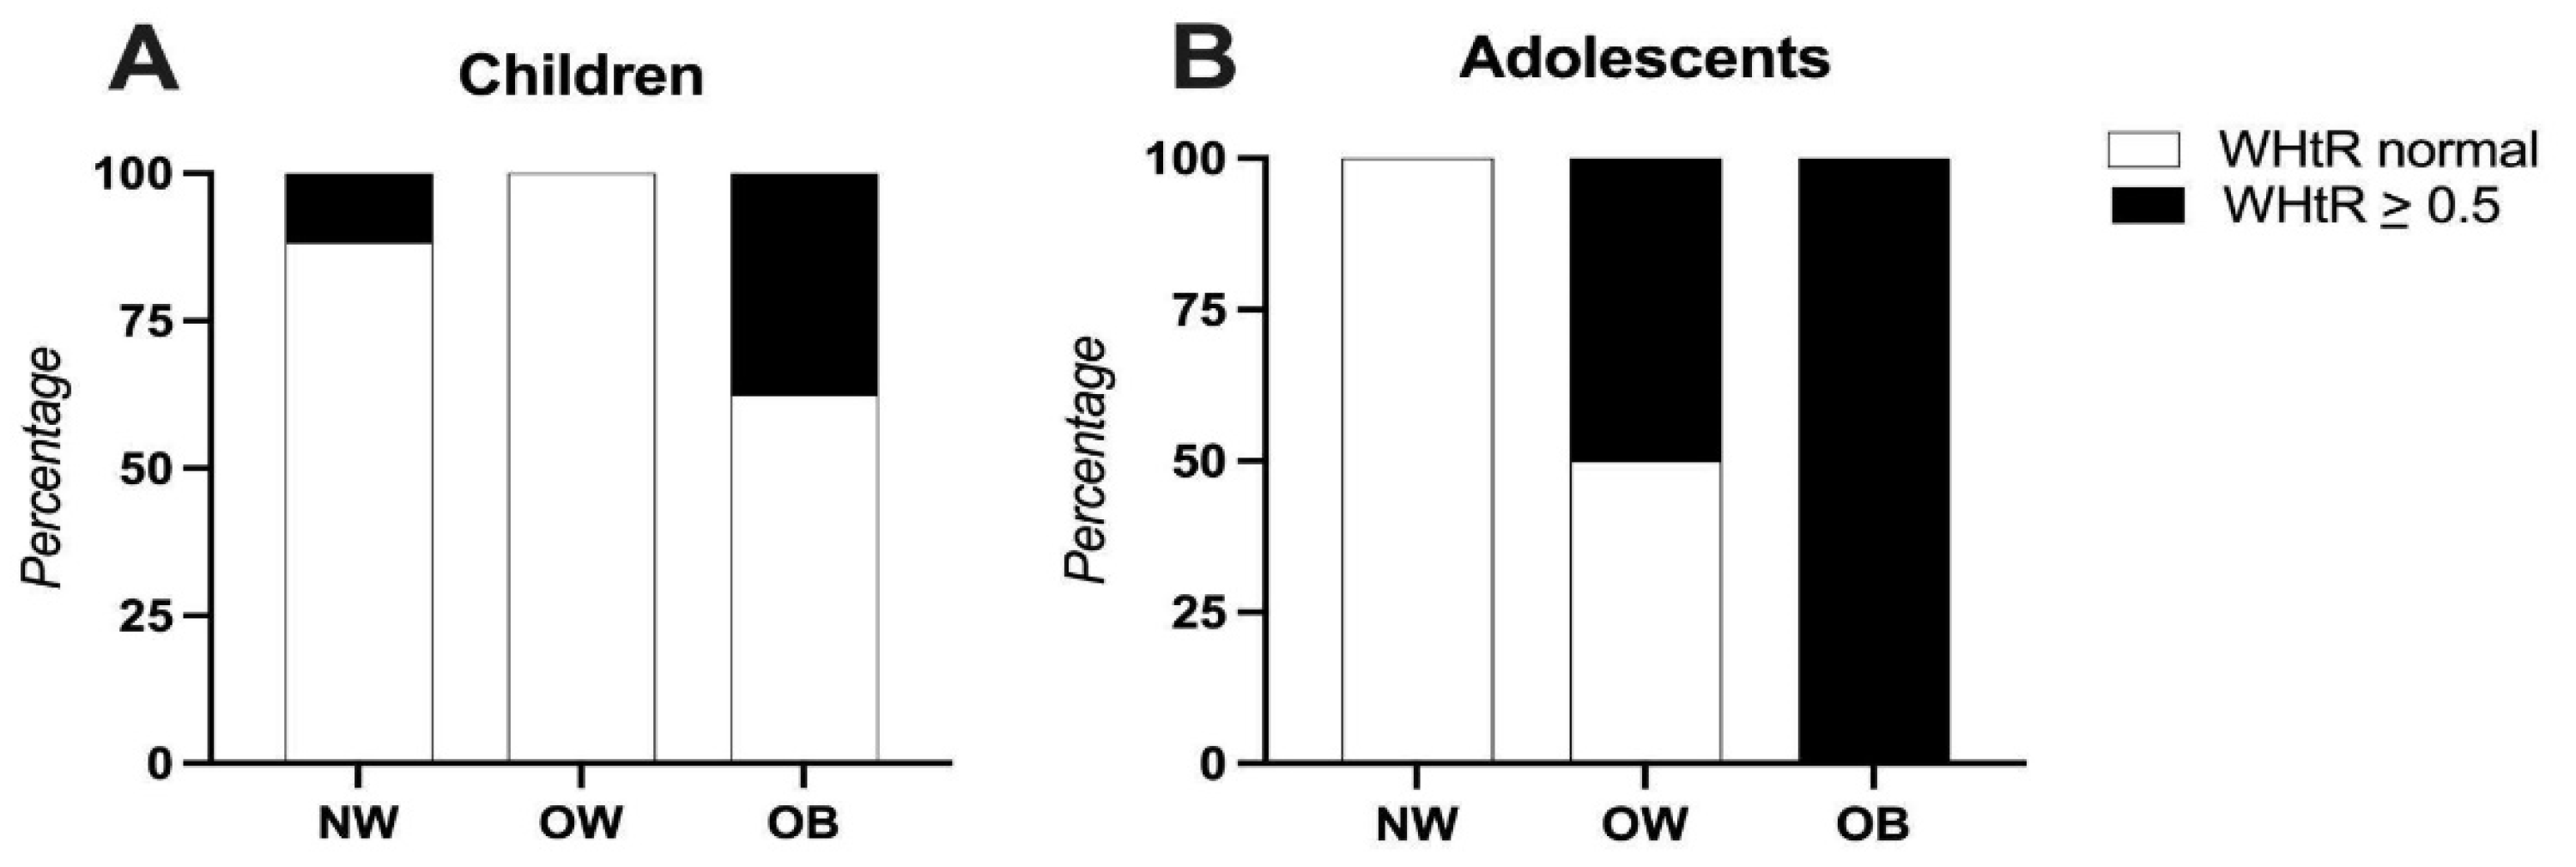
Figure 2.
Triceps skinfold thickness compared to participants BMI. Panel A (left): Children (4-8 years), Panel B: Adolescents (9-13 years). Abbreviations; NW: normal weight, OB: obese, OW: overweight, TST: Triceps skinfold thickness.
Figure 2.
Triceps skinfold thickness compared to participants BMI. Panel A (left): Children (4-8 years), Panel B: Adolescents (9-13 years). Abbreviations; NW: normal weight, OB: obese, OW: overweight, TST: Triceps skinfold thickness.
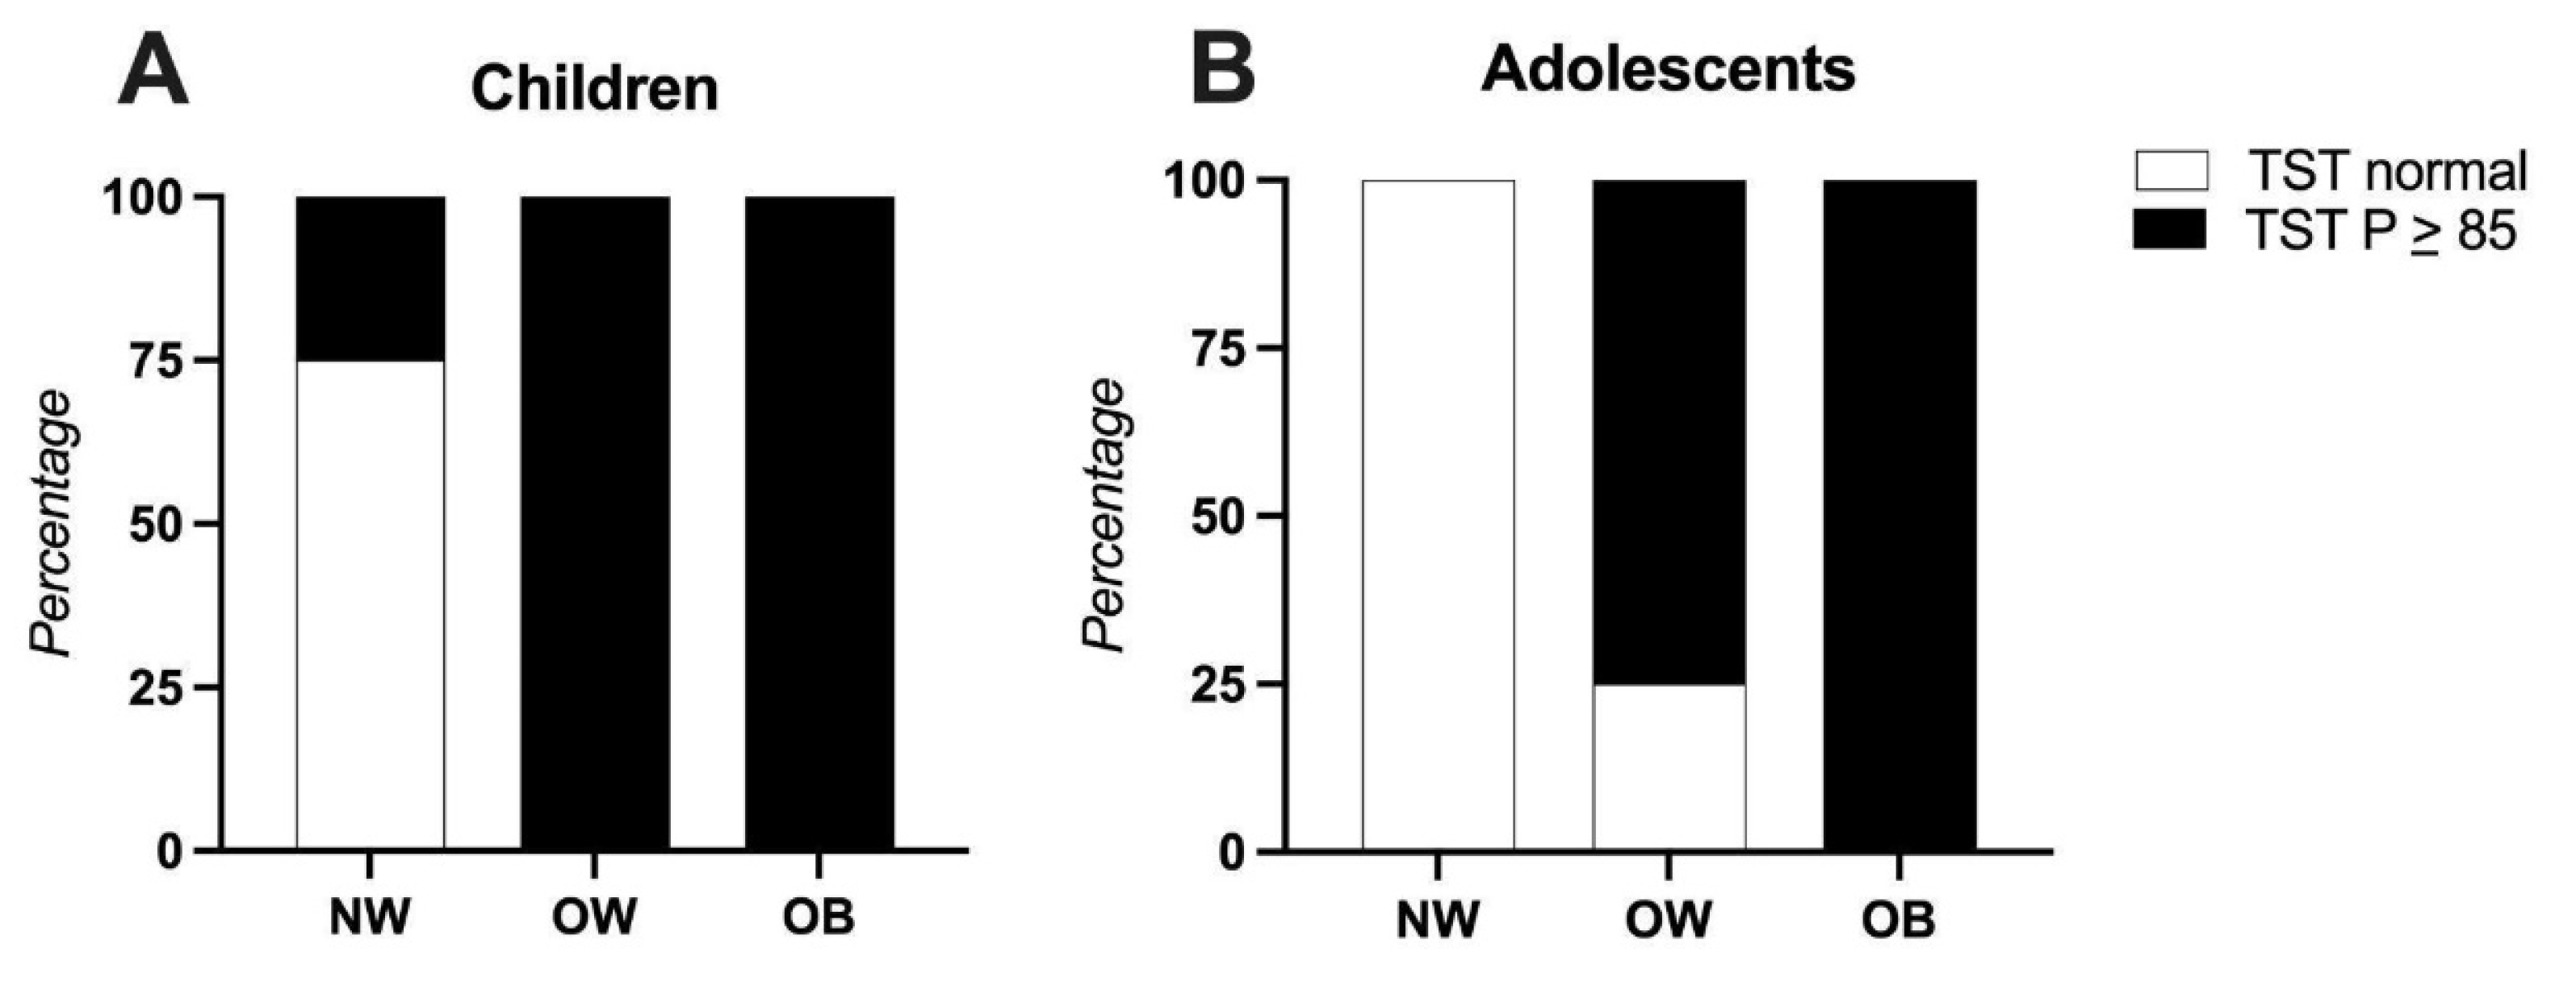
Figure 3.
Differences in plasma amino acid levels between normal-weight and overweight children. Abbreviations; NM: Normal Weight, OW: Overweight, *: p ≤0.05, **: p ≤0.001.
Figure 3.
Differences in plasma amino acid levels between normal-weight and overweight children. Abbreviations; NM: Normal Weight, OW: Overweight, *: p ≤0.05, **: p ≤0.001.
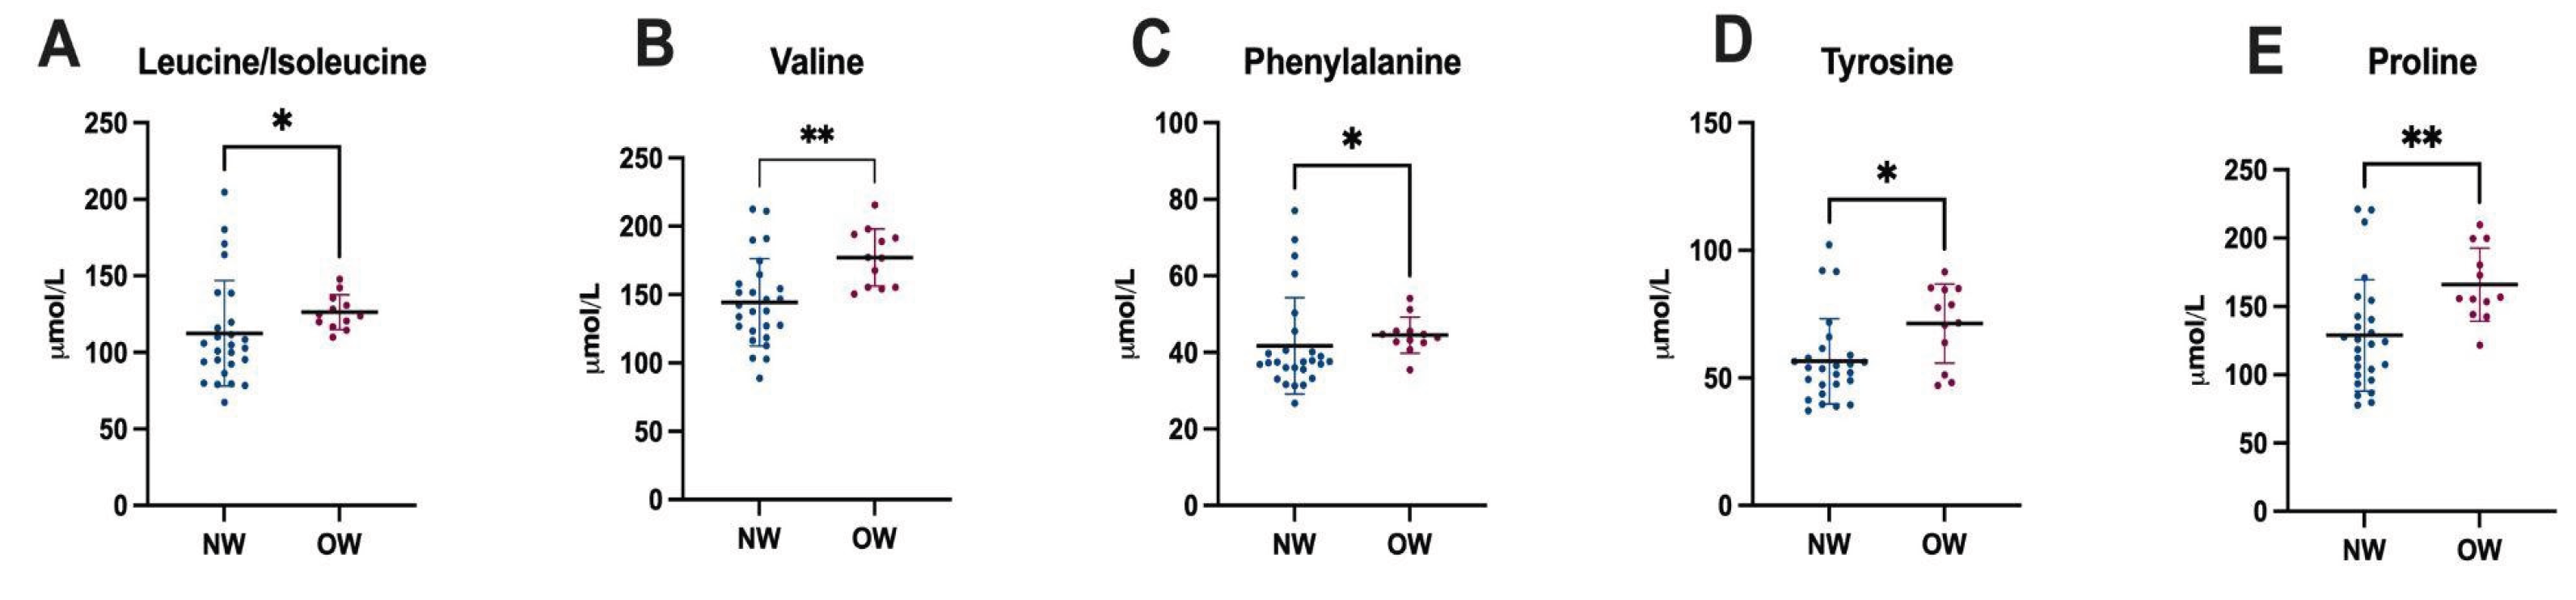

Table 1.
Demographic, anthropometric, and biochemical characteristics of children and adolescents from Tlaltizapán, Mexico.
Table 1.
Demographic, anthropometric, and biochemical characteristics of children and adolescents from Tlaltizapán, Mexico.
| Descriptive Characteristics of the Population | ||
|---|---|---|
|
Children n = 38 |
Adolescents n = 17 |
|
| Age ± SD | 6.9 ± 0.9 | 10.1 ± 1.2 |
| Gender, n (%) (Female) (Male) |
20 (52.6) 18 (47.4) |
10 (58.8) 7 (41.2) |
| Z Score BMI interpretation, n (%) (Underweight) (Normal) (Overweight) (Obese) |
0 26 (68.4) 4 (10.5) 8 (21.1) |
2 (11.8) 7 (41.2) 4 (23.5) 4 (23.5) |
| Biochemical and metabolic alterations | ||
| Anemia, n (%) | 12 (31.6) | 4 (26.5) |
| High Glucose levels, n (%) | 2 (5.3) | 1 (5.9) |
| Elevated Total Cholesterol, n (%) | 7 (18.4) | 4 (23.5) |
| Elevated LDL Cholesterol, n (%) | 4 (10.5) | 3 (17.6) |
| HDL, n (%) (Low) (Borderline low) (Optimal) |
12 (31.6) 22 (57.9) 4 (10.5) |
5 (29.4) 11 (64.7) 1 (5.9) |
| Elevated Triglycerides, n (%) | 2 (5.3) | 2 (11.8) |
| Elevated AST, n (%) | 11 (28.9) | 2 (11.8) |
| Elevated ALT, n (%) | 2 (5.3) | 0 (0) |
Abbreviations; AST: Aspartate Aminotransferase, ALT: Alanine Aminotransferase, BMI: Body Mass Index, HDL: High-Density Lipoprotein, LDL: Low-Density Lipoprotein, SD: Standard deviation.
Table 2.
Nutritional interpretation of height-for-age, mid-arm circumference, triceps skinfold thickness, waist circumference, and waist-to-height ratio with categorical distribution.
Table 2.
Nutritional interpretation of height-for-age, mid-arm circumference, triceps skinfold thickness, waist circumference, and waist-to-height ratio with categorical distribution.
| Z Score Height for age interpretation, n (%) | ||
| (Normal) | 36 (97.3) | 15 (88.2) |
| (Stunted) | 1 (2.6) | 2 (11.8) |
| Mid-arm-circumference interpretation, n (%) | ||
| (Normal) | 25 (65.8) | 13 (76.5) |
| (Underweight risk) | 10 (26.3) | 3 (17.6) |
| (Obesity risk or muscle hypertrophy) | 3 (7.9) | 1 (5.9) |
| Triceps skinfold thickness interpretation, n (%) | ||
| (MM - depletion) | 1 (2.6) | 2 (11.8) |
| (MM below media - Risk) | 1 (2.6) | 1 (5.9) |
| (Average MM) | 12 (31.6) | 5 (29.4) |
| (MM above media - At risk) | 7 (18.4) | 2 (11.8) |
| (MM Excess - obesity) | 17 (44.7) | 7 (41.2) |
| Waist circumference, (cm) | 61.1 ± 11 | 69 ± 13 |
| Waist circumference interpretation, n (%) | ||
| At risk | 8 (21.1) | 4 (23.5) |
| Waist-to-height ratio (media) | 0.49 ± 0.07 | 0.48 ± 0.07 |
| Waist-to-height ratio interpretation, n (%) | ||
| At risk | 15 (39.8) | 6 (35.3) |
Abbreviations; MM: Lean muscle mass.
Disclaimer/Publisher’s Note: The statements, opinions and data contained in all publications are solely those of the individual author(s) and contributor(s) and not of MDPI and/or the editor(s). MDPI and/or the editor(s) disclaim responsibility for any injury to people or property resulting from any ideas, methods, instructions or products referred to in the content. |
© 2025 by the authors. Licensee MDPI, Basel, Switzerland. This article is an open access article distributed under the terms and conditions of the Creative Commons Attribution (CC BY) license (http://creativecommons.org/licenses/by/4.0/).
Copyright: This open access article is published under a Creative Commons CC BY 4.0 license, which permit the free download, distribution, and reuse, provided that the author and preprint are cited in any reuse.


