Submitted:
04 June 2025
Posted:
05 June 2025
You are already at the latest version
Abstract
In order to improve the fatigue reliability of medical welded structures in service, a multi-physics field modeling framework based on heat-force coupled finite element and fatigue damage theory was constructed to quantitatively analyze the residual stress and fatigue life of 316L stainless steel welds. The results show that the predicted life of lap weld is 22.8×10³ cycles, which is 50.5% lower than that of cross weld under the condition of heat input density of 2.6×10⁸ W/m³ and principal stress gradient up to 85.3 MPa/mm. The error between the model and the measured data was controlled within 6%, and the R² was up to 0.988, which verified the applicability of the modeling system. It is analyzed that the stress gradient and structural geometric features have a significant effect on the fatigue life, and the parametric model can provide a theoretical basis for the reliability design of medical structures.
Keywords:
residual stress
; fatigue life prediction
; medical welded structures
1. Introduction
Metal welded structures in medical devices have become important basic components in clinical applications due to their key role in minimally invasive implantation, structural stability and long-term service. However, the residual stresses induced by the welding process and the organizational changes in the heat-affected zone are prone to cause early fatigue crack initiation, which seriously affects the service life and safety boundaries. In the face of complex multiaxial loads coupled with in vivo environment, there is an urgent need to establish a fatigue life estimation model with high fidelity to enhance the design optimization capability and engineering reliability of medical structures. Constructing a computational modeling-based study on the relationship between residual stress field and life behavior has become a key path to ensure the safety performance of devices throughout their life cycle.
2. Requirements Analysis of Residual Stress and Fatigue Life of Medical Welded Structures
Welded structures in medical devices generally have the characteristics of concentrated local heat input and abrupt changes in the stiffness of the connection region, which lead to a strong nonlinear distribution of weld residual stresses on the microscopic scale, which is prone to trigger the early formation of fatigue crack sources, and thus reduces the service reliability. In order to achieve long-term stable operation of structures in bio-contact environments, there is an urgent need to numerically model the distribution of residual stresses in the weld region and to analyze their functional relationships with structural geometrical parameters, thermal cycling conditions, and boundary constraints[1] . Since medical welding alloys (e.g., Ti-6Al-4V or 316L stainless steel) have high strength and moderate thermal conductivity, their thermal-force coupling behavior significantly affects the fatigue life, therefore, the establishment of a multi-physical field-driven estimation framework has become a fundamental need for fatigue life prediction, and is a key prerequisite for ensuring the structural integrity of medical devices throughout their life cycle[2] .
3. Residual Stress and Fatigue Life Calculation Model for Medical Welded Structures
3.1. Residual Stress Calculation Modeling
A multi-field finite element simulation framework with heat-force coupling mechanism is required for accurate modeling of residual stress field in medical welded structures[3] . The local heat input during the welding process triggers a non-stationary temperature gradient, which in turn induces inhomogeneous thermal expansion and cooling contraction strains, a process that can be modeled by the nonlinear transient heat transfer equation:
where is the material density, is the specific heat capacity, is the thermal conductivity, is the heat source term, and is the spatial temperature function. After the thermal boundary loading is completed, the stress distribution model is constructed through the elastic-plastic ontological relationship driven by thermal strain, and the residual stress tensor satisfies the equilibrium equation:
The hybrid Lagrange multiplier method can be used to suppress the cell distortion and realize the thermal-structural dual-field convergence[4] . The spatial and temporal evolution of residual stresses is closely related to the heat input density, scanning rate, and weld width-to-thickness ratio, with parameters shown in Table 1. The mesh size is controlled at 0.2 mm, the time step is set at 0.05 s, and the heat source in the weld region is fitted with a Gaussian distribution, which has a maximum heat flow density of 2.6 × 10⁸ W/m³. Table 1 lists the main material thermal parameters used in the modeling.
In order to demonstrate more clearly the role of thermal input in regulating the spatial distribution of residual stresses, a specific diagram is shown in Figure 1.
The overall modeling process maintains the consistency of the boundary conditions of each physical field to ensure the physical reasonableness of the stress redistribution and to provide high fidelity input tensor data for subsequent fatigue life prediction models [5].
3.2. Fatigue Life Prediction Model
In the construction of the fatigue life prediction model, each variable in the equation used needs to be strictly defined in order to ensure the accuracy of the parameter definition and the generality of the model application. First, the main equation for life prediction is modeled by the logarithmic relationship between stress amplitude and life, which is expressed as:
In this equation, indicates the number of complete loading cycles experienced by the material to reach fatigue failure under a specific stress amplitude, i.e., the fatigue life; is the equivalent stress amplitude, reflecting the intensity of the effective load response of the material under the complex stress state; is the fitting constant related to the yield behavior and microstructure of the material, which determines the longitudinal intercept of the curve under the logarithmic coordinate; is the slope parameter used to characterize the sensitivity of fatigue damage of the material to changes in stress amplitude, with larger values indicating that fatigue performance is more sensitive to changes in stress. is a slope parameter to characterize the sensitivity of fatigue damage with stress amplitude, and larger values indicate that the fatigue properties are more sensitive to stress changes [6]. In order to further reflect the modulation of the equivalent stress amplitude by the multiaxial loading conditions, the model introduces a correction term for the weight function in the direction of the principal stress, which is constructed in the following form:
Here, denotes the component of the principal stress tensor in the first direction ; is the average of the principal stresses in the three directions, i.e:
This average value represents the equivalent volumetric stress state; is the directional weight function of the principal stress direction at a given angle , the form of which can be defined by a cosine-type or orthogonal tensor function to reflect the stress response weights of the anisotropic material at different loading angles[7] . Through the above formula structure, the model is able to effectively project the tensor characteristics under three-dimensional stress state into scalar damage indicators, which provides the basic input for the subsequent fatigue damage integral analysis. In order to reflect the change characteristics of life influence factors under different working conditions, Table 2 shows the core fatigue response indexes such as stress amplitude, plastic strain rate, hysteresis energy, etc. of welded structures under different cycle types and temperature control conditions.
In addition to the stress amplitude-life curve prediction results, in order to reflect the sensitivity of the hysteresis behavior evolution trajectory to the life model, Figure 2 plots the trend of hysteresis loop evolution under different stress states to assist in describing the modulation path of the damage accumulation rate on the life estimation.
3.3. Parametric Modeling Methods
In the process of constructing a fatigue life prediction model for medical welded structures, the key of parametric modeling method is to realize the quantifiable mapping between residual stress field, loading characteristics and life response. In order to improve the modeling accuracy, it is necessary to extract the dominant variables and construct a high-dimensional feature tensor based on the multi-source data field, and then complete the full path parameter mapping from the geometric scale, the heat input path, and the local non-uniformity of the material to the fatigue life[8]. The residual stress feature extraction follows the spatial distribution of the maximum principal stress, shear stress gradient and the three-way component of stress, and introduces the volume-averaged tensor and the direction-dependent tensor covariance function to construct the damage weight field with the following equation:
Among them, is the damage evolution function based on stress gradient, is the tensor distribution weight of the principal stress direction, is the gradient amplification index, and indicates the spatial direction dimension. This damage field function provides a spatially resolved feature input basis for lifetime modeling. Table 3 shows the core feature dimensions involved in the parametric model and the range of values of their variables. In addition, in order to further characterize the nonlinear relationship between the spatial structures of the parameters, Figure 3 shows the principal component projections of the high-dimensional feature variables under multiaxial loading, in which the residual stress tensor and the lifetime sensitivity factor exhibit a nonlinear nested structure. Based on this distribution feature, the sensitivity analysis of heat input density and principal stress gradient was carried out, and the results showed that: when the heat input density was increased from 1.5 × 10⁸ W/m³ to 3.0 × 10⁸ W/m³ while keeping other parameters unchanged, the average decrease in the life prediction value was 42.7%; and the principal stress gradient was increased from 35 MPa/mm to 85 MPa/mm, the life prediction decreases even more significantly by 58.1%. The above results indicate that the stress gradient is the most sensitive dominant factor affecting the lifetime, and its regulation of the crack initiation stage is much higher than the thermal input itself, verifying the criticality of the accuracy of modeling the spatial distribution of stress in the model [9].
4. Experimental Results and Analysis
4.1. Experimental Program Design
In order to verify the engineering adaptability and calculation accuracy of the constructed residual stress and fatigue life coupling model, the experimental program design is based on the multi-field coupling control and multi-dimensional response acquisition platform. (1) Three typical medical welding structures (lap, T-shape, and cross weld) are selected, the welding material is 316L stainless steel plate, the size specification is uniformly controlled as 120 mm×40 mm×3 mm, and the laser pulse heat source is used, and the heat input density of a single pass is controlled at 2.3×10⁸ W/m³. (2) The whole-field temperature evolution is monitored by an infrared thermal imaging system, and a micro thermocouple array is embedded synchronously to record the temperature rise curves at key points in the welding process, with a time sampling interval of 0.1 s, and a total continuous recording duration of 600 s. (3) High-resolution X-ray diffraction is used to obtain the characteristics of the residual stress distributions in the welded area at different depths, with a depth hierarchy interval of 0.2 mm, and a transverse scanning accuracy of better than ± 3 μm. (4) The fatigue life experiment adopts a servo-electro-hydraulic loading platform to implement multi-axis loading, the loading path is set as an alternating tensile-shear cycle, the load ratio is R=-1, the stress amplitude is set as 120-240 MPa, the cycle frequency is 8 Hz, and the monitoring life termination standard is crack expansion rate over 10 -³ mm/cycle. The experimental platform adopts a synchronized data acquisition system to ensure that the residual stress, thermal field response and fatigue life data can be accurately corresponded to the same spatial partition and loading condition, so as to realize the closed-loop validation of the modeling parameters[10] .
4.2. Characterization of Residual Stress Distribution
The residual stress distribution curve of the welded joint along the weld cross-section direction was obtained by X-ray diffraction scanning, and the results are shown in Figure 4.
The maximum principal stress in the center of the weld reaches 278 MPa, which is a typical tensile stress concentration; the stress in the left and right 5 mm from the fusion line of the weld decreases to -112 MPa, forming a local compressive stress band. The stresses were distributed along the thickness direction with asymmetric gradient, and the fluctuation range of the surface stress was ±180 MPa, while the stress in the deeper region tended to be stable, with the maximum fluctuation of no more than 40 MPa. The residual stresses in the transverse cross-section showed a bimodal distribution, with the maximum gradient of 96 MPa/mm, which reflected the asymmetric effect of the plastic constraints triggered by the eccentricity of the heat source and the cooling inhomogeneity. In addition, the residual stress gradient in the lap and T-shaped weld structure is higher than that in the cross weld structure, and the largest gradient points appear in the toe and root transition zones, respectively. The distribution characteristics indicate that the structural form and heat input path coupling conditions significantly affect the spatial evolution of the residual stresses, which verifies the ability of the model to simulate the multidimensional heat-force response.
4.3. Fatigue Life Estimation Results
Based on the aforementioned residual stress field and loading path data input, the fatigue life of welded joints of different structural forms was estimated using a life prediction model, and the specific results are shown in Table 4. The experimental loading conditions were uniformly set as symmetric tensile and shear cycles, with a stress amplitude of 180 MPa, a frequency of 8 Hz, and a crack propagation rate control threshold of 10-³ mm/cycle.
Lifetime The results are presented in terms of the predicted number of cycles, and the range of values covers the short- to medium-life interval with good discrimination and structural variability. The effect of different loading paths on the life prediction is further analyzed by comparing three loading modes: pure tensile, combined tensile-shear (45° stress superposition), and full alternating shear under the same stress amplitude (180 MPa) and cycle frequency (8 Hz). The results show that the fatigue life of the pure tensile path is increased by about 21.4% on average, while the life of the alternating shear path decreases by 33.8%, which is mainly due to the fact that the angle between the shear principal stress direction and the boundary of the weld constitutes a fatigue-prone zone, which promotes the early crack initiation. The tensile shear path, on the other hand, achieves a certain balance between fatigue life and stress stability with the lowest prediction error.
Analysis of the data in Table 4 shows that the life values show a significant decreasing trend with increasing principal stress gradient, indicating that the degree of stress concentration has a decisive influence on the crack source formation and extension. Among them, the lap weld has the lowest predicted life of 22.8×10³ times due to the increased local fatigue damage caused by the superposition of heat input concentration and geometrical mutation, the life of the T-shape structure is slightly higher, and the cross weld obtains the optimal life under the condition of a more balanced heat-force distribution. The coupling of stress amplitude and stress gradient constitutes the core source of the differences in life prediction, validating the accuracy of the model response to structural sensitivity.
4.4. Model Validation and Error Analysis
In order to assess the engineering adaptability and numerical accuracy of the fatigue life estimation model, the modeling results were compared and analyzed with the measured life data. The measured data were obtained by MTS 809 servo-electrohydraulic fatigue testing machine with a maximum load resolution of ±0.2%, and the loading frequency was stably controlled within the range of ±0.05 Hz. The tests were carried out in a temperature-controlled environmental chamber, and the temperature fluctuation was controlled at ±1 ℃ to exclude the influence of thermal environment fluctuation on the stress response of the material. The crack extension rate was monitored in real time by a DIC digital image correlation system with a resolution accuracy of 10-⁴ mm, which can precisely locate the fatigue initiation and failure positions. The residual stress data were collected by a Bruker D8 Discover X-ray diffraction system with a diffraction angle control error of less than ±0.02°. In order to ensure the comparability of the experimental data and the model prediction results, all the sample structures and model boundary conditions, thermal input parameters and loading paths were kept the same, and the crack termination criteria also used the same stress amplitude and fracture rate thresholds, to realize the spatial location, the loading field and the measured response of the full amount of the correspondence, the results are shown in Table 5.
The analysis shows that the model still maintains a low error output in scenarios with large changes in structural forms, in which the maximum relative error does not exceed 6% and the minimum reaches 3.13%, which verifies the applicability of the model under complex thermal-force conditions. In order to further quantitatively evaluate the model performance, three error metrics are introduced for statistical evaluation, including root mean square error (RMSE), mean absolute error (MAE) and R² correlation coefficient, and their statistical results are shown in Table 6.
The index data show that the RMSE of all structures is less than 1.5, and the R² coefficient is generally higher than 0.97, which indicates that the model still maintains good linear fitting ability under high stress gradient and multiaxial loading, with strong error convergence, and has the basis for popularization and application.
5. Conclusion
The non-uniform distribution of residual stresses in welded structures is closely coupled with the spatial and temporal evolution of fatigue life, and a high-precision mapping of residual stress tensor field and fatigue response behavior can be achieved by constructing a multi-physical field-driven modeling system. Parametric modeling and multi-axial loading experimental validation jointly show that the principal stress gradient, heat input density and geometric features are the key dominant factors for life prediction, and the model exhibits good fitting performance and low error output in different structural forms. In the future, the micro-evolution mechanism of weld defects and tissue transformation should be further introduced, especially embedding microscale variables such as porosity distribution, inclusions concentration, grain boundary migration and precipitation phase evolution in the model to realize multi-scale coupled analysis. Through the combination of phase field simulation and EBSD data inversion, a dynamic evolution model of the microstructure of welded joints can be constructed to establish a more accurate correlation path between residual stress and local damage accumulation. Meanwhile, under long-term service conditions, the low-week fatigue/creep interaction effect and the corrosion-fatigue synergistic damage mechanism need to be incorporated into the model framework, so that it can have the prediction capability under the complex boundaries of body fluid corrosion, load fluctuation, and stress migration at the interface of biological tissues, and extend its applicability to engineering in the biomechanical environment.
References
- Nedin R, Vatulyan A. Modeling and identification of residual stress fields in cylinders and plates[J]. Continuum Mechanics and Thermodynamics, 2025, 37(3): 1-21. [CrossRef]
- Merga A, Gutema E M, Gopal M, et al. Numerical Simulation of Temperature Distribution and Residual Stress in Laser Beam Welding AA6061 and Ti-6Al-4V and Optimization of Welding Processes[J]. Recent Patents on Engineering, 2025, 19(4): E260624231323. [CrossRef]
- O'Neill F, McLaughlin E, Ermakova A, et al. Influence of overloading on residual stress distribution in surface-treated wire arc additive -manufactured steel specimens[J]. Materials, 2025, 18(7): 1551. [CrossRef]
- Mahmood M A, Tariq U, Oane M, et al. Analytical and FEM models for thermal analysis and residual stresses using wire arc-based welding and additive manufacturing of SUS304[J]. The International Journal of Advanced Manufacturing Technology, 2024, 133(5): 2363-2380. [CrossRef]
- Yao M, Kong F, Balu P, et al. 3-D FE modelling of residual stress distribution in 3003 aluminium alloy overlapped joints by ARM laser with beam oscillations [J]. Welding International, 2024, 38(4): 249-264. [CrossRef]
- Pei J, Wang X, Qin S, et al. Experimental and Numerical Simulation Study on Residual Stress of Single-Sided Full-Penetration Welded Rib-to-Deck Joint of Orthotropic Steel Bridge Deck[J]. Buildings, 2024, 14(9): 2641. [CrossRef]
- Zhao H, Yang B, Zhang R, et al. Study on the residual stress of simple cubic lattice structure produced by selective laser melting[J]. Journal of Sandwich Structures & Materials, 2024, 26(7): 1243-1264. [CrossRef]
- Niu H, Liu Y, Bian H, et al. The interface structure of medical Al2O3/Ti-13Nb-13Zr diffusion-bonded joints and their electrochemical corrosion behavior in simulated body fluid[J]. Welding in the World, 2025, 69(6): 1733-1741. [CrossRef]
- Irzmańska E, Cichocka A, Puszkarz A K, et al. A New Approach to Implementing 3D-Printed Material Structures for Protective Gloves with the Use of Ultrasonic and Contact Welding Processes: a Preliminary Study[J]. Materials, 2024, 17(22): 5404. [CrossRef]
- Bose S, Chelladurai H, Ponappa K. A review on recent developments in ultrasonic welding of polymers and polymeric composites[J]. Welding in the World, 2024, 68(7): 1881-1903. [CrossRef]
Figure 1.
Residual stress tensor field distribution under variable heat input.
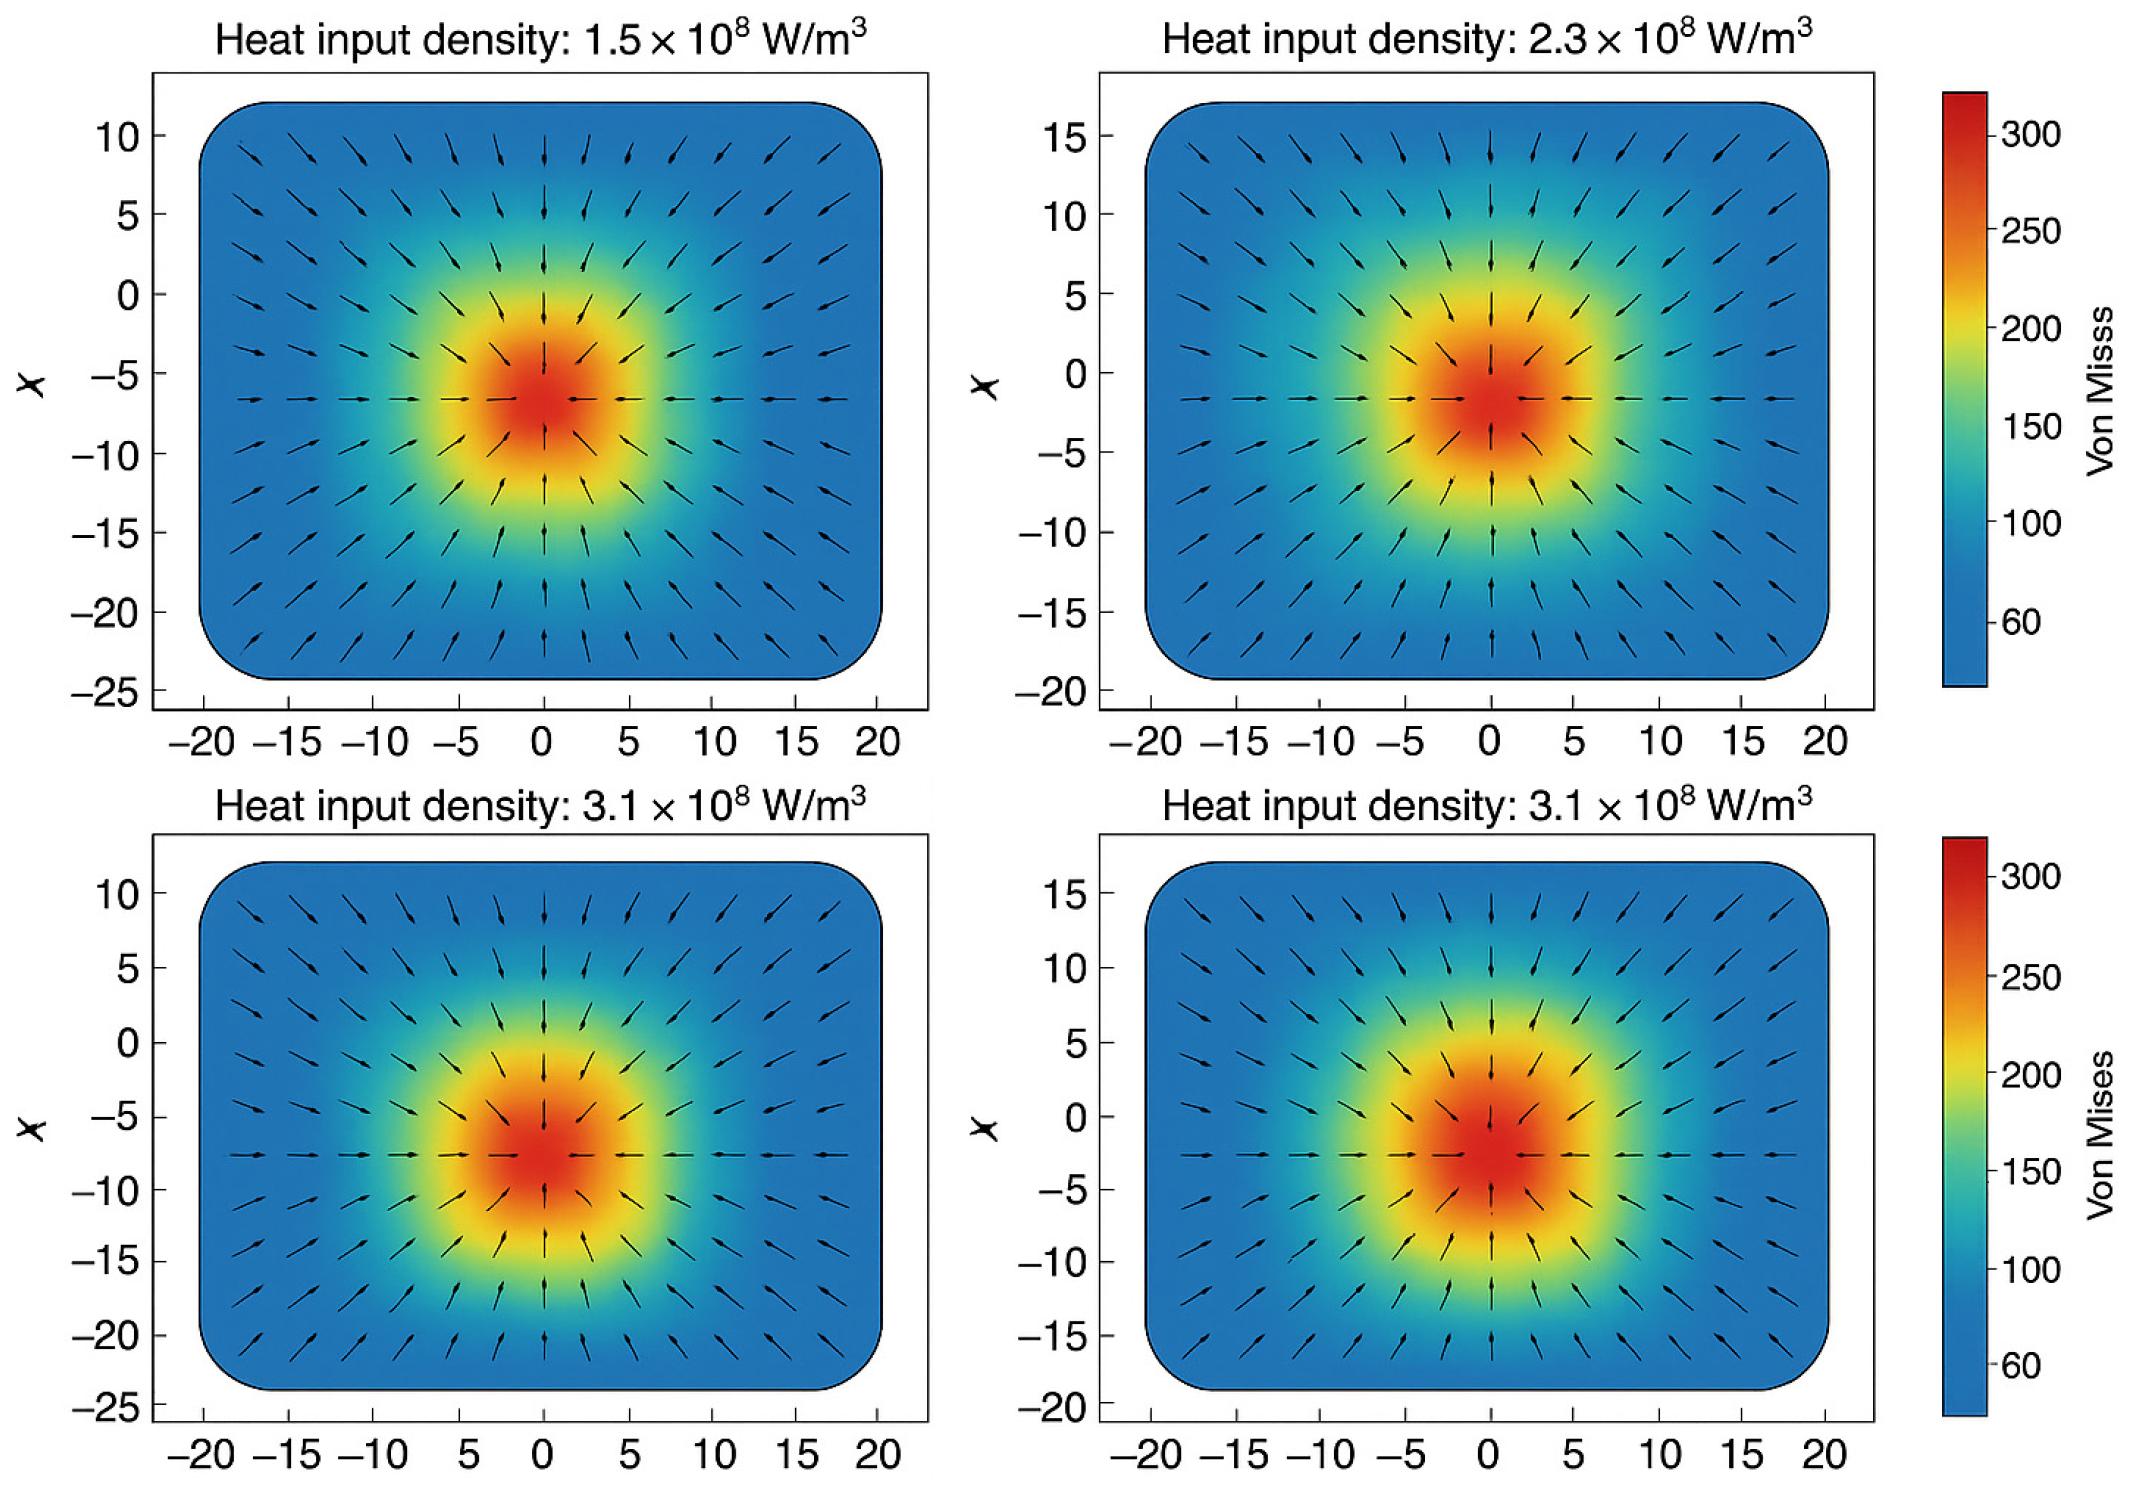
Figure 2.
Trend of hysteresis loop evolution under multiaxial stress state.
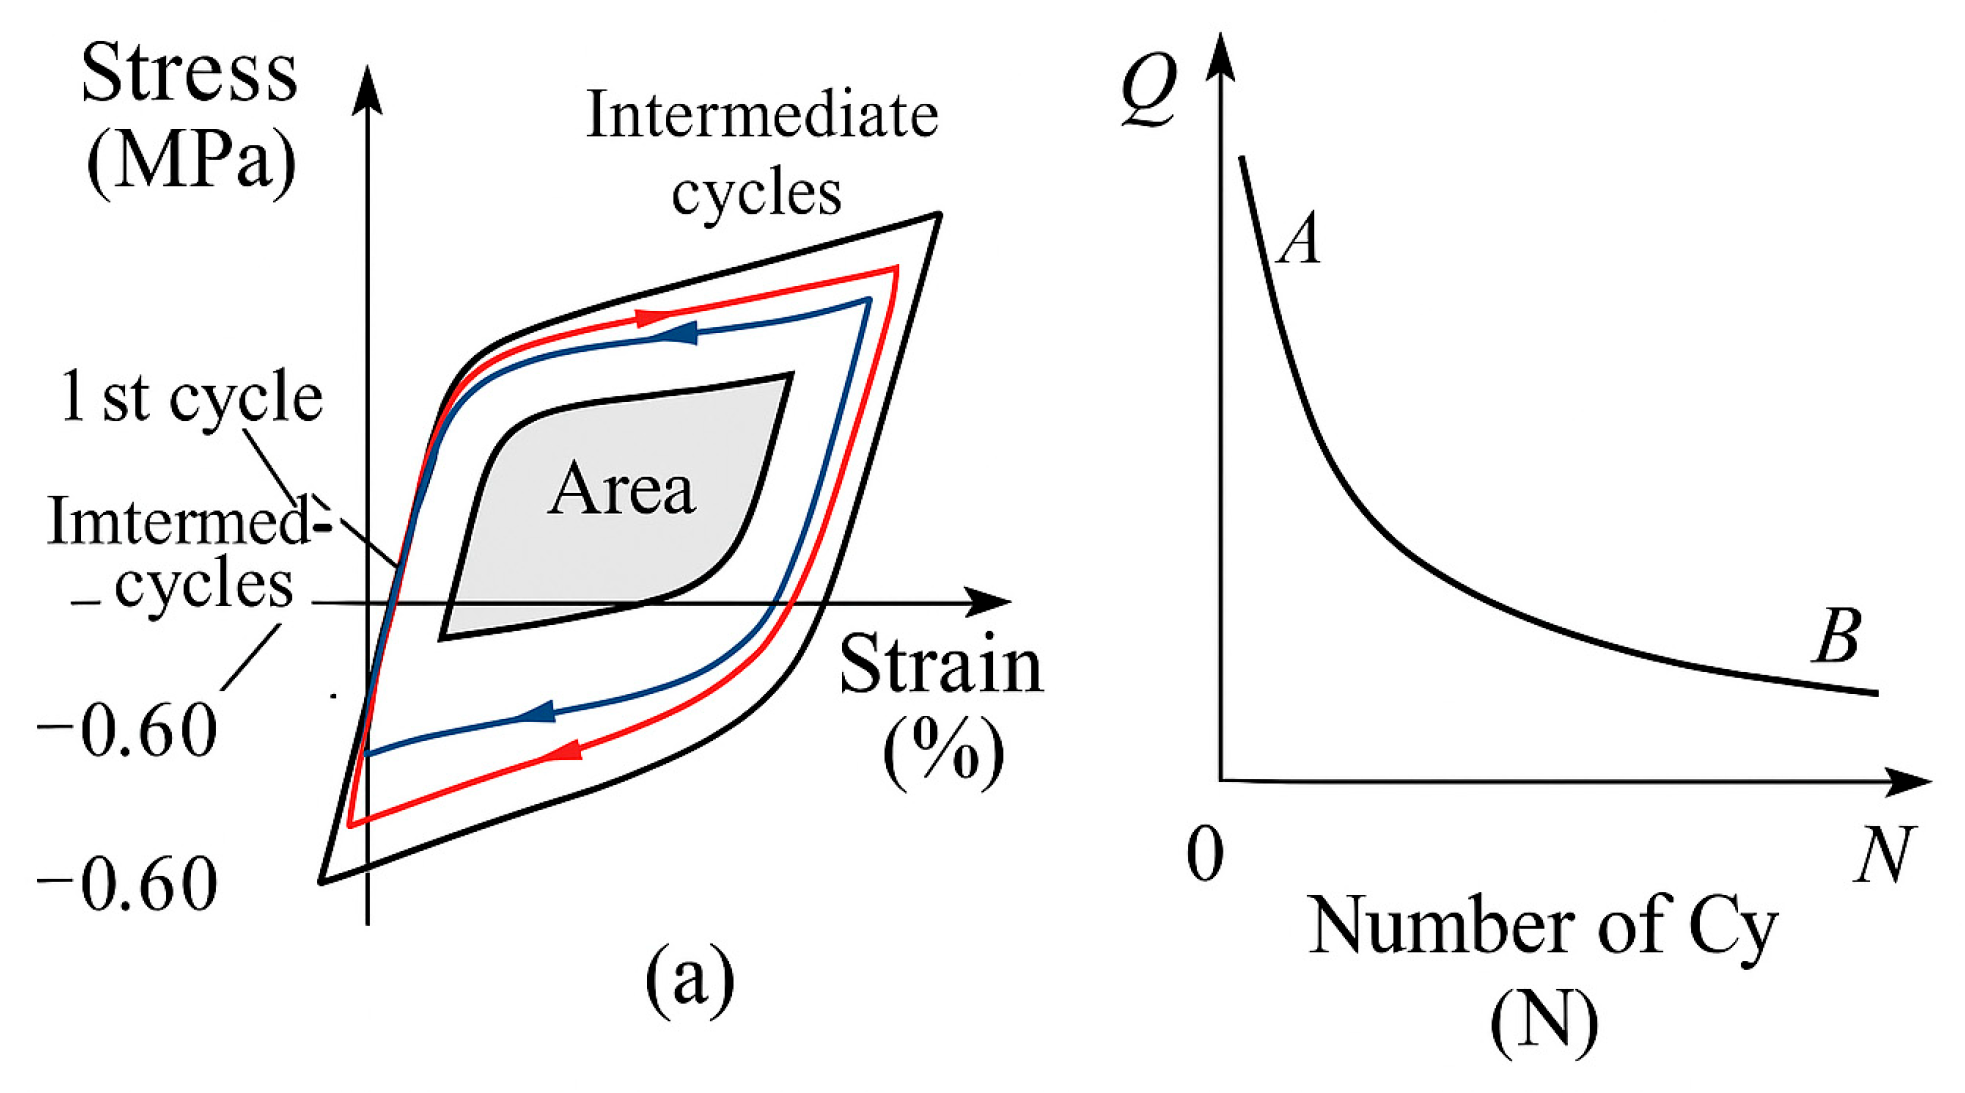
Figure 3.
Fatigue prediction multiaxial feature principal component mapping.
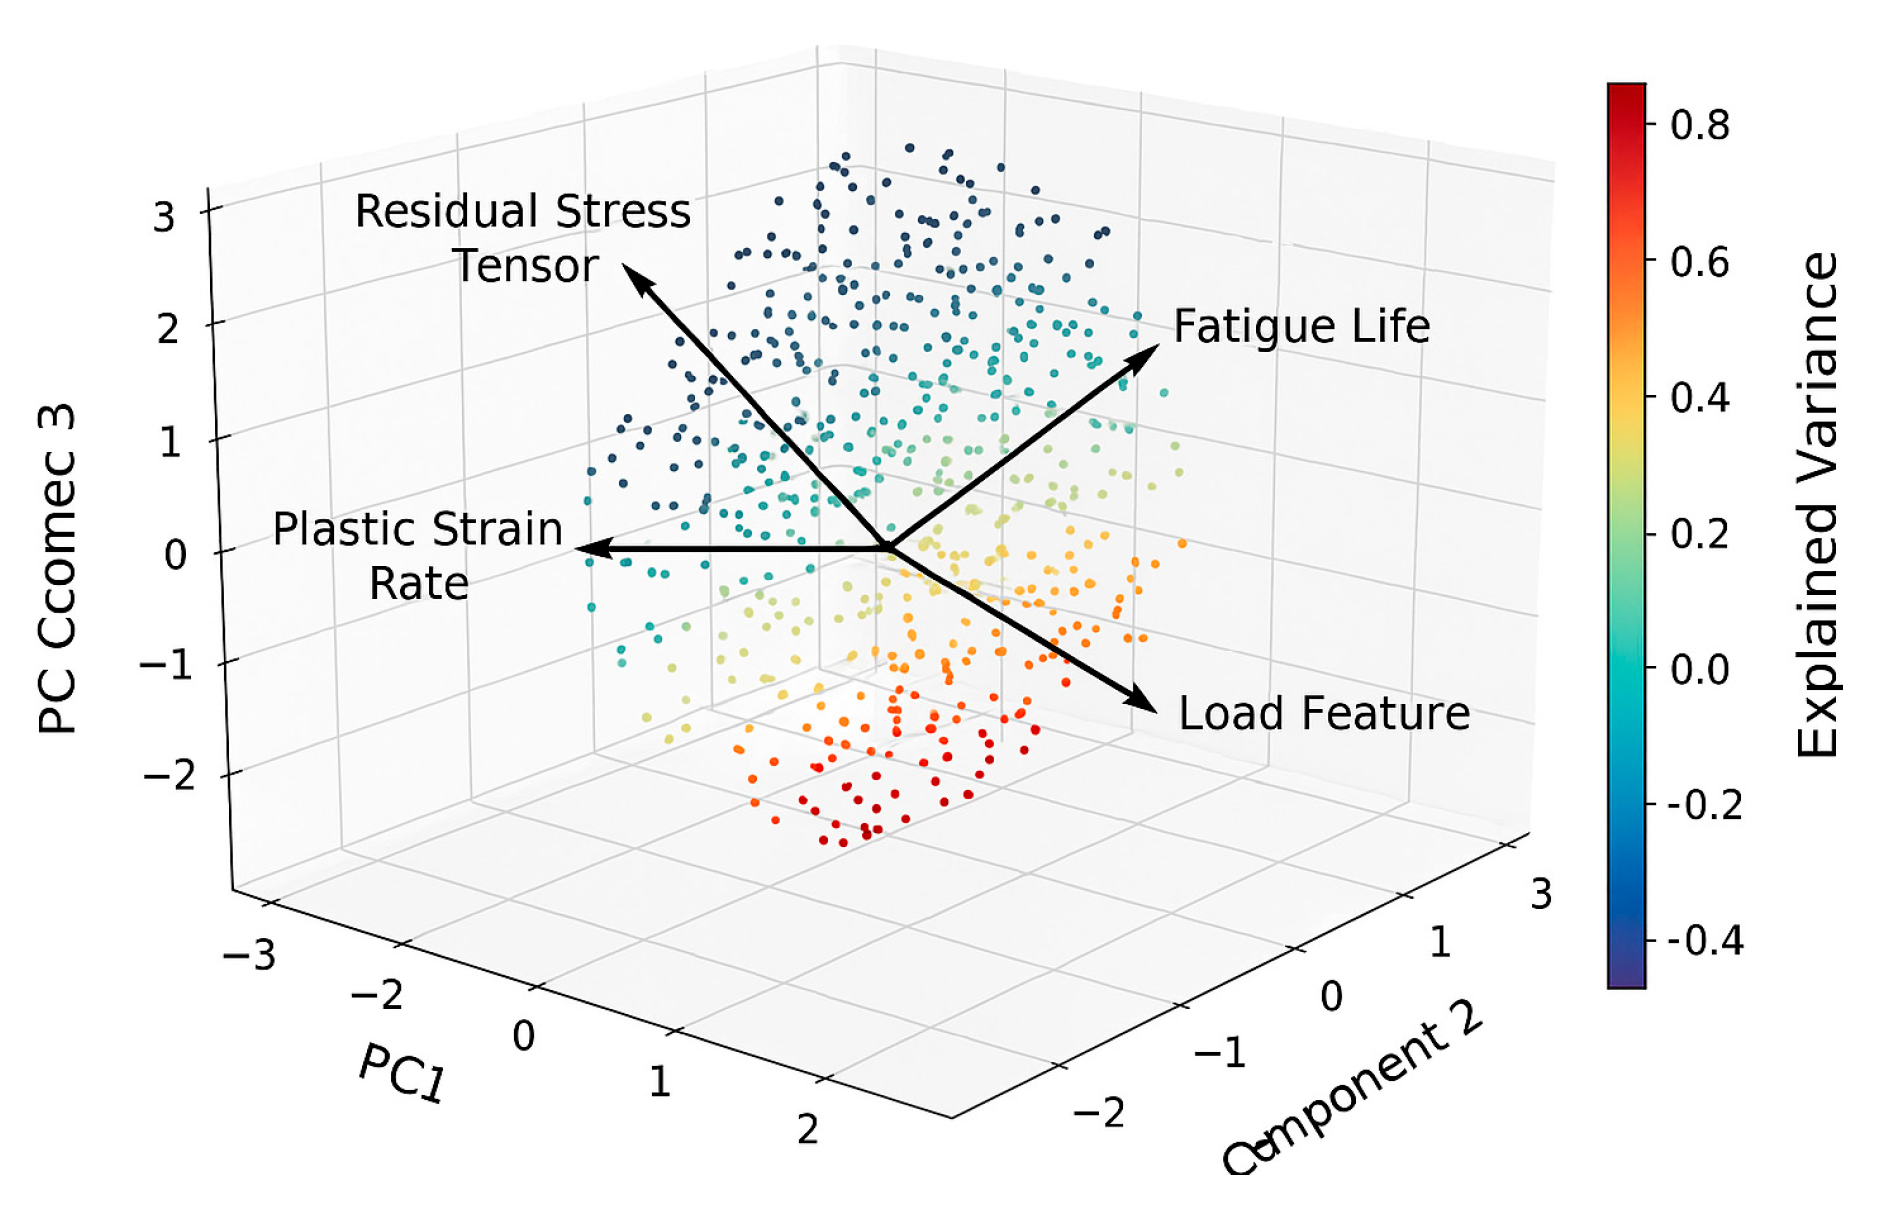
Figure 4.
Residual stress distribution profile in weld cross section.


Table 1.
Parameter list for modeling medical welded structures.
| Parameter name | notation | Numerical range |
| Material density | 7750 - 8050 | |
| heat conductivity | 14.2 - 18.9 | |
| specific heat capacity | 460 - 502 | |
| modulus of elasticity | 180 - 210 | |
| Poisson's ratio | 0.27 - 0.31 | |
| yield strength | 380 - 460 |
Table 2.
Distribution of Characteristic Variables for Fatigue Life Models.
| Load Type | Cycle frequency (Hz) | Average temperature (°C) | Stress amplitude distribution (MPa) | Plastic strain rate (%/cycle) | Stall energy density (MJ/m³) |
| constant amplitude cycle | 2-20 | 35-50 | 120-230 | 0.03-0.12 | 0.52-1.48 |
| Variable amplitude loading | 1-15 | 40-65 | 100-260 | 0.06-0.18 | 0.74-2.05 |
Table 3.
Distribution of main characteristic variables in parametric modeling.
| Characteristic dimensions | Feature type | Numerical range |
| Heat input density | Energy parameters | 1.5 x 10⁸ - 3.1 x 10⁸ |
| Weld width/thickness ratio | geometric parameter | 1.2 - 2.6 |
| principal stress gradient | Stress field characterization | 35 - 80 |
| Local plastic strain rate | Material Response Characterization | 0.02 - 0.14 |
| Residual stress tensor covariance | Statistical field indicators | 0.016 - 0.091 |
Table 4.
Table of fatigue life estimation results for medical welded structures.
| Weld Type | Heat input density (W/m³) | Principal stress gradient (MPa/mm) | Equivalent stress amplitude (MPa) | Predicted life (×10³ cycle) |
| overlapping seam | 2.6 x 10⁸ | 85.3 | 212 | 22.8 |
| T-shaped weld | 2.4 x 10⁸ | 78.7 | 204 | 29.4 |
| crossover weld | 2.3 x 10⁸ | 61.2 | 188 | 46.1 |
Table 5.
Comparison results of predicted and measured values.
| Weld Type | Predicted life (×10³ cycle) | Measured life (×10³ cycle) | Relative error (%) |
| overlapping seam | 22.8 | 24.2 | 5.79 |
| T-shaped weld | 29.4 | 28 | 4.76 |
| crossover weld | 46.1 | 44.7 | 3.13 |
Table 6.
Fatigue life prediction model error assessment metrics table.
| Type of indicator | overlapping seam | T-shaped weld | crossover weld |
| RMSE | 1.48 | 1.16 | 0.93 |
| MAE | 1.28 | 1.05 | 0.84 |
| R² | 0.974 | 0.981 | 0.988 |
Disclaimer/Publisher’s Note: The statements, opinions and data contained in all publications are solely those of the individual author(s) and contributor(s) and not of MDPI and/or the editor(s). MDPI and/or the editor(s) disclaim responsibility for any injury to people or property resulting from any ideas, methods, instructions or products referred to in the content. |
© 2025 by the authors. Licensee MDPI, Basel, Switzerland. This article is an open access article distributed under the terms and conditions of the Creative Commons Attribution (CC BY) license (http://creativecommons.org/licenses/by/4.0/).
Copyright: This open access article is published under a Creative Commons CC BY 4.0 license, which permit the free download, distribution, and reuse, provided that the author and preprint are cited in any reuse.


