
Submitted:
04 June 2025
Posted:
05 June 2025
You are already at the latest version
Abstract
We investigated the composition and dominance of phytoplankton species in the Lake Kyoga Complex in Uganda, focusing on diatoms and potentially toxigenic cyanobacteria. Water quality sampling and analyses were done using standard quantitative methods while phytoplankton abundance and quantification was performed according to sedimentation method. The diatoms, primarily Aulacoseira granulata, Cyclotella meneghiniana and Nitzschia acicularis were recovered. The toxin producing cyanobacteria too that included Dolichospermum circinalis, Dolichospermum planctonica, Cylindrospermopsis africana and Microcystis aeruginosa were present in this ecosystem. The occurrence of cyanobacteria raises concerns about potential harmful algal blooms (HABs) that could impact water quality and ecosystem health. This study provides an ecological baseline for monitoring shifts in community composition with the disappearance of keystone species that are not palatable to fish and potential threats to water safety within the Lake Kyoga catchment more especially River Awoja, the main water supply station for Soroti City.
Keywords:
Eutrophication
; Lake Kyoga complex
; diatoms
; toxigenic cyanobacteria
; water quality
; Uganda
Introduction
The Lake Kyoga Complex, located in central Uganda, plays a crucial role in the region’s hydrology, biodiversity, and socio-economic wellbeing. As one of the country’s major freshwater systems, it forms a vital ecological network that supports livestock, wildlife and human populations. A significant feature of the complex is the River Awoja, a key tributary and the primary source of water for Soroti City. Originating from Lake Bisina, the river traverses extensive wetland systems, notably the Lake Bisina Wetland System, which was designated as a Ramsar Site—a Wetland of International Importance under the [1]. This designation recognizes the wetland’s ecological significance and its role in biodiversity conservation within the districts of Kumi, Katakwi, and Soroti.
Characterized by fringing papyrus swamps and diverse aquatic vegetation, the Lake Bisina Wetland System is particularly notable for its rich biodiversity. It provides critical habitat for several bird species, including the globally vulnerable Shoebill (Balaeniceps rex) and Uganda’s only endemic bird, the Fox’s Weaver (Ploceus spekeoides). In addition, it serves as a refuge for indigenous fish species that have declined in Lakes Victoria and Kyoga. Beyond its ecological importance, the wetland plays a vital role in supporting local communities, providing fish, freshwater for domestic use and livestock, and food resources such as the rhizomes of Nymphaea species, especially during periods of drought [1].
This study builds on investigations conducted in August 2023 by the same team, which profiled and characterized water quality and cyanobacterial dynamics within the Awoja stream and expanded further into the upstream and downstream of Lake Kyoga complex. The specific objectives of the earlier study were to: (i) describe water quality characteristics of selected lake and wetland sites; (ii) assess the presence, distribution, and relative abundance of phytoplankton groups; and (iii) infer the potential for toxin production based on phytoplankton community composition. Findings from the 2023 survey indicated that the River Awoja wetland system exhibited good water quality, characterized by low phytoplankton biomass and correspondingly low chlorophyll-a concentrations. These low chlorophyll-a levels correlated with reduced dissolved oxygen concentrations, suggesting low rates of primary production and limited carbon transfer to support fisheries production. Despite ongoing land-use activities within the catchment, no significant nutrient loading was detected, likely due to the presence of intact Vossia and papyrus-dominated wetlands that effectively filter turbidity and nutrients before they enter the aquatic system.
The phytoplankton community observed during the survey included blue-green algae (cyanobacteria), cryptophytes, diatoms, and green algae. Key cyanobacterial taxa identified were Aphanocapsa, Chroococcus limneticus, Dolichospermum circinale, Planktolyngbya limnetica, Pseudanabaena limnetica, and Raphidiopsis (formerly Cylindrospermopsis). Of particular concern were the potentially toxigenic species - Dolichospermum circinale, Dolichospermum flos-aquae, and Raphidiopsis - commonly associated with harmful algal blooms (HABs) in Ugandan freshwater systems. Notably, Microcystis species, especially Microcystis aeruginosa, historically the most significant toxin producers in Uganda [2], were absent. This absence suggests that the prevailing pristine water conditions are currently unfavourable for cyanobacterial bloom formation and toxin production. However, environmental deterioration through nutrient enrichment or hydrological alterations could still trigger the proliferation of these toxigenic species.
The previous findings highlighted critical questions regarding the influence of upstream and downstream catchment dynamics on River Awoja’s water quality. While upstream lies Lake Bisina, downstream lies the larger Lake Kyoga system. Both areas experiencing more intensive land-use practices, including agriculture, settlement, and grazing. These activities could potentially contribute to nutrient enrichment, foster cyanobacterial growth, and threaten the relatively good water quality observed in the River Awoja.
Maintaining high water quality in these ecosystems is essential, not only to ensure safe water supplies but also to sustain healthy aquatic ecosystems and fisheries productivity. Diatoms, in particular, serve as important bioindicators of good water quality and contribute significantly to the base of the aquatic food web. Their dominance within the phytoplankton community suggests favourable ecological conditions. This study examined the status of the phytoplankton community within the broader Lake Kyoga Complex. The focus was on the prevalence and distribution of diatoms as indicators of ecosystem health and assesses the potential risk of cyanobacterial blooms that could undermine water quality and ecological stability.
Materials and Methods
Study Site and Sampling Procedures
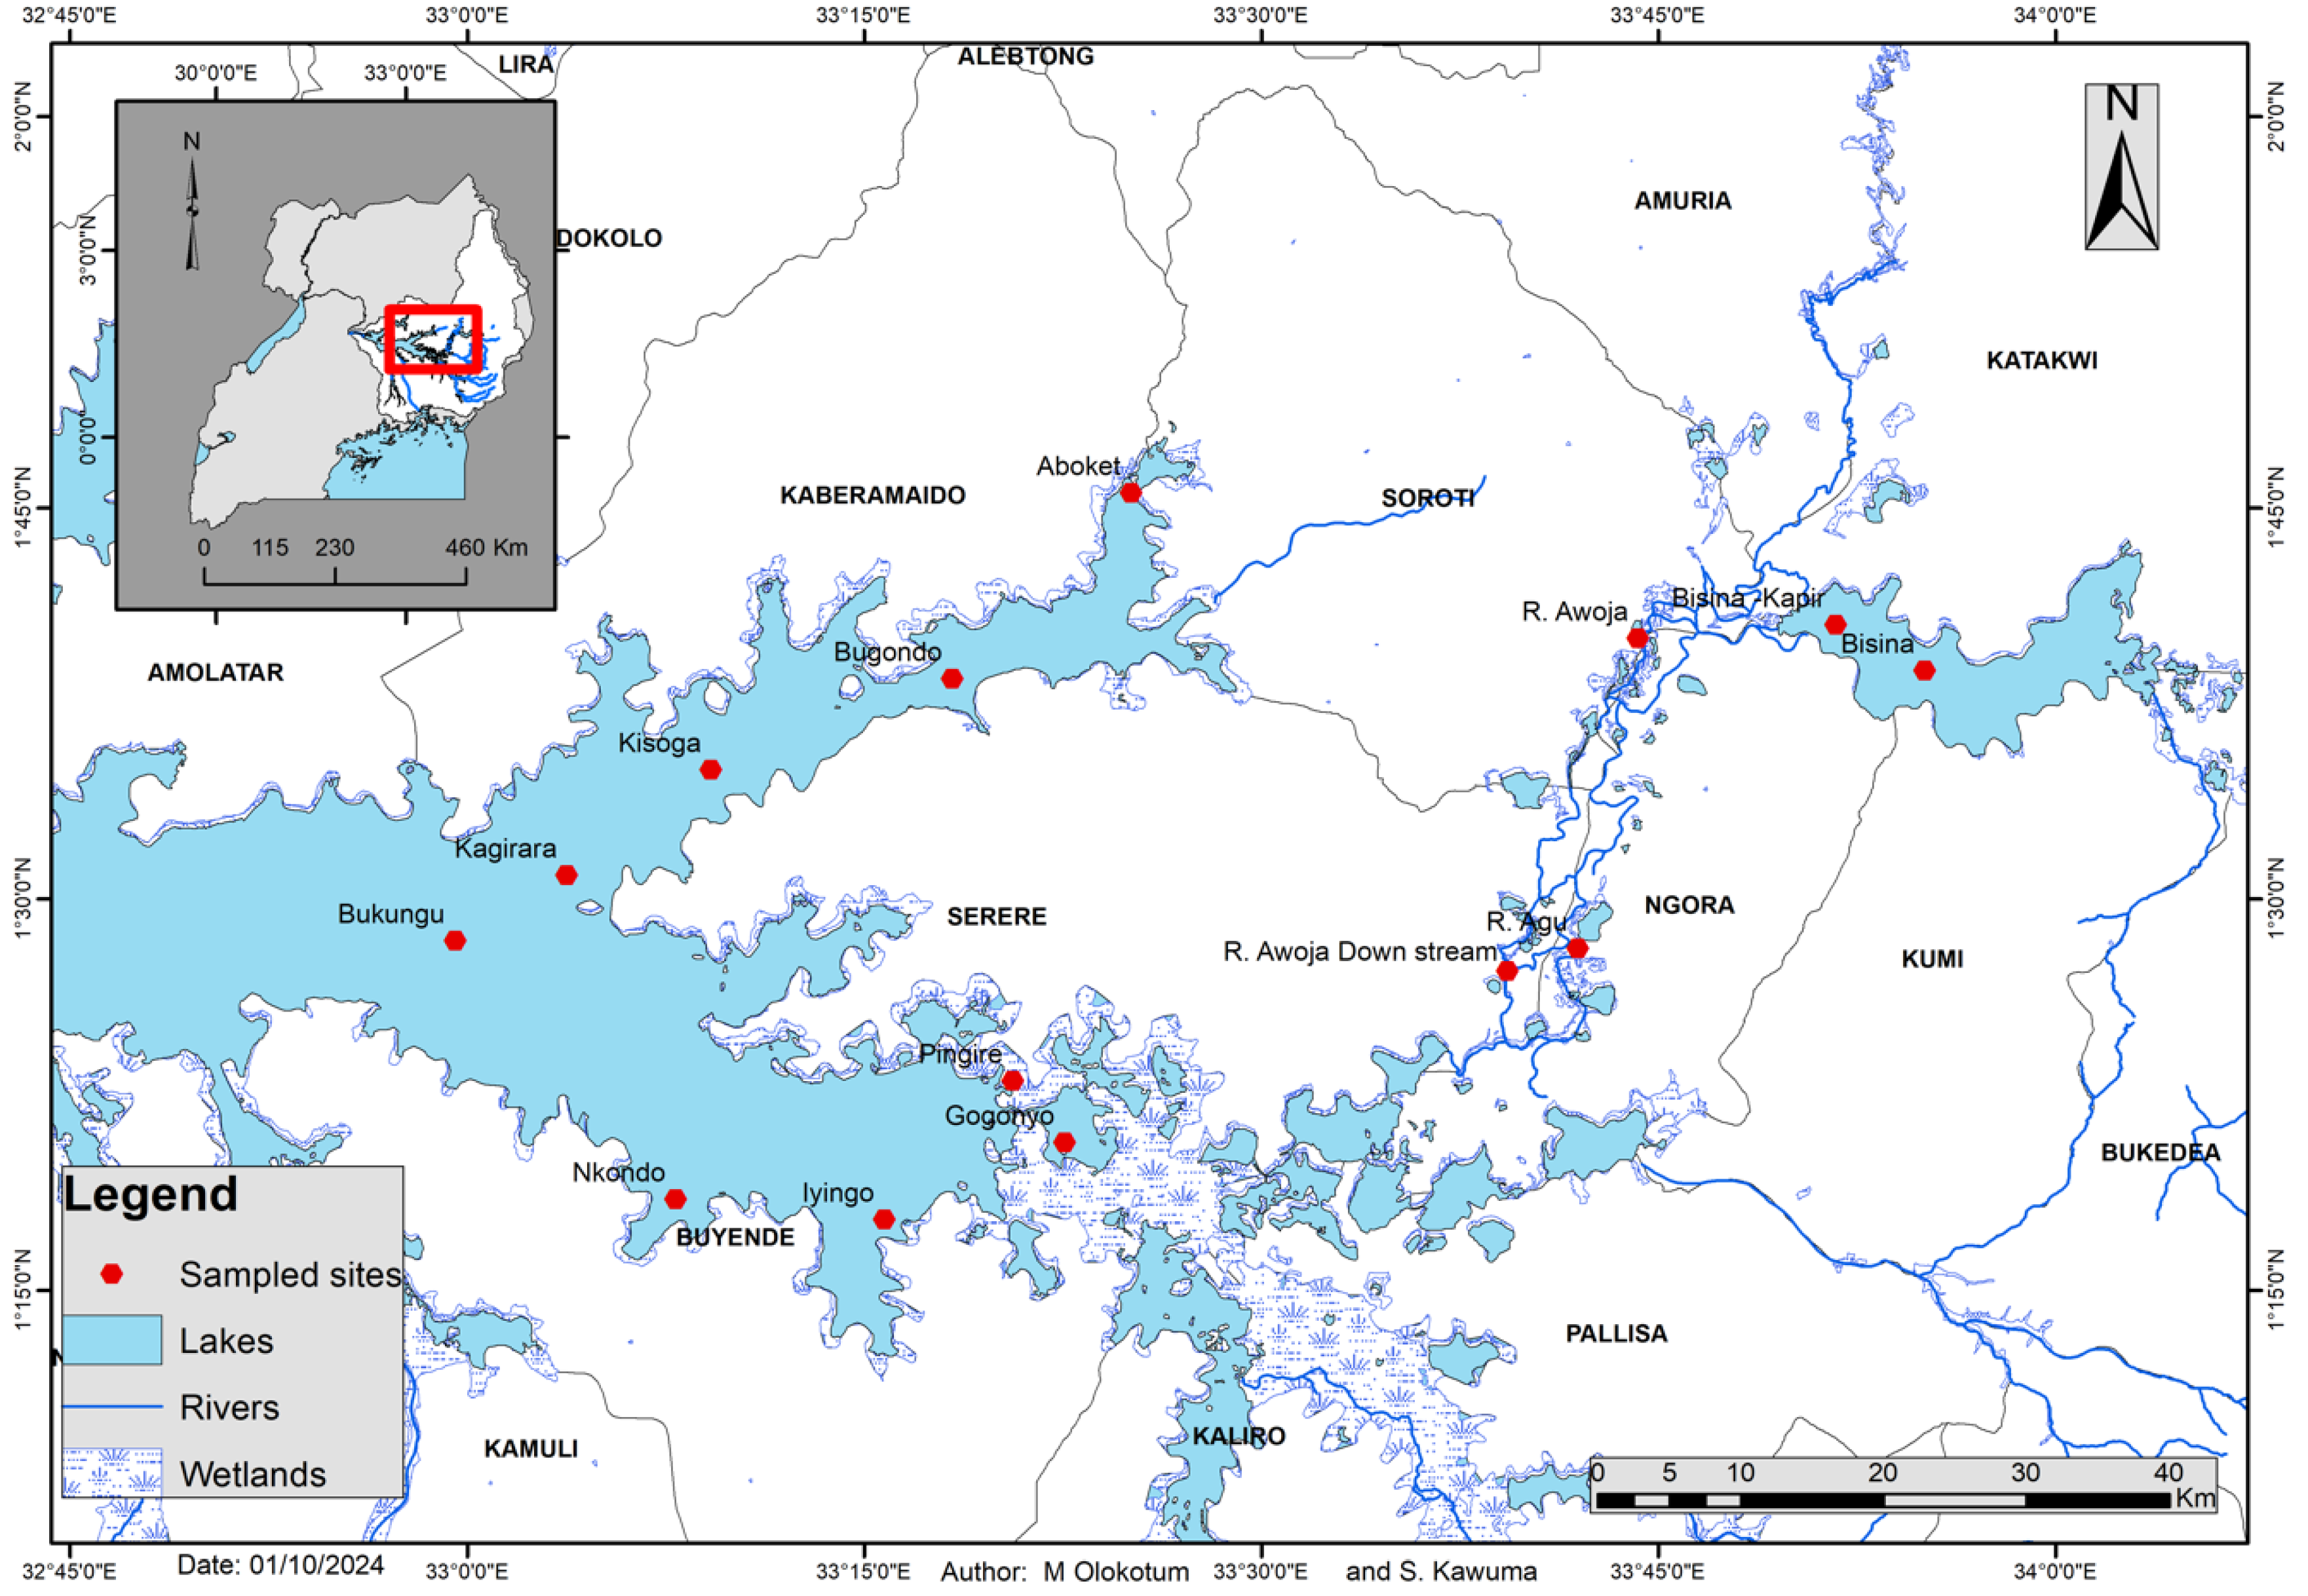
This study was undertaken in Lake Kyoga complex which consists of many satellite lakes, extensive network of shallow open water areas with many arms (Kwania, Bugondo and Iyingo) and dense papyrus wetlands. The open water covers 2700 Km2 with a mean depth of 3.6 m, maximum depth of 6 m, and its swamp fringes also extends to an extra surface area of about 2000 Km2 (Figure 1). The lake primarily relies on Victoria Nile for its inflows (82%) while the other sources include catchment rivers (Awoja, Sezibwa, Manafwa, and Mpologoma) (9%) and direct rainfall (9%) [3]. Despite the many inlets, the lake has only one main outlet, Albert Nile. Part of the lake’s wetlands and satellite lakes such as Bisina and Opeta are designated Ramsar sites while others such as Nakuwa and 30 other smaller lakes are important for water, navigation and fisheries. In terms of fish, the lake once had a diverse fish fauna of at least 45 species in 12 families [4] including two endemic tilapia species Oreochromis variabilis which inhabited the macrophyte zone, and O. esculentus (Graham) found in open water. The two tilapias originally dominated the fishery between 1937 and the early 1950s, after which their contribution declined [3]. Currently, the fishery is now dominated by Nile tilapia, Nile perch and the small pelagic (Mukene) providing over 75,400 tons of fish [5].
Sampling for water quality and phytoplankton from the Lake Kyoga complex was done between 10th and 15th August 2024 at specific points/sites, designated in the Bugondo and Iyingo arm of Lake Kyoga, River Awoja, River Agu and Lake Bisina (Awoja catchment Figure 1). We focused on Lake Bisina due to the high hydrological connectivity to Awoja wetland system and the main Lake Kyoga system. These sampling efforts aimed to capture a broad spectrum of environmental characteristics and phytoplankton communities to provide a holistic understanding of the current state of these aquatic systems.
Figure 1.
Map of Lake Kyoga Complex showing transects (sampling points) in the Bugondo and Iyingo arms of Lake Kyoga, Awoja system and Lake Bisina for assessing water quality and phytoplankton dynamics.
Figure 1.
Map of Lake Kyoga Complex showing transects (sampling points) in the Bugondo and Iyingo arms of Lake Kyoga, Awoja system and Lake Bisina for assessing water quality and phytoplankton dynamics.
Data and Water Sampling
In-situ measurements: For each sampling site, water depth was measured using a portable Echosounder (Hondex PS-7) and georeferenced. Water temperature, pH, electrical conductivity, dissolved oxygen, turbidity, and fluorescent dissolved organic matter (fDOM) were measured in-situ using the YSI Sonde EXO2 multiprobe meter (Sonde 16B102461). Water samples for chemical analysis were collected from the surface (0.5 m depth) using a 2-L horizontal van Dorn sampler as described by [6] from which 2L sample was taken for chlorophyll-a (Chl-a) and nutrients analyses while 20 mL were used for phytoplankton analysis.
Laboratory Sample Analyses
Nutrient dynamics: Samples for dissolved nutrient measurement were immediately filtered using Whatman GF/C filters (Ø 47 mm) and kept refrigerated during transportation. In the laboratory, soluble reactive phosphorus (SRP) was determined using the ammonium molybdate method [6], nitrate (NO3-N) by the sodium salicylate method [7], ammonium (NH4-N) using the indophenol blue method [8] and soluble reactive silica (SRSi) using the yellow molybdate-silicic acid method [6]. From the additional unfiltered water samples that were collected in acid-washed polyethylene containers, the total phosphorus and nitrogen analysis was performed using the persulphate digestion oxidation methods described by [6].
Chlorophyll a (Chl-a): Chl-a concentration was measured by filtering 100-500 mL of water (Whatman GF/C filters), followed by hot 90% ethanol extraction [9] of the filtered biomass and analysis with a Jenway 6505 UV/vis spectrophotometer. In the laboratory, 10 mL of 90% ethanol were added to filtered biomass and incubated in a water bath at 780C for 2 minutes and later sonicated for 15 minutes to accelerate pigments lysis. The extract was cooled in the dark while covered with aluminum foil and then filtered using the 0.2 µm mesh size membrane filter (Millex, GS). We measured the absorbance at 665 nm wavelength and at 750 nm wavelength to corrected for turbidity. To the measured extract in the cuvette, 100 µL of 0.25M hydrochloric acid was added, shaken and absorbance measured again at 665 nm and 750 nm.
Phytoplankton communities: At each sampling site, 20 mL of water for assessment of baseline status of phytoplankton was drawn at 0.5 m depth, fixed with Lugol’s solution [10], and stored away from light [6]. The sedimentation method of [10] was used to count the phytoplankton under an inverted microscope (Leica DM IL). Taxonomic identification was made with the help of standard literature [11,12,13]. Species counts were made at a 400-times magnification. For each sample, two transects in the sedimentation chamber were counted and the average recorded. Nitzschia and Planktolyngbya were counted as filaments, and their total length and width measured using the micrometer scale inserted into the eyepiece (1 unit in the scale equal to 2.5 μm). Other species such as Dolichospermum, Merismopedia, Microcystis and Oocystis were counted as single cells. Cell lengths and widths were determined for biovolume calculation. Twenty randomly selected specimens from the dominant species were measured and their volumes calculated by assuming a geometric shape, that is, for Microcystis. The formula ‘πd3/6’ was used where ‘d’ denotes cell diameter [6,13]. The biovolume was then calculated by multiplying the mean cell volume with cell density.
Statistical Data Analysis
Environmental characteristics: The environmental data were centred on a Euclidean distance matrix before performing Principal Component Analysis (PCA) to determine the gradient and reveal the dimensions and patterns of environmental characteristics of Lake Kyoga complex. The PCAs were computed in “FactoMinerR” package [15] and “factoextra” package was used for visualization. Permutational multivariate analysis of variance (PERMANOVA) using the adonis2 function of “vegan” package [16] was used to test the differences in environmental conditions between rivers.
Phytoplankton communities: The list of phytoplankton taxa across sampling sites was tabulated and we used Venn diagrams to interpret taxa richness relations between sites and stations along the gradient using the ‘Limma’ package in R software [17]. Indices of α-diversity were calculated using Shannon-Weiner and Pielou evenness indices and the ‘vegan’ package [16]. The biovolume for each taxon was summed and a rank-biovolume diagram created for the dominant taxa of each bay. Later, the changes in the mean biovolume of the dominant taxa along the spatial transect were evaluated. Phytoplankton biovolume data were square root-transformed to increase the influence of rare taxa in the dissimilarity matrix. ß-diversity based on the Bray-Curtis dissimilarity index was applied to the square root-transformed phytoplankton biovolume to characterize the differences in phytoplankton community between and within bays (tested using PERMANOVA). The same Bray-Curtis dissimilarity matrix was ordinated using non-metric dimensional scaling (nMDS). The similarity percentage breakdown (SIMPER) analysis [18] was used to assess the average contribution of individual phytoplankton taxa to biovolume-based Bray-Curtis dissimilarity between bays and within stations.
Results
Water Quality Characteristics in the Lake Kyoga Complex
A total of 16 limnological parameters were used to characterize the environmental conditions experienced by phytoplankton communities (Figure 2; Table 1). The distribution of the water quality datasets from the sampled arms of Lake Kyoga (Bugondo and Iyingo), River Awoja and Lake Bisina are summarized in Figure 2. From the PCA, the first and second axes accounted for 39% and 19.9% of the total variance respectively amongst the arms of Lake Kyoga, Awoja system and Lake Bisina. There are four distinct clustering of the sampled habitats due to environmental variance as revealed by overlap of ellipses from Lake Bisina and Aboket site in the Bugondo arm, as well as Iyingo, Nkondo, Bukungu that clustered together. The clustering was due to differences in the selected parameters (Figure 2B). For the sampled parameters we observed significant differences among arms and other systems and amongst the sampled sites/stations within the complex (pseudo-F = 416.2, P(perm) = 0.001).
There were high in-arm variances in pH, dissolved oxygen and NH4 concentration in the Bugondo arm (Bugondo, and Aboket). There was low variance in turbidity, phycocyanin and chlorophyll-a in the Iyingo arm (Kisoga, Bukungu, Nkondo, and Kagwara). There was high detection of dissolved organic matter (fDOM) in the Awoja sites, Pingire and Gogonyo sites (Figure 2 and Figure 3). No significant variations were observed in the Lake Bisina sites. We observed significantly low levels of dissolved oxygen in the Awoja system compared to the other sites of lake Bisina and the two arms of Lake Kyoga (Kruskal-Wallis χ2 = 796.46, df = 3, p-value < 0.001). Electrical conductivity was generally low in Iyingo arm (Kruskal-Wallis χ2= 295.72, df = 3, p-value < 0.001), dissolved organic matter were high in Awoja and Iyingo arm compared to Bisina and the Bugondo arm (Kruskal-Wallis χ2= 710.58, df = 3, p-value < 0.001). pH was generally neutral to alkaline and significantly higher in the lake system (Kruskal-Wallis χ2= 863.75, df = 3, p-value < 0.001) compared to the Awoja river system. Turbidity was generally low <5NTU but these values were much higher in two arms of Lake Kyoga (Bugondo and Iyingo) compared to Awoja and Lake Bisina systems (Kruskal-Wallis χ2 = 728.41, df = 3, p-value < 0.001).
Figure 2.
The differentiation of the sampled sites in Lake Kyoga, River Awoja system and Lake Bisina, using PCA Euclidean distance based on limnological variables. A): The correlation between first two PCs and explanatory variables. B): The distribution and clustering of parameters on the PCs. The first and second PCs contributed 39% and 19.9% of the total variance between the waterbodies.

Figure 3.
The variation in the selected in-situ water quality characteristics in Lake Kyoga (Bugondo and Iyingo arms), River Awoja system and Lake Bisina.
Figure 3.
The variation in the selected in-situ water quality characteristics in Lake Kyoga (Bugondo and Iyingo arms), River Awoja system and Lake Bisina.
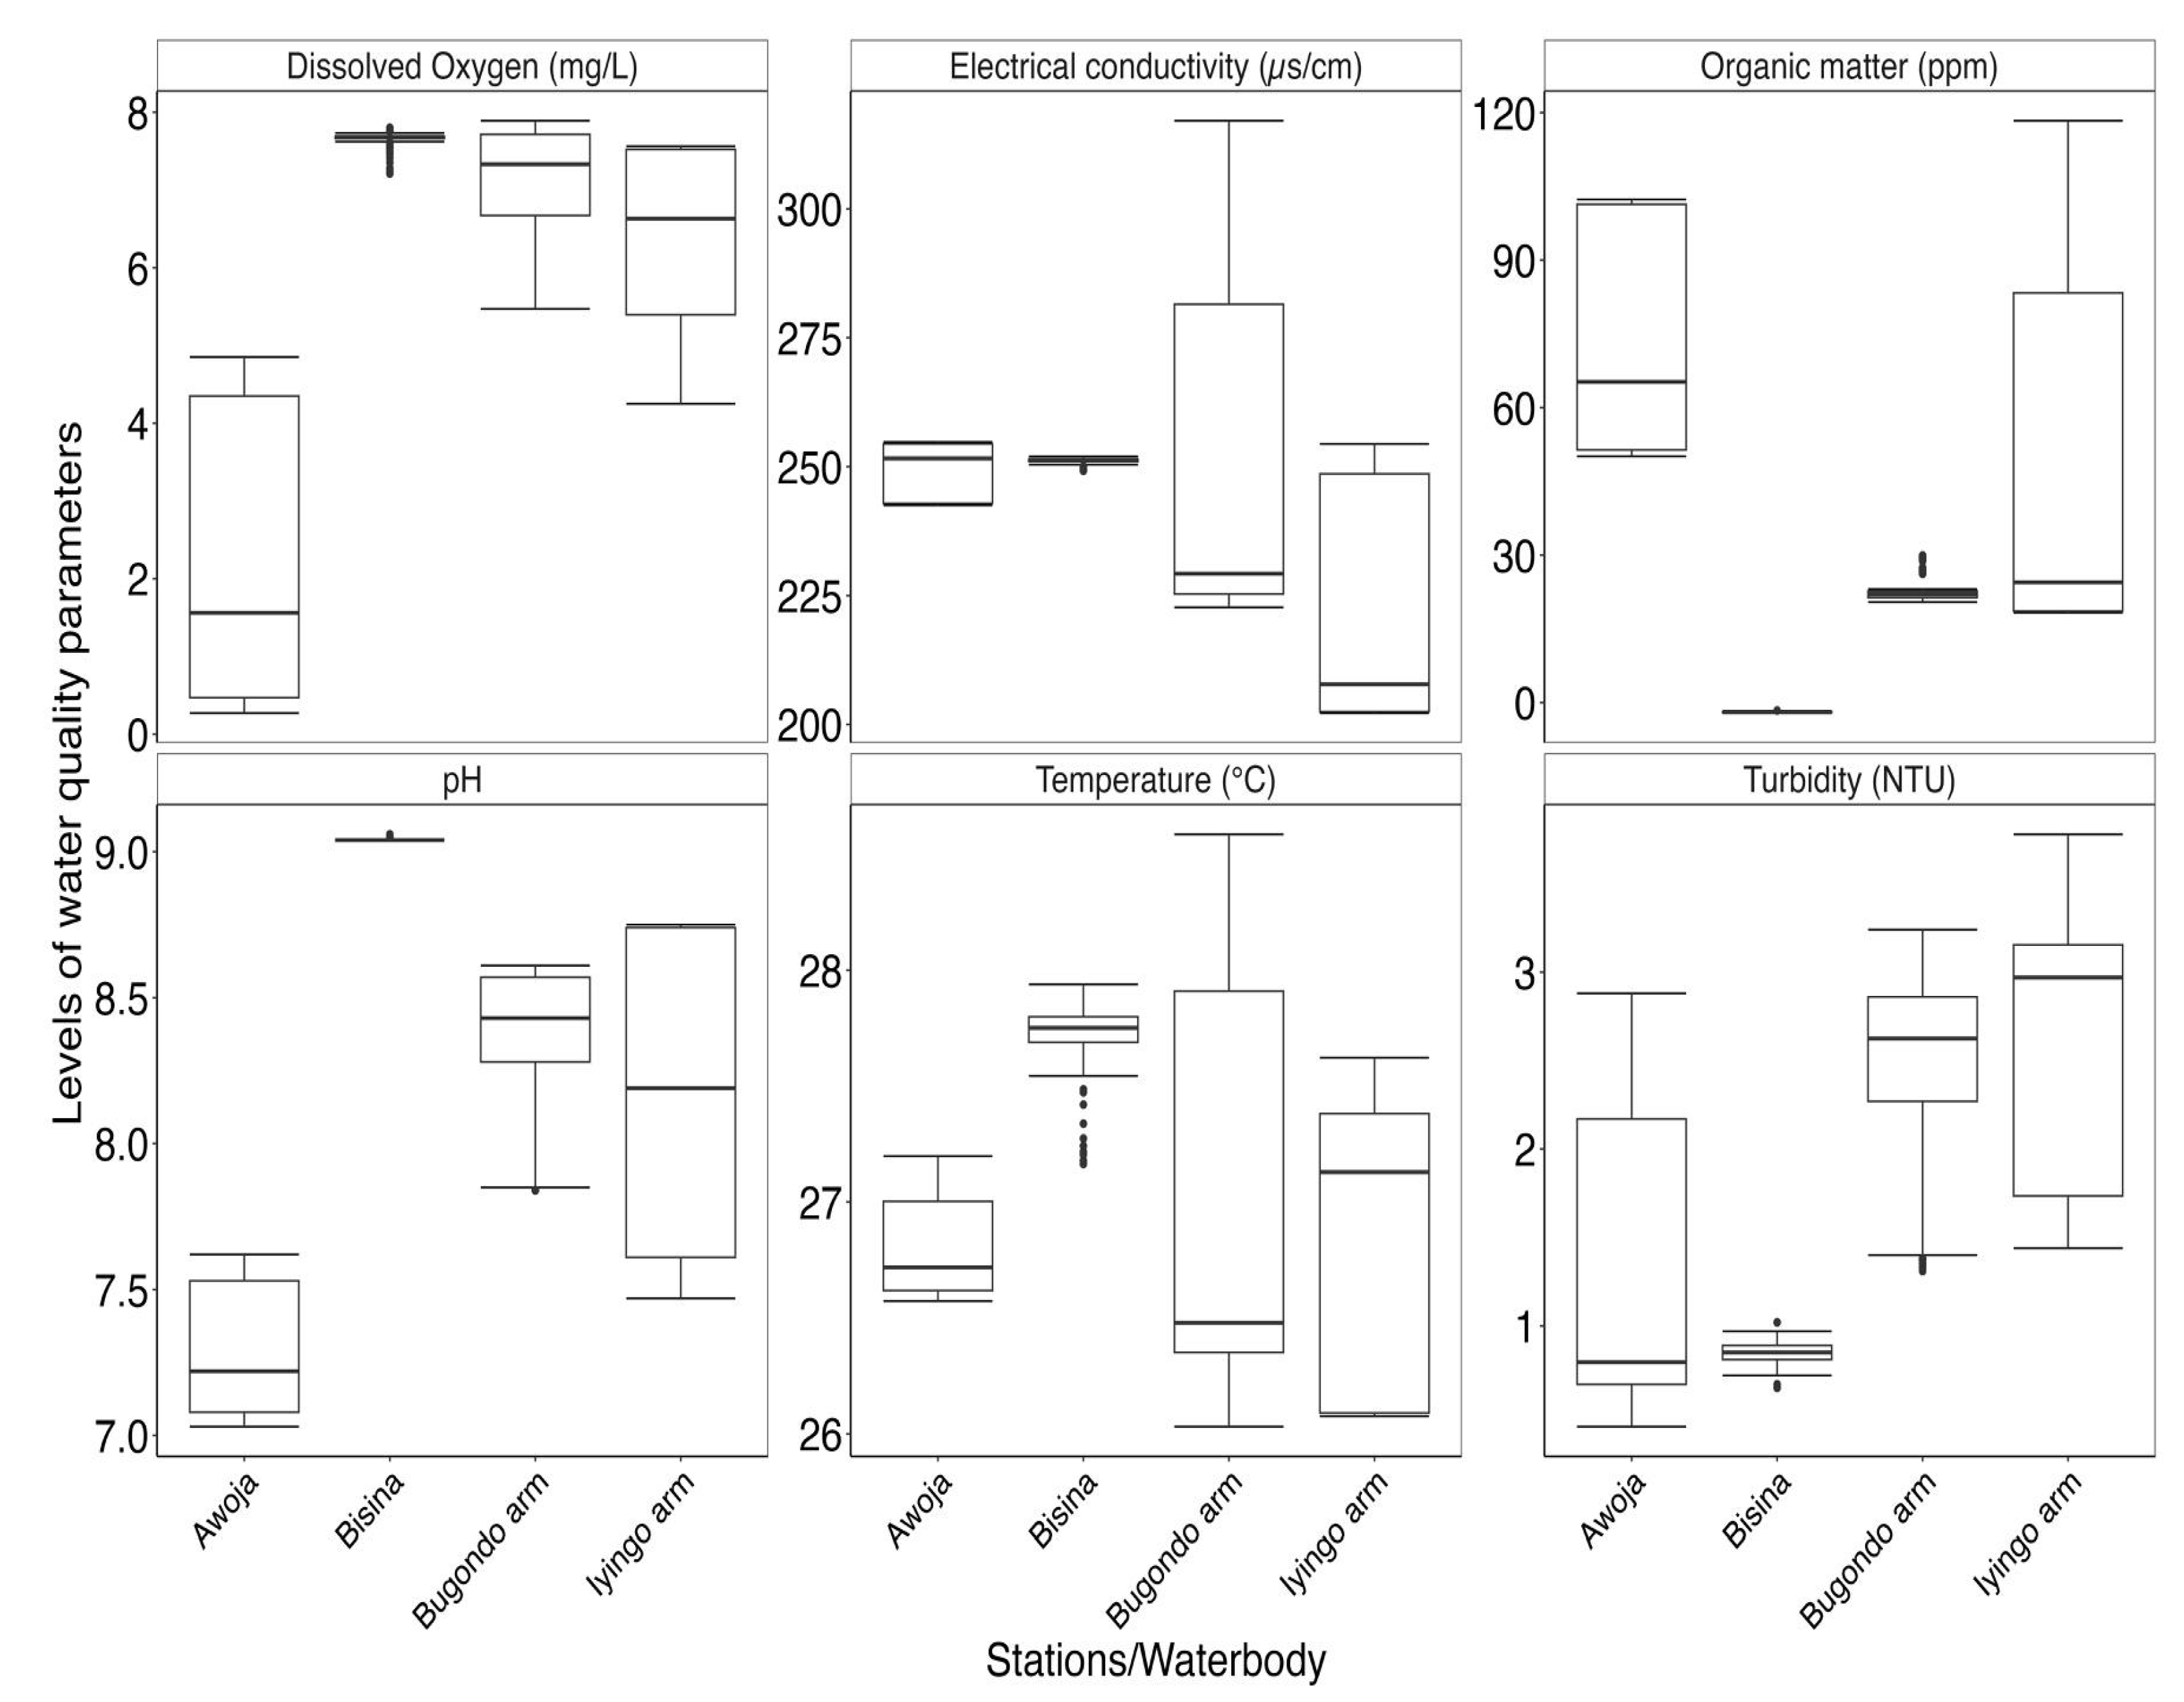
Figure 3.
The variation in the selected in-situ water quality characteristics in Lake Kyoga (Bugondo and Iyingo arms), River Awoja system and Lake Bisina.
Figure 3.
The variation in the selected in-situ water quality characteristics in Lake Kyoga (Bugondo and Iyingo arms), River Awoja system and Lake Bisina.
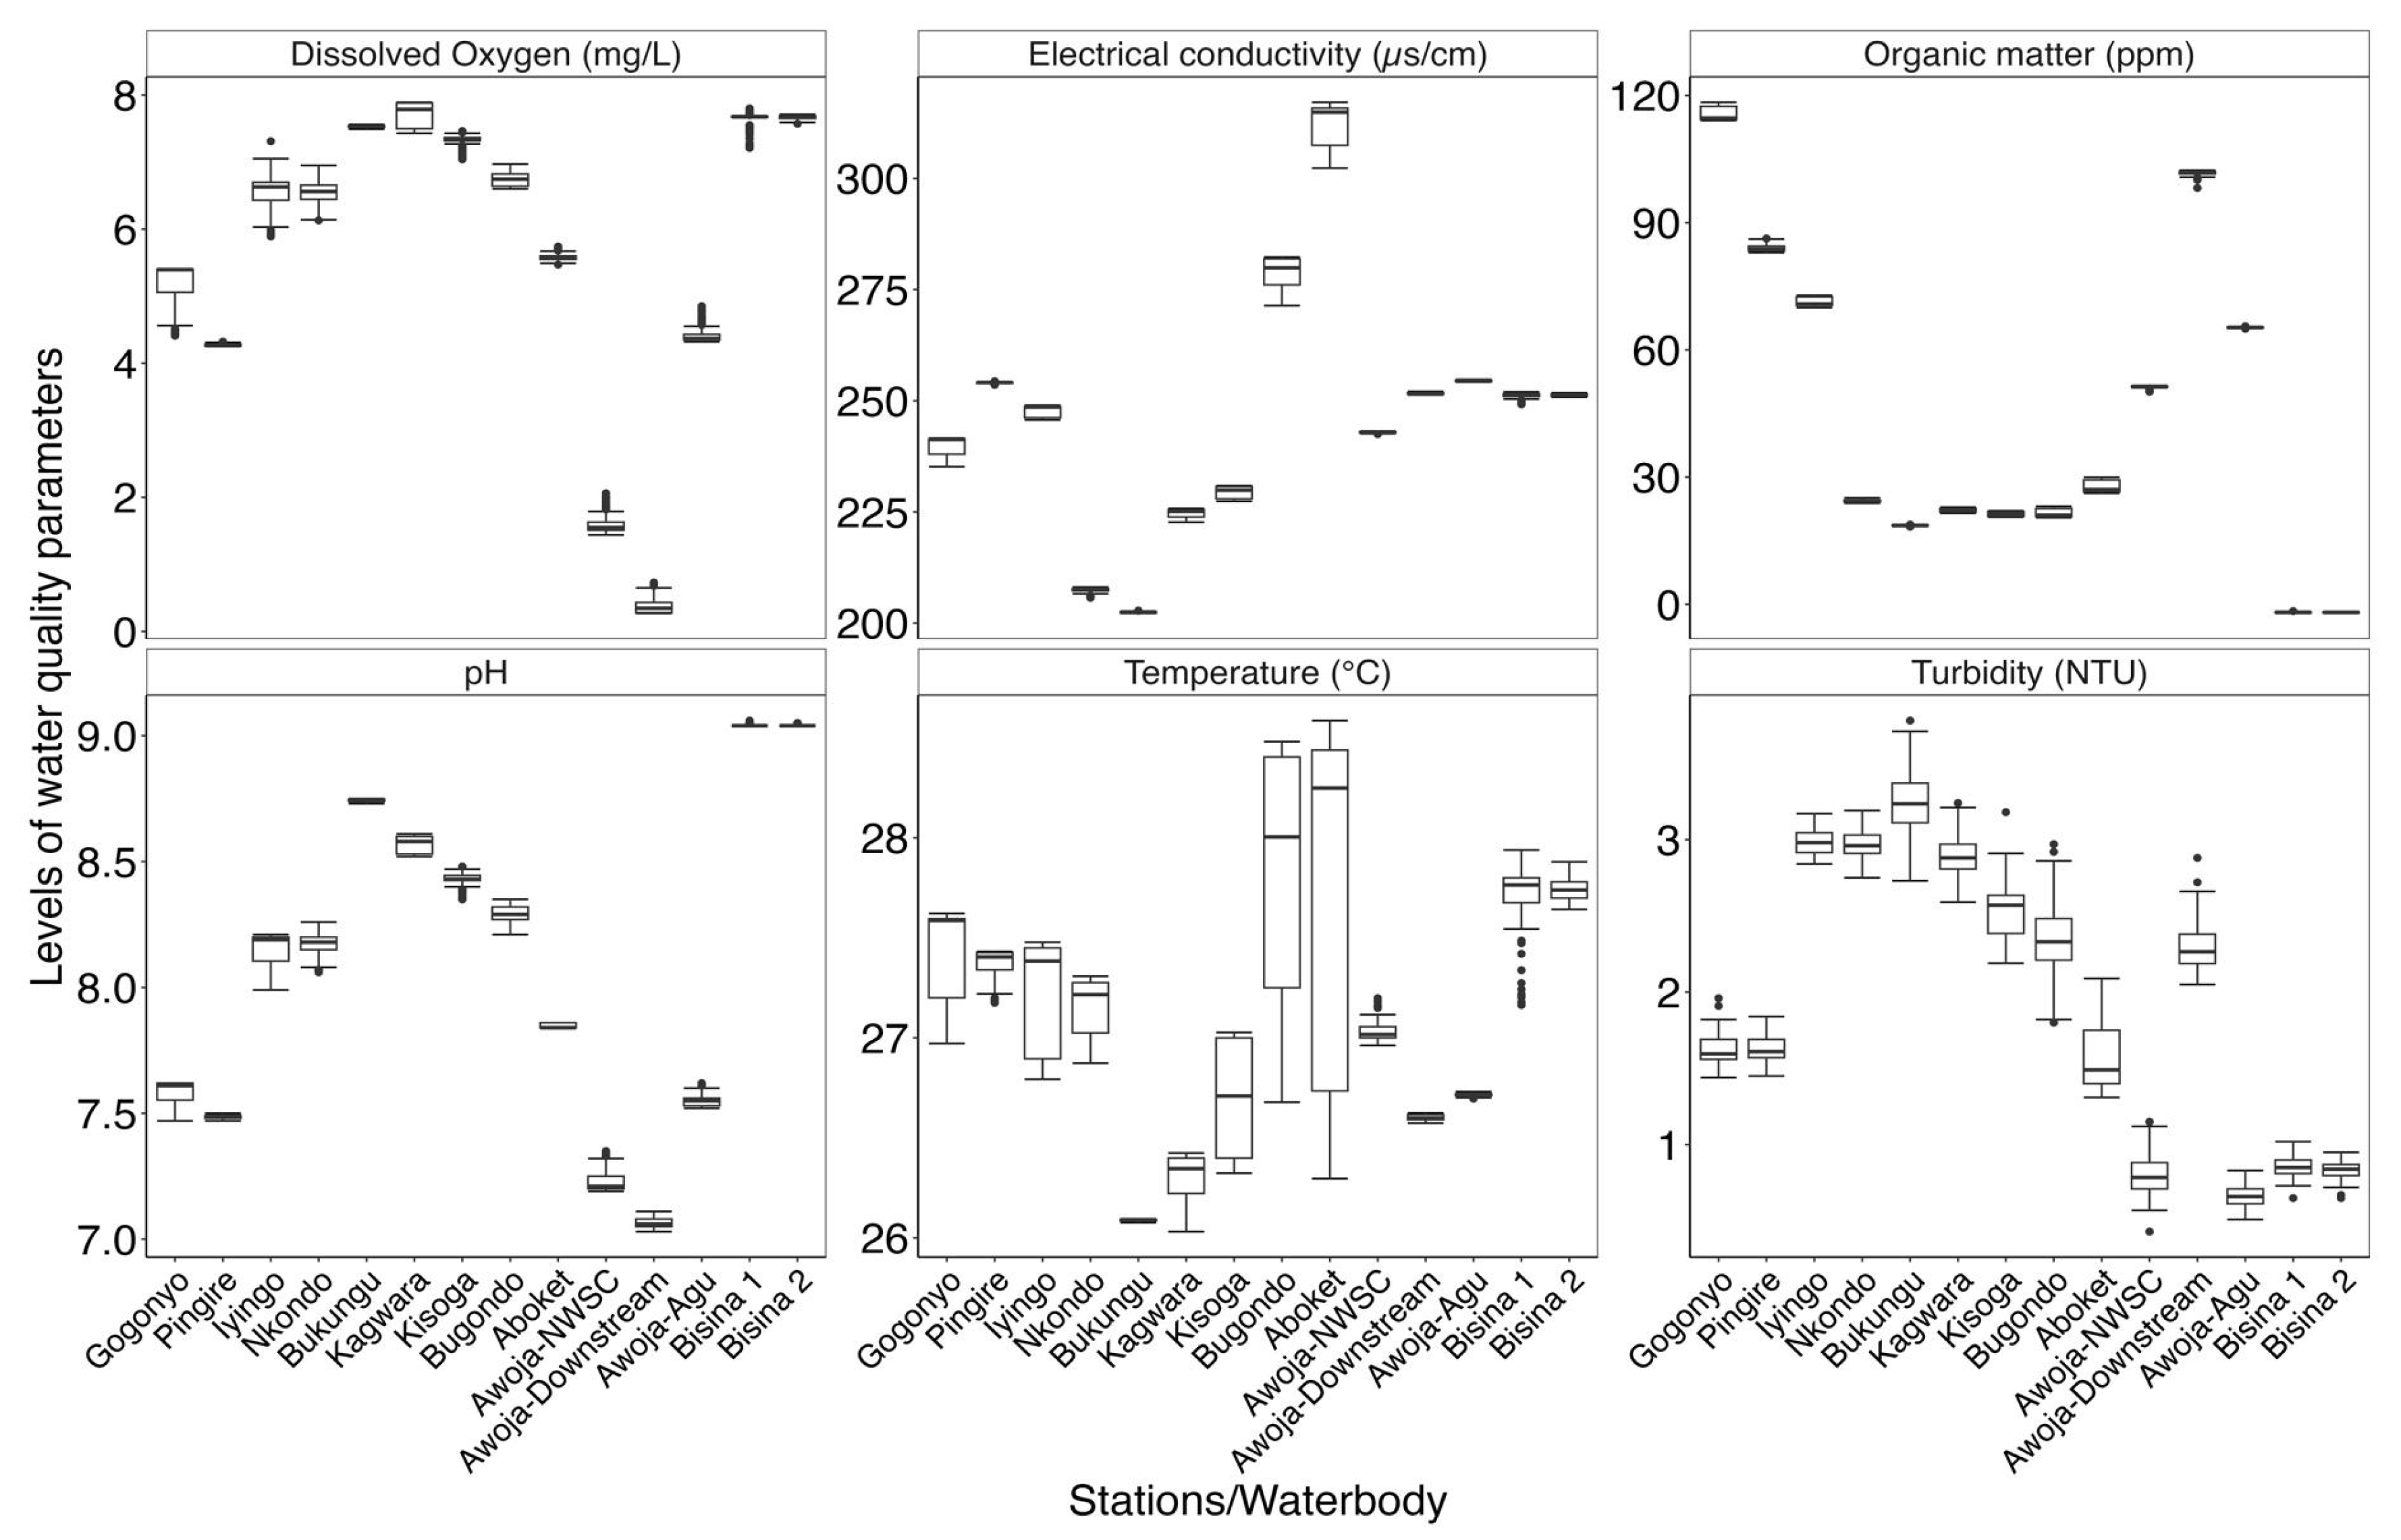

Table 1.
Summary statistics of selected in-situ water quality characteristics and nutrient dynamics measured in Lake Kyoga (Bugondo and Iyingo arms), River Awoja system and Lake Bisina.
Table 1.
Summary statistics of selected in-situ water quality characteristics and nutrient dynamics measured in Lake Kyoga (Bugondo and Iyingo arms), River Awoja system and Lake Bisina.
| Station/waterbody | Temperature (°C) | Dissolved oxygen (mg/L) | DO saturation (%) | Conductivity (µS/cm) | pH | Turbidity (NTU) | fDOM (ppb) | Chlorophyll-a (µg/L) | Phycocyan-BGA (µg/L) | |||||||||
|---|---|---|---|---|---|---|---|---|---|---|---|---|---|---|---|---|---|---|
| Min - Max | Mean±SD | Min - Max | Mean±SD | Min - Max | Mean±SD | Min - Max | Mean±SD | Min - Max | Mean±SD | Min - Max | Mean±SD | Min - Max | Mean±SD | Min - Max | Mean±SD | Min - Max | Mean±SD | |
| Gogonyo | 27−27.6 | 27.4±0.2 | 4.4−5.4 | 5.2±0.3 | 55.3−68.6 | 65.6±4.5 | 235.2−241.6 | 239.7±2.3 | 7.5−7.6 | 7.6±0.1 | 1.4−2 | 1.6±0.1 | 114.1−118.4 | 115.8±1.6 | 10.3−15.1 | 12.1±1.8 | 0.2−0.7 | 0.4±0.2 |
| Pingire | 27.2−27.4 | 27.4±0.1 | 4.3−4.3 | 4.3±0 | 53.8−54.4 | 54±0.2 | 253.6−254.4 | 254±0.2 | 7.5−7.5 | 7.5±0 | 1.5−1.8 | 1.6±0.1 | 83−86.3 | 84.1±0.9 | 8.3−10.9 | 9.6±0.7 | 0−0.2 | 0.1±0 |
| Iyingo | 26.8−27.5 | 27.2±0.3 | 5.9−7.3 | 6.5±0.3 | 73.7−90.4 | 82.5±3.9 | 245.7−249 | 247.7±1.2 | 8−8.2 | 8.1±0.1 | 2.8−3.2 | 3±0.1 | 70−72.8 | 71.4±1 | 13.7−17 | 15.1±0.8 | 2.3−2.8 | 2.5±0.1 |
| Nkondo | 26.9−27.3 | 27.2±0.1 | 6.1−7 | 6.5±0.2 | 76.8−87.5 | 82.4±2.4 | 205.7−208.1 | 207.4±0.6 | 8.1−8.3 | 8.2±0 | 2.8−3.2 | 3±0.1 | 23.9−25.1 | 24.4±0.3 | 8.4−12.3 | 10.3±1.3 | 2.5−4.2 | 3.2±0.6 |
| Bukungu | 26.1−26.1 | 26.1±0 | 7.5−7.6 | 7.5±0 | 92.5−93.3 | 93±0.2 | 202.2−202.8 | 202.4±0.1 | 8.7−8.8 | 8.7±0 | 2.7−3.8 | 3.2±0.2 | 18.3−18.8 | 18.6±0.1 | 7.9−10.1 | 8.8±0.4 | 2.3−3.4 | 2.7±0.3 |
| Kagwara | 26−26.4 | 26.3±0.1 | 7.4−7.9 | 7.7±0.2 | 91.8−98 | 95.6±2.3 | 222.7−225.8 | 224.7±0.9 | 8.5−8.6 | 8.6±0 | 2.6−3.2 | 2.9±0.1 | 21.5−22.9 | 22.2±0.4 | 6.5−11.9 | 8±1.1 | 1.8−3.4 | 2.1±0.4 |
| Kisoga | 26.3−27 | 26.7±0.3 | 7−7.5 | 7.3±0.1 | 87.3−92.9 | 91.4±1.5 | 227.4−230.9 | 229.4±1.4 | 8.4−8.5 | 8.4±0 | 2.2−3.2 | 2.5±0.2 | 20.6−22.1 | 21.3±0.5 | 4.5−10.6 | 6.8±2 | 1.2−3 | 2±0.7 |
| Bugondo | 26.7−28.5 | 27.8±0.6 | 6.6−7 | 6.8±0.1 | 82.5−87.4 | 86.1±0.9 | 271.4−282.3 | 278.7±3.6 | 8.2−8.4 | 8.3±0 | 1.8−3 | 2.4±0.2 | 20.5−23.1 | 21.5±0.9 | 3.1−8.1 | 4.7±1.5 | 0.7−2.1 | 1.2±0.3 |
| Aboket | 26.3−28.6 | 27.8±0.9 | 5.5−5.7 | 5.6±0.1 | 69.3−71.7 | 71.1±0.6 | 302.3−317.1 | 312.4±5.1 | 7.8−7.9 | 7.8±0 | 1.3−2.1 | 1.6±0.2 | 26.2−29.9 | 27.6±1.4 | 2.2−4.4 | 3±0.6 | 0.1−0.5 | 0.2±0.1 |
| Awoja-NWSC | 27−27.2 | 27±0.1 | 1.4−2.1 | 1.6±0.1 | 18.1−25.9 | 20±1.7 | 242.5−243.2 | 242.9±0.1 | 7.2−7.4 | 7.2±0 | 0.4−1.2 | 0.8±0.1 | 50.1−51.6 | 51.3±0.3 | 1.4−2.4 | 1.7±0.2 | -1.1−-0.9 | -1±0 |
| Awoja-Downstream | 26.6−26.6 | 26.6±0 | 0.3−0.7 | 0.4±0.1 | 3.3−9.1 | 4.7±1.4 | 251.3−252.1 | 251.7±0.2 | 7−7.1 | 7.1±0 | 2.1−2.9 | 2.3±0.2 | 98.2−102.4 | 101.7±0.7 | 3.1−31.7 | 5.7±5.7 | -1.1−-0.2 | -0.9±0.2 |
| Awoja-Agu | 26.7−26.7 | 26.7±0 | 4.3−4.9 | 4.4±0.1 | 54−60.6 | 55.2±1.4 | 254.2−254.8 | 254.5±0.1 | 7.5−7.6 | 7.5±0 | 0.5−0.8 | 0.7±0.1 | 65−65.6 | 65.3±0.1 | 2−2.5 | 2.3±0.1 | -1.1−-0.9 | -0.9±0 |
| Bisina 1 | 27.2−27.9 | 27.7±0.2 | 7.2−7.8 | 7.6±0.1 | 91.9−98.2 | 97.3±1.3 | 249.2−252 | 251.2±0.6 | 9−9.1 | 9±0 | 0.7−1 | 0.9±0.1 | -2.1−-1.6 | -1.9±0.1 | 0−0.6 | 0.3±0.1 | -1.1−-0.9 | -0.9±0 |
| Bisina 2 | 27.6−27.9 | 27.7±0.1 | 7.6−7.7 | 7.7±0 | 96.3−98.1 | 97.6±0.4 | 250.8−251.8 | 251.3±0.3 | 9−9.1 | 9±0 | 0.7−1 | 0.8±0.1 | -2.1−-1.7 | -1.9±0.1 | 0.1−0.4 | 0.2±0.1 | -1−-0.8 | -0.9±0 |
Table 1.
….continued ….
| Station/waterbody | NO2 (µg/L) | NO3 (µg/L) | NH4 (µg/L) | PO4 (µg/L) | SiO2 (µg/L) | TP (µg/L) | TN (µg/L) | |
|---|---|---|---|---|---|---|---|---|
| Gogonyo | 5.4 | 26.6 | 42.1 | 19.6 | 353.3 | 125 | 843.7 | |
| Pingire | 7.9 | 32.4 | 36.8 | 37.4 | 315.8 | 201.2 | 1782.6 | |
| Iyingo | 6.1 | 33.9 | 35.9 | 19.6 | 396.5 | 105.9 | 145 | |
| Nkondo | 5 | 22.2 | 38.6 | 15.2 | 227.6 | 125 | 887.4 | |
| Bukungu | 5 | 22.2 | 40.3 | 19.6 | 411.5 | 80.5 | 297.9 | |
| Kagwara | 4.3 | 42.6 | 66.7 | 47.8 | 191.9 | 112.3 | 319.7 | |
| Kisoga | 13.2 | 47 | 43.8 | 71.5 | 193.8 | 105.9 | 800.1 | |
| Bugondo | 3.9 | 17.8 | 35.9 | 28.5 | 308.3 | 48.8 | 428.9 | |
| Aboket | 5 | 23.7 | 83.4 | 37.4 | 180.6 | 99.6 | 2830.6 | |
| Awoja-NWSC | 6.1 | 20.7 | 42.1 | 163.3 | 557.9 | 213.9 | 319.7 | |
| Awoja-Downstream | 5 | 28 | 32.4 | 68.5 | 366.4 | 239.2 | 1280.4 | |
| Awoja-Agu | 5.7 | 32.4 | 44.7 | 123.3 | 584.2 | 213.9 | 843.7 | |
| Bisina 1 | 3.9 | 22.2 | 42.1 | 37.4 | 396.5 | 226.6 | 1804.4 | |
| Bisina 2 | 5.4 | 17.8 | 35.9 | 31.5 | 360.8 | 232.9 | 2241.1 |
Table 2.
Taxonomic checklist, species composition and distribution of phytoplankton in River Awoja and its catchment, August 2024.
Table 2.
Taxonomic checklist, species composition and distribution of phytoplankton in River Awoja and its catchment, August 2024.
| Family | Species | 1 | 2 | 3 | 4 | 5 | 6 | 7 | 8 | 9 | 10 | 11 | 12 | 13 | 14 |
|---|---|---|---|---|---|---|---|---|---|---|---|---|---|---|---|
| Blue- green | Dolichospermum circinalis | × | × | × | × | × | × | × | × | × | × | × | × | × | √ |
| Dolichospermum planctonica | × | × | × | × | × | × | × | × | × | × | √ | × | √ | √ | |
| Anabaenopsis tanganyikae | × | × | × | × | × | × | × | × | × | × | √ | √ | × | √ | |
| Aphanocapsa delicatissima | × | √ | × | × | × | × | √ | × | √ | √ | × | √ | × | √ | |
| Aphanocapsa elachista | × | × | × | × | × | √ | × | × | × | × | × | √ | √ | × | |
| Aphanocapsa holistica | × | √ | × | × | × | × | √ | × | × | × | √ | √ | √ | √ | |
| Aphanocapsa incerta | × | √ | × | × | × | × | √ | × | × | √ | √ | √ | √ | √ | |
| Aphanocapsa nubillium | √ | √ | √ | × | √ | √ | √ | √ | √ | √ | √ | √ | √ | √ | |
| Aphanocapsa species | √ | × | × | × | × | √ | √ | × | × | × | √ | √ | √ | × | |
| Chroococcus dispersus | √ | × | × | × | × | √ | √ | √ | √ | √ | √ | √ | √ | √ | |
| Chroococcus limnetica | √ | √ | × | × | × | √ | √ | √ | √ | √ | × | √ | × | √ | |
| Chroococcus minutus | × | × | × | × | × | √ | √ | √ | √ | √ | √ | √ | √ | × | |
| Chroococcus turgidus | × | × | × | × | × | √ | × | √ | × | × | √ | √ | √ | × | |
| Chroococcus species | × | √ | × | √ | × | × | × | × | × | × | × | × | × | × | |
| Cylindrospermosis africana | √ | √ | × | × | × | √ | √ | × | √ | × | √ | √ | √ | √ | |
| Coelomoron pusila | × | √ | × | × | × | × | √ | × | × | × | × | √ | × | × | |
| Coelomoron tropicale | × | √ | × | × | × | × | √ | × | × | × | × | √ | × | × | |
| Coelosphaerium kuetzingnium | × | × | × | × | × | √ | × | × | × | √ | √ | √ | √ | × | |
| Merismopedia tenuissima | × | × | × | × | × | √ | √ | √ | √ | √ | √ | √ | √ | √ | |
| Microcystis aeruginosa | × | × | × | × | × | × | × | × | × | × | √ | √ | × | × | |
| Planktolyngbya circumcreta | √ | √ | × | × | × | √ | √ | √ | √ | √ | √ | √ | × | × | |
| Planktolyngbya contorta | × | × | × | × | × | × | √ | × | √ | √ | √ | √ | × | × | |
| Planktolyngbya limnetica | √ | √ | √ | √ | √ | √ | √ | √ | √ | √ | √ | √ | √ | √ | |
| Planktolyngbya tallingii | √ | √ | √ | √ | √ | √ | √ | √ | √ | √ | √ | √ | √ | √ | |
| Planktolyngbya undulata | × | × | × | × | × | × | √ | × | × | × | × | √ | × | × | |
| Pseudanabaena limnetica | × | × | √ | × | × | √ | √ | × | √ | √ | × | × | √ | × | |
| Sub Total | 08 | 11 | 04 | 03 | 03 | 14 | 18 | 09 | 12 | 13 | 17 | 22 | 15 | 13 | |
| Cryptophytes | Cryptomonas marssonii | × | × | × | × | × | × | × | × | √ | × | √ | × | √ | × |
| 00 | 00 | 00 | 00 | 00 | 00 | 00 | 00 | 01 | 00 | 01 | 00 | 01 | 00 | ||
| Diatoms | Aulacoseira ambigua | × | × | × | × | × | × | × | × | × | × | × | √ | × | × |
| Aulacoseira granulata | × | × | × | × | × | × | √ | × | √ | √ | × | √ | √ | × | |
| Centric diatoms | × | × | × | × | × | × | × | × | × | × | × | √ | × | × | |
| Cyclotella kutzingiana | × | √ | × | × | × | × | × | × | × | × | × | × | × | × | |
| Cyclotella meneghiniana | √ | × | √ | × | × | × | × | √ | √ | √ | × | × | √ | × | |
| Cyclotella species | × | × | × | √ | × | √ | × | × | × | × | × | × | × | × | |
| Navicula gastrum | × | × | × | × | × | × | √ | × | × | × | √ | × | × | × | |
| Navicula radiosa | × | × | √ | × | × | × | × | × | √ | √ | × | √ | × | × | |
| Nitzschia acicularis | √ | × | × | √ | √ | × | √ | √ | √ | √ | × | √ | √ | √ | |
| Nitzschia nyasensis | × | × | × | × | × | × | × | × | × | × | × | × | × | √ | |
| Nitzschia species | × | × | √ | × | × | × | × | √ | × | × | × | × | × | × | |
| Stephanodiscus astraea | × | × | × | × | × | × | × | × | × | √ | × | × | × | × | |
| Synedra species | × | × | × | × | × | × | × | × | × | √ | × | × | × | × | |
| Sub Total | 02 | 01 | 03 | 02 | 01 | 01 | 03 | 03 | 04 | 06 | 01 | 05 | 03 | 02 | |
| Dinoflagellates | Peridinium species | × | × | × | × | × | × | × | × | × | × | × | × | × | √ |
| 00 | 00 | 00 | 00 | 00 | 00 | 00 | 00 | 00 | 00 | 00 | 00 | 00 | 01 | ||
| Euglenophytes | Cryptomonas marssonii | × | × | × | √ | × | × | × | × | × | × | × | × | × | × |
| Euglena acus | × | × | × | × | √ | × | × | × | × | × | × | × | √ | × | |
| Phacus species | × | × | × | × | × | × | × | × | × | √ | √ | × | × | × | |
| Strambonas species | × | × | × | × | × | × | × | × | × | √ | × | × | × | × | |
| Trachellomonas species | × | × | × | × | × | × | × | × | √ | × | × | × | × | × | |
| 00 | 00 | 00 | 01 | 01 | 00 | 00 | 00 | 00 | 02 | 01 | 00 | 01 | 00 | ||
| Green algae | Actinastrum species | × | × | × | × | × | × | × | × | × | × | × | × | √ | √ |
| Ankistrodesmus falcatus | √ | × | × | √ | √ | √ | √ | √ | √ | √ | √ | × | √ | √ | |
| Ankistrodesmus stegera | × | × | × | × | × | × | × | √ | √ | √ | × | × | √ | × | |
| Chlorella vulgaris | × | × | × | × | × | × | × | × | √ | × | × | × | × | × | |
| Coelastrum microporum | × | × | × | × | × | × | × | × | √ | √ | √ | √ | × | × | |
| Cosmarium habitat | × | × | × | × | × | × | × | × | × | × | × | √ | √ | × | |
| Crucigenia tetraepoda | × | × | × | × | × | × | × | × | × | × | × | × | √ | × | |
| Goniocloris species | × | × | × | × | × | × | × | × | × | × | × | × | √ | × | |
| Kirchniriella obesa | × | × | × | × | × | √ | × | × | × | × | × | × | √ | √ | |
| Monoraphidium contortum | × | × | × | × | × | × | √ | × | × | × | × | √ | × | × | |
| Oocystis gigas | × | × | √ | × | × | × | × | × | × | √ | × | × | × | × | |
| Pediastrum simplex | × | × | × | × | × | × | × | × | × | × | × | × | √ | × | |
| Scenedesmus acuminatus | × | × | × | × | × | × | × | × | √ | √ | √ | √ | × | √ | |
| Scenedesmus apiculatus | × | √ | × | × | × | × | × | × | × | √ | × | √ | √ | × | |
| Scenedesmus bernardii | × | × | × | × | × | × | × | × | × | × | √ | × | × | × | |
| Scenedesmus communis | × | × | × | × | × | × | × | × | × | × | √ | × | × | × | |
| Scenedesmus species | × | × | × | × | × | × | × | × | × | × | × | √ | × | × | |
| 01 | 01 | 01 | 01 | 01 | 02 | 02 | 02 | 05 | 06 | 05 | 06 | 09 | 04 | ||
| Total species | 11 | 08 | 07 | 06 | 17 | 13 | 13 | 14 | 22 | 27 | 25 | 33 | 29 | 20 | |
Where x = Absent and√= PresentThe total biovolume varied by sites ranging from 0.20 - 53.87 mm3L-1 (Table 3). At all these sites, Blue green contributed the most of the biovolume (0.02 - 50.56 mm3L-1), followed by Green algae (0.00 - 4.12 mm3L-1). Diatoms and Euglenoids were of less significance.
Table 3.
River Awoja and its catchment, chlorophyll-a and algal biovolume, August 2024.
| No. | Sampling site | Chl-a (µgL-1) | Blue green | Diatoms | Euglenophytes | Green | Biovolume (mm3 L-1) | |
|---|---|---|---|---|---|---|---|---|
| 1 | Lake Bisiina 1 | 0.70 | 0.54 | 0.23 | 0.00 | 0.08 | 0.85 | |
| 2 | Lake Bisiina 2 | 0.00 | 0.83 | 0.05 | 0.00 | 0.08 | 0.96 | |
| 3 | Awoja Bridge | 1.00 | 0.03 | 0.14 | 0.00 | 0.24 | 0.41 | |
| 4 | Awoja Down | 0.00 | 0.02 | 0.18 | 0.05 | 0.02 | 0.27 | |
| 5 | River Agu | 0.00 | 0.09 | 0.08 | 0.01 | 0.02 | 0.20 | |
| 6 | L. Kyoga - Aboket | 0.70 | 7.90 | 0.05 | 0.00 | 0.12 | 8.07 | |
| 7 | L. Kyoga - Bugondo | 2.10 | 0.03 | 0.28 | 8.75 | 0.00 | 9.06 | |
| 8 | L. Kyoga - Kisoga | 6.10 | 0.15 | 0.29 | 5.76 | 0.04 | 6.24 | |
| 9 | L. Kyoga - Kagwara | 7.30 | 36.28 | 0.22 | 0.12 | 1.06 | 37.68 | |
| 10 | L. Kyoga - Bukungu | 6.50 | 50.56 | 0.57 | 0.09 | 2.65 | 53.87 | |
| 11 | L. Kyoga - Nkondo | 2.60 | 39.86 | 0.16 | 0.18 | 1.42 | 41.62 | |
| 12 | L. Kyoga - Iyingo | 6.50 | 11.97 | 0.69 | 0.11 | 2.89 | 15.66 | |
| 13 | L. Kyoga - Pingire | 2.60 | 4.85 | 0.28 | 0.01 | 2.35 | 7.49 | |
| 14 | L. Kyoga - Gogonyo | 2.60 | 2.11 | 0.44 | 0.00 | 4.12 | 6.67 |
Phytoplankton Composition:
A total of 72 species of phytoplankton from 41 genera belonging to: blue green algae, cryptophytes, diatoms, dinoflagellates, euglenophytes and green algae were found at River Awoja, its catchment areas up to Eastern part of Lake Kyoga (Table 2). Although the species were almost evenly distributed among the four groups, Diatoms had the highest species number of ten followed by Green algae (10), Blue-green algae (9) and least was Euglenoids (1).
Diversity and Abundance:
Blue green algae had 31 species. Out of these, only four known main toxin producing species were: Cylindrospermopsis africana from Aboket, Bugondo, Kagwara, Nkondo, Pingire and Gogonyo; Dolichospermum circinalis and Dolichospermum plactonica got from Nkondo, Pingire and Gogonyo and Microcystis aerugonsa from Nkondo and Iyingo only. All these were recovered from the Lake sites in Bisiina and none from the Awoja Bridge, Awoja Downstream and River Agu.
The genera Cryptophytes was the least represented with only one species Cryptomonas marssonii recorded from Kagwara, Nkondo and Pingire. The overall total biovolume was 0.37 mm3 L-1. Diatoms had 13 species spread all over the sampled sites with the overall total biovolume of 4.04 mm3 L-1. The most prevalent species was Nitzschia acicularis found in 10 out of 14 sites that were sampled. Dinoflagellates occurred in only one sampled site at Gogonyo with a single species of Peridinium observed. However, because of their shape, the biovolume is high at 11.60 mm3 L-1. Also, only five species of Euglenophytes were present from seven sites out of the fourteen sample. All contributed to a total biovolume of 0.56 mm3 L-1.
The second most important group is the Green algae with 16 genera comprising of 27 species contributing to an overall total biovolume of 15.31 mm3 L-1. It is the Ankistrodesmus falcatus that was present in 11 out of the 14 sampled sites. Gogonyo, Pingire and Bukungu were sites with more species of 9, 6 and 6 respectively.
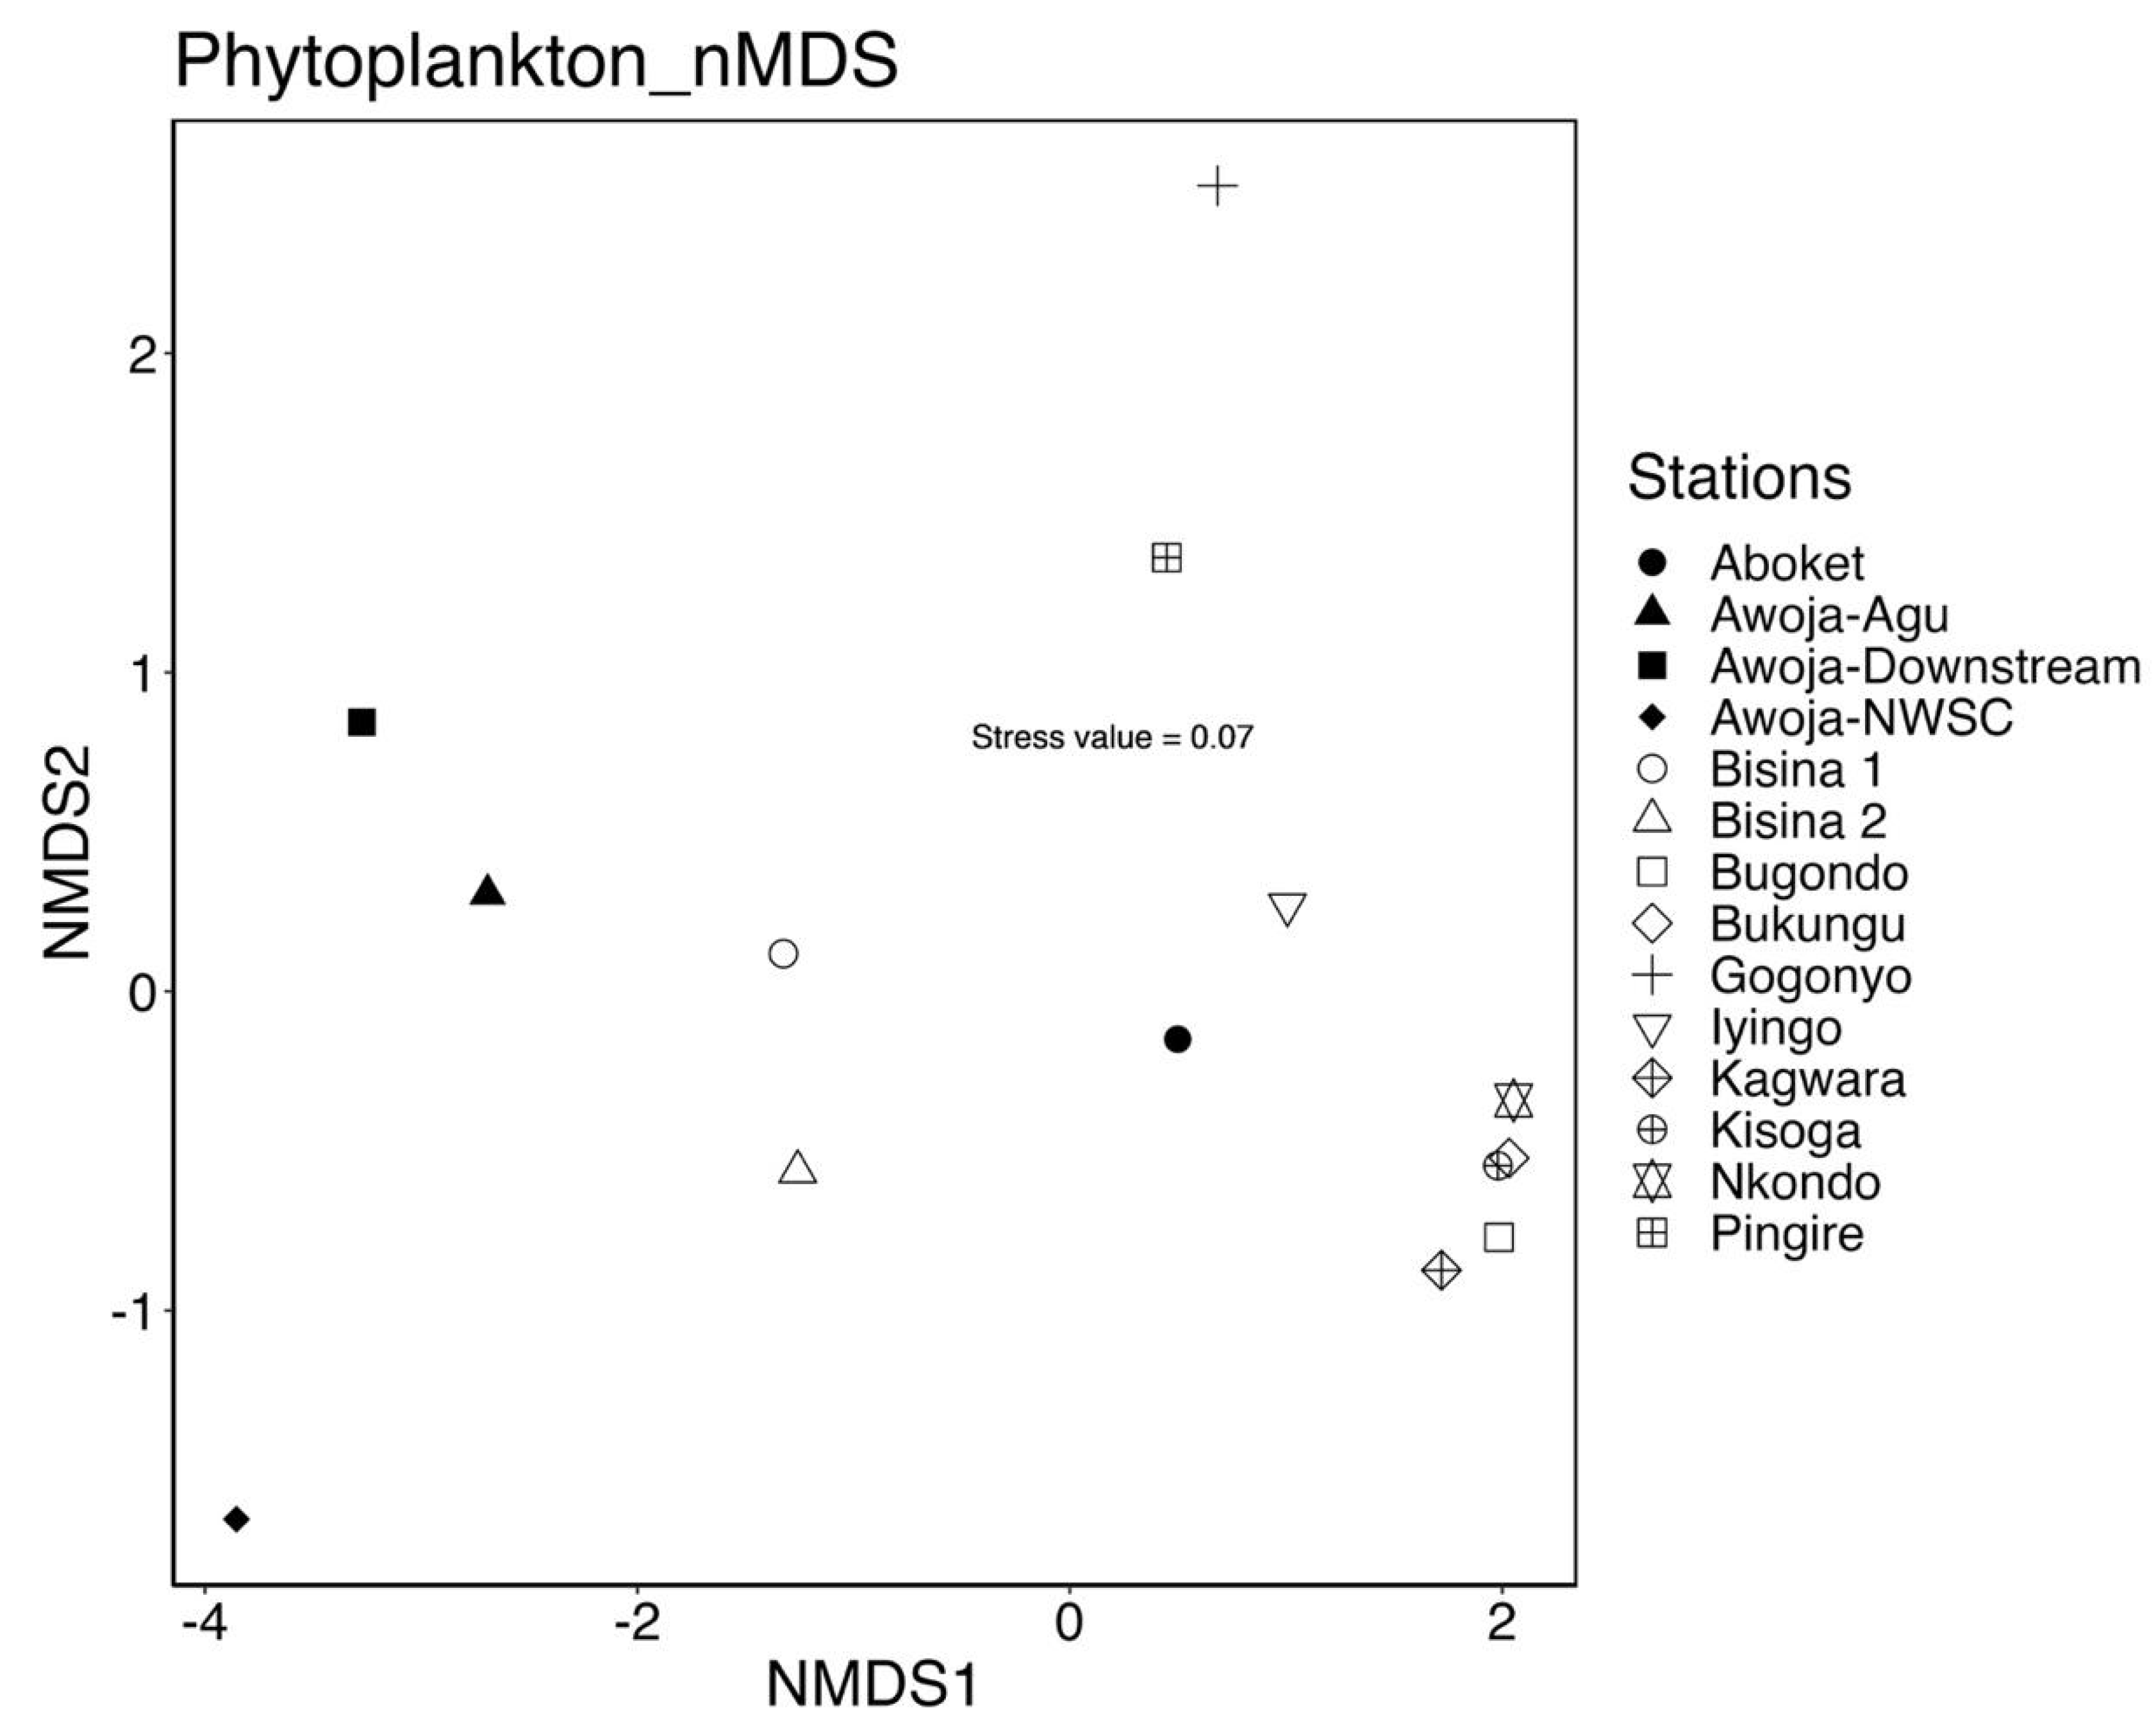
The distribution of phytoplankton abundance varied significantly across the sampled sites, forming four distinct clusters. The sites Nkondo, Kisoga, Bukungu, Bugondo, and Kagwara grouped together, while Iyingo and Aboket formed a separate cluster. Similarly, the Lake Bisina sites, Awoja downstream, and Awoja-Agu clustered together. However, sites such as Awoja-NWSC, Pingire, and Gogonyo did not cluster with any other sites on the nMDS ordination. (Figure 4). The estimated variance and dissimilarity in the structure of the phytoplankton communities’ abundance was 57.2% and mainly driven by 12 phytoplankton species of Blue green alage (Aphanocapsa nubillium, Chroococcus dispersus, C. limnetica, C. minutus, Dolichospermum circinalis, Merismopedia tenuissima, Planktolyngbya circumcreta, P. contorta, P. limnetica, and P. tallingii); the diatom Nitzschia aciccularis and green algae Actinastrum sp.
Figure 4.
Differences in the structure of the phytoplankton communities and contributing taxa to nMDS ordination of the communities performed on Bray-Curtis dissimilarities matrix using relative abundance (Stress =0.07).
Figure 4.
Differences in the structure of the phytoplankton communities and contributing taxa to nMDS ordination of the communities performed on Bray-Curtis dissimilarities matrix using relative abundance (Stress =0.07).
Discussion
Diversity and Abundance of Phytoplankton in Lake Kyoga Complex
Lake Kyoga, along with its catchment areas—such as Lake Bisina and the Awoja wetland system—is a vital component of the Victoria Nile system. This shallow and expansive lake exhibits ecological similarities to Lake Victoria, especially in terms of nutrient cycles and phytoplankton composition. Despite its significance, however, Lake Kyoga has not been extensively studied.
Studies on Lake Victoria, such as those by [19], highlighted significant shifts in phytoplankton composition associated with nutrient enrichment, including the proliferation of cyanobacteria, particularly toxin-producing taxa like Microcystis. Likewise [20] reported a transition from diatom dominance to cyanobacteria, notably Cylindrospermopsis and Microcystis, a trend strongly influenced by increasing eutrophication. Given Lake Victoria’s hydrological influence on Lake Kyoga, it is not surprising that similar phytoplankton transitions are now being observed in the eastern arm of Lake Kyoga.
In the current study, we observed a dominance of cyanobacteria, with over 30 species identified in the phytoplankton community. Of particular concern are four toxin-producing cyanobacteria species: Cylindrospermopsis africana; Dolichospermum circinalis; Dolichospermum planctonica and Microcystis aeruginosa. These taxa are known microcystin (MC) producers and were detected in several sampled sites. Similar cyanobacterial strains were previously documented in Lake Victoria by [21] and [2].
Our findings further reinforce that trophic conditions and water depth are critical environmental drivers of MC-producing cyanobacteria, with shallow, nutrient-enriched sites offering optimal conditions for their proliferation. These patterns are consistent with ecological observations in Lake Victoria and are now evident in parts of the Lake Kyoga complex, indicating a region-wide ecological shift driven by similar pressures.
In a detailed genetic analysis, [2] confirmed that Microcystis spp., particularly Microcystis aeruginosa, is the primary MC-producing cyanobacterium in Uganda. However, their follow-up study [22] noted a discrepancy in Microcystis biomass and toxin levels in Lake George. Despite high biomass, MC concentrations were low attributed to the absence of the mcyB gene, essential for microcystin synthesis. This underlines the importance of molecular screening for toxin genes, as the mere presence of a species does not confirm toxin production.
Given the ongoing anthropogenic pressures such as agricultural runoff, sediment loading, and poor sanitation across the Lake Kyoga and Awoja catchments, these systems are at high risk of experiencing further cyanobacterial proliferation. Without appropriate intervention, these conditions could mirror the toxic bloom events documented in other regional lakes.
This study did not quantify microcystins in the absence of certain analytical instrumentation. We support the recommendation by [22] to use genotypic detection methods, particularly quantifying the mcyB gene, for reliable estimation of toxin potential. This approach offers a cost-effective and scalable alternative while building technical capacity for future toxin monitoring and risk assessments at both the University and the Research Institute.
Conclusions and Implications
This study shows that the River Awoja wetland system continues to exhibit relatively good water quality, characterized by low phytoplankton biomass, low chlorophyll-a concentrations, and reduced oxygen levels. These parameters suggest minimal primary productivity, which is likely to limit fisheries production through reduced carbon transfer to higher trophic levels. The eastern portion of Lake Kyoga demonstrated significant cyanobacterial dominance, including the presence of four known toxin-producing species. These findings highlight an emerging risk of harmful algal blooms in the lake and the need for targeted molecular screening for cyanotoxin genes, particularly mcyB, followed by chemical confirmation from positive sites.
This work underscores the need for continuous monitoring, catchment management, and as applicable, policy-level action to prevent further ecological degradation and safeguard public health. Establishing early warning systems and integrated catchment management frameworks will be critical for ensuring the sustainable use of the Lake Kyoga complex.
Acknowledgements
The study was funded by the International Atomic Energy Agency under Research Contract Number 25062 awarded to Soroti University. We are grateful to Dr Winnie Nalukenge Nkalubo, the Director of The National Fisheries Resources Research Institute, Jinja Uganda for allowing us to analyse the samples in their laboratories.
References
- Ramsar Convention Secretariat. (2006). Lake Bisina Wetland System Ramsar Information Sheet. Ramsar Sites Information Service. (p.11).
- Okello, W. , Portmann, C., Erhard, M., Gademann, K., and Kurmayer, R. Occurrence of microcystin-producing cyanobacteria in Ugandan freshwater habitats. Environ Toxicol 2010, 25, 367–380. [Google Scholar] [CrossRef]
- Ogutu-Ohwayo, R. , Hecky, R. E., Cohen, A. S. and Kaufman, L. (1997). Human impacts on the African Great Lakes. Environmental Biology of Fishes.
- Worthington, E. B. (1929). New species of fish from the Albert Nyanza and Lake Kioga. Proceedings of the Zoological Society of London. (Pt 3, no. 29) (art. 34): 429-440.
- NaFIRRI, (2024). The fisheries potential of the Lake Kyoga complex and its implication for management. Issue 1, volume 1. Page 47.
- Wetzel, R. G. , and G. E. Likens. 2000. Composition and biomass of phytoplankton. Pages 147174 Limnological Analyses. Springer New York.
- Müller, R. and Wiedemann, O. Die Bestimmung des Nitrations im Wasser. Vom Wasser 1955, 22, 247–271. [Google Scholar]
- Krom, M.D. Spectrophotometric determination of ammonia: a study of modified Bertholet reaction using salycilate and dichlorisocyanurate. The Analyst 1982, 105, 305–316. [Google Scholar] [CrossRef]
- ISO-10260 (1992). Water quality - Measurement of biochemical parameters - Spectrometric determination of the chlorophyll-a concentration. The International Organization for Standardization, Geneva, Switzerland, pp. 6.
- Utermöhl, H. (1958). Zur Vervollkommnung der quantitativen Phytoplankton methodik.Mitt.Internat.Verein.Limnol. 2, 1-38.
- Canter-Lund, H and Lund, J. WG. (1995). Freshwater algae: Their microscopic world explored. 360pp.
- John, D. M. , Whitton, B. A. and Brook, A. J. (2002). The freshwater algal flora of the British Isles: an identification guide to freshwater and terrestrial algae. Cambridge University Press, Edinburgh, UK.
- Komarek, J. and Anagnostidis, K. (1999). Cyanoprokaryota, 1. TeilChroococcales. Jena: Gustav Fischer. pp 225-236.
- Hillebrand, H. , Durselen, C.-D., Kirschtel, D., Pollingher, U. & Zohary, T. Biovolume calculation for pelagic and benthic microalgae. J. Phycol. 1999, 35, 403–424. [Google Scholar]
- Sébastien, L. , Josse, J., and Husson, F. FactoMineR: An R Package for Multivariate Analysis. Journal of Statistical Software, 2008, 25, 1–18. [Google Scholar]
- Oksanan, J. , Kindt, R., Legendre, P., O’Hara, B., Henry, M., Stevens, H. (2007). The vegan Package. http://cran.r-project.org/, http://r-forge.r-project.org/projects/vegan/.
- Ritchie M.E., Phipson B., Wu D., Hu Y., Law C.W., Shi, W., Smyth, G.K. limma powers differential expression analyses for RNA-sequencing and microarray studies. Nucleic Acids Research. 2015, 43, e47. [CrossRef]
- Clarke, K. (1993). Non-Parametric Multivariate Analyses of Changes in Community Structure. Australian Journal of Ecology, 18, 117-143. [CrossRef]
- Ogutu-Ohwayo, R., Kamanyi, J.R., Wandera, S.B., Amiina, R. & Mugume, F. (1997). The fisheries and fish stocks of Lake George: their productivity, exploitation, management and conservation. Jinja, Uganda: National Agricultural Research Organisation, Fisheries Research Institute.
- Mugidde, R. The increase in phytoplankton primary productivity and biomass in Lake Victoria (Uganda). Verh. Internat. Verein. Limnol. 1993, 25, 846–849. [Google Scholar] [CrossRef]
- Olokotum, M. , Humbert, J-F., Quiblier, C., Okello, W., Semyalo, R., Troussellier, M., Marie, B., Baumann, K., Kurmayer, R., and Bernard, C. Characterization of Potential Threats from Cyanobacterial Toxins in Lake Victoria Embayments and during Water Treatment. Toxins 2022, 14, 1–23. [Google Scholar] [CrossRef] [PubMed]
- Okello, W., Ostermaier, V., Portmann, C., Gademann, K., and Kurmayer, R. Spatial isolation favours the divergence in microcystin net production by Microcystis in Ugandan freshwater lakes. 2010, 44, 2803–2814.
Disclaimer/Publisher’s Note: The statements, opinions and data contained in all publications are solely those of the individual author(s) and contributor(s) and not of MDPI and/or the editor(s). MDPI and/or the editor(s) disclaim responsibility for any injury to people or property resulting from any ideas, methods, instructions or products referred to in the content. |
© 2025 by the authors. Licensee MDPI, Basel, Switzerland. This article is an open access article distributed under the terms and conditions of the Creative Commons Attribution (CC BY) license (http://creativecommons.org/licenses/by/4.0/).
Copyright: This open access article is published under a Creative Commons CC BY 4.0 license, which permit the free download, distribution, and reuse, provided that the author and preprint are cited in any reuse.


