Submitted:
03 June 2025
Posted:
05 June 2025
You are already at the latest version
Abstract
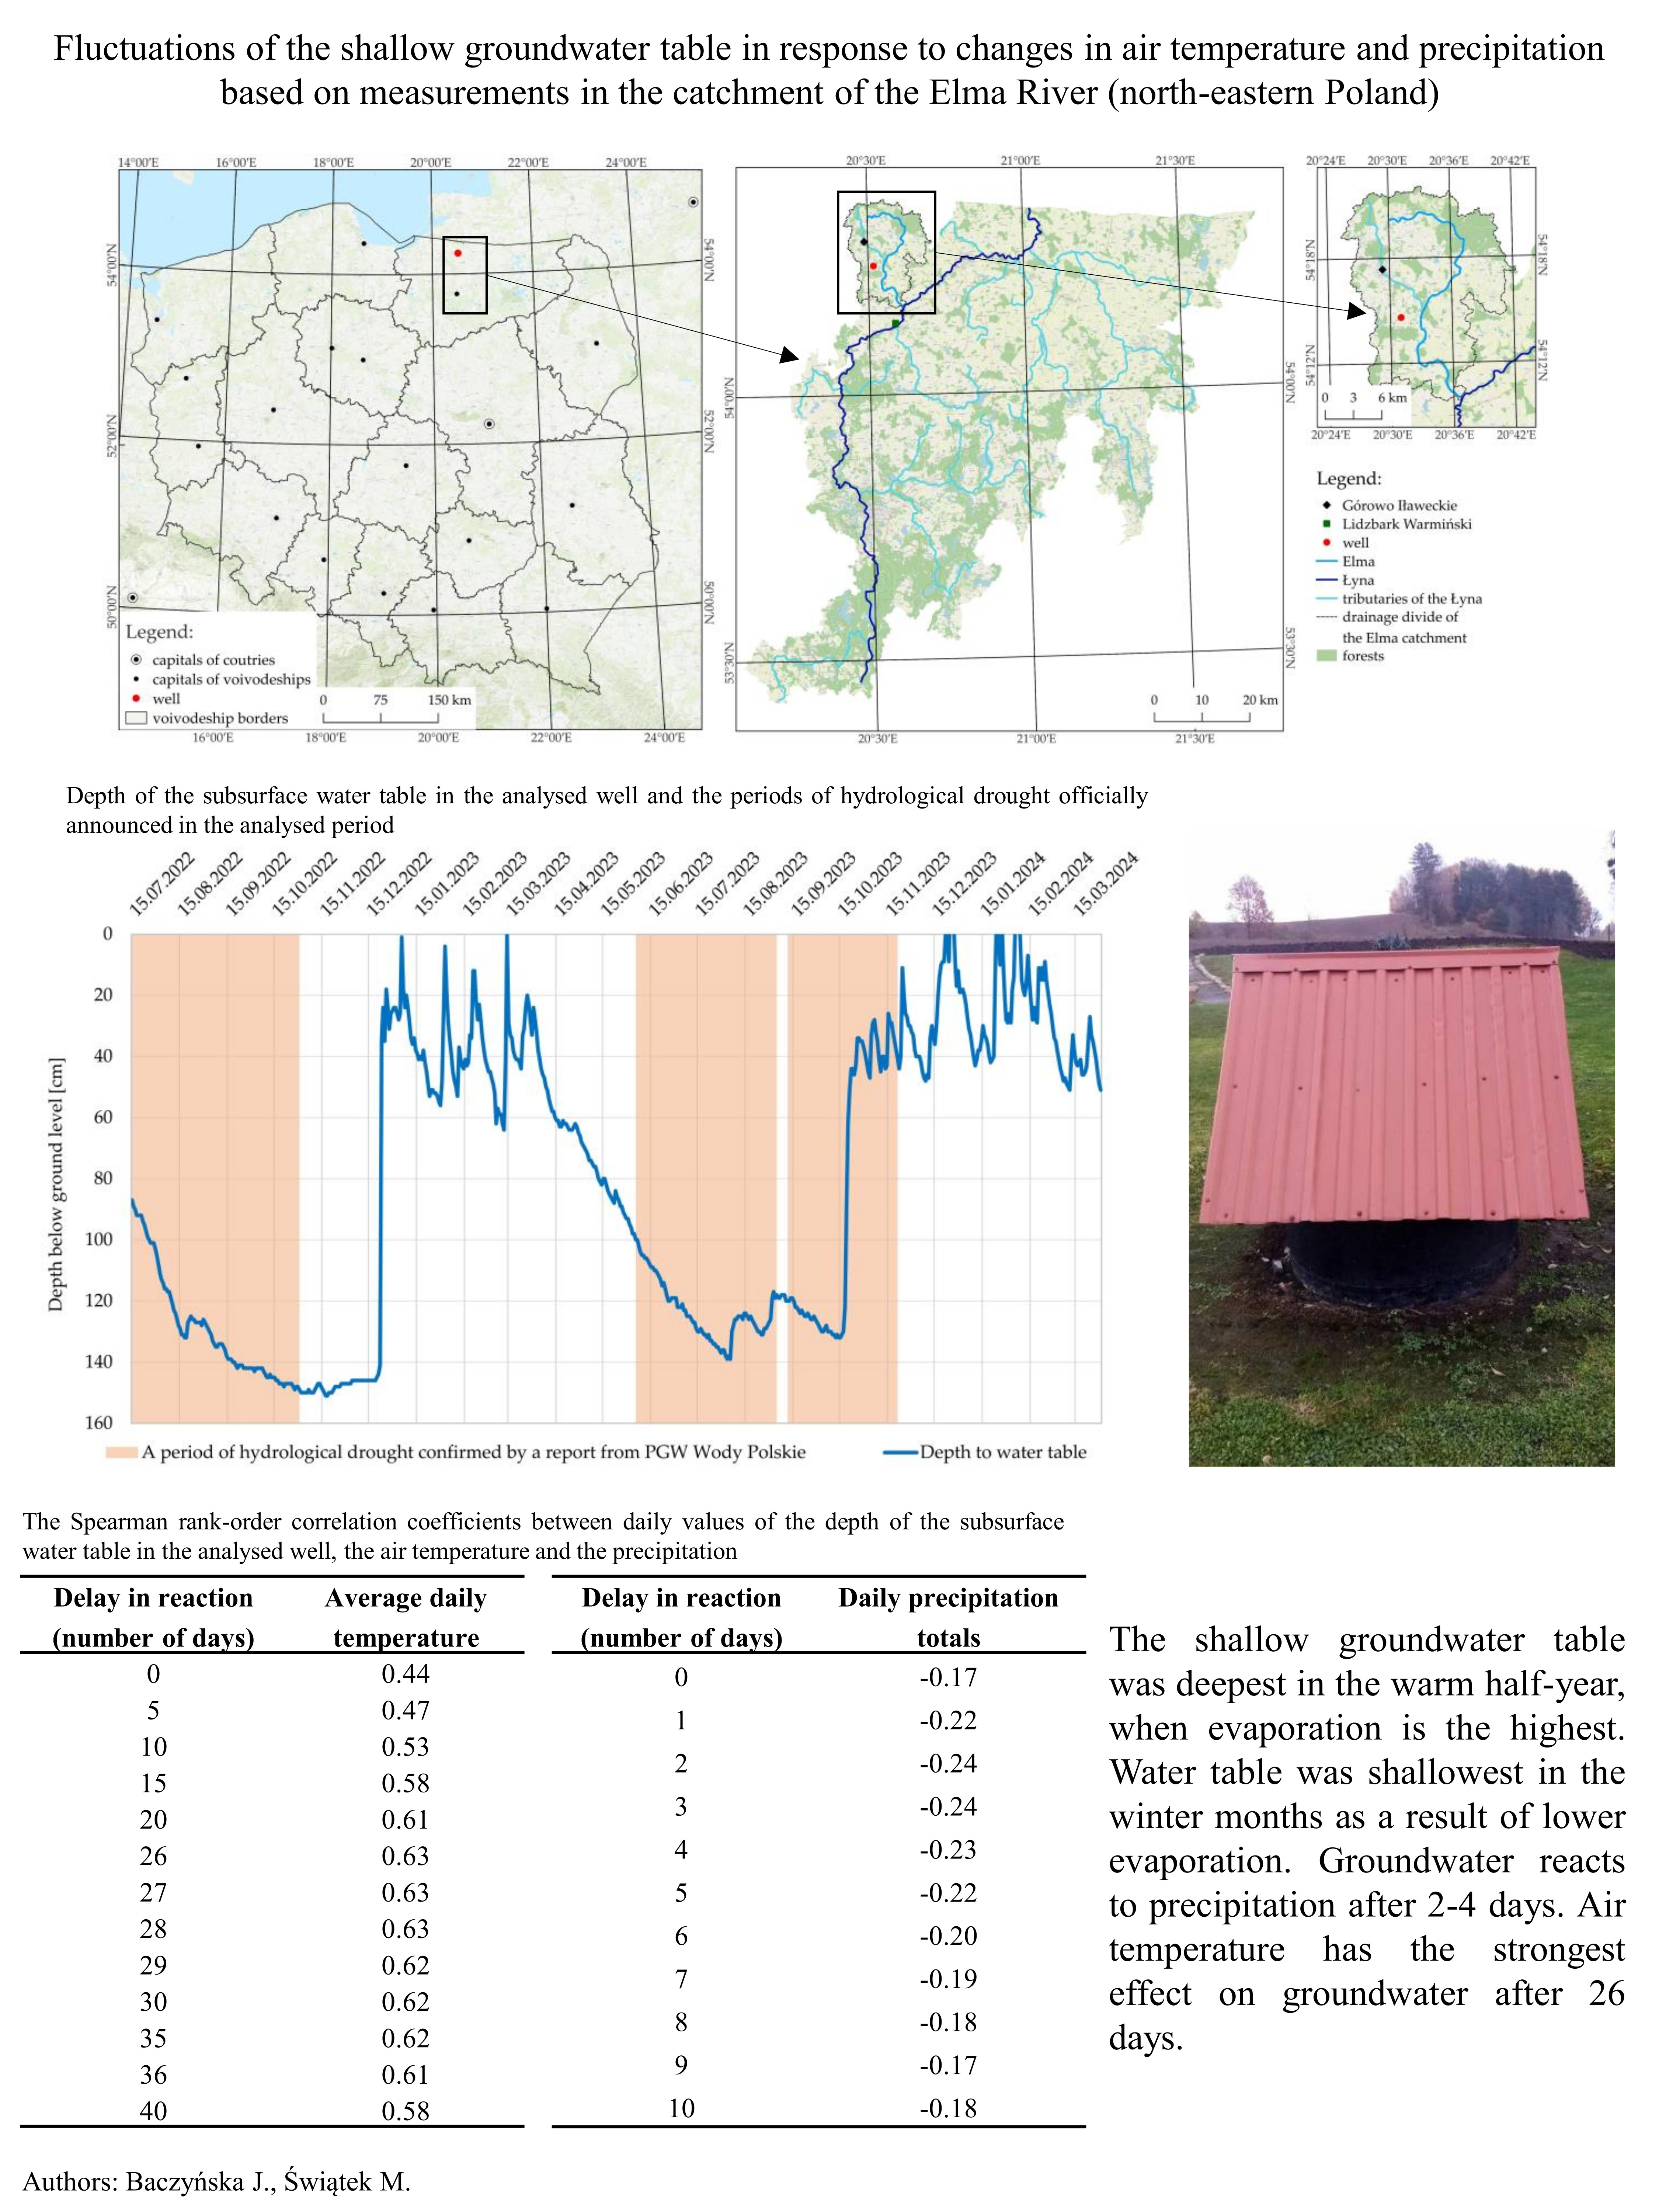
This paper provides an analysis of the seasonal fluctuations in the depth of the sub-surface water table that are determined by changes in the weather conditions in the catchment of the Elma River, a tributary of the Łyna River, in the Old-Prussian Lowland in north-eastern Poland. The studies were conducted from 15 July 2022 to 31 March 2024. This article presents the correlation between air temperature and precipitation and the fluctuations of the shallow water table. The authors analysed the temporal delays in the depth of the water table in the well where the studies were conducted in reference to the fluctuations in air temperature and precipitation totals. These studies enabled the authors to distinguish periods when the meteorological factors listed above had the strongest influence on the depth of the sub-surface water table as well as the variations in how changes in air temperature and precipitation totals affected water table depth.
Keywords:
hydrogeology
; shallow groundwater
; influence of weather conditio
; Staropruska Lowland
1. Introduction
Groundwaters constitute one of the main sources of fresh water globally. Unfortunately, the consequences of climate changes are noticeable not only on the surface of the Earth, but also below it. Several research projects have been conducted to determine the influence of climate changes on groundwaters. For example, research conducted in Ukraine has confirmed that climate changes resulting in the shift of climate zones towards the north interfere with the cycle of the groundwater regimen, and that air temperature is the main factor that determines periodical changes [1]. Climate changes pose a threat to freshwater resources [2,3]. This was confirmed by research carried out in Poland [4,5,6] and throughout the world e.g., [7,8,9]. The main source of global freshwater resources is atmospheric precipitation. However, the frequency and intensity of rainfall are changing as a result of climate change [10,11]. This, in turn, leads to water deficits in the warmer half-year and water excess in the colder six months in many locations, including Central Europe [7,10]. One may also notice the changes in the distribution of precipitation, as an increase is noted at higher latitudes, while lower latitudes are witnessing a decrease [7,10,12]. Therefore, groundwater deficits have become most severe in dry and semi-dry areas at low latitudes, where the high evaporation caused by constantly increasing air temperatures and the decrease in total precipitation contribute to a depletion of water resources [7,9,10]. Another problem is posed by increasingly frequent droughts that lower the water table [13]. However, climate change is not the only factor that leads to the depletion of groundwater resources. Another important factor is a human activity. The research conducted by Zhang et al. [9] reveal that in areas with a high population density, such as the north of India, eastern Brazil, the Middle East, and the North China Plain, groundwater resources are diminishing rapidly. Groundwaters are also absorbed by plants, mainly during the vegetation season, when most of the water evaporates as a result of global warming [4]. The above considerations are an inspiration to monitor the changes in the volume of groundwater resources (among others, the depth of the water table) on a wider scale, in order to ensure more rational management of these resources.
Research conducted in Poland [4] and in Latvia [14] has confirmed that air temperature and precipitation have the strongest influence on groundwaters. Therefore, the objective of this study is to analyse the seasonal fluctuations in the depth of shallow groundwaters determined by changes in air temperature and precipitation totals. Moreover, the authors analysed the delays in the response of sub-surface waters to the fluctuations in the aforementioned weather elements. This research will help determine the temporal variability in the influence of air temperature and precipitation on the depth of the subsurface groundwater table.
Research on shallow groundwaters is almost non-existent. Most of the groundwater studies discuss deeper aquifers. These research projects were carried out in the Białowieża National Park [4], in the Lodz Voivodeship and in neighboring areas [15], in the Masovian Lowland [16], Lublin Upland [17,18], in Lower Silesia [19], in the catchment of the Różany Strumień Stream in Greater Poland Lake District [20], the Gardno-Łeba Lowland [21], and in the Kashubian Marginal Stream Valley [22]. Similar studies were also conducted in neighbouring countries, including Latvia [14], Lithuania [23], Slovakia [24], and Germany [13]. Some projects involved the whole of Europe [25] or the world [9]. As a result, it is necessary to broaden our knowledge about subsurface waters.
2. Research Area
The well where the studies were conducted is located in the village Zielenica (54º14'36.6"N, 20º31'1.355"E; Figure 1), which is situated in the Górowskie Hills lying in the Polish part of the Old Prussian Plain. It is situated at an altitude of 126 m a.s.l. The area is characterised by hilly, early post-glacial relief [26]. Zielenica is located in a depression formed by the melting of a block of dead ice that was surrounded by moraine ramparts consisting of melted post-glacial sediment [27]. Due to the fact that the area was covered by ice-sheet during the northern Poland glacial period, it consists mostly of glacial sediments, in particular boulder clays cut by glacial channels that are filled with sand and gravel [26].
The permeability of the ground in the area of the well where the measurements are conducted is classified as weak due to the presence of low-permeable rock formations [30]. Exceptions are scarce areas with medium or changeable permeability characteristic of river valleys [30].
The climate in the research area is described as warm moderate, with a summer without a dry season [31]. As a result of the proximity of the sea, the climate is milder than in the east of Poland [32]. The area is characterised by changeable weather [33]. The average long-term air temperature in the research area was approximately 7.8°C [34], lower than the average air temperature in Poland, which is 8.7°C [35]. Additionally, it should be emphasised that, as a result of global warming, air temperatures have been rising [7,10]. The total precipitation in the research area [36] is higher than the national average – approximately 700 mm/year. In the Old Prussian Plain, the winter periods bring heavy snowfall, moderately cold weather, and are often cloudy [26].
The analysed well is located in the catchment of the Elma River (Figure 2), which is a tributary of the Łyna that is, in turn, a part of the basin of the Pregoła River. The Górowskie Hills that form the western part of the Old Prussian Plain are characterised by a dense river network consisting of small watercourses. Lakes form only a small share of the catchment [37], although it contains a large number of relatively small wetland areas that contribute to slightly more efficient water retention [33,38].
In the analysed area, groundwaters are present mainly in Quaternary formations and they are separated by layers of clay, silt, and loam. The table of subsurface waters is shallow and extends to 2 m. In the location of the analysed well, according to a hydrological map [30], the groundwater table is situated at a depth of approx. 1 m.
The Górowskie Hills’ landscape is dominated by arable lands and forests, usually mixed. The region is almost free from industrial and degraded areas, and the development of human settlements has caused only minor changes [40]. The negligible human activity in the area has facilitated the creation of protected areas.
3. Materials and Methods
The depth of the subsurface water table was measured in a utility well situated on private property. The well is 357 cm deep with a diameter of 100 cm. It is covered by a watertight roof that prevents water from penetrating the well during rainfall (Figure 3). The tests were conducted in the well from 15 July 2022 to 31 March 2024. The depth of the water table in the well was measured daily, at 17:00. The measurements were taken with the use of a rope with a weight attached to the end. The depth of the water table was determined based on the length of the rope needed for the weight to contact the water.
The influence of the weather conditions on shallow groundwaters was analysed based on daily averages and the maximum and minimum daily air temperatures as well as daily total precipitation from the period 15 July 2022–31 March 2024, obtained from the public database [41] of the Institute of Meteorology and Water Management – National Research Institute (IMGW-PIB) Data on the air temperature were obtained from the weather station situated in Lidzbark Warmiński, whereas the precipitation totals amounts and data on the type of precipitation were obtained from Górowo Iławeckie (Figure 2). Other information used in the analysis included data on hydrological droughts [42], published by the State Water Holding – Polish Water (PGW Wody Polskie).
The authors of this article analysed the daily values of air temperature, total precipitation, and the depth of the water table with the use of selected classical and positional measures presented in form of box plots. Additionally, a graphic comparison of the average monthly air temperatures and the monthly precipitation totals in the analysed period (1 July 2022–31 March 2024) is given with the long-term averages in the last normal period (1991–2020). The authors also present the depths of the water table in the well on individual days (15 July 2022–31 March 2024) in the context of the periods of hydrological drought in the catchment of the Łyna River announced by PGW Wody Polskie.
Then, the distribution of probability of the occurrence of specific values for all the analysed variables was compared to the normal distribution via the Shapiro-Wilk test. This led to the rejection of the zero hypothesis on the normal distribution of such variables as the depth of the subsurface water table, the average, maximum, and minimum air temperatures, minimum temperatures at ground level, and the total precipitation from the daily data collected in the period from 15 July 2022 to 31 March 2024. Therefore, the correlation between weather elements and the depth of the shallow groundwater table was analysed via the non-parametric Spearman rank-order correlation coefficient. The strength of the correlation is determined based on the value of the coefficient, with possible absolute values from 0 to 1, in the following way:
- 0-0.2 – very weak correlation;
- 0.2-0.4 – weak correlation;
- 0.4-0.6 – moderate correlation;
- 0.6-0.8 – strong correlation;
- 0.8-1 – very strong correlation [43].
In order to determine the delay in the reaction of groundwaters to air temperatures and precipitation totals, the correlation coefficients between the depth of the subsurface groundwater table and the daily values of air temperature and precipitation totals were calculated for the preceding day and then for two, three, etc, days before. The days when the value of the correlation coefficient was the highest were those when the influence of the analysed weather elements on the subsurface waters was the strongest (for example, the average temperature of the 1st of July had the strongest impact on the depth of the water surface on July 26-28 days, which was confirmed by the highest Spearman rank-order correlation coefficient with a delay of so many days).
4. Results
The analysis of the daily air temperatures revealed strong variability. The amplitude between the largest and smallest median of the average daily air temperature was 11.6°C. The vast majority of air temperatures were above zero. On over 75% days in the period from 15 July 2022 to 31 March 2024 the average and maximum air temperatures remained above 0°C (Figure 4). The highest maximum daily air temperature in the analysed period was 34.6°C and the lowest minimum daily temperature at ground level was -23.0°C (Figure 4).
In the analysed period, most days were without precipitation. However, single days with very intensive rainfall did occur, which raised the arithmetic average precipitation higher than the median (Figure 5). The highest total daily precipitation in the analysed period was 46.5 mm (Figure 5) on the 5 August 2023. In 14 months of the analysed period a total of 35 days with a precipitation totals ≥10 mm (strong rainfall) were noted. The graeter numbers of intense rainfall events were noted in July 2022 and August 2023 (4 days in each month). Although the number of days with strong rainfall was the same, the total rainfall in July was lower, as the total amount of strong rainfall in this month amounted to 64.4 mm, while in August it was significantly higher: 111.5 mm. The longest dry period in the analysed area lasted for 25 days, from the 20 May 2023 to the 13 June 2023.
The analysed period (15 July 2022–31 March 2024) was relatively warm and humid. It was dominated by months when the average values exceeding the long-term averages, in particular in summer and winter. The largest difference between the monthly average and the long-term average air temperature was noted in February 2024, when the monthly average was 5.5°C higher than the long-term average (Figure 6). The precipitation totals in the analysed period varied depending on the season. In certain seasons, such as the autumn of 2022 and the spring (April and May) of 2023, precipitation was very low, but there were also seasons when the total precipitation significantly exceeded the long-term average. These were the winter of 2022/2023, the autumn of 2023 (apart from September), and the winter of 2023/2024 (Figure 6).
The average depth of the subsurface water table in the analysed period was 83 cm (Figure 7). For 75% of the analysed days the depth of the water table ranged from 38 cm to 129 cm, which is proven by the bottom and top quartiles (Figure 7). The largest depth noted in the analysed period was 151 cm. On 11 days (10 of which occurred in the winter of 2023/2024), groundwaters were present on the surface. This happened usually after massive snow thaw.
The fluctuations in the depth of shallow groundwaters show a noticeable seasonal variability. In the winter season, the water table of subsurface waters is shallower than in summer. This is why, in both winters in the analysed period, a rapid increase of the water table towards the surface was noted. The most rapid decrease in the depth of the groundwater table was noted on the 22–24 December 2022, when the water table rose by 117 cm within two days. In the spring, the groundwater level gradually decreased, until the maximum depths of both warm seasons were reached when hydrological droughts were officially declared in the Łyna catchment. The lowest levels of water in the well were noted on the 17–18 November 2022 (151 cm) and on the 5 August 2023 (139 cm). As a result of precipitation deficits in the second half of 2022 and high air temperatures in the summer of 2023 (Figure 6), the median depth of the groundwater level in these periods significantly exceeded 1 m. Although the dates of the officially announced periods of hydrological drought were generally the same as the periods of the lowest water table levels in the analysed well, the official announcements on hydrological droughts did not always match the local conditions. One example may be the official announced period of drought from the 11 September 2023 to the 21 November 2023. During that time, the level of the water table rose dramatically, by 88 cm in a week, ultimately reaching a depth of 26 cm below ground surface, i.e. 83 cm above the average depth of the subsurface water table. One should also note the differences in the rate at which the water table of shallow groundwaters fell during the analysed period. In the second half of 2022, the level of the groundwater table dropped at a faster rate than in 2023. As a result, the maximum depth of the water table was lower in 2022 than in 2023 (Figure 8). Nevertheless, in the middle of the year (15.07) the water table was lower (130 cm) in 2023 than in 2022 (87 cm), as a result of low total precipitation amounts in May and July 2023.
The drop in the shallow groundwater table was particularly noticeable in the months when the monthly air temperature exceeded the long-term average. In warm months, intense evaporation resulted in a systematic drop in the water table – for example, in August 2022 (Figure 8), when the air temperatures exceeded the average long-term levels by 2.7°C (Figure 6). On the other hand, when the average temperatures exceeded the long-term average in the cold season, the lowering of the water table was interrupted by rapid increases towards the surface as a result of intensive rainfall or rapid snow melt – for example, in January 2023 (Figure 6; Figure 8). The influence of precipitation was the strongest in the cold half-year, due to lower evaporation than in the warm season. In the months when the total monthly precipitation was lower than the long-term average, the subsurface water table decreased noticeably. These were often months when the water table was relatively deep. In warm months, the influence of precipitation was negligible. The water table rose by approx. 5-9 cm only in situations when intensive (≥10 mm per day) or long-lasting rainfall occurred (Figure 8). In the cold months, the influence of precipitation on groundwaters was stronger. As a result of long-lasting rainfall, the water level rose and even reached the ground level (Figure 8).
Long dry periods interrupted by torrential rain, which are characteristic manifestations of climate change, had a very disadvantageous effect on groundwaters. As a result of a long (2 April 2023–13 June 2023) period with hardly any rainfall, interrupted only by single rainy days, the depth of the groundwater level continued to increase, and short rainfall events caused only a slight, short term increase in the level of the water table, followed by yet another significant decrease (Figure 8). An example of such a situation is the period from 24–25 April 2023, when 11 mm of rain fell within 2 days. After 2 days, the water table rose by 2 cm and then started to fall again. On the other hand, in the cold half-year, the water level rose more efficiently after rainfall, for example on the 11-13 March 2024, when, after the rainfall events of the 11th and 12th of March (15.4 mm) the water level in the well rose by 18 cm on the 13th of March. The factor that had a major influence on the groundwaters was the lingering snow cover. Melting snow led to a rapid increase in the shallow groundwater table, which was particularly noticeable in December 2022. In winter, during periods without snow cover, the volume of water in the well decreased significantly (Figure 8).
Analysis of the influence of air temperature on the shallow groundwater table revealed that it is not immediate, but is apparent after some time (Table 1). The value of the R correlation coefficients also confirms the differences in the reaction time of the groundwaters to changes in the average, maximum, and minimum daily air temperature, and in the minimum temperature at ground level. A moderate correlation (0.4<R<0.7) between these temperatures and the level of the water table was noted. Groundwaters react the fastest, after only 26 days, to the increase or decrease in the average air temperature and air temperature at ground level (Table 1). The minimum daily temperature had the strongest influence on the depth of the water table in the well after 27 days, while the effect of the maximum daily temperature was felt as late as 33 days following the observation of specific temperatures (Table 1).
The longest steady influence on groundwaters was noted for the minimum daily temperature, which had the strongest influence for 7 days, and the shortest influence was found for maximum daily temperature, for which the values of the correlation coefficient were the highest for 3 days. The analysis ended on the 42nd day after the occurrence of a specific air temperature, as the correlation coefficient decreased rapidly during subsequent days, which proved that the correlation between the analysed variables faded over time.
As far as the influence of precipitation on the depth of the subsurface water table is concerned, the values of the correlation coefficient pointed to a weak correlation. This is resulted from the irregularity and high variability of precipitation over time, which affects the correlation results. This is why the correlation coefficient should not be considered to reflect the strength of correlation with absolute accuracy. Nevertheless, it was noted that the precipitation influenced the groundwaters significantly faster than air temperatures. The values of the correlation coefficient demonstrated that precipitation had the strongest influence on the water level in the well after 2–3 days (Table 2). The analysis of the coefficient of correlation between the depth of the groundwater table and precipitation ended after 42 days as the correlation between the analysed variables weakened during subsequent days.
5. Discussion
The research conducted in the catchment of the Elma River confirmed that subsurface waters, which are the shallowest groundwaters, are extremely sensitive to the weather conditions in their location [44]. Analysis revealed that subsurface waters are characterised by a noticeable seasonal variability of the level of the water table, with high levels in the winter months and low levels in the warm months. This was also confirmed by studies of the groundwaters in deeper aquifers, conducted by other authors [4,18,21,22]. The analyses carried out in lowland rivers catchments [16] and in peat areas [23] showed that the lowest levels of groundwaters were noted in autumn, when the water resources in the catchments are exhausted, although this was not the rule in the analysed well. In the autumn of 2022, as a result of low precipitation in the second half of the year, the subsurface water table was relatively deep, but in the autumn of 2023, long-lasting rainfall resulted in a relatively shallow level. In the analysed area, the level of the subsurface water table was the highest in winter and early spring, due to the relatively low depth of the water table and quick supply of water by snowmelt and rainfall waters. On the other hand, research conducted in Poland [16] and in Lithuanian peat bogs [23] revealed that the level of the subsurface water table was the highest only in the middle of spring, as the water resources are supplemented by precipitation in winter and snowmelt, which has, however, not been confirmed for subsurface waters.
The fluctuations in the groundwater level in the spring and summer seasons are shaped, among others, by air temperature, which fosters intensive evaporation. Even if rainfall events occur, the water often does not reach the groundwater level as a result of evapotranspiration [14,20]. In the analysed well, such phenomena occurred relatively often, sometimes leading to an increase in the water level by only 1–2 cm. After that, the water table continued to decrease. In dry and hot periods, the level of shallow groundwaters decreases significantly, as it was noted in the analysed well, or they may even disappear completely [45]. Another factor that influences the lowering of the groundwater table in the warm months is vegetation, which intensifies in the spring and the summer. Plants absorb water from the soil, thus contributing to the decrease in the groundwater volume [4,14].
The research conducted in the utility well revealed that groundwaters strongly react to precipitation, particularly in the winter season, as a result of lower evaporation. This was also confirmed by studies conducted in Poland [18] and in Latvia [14]. The influence of precipitation on groundwaters is particularly noticeable for daily values and is characterised by a short increase of the water table [21]. This may also be noticed in the fluctuations of the water table of subsurface groundwaters in the analysed well. The amplitude of the fluctuations in the groundwater level and their delay depends on the depth at which the analysed aquifer is located and on the type of rocks that form the aeration and saturation layers in the given area. Waters that are closest to the ground level react to precipitation the fastest, which was confirmed, among others, by research projects conducted in the Masovian Lowland [16], on the border of Western Roztocze and the Lublin Upland [18], and in Latvia [14]. In low-permeable rocks, such as clay, silt, and loam (in which the analysed well is also located), groundwaters usually react to precipitation after 2–3 days. This was confirmed by studies by Polish and Latvian authors [14,15]. In the winter season, precipitation that accumulates in the form of a snow cover has a significant influence on the volume of subsurface water resources in the early spring, which was also demonstrated in this study. As far as deeper situated groundwaters are concerned, the strongest influence of the snow cover does not become apparent until the warm half-year [17].
The analysis of the values of temperature in Lidzbark Warmiński clearly revealed that the average monthly air temperatures significantly increased, in particular in the winter season. These temperatures have a significant influence on groundwaters, which was confirmed by research conducted in Poland and in Lithuania [4,46,47]. Europe is witnessing a noticeable decrease in groundwater resources [9,25] manifested, among others, in droughts that have occurred in the 21st century [9]. Short periods with lingering snow cover and earlier snowmelt lead to more depleted groundwater resources in spring and summer [16,46]. Meteorological and hydrological droughts that result from the increasing global air temperatures lead to a lowering of the groundwater table as a result of reduced water supply to aquifers caused by evaporation and long dry periods [19,48]. This is also noticeable in the analysed well. In the periods when hydrological droughts were officially announced, the water table was usually situated at relatively larger depths. This was also confirmed by studies conducted in Slovakia, where groundwaters are used for municipal purposes [24]. As far as subsurface waters are concerned, low water levels may be supplemented relatively quickly as a result of supply in the spring [19].
6. Summary and Conclusions
- The depth of the subsurface water table varied during the year. In warm months, the water table was deeper than in cold months ones. This was caused, first of all, by the intensive evaporation of water from the land surface. In the cold season, the water table was relatively high, then falling gradually with increases in the air temperature.
- Air temperature had a significant influence on the depth of the groundwater level. It determined, first of all, the intensity of water evaporation from the soil, which affects the water resources. This was noticeable in the warm seasons of the analysed period, when, as a result of high air temperature values, the groundwater table was situated at greater depths, even in spite of relatively high precipitation totals.
- The influence of precipitation was the most significant in the cold half-year, when the intensity of evaporation decreased. During those periods, precipitation can effectively supplement groundwater resources, which is proven by the relatively high level of the water table in the well in the winter and its noticeable rise after rainfall or rapid snowmelts. An example may be December 2022, when the subsurface water table rose by 117 cm in two days as a result of rapid snowmelt, and October 2023 when, after long rainfall, the subsurface water table increased by 88 cm within one week.
- In the warm season, however, only long-lasting rainfall could effectively supplement the subsurface water resources. Short, torrential rains had only a slight influence on groundwaters. This is proven by the event of 5 August 2024 when, in spite of intensive rainfall (46 mm in a day), the groundwater table increased by 14 cm and then started to drop again after a week.
- Air temperature had the strongest influence on shallow groundwaters after 26–35 days, and precipitation – after 2–3 days.
Author Contributions
Conceptualization, Joanna Baczyńska; methodology, Joanna Baczyńska and Małgorzata Świątek; software, Joanna Baczyńska; validation, Joanna Baczyńska and Małgorzata Świątek; formal analysis, Joanna Baczyńska; investigation, Joanna Baczyńska; resources, Joanna Baczyńska and Małgorzata Świątek; data curation, Joanna Baczyńska and Małgorzata Świątek; writing—original draft preparation, Joanna Baczyńska; writing—review and editing, Małgorzata Świątek; visualization, Joanna Baczyńska; supervision, Małgorzata Świątek; funding acquisition, Małgorzata Świątek. All authors have read and agreed to the published version of the manuscript.
Funding
This research was co-financed by the Polish Minister of Science under the "Regional Excellence Initiative" Program for 2024-2027 (RID/SP/0045/2024/01).
Data Availability Statement
The data presented is this study are openly available in a publicly accessible repository, RepOD, at https://doi.org/10.18150/DKUQMF. Other data used in the work are available on the website: https://danepubliczne.imgw.pl/data/dane_pomiarowo_obserwacyjne/.
Acknowledgments
The authors of the article would like to thank the employees of IMGW-PIB for preparing and providing access to source data and two anonymous reviews for their help in improving the quality of the manuscript.
Conflicts of Interest
The authors declare no conflicts of interest.
References
- Shevchenko, O.; Skorbun, A.; Osadchyi, V.; Osadcha, N.; Grebin, V.; Osypov, V. Cyclicities in the Regime of Groundwater and of Meteorological Factors in the Basin of the Southern Bug River. Water, 2022, 14, 2228. [CrossRef]
- Malinowska, M. Symptoms of climate change in Poland. In Geography for socjety, Kordel, Z., Josan, I., Wiskulski, T., Eds.; Editura Universitӑţii din Oradea: Oradea, Romania, 2015; pp. 94-112.
- Ustrnul, Z.; Wypych, A.; Czekierda, D. Air temperature change. In Climate change in Poland: past, present, future, Falarz, M., Eds.; Springer International Publishing: Cham, Switzerland, 2021; pp. 349-373. [CrossRef]
- Pierzgalski, E.; Boczoń, A.; Tyszka, J. Variability of precipitation and groundwater levels in Białowieża National Park. Kosmos 2002, 51(4), 415-425 (in Polish).
- Świątek, M.; Walczakiewicz, S. Changes in specific runoff in river catchments of Western Pomerania versus climate change. Geographia Polonica 2022, 95, 25-52. [CrossRef]
- Świątek, M. Changes in specific discharge in the lowland part of Poland in the years 1961–2021. Acta Geographica Lodziensia 2024, 115, 125-140 (in Polish). [CrossRef]
- 7. 6th IPCC. Summary for Policymakers. In: Climate Change 2021: The Physical Science Basis. Contribution of Working Group I to the Sixth Assessment Report of the Intergovernmental Panel on Climate Change, Masson-Delmotte, V.; Zhai, P.; Pirani, A.; Connors, S.L.; Péan, C.; Berger, S.; Caud, N.; Chen, Y.; Goldfarb, L.; Gomis, M.I.; Huang, M.; Leitzell, K.; Lonnoy, E.; Matthews, J.B.R.; Maycock, T.K.; Waterfield, T.; Yelekçi, O.; Yu, R.; Zhou, B., Eds.; Cambridge University Press: Cambridge, United Kingdom and New York, NY, USA, 2023a; pp. 3−32. [CrossRef]
- Döll, P. Vulnerability to the impact of climate change on renewable groundwater resources: a global-scale assessment. Environmental Research Letters 2009, 4(3), 035006. [CrossRef]
- Zhang, J.; Liesch, T.; Goldscheider, N. Impacts of climate change and human activities on global groundwater storage from 2003-2022. Research Square 2024. [CrossRef]
- 6th IPCC. Climate information relevant for Water Resources Management. Retrieved from https://www.ipcc.ch/report/ar6/wg1/downloads/factsheets/IPCC_AR6_WGI_Sectoral_Fact_Sheet_Water_Resources_Management.pdf (1 February 2025).
- Małecki, Z.J.; Gołębiak, P. Water resources of Poland and the world. Zeszyty Naukowe – Inżynieria Lądowa i Wodna w Kształtowaniu Środowiska 2012, 7, 50-56 (in Polish).
- Alfieri, L.; Burek, P.; Feyen, L.; Forzieri, G. Global warming increases the frequency of river floods in Europe. Hydrol. Earth Syst. Sci. 2015, 19, 2247–2260. [CrossRef]
- Ebeling, P.; Musolff, A.; Kumar, R.; Hartmann, A.; Fleckenstein, J.H. Groundwater head responses to droughts across Germany. EGUsphere Preprint repository 2024. [CrossRef]
- Vitola, I.; Vircavs, V.; Abramenko, K.; Lauva, D.; Veinbergs, A. Precipitation and Air Temperature Impact on Seasonal Variations of Groundwater Levels. Environmental and Climate Technologies 2012, 10, 25-33. [CrossRef]
- Tomalski P. Dynamics of shallow groundwater resources in the Łódź Voivodeship and neighboring areas. Acta Geographica Lodziensia 2011, 97/2011, 1-102 (in Polish).
- Kaznowska, E.; Wasilewicz, M.; Hejduk, L.; Krajewski, A.; Hejduk, A. The Groundwater Resources in the Mazovian Lowland in Central Poland during the Dry Decade of 2011-2020. Water 2024, 16(2), 201. [CrossRef]
- Dobek, M. The reaction of groundwater levels to the rainfall in the years 1961–1981 in selected areas of the Lublin Upland. Annales Universitatis Mariae Curie-Skłodowska. Sectio E. Agricultira 2007. 62(1), 49-55 (in Polish).
- Chabudziński, Ł.; Michalczyk, Z. Dynamics of the groundwater levels in the border zone of Western Roztocze and the Lublin Upland in 2014. Przegląd Geologiczny 2015, 63, 639-644 (in Polish).
- Staśko, S.; Tarka, R.; Buczyński, S. Extreme weather events and their effect on the groundwater level. Examples from Lower Silesia. Przegląd Geologiczny 2017, 65, 1244-1248 (in Polish).
- Czuchaj, A.; Wolny, F.; Marciniak, M. Response of surface and groundwater to precipitation in the Różany Strumień catchment. Badania Fizjograficzne. Seria A. Geografia Fizyczna 2019, 10(70), 7-19 (in Polish). [CrossRef]
- Chlost, I. Remarks on the regime of groundwater level fluctuations of the first aquifer in the Gardeńsko-Łebska Lowland in the hydrological year 2003. Słupskie Prace Geograficzne 2005, 2, 161-170 (in Polish).
- Lidzbarski, M. The changes of groundwater level in the Cashubian ice-marginal valley aquifer (northen Poland). Przegląd Geologiczny 2002, 50(8), 717-722 (in Polish).
- Kažys, J.; Rimkus, E.; Taminskas, J.; Butkutė, S. Hydrothermal effect on groundwater level fluctuations: case studies of Čepkeliai and Rėkyva peatbogs, Lithuania. Geologija Geografija 2015, 1(3), 116-129.
- Fendeková, M. Groundwater Drought Occurrence in Slovakia. In Water Resources in Slovakia: Part II - Climate Change, Drought and Floods, Negm, A.M.; Zeleňáková, M., Eds.; The Handbook of Environmental Chemistry; Springer: Dordrecht, Netherlands, 2019; pp. 91–104. [CrossRef]
- Söller, L.; Luetkemeier, R.; Müller Schmied, H.; Döll, P. Groundwater stress in Europe – assessing incertainties in future groundwater discharge alterations due to water abstractions and climate change. Frontiers in Water 2024 6, 1448625. [CrossRef]
- Borzyszkowski, J.; Grzegorczyk, I. Staropruska Lowland (841.5). In Regional Physical Geography of Poland, Richling, A., Solon, J., Macias, A., Balon, J., Borzyszkowski, J., Kistowski, M., Eds.; Bogucki Wyd. Naukowe: Poznań, Poland, 2021; pp. 539-544 (in Polish).
- Giemza, A. Detailed geological map of Poland – sheet 63 – Wojciechy. Map N-34-66-A, 1:50 000. Centralna Baza Danych Geologicznych – Państwowy Instytut Geologiczny 2009 (in Polish).
- Landscape map of Poland. Główny Urząd Geodezji i Kartografii (in Polish). Available online: https://mapy.geoportal.gov.pl/imap/Imgp_2.html?SRS=2180&resources=map:wms@ https://mapy.geoportal.gov.pl/wss/service/img/guest/Krajobrazowa/MapServer/WMSServer (20 January 2025).
- Topographic map of the world. Esri. Available online: https://www.arcgis.com/index.html (02 February 2025).
- Hydrological map of Poland. Główny Urząd Geodezji i Kartografii (in Polish). Available online: https://mapy.geoportal.gov.pl/imap/Imgp_2.html?SRS=2180&resources=map: wms@https://mapy.geoportal.gov.pl/wss/service/img/guest/HYDRO/MapServer/WMSServer (20 January 2025).
- Sohoulande, C.D.D. Vegetation and water resource variability within the Köppen-Geiger global climate classifcation scheme: a probabilistic interpretation. Theoretical and Applied Climatology 2024, 155, 1081–1092. [CrossRef]
- Stopa-Boryczka, M.; Boryczka, J. Climate of the Northeastern Poland according to macroregions and mesoregions of J. Kondracki and J. Ostrowski, with consideration of experimental studies of the local climate. In Atlas of interdependencies between meteorological and geographical parameters in Poland, Stopa-Boryczka, M., Boryczka, J., Wawer, J., Grabowska, K., Dobrowolska, M., Osowiec, M., Błażek, E., Skrzypczuk, J., Grzęda, M., Eds.; (pp. 43-153). Wydział Geografii i Studiów Regionalnych UW: Warszawa, Poland, 2013 (in Polish).
- Małek J. Caddisflies (Trichoptera) of the Górowo Heights. Uniwersytet Warmińsko-Mazurski: Olsztyn, Poland, 2001 (in Polish).
- Climate maps of Poland. Instytut Meteorologii i Gospodarki Wodnej – Państwowy Instytut Badawczy (in Polish). Available online: https://klimat.imgw.pl/pl/climate-maps/#Mean_Temperature/Yearly/1991-2020/1/Winter (15 February 2025).
- Climate of Poland 2023. Instytut Meteorologii i Gospodarki Wodnej – Państwowy Instytut Badawczy (in Polish). Available online: https://archiwum.imgw.pl/sites/default/ files/inline-files/imgw-pib_klimat_polski_2023_raport.pdf (23 January 2025).
- Climate maps of Poland. Instytut Meteorologii i Gospodarki Wodnej – Państwowy Instytut Badawczy (in Polish). Available online: https://klimat.imgw.pl/pl/climate-maps/#Precipitation/Yearly/1991-2020/1/null (15 February 2025).
- Sikora, A.; Marchowski, D.; Półtorak, W. Use of beaver ponds by breeding Whooper Swans Cygnus cygnus and Mute Swans C. olor at Górowo Heights (north-eastern Poland). Ornis Polonica 2022, 63, 199–214 (in Polish).
- Zbyryt, A.; Menderski, S.; Niedźwiecki, S.; Kalski, R.; Zub, K. White Stork Ciconia ciconia breeding population in Warmińska Refuge (Natura 2000 Special Protection Area). Ornis Polonica 2014, 55, 240-256 (in Polish).
- Basic world map. OpenStreetMap contributors. Available online: https://www.openstreetmap.org (03 Februry 2025).
- Annex to resolution No. LVII/416/2023 of the Górowo Iławeckie Municipal Council, environmental protection program for the Górowo Iławeckie Municipality until 2030. Biuro Doradcze Ekoinferna (in Polish). Available online: https://gorowoil-ug.bip-wm.pl/public/getFile?id=380242 (6 February 2025).
- Public Data. Instytut Meteorologii i Gospodarki Wodnej – Państwowy Instytut Badawczy (in Polish). Available online: https://danepubliczne.imgw.pl/data/dane_pomiarowo_ obserwacyjne/dane_meteorologiczne/dobowe/ (13 May 2024).
- Archived hydrological situation reports. Państwowe Gospodarstwo Wodne Wody Polskie (in Polish). Available online: https://www.wody.gov.pl/sytuacja-hydrologiczno-nawigacyjna/114-nieprzypisany/991-archiwalne-komunikaty-o-sytuacji-hydrologicznej (19 May 2024).
- Tatarczak, A. Statistics. Handbook. Case studies. Innovatio Press Wydawnictwo Naukowe Wyższej Szkoły Ekonomii i Innowacji: Lublin, Poland, 2021; Volume 9 (in Polish).
- Bajkiewicz-Grabowska, E. General hydrology. Wydawnictwo Naukowe PWN SA: Warszawa, Poland, 2020 (in Polish).
- Jokiel, P.; Marszelewski, W.; Pociask-Karteczka, J. Hydrology of Poland. Wydawnictwo Naukowe PWN SA: Warszawa, Poland, 2011(in Polish).
- Somorowska, U. Assessing the Impact of Climate Change on Snowfall Conditions in Poland Based on the Snow Fraction Sensitivity Index. Resources 2024, 13, 60. [CrossRef]
- Kilkus, K.; Štaras, A.; Rimkus, E.; Valiuškevičius, G. Changes in Water Balance Structure of Lithuanian Rivers under Different Climate Change Scenarios. Environmental Research, Engineering and Management 2006, 2(36), 3-10.
- Kubicz, J.; Kajewski, I.; Kajewska-Szkudlarek, J.; Dąbek, P.B. Groundwater recharge assessment in dry years. Environmental Earth Sciences 2019, 78, 1-9. [CrossRef]
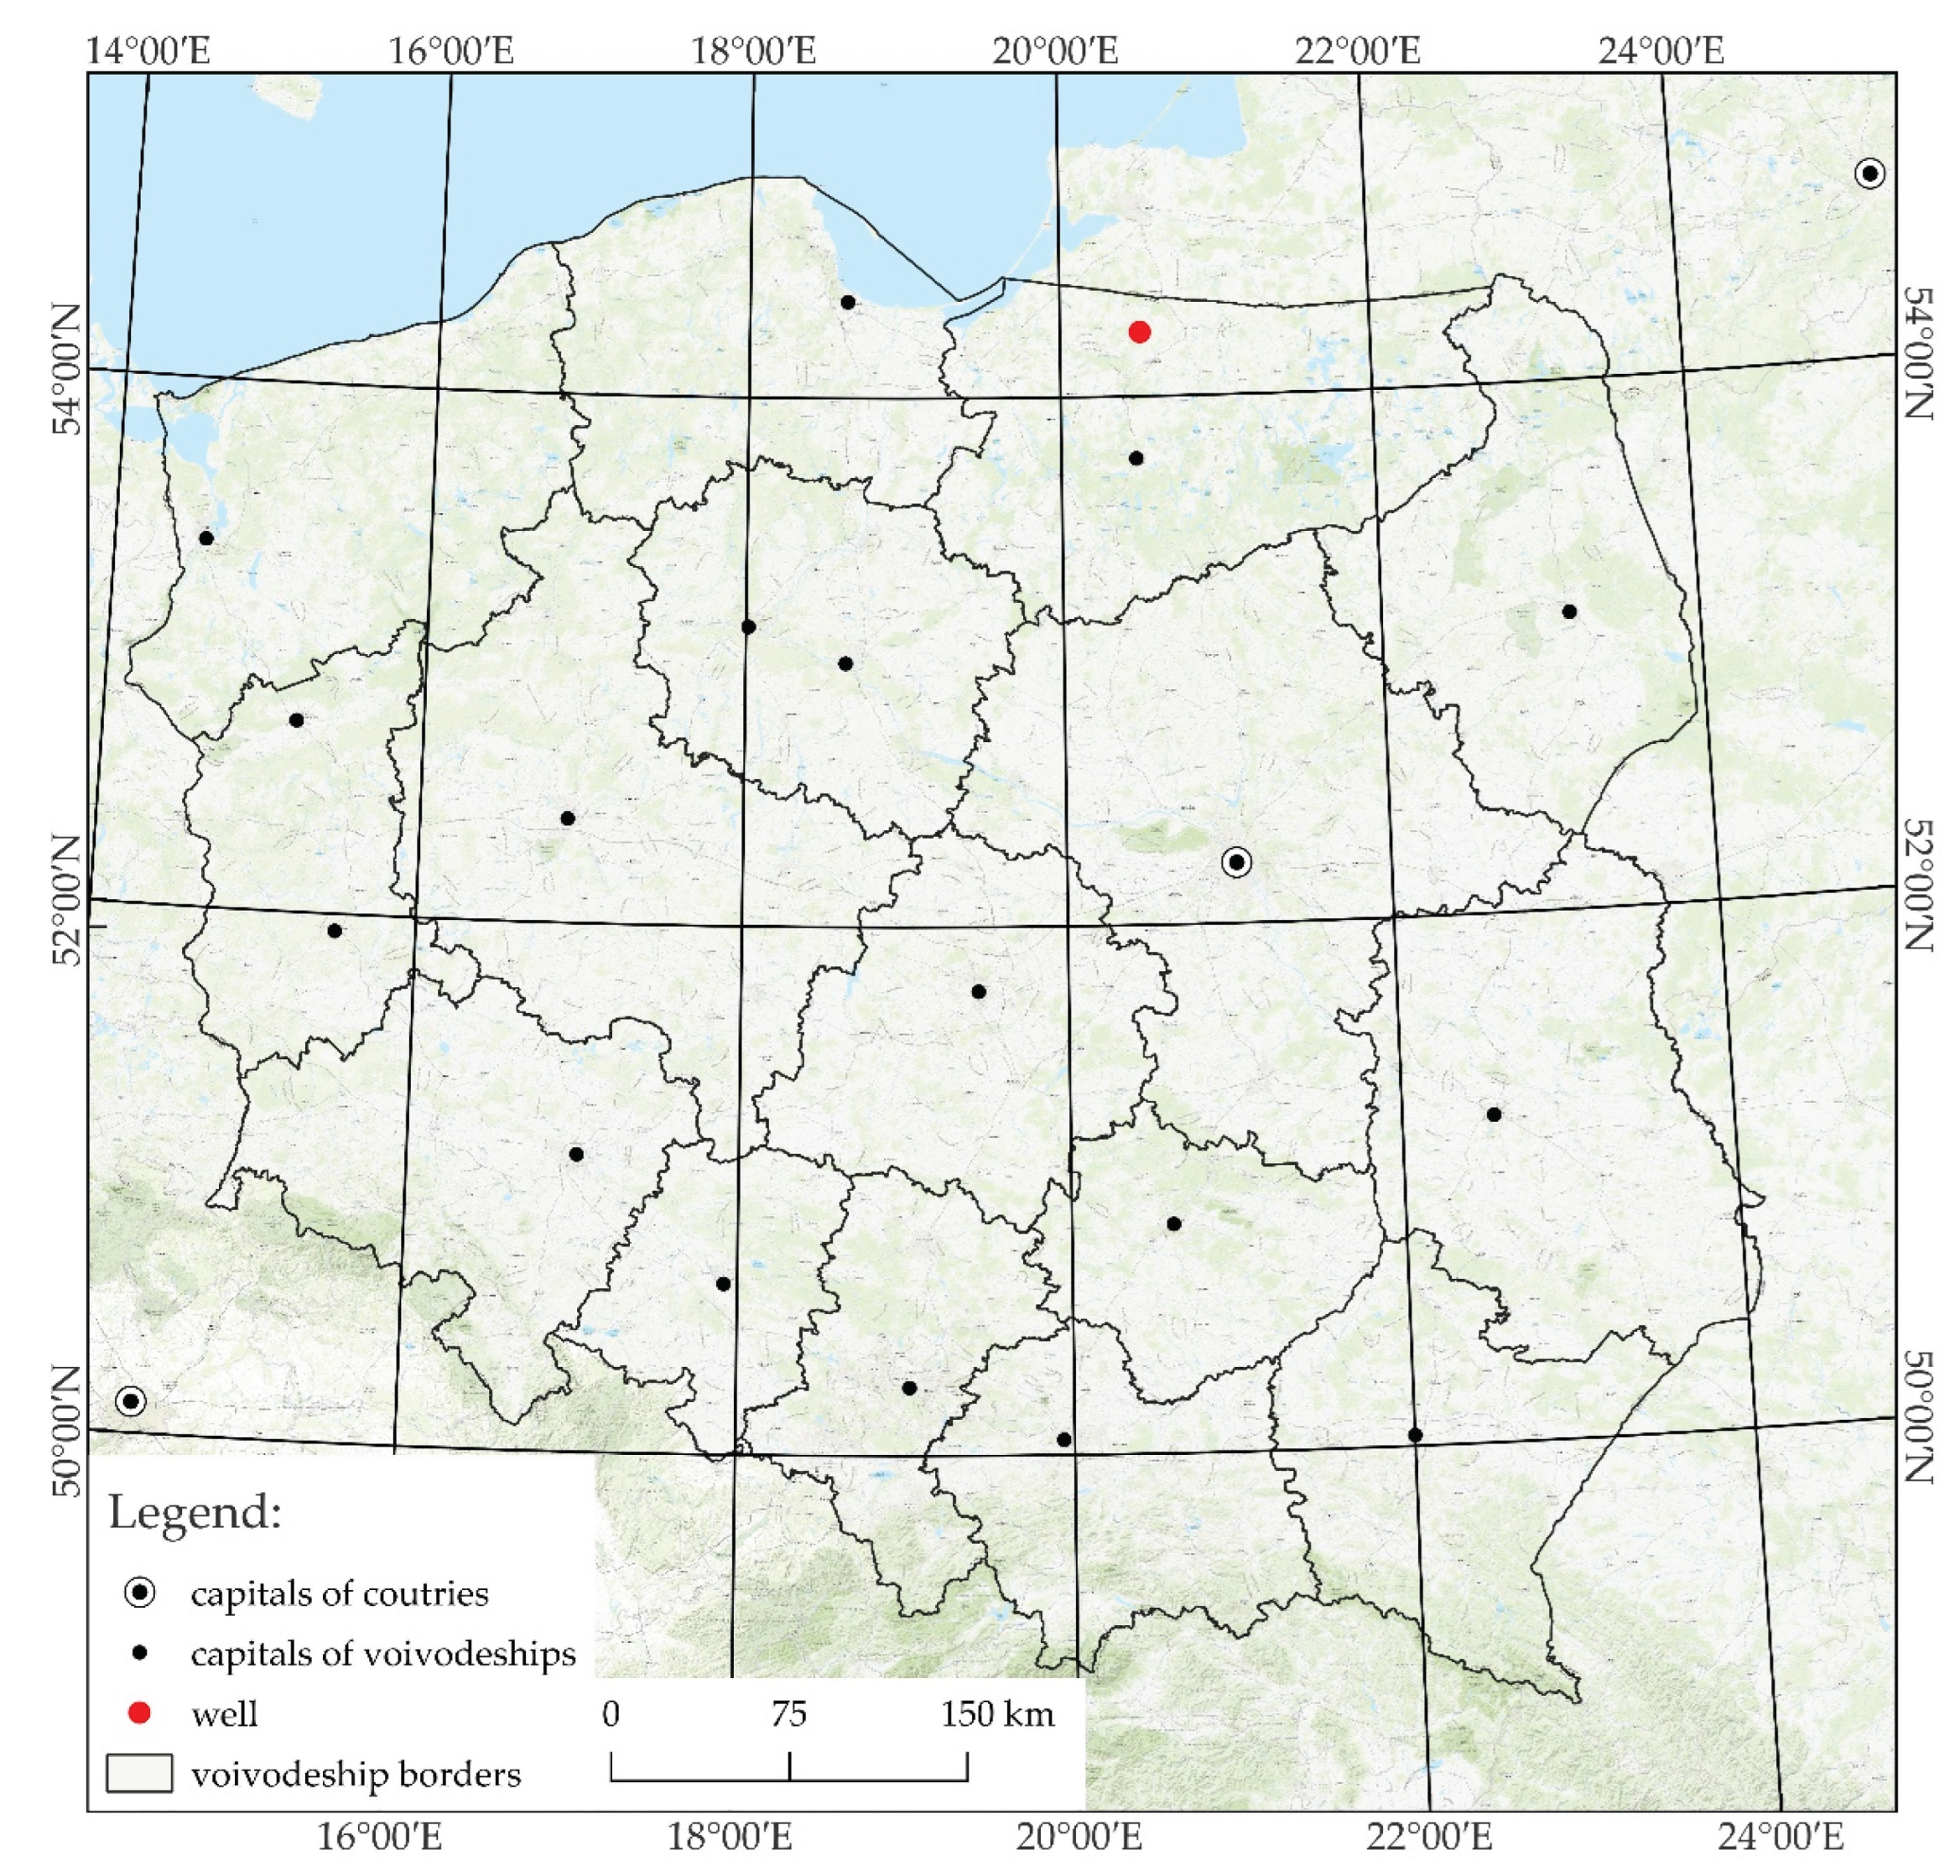
Figure 2.
(a) catchment of the Łyna within the borders of Poland with marked data acquisition sites; (b) catchment of the Elma. Source: Adapted from Geoportal (2025) [28] and OpenStreetMap contributors (2025) [39].
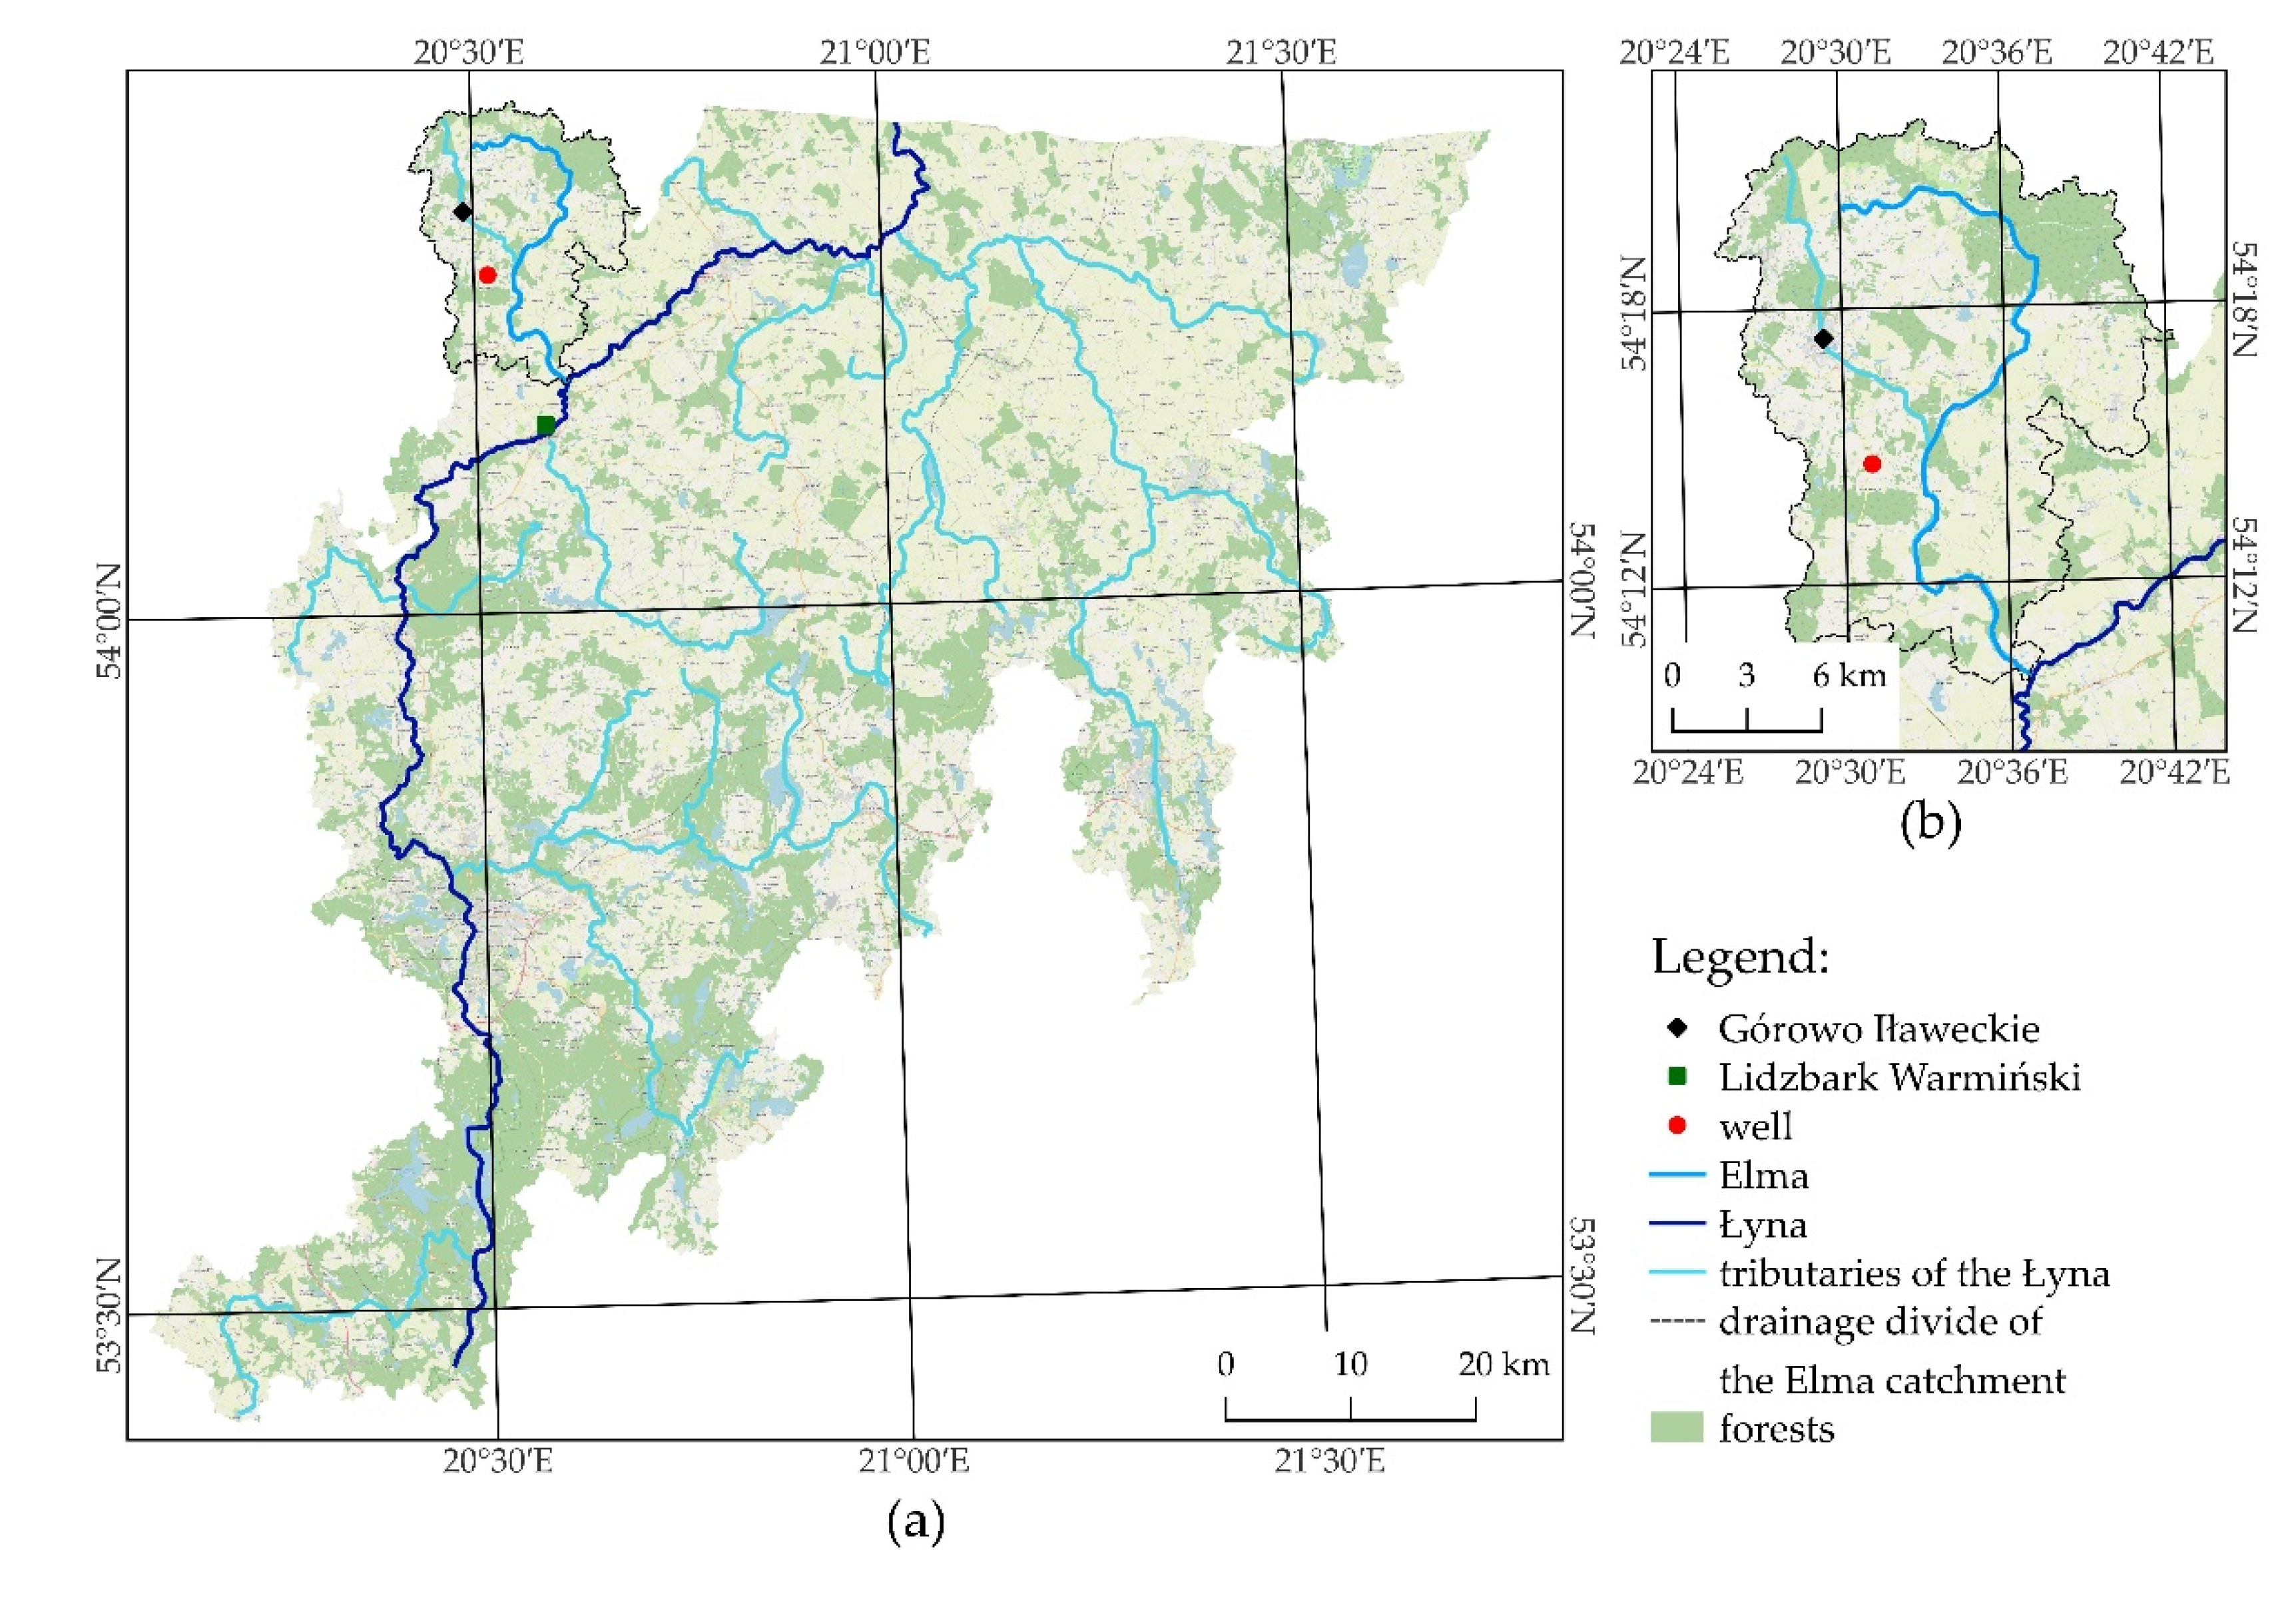
Figure 3.
A drawing of the analysed well.
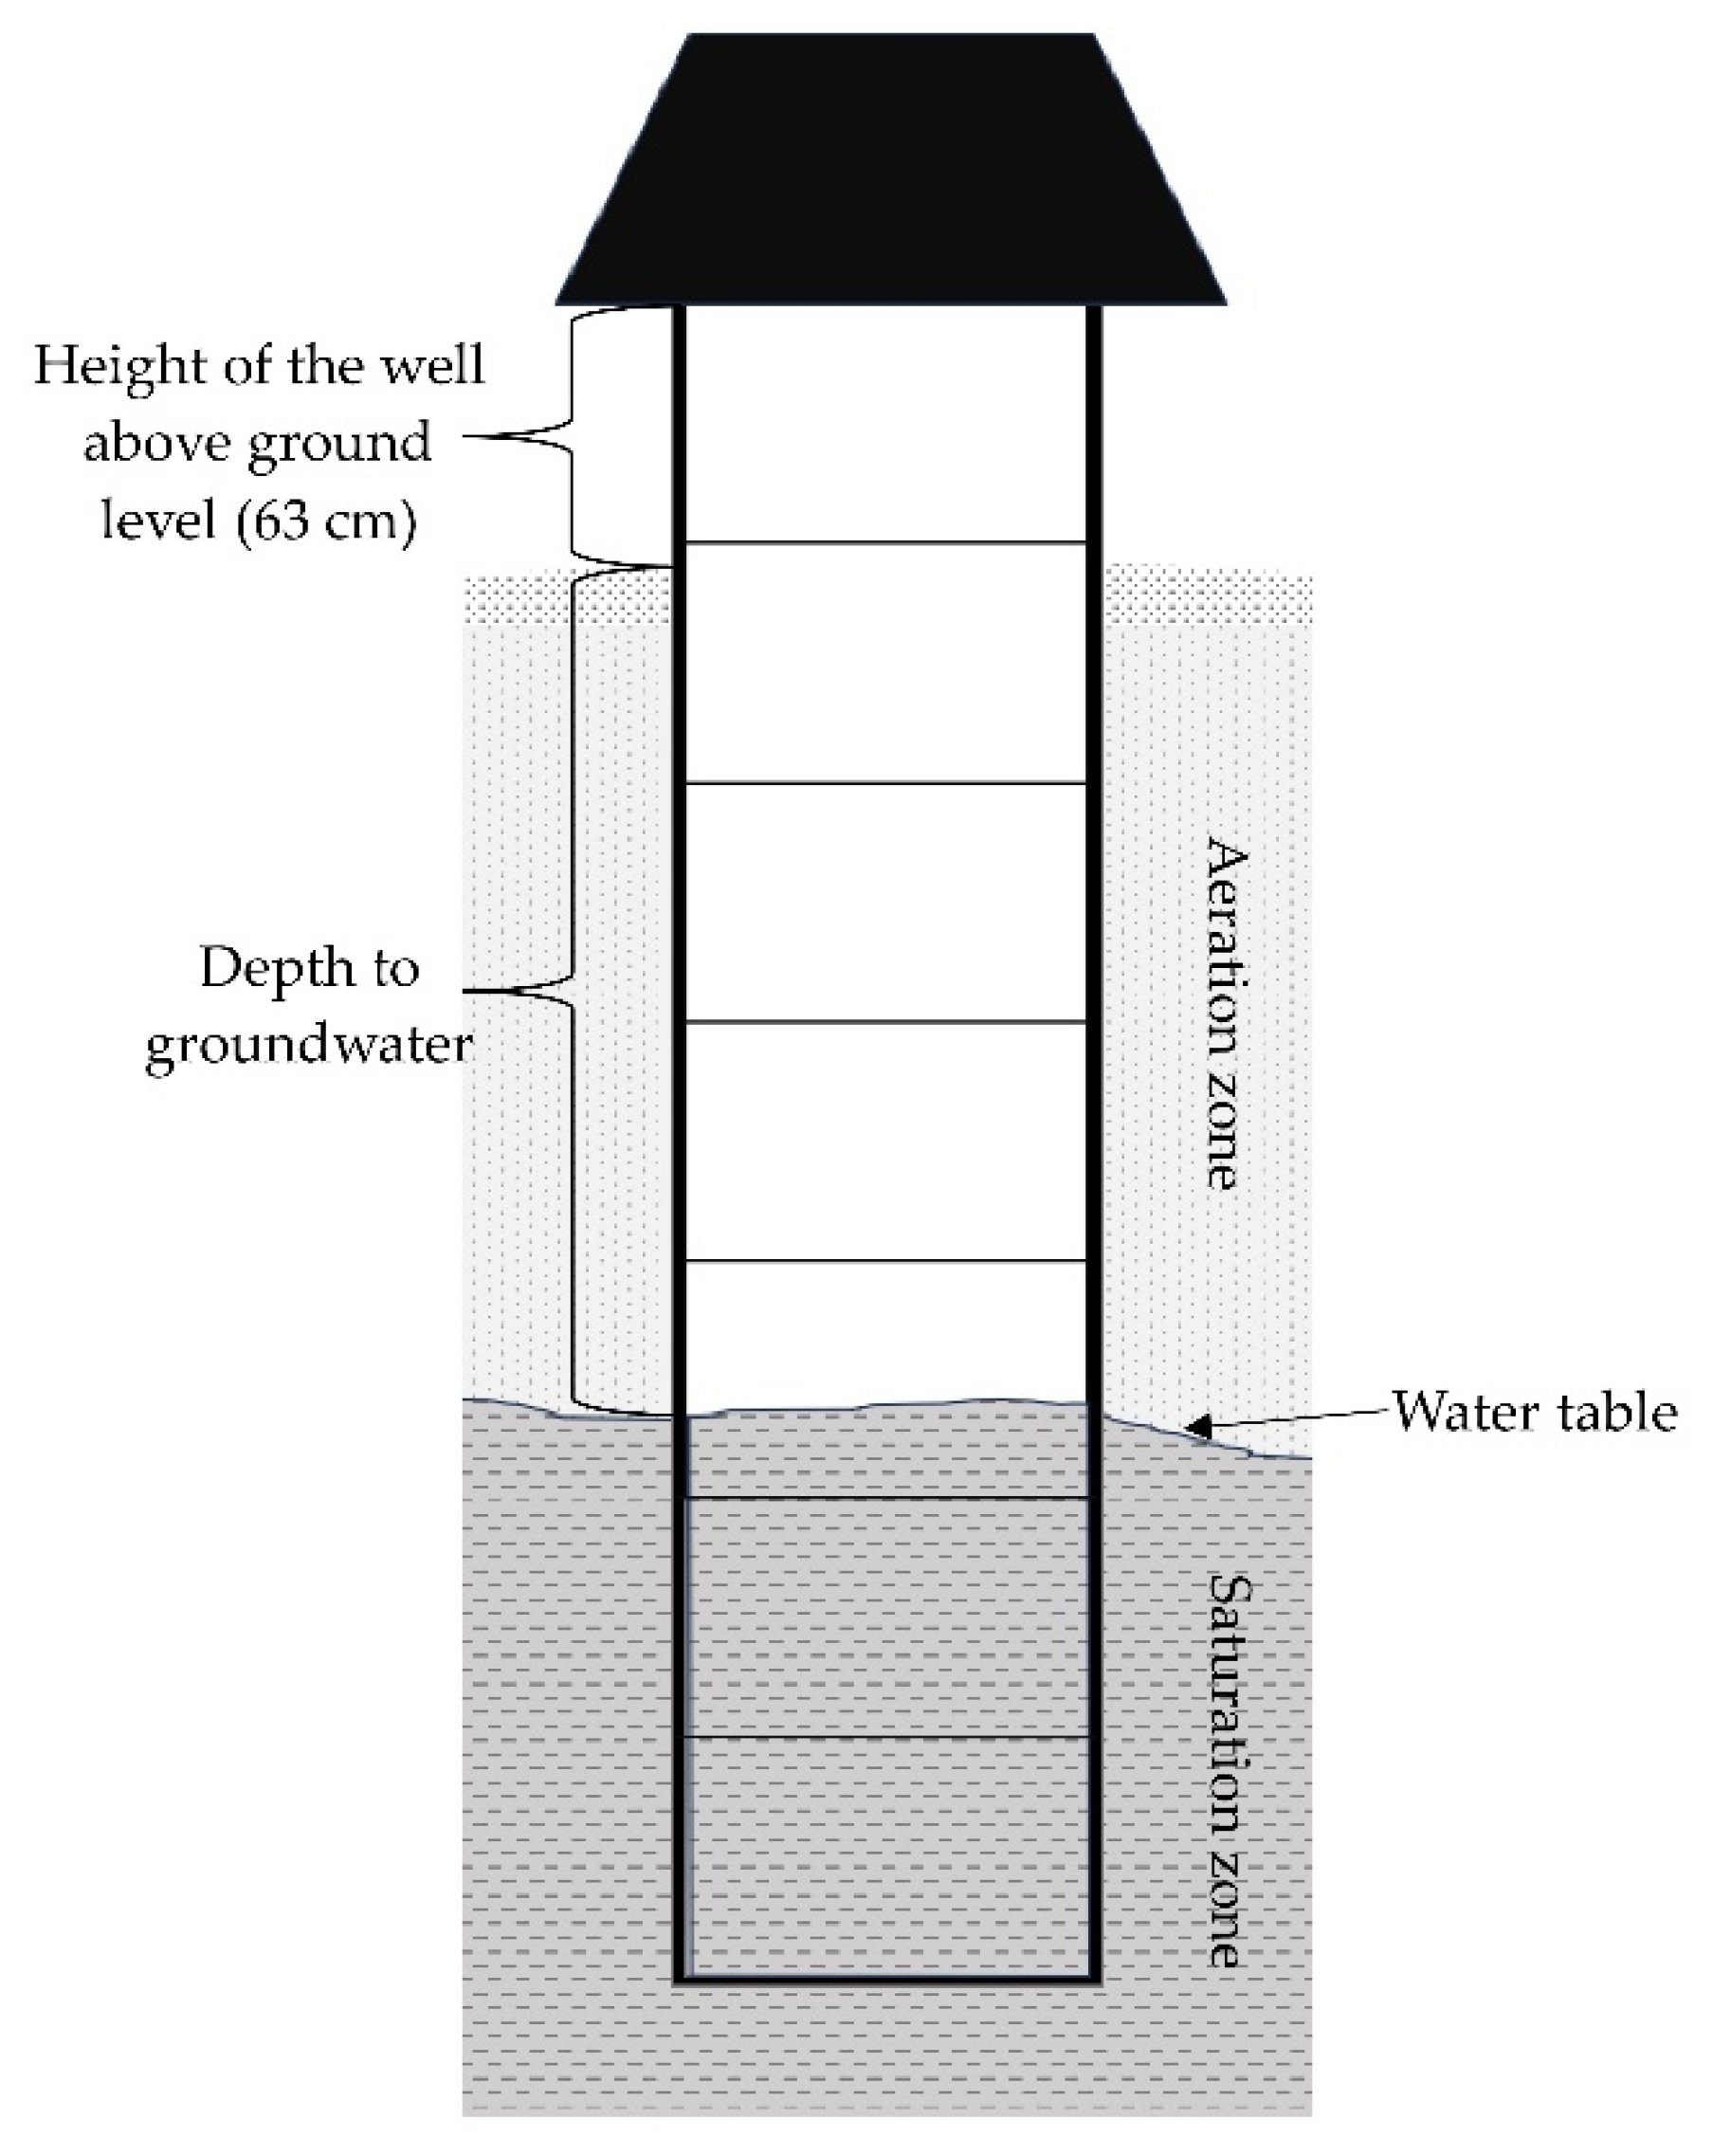
Figure 4.
Selective characteristics describing the daily air temperatures in Lidzbark Warmiński (15 July 2022–31 March 2024): Ta – average daily air temperature, Tmax – maximum daily air temperature, Tmin – minimum daily air temperature, Tgr – minimum daily air temperature at ground level. Source: Own work based on Institute of Meteorology and Water Management – National Research Institute (IMGW-PIB) data.
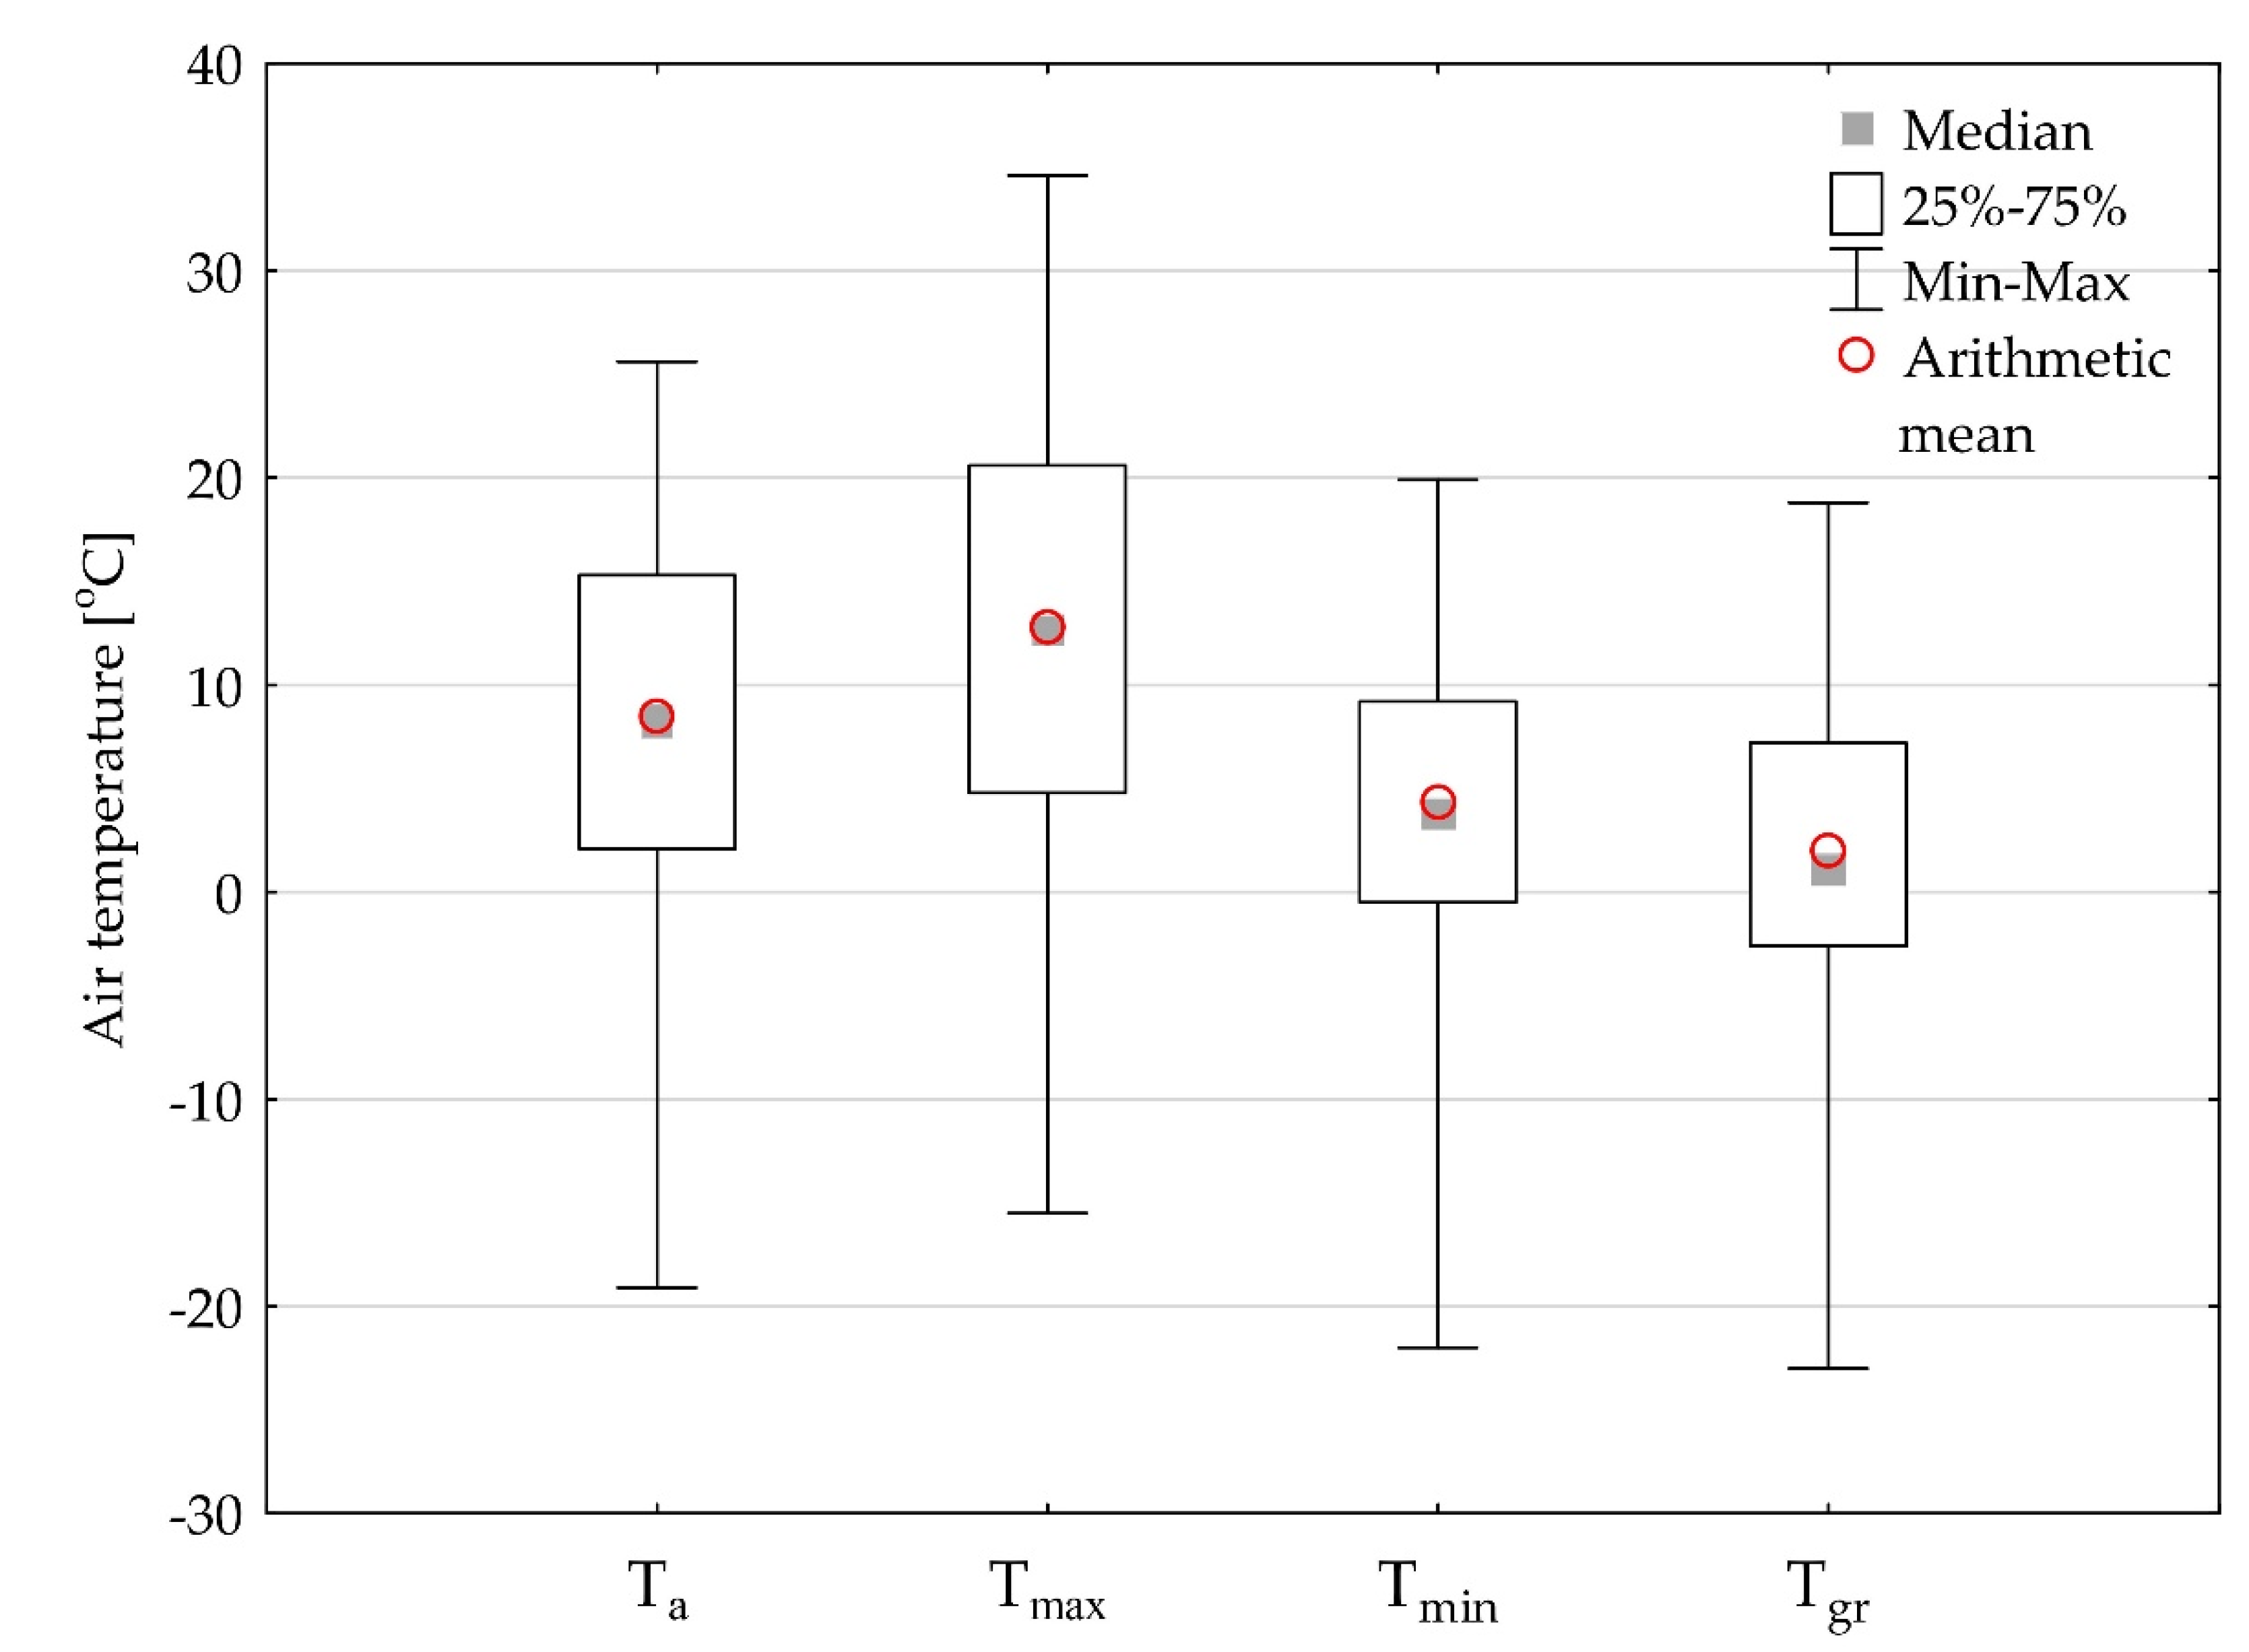
Figure 5.
Selected characteristics describing the total daily precipitation in Górowo Iławeckie (15 July 2022–31 March 2024). Source: Own work based on IMGW-PIB data.
Figure 5.
Selected characteristics describing the total daily precipitation in Górowo Iławeckie (15 July 2022–31 March 2024). Source: Own work based on IMGW-PIB data.
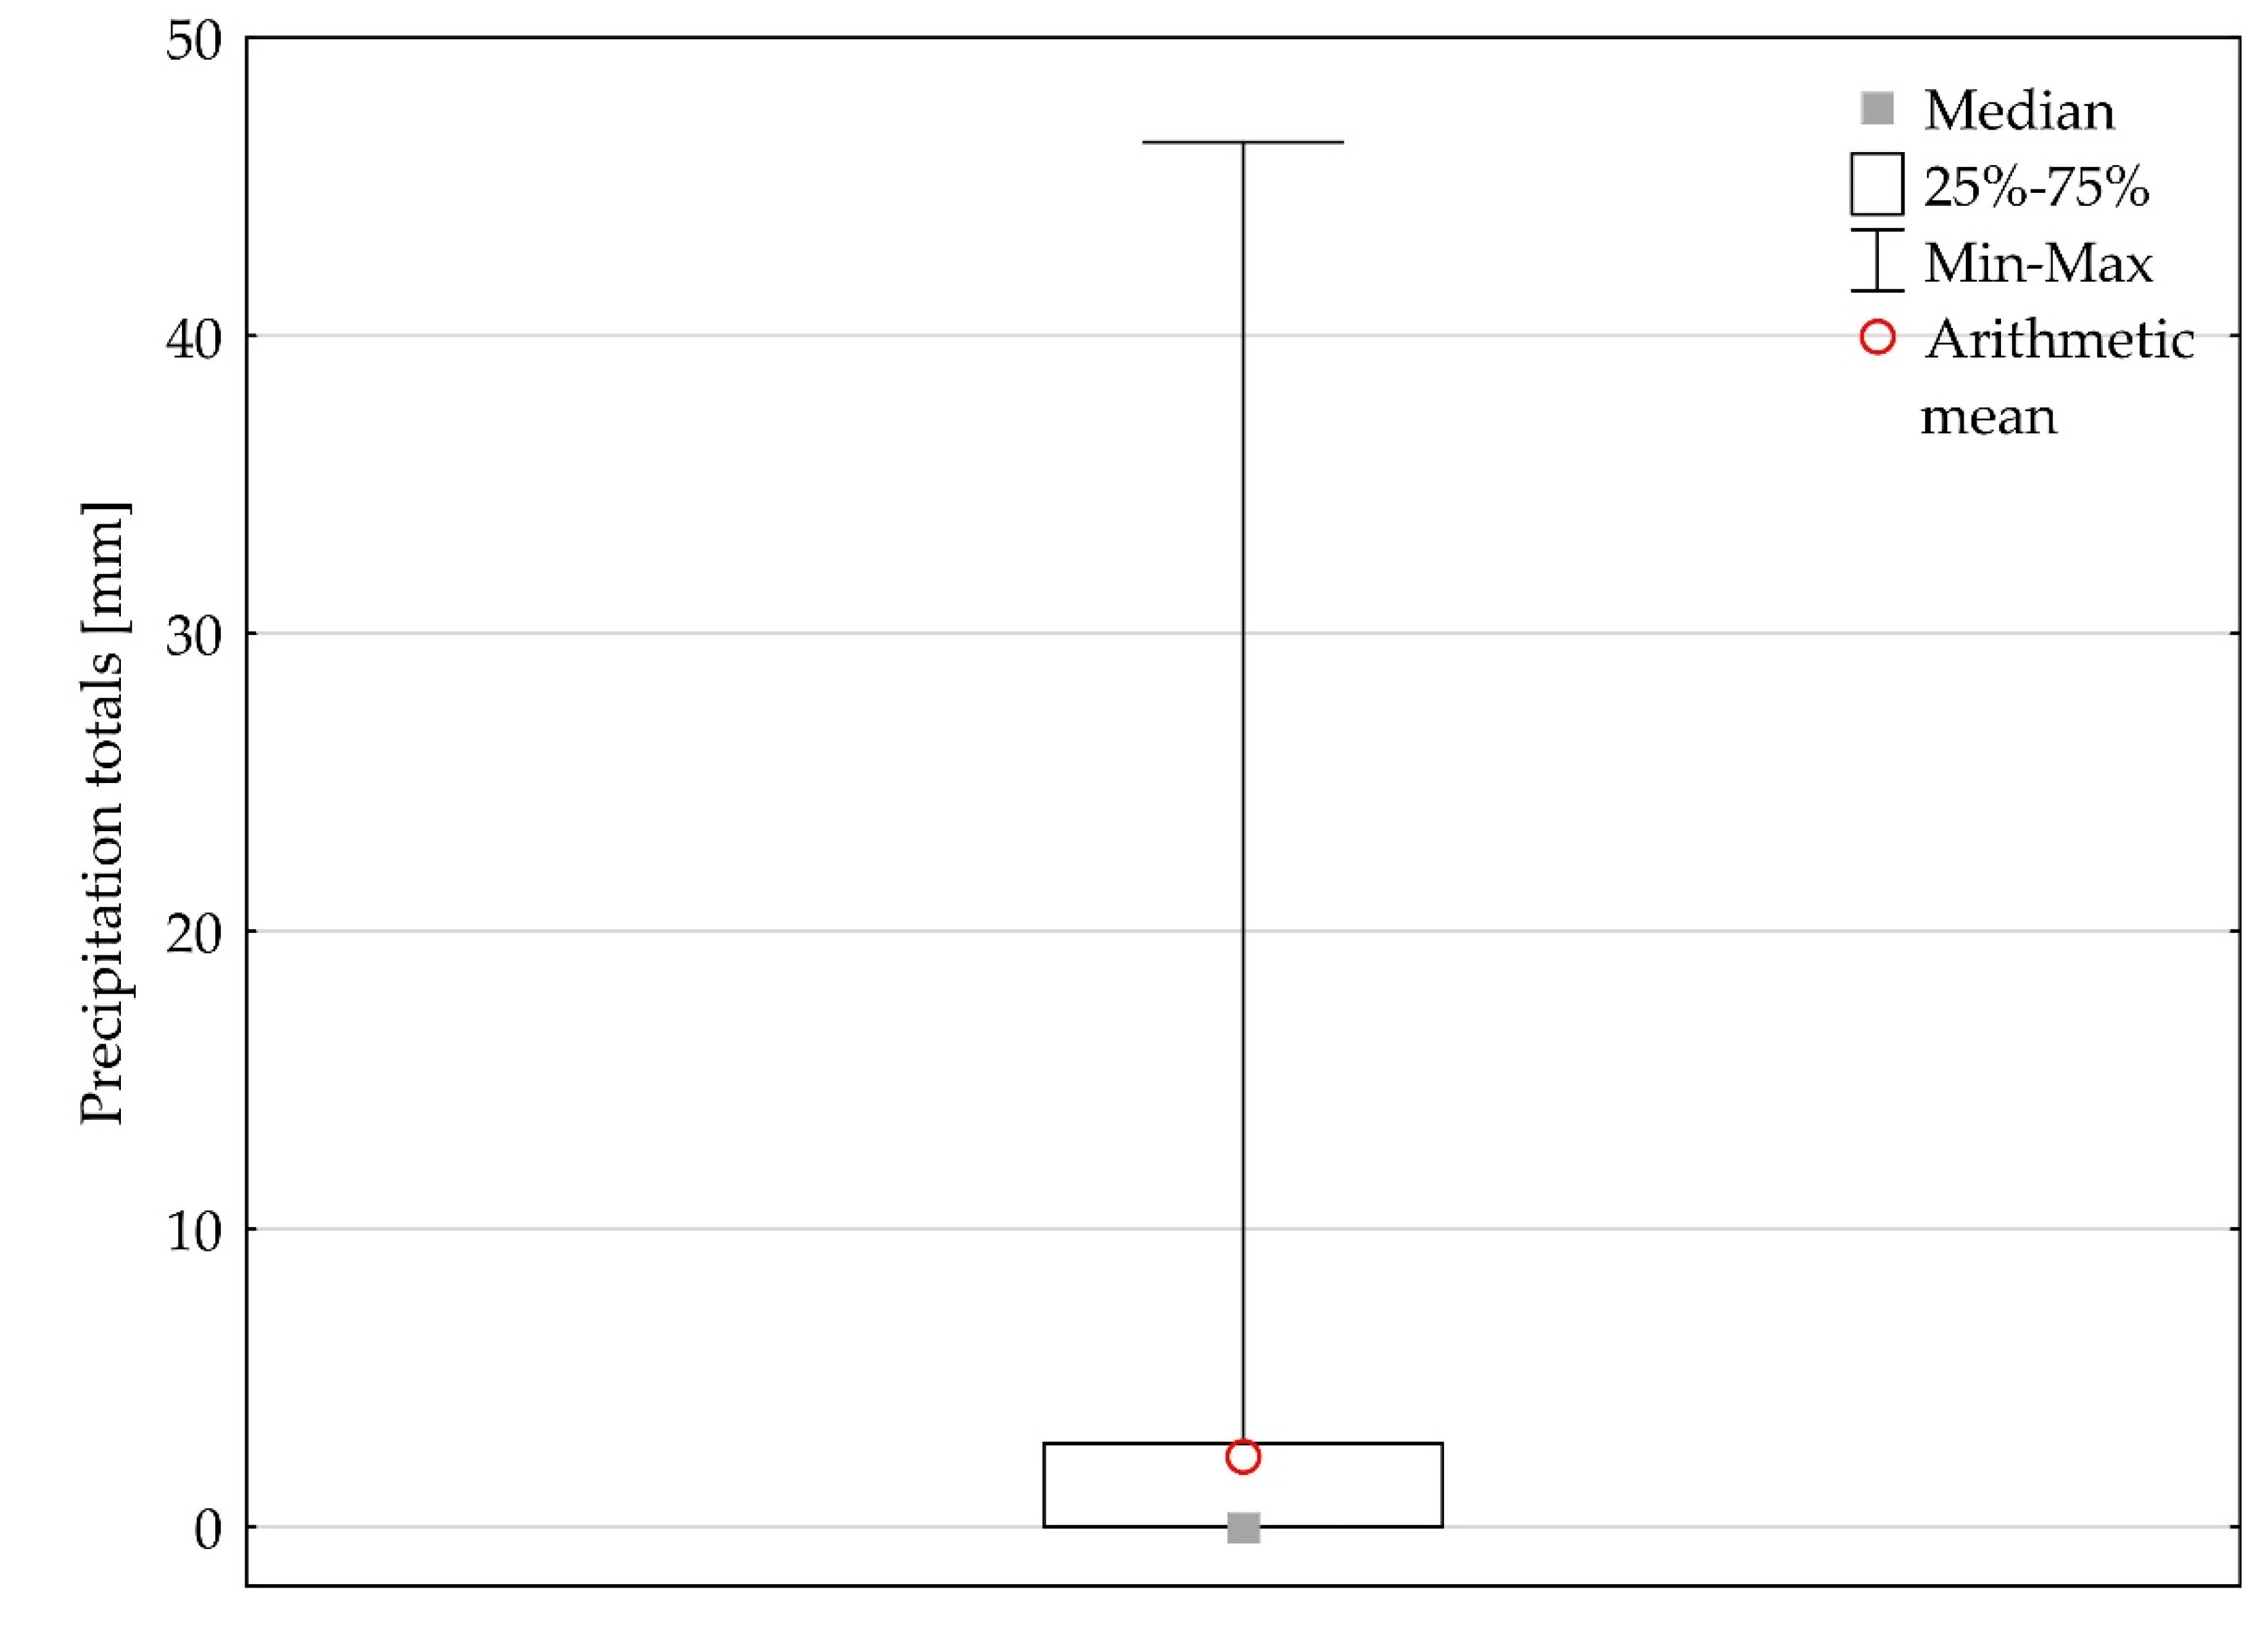
Figure 6.
Average monthly air temperatures in Lidzbark Warmiński and monthly precipitation totals in Górowo Iławeckie in the analysed period (1 July 2022–31 March 2024) and in the long-term period (1991–2020). Source: Own work based on IMGW-PIB data.
Figure 6.
Average monthly air temperatures in Lidzbark Warmiński and monthly precipitation totals in Górowo Iławeckie in the analysed period (1 July 2022–31 March 2024) and in the long-term period (1991–2020). Source: Own work based on IMGW-PIB data.
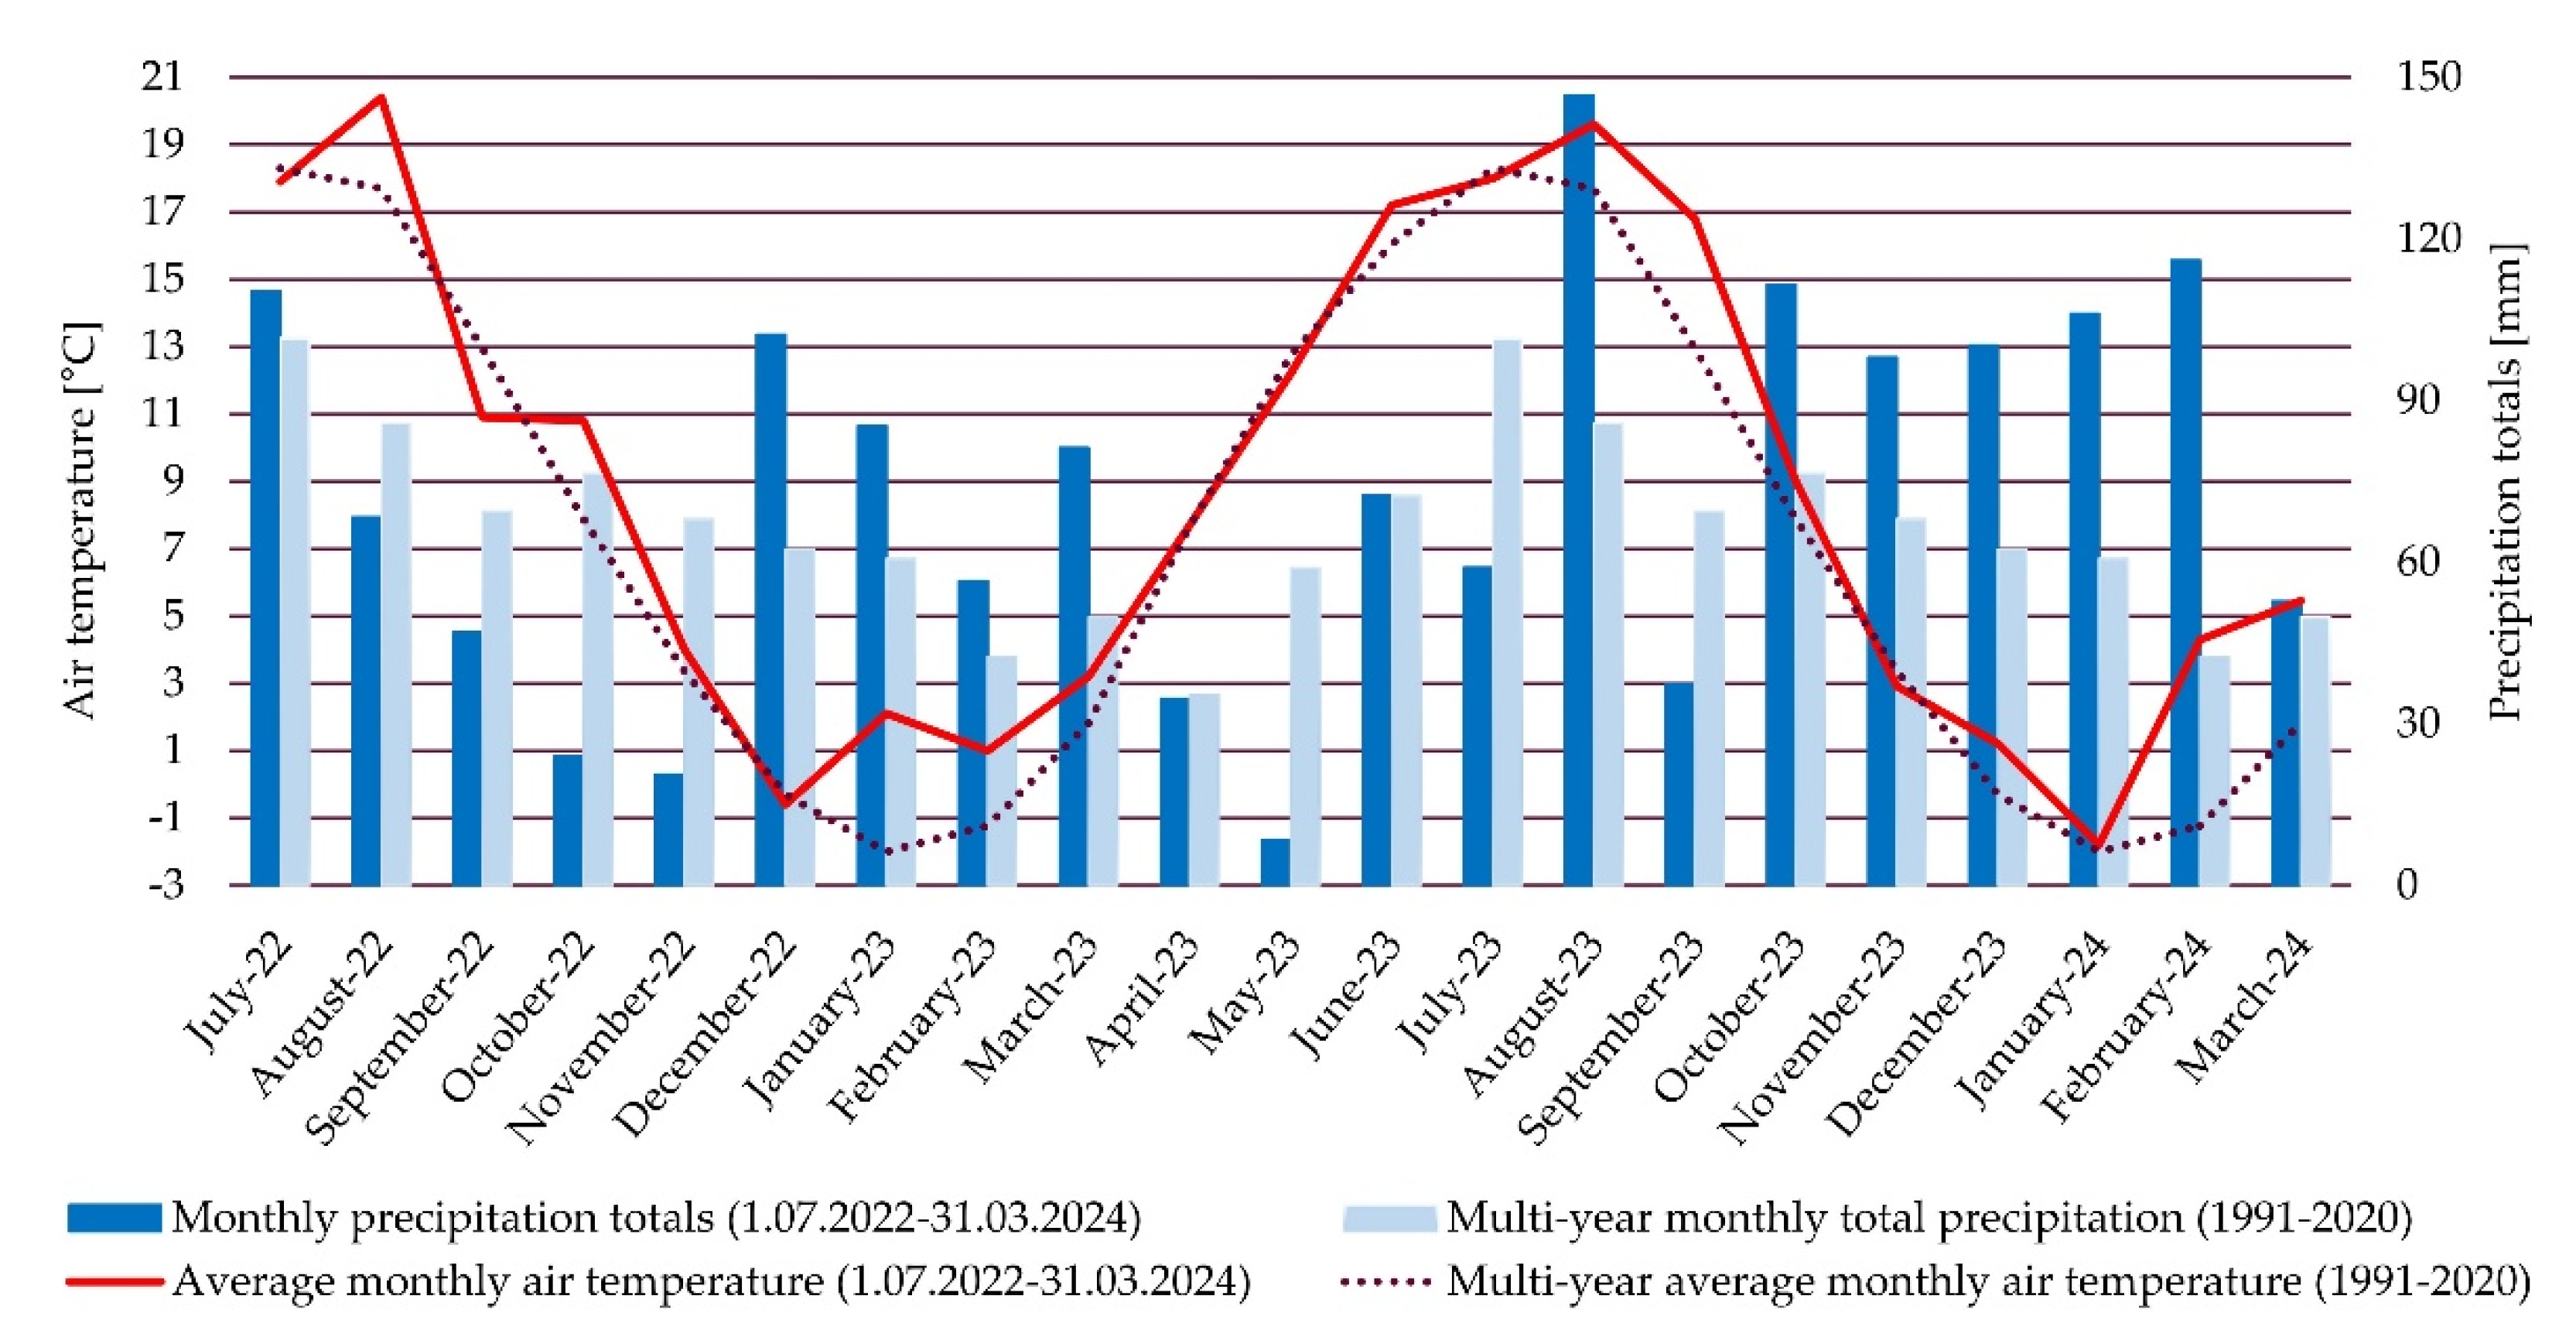
Figure 7.
Selected characteristics describing the daily depths of the subsurface groundwaters in the well (15 July 2022–31 March 2024).
Figure 7.
Selected characteristics describing the daily depths of the subsurface groundwaters in the well (15 July 2022–31 March 2024).
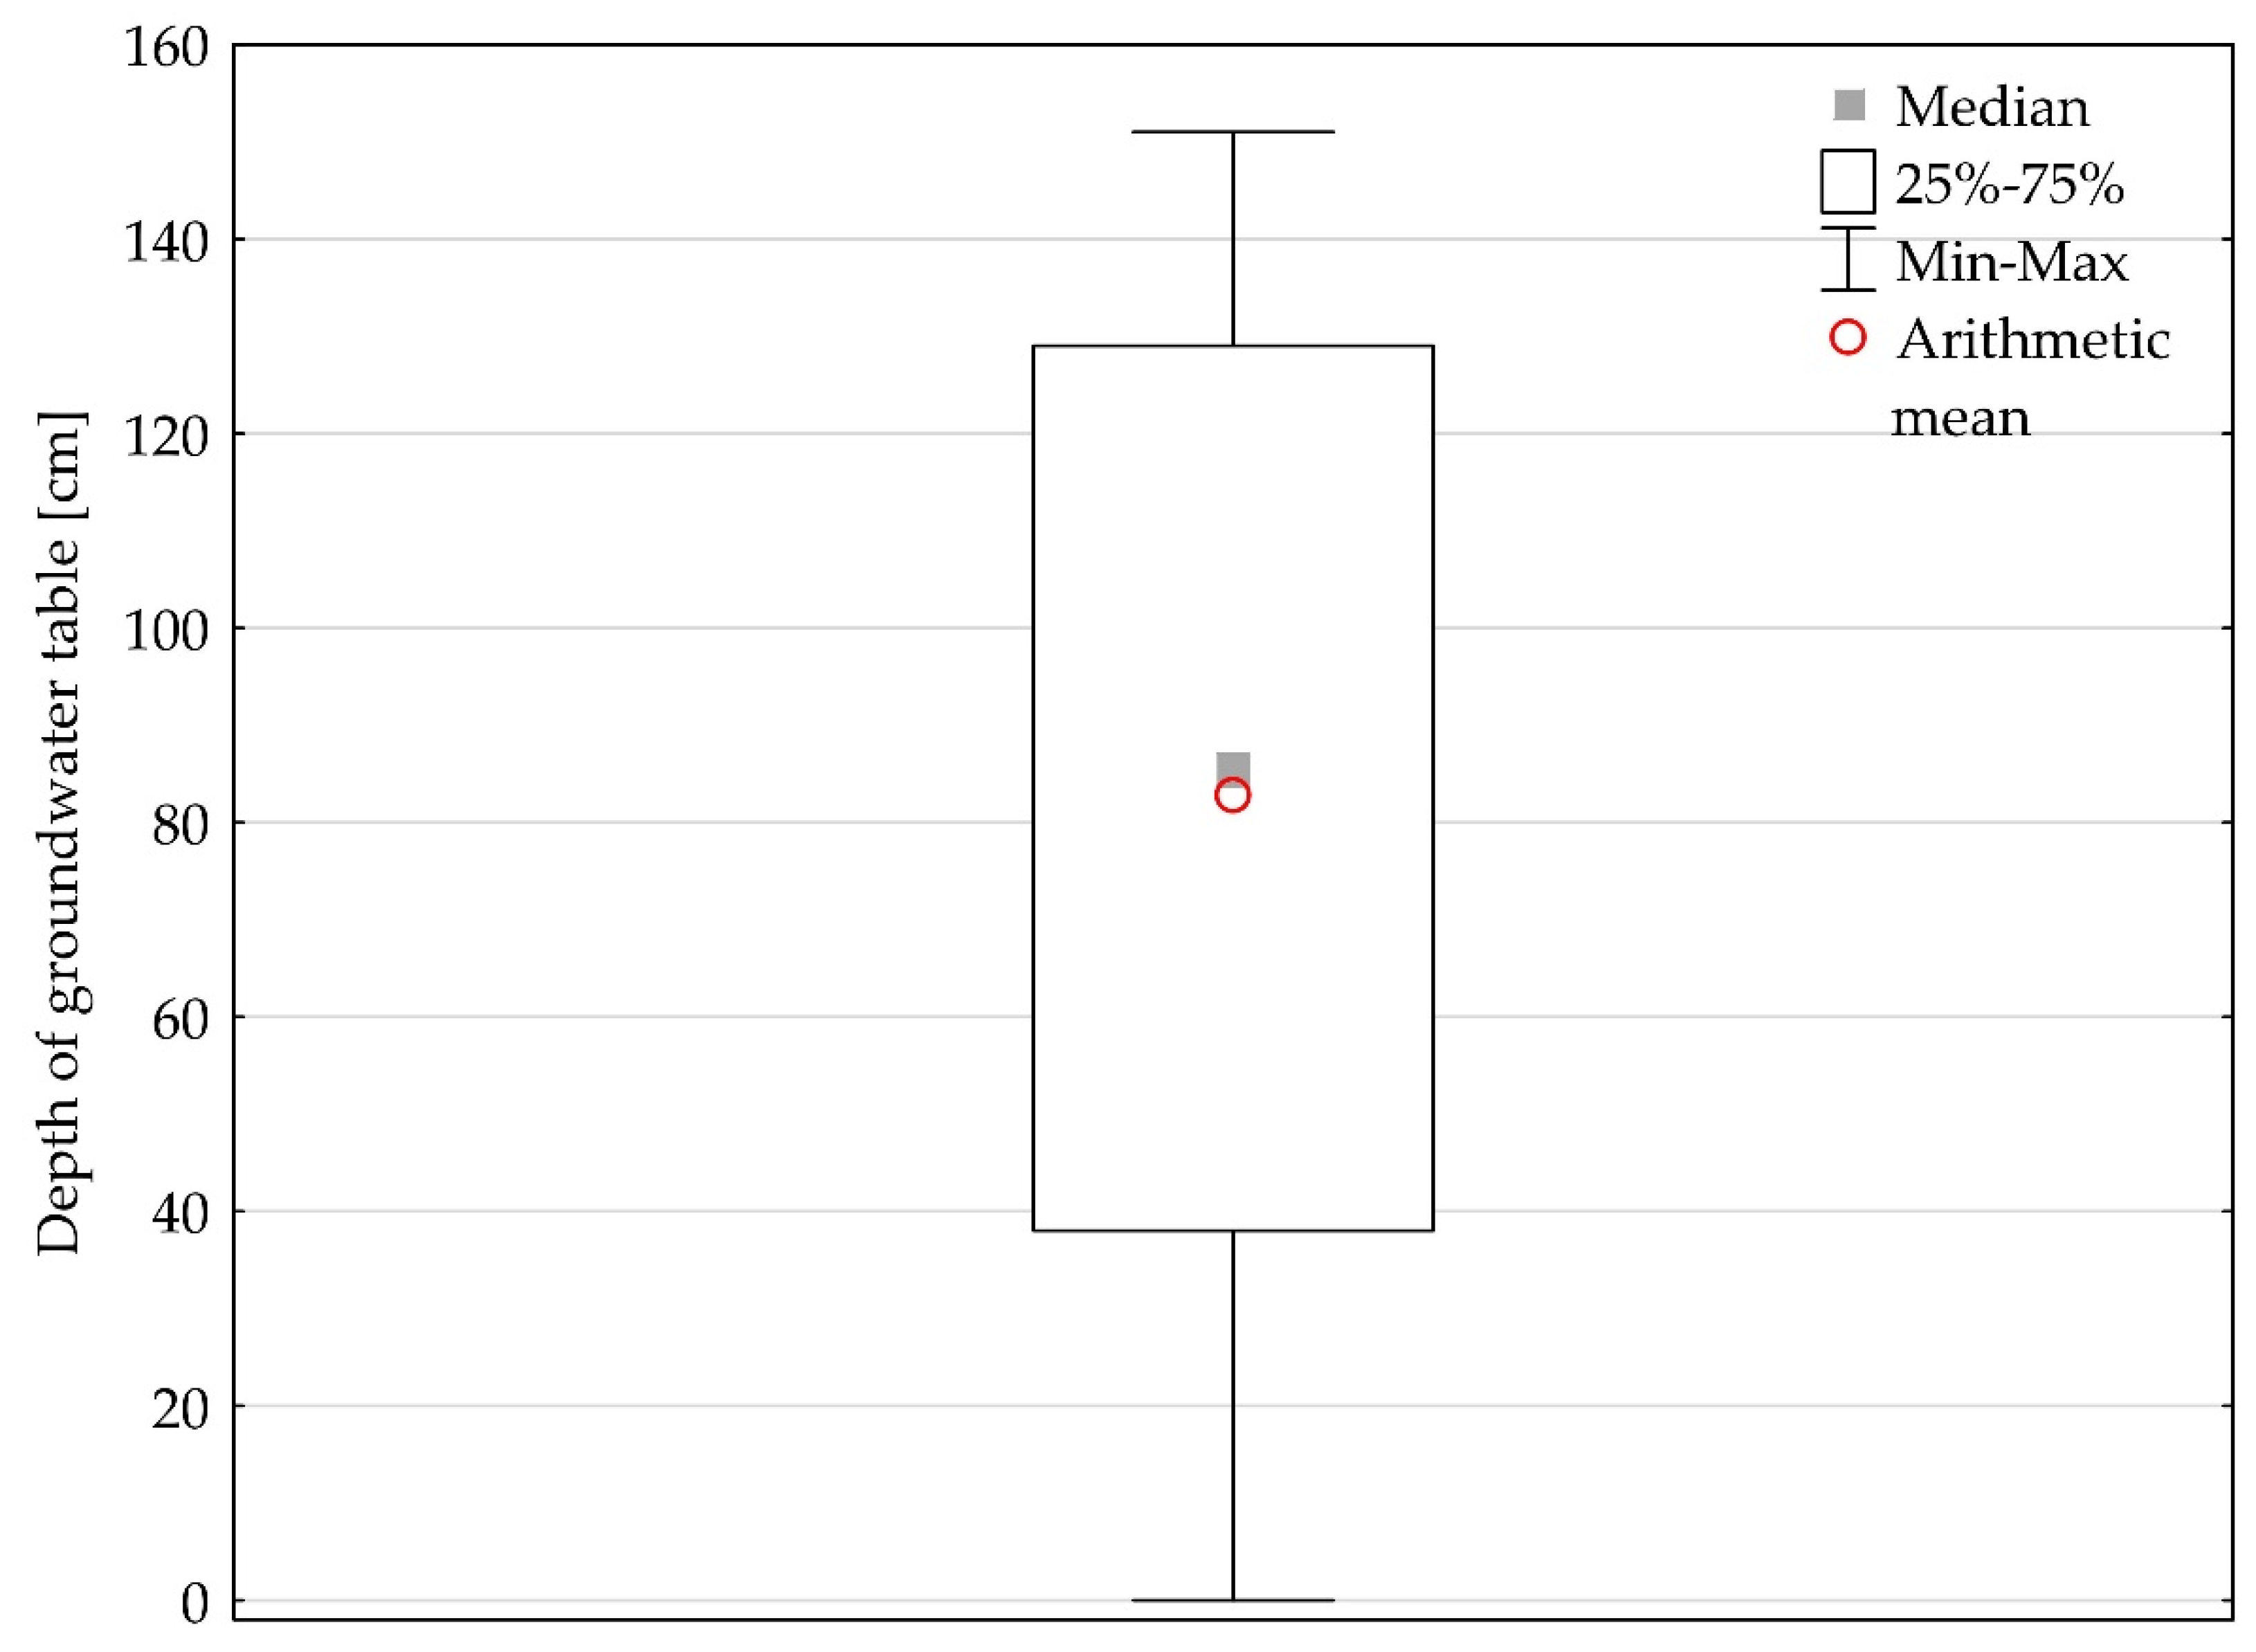
Figure 8.
Depth of the subsurface water table in the analysed well and the periods of hydrological drought officially announced by PGW Wody Polskie (15 July 2022–31 March 2024). Source: Own work based on PGW Wody Polskie data.
Figure 8.
Depth of the subsurface water table in the analysed well and the periods of hydrological drought officially announced by PGW Wody Polskie (15 July 2022–31 March 2024). Source: Own work based on PGW Wody Polskie data.
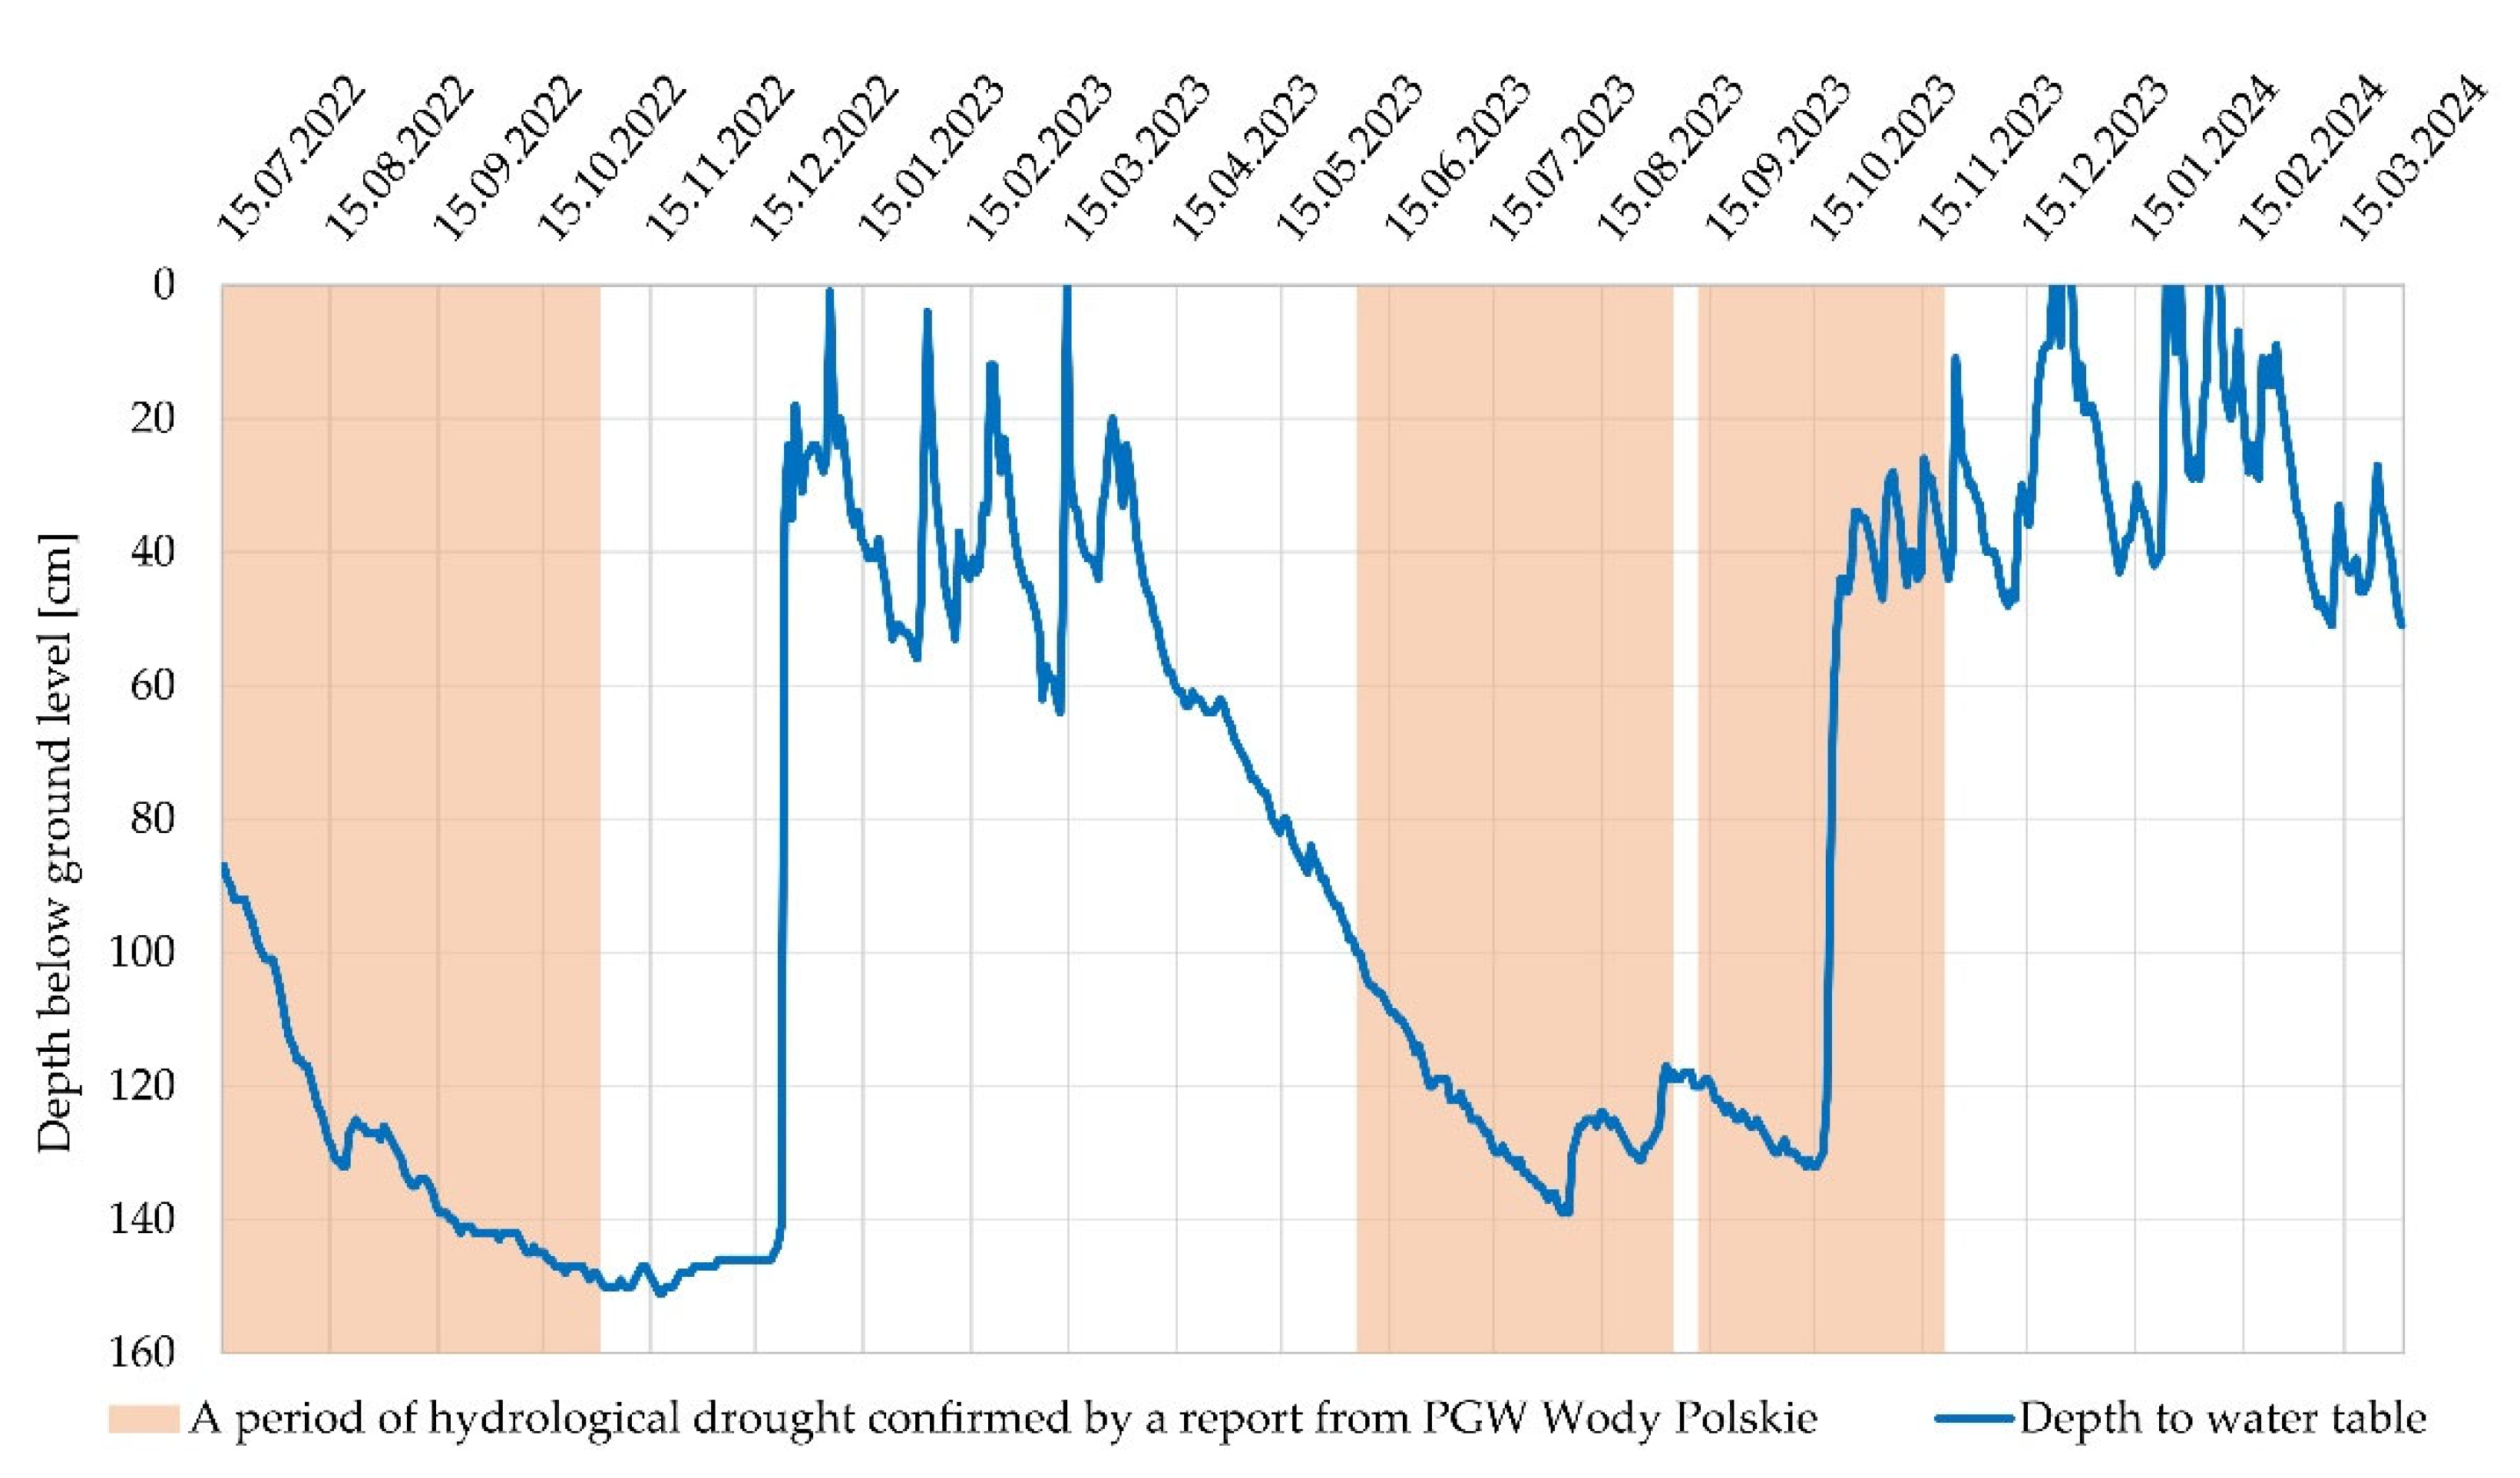

Table 1.
The Spearman rank-order correlation coefficients between daily values of the depth of the subsurface water table in the analysed well and the air temperature in Lidzbark Warmiński (15 July 2022–31 March 2024).
Table 1.
The Spearman rank-order correlation coefficients between daily values of the depth of the subsurface water table in the analysed well and the air temperature in Lidzbark Warmiński (15 July 2022–31 March 2024).
| Delay in reaction (number of days) | Average daily temperature | Maximum daily temperature | Minimum daily temperature | Minimum daily temperature at ground level |
|---|---|---|---|---|
| 0 | 0,44 | 0,42 | 0,43 | 0,41 |
| 1 | 0,43 | 0,43 | 0,45 | 0,41 |
| 2 | 0,44 | 0,44 | 0,46 | 0,42 |
| 3 | 0,45 | 0,45 | 0,47 | 0,42 |
| 4 | 0,46 | 0,46 | 0,48 | 0,43 |
| 5 | 0,47 | 0,48 | 0,49 | 0,45 |
| 6 | 0,48 | 0,49 | 0,50 | 0,46 |
| 7 | 0,49 | 0,50 | 0,51 | 0,46 |
| 8 | 0,51 | 0,51 | 0,53 | 0,48 |
| 9 | 0,52 | 0,52 | 0,54 | 0,48 |
| 10 | 0,53 | 0,54 | 0,55 | 0,49 |
| 11 | 0,54 | 0,55 | 0,56 | 0,50 |
| 12 | 0,55 | 0,56 | 0,57 | 0,51 |
| 13 | 0,56 | 0,57 | 0,58 | 0,52 |
| 14 | 0,57 | 0,58 | 0,60 | 0,53 |
| 15 | 0,58 | 0,59 | 0,61 | 0,54 |
| 16 | 0,59 | 0,60 | 0,61 | 0,55 |
| 17 | 0,60 | 0,61 | 0,62 | 0,56 |
| 18 | 0,60 | 0,62 | 0,63 | 0,56 |
| 19 | 0,61 | 0,63 | 0,64 | 0,56 |
| 20 | 0,61 | 0,63 | 0,65 | 0,57 |
| 21 | 0,62 | 0,64 | 0,65 | 0,57 |
| 22 | 0,62 | 0,65 | 0,66 | 0,57 |
| 23 | 0,62 | 0,65 | 0,66 | 0,57 |
| 24 | 0,62 | 0,65 | 0,66 | 0,57 |
| 25 | 0,62 | 0,65 | 0,66 | 0,57 |
| 26 | 0,63 | 0,65 | 0,66 | 0,58 |
| 27 | 0,63 | 0,66 | 0,67 | 0,58 |
| 28 | 0,63 | 0,66 | 0,67 | 0,57 |
| 29 | 0,62 | 0,66 | 0,67 | 0,57 |
| 30 | 0,62 | 0,66 | 0,67 | 0,57 |
| 31 | 0,62 | 0,66 | 0,67 | 0,57 |
| 32 | 0,62 | 0,66 | 0,67 | 0,57 |
| 33 | 0,62 | 0,66 | 0,67 | 0,58 |
| 34 | 0,62 | 0,67 | 0,67 | 0,58 |
| 35 | 0,62 | 0,67 | 0,67 | 0,57 |
| 36 | 0,61 | 0,67 | 0,67 | 0,57 |
| 37 | 0,61 | 0,66 | 0,66 | 0,56 |
| 38 | 0,60 | 0,66 | 0,66 | 0,55 |
| 39 | 0,59 | 0,65 | 0,65 | 0,54 |
| 40 | 0,58 | 0,64 | 0,64 | 0,53 |
| 41 | 0,56 | 0,64 | 0,63 | 0,51 |
| 42 | 0,55 | 0,63 | 0,62 | 0,50 |
All the coefficients are statistically significant at the level of p ≤0.05. Source: Own work based on IMGW-PIB data.
Table 2.
The Spearman rank-order correlation coefficients between daily values of the depth of the subsurface water table in the analysed well and the precipitation in Górowo Iławeckie (15 July 2022–31 March 2024).
Table 2.
The Spearman rank-order correlation coefficients between daily values of the depth of the subsurface water table in the analysed well and the precipitation in Górowo Iławeckie (15 July 2022–31 March 2024).
| Delay in reaction (number of days) | Daily precipitation totals |
| 0 | -0,17 |
| 1 | -0,22 |
| 2 | -0,24 |
| 3 | -0,24 |
| 4 | -0,23 |
| 5 | -0,22 |
| 6 | -0,20 |
| 7 | -0,19 |
| 8 | -0,18 |
| 9 | -0,17 |
| 10 | -0,18 |
All the coefficients are statistically significant at the level of p ≤0.05. Source: Own work based on IMGW-PIB data.
Disclaimer/Publisher’s Note: The statements, opinions and data contained in all publications are solely those of the individual author(s) and contributor(s) and not of MDPI and/or the editor(s). MDPI and/or the editor(s) disclaim responsibility for any injury to people or property resulting from any ideas, methods, instructions or products referred to in the content. |
© 2025 by the authors. Licensee MDPI, Basel, Switzerland. This article is an open access article distributed under the terms and conditions of the Creative Commons Attribution (CC BY) license (http://creativecommons.org/licenses/by/4.0/).
Copyright: This open access article is published under a Creative Commons CC BY 4.0 license, which permit the free download, distribution, and reuse, provided that the author and preprint are cited in any reuse.


