
Submitted:
04 June 2025
Posted:
05 June 2025
You are already at the latest version
Abstract
The increasing demand for critical raw materials, such as antimony—a semimetal with strategic relevance in fire-retardant applications, electronic components, and national security—has made the identification of European sources essential for the European Union's strategic autonomy. Remote sensing offers a valuable tool for detecting alteration minerals associated with subsurface gold and antimony deposits that reach the surface. However, the coarse spatial resolution of the most freely available satellite data remains a limiting factor. The PlanetScope satellite constellation presents a promising low-cost alternative for the academic community, providing 3-meter spatial resolution and eight spectral bands. In this study, we evaluated PlanetScope's capacity to detect Fe³⁺-bearing iron oxides—key indicators of hydrothermal alteration—by applying targeted band ratios (BRs) in northern Portugal. A comparative analysis was conducted to validate its performance using established BRs from Sentinel-2, ASTER, and Landsat 9. The results were assessed through relative comparison methods, enabling both quantitative and qualitative evaluation of the spectral similarity among sensors. Spatial patterns were analyzed, and points of interest were identified and subsequently validated through fieldwork. Our findings demonstrate that PlanetScope is a viable option for mineral exploration applications, capable of detecting iron oxide anomalies associated with alteration zones while offering finer spatial detail than most freely accessible satellites.
Keywords:
antimony
; gold
; band ratio
; mineral exploration
; satellite
; critical raw materials
1. Introduction
Critical Raw Materials (CRMs), particularly antimony (Sb), are essential for modern technologies, ranging from flame retardants to defense alloys. With Europe heavily reliant on imports, exploring domestic Sb deposits has become a strategic priority [1]. Like many CRMs, Sb is typically concentrated in hydrothermal systems, where mineral-rich fluids circulate through fractures, faults, and shear zones [2,3].
Remote Sensing (RS) has long played a key role in detecting these systems. Early studies, such as those by Abrams et al. [4], demonstrated the use of Landsat imagery to identify hydrothermal zones linked to copper deposits in Arizona. Later advancements by Kruse et al. [5] integrated high spectral and spatial resolution data, enhancing mineral mapping capabilities. Additionally, Sabins [6] provided foundational guidelines for RS applications in mineral exploration.
However, traditional RS methods faced limitations due to the low resolution of early satellite sensors [6,7]. Recent advances in hyperspectral missions (e.g., PRISMA, EnMAP) have transformed mineral exploration, yet very high-resolution satellites like WorldView-3 (WV3) remain costly for academia beyond limited free tires. The sensor SuperDove (PSB.SD) of the PlanetScope (PS) constellation, launched in 2021, offers an affordable alternative with eight Visible and Near Infrared (VNIR) bands (including red edge and coastal blue) and a 3-m resolution [8]. PS offers free quotas for scientific purposes, making its imagery more attractive to the scientific community compared to World View-3.
With eight VNIR bands—including a dedicated blue band and a NIR band, which are critical for detecting iron oxides (Fe³⁺), key indicators of hydrothermal activity—PS's high spatial resolution offers strong potential for iron oxide identification. However, few studies have systematically evaluated PSB.SD's efficacy compared to established sensors like Sentinel-2 or ASTER.
This study evaluates PSB. SD's ability to map iron oxides, linked to Sb-Au mineralization in Freixeda, northern Portugal, where Sb is found in association with gold (Au), another important mineral for the economy. The methodology applied in this work focuses on the use of specific band ratios (BR) for Fe³⁺ identification, followed by a relative comparison of the results obtained from different satellites against PS data.
BR was selected for this study due to its easy accessibility, replicability, and well-established validation in the literature. Numerous studies have successfully employed BR to detect hydrothermal zones associated with pegmatites [9,10], carbonate-hosted Zn-Pb deposits [11,12], as well as copper [4,13,14], and gold mineralization [15]. Using BR to highlight iron oxide spectral signatures, we compare PSB. SD's performance to Sentinel-2, ASTER, and Landsat 9. Regarding RS studies related to antimony, we can mention the work of Dan et al. [16], who integrate images from different multispectral satellites (Landsat 8 OLI, Sentinel-2 and ASTER) with lineament extraction to identify antimony occurrences. Gómez et al. [17] use the integration of hyperspectral and thermal data to detect antimony concentrations. Carvalho et al. [18] applied Convolutional Neural Networks (CNNs) to map antimony in northern Portugal, and Santos et al. [19] used Hyperspectral data (PRISMA satellite) to calculate Relative Band Depth (RBD) to map alteration minerals associated with antimony in Freixeda, Portugal.
While previous studies have integrated hyperspectral data or machine learning algorithms for Sb detection, this work uniquely evaluates PS's cost-efficient VNIR capabilities against established multispectral sensors.
PlanetScope has a disadvantage compared to Sentinel-2, ASTER, and Landsat 9 due to the absence of Shortwave Infrared (SWIR) bands. However, this study aims to evaluate whether PlanetScope's higher spatial resolution can compensate for the lack of SWIR bands in mapping the target minerals. Only the VNIR (Visible and Near Infrared) bands were considered for the other satellites to ensure a fair comparison.
As a result, the method is limited to detecting Fe³⁺since the BRs used to identify Fe²⁺, ferric oxides, ferrous iron, and ferrous silicates require SWIR bands [11,20,21,22].
Our findings aim to validate PSB.SD as a cost-efficient tool for academic mineral exploration, bridging the gap between high-cost and low-resolution datasets.
2. Study Area
Freixeda is located in Zona de Galiza-Trás-os-Montes (ZGTM) in the municipality of Mirandela, north of Portugal (Figure 1). The study area has 83 km2 of extension and encompasses several mineralizations of Au-Ag (silver)-As (arsenic) and As-Au-Ag with some mining activity from the Roman period [23,24]. The Freixeda Philonian field is also rich in tungsten, lead, zinc, and copper. Antimony can be found in small quantities and is always associated with gold deposits [25]. Among these mineralizations, we can give the example of the Freixeda mine, which encompasses two important veins (São Jerónimo and Santo André vein) with Sb mineralization [25]. The Covo vein is Northeast of the Freixeda mine, a continuation of the São Jeronimo lode and, therefore, has great potential for Sb mineralization [25].
Gold and silver deposits are generally associated with Paleozoic quartzites from the Ordovician period and black shales dating from the Ordovician and Silurian periods [26]. Occasionally, these mineralizations also occur in granitic rocks. Gold is found in veins, stockworks, and silicified masses within metamorphosed metasediments. The formation of these deposits was influenced by shear zones, tectonic pulses, and late fractures related to the Variscan Orogeny [24].
The Freixeda mine operated as a gold mine from 1952 to 1955, ceasing its activities due to economic and organizational issues [25,27]. Almeida & Noronha [22] suggest a relationship between late granites and tungsten (W) and Au-Ag mineralization. Almeida & Noronha [27] describe the mineral deposition sequence in two stages: the first is characterized by the presence of scheelite + wolframite + sulfides (such as arsenopyrite, pyrite, pyrrhotite, and molybdenite); the second stage includes the association of chalcopyrite + sphalerite + sulfides + galena + native elements, which is well represented in Freixeda.
The main iron oxides present in the study area that can be mapped are Goethite and Hematite. Both Hematite and Goethite were identified through spectral analyses conducted on rock samples. The spectral analyses also identify maghemite, zincite, and ferrihydrite but are less representative than Goethite and Hematite. For future intents, Goethite and Hematite will be called target minerals.
3. Materials and Methods
The step-by-step process illustrated in Figure 2 outlines the methodology used in this study. It can be divided into two main stages. The first stage, Spectral Data Acquisition, involves collecting spectral data from rock samples, organizing it into a spectral library, and analyzing it to identify target minerals. The second stage, Satellite Image Processing, focuses on calculating specific BRs to map target minerals, identify potential areas of interest, and compare the results obtained from the PS sensor with other satellites. This comparison helps assess the degree of similarity between datasets and evaluate the PS sensor's ability to detect iron oxides.
3.1. Data
The PS image was acquired on August 28, 2024. The PS image was obtained through the Planet Explore gallery (developers.planet.com). The image was already provided in surface reflectance, so no atmospheric correction was needed. PS, operated by Planet, is a constellation of around 130 satellites with a Ground Sample Distance (GSD) of 3 meters (m). The SuperDove instrument (PSB.SD), launched in 2021, enhanced the original PS capabilities by expanding the available bands from the initial four (blue, green, red, and near-infrared (NIR)) to eight, with the addition of green I, yellow, coastal blue, and the red edge band [28]. The Sentinel-2 image was acquired on October 02, 2023. The image was downloaded from the Copernicus dataspace website. The Sentinel-2 Multispectral Instrument (MSI) has four bands with 10 m of ground sample distance (GSD), six bands with 20 m of GSD, and three bands with 60 m of GSD [29]. The ASTER image was captured on September 14, 2003. The ASTER has three bands in the visible and NIR with 15 m of GSD, six bands in the SWIR with a GSD of 30 m, and four bands in the Thermal Infrared (TIR) Region with 90 m of GSD [30]. The Landsat 9 image was acquired on October 4, 2022. Landsat 9 is equipped with the Operational Land Imager 2 (OLI-2) and the Thermal Infrared Sensor 2 (TIRS-2), which provide data across 11 spectral bands. The OLI-2 sensor captures data in the visible, near-infrared (NIR), and shortwave infrared (SWIR) regions with a GSD of 30 meters for most bands. The panchromatic band has a GSD of 15 meters. The TIRS-2 sensor acquires thermal infrared data in two bands with a native GSD of 100 meters [31].
One of the goals of this research is to compare the potential of PS satellites in mapping ferric iron (Fe3+) with that of Sentinel-2 and ASTER satellites. Table 1 presents the correlation between the bands of these satellites and those of the PS satellite.
3.2. Spectral Data Acquisition
The methodology began with collecting and analyzing rock spectra from the Freixeda study area. In total, 16 rock samples were acquired and placed in an oven, where they were subjected to a temperature of 50 degrees Celsius to eliminate any traces of liquid on the surface [32].
The spectral information obtained from the rock samples was collected using Analytical Spectral Devices (ASD). The ASD FieldSpec 4 spectroradiometer is a portable, battery-operated spectrometer with a spectral range of 350–2500 nm. It offers a spectral resolution of 3 nm at 700 nm (VNIR), 10 nm at 1400 nm (SWIR 1), and 10 nm at 2100 nm (SWIR 2). A spectralon (Labsphere) plate was used for reflectance calibration. The spectralon plate has a maximum reflectance higher than 99% for the 400 to 1500nm range and higher than 95% for the 250 to 2500 nm range[9]. In total, 48 spectra were collected.
3.3. Preprocessing
The atmosphere correction was applied to satellite images (Sentinel-2, ASTER, and Landsat 9) using Quick Atmospheric Correction (QUAC). QUAC can derive atmospheric correction parameters directly from the image itself without requiring any external data [33].
With the atmospheric correction completed, all images were resampled to a spatial resolution of 3 meters using the "Resize Data" tool in ENVI 6.0.
3.4. Spectral Analyses
After that, a first spectral analysis was performed. This analysis is crucial for identifying the alteration minerals associated with Au-Sb deposits. Since the aim of this work is to map iron oxides, they were the focus of the analysis. The analyses were conducted using the Spectral Analyst tool (ENVI) to match an unknown spectrum with reference spectra from a known spectral library [34]. The Spectral Analyst provides a score where a higher score indicates a higher probability that the spectrum belongs to a specific mineral [34].
Iron oxide minerals such as maghemite, zincite, Goethite, ferrihydrite, and Hematite were identified. Among the iron oxides in the study area, we detected that Hematite and Goethite are the most representative minerals. After identifying the key iron oxides, a spectral resampling was performed to convert the iron oxide spectra to PS spectral resolution using the spectral resampling tool (ENVI). The spectra were then saved in a spectral library and used in final spectral analyses.
A final spectral analysis was conducted, in which, after composing graphs with the previously selected spectra (using OriginPro software 2025), it was possible to compare the main absorption features and reflectance peaks of the target minerals with the satellite bands. This allowed for an understanding of the advantages and limitations of the satellites in mapping these minerals.
3.5. Mapping Methods
BR is a common technique used in mineral exploration. It involves calculating the ratio between a band that reflects the target signal and a band that absorbs that signal [9]. The difference between the reflecting band and the absorbing band highlights specific characteristics of the target [9]. Many works use Fe3+ as a key to map Hematite, and it can also be applied to map Goethite [20,24,35].
To analyze the potential of PS satellites in detecting iron oxides, we developed and tested a new spectral ratio for PS while applying recognized methods to other satellites (Table 2). We then assessed the similarity of the results to determine whether PS can achieve comparable outcomes to satellites with proven effectiveness in identifying these minerals. We focused on mapping the primary iron hydroxides associated with Au-Sb mineralization in Freixeda, specifically Hematite and Goethite.
3.6. Data Standardization
As we are working with different sensors, normalizing the data to a [0,1] scale facilitates direct comparison between sensors. Additionally, standardized data eliminates scale differences that could negatively impact the correlation analysis between results from different satellites. To standardize the data, the following equation was applied to BR:
where min(BR) is the minimum pixel value of the BR, and max(BR) is the maximum pixel value of the BR.
3.7. Post-Processing
It was necessary to mask higher values in BR, as these corresponded to a small number of pixels that were not representative of the study area and were associated with false positives, such as urban areas. This step was taken because, when applying color slices, these higher values distorted the scale, making it difficult to accurately interpret the distribution of the values within the area of interest. Masking these outliers ensured that the resulting visualization was more representative and better aligned with the study's objectives. The masked values can be observed in Table 2.
The Color Slices tool was applied using the Color Slices function in the ENVI software. This tool allows selecting data ranges and assigning colors to highlight specific areas in an image. Automatically, the data is organized into 16 intervals, which we will refer to as classes. While cool colors represent the lowest values, warm colors represent the highest values.
3.8. Mapping Regions of Interest
A fuzzification (by fuzzy overlay) was computed to identify possible regions of interest (ROIs) for iron oxides in Freixeda. Identifying ROIs is crucial to compare the results of the satellites and to understand the capability of the PS image to identify the same ROIs.
Two tests were conducted using the GAMMA function of fuzzy overlay. Test 1 – Using all the BR from each satellite as input (γ = 0.9); test 2 – A fuzzification (Sentinel-2, ASTER. Landsat 9) without PS (γ = 0); this will allow us to understand the impact of PS in the final result. The final result was analyzed with the help of high-resolution true color composites and geological maps to discard false positives and choose the ROIs.
3.9. Relative Comparison (Ratio Between BRs)
The BR results from each satellite were analyzed to better understand their similarities concerning PS results.
A cross-sensor band ratio comparison was applied to examine the relationship between values detected by different satellites. The results from each satellite (represented in Color Slices) were used to compute the ratios. This process involves calculating the ratio between the BRs of two satellites for each pixel, always using the PS BR as the dividend. To interpret these ratios, specific thresholds were established to classify the similarity between the results of PS and the other satellites:
- Positive results are all those between ≥ 0.5 and ≤ 1.99.
- Between 0.5 and 1, the PS identified fewer iron oxides than the other satellite, but there was no significant difference in the results.
- Between 1 and 1.99, the PS identified more iron oxides, but again, without any abnormality in the results.
- Values ≥ 2, based on the logic of the ratio, imply a significant discrepancy between the results.
- On the other hand, values >0 and ≤ 0.5 indicate that the PS identified far fewer iron oxides than the other satellite, which is, therefore, not an ideal result.
This approach has advantages, such as allowing an understanding of the proportion or relationship between the values detected by the satellites instead of just absolute differences. It enables a direct interpretation of the values, providing a clear and objective analysis of the results, which can be assessed both qualitatively and quantitatively. It also allows for analyzing the sensor's spectral sensitivity in detecting the target mineral (in this case, iron oxides).
However, the method also has its limitations. Due to the nature of ratios, division by zero is undefined. Therefore, when ASTER, Sentinel-2, or Landsat 9 have a value of 0, the ratio result will be NoData. If both satellites have a value of 0, the result will also be NoData. On the other hand, if PS has a value of 0, the ratio result will be 0.
Although it is possible to apply filters or replace the NoData value with a real number, it was decided to keep it to preserve the integrity of the original data and avoid distortions in the results. Additionally, NoData values indicate areas with invalid or missing data, ensuring transparency in the analysis and facilitating its replication.
3.10. Validation and Evaluation
Fieldwork was conducted with the objective of collecting samples and surveying the identified regions of interest. Both rock and soil samples were collected during the field campaign; however, this study focuses exclusively on the soil samples. Aerial reconnaissance was performed using a high-resolution drone DJI Mavic 3 Pro (sensor 4/3 CMOS; Effective pixels: 20 MP) that captured RGB images and videos of the study area. The samples were oven-dried at 50 °C and sieved (<200 µm). After sieving and proper drying, five spectra were collected from each sample to ensure the representativeness of the data. The procedure for spectral analysis was the same as described in Section 3.4.
4. Results
4.1. Spectral Analyses
The spectral analyst results indicate that iron oxides are less representative than sheet silicates in the study area. Goethite was identified in four spectra, and Hematite in two spectra. Despite not being so representative, mapping Iron Oxides is a basic method of finding hydrothermal deposits.
Therefore, after spectral analyst results, a new spectral analysis was conducted focusing on Goethite and Hematite. Figure 3 compares both Hematite and Goethite spectra, and it is possible to observe that there is a slight shift between their absorption features and reflectance peaks. However, due to the limited spectral resolution of multispectral satellites, both minerals often fall within the same satellite bands, making it challenging to differentiate between them [36]. As a result, the same processing methods used to map Goethite can also be applied to Hematite [36]. Therefore, while the Goethite spectrum was selected for analysis, it can be used to represent both minerals in this context.
Concerning the Goethite spectrum, two diagnostic iron absorption features (at ~673 nm and ~924 nm) and one diagnostic reflectance peak at ~750 nm can be observed [37]. After that, in the SWIR region, we can observe two generic OH/water absorption features at ~1401 nm and ~1915 nm. Hematite differs from Goethite by a tiny difference in one of the iron absorption that appears at ~859 nm [38,39].
4.2. Band Ratios Indices
For the analysis of the results, we considered the pixels of interest, which correspond to classes between 12 and 16, with class 16 having maximum relevance and class 12 having medium relevance (Figure 4). The data presented in Table 3 were calculated based on the proportion of pixels of interest rather than the total image, but this information can also be consulted in Figure A1 (Appendix A). When analyzing the most significant satellites for each class, we observed the following order of pixel identification by proportion:
- Class 12: Sentinel-2 (72.23%) > PS (67.86%) > Landsat 9 (64.34%) > ASTER (40.40%).
- Class 13: ASTER (43.86%) > Landsat 9 (32.55%) > Sentinel-2 (18.48%) > PS (18.12%).
- Class 14: ASTER (13.29%) > PS (5.95%) > Sentinel-2 (5.64%) > Landsat 9 (2.91%).
- Class 15: PS (3.71%) > Sentinel-2 (2.34%) > ASTER (2.09%) > Landsat 9 (0.18%).
- Class 16: PS (4.37%) > Sentinel-2 (1.29%) > ASTER (0.33%) > Landsat 9 (0.00%).
The results show that PS is the most sensitive in identifying pixels in the most important classes (classes 15 and 16), followed by Sentinel-2, while Landsat 9 proved to be the least sensitive, as it did not present significant results for class 16. ASTER performed distinctly, effectively identifying pixels in classes 13 and 14; however, upon further analysis, we observed that this high detection, especially in class 14, may indicate the presence of false positives associated with vegetation. In the results obtained for Reflectance Bands (BR) of PS and Sentinel-2, classes 14, 15, and 16 have low values, but the pixels are distributed across areas of interest. Conversely, for ASTER and Landsat 9, the pixels are concentrated in class 14 rather than being distributed in classes 15 and 16, resulting in the formation of large clusters within a single class, which are not intuitive for identifying areas of interest.
4.3. Region of Interest
Clusters in hot colors are iron oxide pixels; the behavior of the clusters of interest are pixels with high to very high values surrounded by clusters with medium-high values (see Figure 5 and Figure 6).
It was possible to identify four ROIs (Figure 5) in test 1 results (fuzzy of all satellite images). The ROI 1 is located 1.2 km (kilometers) Norwest of Frexas village, ROI 2 is located 600 m (meters) Southwest of Vila Verde village, ROI 3 is located 1.8 km Northeast of Vila Verde village, ROI 4 is located 3.1 km East of Freixeda village.
Figure 6 shows us the result of test 2 (fuzzy without PS image). Six ROIs were identified, and four (ROIs 1, 2, 3, and 4) of them are the same identified in test 1. The ROI 5 is located 3.7 km Southeast of Vila Verde city, and ROIS 6 is located 3.1 km East of Freixeda village. The location of the ROIs in the study area can be observed in Figure A2 (Appendix A)
Table 4 shows the percentage each class occupies for Test 1 and Test 2 results. This analysis helps to understand the representativeness of the classes in the image. This analysis will focus on the pixels of interest, ranging from class 11 to class 16.
It is possible to observe in Table 4 that Test 2 identified more pixels in class 12, while Test 1 detected more pixels between classes 13 and 16. Notably, classes 15 and 16 are the most important for identifying iron oxides.
4.4. Relative Comparison (Ratio Between BRs)
A comparison between the PS results and those of the other satellites was performed (Figure 7). The results were normalized concerning PS, focusing on values of 1, indicating perfect agreement, and 0, indicating no agreement. The analysis includes only the pixels identified as iron oxides, which fall between classes 12 and 16, previously selected in earlier steps.
The ratio map between BR-PS and BR-Sentinel-2 (Figure 7a,b) demonstrated the highest agreement, with 34.98% of pixels having a value of 1 and 31.49% having a value of 0, indicating the lowest disagreement. Positive values comprised 68.48% of the data, with 21.15% greater than 1 and 12.35% less than 1, suggesting that PS identified more iron oxides in pixels as higher values compared to Sentinel-2.
For BR-PS and BR-ASTER (Figure 7c,d), 0% of the pixels had a value of 1, while 69.89% had a value of 0, indicating significant non-correspondence. Positive values accounted for 30.09% of the pixels, with 12.92% greater than 1 and 17.17% between 0.5 and 1, suggesting ASTER identified more iron oxide pixels with more confidence than PS.
The ratio map between BR-PS and BR-Landsat 9 (Figure 7e, f) revealed similar results as BR-PS and BR-ASTER, with 0% of pixels having a value of 1 and 61.62% having a value of 0, indicating high non-correspondence. Positive values comprised 38.35%, with 21.96% greater than 1 and 16.39% between 0.5 and 1, indicating that PS identified more iron oxide pixels as having higher values than Landsat 9.
Notably, despite the high non-correspondence between PS and both ASTER and Landsat 9, no ratio map exhibited anomalous values greater than 2 or between 0 and 0.5.
When focusing on the areas of interest (Figure 8), the lowest non-correspondence was between PS and Sentinel-2 at 3.15%, followed by ASTER at 13.19% and Landsat 9 at 20.53%.
Regarding positive values, PS and Sentinel-2 had the highest correspondence, with 96.81% of pixels matching positive values. Of these, 32.22% had absolute correspondence, 51.34% showed PS identifying higher iron oxide values, and 13.25% indicated that Sentinel-2 identified iron oxide pixels with more confidence.
For the PS and ASTER comparison, there was no absolute correspondence, but 86.78% of the pixels exhibited positive data. Of these, 36.65% had PS identifying iron oxides with more confidence, and 50.13% had ASTER identifying more. This represents a positive shift compared to the entire image ratio map, where ASTER obtained the lowest similarity to PS.
The ratio between PS and Landsat 9 reached 79.44%, lower than the PS and ASTER ratio. Similar to ASTER, Landsat 9 had no absolute correspondence to PS. Among the positive values, 25.29% had PS identifying higher iron oxide values, while 54.15% had Landsat 9 identifying more.
4.5. Validation and Evaluation
The field campaign focused on collecting rock and soil samples from locations identified as having maximum values based on the fuzzification results. Figure 9 shows a comparison between a high-resolution image (Figure 9a,c) obtained through drone reconnaissance and the fuzzification output, where the sampling locations can be observed (Figure 9b,d). This study focuses on the spectral analysis of the collected soil samples.
In Figure 10, the first column shows the soil samples from which the spectra were obtained. The second column presents the corresponding spectra graphically. All spectra display a reflectance peak at approximately 750 nm. This peak is slightly weaker in the sample from ROI 5 (Figure 10i,j) and significantly weaker in the sample from point 3 (Figure 10e,f). Given that hematite typically exhibits a reflectance peak at 750 nm and goethite around 660 nm, and that all spectra display a peak at 750 nm, the results suggest that goethite is absent in the analyzed soil samples, with hematite being the predominant iron oxide identified.
The characteristic iron absorption near ~670 nm is absent in all spectra. However, all of them show a second diagnostic absorption feature ranging from 852 nm to 890 nm, which strongly indicates the presence of Hematite.
The spectra from sample 3 exhibit very uniform spectral behavior and low reflectance for iron diagnostic features. This may suggest that the sample is homogeneous and contains a low iron content.
5. Discussion
5.1. BR
We observed that the higher the spatial resolution, the greater the sensitivity in identifying pixels in the higher classes (15 and 16). Although ASTER and Landsat 9 identified pixels in medium-value classes (class 13) and high-value classes (class 14), these pixels were highly concentrated, forming large clusters that were not intuitive for prospectivity analysis. PS stands out overwhelmingly compared to the other satellites in detecting maximum-value pixels (class 16), the most important class for identifying iron oxides, highlighting its great potential for prospecting studies.
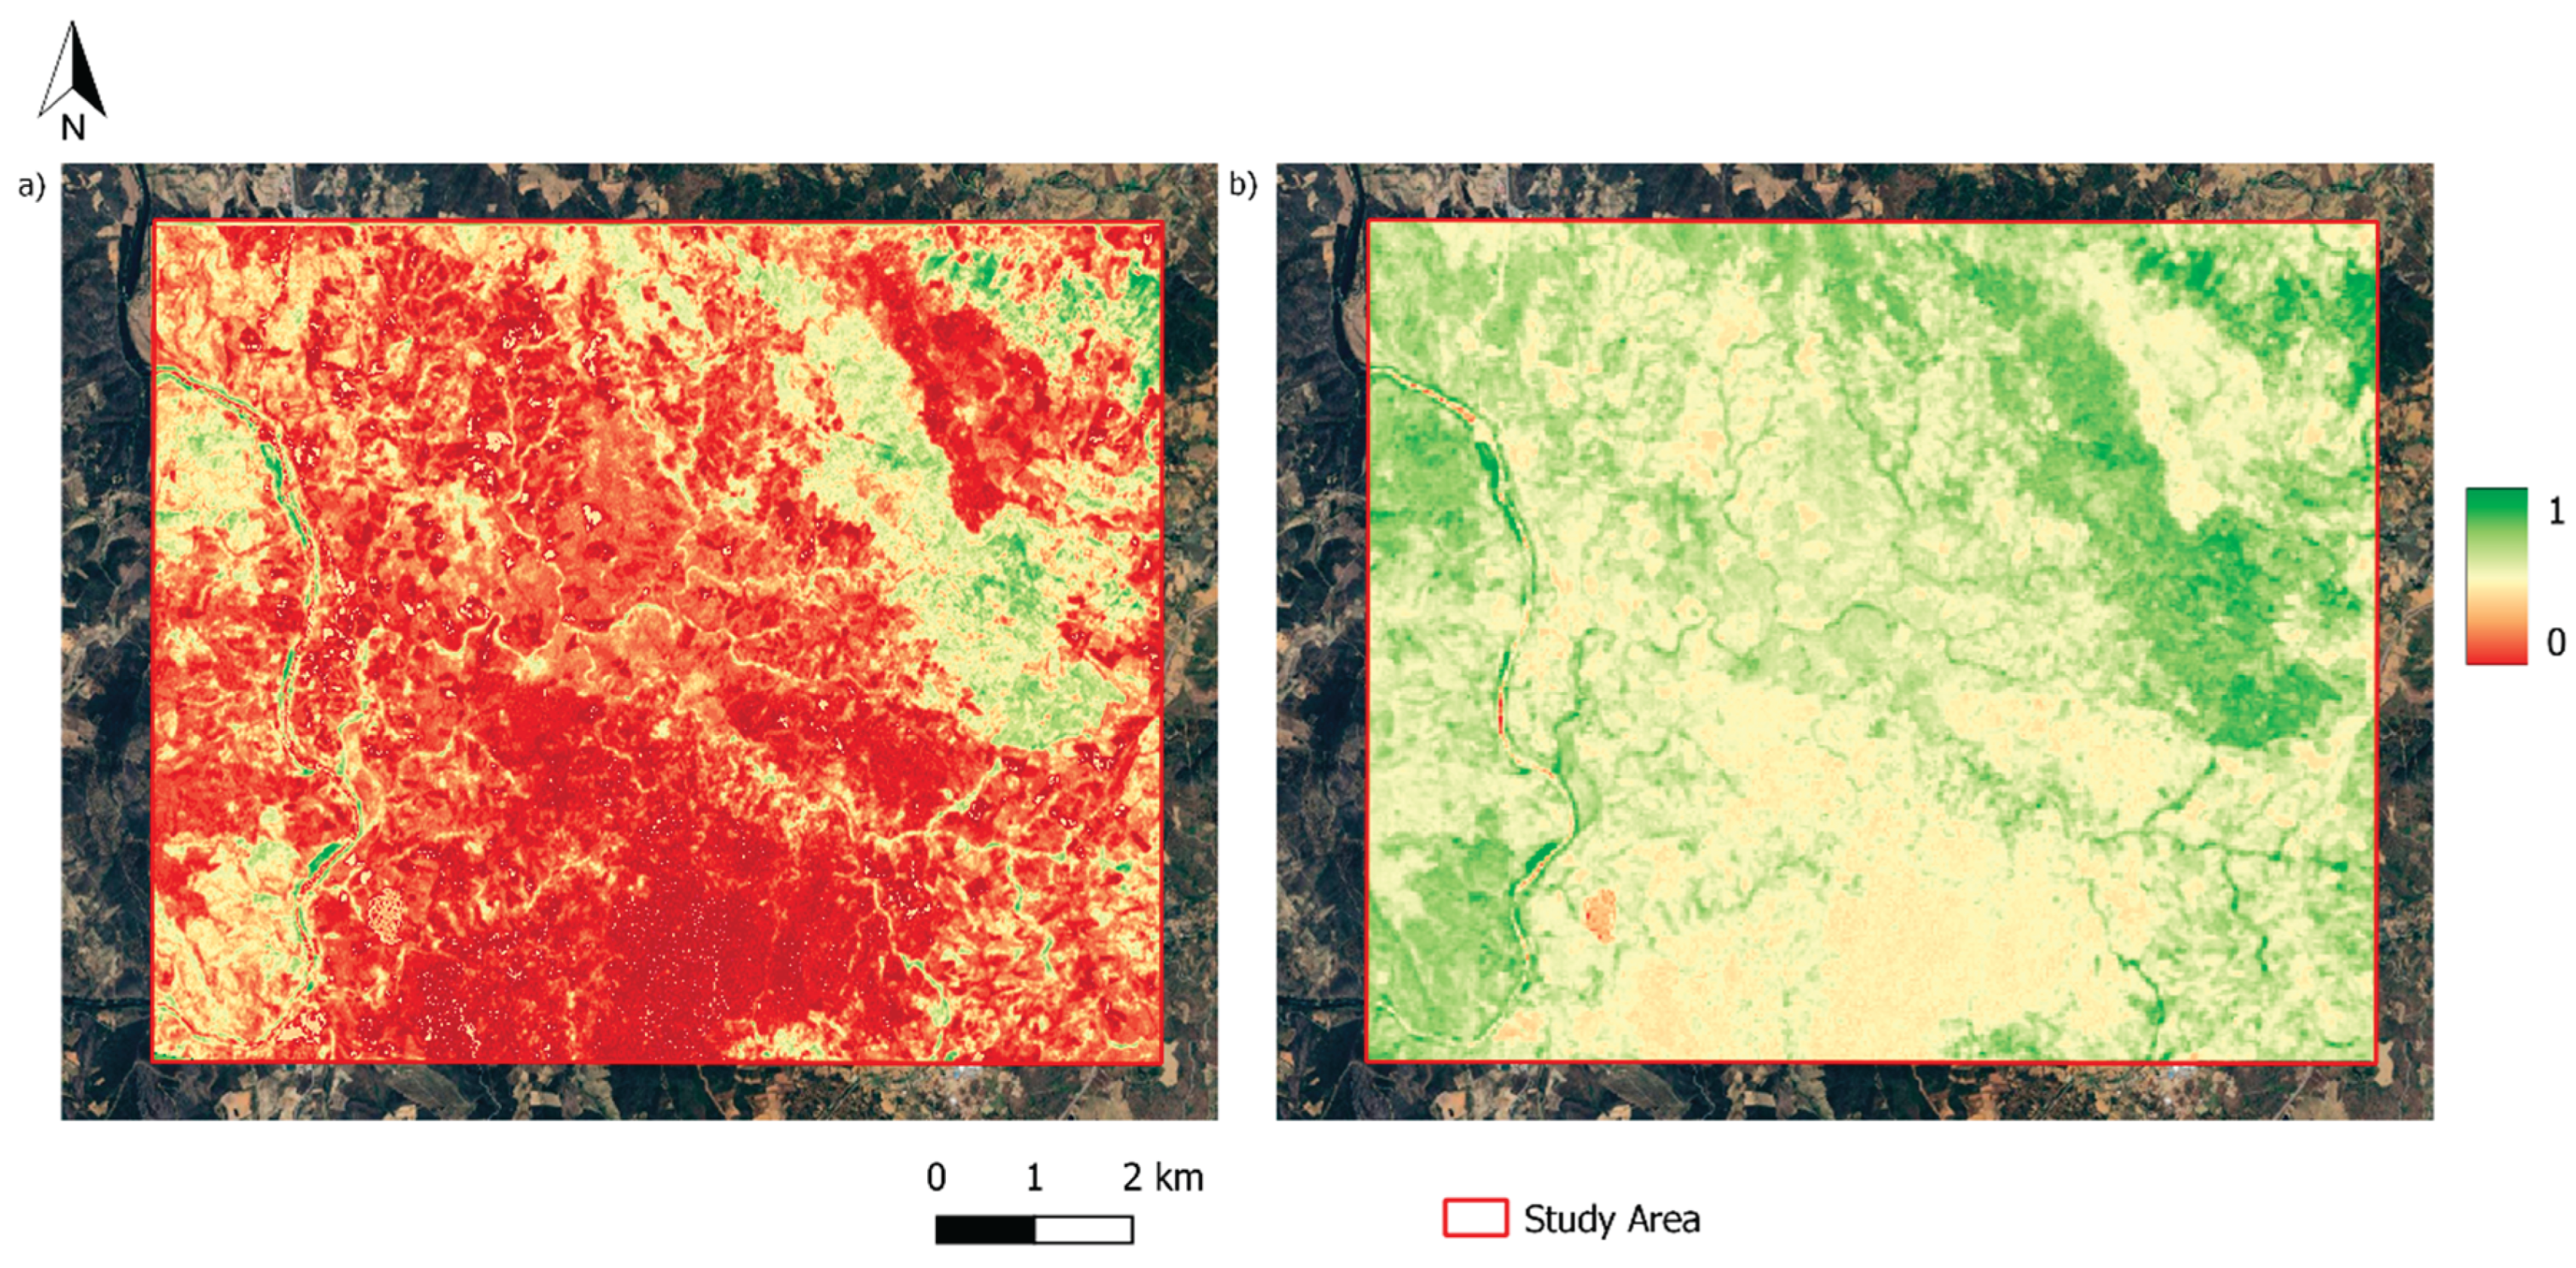
False positives related to non-vegetated areas were primarily observed in the BR 2/1 of ASTER, which misclassified extensive regions with sparse vegetation as class 14. Among all satellites, ASTER was the only one that consistently confused vegetated areas with areas of interest. When analyzing the NDVI results (Figure A3, Appendix A), we observed that ASTER detected significantly less vegetation, especially in the central region of the image. By comparing the NDVI with a true-color image from the same year on Google Earth, we confirmed that this area is predominantly covered by sparse vegetation, which was not correctly identified by ASTER's NDVI. Comparative studies have shown that ASTER's NDVI tends to yield lower values compared to other sensors[40]. Although similar band ratios were applied to other satellites, they did not show the same level of misclassification, suggesting that ASTER's spectral response in this configuration is less effective at distinguishing subtle vegetation signals from background materials such as iron oxides.
Landsat 9 also presented false positives with vegetation but in medium-value classes (12 and 13), which did not significantly affect the analysis compared to ASTER. PS and Sentinel-2 showed no false positives with vegetation, as in both cases, vegetation was identified with low values, ensuring greater reliability in detecting iron oxide occurrences.
5.2. ROIs
Test 2 identified more zones of interest than Test 1. However, upon analyzing the results, we can observe that this higher number of ROIs in Test 2 was primarily identified by pixels in classes 12 and 13. In contrast, Test 1 contains more pixels in the higher classes (14, 15, and 16). This suggests that PS influenced the fuzzification process, reducing the number of pixels representing iron oxides with lower values and increasing the number of pixels identified with higher values. This effect, as seen in Figure 5c,d, is the formation of well-defined and restricted areas of interest, allowing for a more objective and effective field analysis.
For example, in ROI 3 (Figure 5a), there is a concentration of high-value pixels (classes 15 and 16) in the southwestern corner of the ROI. In ROI 4 (Figure 5d), the high-value pixels (classes 15 and 16) are concentrated in the center of the ROI. The clusters observed in Figure 5 allow the field validation team to directly target locations with a higher probability of iron oxide occurrences.
Conversely, Test 2 identified ROIs 1 (Figure 6a), 2 (Figure 6b), 3 (Figure 6c), and 5 (Figure 6e), with clusters predominantly composed of class 12 and 13 pixels, which hinders a more direct approach and requires a broader area to be analyzed for field validation compared to Test 1. However, Test 2 yielded good results for ROI 4 (Figure 6d).
Overall, although the fuzzification process with PS identified fewer ROIs, this is not necessarily a negative outcome, as the results indicate that PS influenced the detection of a higher number of pixels with elevated values, which are more accurate for iron oxide identification. This demonstrates that the high spatial resolution of PS enhances sensitivity in detecting areas of interest, possibly leading to fewer false positives.
5.3. Relative Comparison (Ratio Between BRs)
The PS result was closer to Sentinel-2 than to the other satellites when considering the entire image. Although the other satellites also showed positive results for the analysis, indicating agreement, the ratio between BR-PS and BR-Sentinel-2 was the only one to achieve significant values of absolute concordance. This is most likely due to their higher similarity in spatial resolution compared to the other satellites. When analyzing the individual BR results (Table 3), we observed that both satellites identified very similar proportions of iron oxides, which explains why the ratio result was so positive.
The BR-PS / BR-ASTER and BR-PS / BR-Landsat 9 ratios showed similar levels of disagreement. However, the ratio with BR-ASTER exhibited slightly higher disagreement and fewer positive values than the ratio with Landsat 9, which was unexpected given its higher spatial resolution (15m) compared to Landsat 9 (30m).
This may be due to the fact that BR-ASTER identified significantly more pixels in class 14 than the other satellites, and Figure 4 (i), shows that many of these pixels correspond to regions with sparse vegetation. Although this issue could be resolved by applying a vegetation mask, this approach was deliberately avoided to assess the potential false positives that the ratios might produce. By not excluding vegetation pixels beforehand, it was possible to analyze the extent to which the spectral signal of vegetation could influence the results. This analysis provides valuable insights into the limitations and reliability of the method when applied to areas with significant vegetation cover.
The ratio with Landsat 9 showed high levels of disagreement, with no cases of total agreement. However, compared to ASTER, it had more positive values and slightly lower disagreement. Some false positives involving vegetation were observed, particularly in class 12, but were less critical than those found with ASTER.
When analyzing the ratio maps across the entire study area, it becomes evident that the PS results are much more like those of Sentinel-2 and ASTER. However, it is crucial to consider that differences in spatial resolution may have a significant impact, contributing to the higher levels of disagreement between PS and the results from ASTER and Landsat 9.
Despite this, no anomalous values were observed, indicating that the discrepancies are primarily related to differences in spatial resolution rather than inconsistencies in detecting iron oxides.
When analyzing only the areas of interest, a stronger relationship emerges between the level of result correspondence and the spatial resolution of the satellites. The data suggest that as spatial resolution decreases, non-correspondence increases. Sentinel-2 (10 m) shows the highest agreement with PS (3 m), followed by ASTER (15 m), and finally, Landsat 9 (30 m), which has the lowest correspondence. This confirms that the further a satellite's spatial resolution deviates from PS, the more different the results become due to increased pixel aggregation and spectral mixing.
Despite ASTER's spatial lower resolution than Sentinel-2, its correspondence with PS significantly improves when focusing only on the areas of interest. This contrasts with the full-image analysis, where ASTER showed the lowest similarity with PS. A key factor contributing to this improvement is the absence of vegetation cover in the selected areas, which reduces spectral noise and potential misclassification.
Landsat 9, with its 30 m of spatial resolution, shows the lowest agreement level with PS. Its higher percentage of non-correspondence may be attributed to the larger pixel size, which results in mixed spectral signals and a loss of finer details in iron oxide detection. Additionally, the fact that Landsat 9 consistently identifies a greater proportion of iron oxides compared to PS suggests potential overestimation due to its broader spectral bands and coarser resolution.
While Sentinel-2 is the most comparable to PS, ASTER performs better in specific conditions, particularly in areas with minimal vegetation. On the other hand, Landsat 9's lower agreement underscores its limitations for fine-scale iron oxide mapping but may still be useful for broader regional assessments.
Upon analyzing the spectra of the field-collected samples, all exhibit spectral characteristics marked by a prominent diagnostic iron absorption feature, indicating the predominance of hematite in the study area. The soil sample from ROI 3 displays a comparatively weaker spectral response associated with iron oxides. This location was identified in both Fuzzification Tests 1 and 2, indicating consistent detection across all satellite datasets. However, before classifying this point as a false positive, a more detailed analysis of rock samples is planned for future work.
The analysis of the field samples confirms the effectiveness of the proposed method in accurately delineating zones enriched in iron oxides.
6. Conclusions
This study tests the effectiveness of PS in mapping iron oxides in Mirandela, emphasizing its high spatial resolution as a key factor in accurately detecting mineral targets. The results demonstrate that PS has the same capability to identify Fe³⁺ iron oxides as Sentinel-2, ASTER, and Landsat 9; however, its higher spatial resolution allows for more precise identification and analysis of potential points of interest. Despite its spectral limitations, notably the absence of SWIR bands, the proposed methodology, based on spectral analyses and band ratios (BR), proved robust for mineral discrimination. When discussing potential areas of interest, Sentinel-2 exhibited the highest agreement with PS among the compared sensors. At the same time, ASTER and Landsat 9, due to their lower spatial resolution, showed a lower degree of concordance. However, the absence of anomalous values indicates that the results remain reliable and consistent across different sensors. As a practical contribution, this study reinforces the potential of PS for mineral exploration, providing a reliable method for identifying areas of interest. Future research will explore the integration of PS with sensors featuring SWIR bands (e.g., Sentinel-2) to mitigate spectral limitations, assess the methodology's applicability across diverse geological contexts, and incorporate advanced techniques such as machine learning to enhance mineral discrimination. In summary, this research validates the utility of PS in iron oxide mapping and lays the groundwork for further investigations into the combined use of multiple sensors in geosciences.
Author Contributions
For research articles with several authors, a short paragraph specifying their individual contributions must be provided. The following statements should be used "Conceptualization, DS. and ACT.; methodology, DS., JCF., ACT.; software, DS.; validation, DS., JCD., AL. and ACT.; formal analysis, DS.; investigation, DS.; resources, ACT.; data curation, DS.; writing—original draft preparation, DS.; writing—review and editing, DS., JCF.; visualization, DS.; supervision, ACT., AL., JCF..; project administration, ACT.; funding acquisition, ACT. All authors have read and agreed to the published version of the manuscript."
Funding
The work is funded by national funds through FCT – Fundação para a Ciência e Tecnologia, I.P., in the framework of the UID/04683: Instituto de Ciências da Terra (ICT). Douglas Santos was financially supported by Portuguese national funds through FCT (Grant: UI/BD/154412/2023).
Declaration of Generative AI in Scientific Writing
During the preparation of this work, the author(s) used Grammarly (2023 © Grammarly Inc.) and ChatGPT (ChatGPT 3.5) to improve the readability and flow of the writing. After using this tool/service, the author(s) reviewed and edited the content as needed and take(s) full responsibility for the content of the publication.
Conflicts of Interest
The authors declare the following financial interests/personal relationships which may be considered as potential competing interests: Douglas Santos reports financial support was provided by Institute of Earth Sciences. If there are other authors, they declare that they have no known competing financial interests or personal relationships that could have appeared to influence the work reported in this paper.
Appendix A
Figure A1.
Proportion of pixels of interest in relation to the total image. The data used for the calculations in Table 3 are derived from these proportions.
Figure A1.
Proportion of pixels of interest in relation to the total image. The data used for the calculations in Table 3 are derived from these proportions.
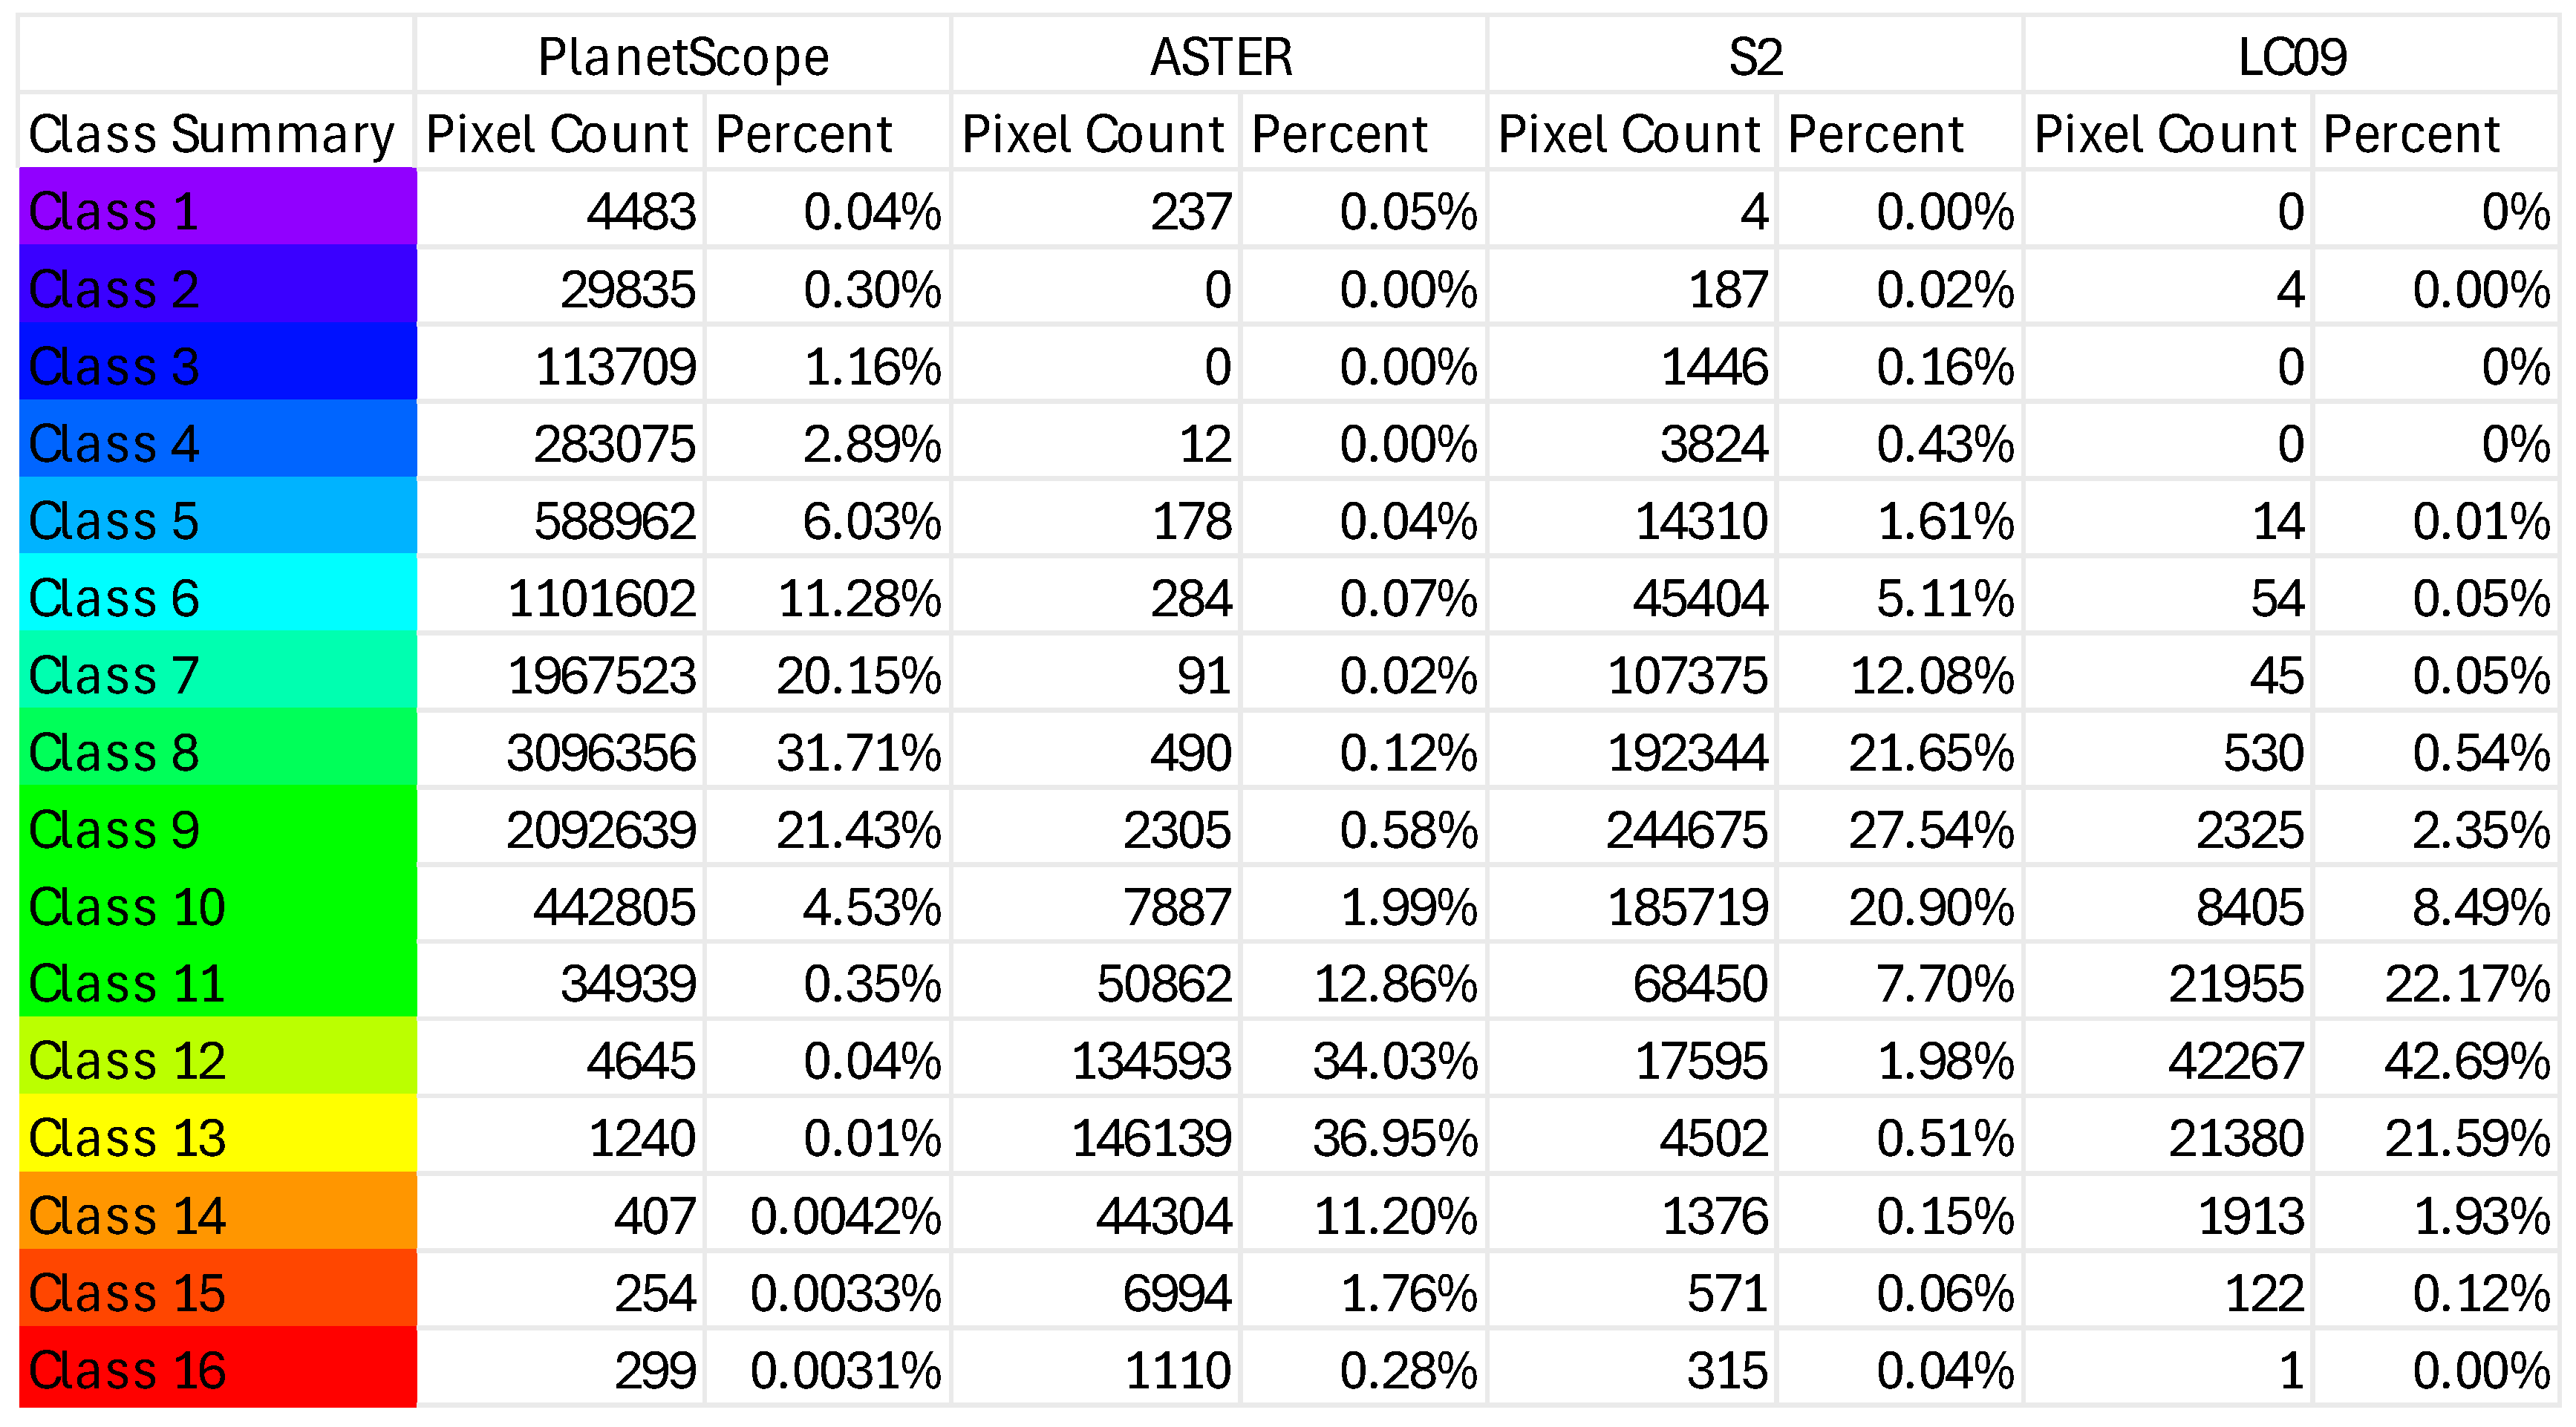
Figure A2.
ROIs location in the study area. Freixeda mine is highlighted by a red triangle, and an orange triangle highlights the Covo location.
Figure A2.
ROIs location in the study area. Freixeda mine is highlighted by a red triangle, and an orange triangle highlights the Covo location.
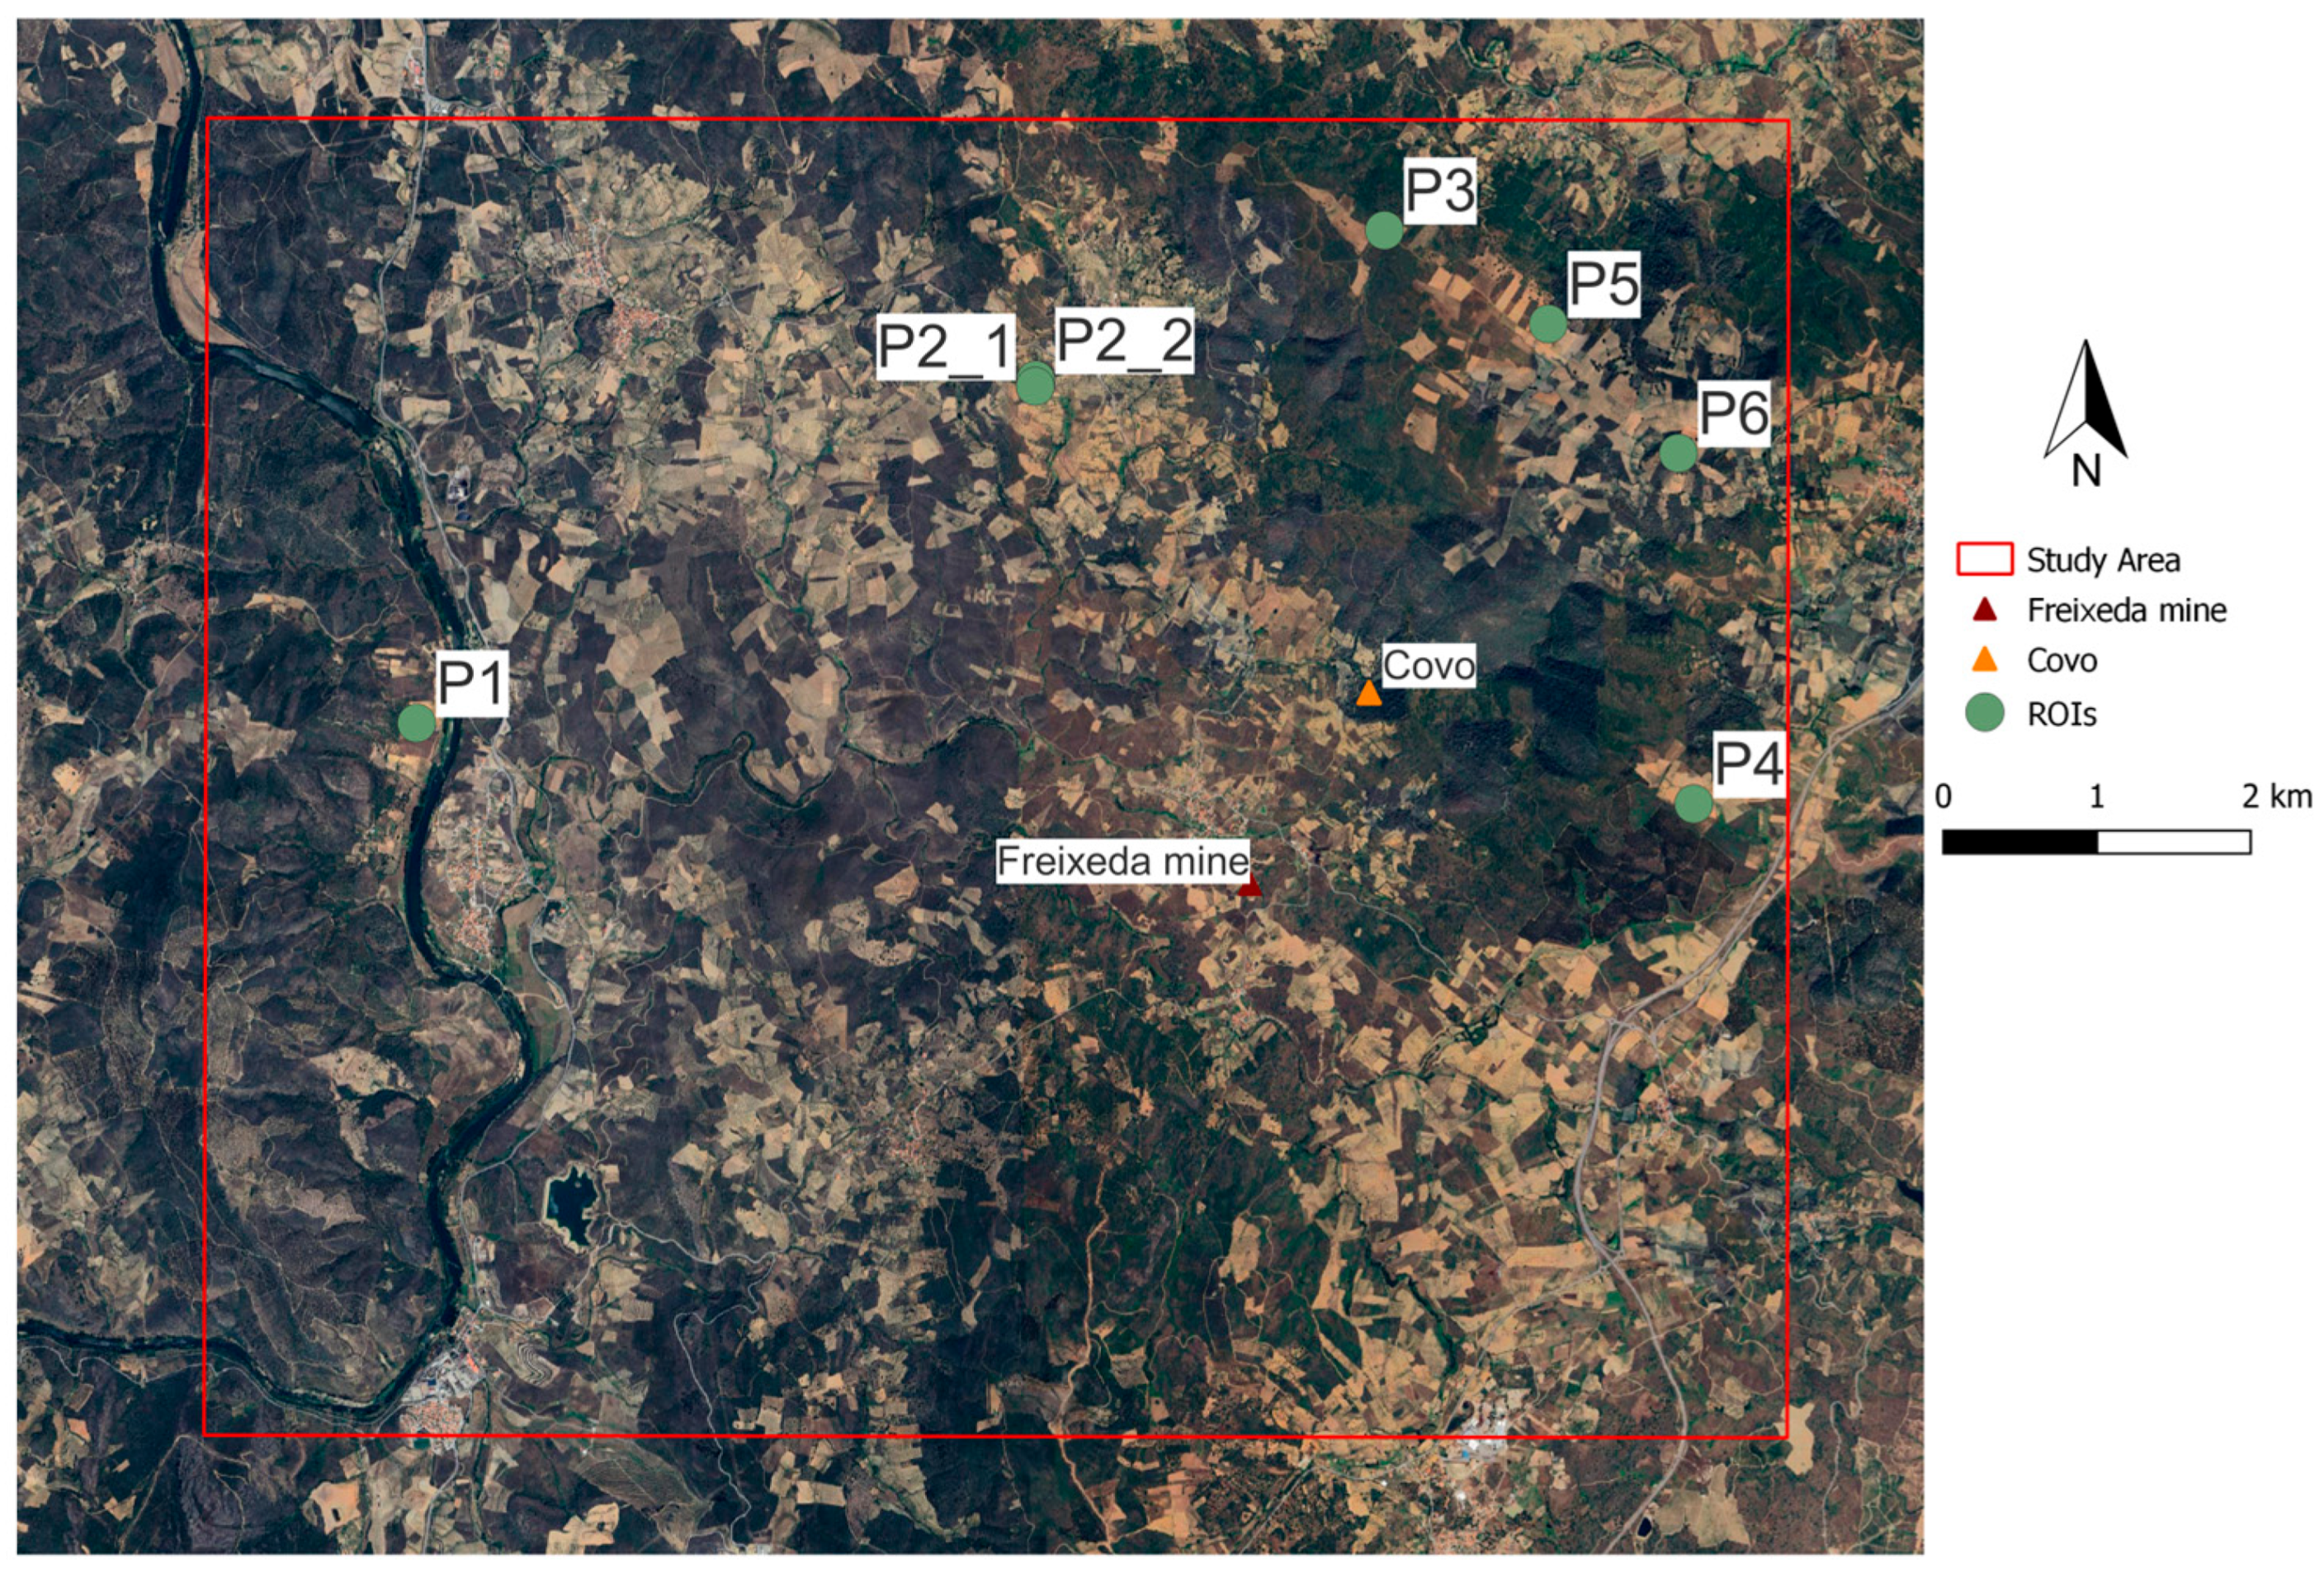
Figure A3.
ASTER NDVI (from September 14, 2003) for the entire area (a) and the Landsat 5 NDVI (from September 13, 2003) of the entire area (b). It is evident that the NDVI does not accurately identify areas where vegetation is present.
Figure A3.
ASTER NDVI (from September 14, 2003) for the entire area (a) and the Landsat 5 NDVI (from September 13, 2003) of the entire area (b). It is evident that the NDVI does not accurately identify areas where vegetation is present.
References
- Lewicka, E.; Guzik, K.; Galos, K. On the Possibilities of Critical Raw Materials Production from the EU’s Primary Sources. Resources 2021, 10. [Google Scholar] [CrossRef]
- Ali, H.F.; Abu El Ata, A.S.A.; Youssef, M.A.S.; Salem, S.M.; Ghoneim, S.M. A Newly-Developed Multi-Algorithm Integration Technique for Mapping the Potentially Mineralized Alteration Zones. Egypt. J. Remote Sens. Sp. Sci. 2023, 26, 691–711. [Google Scholar] [CrossRef]
- Algouti, A.; Algouti, A.; Farah, A. Mapping and Analysis of Structural Lineaments Using SRTM Radar Data and Landsat 8-OLI Images in Telouet-Tighza Area, Marrakech High Atlas - Morocco. Res. Sq. 2022, 1–21. [Google Scholar]
- Abrams, M.J.; Brown, D.; Lepley, L.; Sadowski, R. Remote Sensing for Porphyry Copper Deposits in Southern Arizona. Econ. Geol. 1983, 78, 591–604. [Google Scholar] [CrossRef]
- Kruse, F.A.; Lefkoff, A.B.; Boardman, J.W.; Heidebrecht, K.B.; Shapiro, A.T.; Barloon, P.J.; Goetz, A.F.H. The Spectral Image Processing System (SIPS)—Interactive Visualization and Analysis of Imaging Spectrometer Data. Remote Sens. Environ. 1993, 44, 145–163. [Google Scholar] [CrossRef]
- Sabins, F.F. Remote Sensing for Mineral Exploration. Ore Geol. Rev. 1999, 14, 157–183. [Google Scholar] [CrossRef]
- Santos, D.; Azzalini, A.; Mendes, A.; Cardoso-Fernandes, J.; Lima, A.; Müller, A.; Teodoro, A.C. Optimizing Exploration: Synergistic Approaches to Minimize False Positives in Pegmatite Prospecting – A Comprehensive Guide for Remote Sensing and Mineral Exploration. Ore Geol. Rev. 2024, 175, 106347. [Google Scholar] [CrossRef]
- Planet Lab PlanetScope Overview. Available online: https://developers.planet.com/docs/data/planetscope/ (accessed on 17 March 2025).
- Santos, D.; Cardoso-Fernandes, J.; Lima, A.; Müller, A.; Brönner, M.; Teodoro, A.C. Spectral Analysis to Improve Inputs to Random Forest and Other Boosted Ensemble Tree-Based Algorithms for Detecting NYF Pegmatites in Tysfjord, Norway. Remote Sens. 2022, 14, 3532. [Google Scholar] [CrossRef]
- Gemusse, U.; Cardoso-Fernandes, J.; Lima, A.; Teodoro, A. Identification of Pegmatites Zones in Muiane and Naipa (Mozambique) from Sentinel-2 Images, Using Band Combinations, Band Ratios, PCA and Supervised Classification. Remote Sens. Appl. Soc. Environ. 2023, 32, 101022. [Google Scholar] [CrossRef]
- Sekandari, M.; Masoumi, I.; Beiranvand Pour, A.; M Muslim, A.; Rahmani, O.; Hashim, M.; Zoheir, B.; Pradhan, B.; Misra, A.; Aminpour, S.M. Application of Landsat-8, Sentinel-2, ASTER and WorldView-3 Spectral Imagery for Exploration of Carbonate-Hosted Pb-Zn Deposits in the Central Iranian Terrane (CIT). Remote Sens. 2020, 12. [Google Scholar] [CrossRef]
- Chirico, R.; Mondillo, N.; Laukamp, C.; Mormone, A.; Di Martire, D.; Novellino, A.; Balassone, G. Mapping Hydrothermal and Supergene Alteration Zones Associated with Carbonate-Hosted Zn-Pb Deposits by Using PRISMA Satellite Imagery Supported by Field-Based Hyperspectral Data, Mineralogical and Geochemical Analysis. Ore Geol. Rev. 2023, 152, 105244. [Google Scholar] [CrossRef]
- Pour, A.B.; Hashim, M. Hydrothermal Alteration Mapping from Landsat-8 Data, Sar Cheshmeh Copper Mining District, South-Eastern Islamic Republic of Iran. J. Taibah Univ. Sci. 2015, 9, 155–166. [Google Scholar] [CrossRef]
- Pazand, K.; Pazand, K. Identification of Hydrothermal Alteration Minerals for Exploring Porphyry Copper Deposit Using ASTER Data: A Case Study of Varzaghan Area, NW Iran. Geol. Ecol. Landscapes 2022, 6, 217–223. [Google Scholar] [CrossRef]
- Naftali Hawu Hede, A.; Yahya Al Hakim, A.; Fakhri Khairo, D.; Putri Rahmadica, S. Mapping of Small-Scale Gold Deposits Using Sentinel-2 and DEMNAS in Cineam, Tasikmalaya, Indonesia. Int. Symp. Earth Sci. Technol. 2020. [Google Scholar]
- Wang, D.; Chen, J.; Dai, X. Extracting Geological and Alteration Information and Predicting Antimony Ore Based on Multisource Remote Sensing Data in Huangyangling, Xinjiang. Front. Earth Sci. 2024, 12, 1–23. [Google Scholar] [CrossRef]
- Rodriguez-Gomez, C.; Kereszturi, G.; Reeves, R.; Mead, S.; Pullanagari, R.; Rae, A.; Jeyakumar, P. Mapping Antimony Concentration over Geothermal Areas Using Hyperspectral and Thermal Remote Sensing. In Proceedings of the IGARSS 2020 - 2020 IEEE International Geoscience and Remote Sensing Symposium; 2020; pp. 1086–1089. [Google Scholar]
- Carvalho, M.; Cardoso-Fernandes, J.; Lima, A.; Teodoro, A.C. Convolutional Neural Networks Applied to Antimony Quantification via Soil Laboratory Reflectance Spectroscopy in Northern Portugal: Opportunities and Challenges. Remote Sens. 2024, 16. [Google Scholar] [CrossRef]
- Santos, D.; Cardoso-Fernandes, J.; Lima, A.; Teodoro, A.C. Application of Band Ratios to Map Hydrothermal Alteration Zones Related to Au-Sb Mineralization in Freixeda , Northern Portugal. 2024, 13197, 1–9. [Google Scholar] [CrossRef]
- Zhifang, Z.; Yujun, Z.; Qiuming, C.; Jianping, C. Extraction of Mineral Alteration Zone from ETM+ Data in Northwestern Yunnan, China. J. China Univ. Geosci. 2008, 19, 416–420. [Google Scholar] [CrossRef]
- ElGalladi, A.; Araffa, S.; Mekkawi, M.; Abd-AlHai, M. Exploring Mineralization Zones Using Remote Sensing and Aeromagnetic Data, West Allaqi Area, Eastern-Desert, Egypt. Egypt. J. Remote Sens. Sp. Sci. 2022, 25, 417–433. [Google Scholar] [CrossRef]
- Gopinathan, P.; S, P.; T, M.; Fadhil Al-Quraishi, A.M.; Singh, A.K.; Singh, P.K. Mapping of Ferric (Fe3+) and Ferrous (Fe2+) Iron Oxides Distribution Using Band Ratio Techniques with ASTER Data and Geochemistry of Kanjamalai and Godumalai, Tamil Nadu, South India. Remote Sens. Appl. Soc. Environ. 2020, 18, 100306. [Google Scholar] [CrossRef]
- Lima, A.; Teodoro, A.C.; Casimiro, J.P. Evaluation of Remote Sensing Data Potential in the Geological Exploration of Freixeda Area (Mirandela, Portugal): A Preliminary Study. Earth Resour. Environ. Remote Sensing/GIS Appl. V 2014, 9245, 92451I. [Google Scholar] [CrossRef]
- Montes, R.; Gomes, M.E.; Ferreira, A.; Ávila, P. Geochemistry of Soils and Waters from the Abandoned Freixeda Gold Mine, Northeast. 2008, 10, 136–137. [Google Scholar]
- Marques, J.R.M. da C. Caracterização Geológica e Metalogénica Do Campo Filoniano Da Freixeda, Faculdade de Ciencias da Universidade do Porto, 2020.
- Costa, M.R.; Ávila, P.; Ferreira, A.; Silva, E.F. “ Reliable Mine Water Technology ” Availability of Trace Elements in the Abandoned Freixeda Gold Mine Area, NE Portugal. Reliab. Mine Water Technol. Proc. Int. Mine Water Assoc. Annu. Conf. 2013, Vols I Ii 2013, 313–318. [Google Scholar]
- Almeida, A.; Noronha, F. Fluid Associated with W and Ag-Au Deposits of the Mirandela Area, NE Portugal : An Example of Peri-Granitic Zoning. Bull. Minéralogie 1988, 111, 331–341. [Google Scholar] [CrossRef]
- Planet Understanding PlanetScope Instruments. Available online: https://developers.planet.com/docs/apis/data/sensors/ (accessed on 2 October 2024).
- (ESA), E.S.A. User Guides: Sentinel-2.
- ASTER: Mission Available online: https://asterweb.jpl.nasa.gov/mission.asp.
- USGS Landsat 9 Available online: https://www.usgs.gov/landsat-missions/landsat-9.
- Cardoso-Fernandes, J.; Teodoro, A.C.; Santos, D.; de Almeida, C.; Lima, A. Spectral Library of European Pegmatites, Pegmatite Minerals and Pegmatite Host-Rocks – The Greenpeg Database 2023.
- Bernstein, L.S.; Jin, X.; Gregor, B.; Adler-Golden, S.M. Quick Atmospheric Correction Code: Algorithm Description and Recent Upgrades. Opt. Eng. 2012, 51, 111719. [Google Scholar] [CrossRef]
- Wolfe, J.D.; Black, S.R. Hyperspectral Analytics in ENVI. 2018.
- Baid, S.; Tabit, A.; Algouti, A.; Algouti, A.; Aboulfaraj, A.; Ezzahzi, S.; Kabili, S.; Elkhounaijiri, H. Integrating Geochemical Insights and Remote Sensing for Enhanced Identification of Hydrothermal Alterations in the Igoudrane Region, Anti-Atlas, Morocco. J. African Earth Sci. 2024, 218, 105368. [Google Scholar] [CrossRef]
- Zagajewski, B.; Kluczek, M.; Zdunek, K.B.; Holland, D. Sentinel-2 versus PlanetScope Images for Goldenrod Invasive Plant Species Mapping. Remote Sens. 2024, 16. [Google Scholar] [CrossRef]
- Clark, R.N.; King, T.V.V.; Klejwa, M.; Swayze, G.A.; Vergo, N. High Spectral Resolution Reflectance Spectroscopy of Minerals. J. Geophys. Res. 1990, 95. [Google Scholar] [CrossRef]
- Hunt, G.R.; Ashley, R.P. Spectra of Altered Rocks in the Visible and Near Infrared. Econ. Geol. Lancaster, Pa. 1979, 74, 1613–1629. [Google Scholar] [CrossRef]
- Hunt, G.R. SPECTRAL SIGNATURES OF PARTICULATE MINERALS IN THE VISIBLE AND NEAR INFRARED. Mol. Phys. 1977, 42, 501–513. [Google Scholar] [CrossRef]
- Xu, H.; Zhang, T. [Cross comparison of ASTER and Landsat ETM+ multispectral measurements for NDVI and SAVI vegetation indices]. Guang Pu Xue Yu Guang Pu Fen Xi 2011, 31, 1902–1907. [Google Scholar] [PubMed]
Figure 1.
Study area location. a) Study area location in Portugal. b) Study area location in the Bragança district. c) Geological map.
Figure 1.
Study area location. a) Study area location in Portugal. b) Study area location in the Bragança district. c) Geological map.
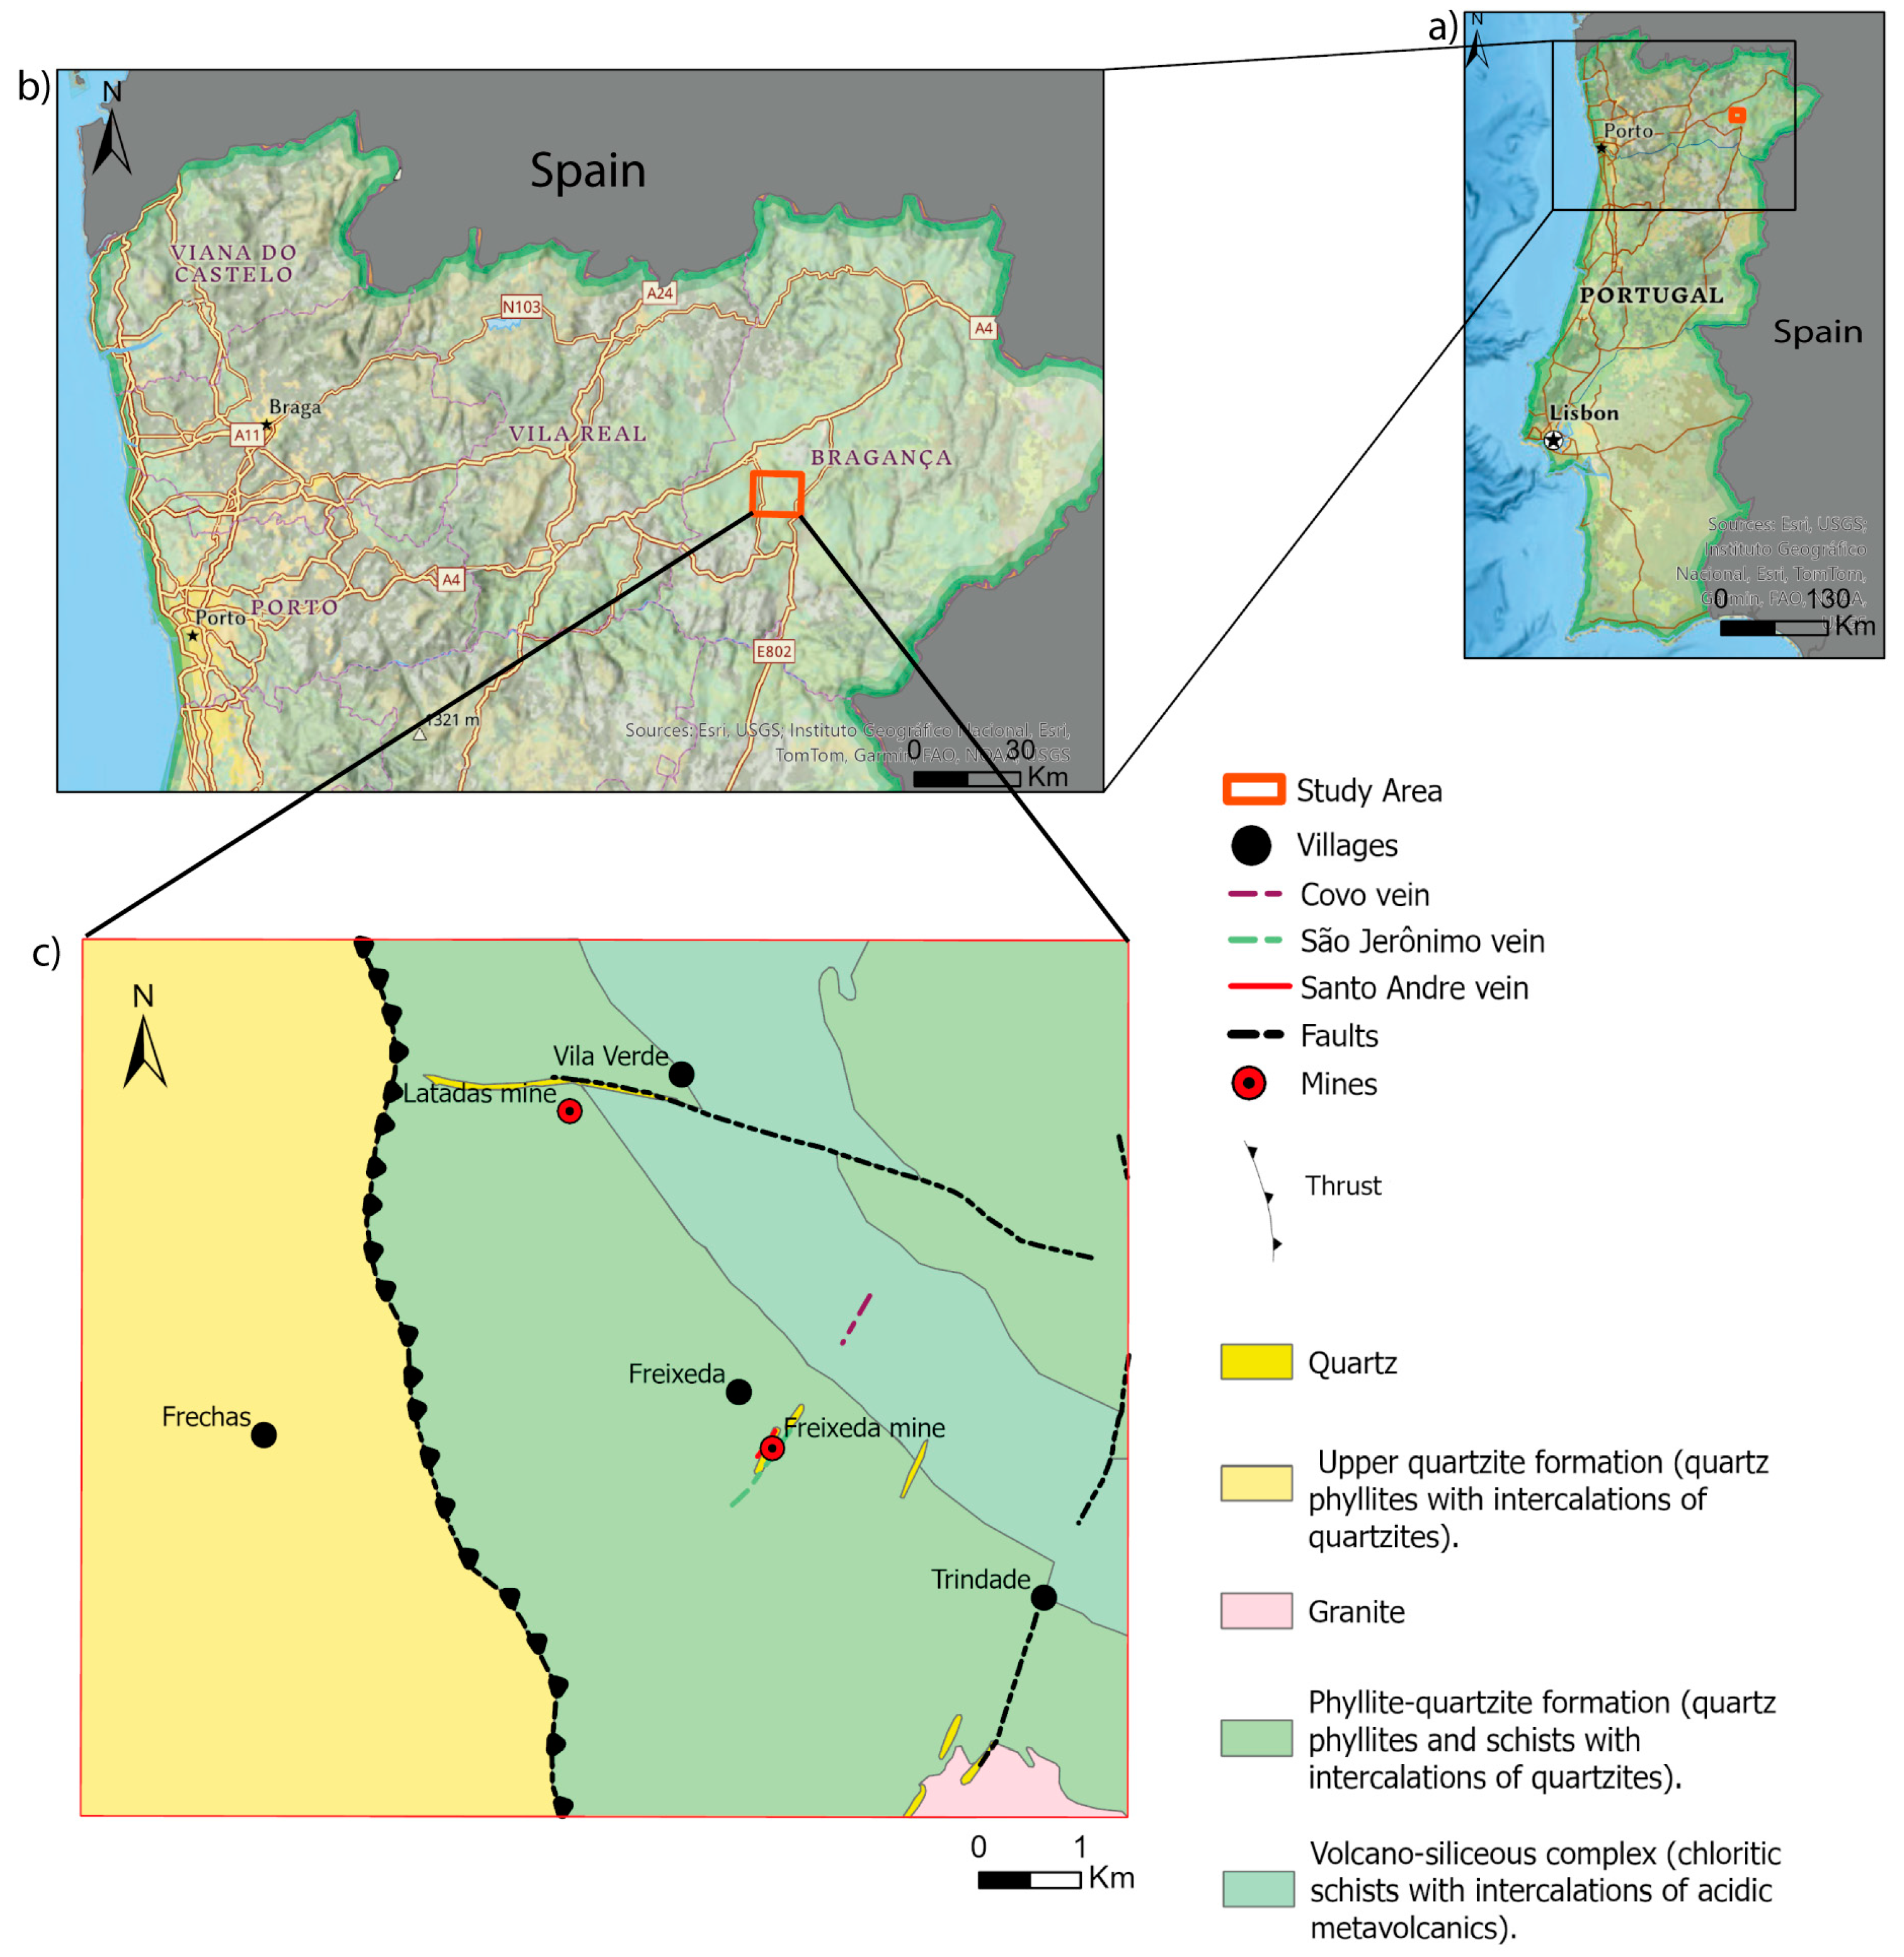
Figure 2.
Methodological workflow adopted in this study. The process is divided into two main stages: (1) spectral data acquisition and analysis and (2) satellite image processing, including band ratio calculations and relative comparison.
Figure 2.
Methodological workflow adopted in this study. The process is divided into two main stages: (1) spectral data acquisition and analysis and (2) satellite image processing, including band ratio calculations and relative comparison.
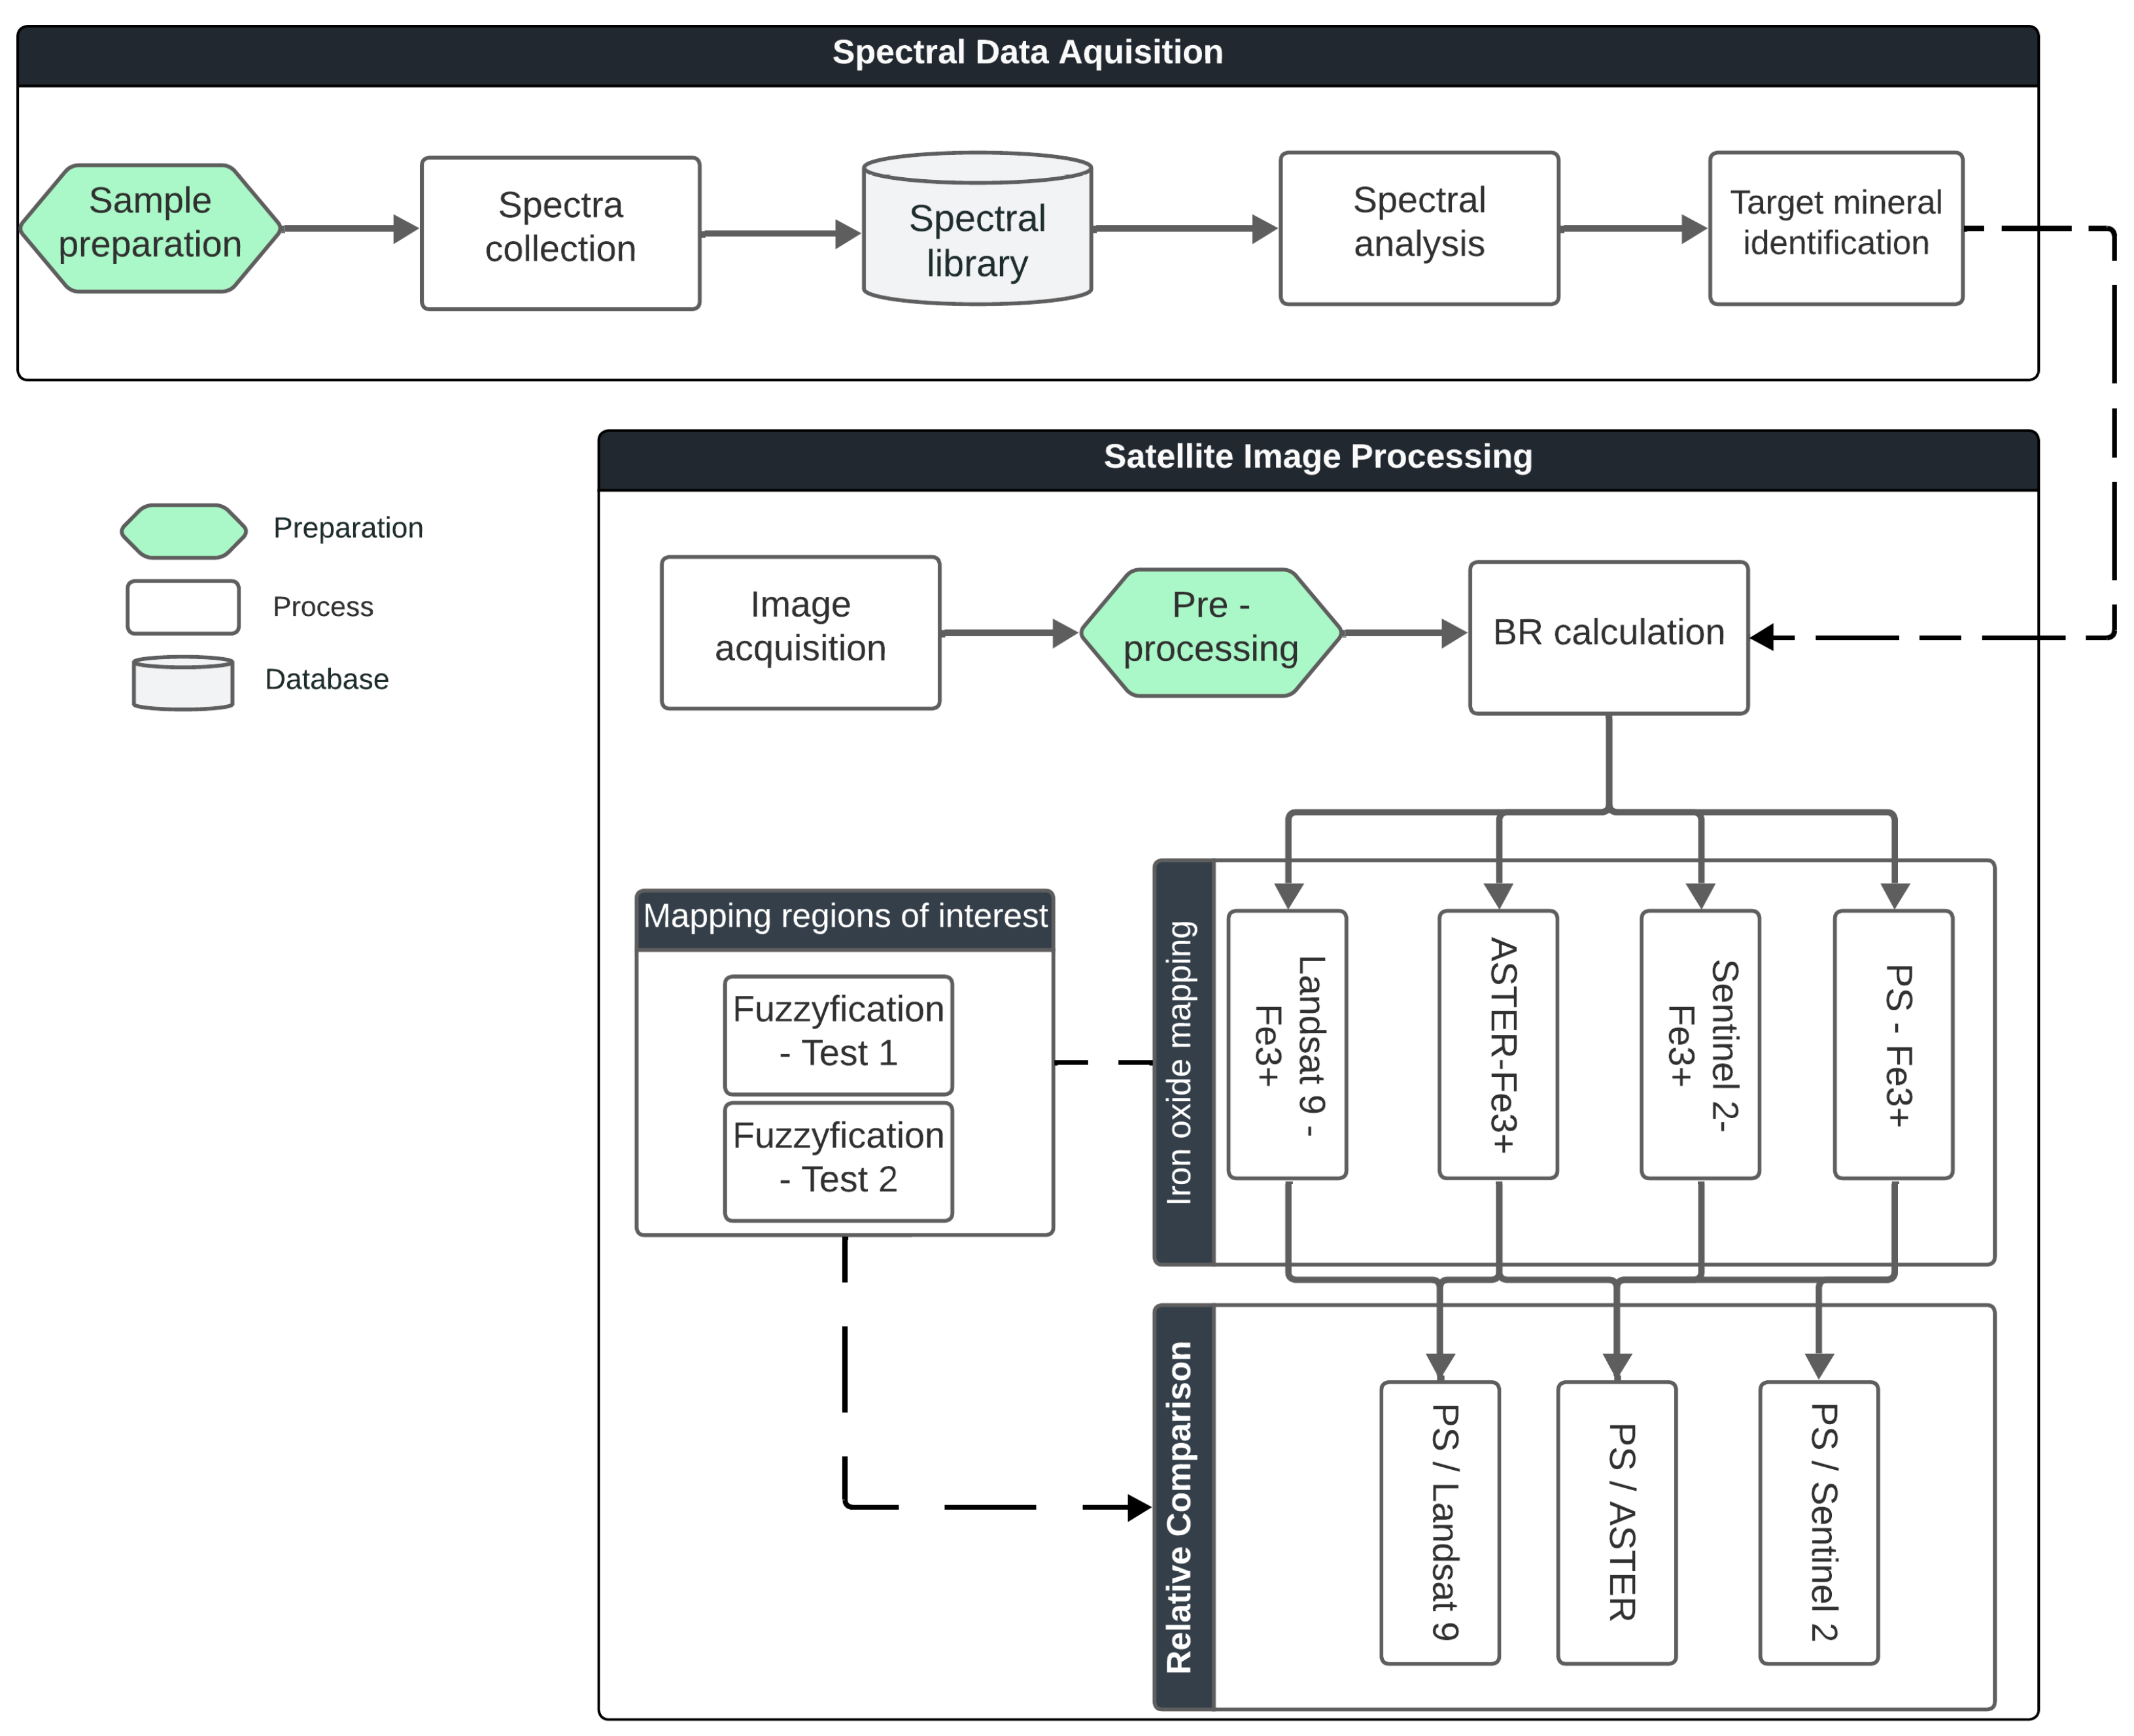
Figure 3.
Absorption features and reflectance peaks of Goethite and Hematite spectra.
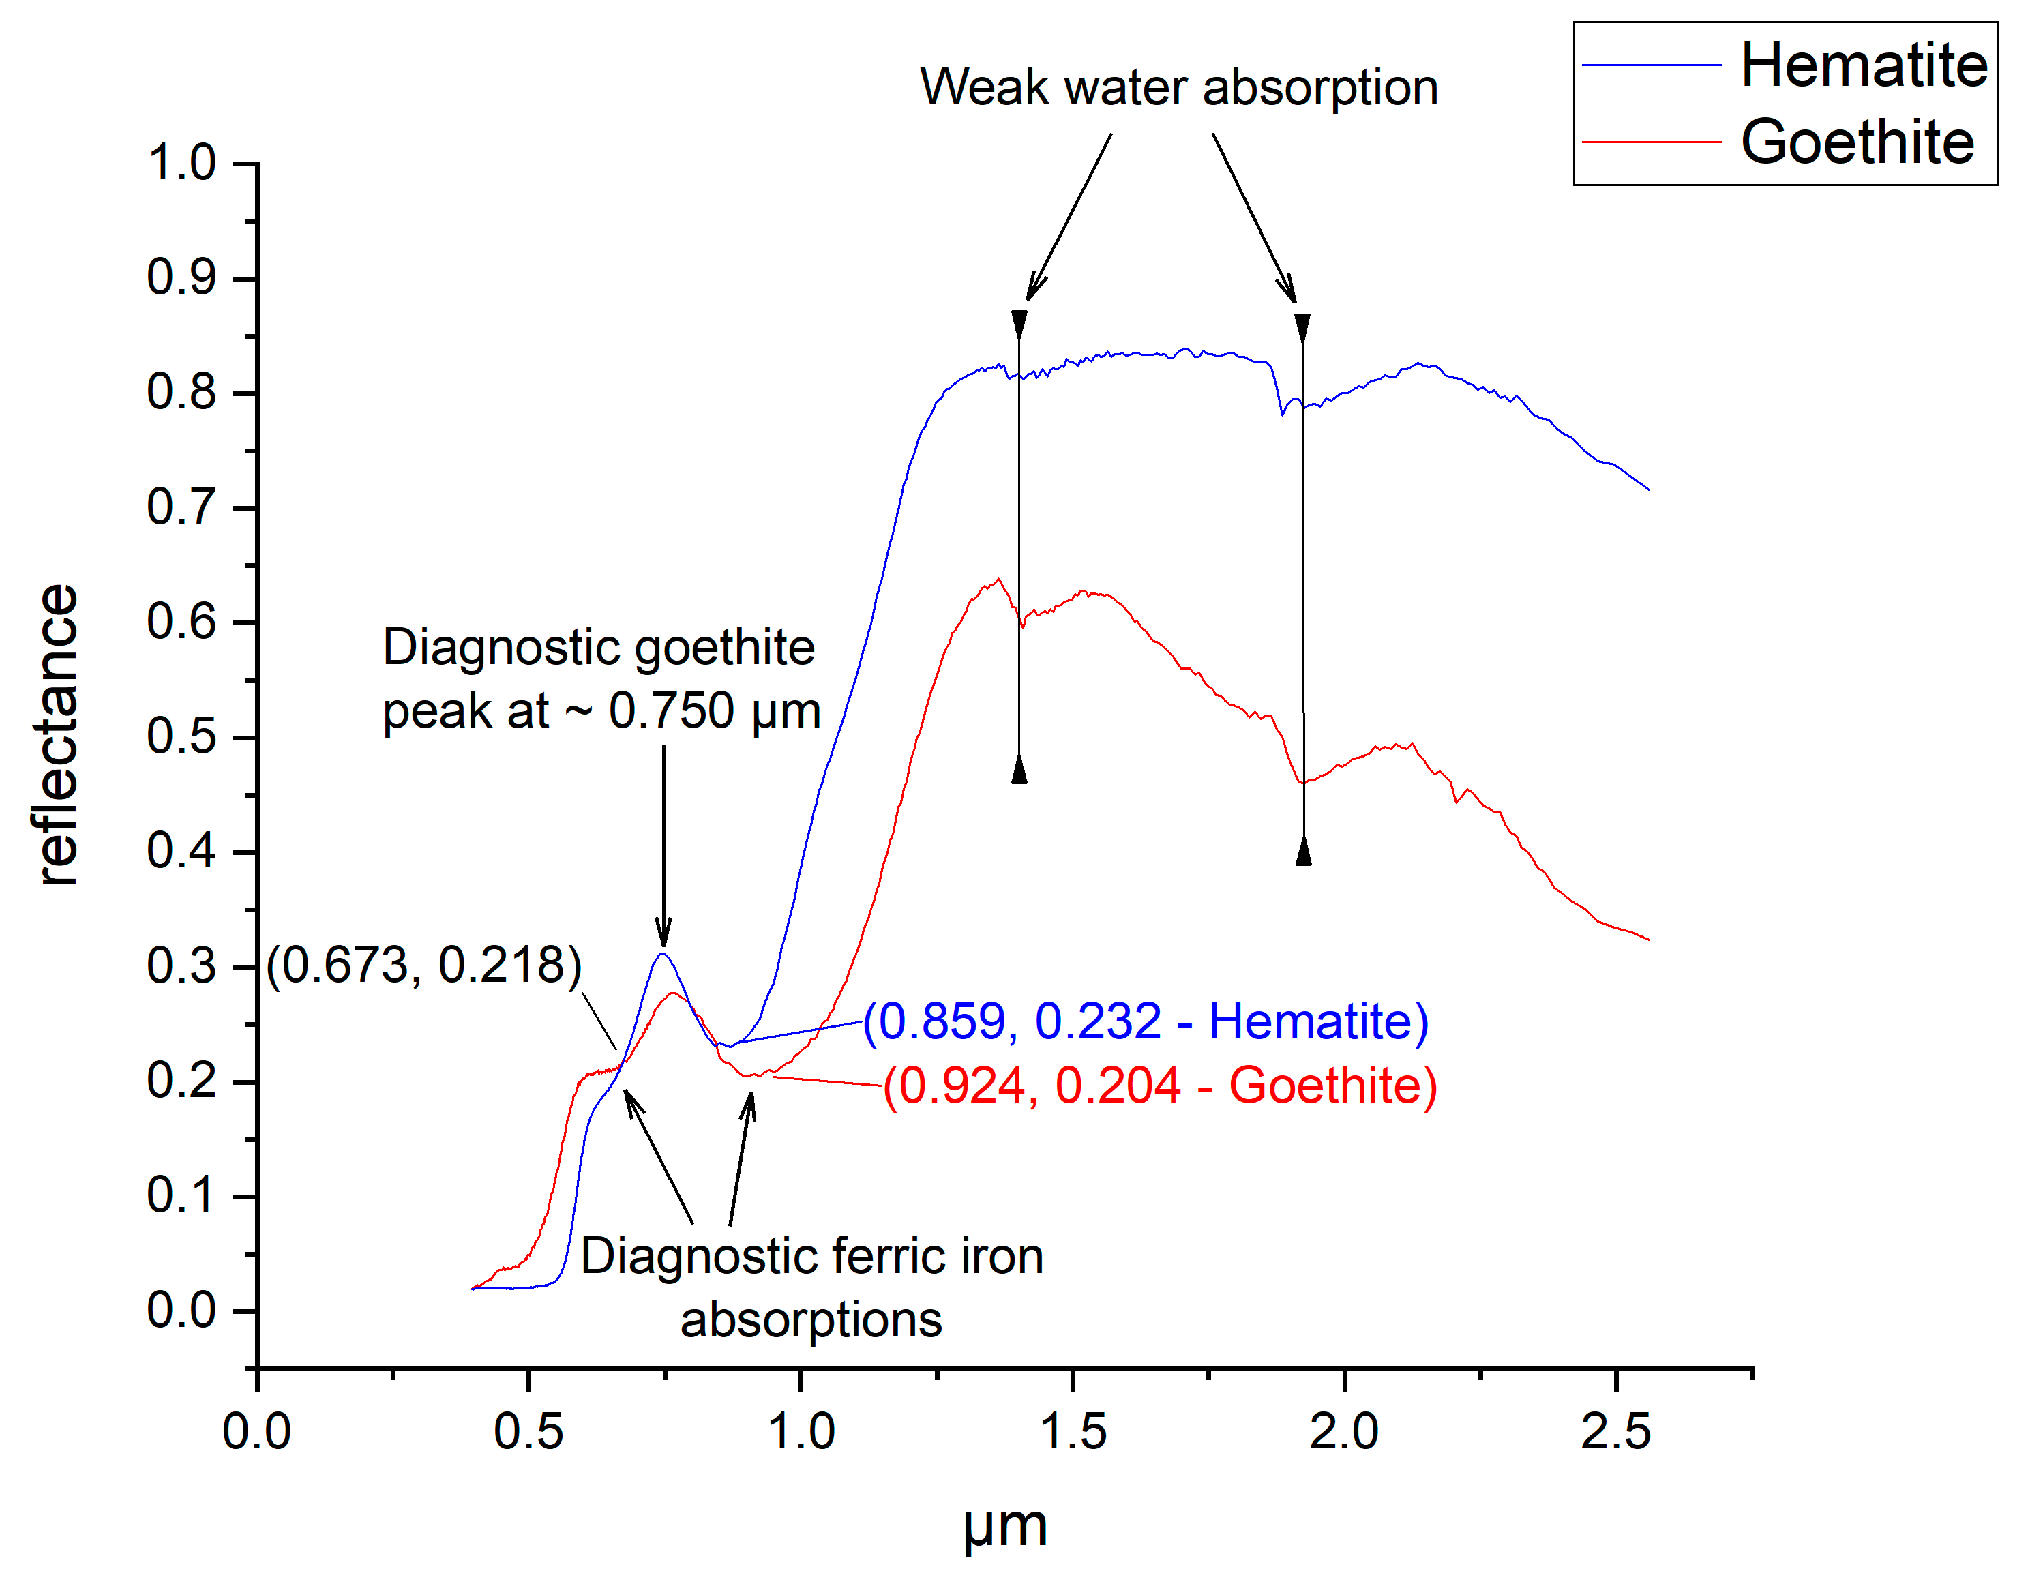
Figure 4.
Spatial distribution of pixels classified between classes 12 and 16, derived from band ratio (BR) analyses using PS, Sentinel-2, ASTER, and Landsat 9 imagery. These classes represent increasing probabilities of Fe³⁺ presence, with warmer colors indicating higher values. Subfigures illustrate the BR results and their corresponding color slice visualizations for each satellite: (a,b,c) BR map, color slice of BR, and NDVI for PS, (d,e,f) BR map, color slice of BR, and NDVI for Sentinel 2, (g,h,i) BR map, color slice of BR, and NDVI for ASTER, (j,k,l) BR map, color slice of BR, and NDVI for Landsat 9.
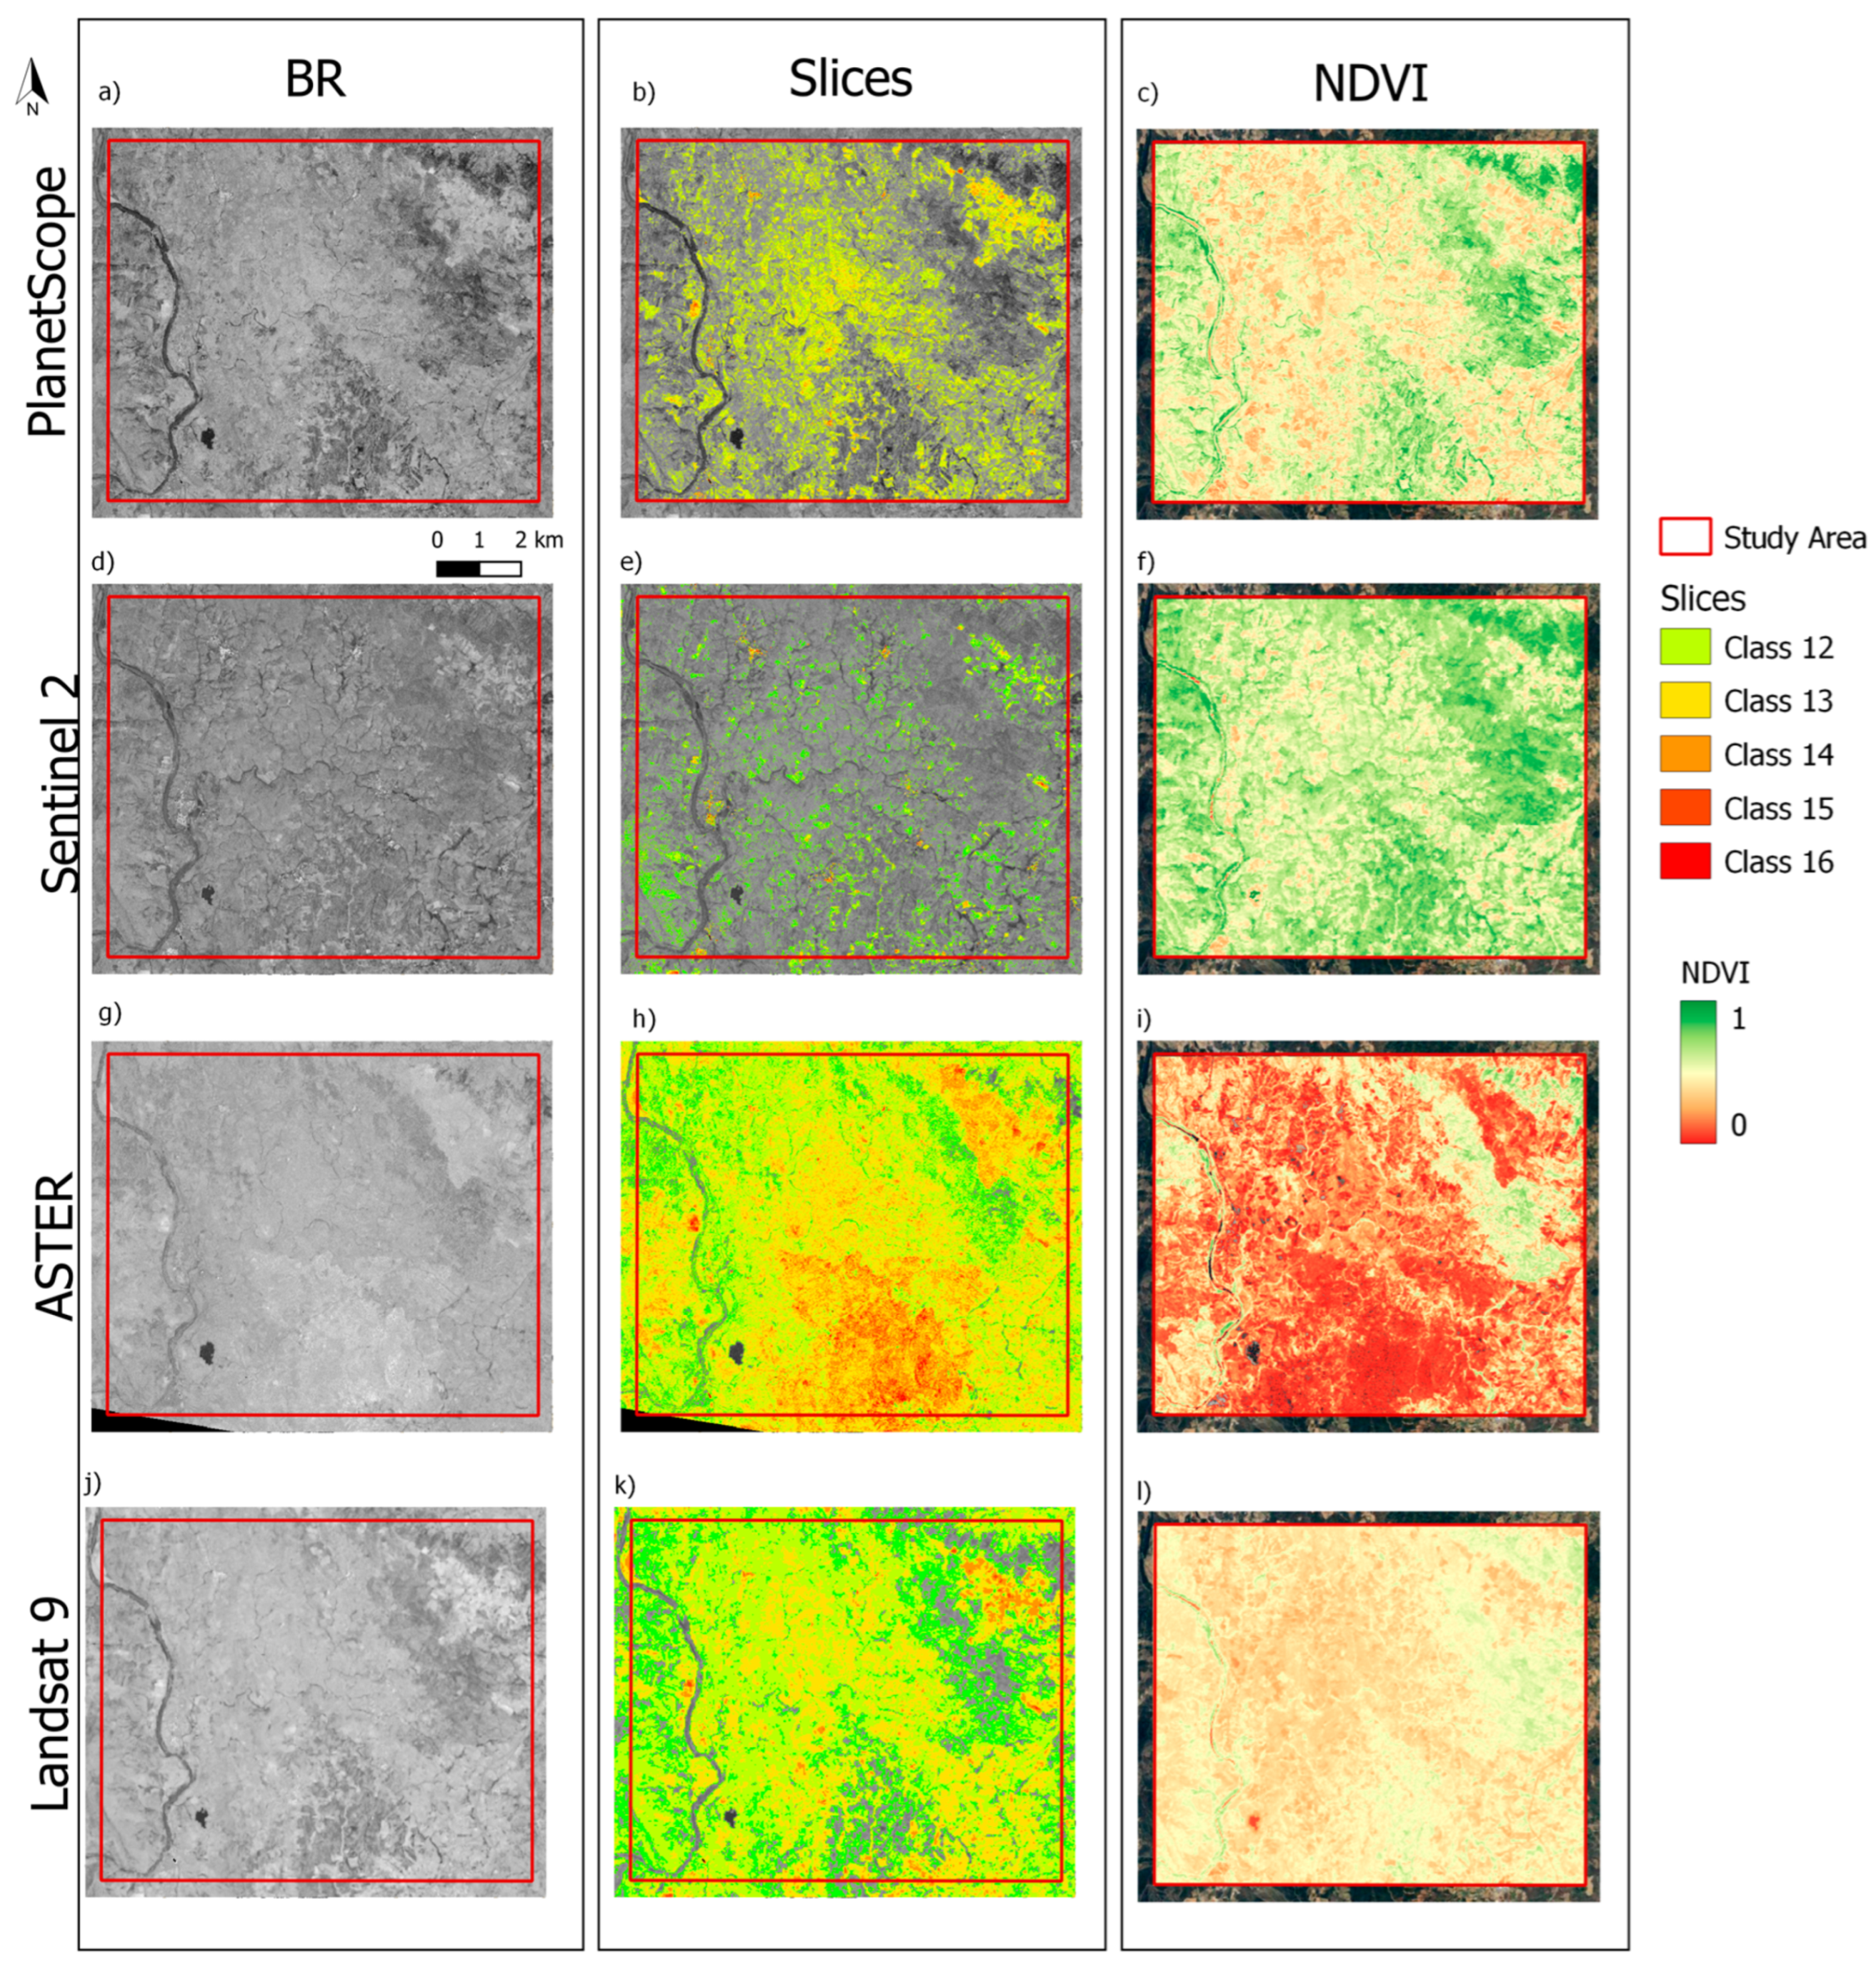
Figure 5.
Regions of Interest (ROIs) identified in Test 1 (using PS data).
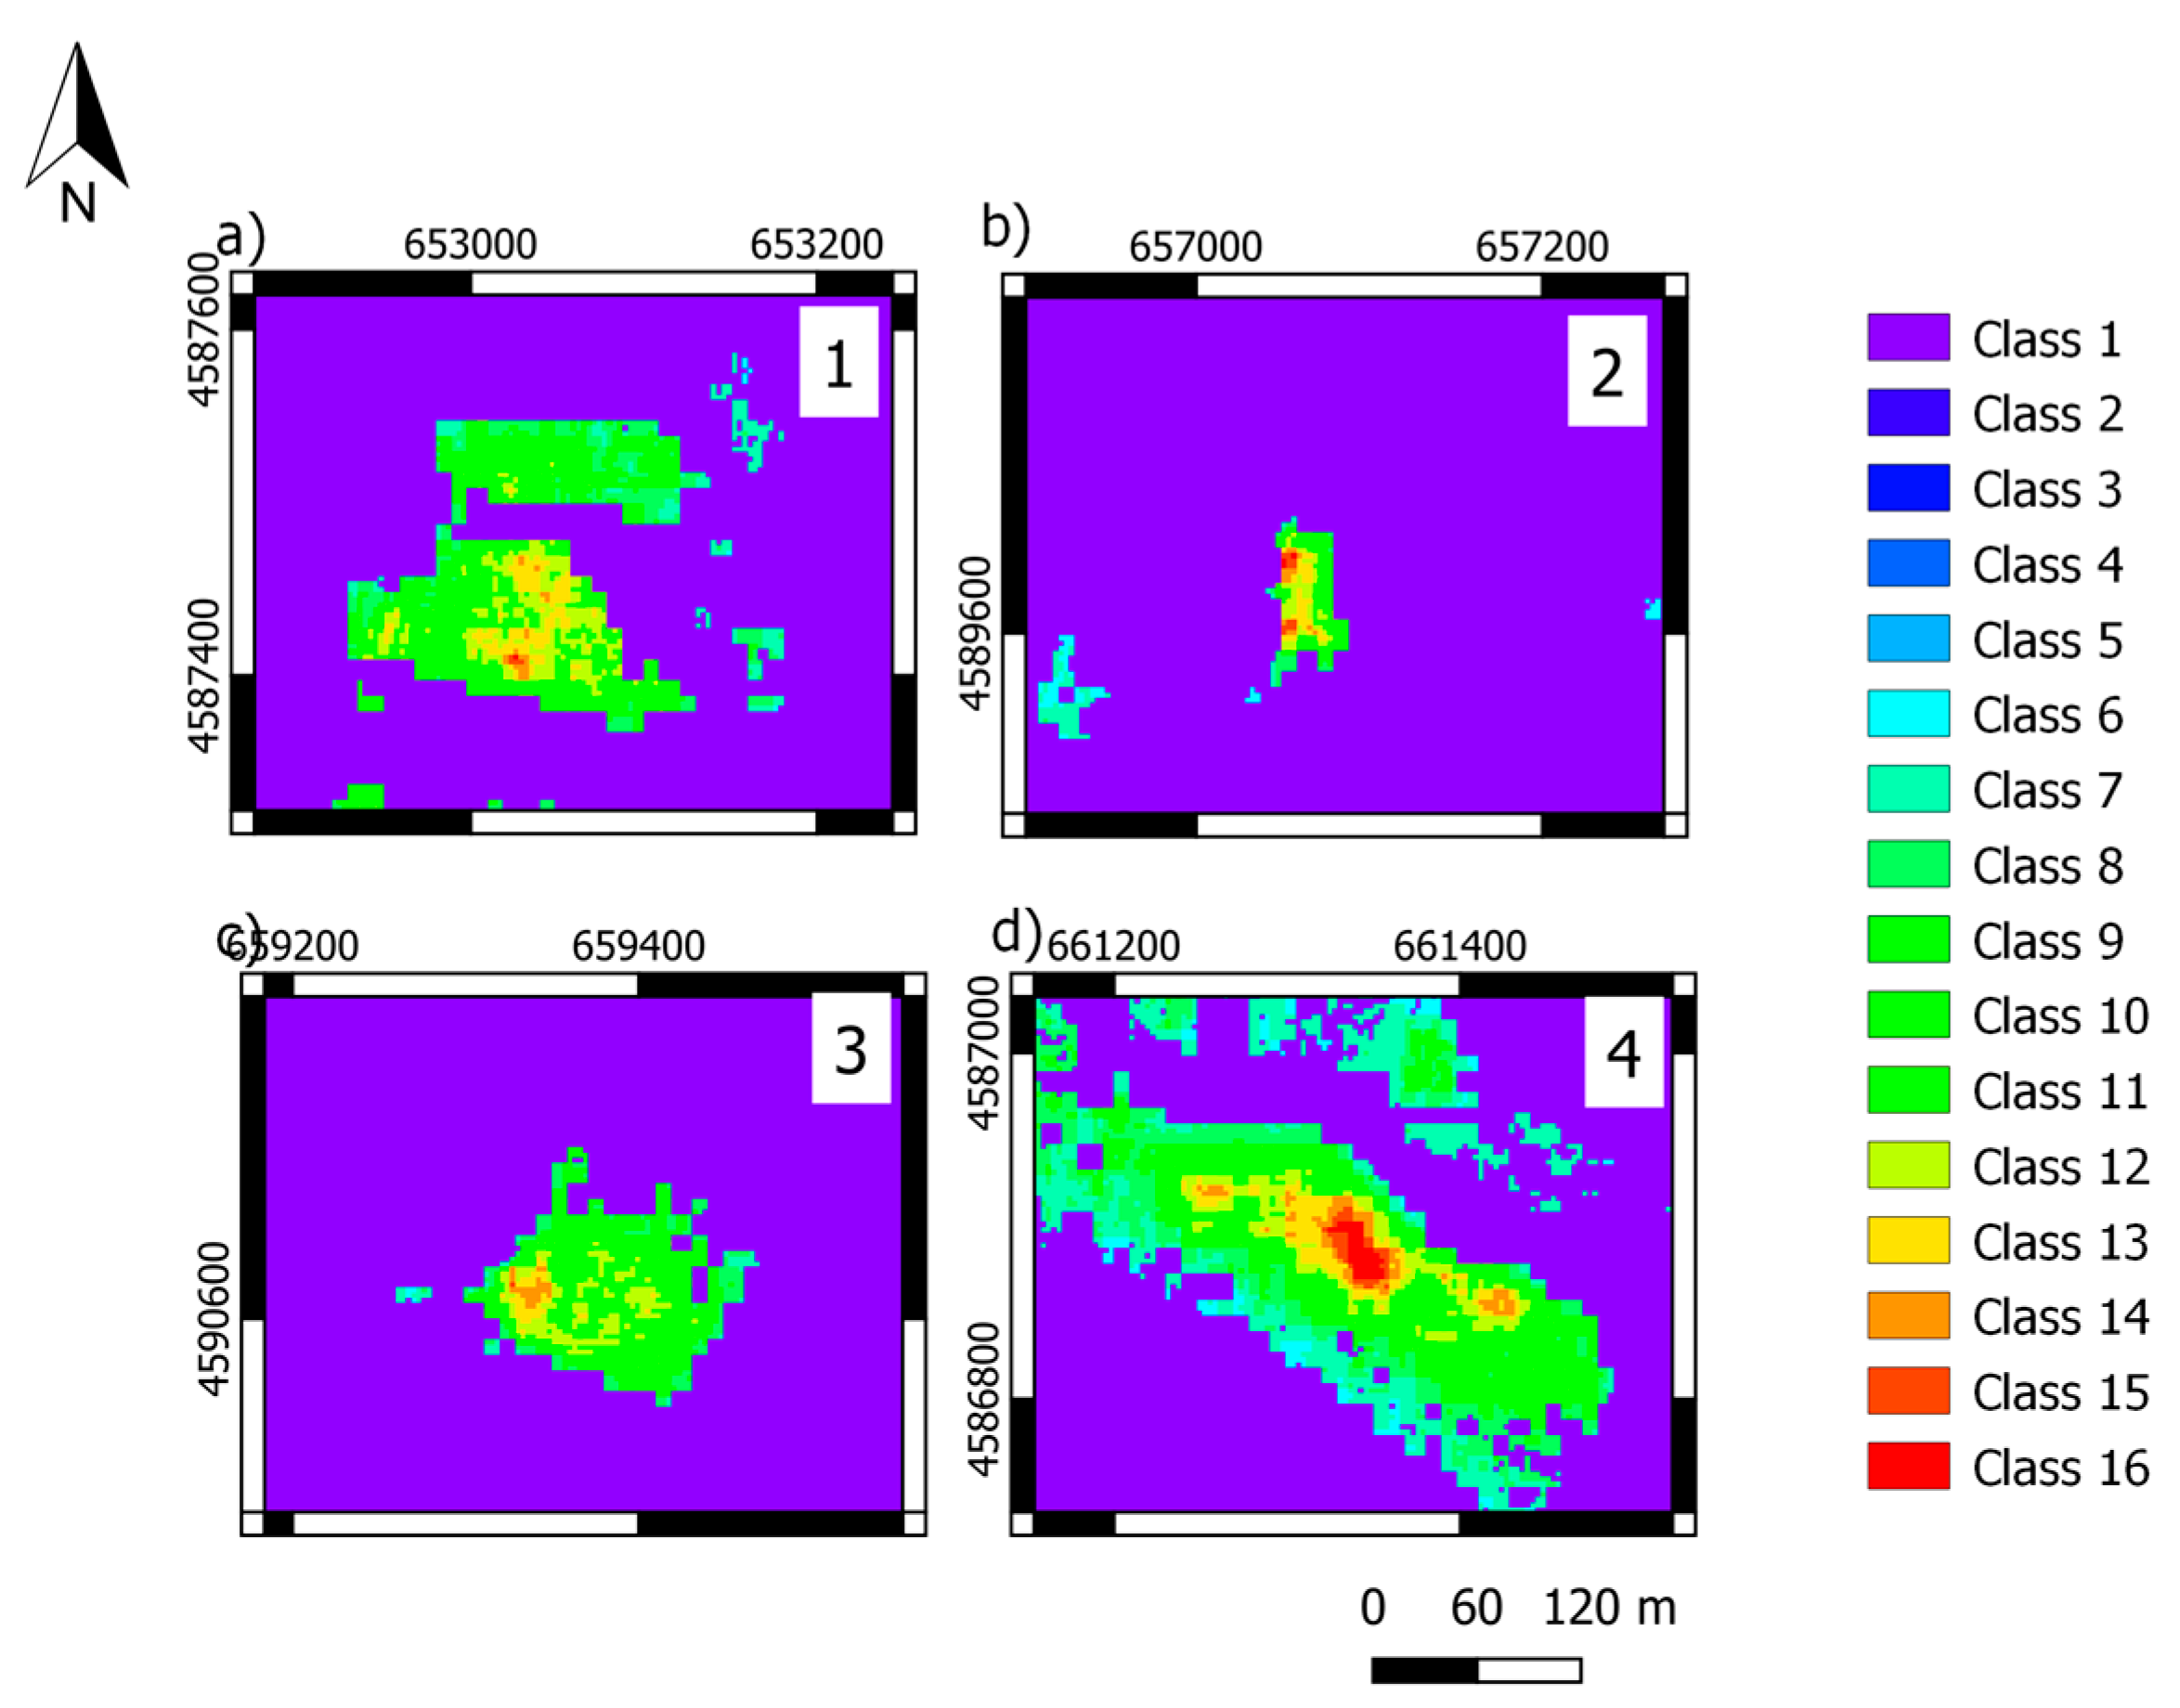
Figure 6.
ROI test 2. Regions of Interest (ROIs) identified in Test 2 (without PS data).
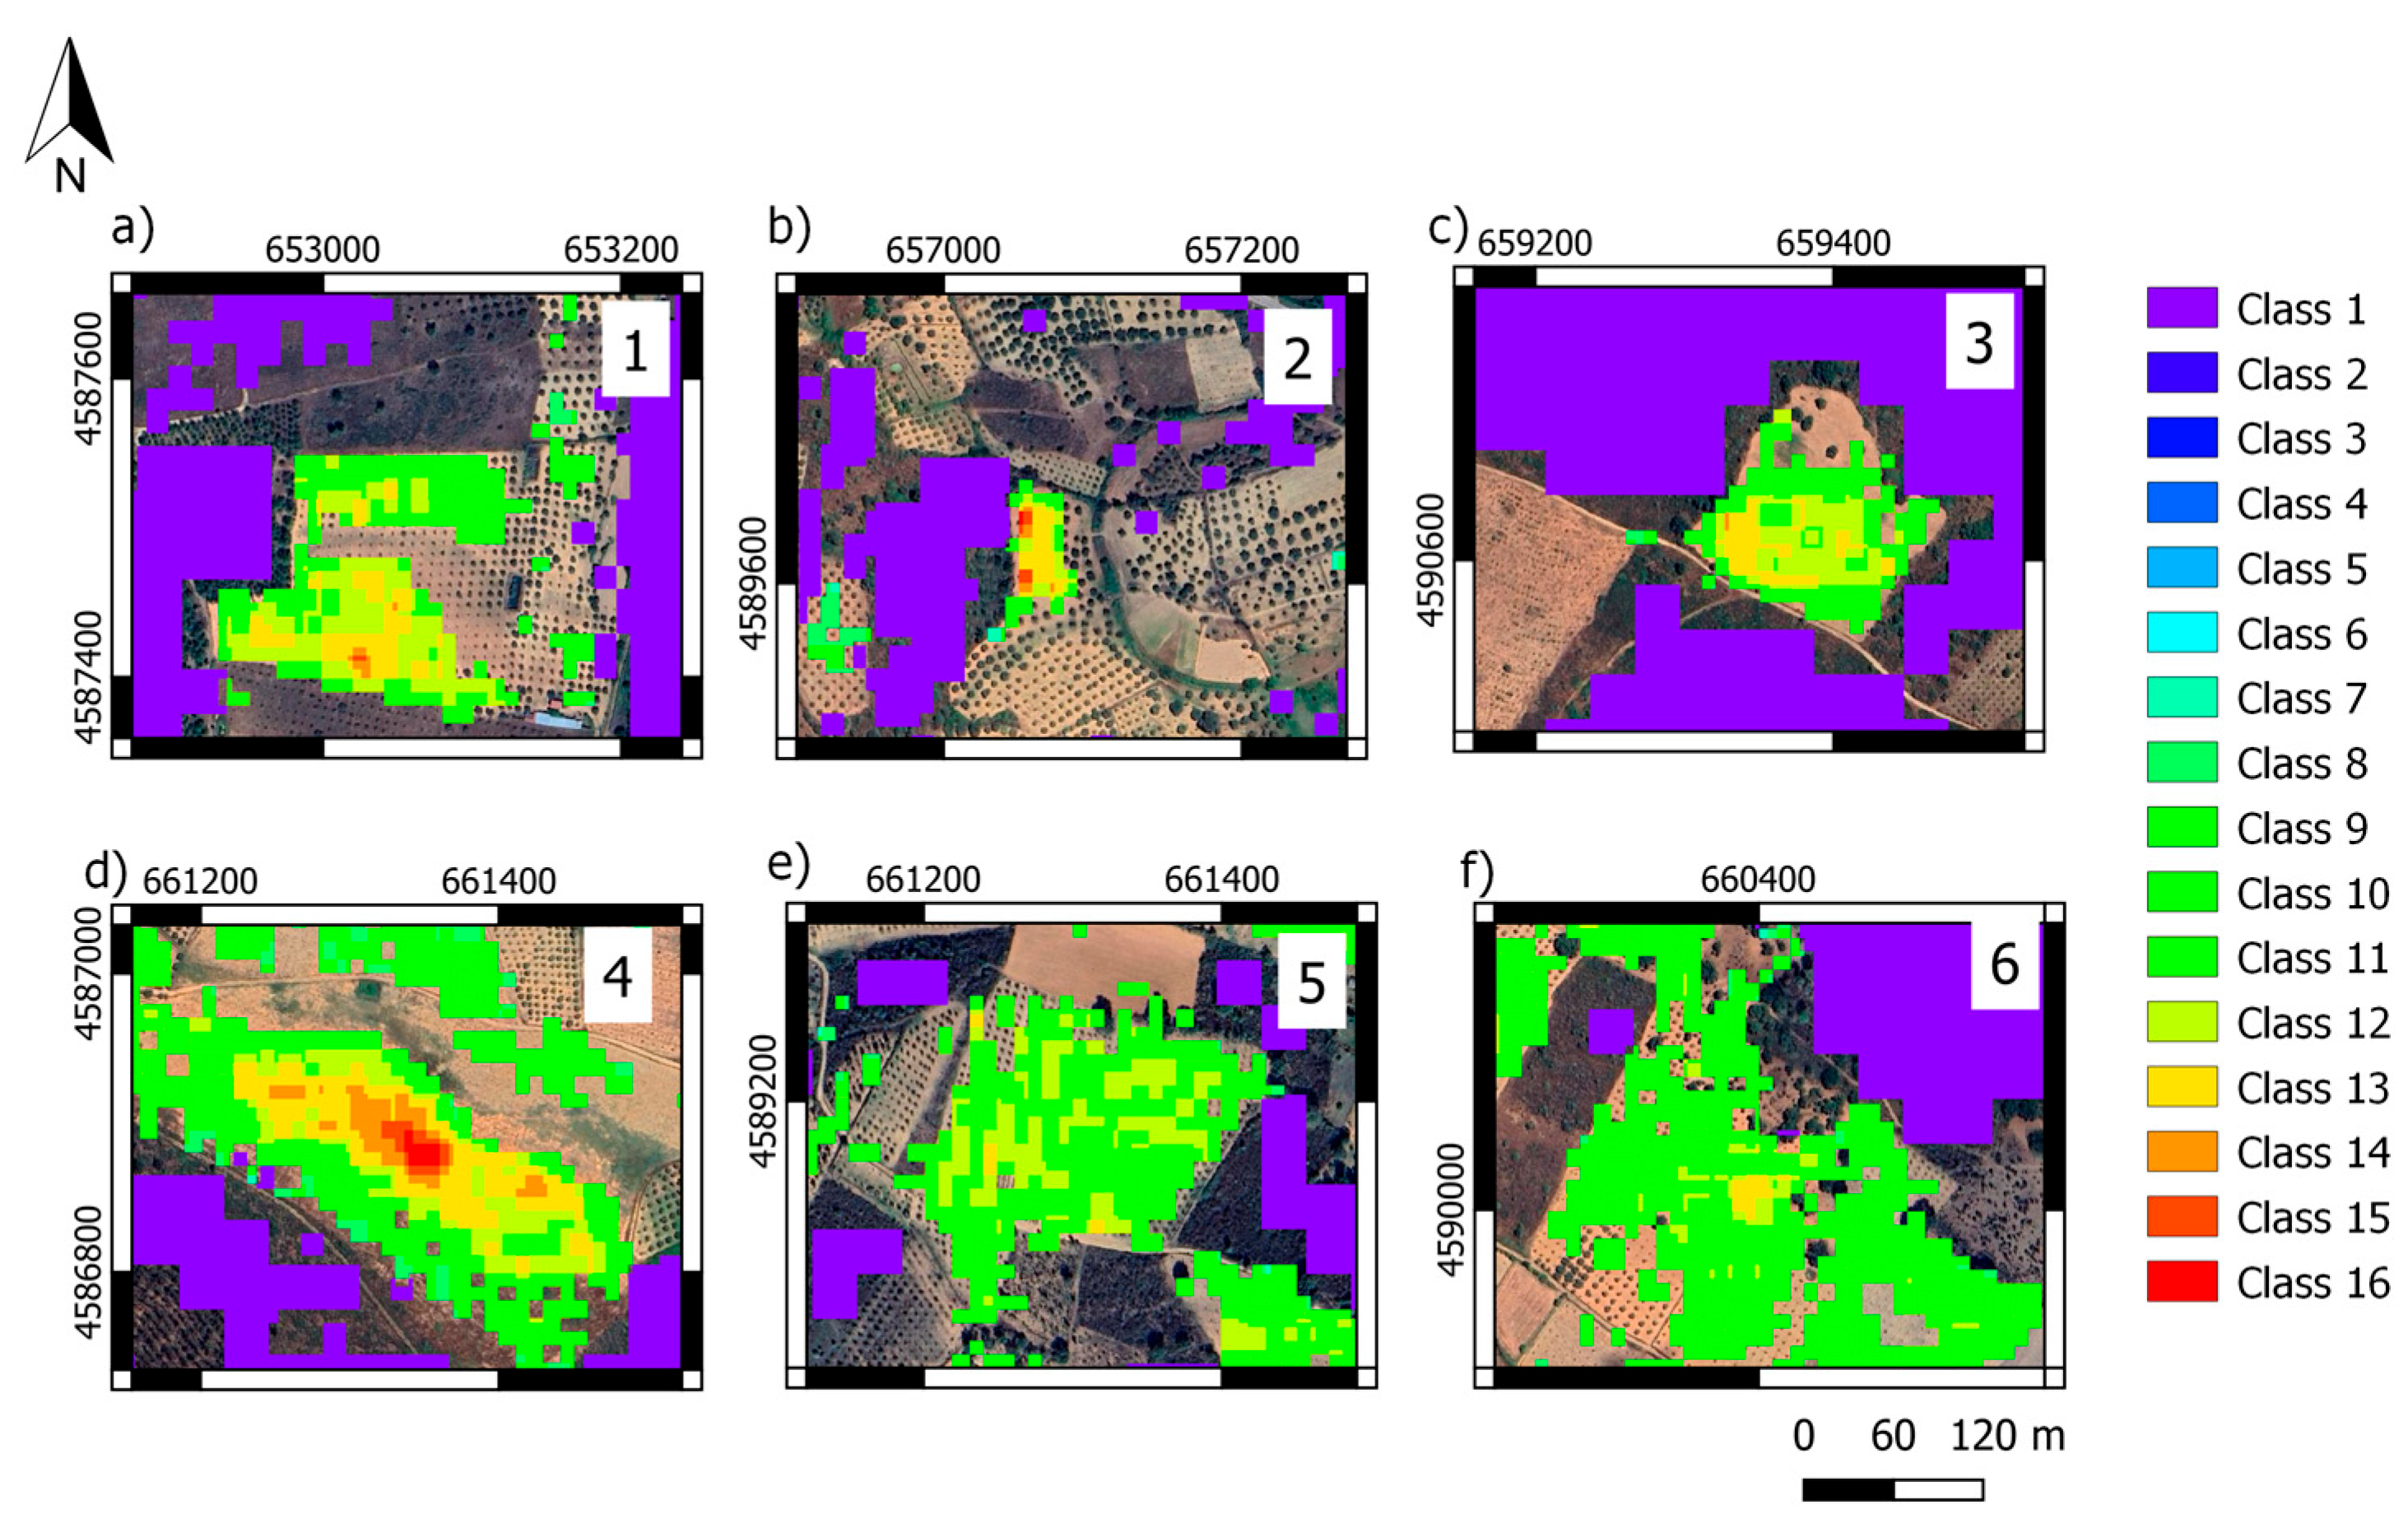
Figure 7.
Ratio maps comparing PlanetScope band ratios with Sentinel-2, ASTER, and Landsat 9. The maps illustrate areas of agreement and disagreement between sensors in detecting Fe³⁺ iron oxides.
Figure 7.
Ratio maps comparing PlanetScope band ratios with Sentinel-2, ASTER, and Landsat 9. The maps illustrate areas of agreement and disagreement between sensors in detecting Fe³⁺ iron oxides.
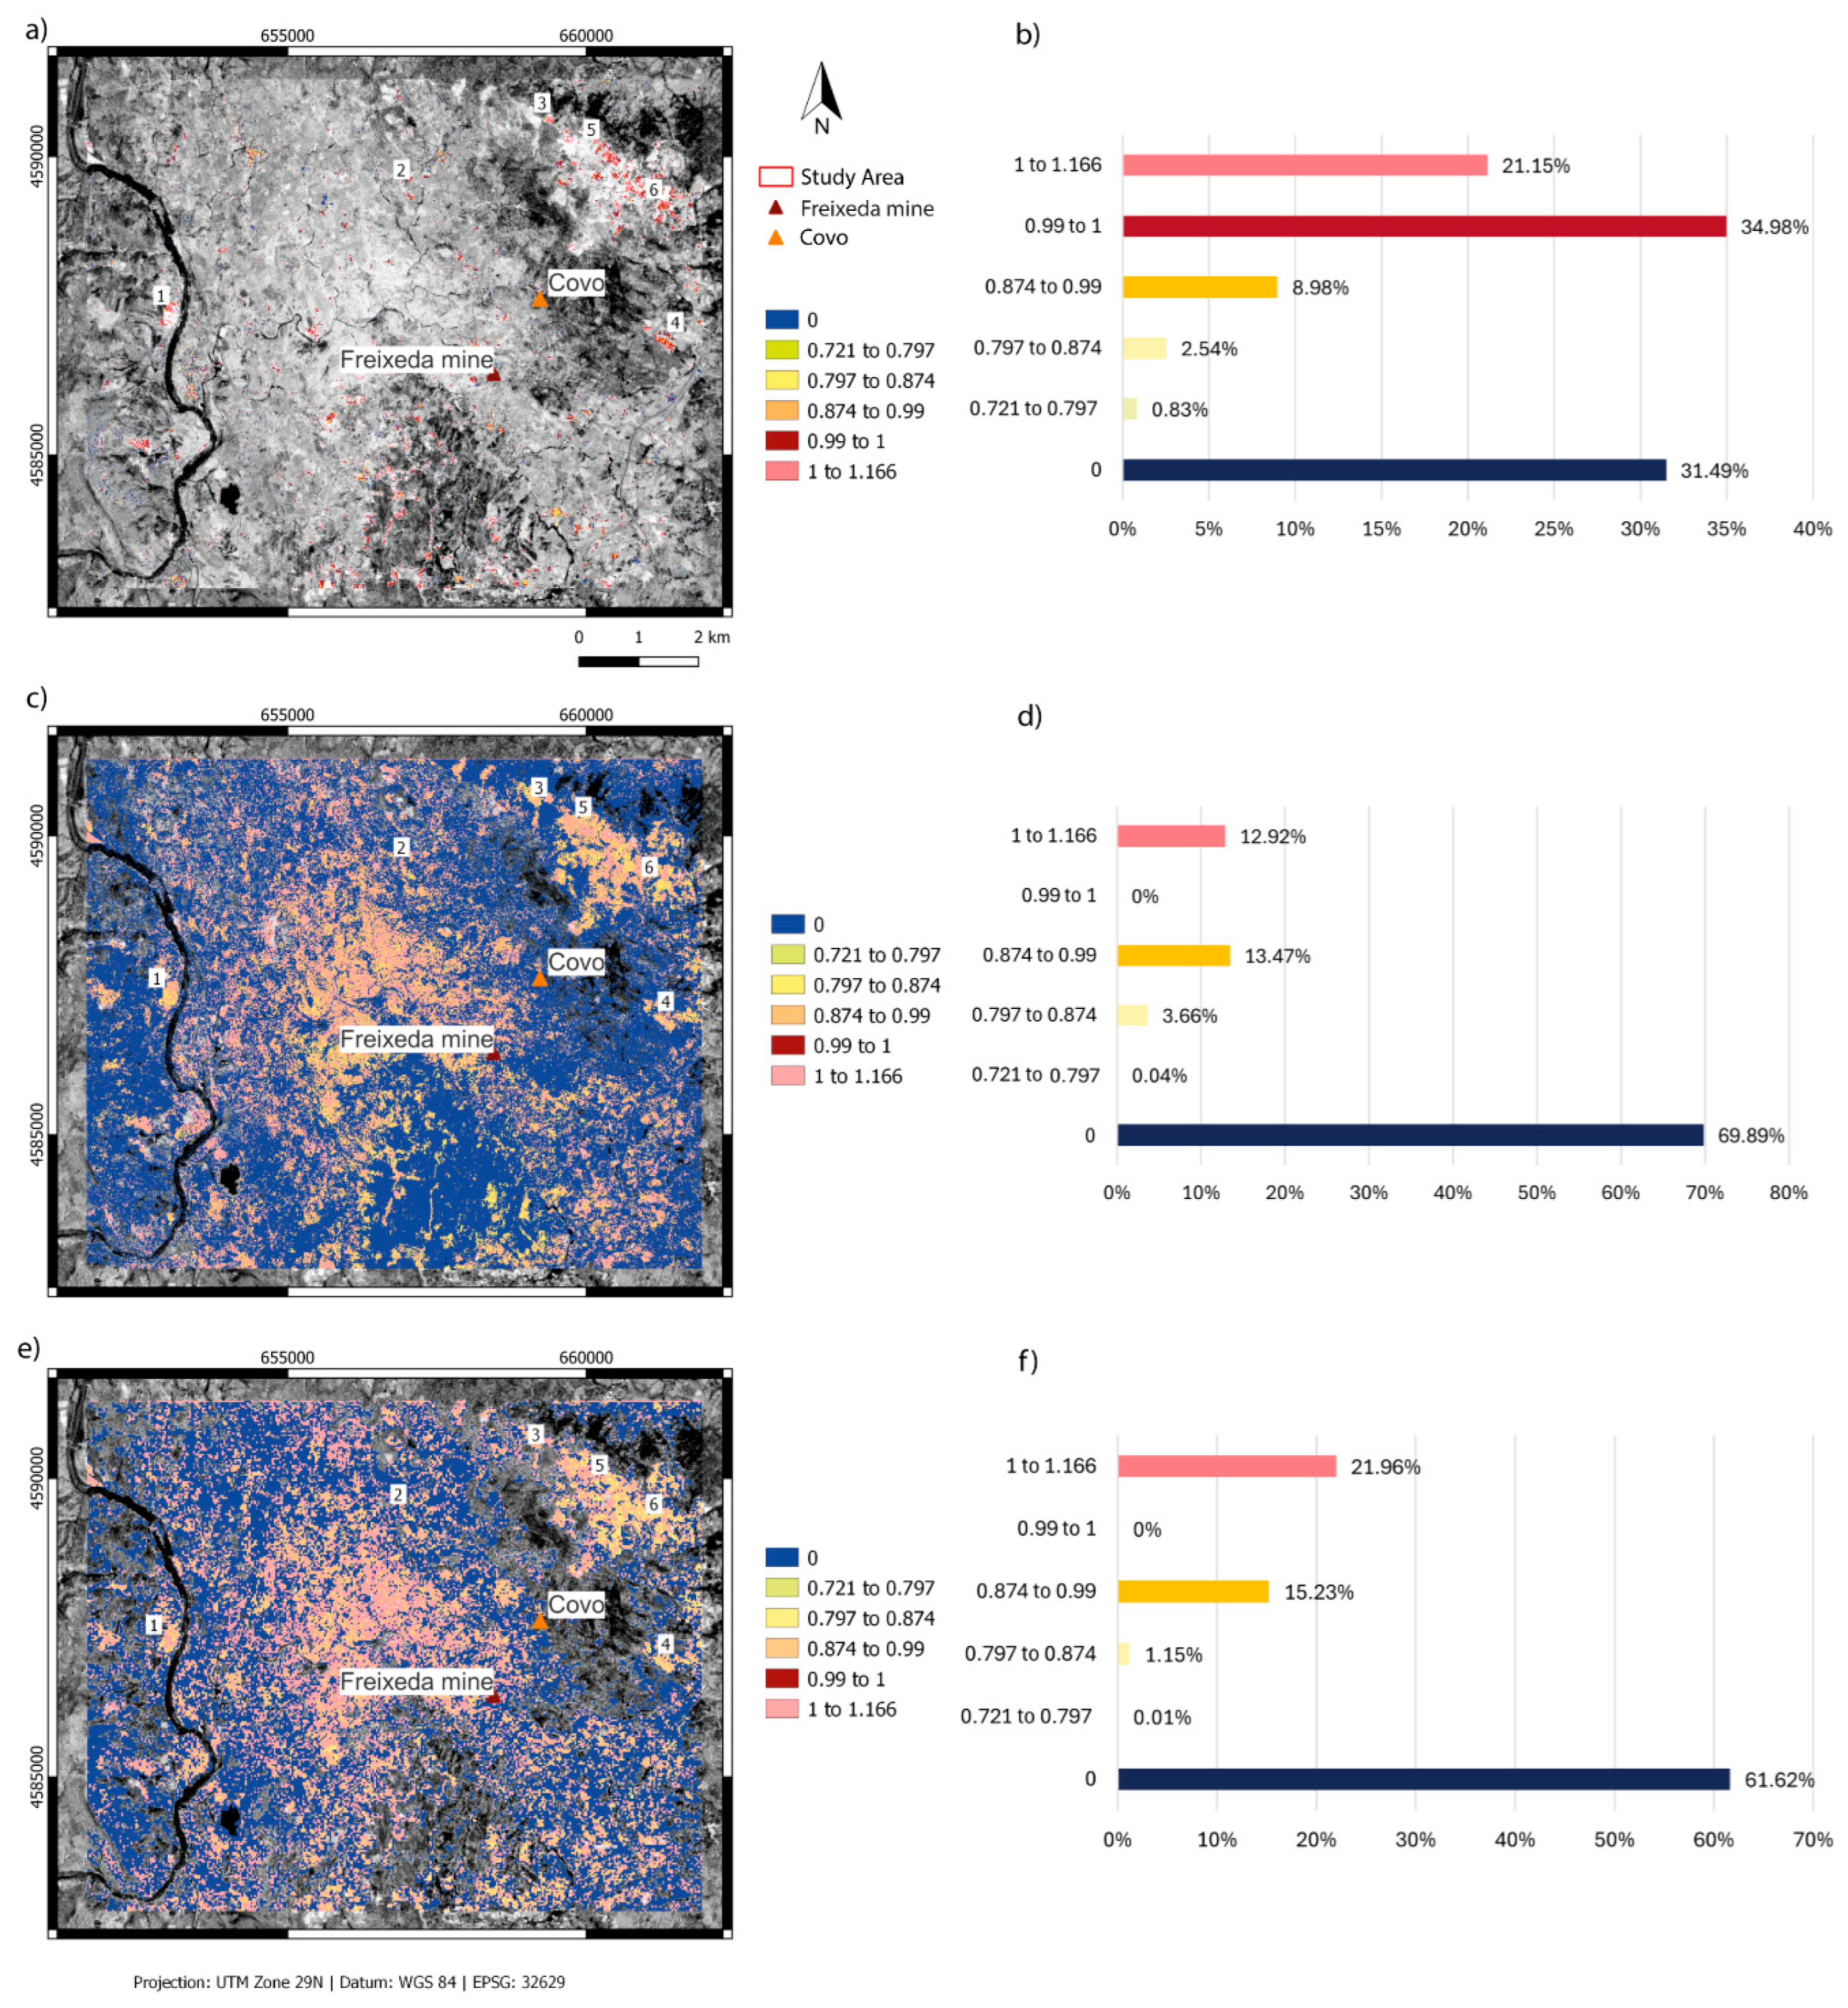
Figure 8.
Ratio maps comparing PS band ratios with Sentinel-2, ASTER, and Landsat 9 in the selected ROIs (test 2). The maps illustrate areas of agreement and disagreement between sensors in detecting Fe³⁺ iron oxides.
Figure 8.
Ratio maps comparing PS band ratios with Sentinel-2, ASTER, and Landsat 9 in the selected ROIs (test 2). The maps illustrate areas of agreement and disagreement between sensors in detecting Fe³⁺ iron oxides.
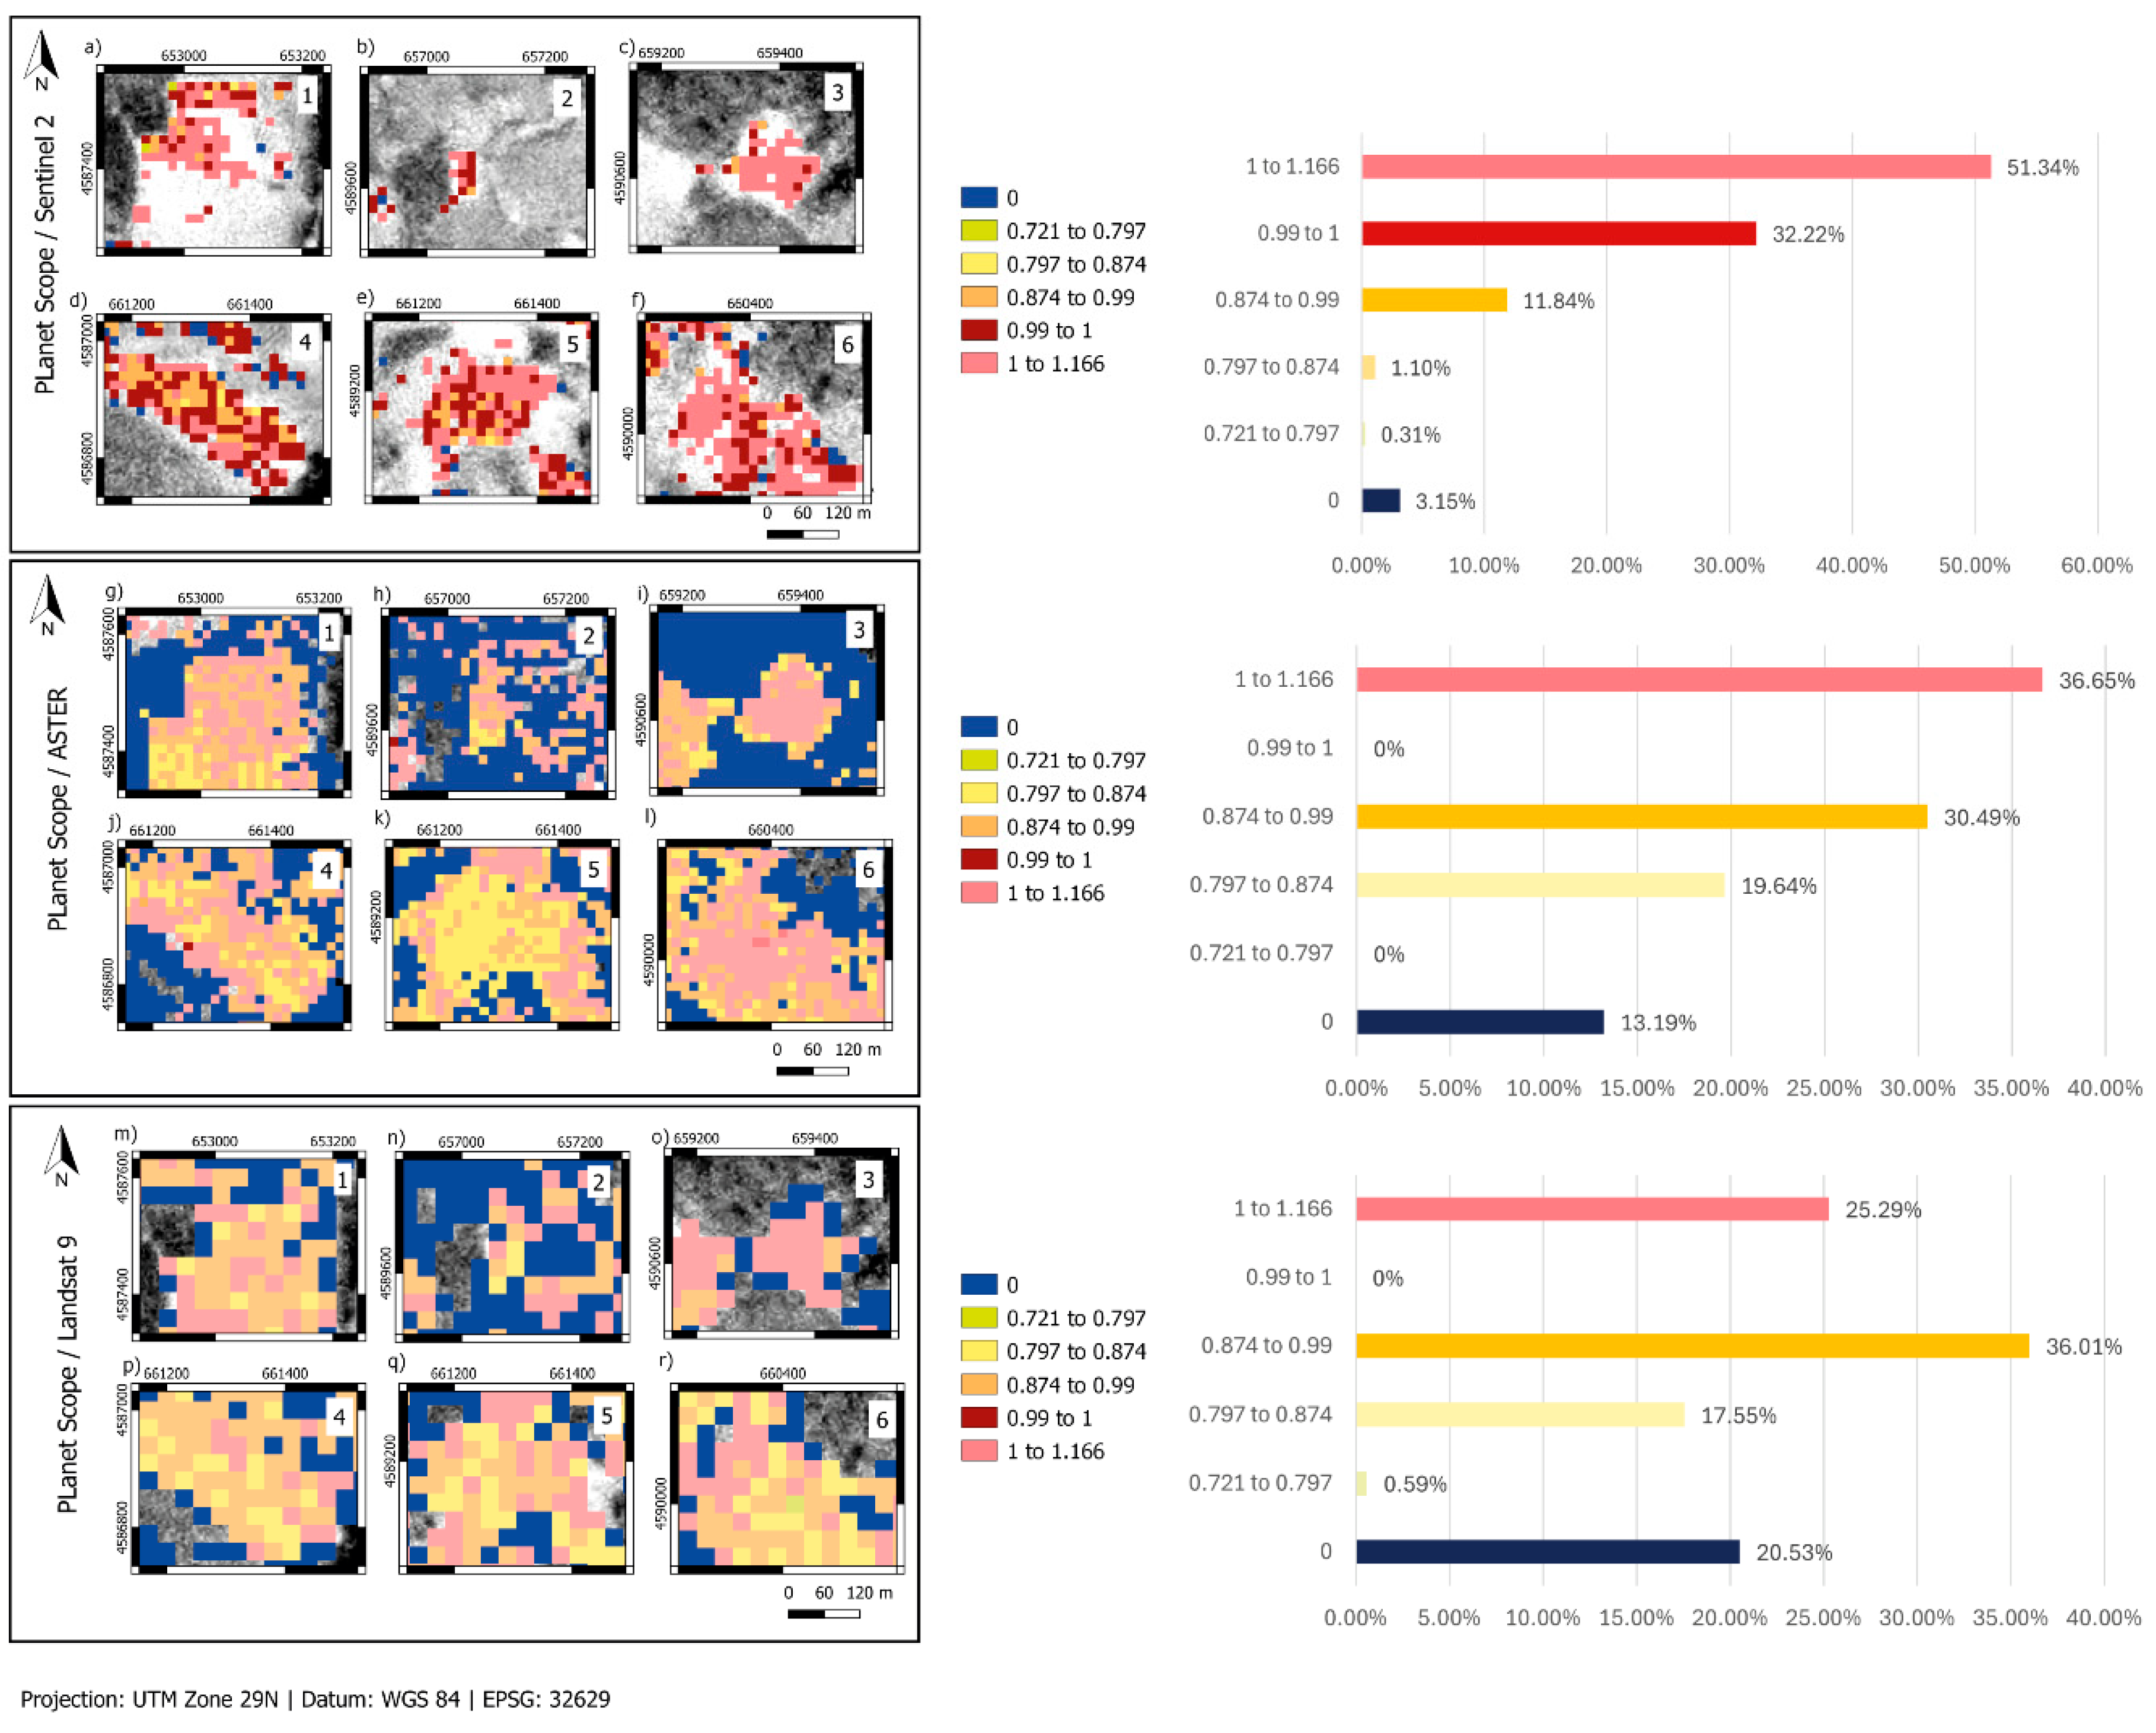
Figure 9.
Comparison between drone-based high-resolution imagery and fuzzification results. (a, c) High-resolution aerial images acquired via drone reconnaissance. (b, d) Fuzzification output highlighting regions with maximum values that indicate sampling locations for soil and rock collection.
Figure 9.
Comparison between drone-based high-resolution imagery and fuzzification results. (a, c) High-resolution aerial images acquired via drone reconnaissance. (b, d) Fuzzification output highlighting regions with maximum values that indicate sampling locations for soil and rock collection.
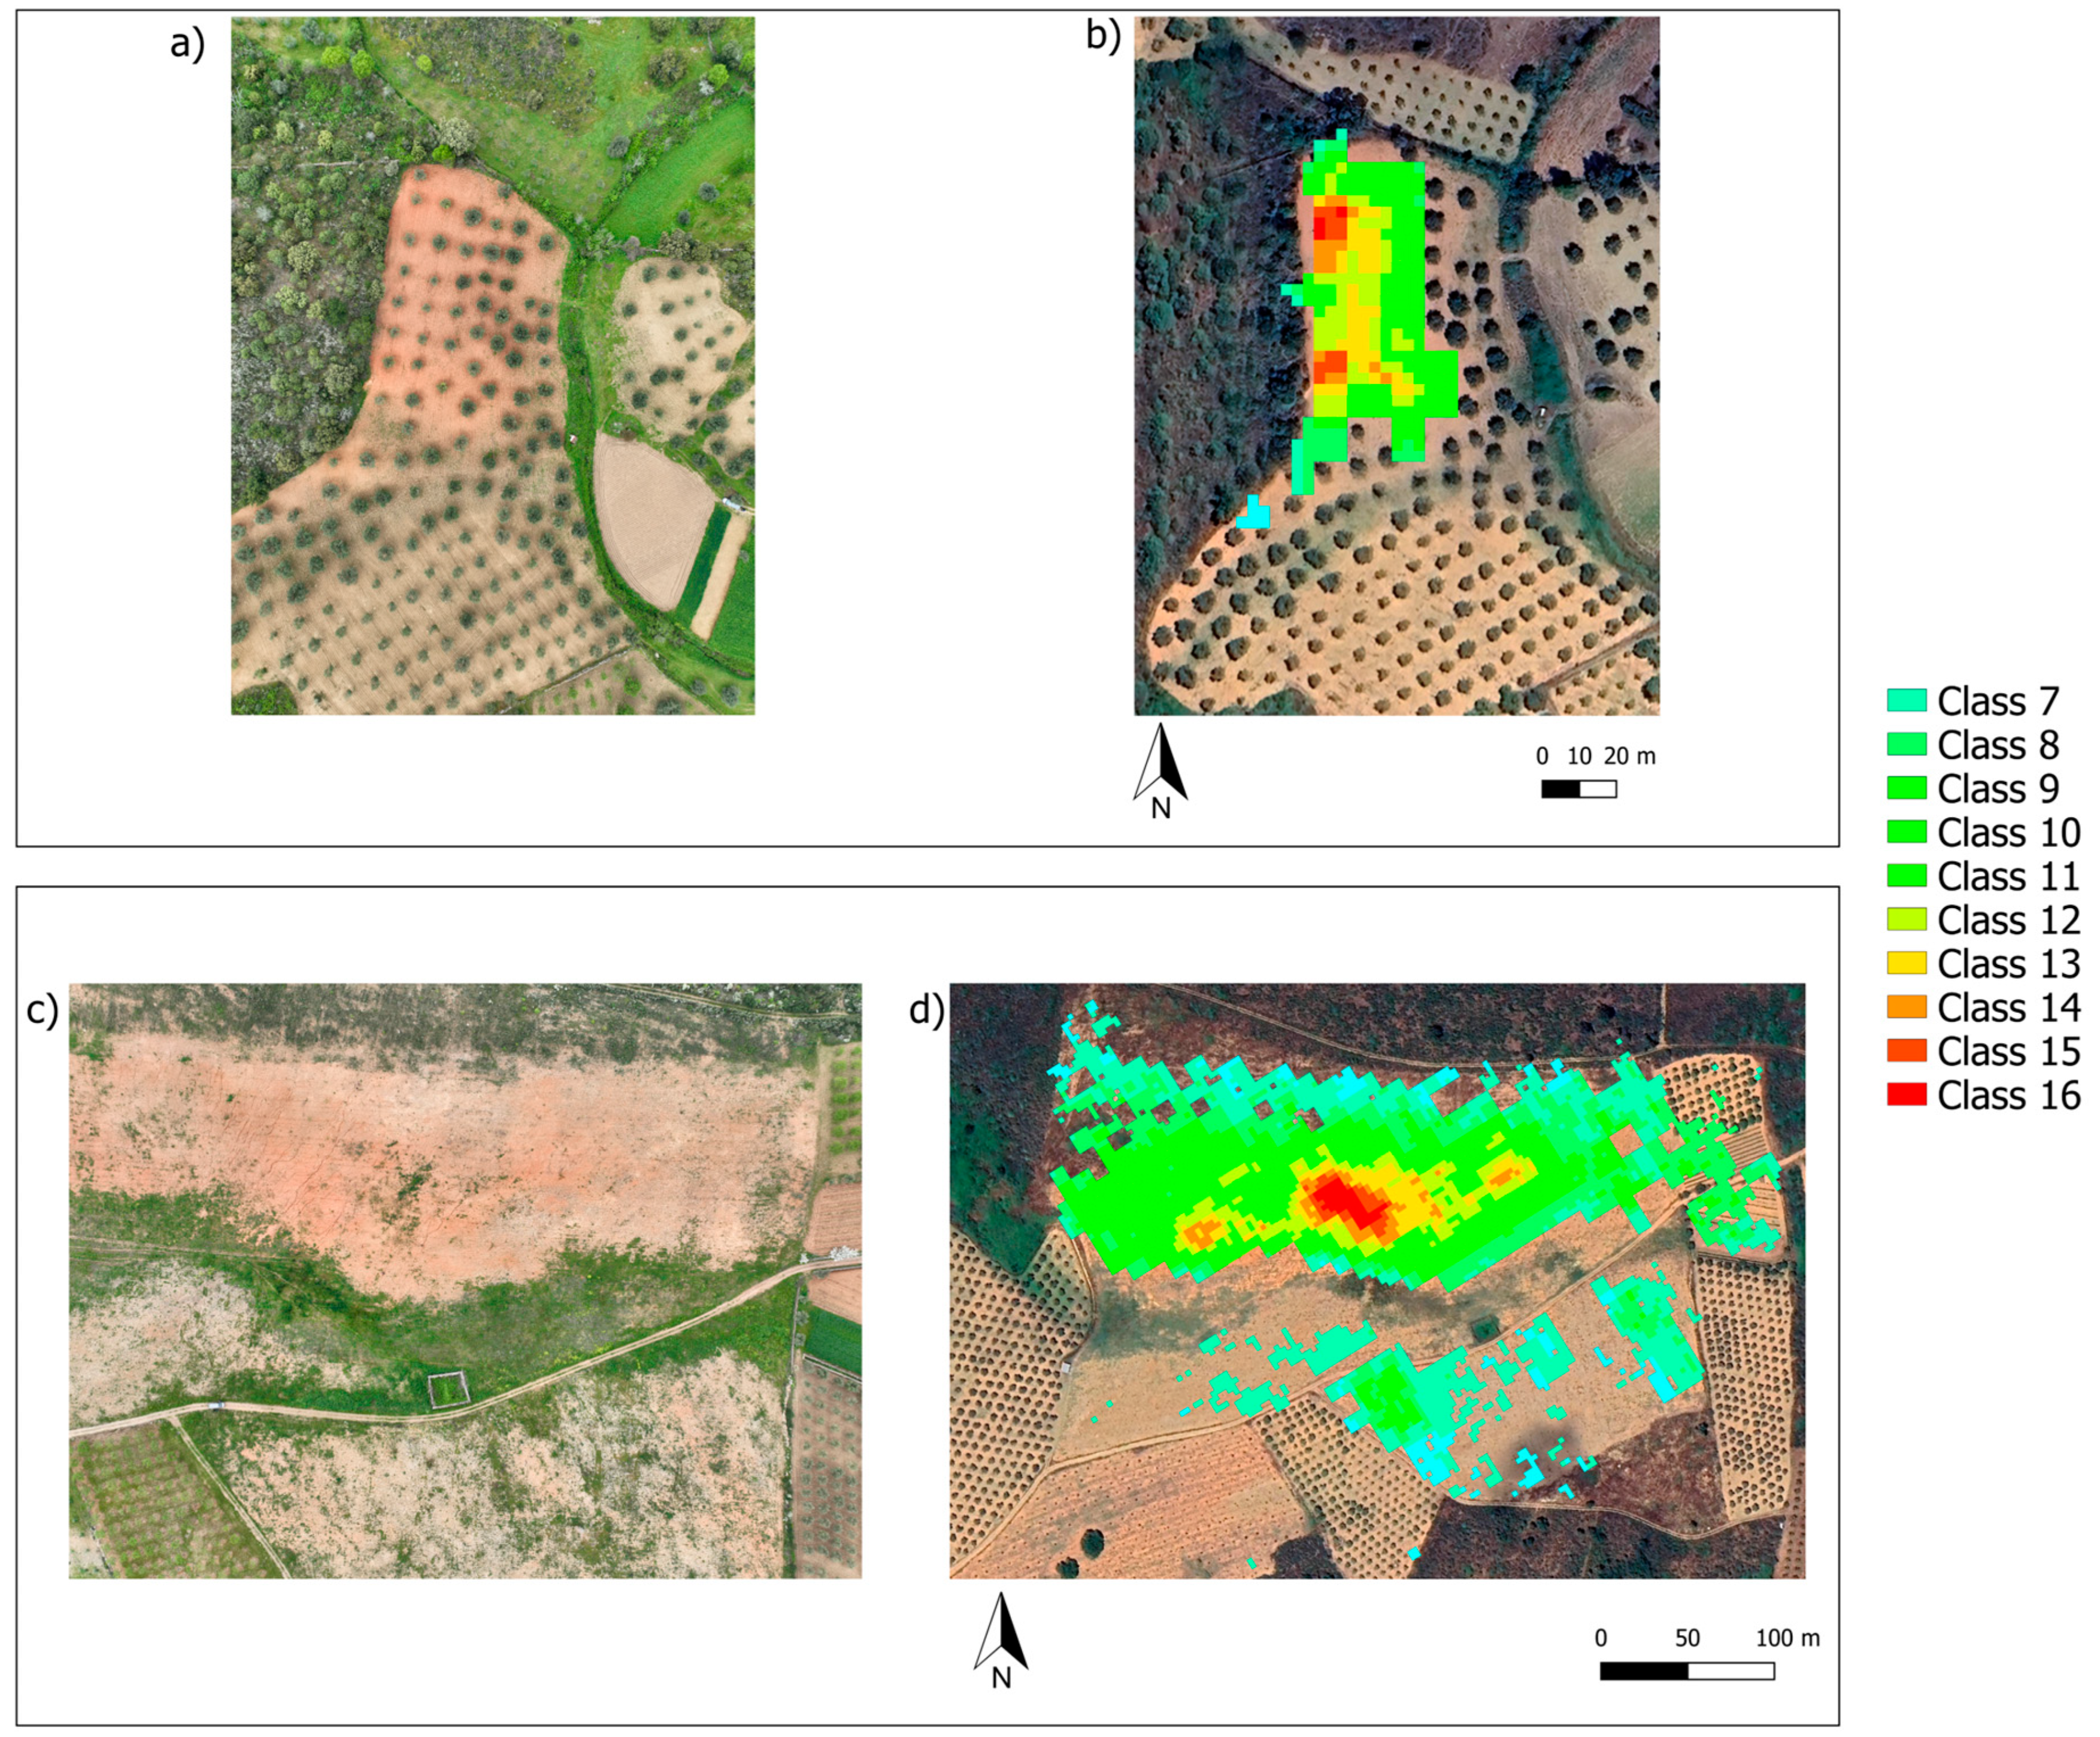
Figure 10.
Spectral characterization of soil samples. The first column (a, c, e, g, I, k) displays the soil samples collected from various ROIs. The second column (b, d, f, h, j, l) shows the corresponding spectral reflectance curves.
Figure 10.
Spectral characterization of soil samples. The first column (a, c, e, g, I, k) displays the soil samples collected from various ROIs. The second column (b, d, f, h, j, l) shows the corresponding spectral reflectance curves.
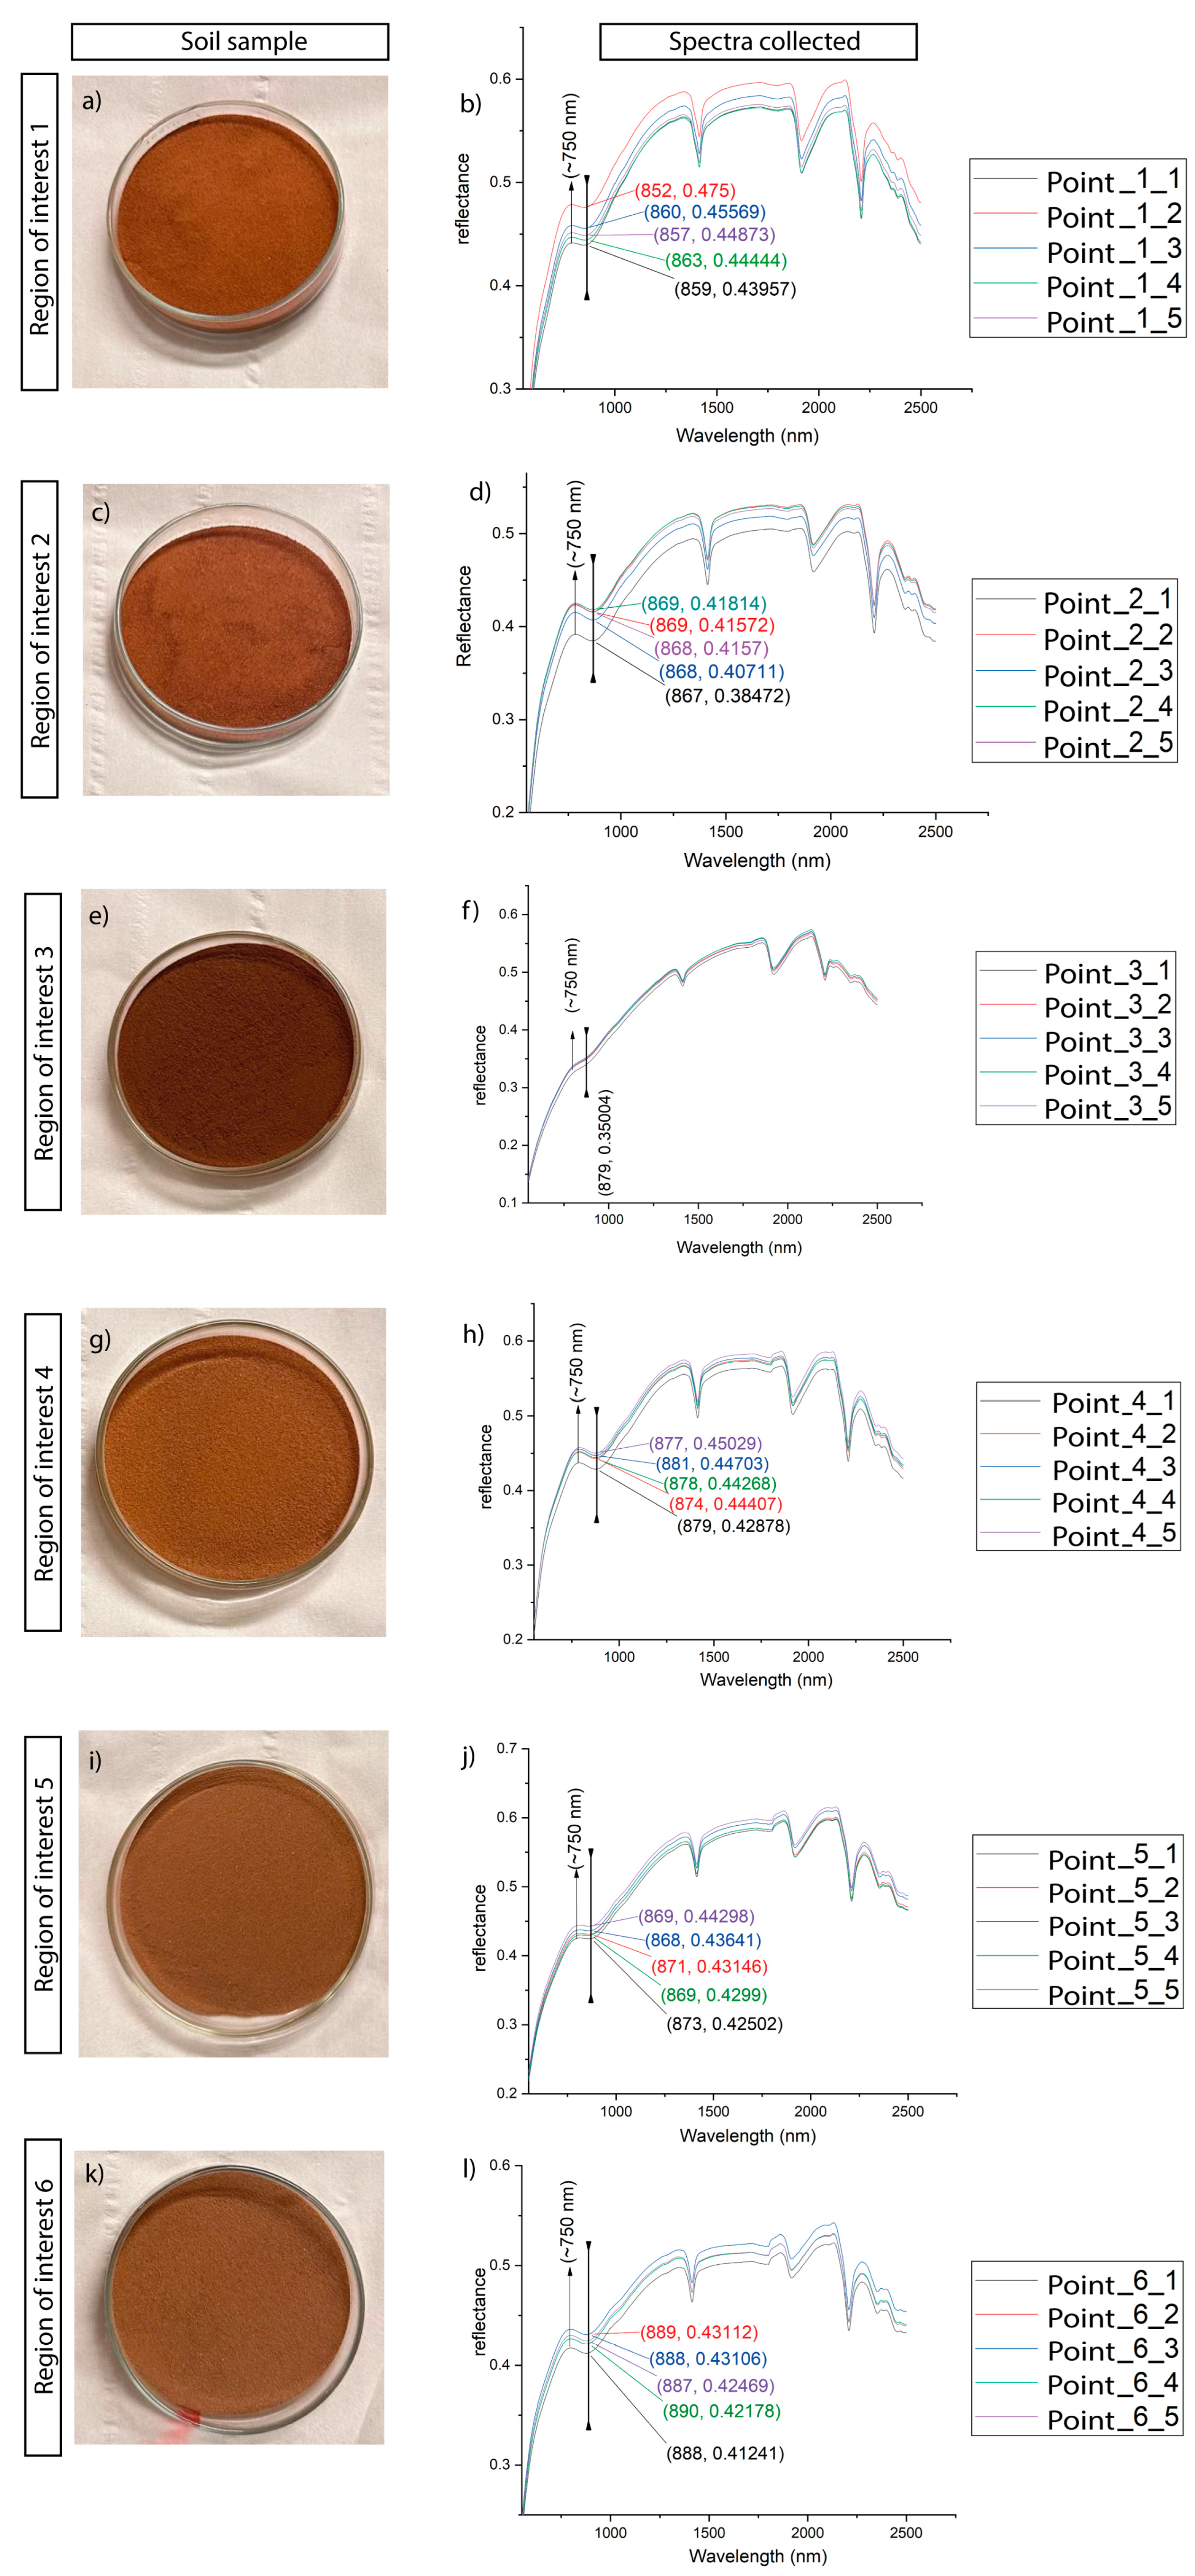
Figure 11.
Spatial context of ROIs in relation to fault zones. (a) Overview map of the study area. (b) ROI 2 is located directly on a fault line. (c) ROI 4 is positioned approximately 470 meters from a fault, suggesting potential structural influence on mineralization patterns.
Figure 11.
Spatial context of ROIs in relation to fault zones. (a) Overview map of the study area. (b) ROI 2 is located directly on a fault line. (c) ROI 4 is positioned approximately 470 meters from a fault, suggesting potential structural influence on mineralization patterns.
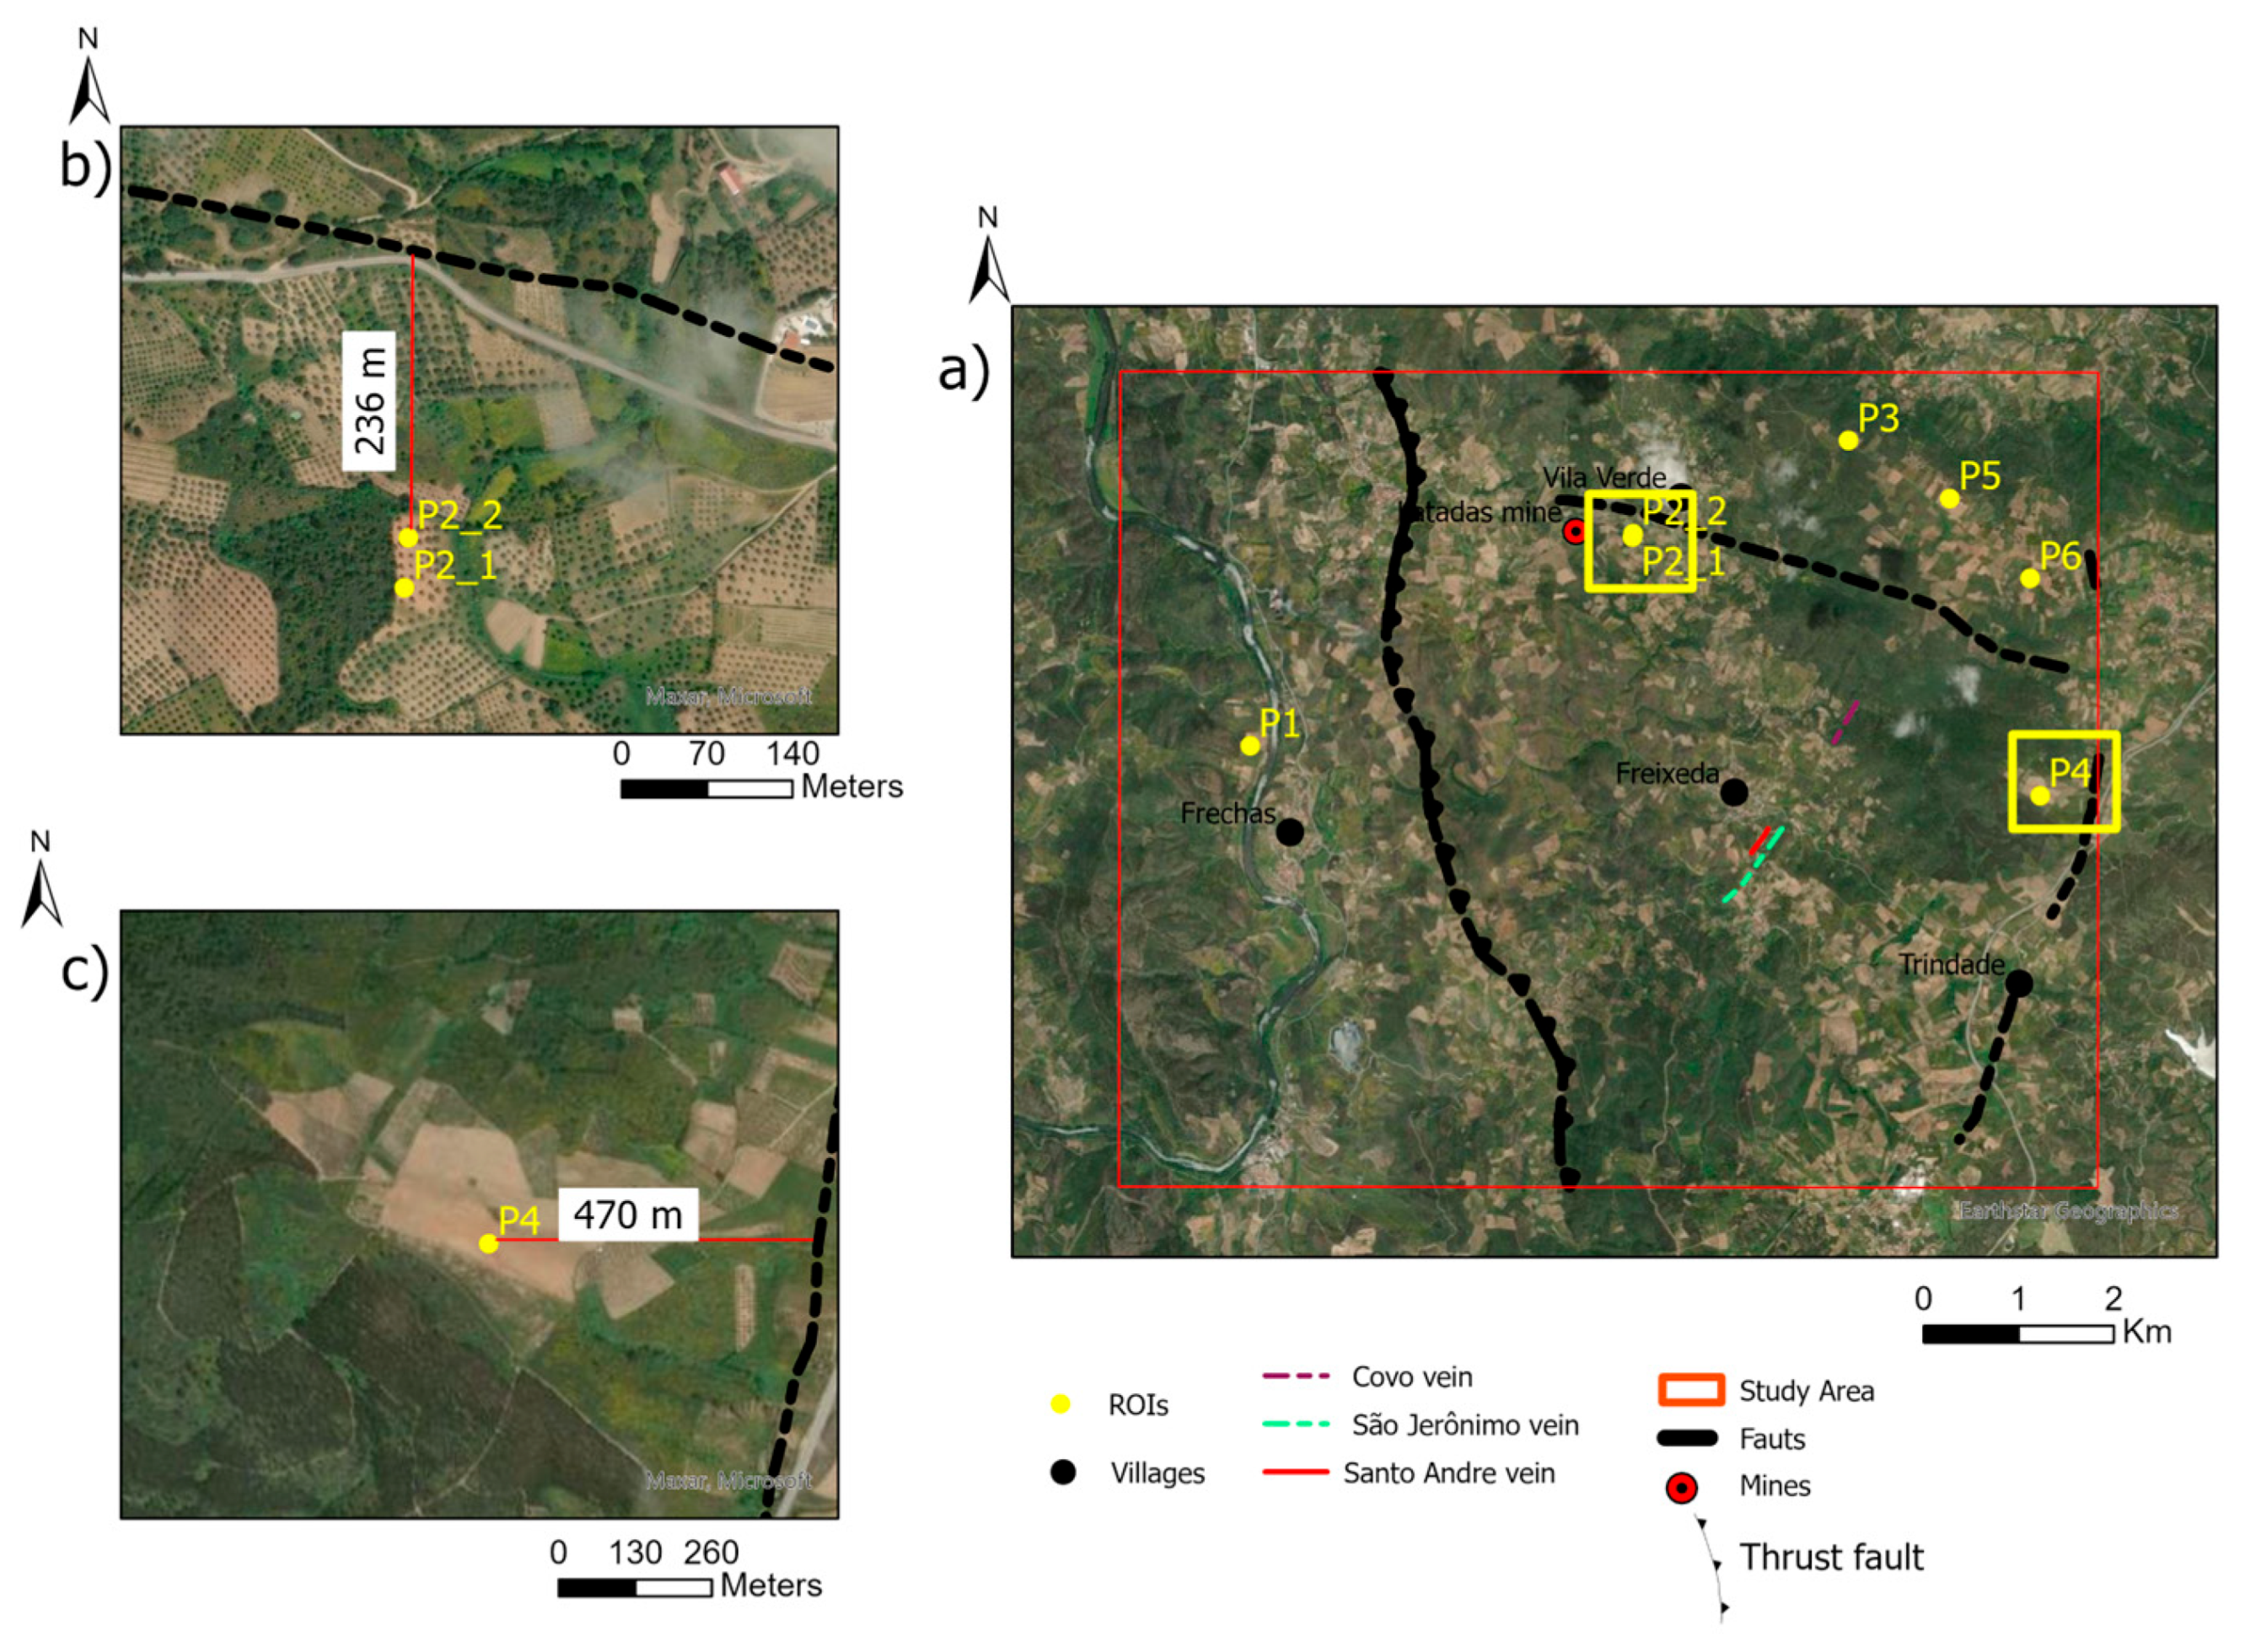

Table 1.
Spectral range correspondence between PS and other multispectral satellite sensors (Sentinel-2, ASTER, and Landsat 9).
Table 1.
Spectral range correspondence between PS and other multispectral satellite sensors (Sentinel-2, ASTER, and Landsat 9).
| PlanetScope |
SR (µm) |
Sentinel-2 |
SR (µm) |
ASTER | SR (µm) | Landsat 9 |
SR (µm) |
| Coastal Blue (B1) | 0.431 – 0.452 | Band 1 | 0.433 – 0.453 | - | - | Coastal Aerosol | 0.435-0.451 |
| Blue (B2) | 0.465 – 0.515 | Band 2 | 0.458 – 0.523 | - | - | Blue (B2) | 0.452-0.512 |
| Green I (B3) | 0.513 – 0.549 | - | - | - | - | - | - |
| Green II (B4) | 0.547 – 0.583 | Band 3 | 0.543 – 0.578 | Band 1 | 0.52 – 0.60 | Green (B3) | 0.533-0.590 |
| Yellow (B5) | 0.600 – 0.620 | - | - | - | - | ||
| Red (B6) | 0.650 – 0.680 | Band 4 | 0.650 – 0.680 | Band 2 | 0.63 – 0.69 | Red (B4) | 0.636-0.673 |
| Red Edge (B7) | 0.697 – 0.713 | Band 5 | 0.698 – 0.713 | - | - | - | - |
| NIR (B8) | 0.845 – 0.885 | Band 8A | 0.755 – 0.875 | Band 3N and 3B | 0.78 – 0.86 | NIR (B5) | 0.851-0.879 |
Table 2.
BR tested and its masked values.
| Sensor | BR tested |
| PlanetScope PSB.SD | (B6/ B4) masked values > 0.83 |
| Sentinel 2 MSI | (B4/B3) masked values > 0.41 |
| ASTER | (B2 / B1) masked values > 0.87 |
| Landsat 9 OLI | (B4/B3) masked values > 0.34 |
Table 3.
Percentage proportion of the pixels of interest for each satellite, considering the total number of pixels of interest among classes 12 to 16.
Table 3.
Percentage proportion of the pixels of interest for each satellite, considering the total number of pixels of interest among classes 12 to 16.
| PlanetScope | Sentinel2 | ASTER | Landsat 9 | |
| Class 12 | 67.86% | 72.23% | 40.40% | 64.34% |
| Class 13 | 18.12% | 18.48% | 43.86% | 32.55% |
| Class 14 | 5.95% | 5.64% | 13.29% | 2.91% |
| Class 15 | 3.71% | 2.34% | 2.09% | 0.18% |
| Class 16 | 4.37% | 1.29% | 0.33% | 0.00% |
Table 4.
Percentage that each class occupies for both Test 1 and Test 2 results considering the total number of pixels of interest among classes 12 to 16.
Table 4.
Percentage that each class occupies for both Test 1 and Test 2 results considering the total number of pixels of interest among classes 12 to 16.
| Class ID | Test 1 (with Planet Scope) | Test 2 (without Planet Scope) | ||||
| Class Summary | Pixel Count | % | Class Summary | Pixel Count | % | |
| Class 12 | 42240 to 46080 | 2061 | 52.19 | 2209 to 2410 | 10514 | 68.19 |
| Class 13 | 46080 to 49920 | 1128 | 28.56 | 2410 to 2611 | 3829 | 24.83 |
| Class 14 | 49920 to 53760 | 461 | 11.67 | 2611 to 2812 | 705 | 4.57 |
| Class 15 | 53760 to 57600 | 181 | 4.58 | 2812 to 3013 | 290 | 1.88 |
| Class 16 | 57600 to 61440 | 118 | 2.98 | 3013 to 3213 | 80 | 0.51 |
Disclaimer/Publisher’s Note: The statements, opinions and data contained in all publications are solely those of the individual author(s) and contributor(s) and not of MDPI and/or the editor(s). MDPI and/or the editor(s) disclaim responsibility for any injury to people or property resulting from any ideas, methods, instructions or products referred to in the content. |
© 2025 by the authors. Licensee MDPI, Basel, Switzerland. This article is an open access article distributed under the terms and conditions of the Creative Commons Attribution (CC BY) license (http://creativecommons.org/licenses/by/4.0/).
Copyright: This open access article is published under a Creative Commons CC BY 4.0 license, which permit the free download, distribution, and reuse, provided that the author and preprint are cited in any reuse.


