
Submitted:
03 June 2025
Posted:
05 June 2025
You are already at the latest version
Abstract
We introduce a novel technique for the sonification / auditory representation of 12 lead electrocardiogram (ECG), the standard diagnostic method for the detection of ST elevation myocardial infarction (STEMI). Our approach of ST elevation sonification conveys the detailed variation of the ST segment to enable differentiated correct interpretation and severity without consulting visual display. We present a variety of novel sonification designs and discuss their benefits and limitations. As part of an emergency training program, a cohort of 44 medical students (5th academic year) participated in a classification study in which the diagnostic accuracy of the participants was determined with regard to audibly presented ECG sequences of different STEMI severity levels. Regarding the classification of sonified ECG sequences, discrimination of isoelectricity (IE, the healthy class) from all other (STEMI) classes combined yielded a perfect classification of all 660 classification instances (sensitivity=specificity=1). With respect to the individual classification of all 5 classes (IE, inferior/anterior, and moderate/severe STEMI) an overall accuracy of 0.82 (0.79, 0.85) and an intraclass coefficient of kappa = 0.77 was estimated.
Keywords:
auditory display
; sonification
; process monitoring
; parameter mapping
; electrocardiography
; STEMI
1. Introduction
Acute chest pain with the suspicion of ST elevation myocardial infarction (STEMI) is common in Europe. The incidence of hospital admissions for STEMI is 44–142 per 100000 inhabitants per year [1]. Emergency Medical Services (EMS) are involved in most cases for diagnosing, initial treatment and transportation [2]. The 12 lead electrocardiogram (ECG) is the diagnostic cornerstone of STEMI [3].
Sonification, the scientific method to represent data as sound in an auditory display, has the potential to play an important role as a new supporting tool for the surveillance of the ST segment during (out of hospital) care of patients with suspicion of myocardial infarction according to a recent study [4].
Sonification converts data, particularly biosignals, into sounds in a systematic and reproducible way. In our context, the ECG is used as data source [5]. These sounds are supposed to transfer the information contained in the biosignals to the EMS crew. Other examples of auditory display of biosignals are pulse oximetry and QRS tone of the ECG (cf. Figure 1 for the notation of ECG signal segments), which are established methods in the medical environment. In case of the ECG, additionally the ST segment (Figure 1) can reveal different sounds when being isoelectric or elevated [4].
Rhythm disturbances are monitored by one to three leads continuously to be able to treat malignant cardiac arrhythmias immediately when they occur. According to the European Society of Cardiology (ESC) clinical practice guidelines, a 12 lead ECG has to be recorded on scene within ten minutes after arrival, but routinely only at one point of time. The evaluation results of the ST segment are dependent on age and sex of the patients, particularly the leads V2 and V3 according to the current ESC guidelines [3]. Therefore, good knowledge and training are essential to ensure a correct and prompt diagnose.
In cases of fluctuating symptoms, ECG changes can also be transient and therefore diagnosis of STEMI can be challenging for EMS [6]. We describe whether sonification could have the potential to support EMS by finding the correct diagnosis by distinguishing ST elevation from non-ST elevation during the prehospital surveillance period. A quick and correct classification is necessary, because if ST elevation or other signs of coronary occlusion are present in the ECG, immediate revascularization is needed. Treatment includes prompt delivery of medication on scene and urgent heart catheterization. Therefore, the treating hospital has to offer 24/7 acute revascularization therapy [3].
Encouraged by recent findings of a feasibility study [4] we raised the following hypothesis for the current study: Sonification of the ECG can provide interpretable information of ST segment elevation. To test this hypothesis we first developed a sonification concept for the auditory representation of different STEMI severity levels and types and then conducted a classification study with a student training cohort.
2. Related Research
A number of methods have been developed for the sonification of uni- and multivariate biomedical time series, such as sonification of electroencephalography (EEG), of electromyography (EMG) and of CT/PET scans, to name a few [7,8,9,10]. With respect to ECG sonification, the existing applications split into two research lines. The first group of approaches focuses on sonifying temporal features such as the heart rate and the heart rate variability [11,12,13]. For instance, heart rate sonification supports better self-regulation in sports training intensity [14]. In contrast, heart rate variability is a diagnostic early indicator for the development of arrhythmias and other heart-related diseases [13].
The second research line focuses on the representation of the morphology of ECG signals, supported by the fact that pathological states usually correspond to specific changes in the ECG signal shape – with applications to facilitate and support diagnostic tasks [15,16].
In summary, ECG sonification is a recognised field, particularly for sonification to monitor and detect cardiac pathologies. To our knowledge, however, more elaborate / detailed sonifications are yet in the state of basic research, as complex sonifications are usually not integrated in medical devices nor professional procedures.
Previous research introduced ECG sonification with a focus on the ST segment. Its elevation was represented by various sonic means, such as using a formant synthesizer for the polarity sonification, synthesized water drop sounds for the water ambience sonification, or a subtle morphing between timbres in the morph sonification [4,5]. These approaches allowed a general perception whether the ST segment is elevated, but did not enable to perceive the spatial distribution, i.e., in which orientations / projections ST elevations or depressions occur. To make these spatial patterns stand out clearly , the present study introduces an approach similar to what is known as temporal nesting in the field of parameter mapping sonification [17].
Another focus of our previous research in ECG sonification was the development of an auditory magnification loupe, which allows to perceptually magnify changes of a variable so that subtle changes of values become highly salient. For instance, subtle rhythmic irregularities, too small to perceive directly from a change of rhythm, have been mapped to pitch deviations, thereby turning them into highly salient cues [18]. Although we are taking a different approach here, this method is a promising option for future projects, for instance to emphasize relative changes compared to a reference ST elevation profile.
3. Conceptual Design of ST Elevation Sonification
In this section we unfold the key ideas for the ST elevation sonification, both concerning the relevant properties of the data including the feature extraction and the sonification techniques including various novel designs to anchor the sonification to the QRS tone that serves as given and known baseline auditory display in emergency settings. We here focus on the conceptual level and address aspects of software architecture, sound computing and the embedding of the sonifications into the acoustic ecology to Section 4 and Section 5.
3.1. Electrocardiography
The electrocardiogram (ECG) is the (usually visual) display of a recording of the heart’s potential differences of cardiac muscle cells over repeated cardiac cycles. The potential differences are measured via electrodes placed on the skin. There are standards for depicting the resulting set of curves as amplitudes over time. The voltages depend on various factors such as the thickness and activation of the heart muscle, the distance between electrode location and heart, and the type of the surrounding tissue (e.g. fluid or fat) [10]. Usually more than two electrodes are used and thus the electrical activity can be assessed from different angles (i.e., projections), which provide clinicians with relevant information for (mal-)function [16]. The standard ECG uses 12 leads, including the 3 limb leads, 3 augmented limb leads and 6 precordial leads, thus offering rich spatial information.
Figure 1.
ECG signal with moderate ST elevation, data is typical for what was used for the sonification presented later.
Figure 1.
ECG signal with moderate ST elevation, data is typical for what was used for the sonification presented later.
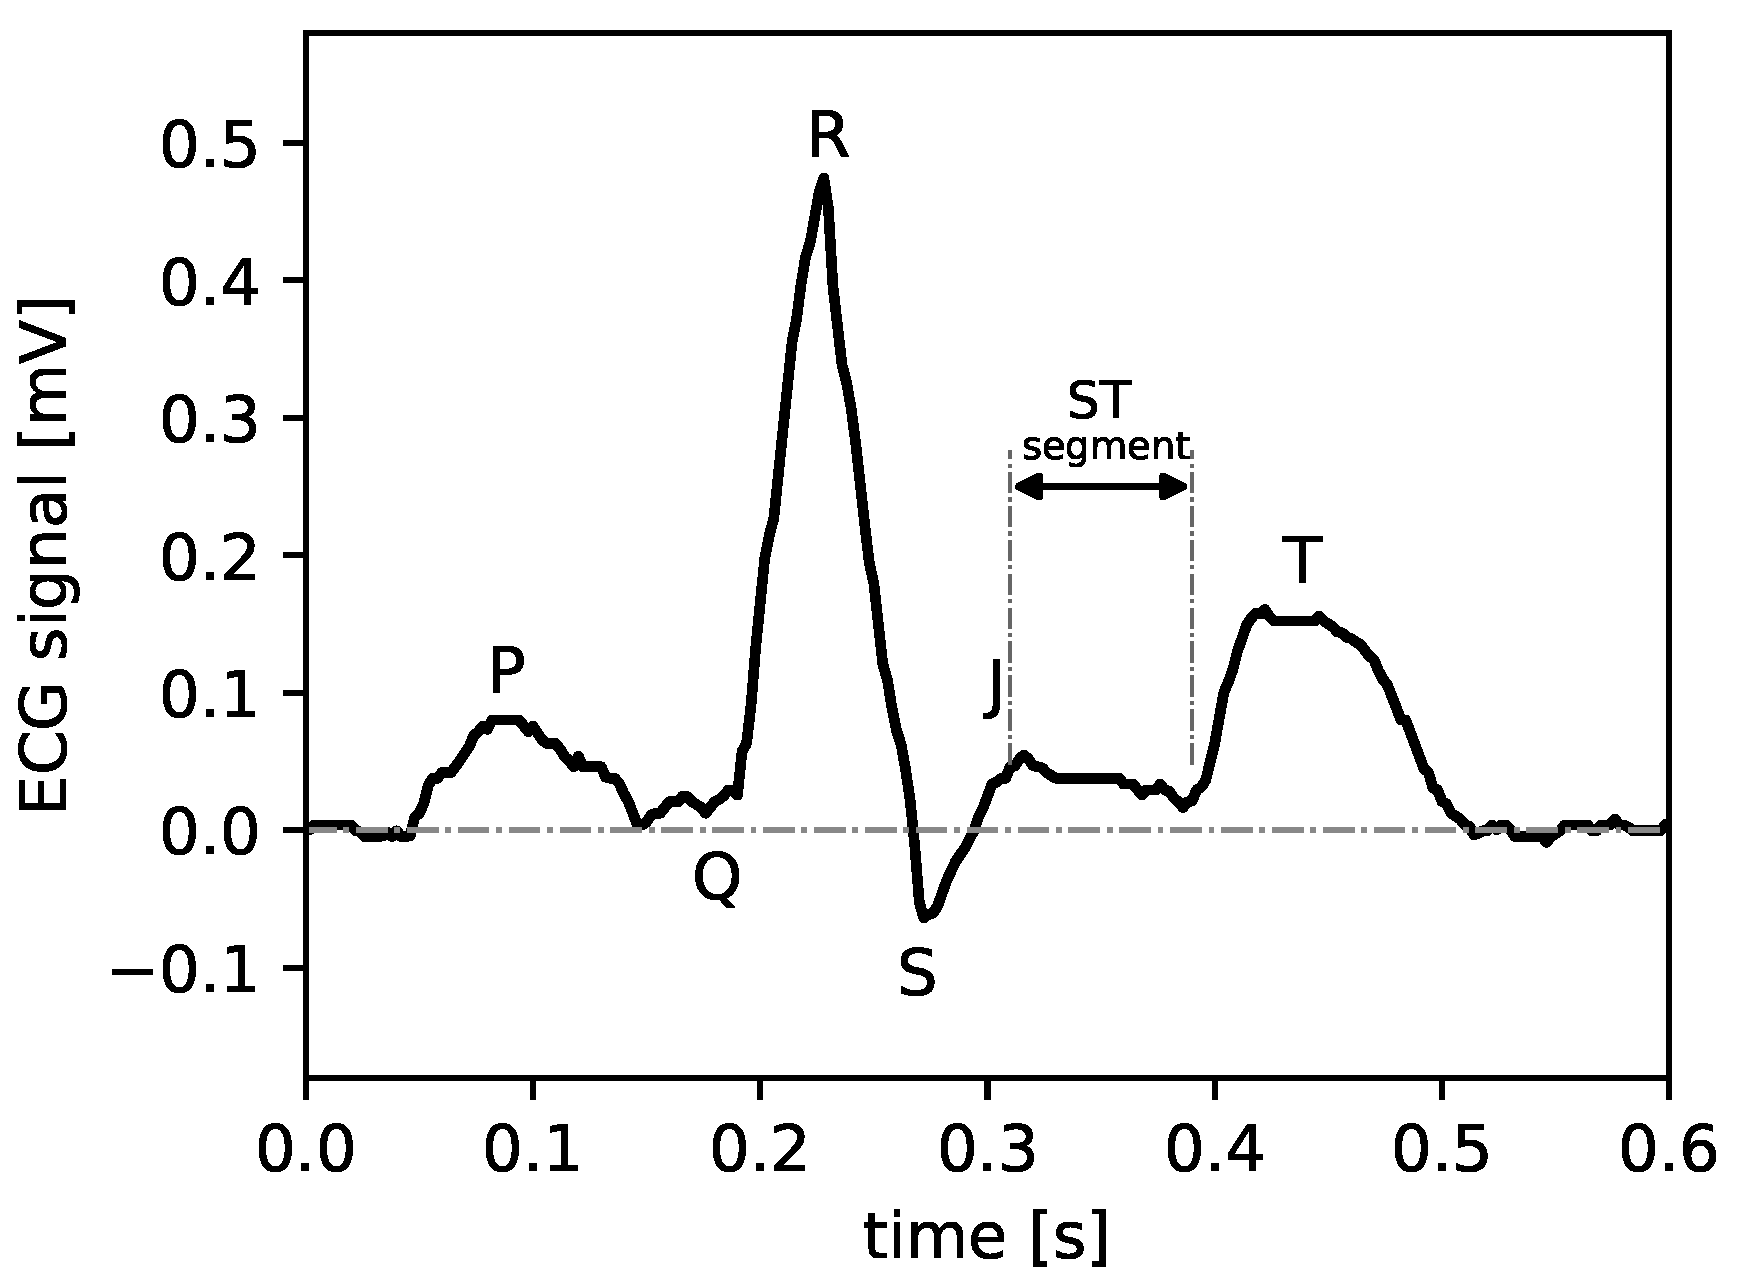
Concerning the temporal structure of the ECG, the time series can be divided into the following parts which represent different states of the heart’s cycle (see Figure 1), since the approximately periodic repetition of depolarization and repolarization causes a contraction followed by a relaxation of the heart muscle: (i) the P wave results from the depolarization of the left and right atrium, (ii) the QRS complex represents the depolarization of the ventricles, whereby the repolarization of the atria is usually masked by the QRS complex, and finally, (iii) the repolarization of the ventricles manifests as the T wave.
The references (P, Q, R, J, S, T) are usually used to pinpoint heart abnormalities. In particular, the ST segment, i.e., the J point, the beginning of the ST segment, may deviate from the ‘healthy’ state which is ‘isoelectric’ (IE), i.e., exhibits neither elevation nor suppression. Deviations from that isoelectric state could be caused by a blockage of coronary arteries. These conditions are important for the subsequent feature selection and proper choices for the sonification method to maximize diagnostic value for assessing STEMI conditions.
3.2. Feature Extraction
As data we use a 12 lead ECG which we extract from simulation runs of the ECG generator of the Laerdal Resusci Anne Advanced SkillTrainer training device. The reason for this choice of data source is that we conduct a subsequent user study to evaluate a selected sonification in a scenario study for which a patient mannequin will be used and Laerdal will be used to compute and present real-time data (to be published elsewhere). For the sake of brevity, we have omitted some technical details on the extraction of the raw data, which do not contribute anything relevant here, and assume 12 signals (leads) to be given as time series for lead . We furthermore assume that all signals are already appropriately band-pass filtered such that values 0 correspond to isoelectric states and no high-frequency noise pollutes the readings. Figure 2 depicts one of the data sets we use for feature extraction.
As our main objective is to develop a method that conveys information about STEMI, we used the Laerdal ECG generator to create ECGs according to two controlled parameters, one being the direction (anterior vs. inferior), the other being the severity (weak, moderate, severe), thus resulting in data sets, in total 7 when counting the IE condition. To keep the study focused, we did not vary the heart rate and adjusted it to 80 bpm for all data sets. Excerpts of two seconds duration of the resulting six data sets are depicted in Figure 3.
The key features here, assuming properly calibrated readings in terms of V/unit, are the ST elevations. Briefly, these features are extracted from the raw data using the following method. First, we identified the locations of R-peaks. To this end, is calculated and rescaled to range . Second, the peak finder algorithm peak_find() from Python/SciPy is utilized, using a peak height of 0.5 and peak distance equal to 30% of the sampling rate, which is resampled (down) to 100 Hz from the given data at 500 Hz. Peaks are accurately discovered for the given data, however, we acknowledge that for arbitrary real-time data from real sources a more elaborate approach might be required, which is, however, beyond the scope of the present study. Figure 3 depicts excerpts of the extracted R-peak locations.
For the data sets at hand, we subsequently extracted the ST elevation (resp. suppression in case of negative elevation) by calculating the channel-wise median of all data within the [10%, 20%] time interval of the heartbeat, so that 0% and 100% refer to the current and subsequent R-peak time point, respectively. The resulting ST elevations are depicted as red horizontal line segments in Figure 3, and match medical expert (selected authors of this article) evaluations of accurate ST estimates. For pragmatic reasons, we refrain from discussing a more generally applicable feature extraction to maintain the focus on feasible sonification designs.
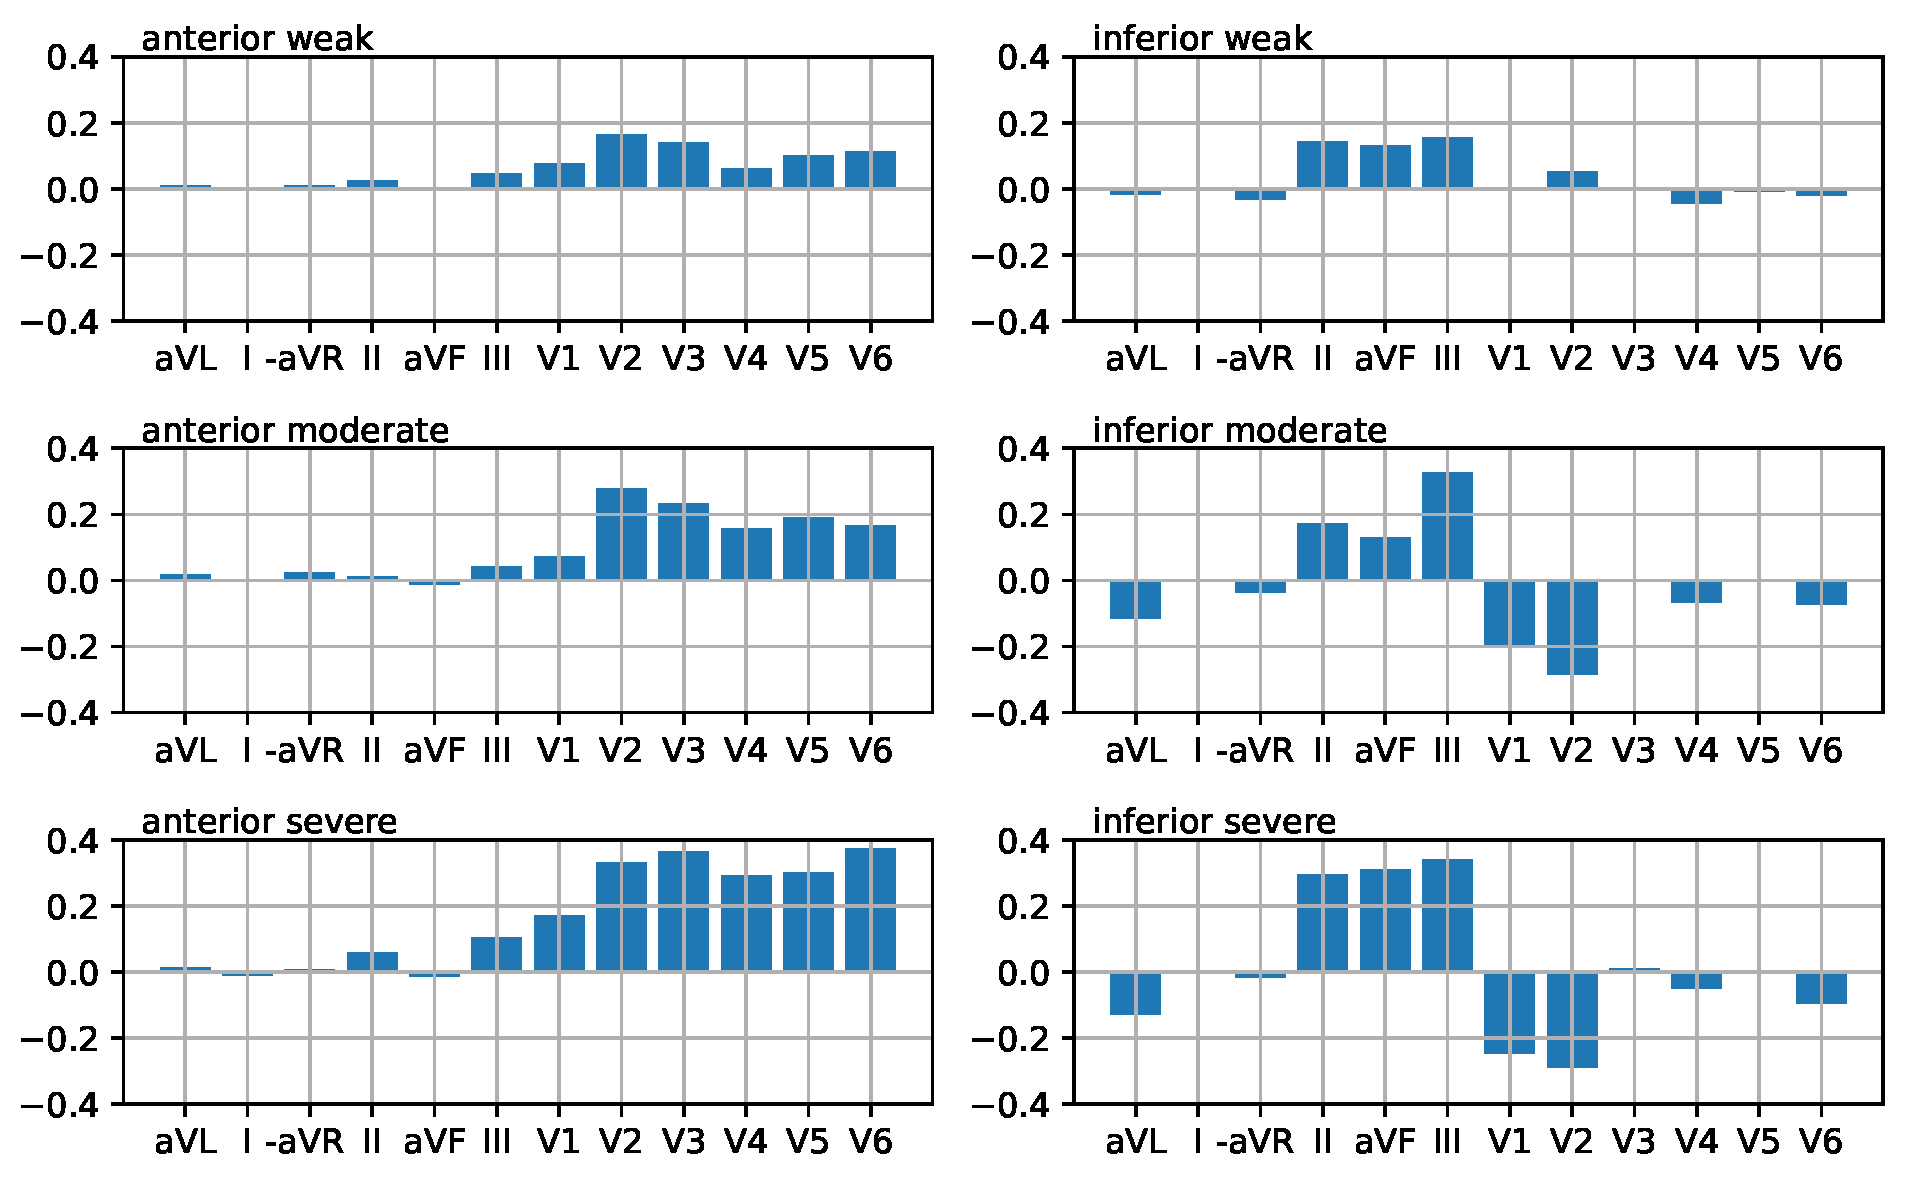
While this representation of ST displacements as depicted in Figure 3 appeals to medically trained users, we additionally present the data as parallel coordinate plots (Figure 4), so that ST elevation profiles can be more clearly discerned. Note that the order of leads (limb leads followed by precordial leads) does not correspond to a neighborhood relation, rather, the connection of points by solid lines is used to support perception. Where appropriate, the limb leads will be ordered as aVR, III, aVF, II, I, aVL, i.e., via inferior to lateral, or alternatively in the order aVL, I, −aVR, II, aVF, III.
These 12-dimensional ST elevation vectors provide the starting point for the sonification designs introduced in the following section.
3.3. Sonification Designs
The purpose of the sonifications is to yield detailed information about the ECG with respect to STEMI situations, particularly in emergency settings where many tasks, persons and displays compete for the physicians’ attention. Therefore the designs should offer sound as salient as necessary but as unobtrusive as possible at the same time. Verbal cues (a corner case of auditory display) are not applicable in the given context due to their disturbing interference with the verbal within-team, team-hospital, and team-patient communication. Auditory information is superior to visual information due to the ambient character of sound in contrast to the visual focus or position of a crew member. As the ECG is already the point of reference and iconically connected to the beep sound of the QRS tone, we regard it as a natural and proven choice to anchor the auditory representation to the aforementioned sound stream and augment it by detailed information that should be intuitively associated to the heart’s electro-mechanic condition.
There are multiple sonification techniques such as audification, model-based sonification, wave space sonification, parameter-mapping sonification, parameterized auditory icons and earcons, to name the basic categories [19]. Each method requires specific conditions to be applicable, such as the amount and structure of data. In view of the given 12-dimensional vectors, parameter mapping sonification (PMSon) (cf. [17]) is an obvious choice. PMSon is a highly flexible method in connecting analog data (such as the continuous values of ST elevation) with sound synthesis parameters that shape perceptual qualities such as pitch, sharpness, loudness of sound events. Choosing sound events that correspond to meaningful sounds in the world allows to connect PMSon with Auditory Icons, hence creating hybrid approaches. We introduce and unfold a number of designs in the following focusing on analogic representations [20], i.e., the actual (raw) ST elevations should on variation cause perceivable variations of their corresponding sound. This contrasts with symbolic representations that condense the raw data into one or a few semantic units conveyed as notifications which require learning. The motivation for analogic sonification designs is to draw the users’ attention to significant changes as early as the real-time data allows – in order to avoid the manifestations of critical states by recognizing incipient transitions towards alarming situations. Noteworthy, automatic classification is biased toward false positive results and may therefore mislead users. Furthermore, it has previously been shown that analogic auditory representations to assist secondary tasks within the scope of process monitoring have the ability to switch the operation mode from problem solving to problem anticipation [21].
3.3.1. Sonification Concept 1: Heartbeat-Locked ST Elevation Arpeggio
In practical ECG recordings a fresh 12-dimensional ST elevation vector will be available for every heartbeat. One option to inform users at the least latency is to append sonification directly to each QRS tone . For subsequent demos we play a short noise burst to mark the QRS onset, thus enabling to use the display alone or later as augmentation to existing heart monitors. We propose to generate a sequence of 12 tones, played in a very short succession merging into an arpeggio. Each tone thus represents one lead appearing in the order as plotted in Figure 4, with a musical pitch along a musical scale to be chosen. For instance, a sequence of 12 tones along a pentatonic scale, or 6 tones on a diatonic scale for the limb leads and the same 6 tones transposed up by one octave for the precordial leads is an option. Alternatively, the 12 semitones of an octave can be used, but this would not result in desired aesthetic sounds. This design concept offers multiple modes for mapping the available data to sonic variations, thus turning data into a musical structure. A few sub-designs deserve special mention:
Design S1.1: tones played longer and louder if the corresponding lead is elevated or suppressed, dull (resp. medium, sharp) for suppressed (resp. isoelectric or elevated) ST segment...
- a.
- with diatonic sequence [0, 2, 4, 5, 7, 9, 12, 14, 16, 17, 19, 21], i.e., major scale, precordial leads transposed by one octave (i.e. 12 semitones offset): Sound examples1 S1.1a.wav for the 6 STEMI conditions [weak anterior, moderate anterior, severe anterior, weak inferior, moderate inferior, severe inferior], 3 heartbeats for each condition.
- b.
- with pentatonic scale [0, 2, 4, 7, 9, 12, 14, 16, 19, 21, 24, 26]: Sound examples S1.1b.wav for the 6 STEMI conditions as in the previous item.
The design patterns are clearly discernible, since an isoelectric ST in all channels leads to an uprising arpeggio of short unobtrusive tones, whereas individual non-isoelectric notes stand out. Affected leads are identified by pitch and location in sequence, whereby the octave suggested in variant a) is addressed to musically trained listeners, thus provides another cue to discern limb vs. precordial leads.
Design S1.2: percussion sequence: In this design, the channel is solely identified by its position in the sequence. In turn, the pitch remains free to convey the ST value, quantised as either in , below or above using 3 drums of increasing drum tension from suppressed via around zero to elevated. The neutral sound (ST around IE) was given a much higher damping so that it doesn’t dominate the sound. We find that inter-tone-intervals of , as used with the previous method, is very fast to discern the rhythm, yet with higher inter-beat intervals that better fit our ability to perceive rhythms in music, the 12 beat sequence would often extend over the onset of the subsequent heart beat. Yet even with very fast sequences, it seems to be possible to discern roughtly where (limb leads or precordial leads) and how many accents are associated with corresponding parts of the vector (e.g. is more elevated or suppressed). Sound example S1.2.wav illustrates the percussion sequence for the 6 conditions, again, showing 3 heartbeats, with 1.5 seconds gap between conditions. The repetitive nature likely reduces acceptance for using it as a permanently playing process monitoring over extended periods of time.
Design S1.3: vowel transitions: In this design we adapt the design S1.2, replacing a sequence of 12 drum hits by a single utterance of a vocal tract, mapping ST values (again quantized in the three levels suppressed (below ), around IE and elevated (above )) to a German pronunced vowel, namely ’o’ (as in bow), ’a’ (as in bath) and ’i’ (as in bee). The Vowel class in Supercollider [22] serves to compute formants for a male bass voice excited at Hz, smoothing transitions (implemented via blend() by means of SuperColliders Lag Ugen). Sound example S1.3.wav presents the auditory representations of 3 heart beats for each of the 6 aforementioned conditions, with a 1.5 s gap in between. The continuity of the sound streams reduces the required attention. The vicinity to verbal sounds activates own language processing skills and might help memorizing patterns compared to rhythms or melodies. As a disadvantage, articulatory speech sounds might interfere with vocal interactions between EMS personnel and could affect mobile phone conversions as they are probably not filtered out properly by environmental sound filters.
–
In summary, all designs mentioned so far are rich in information, capable of conveying beat-to-beat variations of the ST profile. However, this comes at the cost of generating highly repetitive sound chunks that may become quite boring or obtrusive on extended listening. Also, assuming a heart rate of 80 bpm at rest, the speed of the arpeggios / rhythm is already high. This might not be the best presentation for sustained use. Therefore, we propose alternative paradigms by introducing the following concept.
3.3.2. Sonification Concept 2: Musical Phrase Melody over Several Heartbeats
While developing concept 1, it became clear that the heart beat can serve as the bars in the sense of a metrum in musical notation. We suggest to compose a musical motif that spreads over several bars to convey information over a longer / extended time interval. This entails that the ST vector will only be updated every k heartbeats, with k being a small number (e.g., ). Specifically, the sheet notation in Figure 5 illustrates a typical melody using a 3/4 (waltz) rhythm as in a minuett.
Note that aspects such as note length (1/4 vs 1/8) or accents can be assigned according to the actual ST elevation prevalent in the corresponding channel. Notes could even be replaced by silence (i.e. a pause) if the lead’s ST is isoelectric. As a constantly repeating melody quickly becomes rather boring or annoying, one could even further reduce its occurrence density, e.g., playing it only every 10th heart beat, or even just once per minute, or at higher frequency as there is a clear deviation to the 12 lead ECG initially inspected visually (as reference, at the first contact with the patient).
Using musical instruments such as a cello allows to use different phrasings such as playing a note percussively and quietly for low absolute ST (pizzicato), playing the note bowed and loudly for high absolute ST (arco / marcato). Sound Examples S2-*.wav illustrate this approach for the 6 selected conditions (weak anterior, moderate anterior, severe anterior, weak inferior, moderate inferior, severe inferior) STEMI. Note that the cello notes for leads where exceeds mV are transposed one octave down in case of ST suppressions.
Manifold variations are possible, such as using different musical instruments for leads 1–3 / aVR aVL aVF / V1-V6, or for elevated / suppressed. For instance, assigning a piano for limb leads, a wind instrument such as a flute for the augmented leads and a string instrument such as the cello for the precordial leads. Such a multitimbral approach might help listeners to more easily attribute the sound, however at the cost of requiring to learn the associations. Mappings as proposed here fall in the field of parameterized Earcons: motifs and timbre selection is a key element, however, the mapping of data features to phrase lies between analogic and symbolic representation, virtually letting the sound ‘speak for the data’.
On the one hand this procedure could be acceptable for practical use, on the other hand it might be regarded a bit too playful, unserious, and too dependent on the memory of a specific melody. In our experience, we dislike being entrained into melodies that won’t get out of ones head, such as from mobile phone providers wake-up melody or ring tones designed as audio branding to associate a specific mobile phone company. For that reason we refrain from pursuing this approach and rather focus on the third and last design (for this paper).
3.3.3. Sonification Concept 3: Grouped Lead Scans
The key idea for the further procedure is to design a sonification between the first design (all data for each heart beat) and the second (a strongly distributed representation). That means to use sufficient time but not more than necessary for targeted representation. In addition, we aim at keeping the sound as simple as possible such that the memory of the melody is not overstrained. In our assessment, this level of detail is compatible with a typical duration of about 10-15 seconds, within which the melodies can be memorized. Hence, time intervals in between repetitions are left silent, which appears as the best choice for designing the display in terms of cognitive load. As a refinement to the limb / augmented / precordial order, we decided to use the Cabrera circle for limb and augmented leads, i.e., the order aVR, III, aVF, II, I, aVL as depicted in Figure 6, thus obtaining two groups (vectors) of 6 elements each, which also fits into the amount of memorable items (5–7).
We align the presentation of these groups to the QRS tone of a heartbeat as a trigger, but keep the inter-tone interval constant and independent from the heart rate, at the most ideal rate possible in terms of scanning. We acknowledge that listeners may prefer low scanning rates in the beginning but may prefer to speed up the rate with a growing routine, similar to the observation that visually impaired users speed up screen readers or language learners are able to decipher faster speech with increasing skill. Because the position in the sequence already determines the lead, we keep pitch – probably the most salient perceptual quality of a tone – free for displaying the ST elevation. This choice is supported by the fact that most listeners intuitively associate pitch with vertical displacement, whereby higher pitch is regarded as higher above ground. While we acknowledge that this might not be a universal mapping it is probably the dominant association, and we adopt it for that reason and refer to studies on polarity in mapping by Walker (cf. [23] for further details). Representing ST elevation by pitch, however, calls for the definition of the reference (i.e., the pitch to be used for isoelectric ST), because pitch is a continuous attribute without inherent zero-point. However, we can provide a clear reference using the pitch of the QRS tone. ST tones higher (resp. lower) than that should represent ST elevations (resp. suppressions). This still leaves a large design space with various options, e.g. whether to discretize or use continuous values for the mapping. Such variations will be illustrated below. As to the intensity, we acknowledge that the ECG will naturally have some variability and in turn there will be threshold below which elevations or suppressions are possibly clinically irrelevant such that related variation in the sonifications may rather mislead or irritate the users. In contrast, large elevations and large suppressions should stand clearly out, which can be implemented by using a nonlinear mapping to sharpness and/or modulation and/or sound level. In summary the sonification scheme reads:
- on each heartbeat play the QRS tone
- every kth heartbeat (e.g. ) play a sequence of 6 notes for limb leads in order aVR, III, aVF, II, I, aVL, via inferior to lateral, with pitch encoding ST level, relative to the pitch of the QRS tone. In addition, outside a ‘healthy’ range use larger sharpness, or modulation
- on the heartbeat (d = 1, 2, or 3 adjustable) play 6 notes for the precordial leads V1...V6, i.e. from septal via anterior to lateral, using the same mappings as for limb leads, in addition (if necessary) another timbre in case users can’t distinguish the order of the groups.
This procedure defines an absolute mapping – alternatively, it could be defined as relative mapping, i.e., pitches chosen relative to the corresponding ST elevations initially recorded 10 s ECG’ as the reference.
To explore the still large space of possible mappings we constrained the design space by introducing sonification hyper-parameters to configure the sonification. The first refers to the pitch mapping used for specific designs. We regard the most important factor to be the spectral (or pitch) mapping, i.e., how ST evaluation will be mapped to the tone’s pitch. We considered and implemented the following variants:
- continuous mapping: the ST elevations are mapped linearly to pitch, corresponding to an exponential mapping to frequency. A suitable source interval is V, a suitable target interval is a musical fifth, i.e. 7 semitones on the chromatic scale down and up, i.e. , cf. Section 4 for details on the implementation in Python.
- chromatic mapping: starting from the above-described continuous mapping here we round (i.e., discretize) the pitch value (represented in MIDI notes as float) to integer values, resulting in pitches as they occur on the chromatic scale, i.e. tones available on the piano keyboard (though we don’t need to use any specific musical instrument)
- diatonic mapping: here we choose all tones of two octaves (excluding the octave below and above the center tone) and map the source interval V to the index in this array of notes, thus we obtain a musical interval (when relating the tone to the QRS pitch) which we are highly familiar with from Western music and which are rather easy to recognize: tonic, major second, major third, forth, fifth, major sixth and major seventh.
- 5-state mapping: here we discretize the ST elevation into 5 levels: severe suppression, weak suppression, IE, weak elevation, severe elevation) using two thresholds (, ) and the sign of the value for group selection. As pitch mapping we experimented with a harmonic choice, i.e. the tones should fit to a major chord, choosing the tones e, g, c’, e’, g’ from negative to positive, or [-9, -5, 0, 4, 7] as semitone offset to the pitch of the QRS tone.
- 5-state-dissonant mapping: this is a variation of the previous 5-state mapping, but here we chose the extrema of the pitches to be dissonant to elicit a clear feeling of discomfort, i.e. such sounds should draw more attention as they are more disturbing or unpleasant (when being heard together with the QRS tone). Specifically we tried a major 7 down and a minor 6 (augmented 5) up, particularly the major 7 down has much friction with the reference.
-
Tristate mapping: here we discretize the ST elevation in just three niveaus: For each specific ST elevation s we use
- -
- For : a lower pitch, e.g. a forth below the reference
- -
- For : the reference pitch
- -
- For : a higher pitch, e.g. a fifth above the reference.
The next sonification hyper-parameter is the channel mode, which determines whether channels should be organized along the Cabrera circle (i.e., in sequence aVL, I, −aVR, II, aVF, III) or counterclockwise (i.e., in sequence avR, III, aVF, II, I, aVL).
Three further parameters refer to the temporal organization: (i) inter-tone interval [s] controls how fast tones play in both limb and precordial group, (ii) stride controls the gap (in heart beats) between sonification initiations, and (iii), separation specifies the gap (in heart beats) between the limb lead and precordial lead group. Through experimentation we found two feasible settings, firstly, a slow setting ( s, separation = 8 heart beats, stride = 2 heart beats) leaving enough time for the listener in order to cognitively process the meaning transferred by each tone and gap before the cycle starts anew, and secondly, a fast setting (0.08 s, separation = 4 heart beats, stride = 1 heart beat) where all tones are basically presented between two heart beats (at least at 80 bpm). While of course all settings in between are possible, the two being selected correspond to the two modes: the novice (learner) mode and the expert (pro listener) mode.
Finally, the overall level of the tones relative to the QRS tone level needs to be adjusted in deciBel, which we attempted by a dB offset – nevertheless we added a dBscale parameter for fine calibrating the loudness mapping.
The following supplementary material contains sound examples for the proposed pitch mapping modes (continuous, chromatic, diatonic, 5-state, 5-state dissonant, tristate), furthermore samples corresponding to the 5-state mode sonifications using different speeds ( specifies the time between notes in seconds), stride (6 and 8), and set separation (1 or 2).
- The 30 sound examples S3.1–S3.30 are titled in a self-explanatory way, specifying mode, condition, , stride and separation. We recommend to listen to files in blocks of 6 that belong to the same mode and only vary in condition.
- Sound examples S3.31–S3.34 all correspond to a single selected condition (inferior moderate) but with different , stride, and set separation. For instance sonification example S3.34 is a fast and dense and may be the setting of choice if ST elevation changes are expected and should be detected not later than 3 heart beats. S3.31–S3.33 show a slightly faster lead sequence ( ms) with different modes.
We obvserved that with increasing familiarization, faster settings can be well processed.
4. Implementation of ST Elevation Sonification
For the purpose of real-world medical applications, we eventually target the integration into standard ECG recording devices in cooperation with device manufacturers. However, for method development and testing, a standard computer platform offers higher flexibility and facilitates interaction and plotting of data. We use Python 3.10 with numpy/scipy/matplotlib for data processing and plotting, our self-developed mesonic Python package as middleware for parameter mapping sonification [24]. With mesonic we abstract from the sound rendering backend, nevertheless we utilize SuperCollider3, a powerful sound programming system, for sound rendering. As interface between mesonic and SuperCollider3, our self-developed Python package sc3nb [25] is used.
The code snippet in Figure 7 illustrates how ST elevations are mapped to pitch and subsequently to audio frequencies according under the different pitch mapping modes. Note that midicps converts pitch (as MIDI note) to fundamental frequencies in Hz and the linlin function maps the x from to .
5. Sonification Demonstration and Method Selection for Evaluation
The above introduced sonification methods demonstrate how flexible and versatile sonifications can be crafted, even under the narrow constraint of using just the 12 lead vector of ST elevations, and even when narrowing the methodical focus even further to PMSon based designs. Due to the sheer amount of possible designs, a comprehensive evaluation of all variants is not feasible. Therefore, design criteria and validation have been based on expert reviews involving clinical partners, coauthors, and selected colleagues with different expertises. For that purpose, we developed a real-time sonification player and demonstrator that allows to interactively select sonification hyper-parameters via pop-down widgets and sliders as depicted in Figure 8.
Figure 8.
User interface to explore the parameter space of mappings within the sonification designs of concept 3. Parameters are (from top to bottom) (i) STEMI condition (cf. main text), (ii) heart rate (bpm), and hyperparameters to configure the sonification being (iii) the spectral mapping mode (chromatic, diatonic, 5 state, tristate, 5-dissonance), (iv) the channel mode (Cabrera vs. counter-clockwise), (v) the inter-tone interval dt, (vi) the gap between sonification initiations (stride), (vii) the separation of groups of 6 channels in heartbeats (separation), (viii) the overall level of the tones relative to the QRS tone level in dB and (ix) dBscale (fine calibrating the loudness mapping).
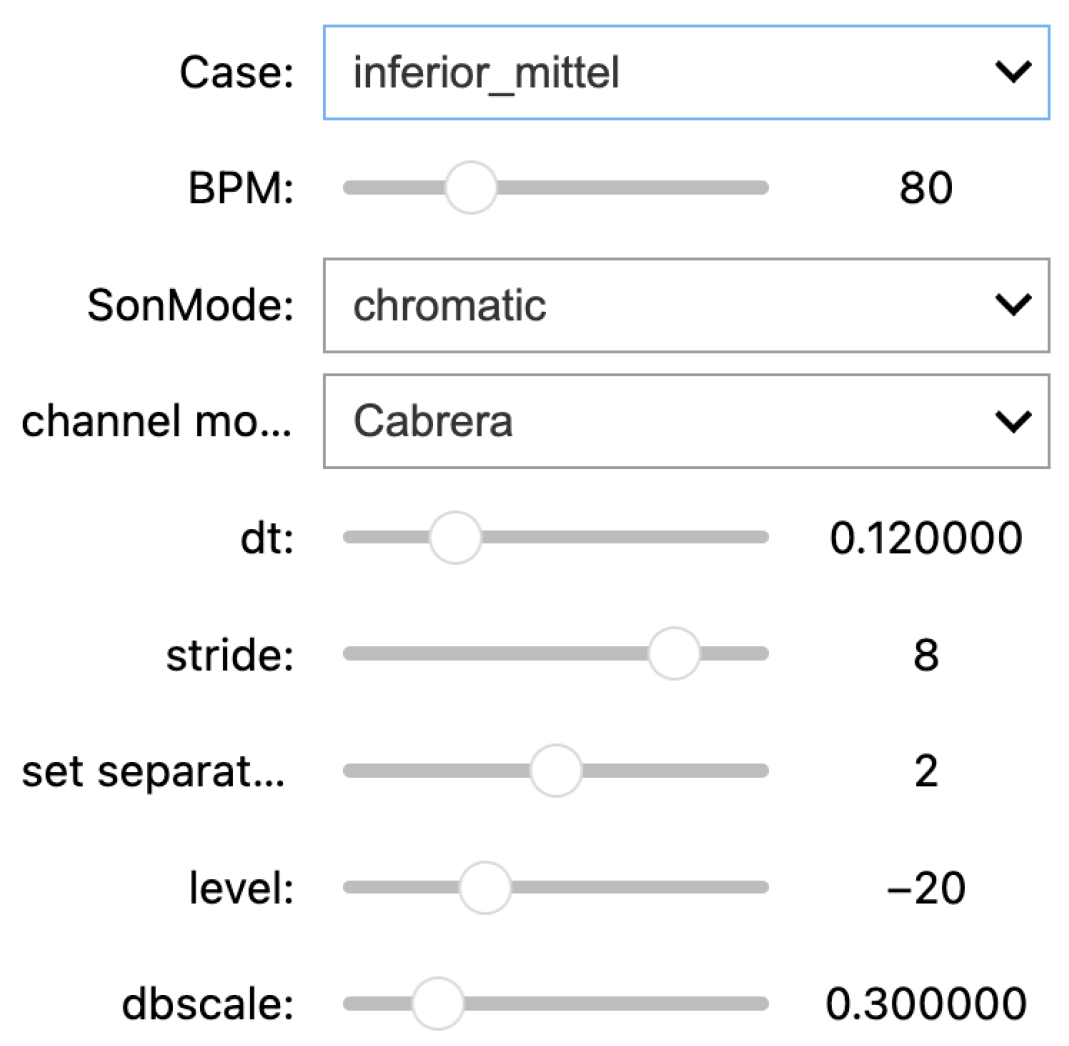
Figure 9.
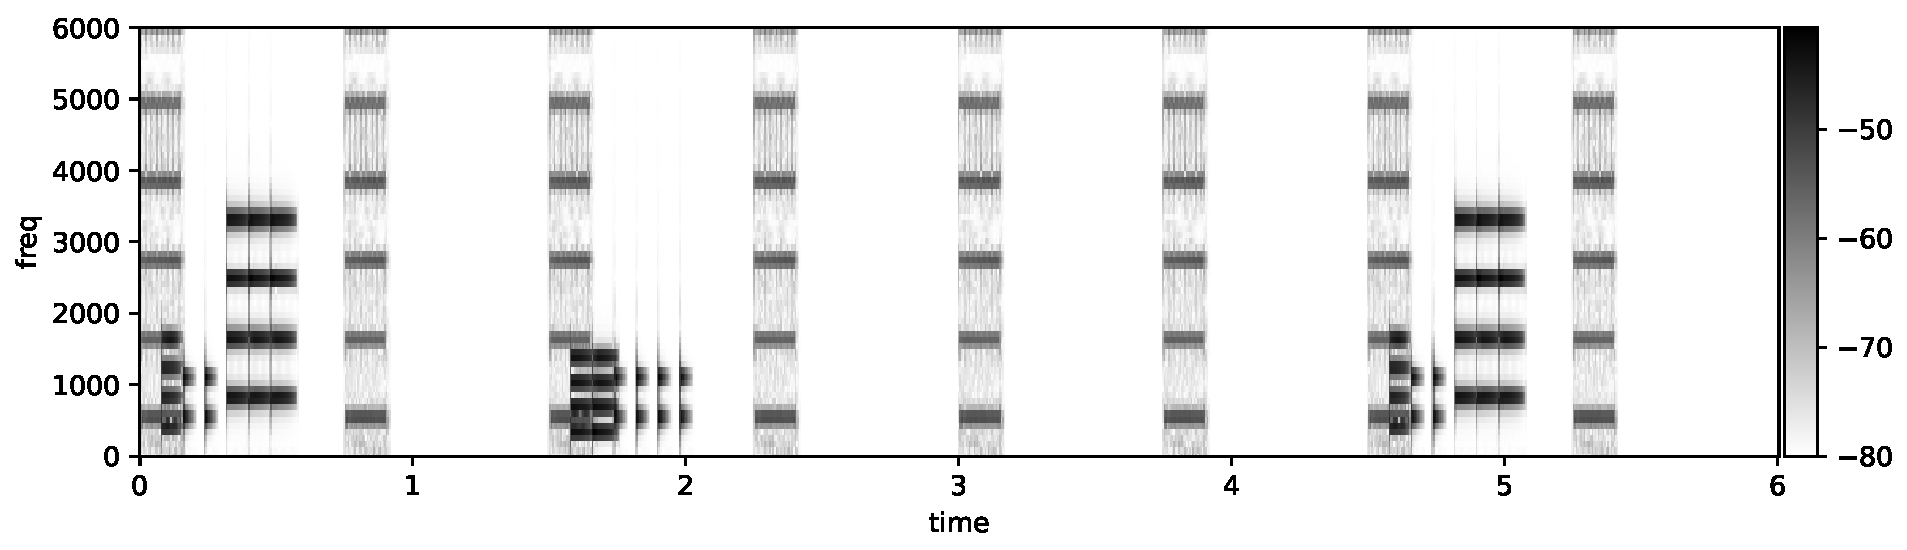
Short-term Fourier Transform of the inferior-severe sonification using 5-state-mapping mode: after QRS tone 1 and 7 we see the 6 limb lead ST elevation tones, after QRS tone 3 we see the weaker precordial ST elevation tones.
Figure 9.
Short-term Fourier Transform of the inferior-severe sonification using 5-state-mapping mode: after QRS tone 1 and 7 we see the 6 limb lead ST elevation tones, after QRS tone 3 we see the weaker precordial ST elevation tones.
The key criteria for selecting the design and setting suitable hyper-parameters, i.e. for model selection, were:
- Comprehensibility:
- the 5 pitch levels are few enough to be understood correctly without much training, the low presentation speed allows to follow the pitch contour.
- Dominant Perceptual Quality:
- the presentation speed is fast enough so that the six channels in each block are perceptually grouped in one cluster, forming a pattern or gestalt, similar to how raindrop sounds fuse to the perception of rain, or a sequence of knocking sounds merge to the interaction of a woodpecker with a tree. This grouping facilitates the association of groups to lead groups. Users thus are not challenged to interpret individual leads.
- Aesthetics/pleasantness:
- the sound should be pleasant to hear, e.g., not too frequent, not too harsh or loud. This motivated the selection of dB, musical intervals for the two elevation pitches and the two suppression pitches. The isoelectric pitch is already given by the pitch of the QRS tone.
- Memorizability:
- is an important characteristic optimized with design 3, as it involves only two groups, and the sequence is topologically ordered (Cabrera circle resp. counterclockwise)
- Compatibility with environmental sounds:
- note that the selection of sounds as synthesized sounds instead of using real-world sound samples or physical model-based sounds is useful as it avoids any confusion with ambient sounds. In addition, the sounds are selected to avoid interference with speech / vocal interaction. The pitches are in a middle/upper range of musical frequencies, where the sensitivity is high and low-cost loudspeakers easily project the sounds over several meters.
- Backgrounding and Saliency:
- the sound streams should be regular (e.g., in rhythmic and temporal organization) to facilitate that listeners can habituate to these sound streams. Habituation is a perceptual skill allowing to ignore sound streams (in favor of other tasks or sound streams) yet to remain sensitive to relevant changes in those background streams. An example is the sound of the refrigerator in the kitchen, or the exhaust in out-dated fossil fuel driven automobiles, which drivers clearly hear but can ignore until their sound pattern changes due to malfunction. However, mapping absolute ST values to more extreme pitches and sharpness, changes can be expected to be salient enough to draw the listeners’ attention.
- Universality:
- musical sounds are perceived according to the cultural background. The current choice of intervals, however, is largely driven by consonance, which is a more universal feature: the octave is a preferred interval in most musical communities, and the fifth and fourth are generally preferred consonant intervals.
Based on these criteria, we proceeded with design selection and method fine tuning. We have tested multiple variants, including how it would appear at various realistic heart rates.
Concerning the channel model we decided to play limb leads counterclockwise, and to negate (invert) lead aVR, so that the series becomes: aVL, I, −aVR, II, aVF, III as depicted in Figure 6 and Figure 4(b). The clinical reason for this procedure is that by doing so we have the ST elevations of the limb leads clustered. The resulting channel mode is the sequence of limb leads counterclockwise und precordial leads counterclockwise (viewed from the top downwards).
Regarding he temporal organization (i.e., set separation and stride), the clinicians rated to be a lower limit – since they believed that students otherwise could not properly resolve the channels. The slower version was regarded as being easier to learn and to comprehend, particularly within the scope of a study that leaves little time to familiarize. From a perspective of musical structures where patterns often take 4, 8 or 16 bars, a stride of 8 heartbeats between repetitions of the sonification were subjectively preferred. To obtain a clear separation of the limb and precordial lead groups, a separation of 2 heartbeats is the minimum, i.e., limb leads/augmented leads played after the first beat, precordial leads starting with the third beat.
Regarding the pitch mapping, the tristate appeared to be `too coarse` and not providing enough detail. On the contrary, continuous mapping and chromatic mapping offered too much variability to be processed at manageable effort. Further, it appeared to be less aesthetic with many intervals that do not fit. This directed our attention towards the 5-state sonifications, which were preferred by the clinicians, taking into account their expertise with medical alerts, soundscapes in operation theatre and emergency situations. It was regarded to offer the highest discernability and lowest risk of alarm fatigue. If non-urgent or even false alarms are repeatedly detected by nurses or other staff, alarm fatigue may be the result and staff might not react in proper time if genuine emergency alarms are sounding [26]. The ’5-state-dissonant mapping’ was regarded as compelling concerning the quality of sound: dissonant sounds would stronger call for users’ actions to resolve a precarious situation. However, bearing in mind that a 5-minute or even longer journey to the hospital is involved, then the constant need for the emergency crew to listen attentively to dissonant sounds while not being able to do anything about it will probably be pointless, which is why we eventually opted for the more pleasant/consonant ’5-state mapping’.
Figure 10.
ST elevation plots: left: anterior STEMI, right: inferior STEMI, from top to bottom: weak, moderate, severe. Data corresponding to the 6 cases derived from Laerdal simulator data as explained in Sec. 3 and shown in Figure 4. Plots used as visual reference to familiarize trial subjects within the scope of the classification study explained in Sec. 6.
6. Classification Study Design
6.1. Overview
The local ethics committee of the Ruhr University Bochum, situated in Bad Oeynhausen, Germany gave approval (file no.: 2022-1017). The study followed the principles of Helsinki.
The entire study consisted of a perception and STEMI classification study using audibly presented (sonified) ECG sequences as well as a scenario study in form of a randomized controlled trial (RCT) in order to compare a sonification-assisted with a standard visual-based diagnostic process in an emergency situation. Here, we focus on the perception and classification part, whereas the results of the scenario study will be published elsewhere. In addition, basic epidemiological parameters had been collected and questionnaire-based surveys were carried out. A first survey regarding score-based self-assessments of previous experience with emergency situations and musical expertise, as well as questions concerning the general attitude toward sonification took place before the study was carried out. Specifically we asked for subject’s agreement with the following statements on a Likert scale from 1 (not at all) to 5 (completely):
- Q1
- I had experience with pre-clinical emergencies.
- Q2
- I have participated to more than 3 emergency trainings.
- Q3
- I feel confident when handling emergency situations.
- Q4
- For me, emergency situations cause negative stress.
After the perception test, we asked for subject’s agreement with the following 3 statements:
- SQ1
- Sonification is pleasant to listen to
- SQ2
- The sonification is informative, i.e., it enables to identify ST elevation changes in the ECG
- SQ3
- I can imagine to listen to these sonifications for a longer time period
6.2. Participants
After receiving the certificate of nonobjection from the local ethics committee on 2023-01-20, data acquisition began, which ended on 2023-06-30. The study cohort consisted of 44 students from the faculty of medicine of the Ruhr University Bochum (RUB) in Germany (5th academic year corresponding to 9th and 10th semester) who were assigned to a three day training program in emergency medicine. After being informed about nature, significance and scope of the study as well as the requirements for participants but prior to the study, participants provided informed consent in written form by signing a declaration of consent, and also consented to the processing of study data. All students received a 10-minute review about diagnosing and treating STEMI in prehospital care. Since sonification of the ST segment was a new concept they received an introduction into sonification, particularly ECG sonification. For this purpose all participants received a 6:15-minute introduction video about sonification, its impact on ECG monitoring and the motivation of our research. As part of the introduction we presented audio examples of ECGs either in isoelectric mode or with significant elevation of the ST segment to the students.
Before starting the perception and classification study we requested the participants to answer an initial questionnaire for collection of basic demographic data (i.e., age, gender, medical education) and for experience in medical emergencies. Since it could affect the comprehension of sonification it was also asked for pre-existing experience in music (see supplement/appendix for the complete questionnaire). A summary statistics depicting the composition of the cohort stratified by gender including the self-assessment scores derived from the survey and the assignment to either the intervention or the control group of a RCT (to be published elsewhere) i.e. parameter sonification, is shown in Table 1.
6.3. Classification Task
The sonification used in this study was designed for the detection of an ST segment elevation in the ECG that fulfills the STEMI criteria according to ESC guidelines (see 2.1 for details). A total of 3 similar blocks of five distinct sonified ECG-variants (IE, anterior-moderate, anterior-severe, inferior-moderate, inferior-severe) each were presented to all of the participants (n=44) leading to classification instances. Participants were asked to classify the samples with regard to localization (anterior or inferior) and severity (IE, moderate or severe) of the ST elevation using the questionnaire mentioned before.
7. Statistical Methods
Sonifications of 15 ECG examples have been presented to 44 individuals with the task of classifying the 5 different STEMI types leading to classification instances. The classification performance is evaluated on the basis of the -confusion matrix depicting the frequencies of the 660 classification results versus the correct classifications (gold standard) for each of the 5 classes. The estimation of diagnostic parameters, particularly accuracy, sensitivity, and specificity, is based on the confusion matrix. The nested structure of the classes (grouping into one normal ECG and two cases each of moderate and severe STEMI, as well as the decomposition into successively presented samples) is accounted for by sub-matrix analyzes. Quantitative results are reported as overall accuracy, sensitivity (se), specificity (sp), F-score (), balanced accuracy per class (), and intraclass coefficient [27].
A multivariable linear random effects regression allows quantification of the effects of covariates (demographic parameters, self-assessments and pre-knowledge, and index of the chronological order of ECG presentation) on the classification performance. The random effects model does account for the repeated measurement structure of the trial by adding the person-ID as random effect [28]. Univariable 2-sample comparisons are based on t-tests for metric data and Fisher’s exact test or chi-squared test for categorical data. Significance level is chosen to be 5% and precision is reported using 95%-confidence intervals.
Statistical analyses were performed with R (version 4.3.2) [29].
8. Results
Summary statistics containing age and scores of self-assessment derived from questionnaires stratified by gender are shown in Table 1. In total, more female (n=31) than male (n=13) students participated in the study. Female students are slightly younger in the average.
8.1. Excellent Performance of Sonification-Assisted STEMI Classifications
The results of the 660 classification instances are depicted as a confusion matrix in Table 2.
The ECGs without abnormality (IE), 3 samples of which were presented to each of the 44 students for classification, were all correctly classified as "healthy." In some instances, severity of STEMI has been falsely classified, however, there is only one instance where a moderate inferior STEMI (I-moderate) has falsely been diagnosed as ,,healthy” (IE). In addition, occasionally an ,,ST elevation inferior” has been confused with an ,,ST elevation anterior” and vice versa, however, the overall classification performance turned out to be excellent. Overall accuracy is 0.82 (0.79, 0.85) and intraclass coefficient turns out to be . Class-specific diagnostic parameters are listed in Table 3.
In a dichotomized version of the classification problem, IE is coded as 0 (,,healthy“), whereas all other classes are combined to one positive class coded as 1, i.e. STEMI independently of severity and location. This results in the confusion matrix depicted in Table 4. Remarkably, all 660 classification instances yielded a perfect classification with an accuracy of 1 (0.99, 1) and both sensitivity and specificity of exactly 1.
Finally, we combined the two severe and the two moderate classes to one class each, independently of location (inferior or anterior). This gives rise to the confusion matrix depicted in Table 5.
As the most important adverse result, 29 severe cases have been predicted as moderate. The corresponding estimated class-specific diagnostic test parameters are listed in Table 6.
Overall accuracy has been estimated as 0.91 (0.88, 0.93) and .
Thus far, we find that discrimination of IE from STEMI classes yields a perfect result with sensitivity and specificity both equal to 1. Although not perfect, sonification-assisted differential diagnostic performance within the STEMI classes is still hugely satisfying with an overall accuracy of 0.82 and with 0.91 even larger, if the location is disregarded and only severity considered.
8.2. Uncertainty in Coping with Emergency Situations Affects Sonification-Based Classification Performance
In an alternative way, accuracy per class can be estimated on the basis of a linear model after numeric 0-1-coding of the outcome per classification instance (1 if correctly classified, 0 otherwise). This approach can straightforwardly be extended to a multivariable random effects linear regression in order to assess the impact of demographic determinants or scores from self-assessment like prior knowledge and uncertainty in coping with emergency situations on the classification performance. In this case, correlations due to repeated measures can be adequately handled by adding the person index as a random variable. The according regression results are shown in Table 7.
Results for the class indicators are not shown since they only function as dummy variables. Reference levels for categorical predictors as well as the intercept are also omitted.
Gender, scores Q3 and SQ2, and block 3 turn out to unfold statistically significant impact as predictors for the outcome of the sonification-assisted ECG classification task. Specifically, females perform significantly better than male students. Q3 refers to question 3 of the first questionnaire where each student has been asked whether they feel confident when handling emergency situations. Worth of note, we observe a contraintuitive negative effect. Apparently, less confidence correlates with better classification. Interpretations, however, particularly causal inferences, have to be drawn with utmost care. More intuitive is the result with respect to an increased classification performance for block 3. This variable refers to the last of three consecutively presented blocks of sonification samples, thus pointing to a learning effect in the course of time through repetitions. Finally, the score derived from question SQ2 that has been asked after finishing the sonification-assisted classification rates in ascending order whether the students regarded sonification to be informative correlates positively with classification accuracy. The remaining ratings have neglectable impact. For the sake of completeness, variances of the random effects turn out to be 0.016 (intercept) and 0.11 (residual). Thus far we conclude that some self-assessment scores correlate in an intuitive way with the outcome with the exception of Q3. Roughly speaking, feeling more or less comfortable with sonifications improves classification performance, however, prior experience with emergency situations appears to be counter-productive. Also somewhat surprising is the fact that females perform better than males with respect to correctly classifying sonification-assisted ECG samples.
9. Discussion
A first and primary focus of this article was the sonification concept, design and implementation of the ST elevation sonification method. The step-by-step development from `heartbeat-locked ST elevation arpeggio’ over `musical phrase melody over several heartbeats’ to `grouped lead scans’ illustrated how, step-by-step, sonification design progresses towards a solution that addresses issues such as cognitive load, attention, annoyance, perceptability and ecological acoustics, i.e., how sonifications integrate into the soundscape. We acknowledge that choices within the design progression are taken on the basis of subjective decisions and not on objectively derived evidence. However, as in any other field of design such as industrial or visual design, a fully objective evidence is not feasible. Retrospectively, however, usability or, in the given context, diagnostic value is objectively testable, the way we did it here. Further results will be published soon.
Sonification design was initially based on the assumption that it is best to convey as much information as possible and as timely as possible. The ’heartbeat-locked ST elevation arpgeggio’ conveys all 12 lead elevations with each heartbeat. This could be useful if, e.g., medical interventions would require a precise and low-latency eyes-free monitoring of these details, for instance for balloon-catheter interventions or intermittent pre-clinical ST elevation representations in the ECG (e.g., occlusive myocardial infarction). Noteworthy, the sound level could be considerably lowered in practical applications, i.e., we expect the sound to become part of the available periphery as in Mark Weiser’s vision of calm computing [30], an information stream that is available yet only attracting attention when needed – and thereby less distracting.
We realized that for extended monitoring (e.g. over many minutes to hours) the initially chosen amount of detail is overwhelming. Additionally, ST patterns change rarely between beats. Therefore, we explored a complementary approach in design 2 (musical phrase melody over several heartbeats), which reduces information density. However, a specific melody repeated many times over hours could be perceived as intrusive, and would also conflict with situations in which music is heard. Design 2 could be of interest for applications in long-term monitoring, particularly if it would be modified by fading out upon absent changes and by boosting the sound level upon relevant ST changes over time.
Design 3 (the grouped lead scans) represents a compromise between precision and aesthetics, between low-latency and acceptable delay, in such a way that grouping is supported, thus revealing auditory gestalts (for typical motifs corresponding to clinically relevant parts).
All designs use pitched tones as these are clearly recognised as artificial, to avoid the risk of confusing the auditory display with environmental sounds. Alternative ideas such as water drop sounds, footstep sounds, etc. have been dropped. However, it might be worth investigating other pitched real-world sounds as material, as these could lead to higher acceptance and reduced annoyance. We put this on our roadmap for future optimisation.
We envision the sonifications to be integrated into commercial ECG devices. The computational requirements are rather low for the mapping and sonification rendering. For sound projection, due to the artificial nature of the sound, small loudspeakers would suffice that could easily be integrated in devices.
It will be important that personnel has direct control to de-/activate sounds and control its sound level. A more futuristic perspective could be the integration of monitoring sounds into the personal soundscape of medical staff, e.g. via transparent earplugs that do not block external sounds, however, leaving patient and others who don’t need to be informed in calm.
In the advent of clinical AI-based diagnosis and information systems, it might appear questionable whether the proposed rather direct / low-level information approach would be superior to an AI method that condenses data and directly communicates the essential to users. On the one hand, AI-based approaches bear the risk of false positives and go along with an interruption of other ongoing processes (in an emergency situation), while the low-level monitoring continuously supplies the information and leaves the evaluation to the human. Human operators usually feel more in control if they perceive continuous changes or the actual state, as compared to only be informed on critical changes.
We used surrogate ECG data obtained from the Laerdal Resusci Anne Advanced SkillTrainer. We observe little variability in the measured data over time and have rather stable ST elevation patterns over time. The next step would be to apply the chosen design to real-world data from emergency procedures, which would include all sorts of artefacts such as shivering, interference from other electric devices, body movements, loose electrodes, or problems due to incorrect lead placement. The question is how the increased variability of actual ST elevation sonifications would then be interpreted and to what extend medical conclusions depend upon these factors.
This study reveals that ST elevation, a pathology of the ECG, can be detected reliably by a defined minimally trained cohort of medical students. Data was transferred to a novel specially designed ST elevation sonification of the 12 lead ECG. ST elevation is the most important part of the ECG when assessing patients with chest pain and therefore essential for diagnosing STEMI [3]. Good recognition of the different sounds was possible after a short training period, so that even more precise discrimination can be expected with longer training. A 6.5-minute video tutorial was sufficient to teach the method to subjects who were naïve to sonification.
Training is known to improve pattern recognition in regular visual ECG learning [31]. Therefore, this is also to be expected for ECG sonification of the ST segment.
We investigated a group of medically trained individuals. However, even in this otherwise quite homogeneous group we observed structural variance. Demographic covariates include the fact that some of the students had worked in EMS previously and some had musical training. However, the proposed method has been designed to be generally suitable for EMS and even in hospital, this pre-trained group of test subjects appears to be representative.
The use of sonification to improve the correct interpretation of abnormal ECG data and/or signals has already been tested in several preliminary studies. In 2017, Kather et al. [16] showed that the auditory presentation of ECG data can enable the detection of clinically relevant cardiac pathologies (including bigemini, atrial fibrillation or STEMI) by non-medically trained volunteers and after a short training session. In addition, this study was able to show that a cohort of 5th year medical students had been able to correctly identify the severity and type of STEMI with a high degree of sensitivity.
Sonification of the ST segment has been scientifically investigated in previous studies [4,5] and the potential for detecting ST elevations has already been demonstrated. ST elevations can be transient and therefore not detectable at all times. Since patterns in the context of a myocardial infarction have a different treatment priority, it can be crucial to detect them. For this constellation, sonification is a method that can be helpful in detecting these transient ST elevations. In addition, it was also possible to detect different degrees of severity of ST elevation. It is to be expected that the just noticeable differences (JND) could become smaller with increasing training.
Compared to realistic settings, the perception study has the limitation that the participants were not distracted by other impressions, particularly not by impressions of auditory nature. This limits the generalization power. In the future, users can be taught this method by using tutorials as video clips. It is not practical to replace the current practice of printing out a 12 lead ECG or visualizing it in another way. However, ST elevation sonification can be a valuable add-on to current practice, as sonification can draw attention to transient ST elevations.
10. Conclusion
We introduced a variety of sonification designs for monitoring ST elevation patterns according to their intensity, polarity and spatial distribution, which is connected to relevant detail corresponding to specific heart pathologies (coronary occlusion). We chose design 3 (grouped lead scans) for EMS as trade-off between distraction and timely, precise and detailed information. The discretization of continuous ST elevations into 5 levels reduces auditory variability while maintaining enough information for users to distinguish states. The sonification of the ST segment of the ECG can be designed so that it is perceived as pleasant.
Our empirical evaluation shows that ST changes can be detected reliably and the procedure can be learned easily and in a short period of time. In emergency situations, using sonification has the potential for surveillance of the ST segment with high sensitivity and specifity to detect changes. ST segment sonification enables the continuous process monitoring for intermittent ST segment elevations so that they can be identified promptly. This auditory display method is a promising auxiliary help for diagnosing ST elevation myocardial infarction, leading to immediate consequences in treatment.
Possible clinical application of ST segment sonification can be in EMS, the emergency room and in the catheterization laboratory. Future studies should examine, as part of a proof-of-concept, whether the results achieved in the presented study also have a corresponding impact after translation into clinical practice.
Supplementary Materials
The following supporting information can be downloaded at the website of this paper posted on Preprints.org. Sound examples are an essentia supporting media for articles introducing sonification methods. Thus they are provided as supplementary material. The following files are part of this publication: Sonification Examples for Design 1 The supplementary material contains 4 MP3 files S1-1-a-all-six-conditions.mp3, S1-1-b-all-six-conditions.mp3, S1-2-percussion-all-six-conditions.mp3, S1-3-vowels-all-six-conditions.mp3; Sonification Examples for Design 2 The supplementary material contains 6 MP3 files, one for each STEMI condition: S2-musicalphrase-inferior-weak.mp3, S2-musicalphrase-inferior-moderate.mp3, S2-musicalphrase-inferior-severe.mp3, S2-musicalphrase-anterior-weak.mp3, S2-musicalphrase-anterior-moderate.mp3, S2-musicalphrase-anterior-severe.mp3; Sonification Examples for Design 3 The supplementary material contains 34 MP3 files. The first 30 sonification examples (S3.01-S3.30) are in groups of 6 files (one for each STEMI condition) according to the five modes `chromatic’, `diatonic’, `5- state’, `5-state-dissonant’, `tristate’. The remaining 4 sonification examples (S3.31–34) illustrate fast mappings, suitable for trained listeners, cf. the file names for details on the parameters.
Author Contributions
Conceptualization, T.H. and J.T; methodology, T.H. and J.T.; software, T.H.; validation, all authors; formal analysis, H.H.D.; investigation, S.G. and F.B. and J.P. and J.T; resources, T.H. and S.G. and J.T.; data curation, F.B.; writing—original draft preparation, T.H.; writing—review and editing, T.H. and S.G. and F.B. and J.P. and H.H.D. and J.T.; visualization, T.H. and H.H.D.; supervision, J.T. and J.P. and S.G.; project administration, T.H. and J.T. and F.B. and S.G. and J.P.. All authors have read and agreed to the published version of the manuscript.
Funding
This research received no external funding.
Author Contributions
Conceptualization, T.H. and J.T; methodology, T.H. and J.T.; software, T.H.; validation, all authors; formal analysis, H.H.D.; investigation, S.G. and F.B. and J.P. and J.T; resources, T.H. and J.H. and S.G. and J.T.; data curation, F.B.; writing—original draft preparation, T.H.; writing—review and editing, T.H. and S.G. and F.B. and J.P. and H.H.D. and J.T.; visualization, T.H. and H.H.D.; supervision, J.H. and J.T. and J.P. and S.G.; project administration, J.T. and F.B. and S.G. and J.P.; funding acquisition, J.H. All authors have read and agreed to the published version of the manuscript.
Funding
This research received no external funding.
Institutional Review Board Statement
The study was conducted in accordance with the Declaration of Helsinki, and approved by the Institutional Review Board (or Ethics Committee) of Ethikkommission der Medizinischen Fakultät der Ruhr-Universität Bochum – Sitz Ostwestfalen, Germany, file no.: 2022-1017, date of approval 2023-01-20.
Informed Consent Statement
Informed consent was obtained from all subjects involved in the study.
Abbreviations
The following abbreviations are used in this manuscript:
| ECG | Electrocardiography |
| EMS | Emergency Medical Services |
| PMSon | Parameter Mapping Sonification |
| STEMI | ST elevation Mycardial Infarction |
References
- Widimsky P, Wijns W, Fajadet J, de Belder M, Knot J, Aaberge L, et al. Reperfusion therapy for ST elevation acute myocardial infarction in Europe: description of the current situation in 30 countries. European Heart Journal. 2010;31(8):943–957. [CrossRef]
- Baradi A, Dinh DT, Brennan A, Stub D, Somaratne J, Palmer S, et al. Prevalence and Predictors of Emergency Medical Service Use in Patients Undergoing Primary Percutaneous Coronary Intervention for ST-Elevation Myocardial Infarction. Heart, Lung and Circulation. 2024;33(7):990–997. [CrossRef]
- Byrne RA, Rossello X, Coughlan JJ, Barbato E, Berry C, Chieffo A, et al. 2023 ESC Guidelines for the management of acute coronary syndromes: Developed by the task force on the management of acute coronary syndromes of the European Society of Cardiology (ESC). European Heart Journal. 2023;44(38):3720–3826. [CrossRef]
- Aldana Blanco AL, Hermann T, Tiesmeier J, Persson J, Grautoff S. Sonfication enables continuous surveillance of the ST segment in the electrocardiogram. American Journal of Emergency Medicine. 2022;58:286–297. [CrossRef]
- Aldana Blanco AL, Grautoff S, Hermann T. ECG sonification to support the diagnosis and monitoring of myocardial infarction. Journal on Multimodal User Interfaces. 2020;14:207–218. [CrossRef]
- Badings EA, Remkes WS, The SH, Dambrink JE, Tjeerdsma G, Rasoul S, et al. Early or late intervention in patients with transient ST-segment elevation acute coronary syndrome: subgroup analysis of the elisa-3 trial: Intervention in Transient ST-Segment Elevation ACS. Catheterization and Cardiovascular Interventions. 2016;88(5):755–764. [CrossRef]
- Väljamäe A, Mealla S, Steffert T, Holland S, Marimon X, Benitez R, et al. A review of real-time EEG sonification research. In: International Conference of Auditory Display 2013 (ICAD 2013); 2013. p. 85–93.
- Pauletto S, Hunt A. The sonification of EMG data. In: Proceedings of the 12th International Conference on Auditory Display; 2006. p. 152–157.
- Gionfrida L, Roginska A. A novel sonification approach to support the diagnosis of alzheimer‘s dementia. Frontiers in Neurology. 2017;8:647. [CrossRef]
- Roginska A, Mohanraj H, Keary J, Friedman K. Sonification method to enhance the diagnosis of dementia. In: International Conference on Auditory Display; 2014.Available from: https://api.semanticscholar.org/CorpusID:20280044.
- Stahl B, Thoshkahna B. Real-time heart rate sonification for athletes. In: Proceedings of the 21st International Conference on Auditory Display. University of Music and Performing Arts Graz. Institute of Electronic Music and Acoustics; 2015.Available from: https://api.semanticscholar.org/CorpusID:114817490.
- Aldana Blanco AL, Grautoff S, Hermann T. CardioSounds: Real-time auditory assistance for supporting cardiac diagnostic and monitoring. In: Proceedings of the 12th International Audio Mostly Conference on Augmented and Participatory Sound and Music Experiences, AM ’17. New York, NY, USA: Association for Computing Machinery; 2017. p. 1–4. Available from: . [CrossRef]
- Ballora M, Pennycook B, Ivanov PC, Glass L, Goldberger AL. Heart Rate Sonification: A New Approach to Medical Diagnosis. Leonardo. 2004;37(1):41–46. [CrossRef]
- Landry S, Sun Y, Slade DL, Jeon M. Tempo-Fit Heart Rate App: Using Heart Rate Sonification as Exercise Performance Feedback. In: Proceedings of the International Conference on Auditory Display; 2016.Available from: https://digitalcommons.mtu.edu/cls-fp/40.
- Aldana Blanco AL, Grautoff S, Hermann T. Heart Alert: ECG Sonification for Supporting the Detection and Diagnosis of ST Segment Deviations. In: Proceedings of the Interactive Sonification Workshop (ISon). Bielefeld: ISon; 2016.Available from: https://interactive-sonification.org/ISon2016.
- Kather JN, Hermann T, Bukschat Y, Kramer T, Schad LR, Zöllner FG. Polyphonic sonification of electrocardiography signals for diagnosis of cardiac pathologies. Scientific Reports. 2017;7:44549. [CrossRef]
- Grond F, Berger J. Parameter Mapping Sonification. In: Hermann T, Hunt A, Neuhoff JG, editors. The Sonification Handbook. Berlin, Germany: Logos Publishing House; 2011. p. 363–397. Available from: http://sonification.de/handbook/chapters/chapter15/.
- Blanco ALA, Grautoff S, Hermann T. CardioSounds: Real-time Auditory Assistance for Supporting Cardiac Diagnostic and Monitoring. In: Proceedings of the 12th International Audio Mostly Conference on Augmented and Participatory Sound and Music Experiences. AM ’17. New York, NY, USA: Association for Computing Machinery; 2017.Available from: . [CrossRef]
- Hermann T, Hunt A, Neuhoff JG, editors. The Sonification Handbook. Berlin, Germany: Logos Publishing House; 2011. Available from: http://sonification.de/handbook.
- Kramer G. An Introduction to Auditory Display. In: Kramer G, editor. Auditory Display. ICAD. Addison-Wesley; 1994. p. 1–78.
- Hildebrandt T, Hermann T, Rinderle-Ma S. Continuous sonification enhances adequacy of interactions in peripheral process monitoring. International Journal of Human-Computer Studies. 2016;95:54–65.
- Grond F, Bovermann T, Hermann T. A SuperCollider Class for Vowel Synthesis and its Use for Sonification. In: Worall D, Wersényi G, editors. The 17th Annual Conference on Auditory Display, Budapest, Hungary 20-24 June, 2011, Proceedings. OPAKFI; 2011.Available from: https://pub.uni-bielefeld.de/record/2277122.
- Walker BN, Nees MA. Theory of sonification. In: Hermann T, Hunt A, Neuhoff JG, editors. The Sonification Handbook. Berlin, Germany: Logos Verlag Berlin; 2011. p. 9–39.
- Reinsch D, Hermann T. Interacting with sonifications: The mesonic framework for interactive auditory data science. In: Rönnberg N, Lenzi S, Ziemer T, Hermann T, Bresin R, editors. Psychoacoustics in the Loop.Proceedings of the 7th Interactive Sonification Workshop; 2022. p. 65–74.
- Hermann T, Reinsch D. sc3nb: a Python-SuperCollider Interface for Auditory Data Science. In: Proceedings of the 16th International Audio Mostly Conference. AM ’21. New York, NY, USA: Association for Computing Machinery; 2021. p. 208–215. Available from: . [CrossRef]
- Anderson HR, Borgen AC, Christnacht R, Ng J, Weller JG, Davison HN, et al. Stats on the desats: alarm fatigue and the implications for patient safety. BMJ Open Quality. 2023;12(3):e002262. [CrossRef]
- Kuhn M. Building Predictive Models in R Using the caret Package. Journal of Statistical Software. 2008;28(5):1–26. [CrossRef]
- Pinheiro JC, Bates DM. Mixed-Effects Models in S and S-PLUS. Statistics and Computing. Springer New York, NY; 2006.
- R Core Team. R: A Language and Environment for Statistical Computing; 2024. Available from: https://www.R-project.org/.
- Case A. Calm Technology: Principles and Patterns for Non-intrusive Design. O’Reilly Media; 2016. Available from: https://books.google.de/books?id=wQaGjwEACAAJ.
- Elkammash A, Ring L. The effectiveness of cardiology e-training in improving electrocardiogram interpretation skills in junior medical trainees; a pre-post mixed methods study. Future Healthcare Journal. 2023;10(Suppl 3):72–73. [CrossRef]
| 1 | Sound files are provided as supplementary material |
Figure 2.
ECG data set depicting a 10s 12 lead recording of a mild anterior STEMI.
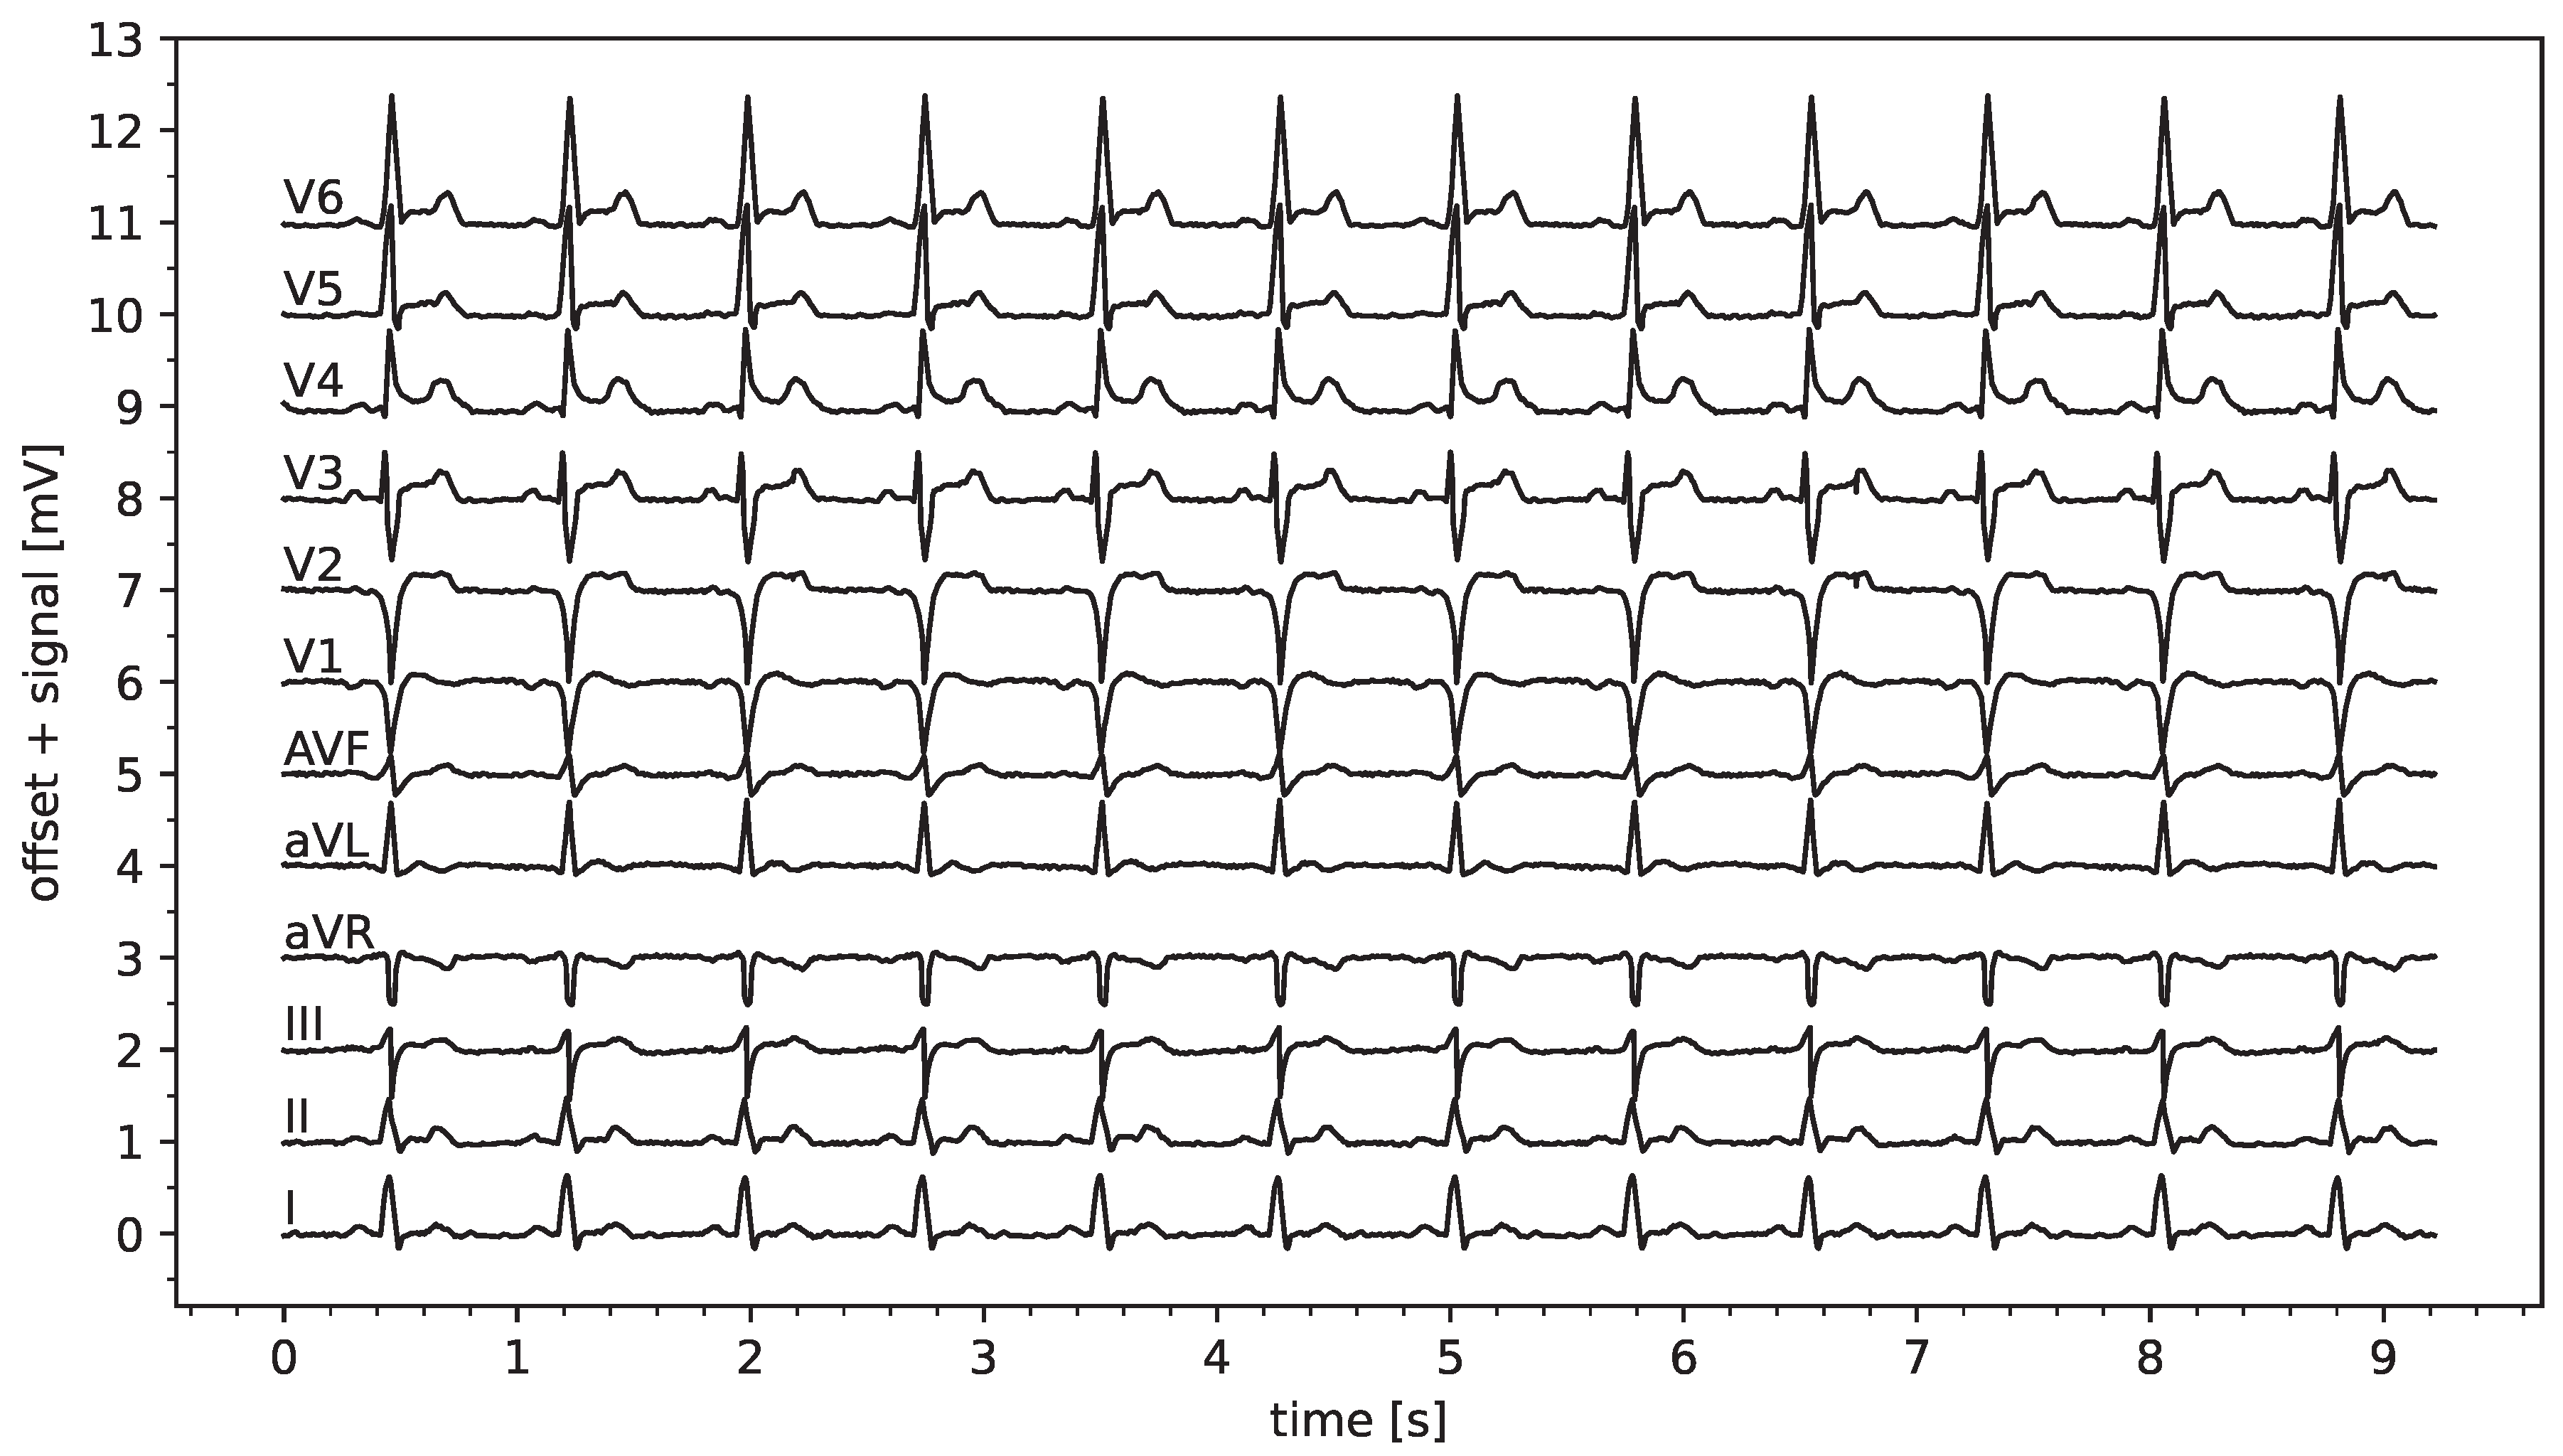
Figure 3.
ECG signals extracted from Laerdal simulations for the cases indicated in the panel headers. (x-axis shows time [s], y-axis the signal in arb. units). Vertical red lines despict our R-peak detection results, horizontal lines depict our ST elevation estimations as explained in Section 3.2.
Figure 3.
ECG signals extracted from Laerdal simulations for the cases indicated in the panel headers. (x-axis shows time [s], y-axis the signal in arb. units). Vertical red lines despict our R-peak detection results, horizontal lines depict our ST elevation estimations as explained in Section 3.2.
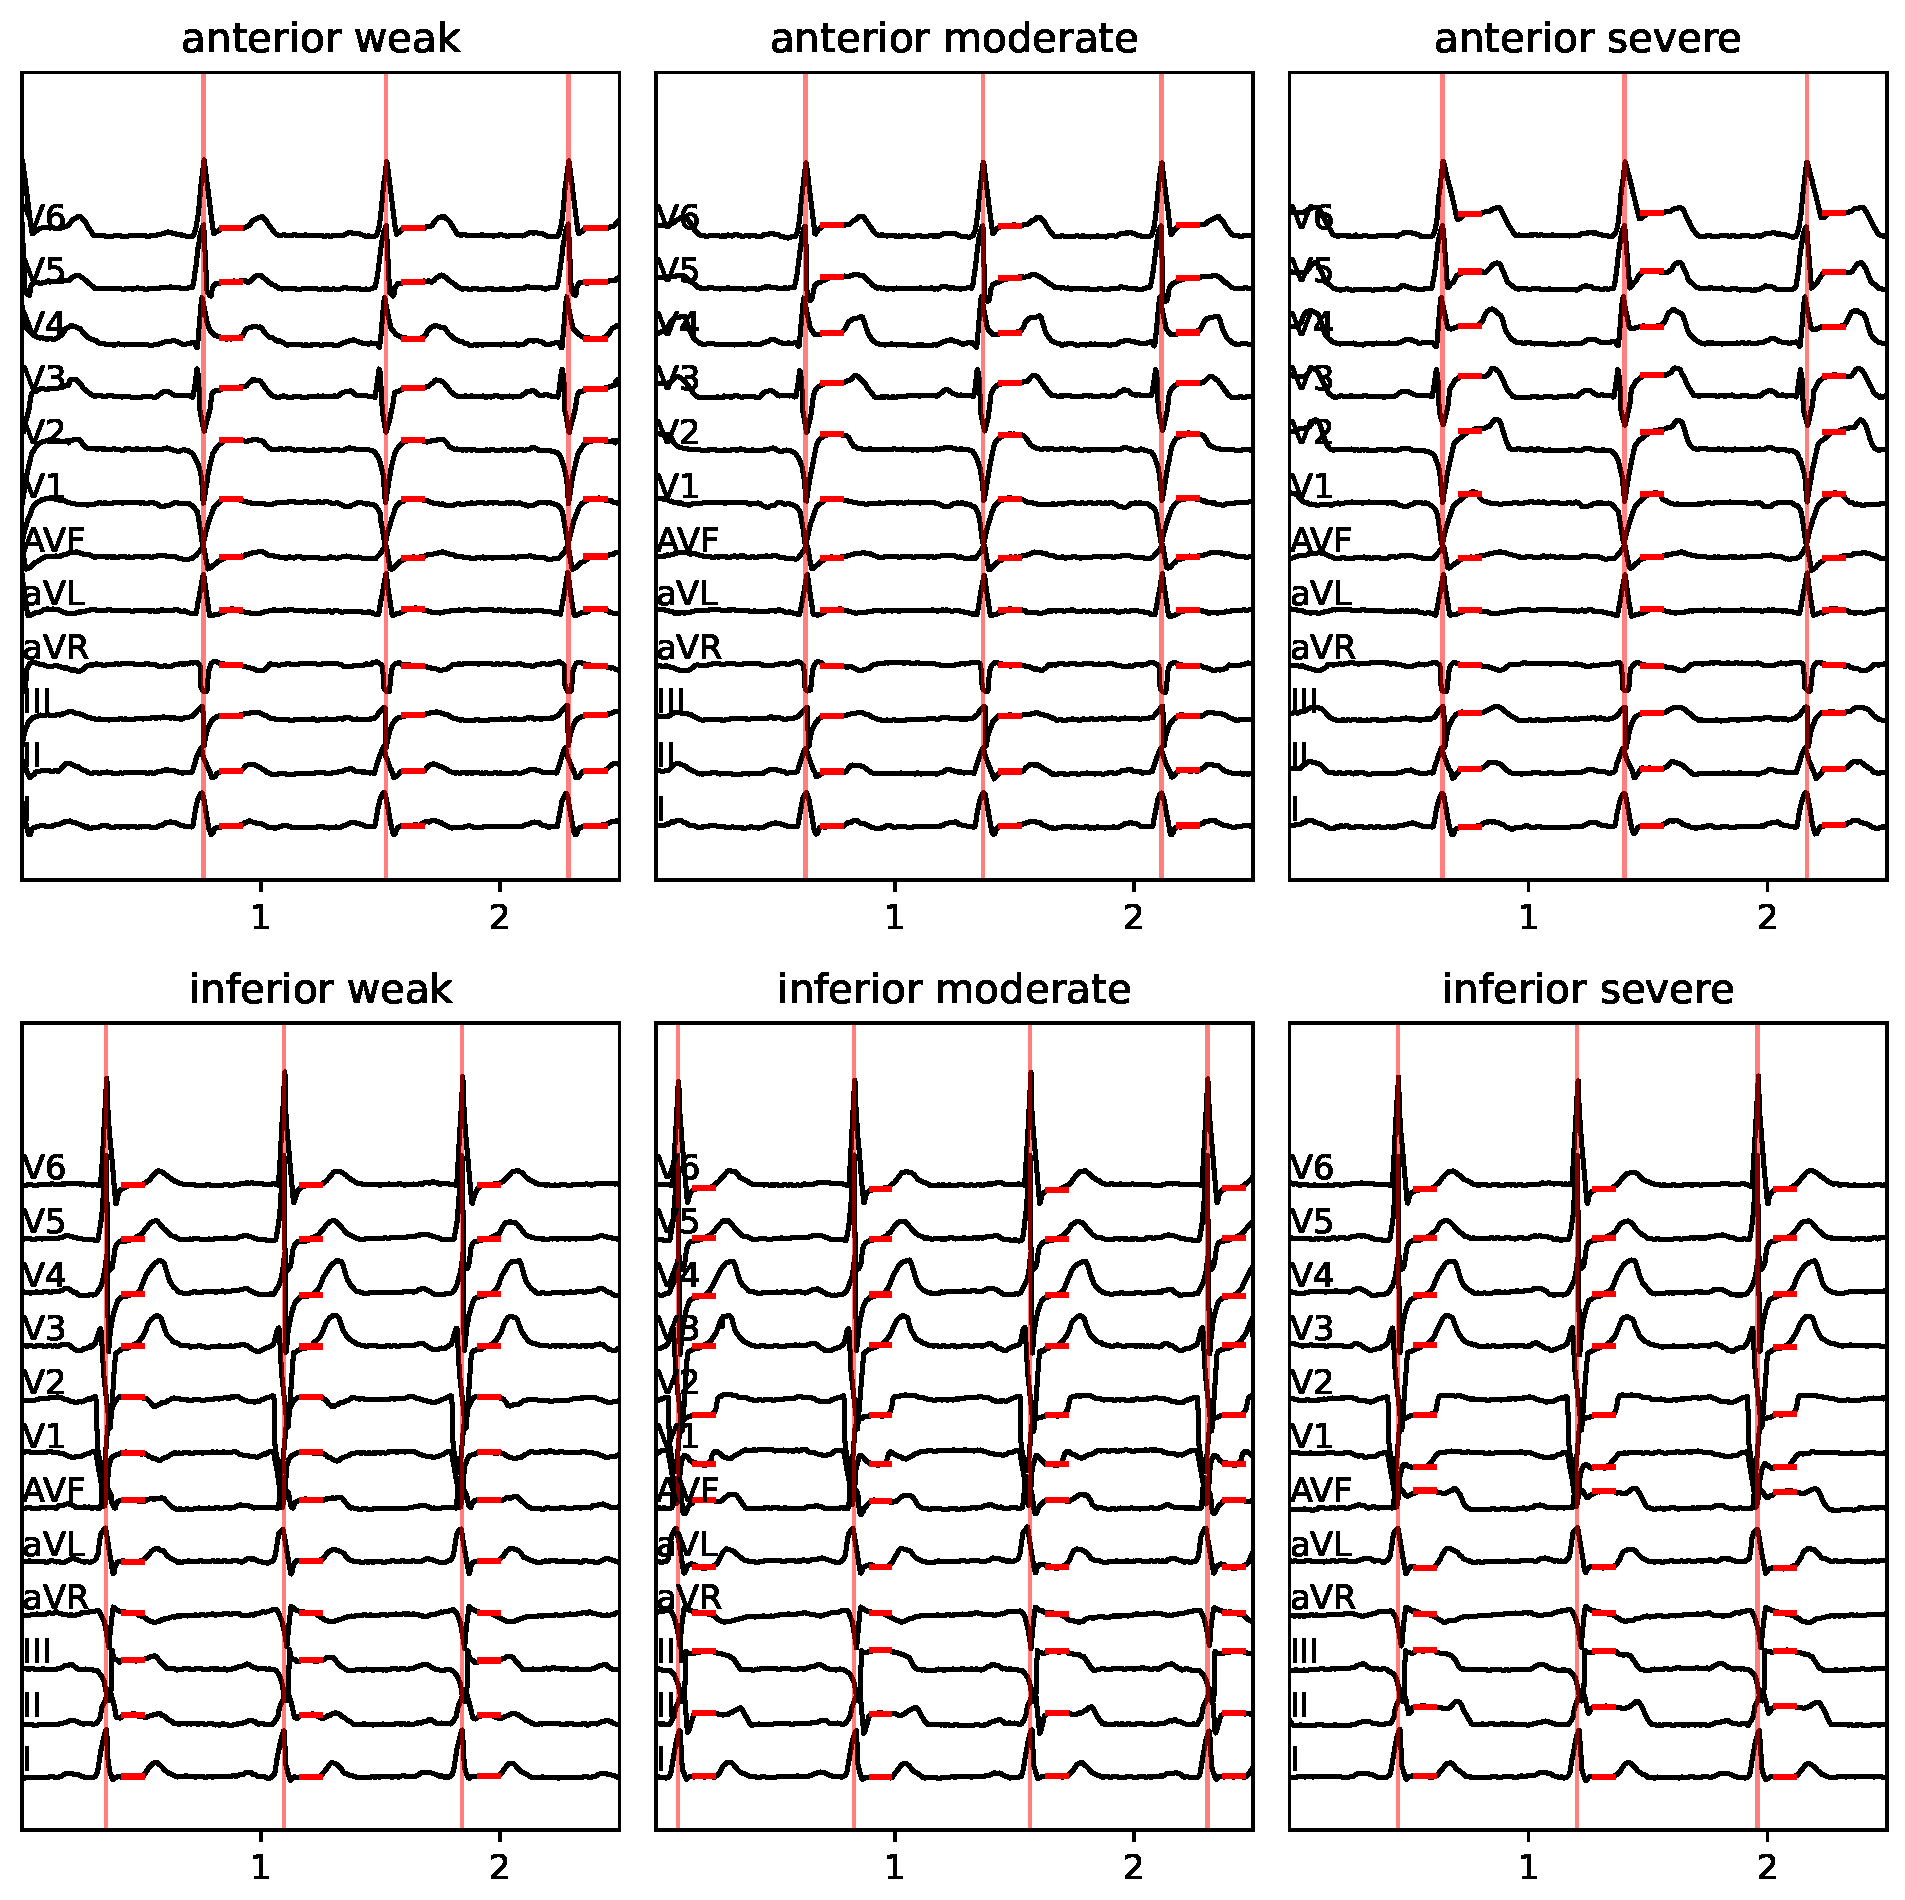
Figure 4.
ST elevation vectors for the 6 selected cases as parallel coordinates plot. Upper plot: limb leads in standard order, bottom plot: channels along the Cabrera circle with mirrored (i.e. inverted) aVR lead.
Figure 4.
ST elevation vectors for the 6 selected cases as parallel coordinates plot. Upper plot: limb leads in standard order, bottom plot: channels along the Cabrera circle with mirrored (i.e. inverted) aVR lead.
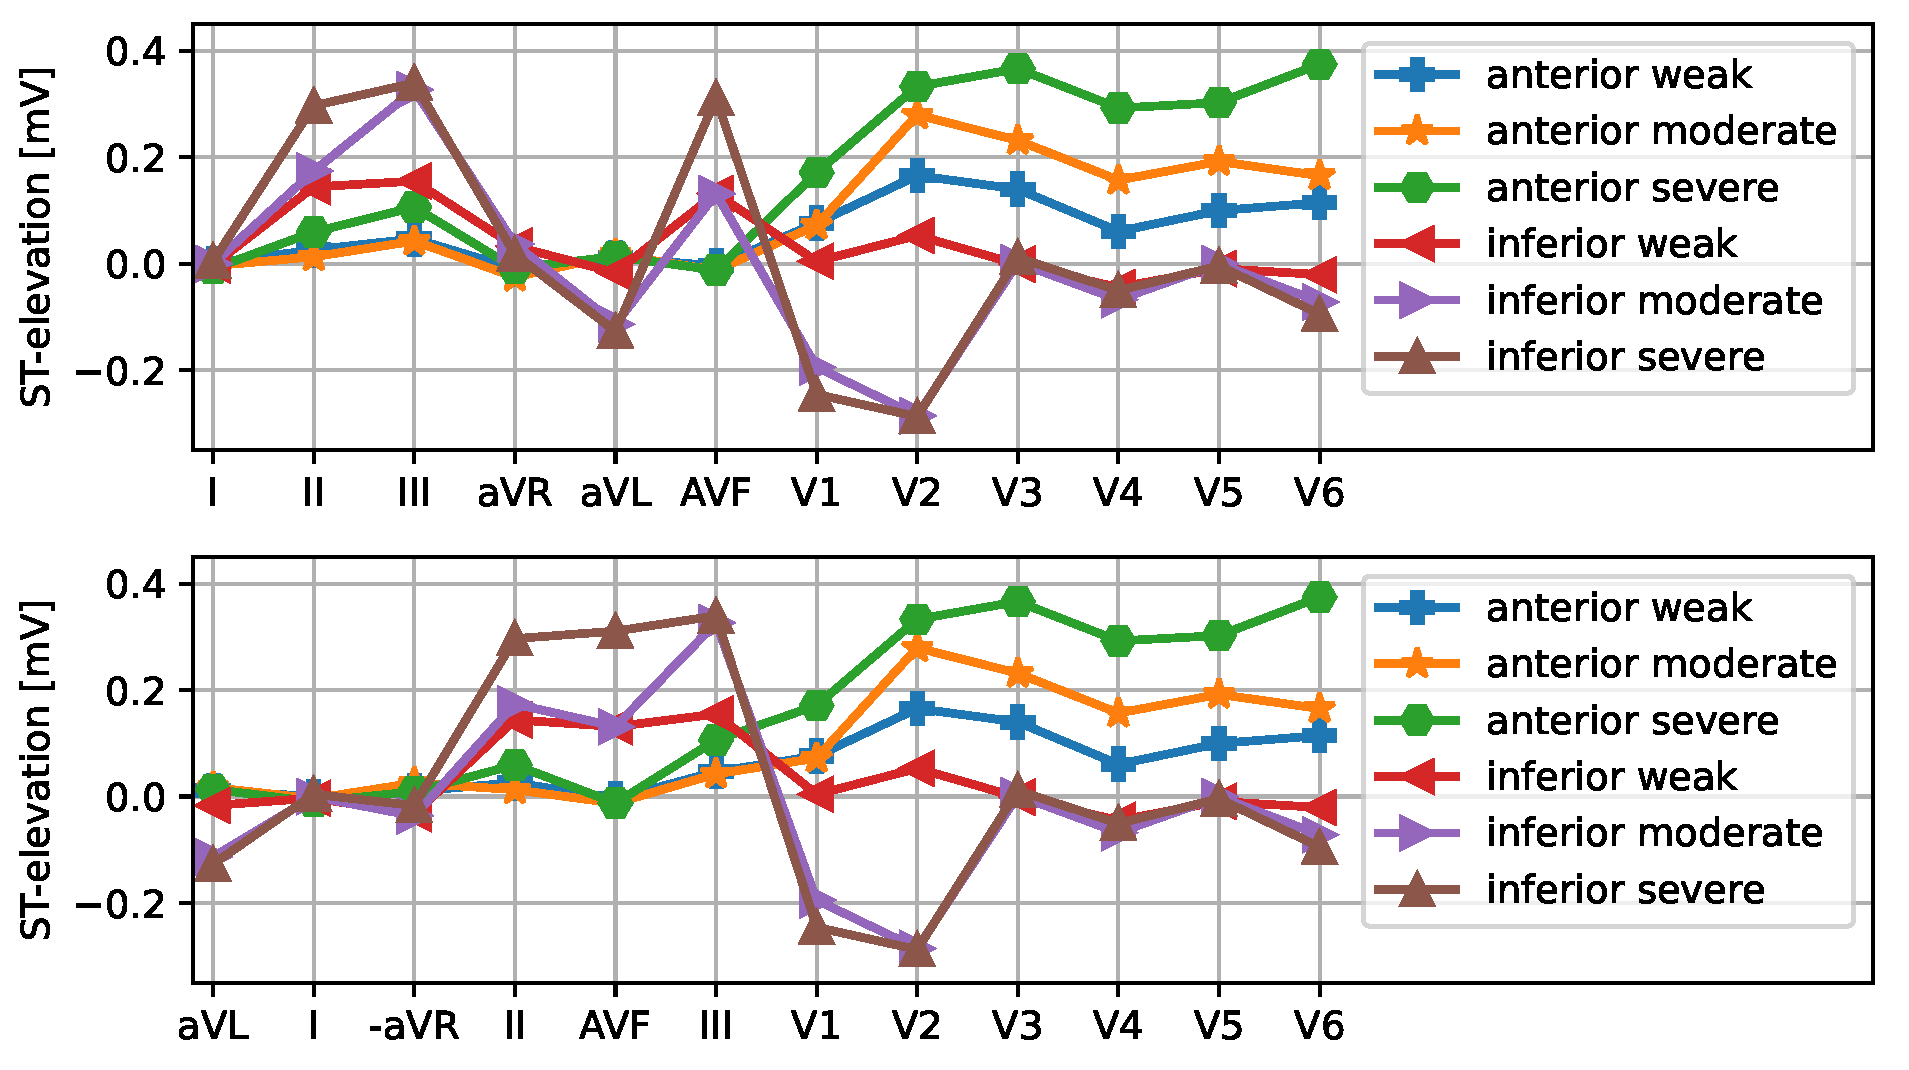
Figure 5.
Musical representation of `a sonification melody’ to disperse information over several heartbeats (QRS tones played at the bars).
Figure 5.
Musical representation of `a sonification melody’ to disperse information over several heartbeats (QRS tones played at the bars).
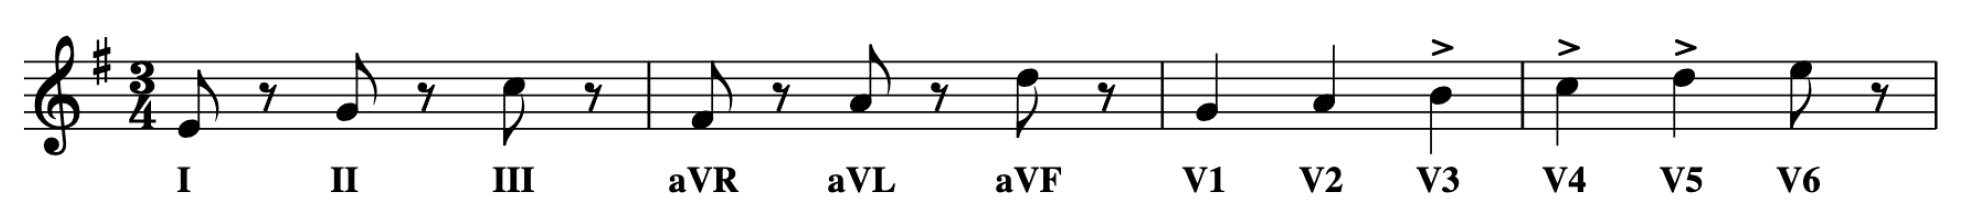
Figure 6.
Lead projections along the Cabrera circle (red), using mirrored aVR as −aVR. The red circle represents the heart, the patients body upright facing towards the reader. The ultimately selected sonification progresses from aVL to III in the first group, followed by V1 to V6 in the second group. Lead aVR is additionally depicted as it is used in some sonification designs.
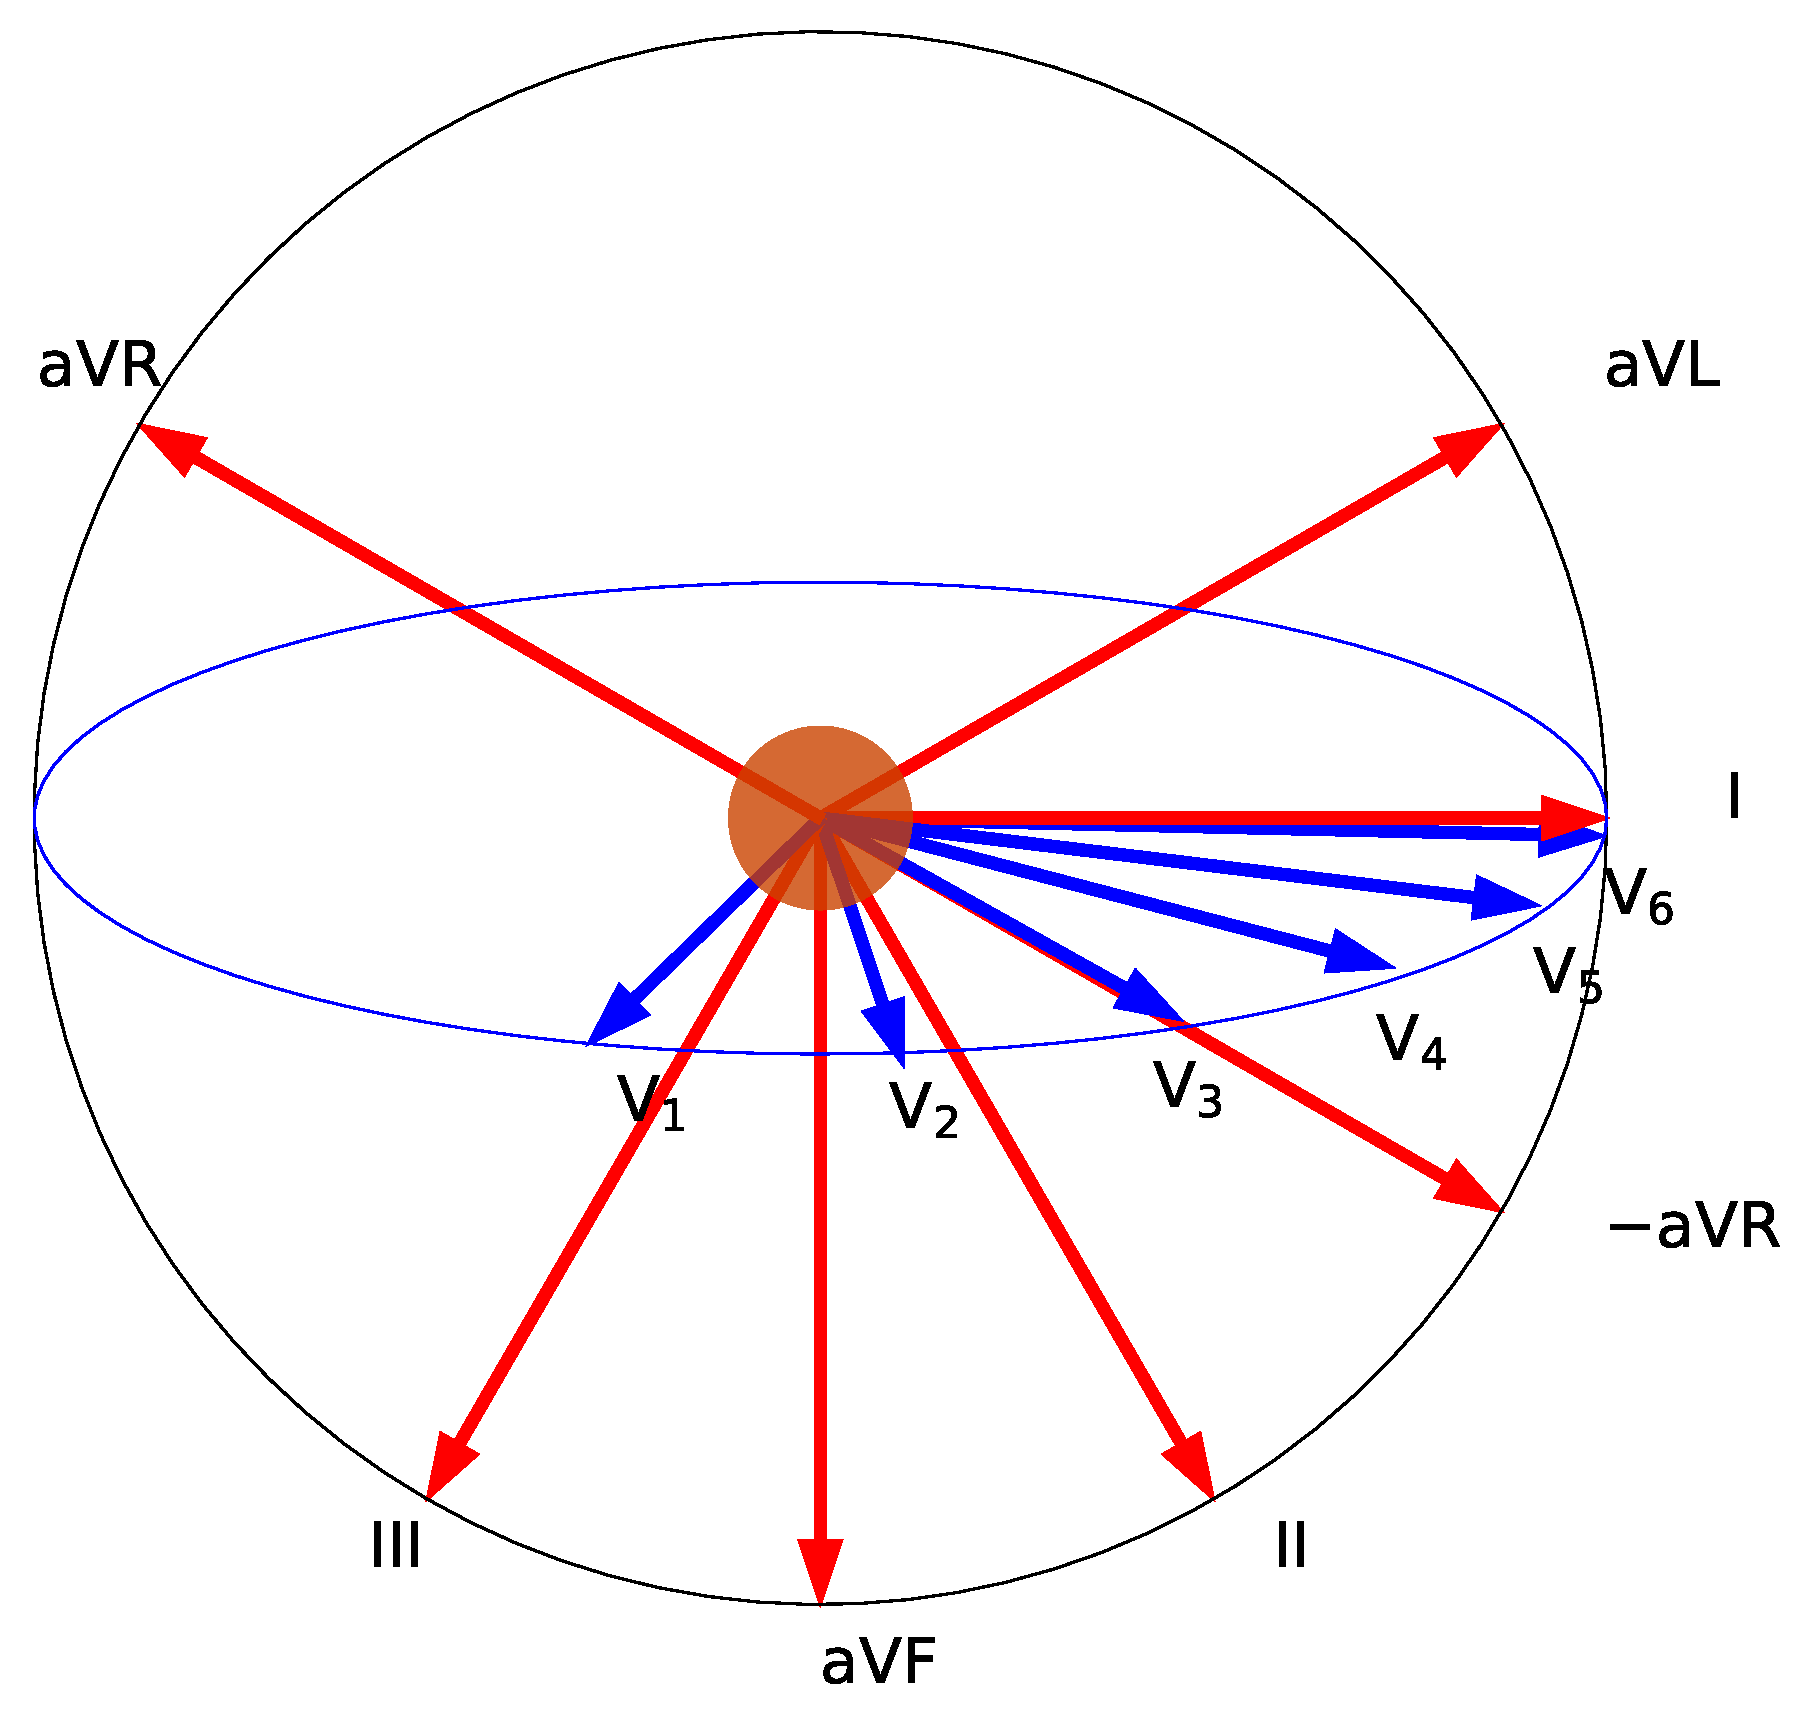
Figure 7.
Code snippet for the various pitch mapping modes in ST elevation sonification design 3.
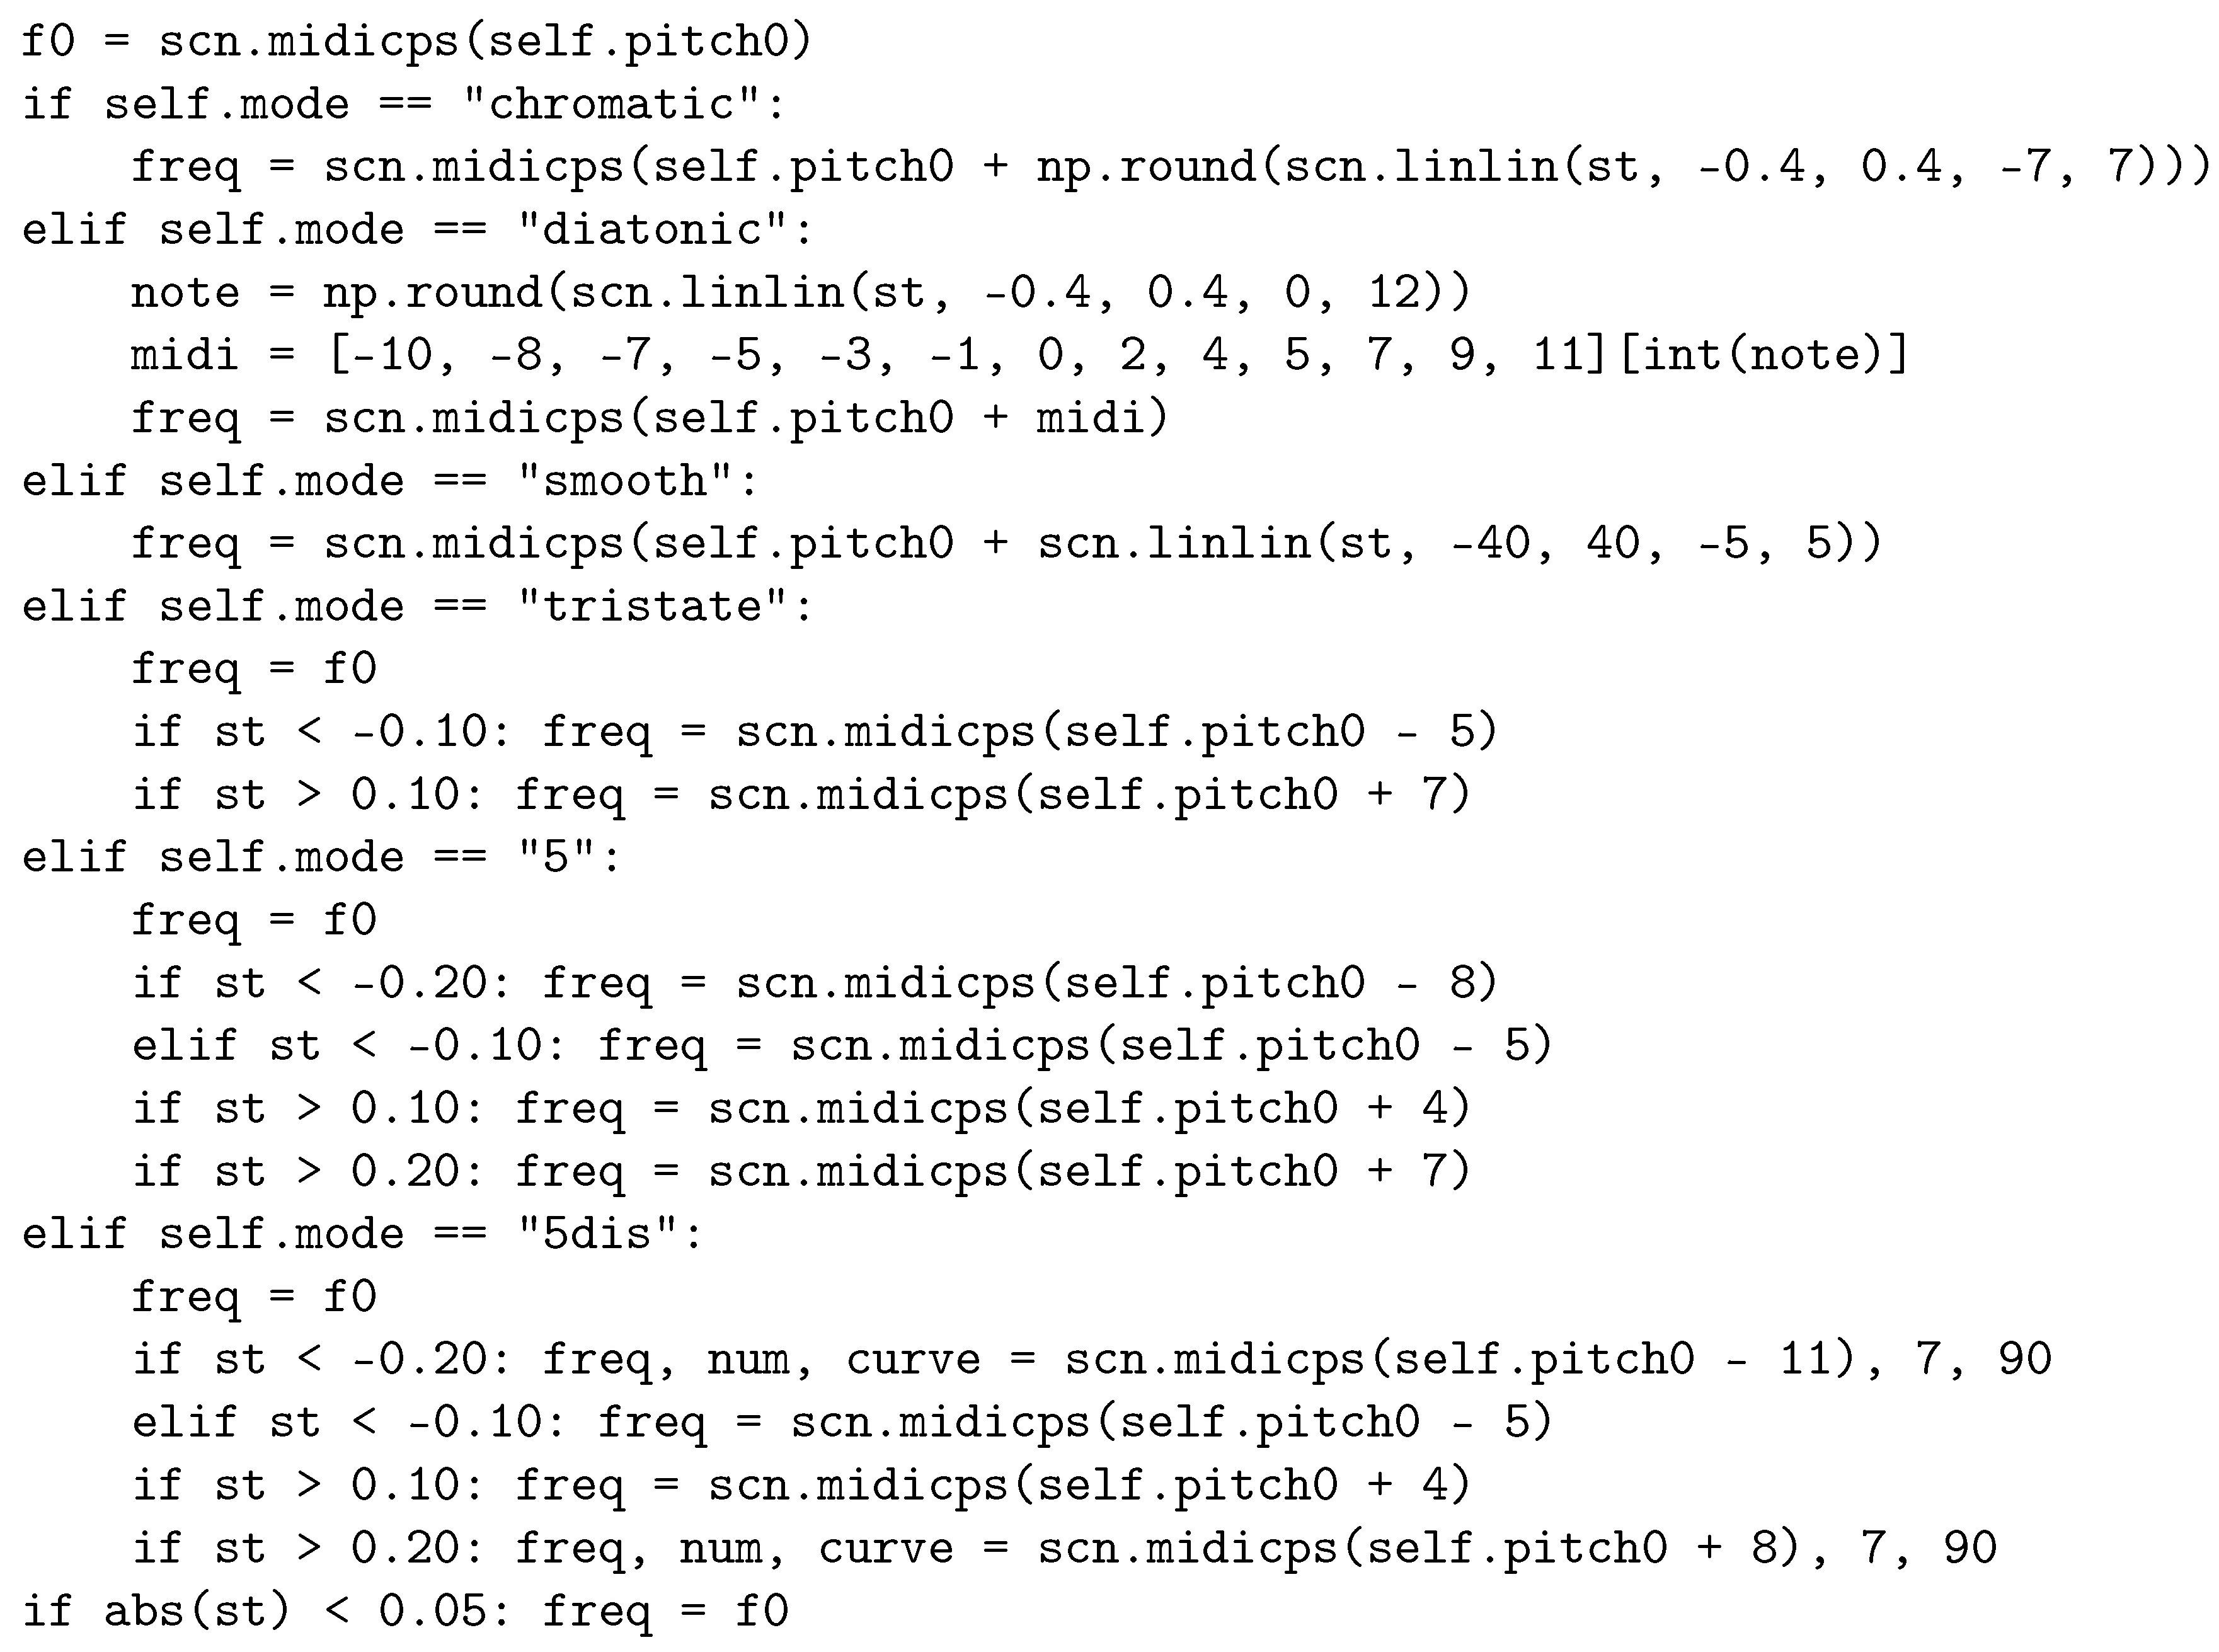

Table 1.
Summary statistics of self-assessment scores, demographic parameters and group assignment stratified by gender. Q1-Q4 and SQ1-SQ3 refer to the self-assessment scores collected by means of questionnaires. “Preknowledge” refers to previous medical training, whereas “Musicality” and “Instrument” refer to single choice formal information on musical education. For details on questionnaires cf. Methods section.
| Characteristic | Female, | Male, | p-value |
|---|---|---|---|
| Age | 23.00 (23.00, 24.00) | 24.00 (23.00, 25.00) | 0.2 |
| Q1 | 4.00 (3.00, 5.00) | 4.00 (4.00, 5.00) | 0.9 |
| Q2 | 4.00 (2.00, 5.00) | 4.00 (2.00, 4.00) | 0.6 |
| Q3 | 4.00 (3.00, 4.00) | 4.00 (3.00, 4.00) | 0.6 |
| Q4 | 2.00 (2.00, 3.00) | 3.00 (2.00, 3.00) | 0.2 |
| SQ1 | 4.00 (3.00, 5.00) | 4.00 (3.00, 5.00) | 0.5 |
| SQ2 | 5.00 (4.00, 5.00) | 4.00 (3.00, 5.00) | 0.4 |
| SQ3 | 3.00 (2.00, 4.00) | 3.00 (2.00, 5.00) | 0.9 |
| Preknowledge | 3 / 31 (9.7%) | 1 / 13 (7.7%) | >0.9 |
| Musicality | 2 / 31 (6.5%) | 1 / 13 (7.7%) | >0.9 |
| Instrument | 14 / 31 (45%) | 7 / 13 (54%) | 0.6 |
| n / N (%) Median (IQR); Fisher’s exact test; | |||
| Welch Two Sample t-test; Pearson’s Chi-squared test | |||
Table 2.
Confusion matrix depicting the classification frequencies of predicted classes versus the correct classes (gold standard).
Table 2.
Confusion matrix depicting the classification frequencies of predicted classes versus the correct classes (gold standard).
| Gold Standard | ||||||
|---|---|---|---|---|---|---|
| IE | I-moderate | I- severe | A-moderate | A-severe | Total | |
| Prediction | ||||||
| IE | 132 | 0 | 0 | 0 | 0 | 132 |
| I-moderate | 0 | 106 | 14 | 15 | 0 | 135 |
| I-severe | 0 | 8 | 95 | 4 | 13 | 120 |
| A-moderate | 0 | 12 | 4 | 100 | 11 | 127 |
| A-severe | 0 | 6 | 19 | 13 | 108 | 146 |
| Total | 132 | 132 | 132 | 132 | 132 | 660 |
Table 3.
Estimated class-specific diagnostic parameters of the sonfication-assisted STEMI classification task.
Table 3.
Estimated class-specific diagnostic parameters of the sonfication-assisted STEMI classification task.
| Class | Sensitivity | Specificity | f1 | Balanced Accuracy |
|---|---|---|---|---|
| IE | 1 | 1 | 1 | 1 |
| I-moderate | 0.8 | 0.95 | 0.79 | 0.87 |
| I-severe | 0.72 | 0.95 | 0.75 | 0.84 |
| A-moderate | 0.76 | 0.95 | 0.77 | 0.85 |
| A-severe | 0.82 | 0.93 | 0.78 | 0.87 |
Table 4.
Confusion matrix for the dichotomized classification problem.
| Gold Standard | |||
|---|---|---|---|
| 0 | 1 | Total | |
| Prediction | |||
| 0 | 132 | 0 | 132 |
| 1 | 0 | 528 | 528 |
| Total | 132 | 528 | 660 |
Table 5.
Confusion matrix for the reduced classification task with combined classes corresponding to moderate and severe cases, respectively, independently of location.
Table 5.
Confusion matrix for the reduced classification task with combined classes corresponding to moderate and severe cases, respectively, independently of location.
| Gold Standard | ||||
|---|---|---|---|---|
| IE | moderate | severe | Total | |
| Prediction | ||||
| IE | 132 | 0 | 0 | 132 |
| moderate | 0 | 233 | 29 | 262 |
| severe | 0 | 31 | 235 | 266 |
| Total | 132 | 264 | 264 | 660 |
Table 6.
Estimated class-specific diagnostic parameters of the sonfication-assisted STEMI classification task with the two severe and the two moderate classes each combined to a single class irrespective of location.
Table 6.
Estimated class-specific diagnostic parameters of the sonfication-assisted STEMI classification task with the two severe and the two moderate classes each combined to a single class irrespective of location.
| Class | Sensitivity | Specificity | f1 | Balanced Accuracy |
|---|---|---|---|---|
| IE | 1 | 1 | 1 | 1 |
| moderate | 0.88 | 0.93 | 0.89 | 0.9 |
| severe | 0.89 | 0.92 | 0.89 | 0.9 |
Table 7.
Fixed effect regression results from a multivariable linear random effects model which regresses the classification result (prediction) on 13 demographic and self-assessment parameters (predictors). Reference levels for categorical variables are omitted. “Block” refers to the iteration of consecutively presented blocks of sonification samples. For explanations of the other covariates see Table 1 and the Methods section, respectively.
| Predictors | Estimate | Std.Error | p-value |
|---|---|---|---|
| Gender female | 0.18 | 0.06 | 0.005 |
| Age | -0.001 | 0.018 | 0.968 |
| Q1 | 0.034 | 0.04 | 0.399 |
| Q2 | 0.024 | 0.031 | 0.442 |
| Q3 | -0.115 | 0.042 | 0.01 |
| Q4 | 0.057 | 0.039 | 0.158 |
| Preknowledge yes | 0.087 | 0.149 | 0.562 |
| Instrument yes | 0.012 | 0.06 | 0.846 |
| Musicality yes | 0.06 | 0.107 | 0.578 |
| SQ1 | -0.011 | 0.024 | 0.663 |
| SQ2 | 0.053 | 0.021 | 0.015 |
| SQ3 | 0.011 | 0.023 | 0.653 |
| Block 2 | 0.05 | 0.032 | 0.114 |
| Block 3 | 0.091 | 0.032 | 0.004 |
Disclaimer/Publisher’s Note: The statements, opinions and data contained in all publications are solely those of the individual author(s) and contributor(s) and not of MDPI and/or the editor(s). MDPI and/or the editor(s) disclaim responsibility for any injury to people or property resulting from any ideas, methods, instructions or products referred to in the content. |
© 2025 by the authors. Licensee MDPI, Basel, Switzerland. This article is an open access article distributed under the terms and conditions of the Creative Commons Attribution (CC BY) license (http://creativecommons.org/licenses/by/4.0/).
Copyright: This open access article is published under a Creative Commons CC BY 4.0 license, which permit the free download, distribution, and reuse, provided that the author and preprint are cited in any reuse.


