
Submitted:
03 June 2025
Posted:
05 June 2025
You are already at the latest version
Abstract
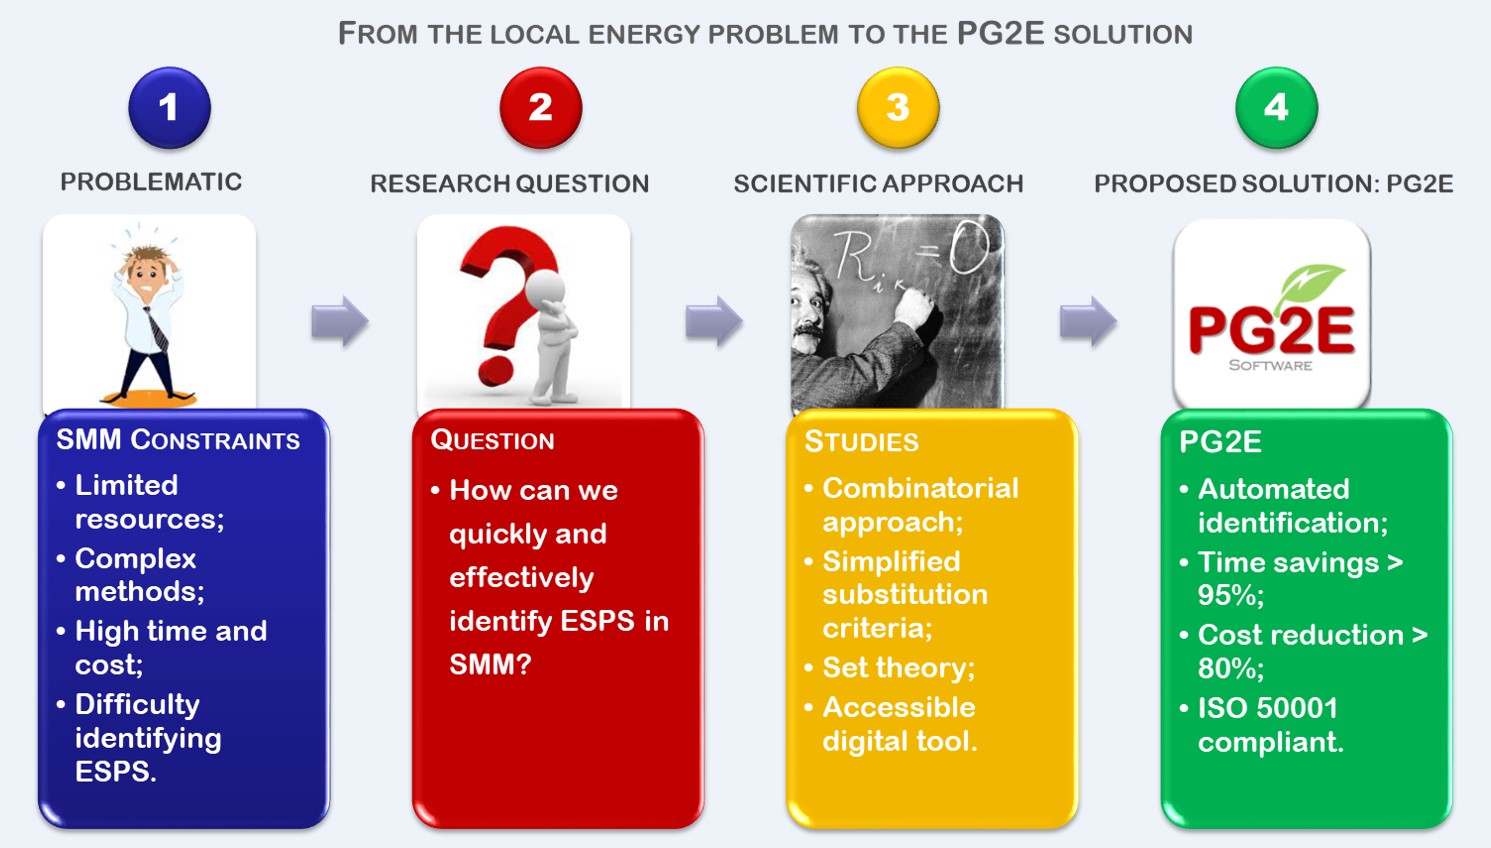
The energy consumption of buildings, the effectiveness of energy-saving measures and the exploitation of energy-saving potential represent crucial challenges for improving the energy performance of local authorities and reducing their environmental impact. However, Small and Medium Municipalities (SMM) are finding it difficult to identify their energy-intensive units, a process that is time-consuming (3 to 18 months), costly and based on inefficient manual methods. This article proposes an innovative solution, PG2E, based on a combinatorial approach to quickly and efficiently identify Energy Saving Potential Scopes (ESPS). The methodology adopts a critical realist approach to analyze the limitations of existing systems, using real energy data from a local authority. In addition, a constructivist-pragmatic approach was adopted to develop a solution adapted to the specific constraints of SMM. PG2E simplifies the ESPS identification process by using accessible statistical criteria (average consumption, upper quartile), thus reducing the need for technical expertise and optimizing the time and resources mobilized. The study carried out in ‘Quesnoy-sur-Deûle’ demonstrates the effectiveness of PG2E, which identifies ESPS with a success rate ranging from 60 % to 100 %, offering a rapid and cost-effective solution for improving the energy performance of local authorities.
Keywords:
Energy Saving Potential Scope
; ESPS
; ISO 50001
; PG2E
; Energy Saving
1. Introduction
The global energy challenge is central to the climate change debate, due to our historical reliance on fossil fuels and their significant contribution to greenhouse gas (GHG) emissions. The 1.5°C limit set out in the Paris Agreement is an ambitious target that will require far-reaching transformations in energy, economic and social systems [1].
Scientific literature converges on the fact that limiting global warming to 1.5°C requires rapid, systemic transformations in all economic sectors [2]. The scientific foundations laid down by the IPCC (Intergovernmental Panel on Climate Change) call for urgent action to reduce global emissions as early as this decade [2]. The trajectories proposed by Rogelj et al. .[3], as well as the energy scenarios drawn up by the IEA (International Energy Agency) [4] and Grubler et al. [5], offer strategic frameworks to guide this transition. However, as highlighted by the UN [6], there remains a significant gap between stated ambitions and actual implementation. Bridging this gap is essential to avoid irreversible climate impacts while ensuring equitable sustainable development.
Among the sectors requiring far-reaching energy transformation, the building industry occupies a central position due to its major role in energy consumption and greenhouse gas emissions.
The energy efficiency of buildings is a central issue in energy transition and climate change policies. With an estimated contribution of between 20% and 40% to global energy consumption in developed countries, the building sector represents an essential lever for reducing greenhouse gas emissions [7]. Several studies have shown that heating, ventilation and air-conditioning (HVAC) systems are the most energy-intensive consumption items, accounting for almost 50% of total building energy consumption. However, despite the existence of numerous energy efficiency policies, energy consumption continues to rise, particularly in the tertiary and residential sectors, underlining the importance of developing tools that are better suited to identifying potential energy savings.
The literature used (Table 1) has mainly focused on building energy consumption and energy savings prediction models [8]. One of the most common approaches relies on detailed analysis of energy flows and equipment in place, enabling be identified energy-saving potential to through advanced simulations and detailed energy audits. Although robust, these methods generally require substantial resources in terms of technical expertise, data collection and financial resources. In addition, a large body of research has examined energy efficiency measures, from technological improvements (equipment refurbishment, thermal insulation, etc.) to more effective energy management strategies (optimizing usage, modifying user behavior) [9].
In the face of ever-increasing energy consumption in buildings, research has also focused on the potential for energy savings. Drawing on the sources presented in Table 2, the literature review aims to identify general trends, challenges encountered and policies put in place to improve energy efficiency.
Despite numerous policies and initiatives at European and national level, electricity consumption continues to rise in EU member countries. In the EU-25 residential sector, for example, consumption rose by 10.8% between 1999 and 2004, keeping pace with economic growth. Comparable trends were observed in the tertiary sector, although the increase was less marked in industry. However, there is still a lack of precise data on the breakdown of this consumption between different uses and equipment, particularly in the tertiary sector, where information is even more limited than in the residential sector [10].
The European Union has introduced a number of energy efficiency programs and policies to encourage reduced consumption, including standards, energy labels, financial incentives and energy saving certificates. One of the most effective levers for improving energy efficiency is to speed up the replacement of energy-hungry equipment with more efficient models, thus reducing the time needed to completely renew the existing stock [10].
- Cost of data collection : identifying potential energy savings requires in-depth analysis, which is often costly and difficult to implement [11].
- Lack of appropriate financial incentives : the lack of coordination between the various players (e.g. the owners who make the investments and the tenants who benefit from them) limits the implementation of effective measures [11].
- Fragmentation of the building sector : the diversity of the players involved (architects, engineers, construction companies, operators) makes it difficult to take a global, coherent approach to energy efficiency [11].
These challenges are particularly acute in the residential and tertiary sectors, which calls for a more integrated approach combining several policy tools and instruments.
While identifying energy-saving potential is an essential first step, implementing concrete measures remains a major challenge, according to the literature in energy-saving measurement the articles presented in Table 3.
Improving energy efficiency relies on a combination of policies, assessment models and analysis of consumption behavior. These different approaches enable us to identify the most effective strategies for reducing energy consumption and optimizing the energy performance of buildings.
Energy efficiency policies play a key role in reducing energy intensity. Geller et al (OECD) have analyzed policies implemented over a thirty-year period, highlighting their impact on reducing energy consumption. Their results show that these gains are often attributed to changes in economic sectors and technological innovation, but that research and development (R&D) efforts in the building sector remain under-exploited [15].
Different methodologies are used to assess energy consumption and identify opportunities for improvement. Kavgic et al. have investigated bottom-up models, which estimate baseline building energy consumption and analyze the impact of CO₂ emission reduction strategies. However, their study highlights several limitations, including the lack of detailed public data and the absence of models incorporating both technical and socio-economic factors [16].
Jaffe and Stavins have explored the difference between actual and optimal energy use. Their work highlights several market failures, such as the lack of information on potential energy efficiency gains or the high initial cost of retrofits, which prevent widespread adoption of energy-saving solutions. They distinguish several levels of optimality, ranging from theoretical economic potential to the social optimum, depending on incentives and policy interventions [17].
Koopmans and et Velde have proposed a hybrid model, combining bottom-up and top-down approaches to predict energy demand. Their study reveals a slowdown in the adoption of energy-saving technologies between 1990 and 2015, suggesting that more incentive-based policies and accessible innovations are needed to accelerate the energy transition [18].
Beyond simply reducing consumption, Sharmina et al. have identified several co-benefits linked to building energy efficiency, such as :
- Improved indoor air quality.
- Reduced respiratory illness and mortality.
- Productivity gains and enhanced well-being for occupants. However, these benefits are rarely integrated into economic analyses and political decisions, which underestimates their overall impact [19].
Research into energy-saving measures faces several challenges :
- Lack of data transparency and accessibility : gathering reliable information on consumption and potential savings remains a major obstacle [16].
- Limited consideration of socio-technical factors : studies do not always take into account occupant behavior and its impact on energy consumption [16].
- Lack of standardized methodologies for quantifying and comparing the co-benefits of energy savings [19].
- Multidisciplinary, dynamic models are needed integrating energy, economics and public health for a more global vision of energy efficiency [16].
Energy-saving measures are essential for reducing consumption and improving the energy performance of buildings. However, efforts are still needed to refine evaluation models, integrate co-benefits into decision-making and harmonize methodologies. Implementing more accessible solutions, tailored to the realities of local authorities and businesses, is a key issue in maximizing the long-term impact of energy efficiency policies.
An analysis of the challenges and gaps in existing literature on building energy consumption, energy-saving potential and energy-saving measures highlights the lack of solutions tailored to small and medium municipalities (SMM) for identifying .energy-saving. This limits their ability to optimize their efforts to reduce consumption and comply with environmental standards, notably ISO 14001 and more specifically ISO 50001 for Energy Management Systems (EMS). The development of methodologies and tools dedicated to SMMs would help fill this gap, facilitating the identification of energy saving potential scopes and reinforcing the effective implementation of local energy policies.
The main objectives of this article are to:
- Analyze and assess the limitations of approaches current to identifying energy-saving potential, highlighting the specific obstacles encountered by small and medium municipalities (SMM).
- Develop an innovative methodology, based on combinatorial optimization and simplified criteria, to enable rapid and effective identification of potential energy savings.
- To propose an automated digital tool, designed to facilitate the identification of energy-saving potential for SMMs and enable them, without advanced expertise, to determine the perimeters eligible for Energy Management System (EMS) certification under the ISO 50001 standard. This tool will be tested through a case study.
By combining an adapted methodological approach and an accessible digital tool, this research aims to offer SMMs a fast, reliable and low-cost solution to optimize the process of identifying energy saving potential and strengthen their commitment to the energy transition. Before exploring these solutions, it is essential to precisely define the concept of ESPS, and to examine existing approaches to identifying them in the specific context of SMM.
2. Energy Saving Potential Scope (ESPS)
2.1. What Is the ESPS
The Energy Saving Potential Scope (ESPS) is defined as a set of energy-intensive units, zones or sectors where energy savings can be achieved. Figure 1 shows an example of an organization's ESPS, with five energy-intensive units. The aim is to identify scope where energy consumption can be reduced without affecting service or production levels. Energy-saving opportunities can be found in various sectors, such as industry, construction, transport and agriculture. They include actions such as improving the energy efficiency of equipment, reducing energy losses, and adopting more energy-efficient behavior [20] [21].
The process of identifying the energy saving potential scope (ESPS) depends on the system used in the municipalities. And the ISO 50001 certification scope (CS) is derived from the relevant ESPS.
This concept is fundamental to assessing and improving energy efficiency in different contexts, and understanding it is essential to any research aimed at optimizing the management of the process of identifying energy-saving opportunities.
Based on set theory, we identify the subsets of a set of 5 energy-consuming units, for example, excluding the empty set (∅ ) and the full, and calculate their count, which is 25 - 2 = 30 subsets grouped by subset type characterized by its count. In our example, we obtain the following types of perimeter or subset :

Table 4.
Example of perimeter count for a set of 5 energy consumption units.
| Pn | Scope Description | Quantity Pn |
|---|---|---|
| P1 : | Energy saving potential scope set with 1 energy-intensive unit | 5 |
| P2 : | Energy saving potential scope set with 2 energy-intensive units | 10 |
| P3 : | Energy saving potential scope set with 3 energy-intensive units | 10 |
| P4 : | Energy saving potential scope set with 4 energy-intensive units | 5 |
2.2. Current Methods Used to Identify the ESPS
Energy data collection methods for identifying ESPS in municipalities are generally based on several existing solutions, including the Local Measurement System (LMS), the Real-Estate and Energy Master Plan (REMP) and the Cit'ergie System (climate-air-energy policy labeling program), according to the field survey (Figure 2).
The survey shows that current methods for collecting data and identifying ESPS are poorly adopted, with the exception of the local measurement system (LMS). It also examined the criteria used by municipalities to identify the ESPS (Figure 3).
The results of the survey show that the physical obsolescence index (POI) of units, along with other criteria such as regulatory status used by municipalities, account for 54% of energy-hungry units.
An organization’s or municipality's energy policy defines criteria for existing systems, among which it is essential to select the most relevant ones in order to identify the optimal ESPS and define it as a certification scope (CS) according to the ISO 50001 standard. Criteria may include :
- Energy consumption of the energy-guzzling unit.
- Energy consumption per square meter of the energy-consuming unit, if it's a building.
- Energy Performance Diagnostic (EPD).
- The indicator that qualifies the state of disrepair of the building, equipment and networks.
- Regulatory status.
- The cost of owning the building for the community.
- Etc.
The classic of the current process used to identify energy saving potential scope (ESPS) methodology is a step-by-step process (Figure 4):
Walk-through audit :
- Visual Inspection: A rapid inspection of installations to identify energy-saving opportunities linked to equipment maintenance and operation.
- Rapid Identification: Quickly identify scopes with high savings potential without detailed analysis. [22]
Standard Energy Audit :
- Data Collection: Detailed collection of energy consumption data over a significant period.
- Consumption analysis: Evaluation of energy consumption by use (heating, lighting, etc.) and identification of inefficiencies.
- Recommendations : Proposed energy efficiency improvement measures with estimated potential savings and return on investment [22].
In-depth energy audit :
- Energy Analysis: Assessment of the quality of energy used and identification of exergy losses for specific processes.
- Modeling and Simulation: Using thermodynamic models to simulate energy performance and identify energy-saving opportunities [22].
The existing systems for identifying the Energy Savings Potential Scopes (ESPS) are:
- The Real-Estate and Energy Master Plan (REMP) method.
- The Local Measurement System (LMS).
- The Cit'ergie system.
In the following section, we present in detail these different methods and their application in the context of Small and Medium Municipalities (SMM).
2.3. REMP System Method for Identifying the ESPS
The difficulties encountered by local authorities in gathering information on a building, its history and its operation, for example, to carry out a simple energy audit, are often so insurmountable that the service provider has to do “without”. It is therefore becoming a matter of urgency for local authorities to implement a rigorous management and monitoring tool for the performance of their real estate assets, so that they can meet the energy challenges, and of course take advantage of the opportunity to meet many others: quality of use (functionality, comfort, upgradability, security, etc.), accessibility in the broadest sense (services and mobility), and controlled operating costs. According to ADEME, this tool is the Real-Estate and Energy Master Plan (REMP). It is an essential strategic tool for managing and optimizing the real estate assets of local authorities. It combines real estate and energy planning to meet current and future needs, while respecting budgetary and environmental constraints.
One of the key objectives of the REMP is to reduce energy consumption by identifying priority actions and planning investments as part of the Pluriannual Investment Plan (PIP). The REMP helps to define strategies for achieving the energy consumption reduction targets set by regulations such as the "Tertiary eco energy" decree [23] [24].
This REMP can identify the scope of energy-saving potential in several ways, following a structured methodology, as shown in Figure 5, and using advanced diagnostic tools.
These stages are defined as follows:
- Asset mapping: The first step is to carry out a detailed mapping of the building stock. This involves identifying all buildings and assessing their current condition, including energy performance, obsolescence and functional use [25]. This mapping enables us to visualize the entire portfolio and identify the buildings with the greatest potential for energy improvement.
- Energy Diagnosis: An in-depth energy diagnosis is carried out for each building. This includes an analysis of energy consumption, identification of the main sources of energy loss, and assessment of the technical systems in place [23]. This diagnosis enables us to target buildings and installations where significant energy savings can be made.
- Multi-criteria analysis: A multi-criteria analysis is carried out to prioritize the actions to be taken. This analysis takes into account various factors such as the cost of the work, the return on investment, the potential energy impact, and technical or regulatory constraints [23]. This helps to identify the most effective interventions and define a priority action scope.
- Energy strategy: On the basis of diagnostics and analyses, an energy strategy is drawn up. This strategy includes energy improvement scenarios with clear, measurable objectives, aligned with regulatory requirements such as the "Tertiary eco energy" decree [25].
- Pluriannual Investment Plan (PIP) : The REMP includes a multi-year investment plan detailing the actions to be undertaken over several years. This plan makes it possible to program the work in a coherent way and to monitor the progress of the energy savings achieved. [23].
In short, the REMP uses a combination of mapping, diagnosis, multi-criteria analysis and strategic planning to identify and exploit energy-saving potential, thus ensuring optimized, sustainable management of property assets, thanks to technical, engineering, financial and time challenges that can range from 3 to 18 months, especially for Small and Medium Municipality (SMM) that may lack the resources to deal with these issues.
2.4. Measuring System Method to Identify the ESPS
A metering system is a set of devices for measuring, recording and analyzing the energy performance of a site or organization. Every metering system is made up of three elementary building blocks: metering devices, reading devices and analysis devices:
- The measuring device is made up of equipment designed to be used to take measurements: voltage, current, flow, temperature, humidity, etc.
- The reading means enable data from the measuring device to be collected and centralized via an acquisition chain.
- Analysis resources are the tools used to process the data collected.
The concept of a metering system therefore encompasses the metering instruments, the energy data acquisition chain and the energy data analysis resources. [26]. The system recommended by ISO 50001 is limited by its manual or semi-automatic methodological and technological approach, mainly using Excel (Figure 6).
Thus, a local energy performance local measurement system consists of several essential elements. Firstly, it includes metering devices such as energy meters (electricity, gas, water) and temperature and pressure sensors, which measure energy data accurately and granularly [26]. Secondly, the means of reading and historizing are crucial for collecting and storing this data. This can be done by manual or automated readings, using wired or wireless data transmission networks, and gateways for data concentration [26]. Finally, analysis resources include energy management software and data analysis tools, often based on big data, which enable data visualization, calculation of Energy Performance Indicators (EPI), and identification of energy-saving opportunities [26]. These components work together to provide continuous, optimized monitoring of energy consumption.
But how are the data collected by a local measurement system analyzed to identify energy savings?
The data collected by a local measurement system are analyzed to identify energy savings through several methodical steps according to the following Figure 7 :
- Comparative methods : Comparative methods, such as inter-site and intra-site analysis, are used to compare energy performance between different sites or within a single site. These methods make it possible to detect consumption stubs, reading errors and consumption drifts, thus facilitating the identification of corrective actions [31].
- Energy Performance Indicators (EPI) : EPIs are calculated to assess energy efficiency. These indicators take into account explanatory variables, such as climatic conditions or building occupancy, to provide an accurate assessment of energy performance. [32].
By combining these steps, a local measurement system can optimize energy consumption and generate significant savings, while improving environmental sustainability.
On the other hand, setting up a local metering system in communities presents several major challenges. Firstly, technical complexity is a major obstacle, as various measuring devices, such as energy meters and sensors, need to be integrated, while ensuring their compatibility with existing building management systems [27] [26]. Data collection and management also pose challenges, requiring robust communication networks to transmit data reliably and continuously to a centralized system [27] [26]. The sheer volume of data collected requires high-performance software solutions for analysis and storage. Secondly, analyzing and exploiting the data to identify energy-saving opportunities can be complex, requiring specialized software to calculate Energy Performance Indicators (EPI) and detect anomalies. [27] [32]. Regulatory and normative compliance, particularly with standards such as ISO 50001, adds another layer of complexity, requiring system adaptation to meet legal requirements [32]. Finally, the cost and financing of system installation and maintenance can be significant, necessitating innovative financing solutions [33]. The human resources and skills needed to manage these systems represent another challenge, as it can be difficult to recruit and train qualified personnel [35].
2.5. Cit'ergie System Method for Identifying the ESPS
According to "Aides-territoires" (Territorial aids) from the “Direction Générale de l’Aménagement, du Logement et de la Nature (DGALN)” (General Directorate of Planning, Housing and Nature - GDPHN), the Cit'ergie system is a management and certification program designed to help municipalities implement ambitious climate, air and energy policies. Supported by ADEME, the program aims to reduce greenhouse gas emissions, improve energy efficiency, cut air pollution and develop renewable energies. Cit'ergie offers technical and financial support to local authorities, enabling them to structure, monitor and evaluate their “Territorial Climate-Air-Energy Plan” (TCAEP). The Cit'ergie label, which is part of the European Energy Award (EEA), evaluates the actions of local authorities in their own scopes of competence and sphere of influence, taking into account a catalog of concrete measures for undertaking energy-climate actions on the territory. By obtaining this label, local authorities can demonstrate their commitment to the energy transition, which can also contribute to their economic development, attractiveness and quality of life for their residents [36] [37].
But in the context of energy reduction, what are the steps involved in identifying potential energy savings with a Cit'ergie system?
To identify energy-saving opportunities with a Cit'ergie system, several key steps are involved (Figure 8).
Firstly, an energy survey is carried out to collect data on the energy consumption of the buildings or facilities concerned. This includes information on energy bills, heating, ventilation and air-conditioning systems, lighting and electrical equipment. [29]. This data is then analyzed to identify consumption trends, peak periods and potential wastage. Analysis can be carried out using specialized software that models energy performance [29].
In parallel, the use of an energy performance indicator (EPI) measurement system in Cit'ergie makes it possible to monitor energy consumption, identify opportunities for improvement, and implement strategies to reduce energy consumption and associated costs. [27]. EPIs, which are ratios between energy consumed and explanatory variables, help to understand the factors influencing consumption and predict potential savings [32]. Finally, recommendations are made for improving energy efficiency, such as upgrading equipment or installing automatic controls [29]. These steps make it possible to quantify energy savings and optimize municipality energy management.
On the other hand, the main challenges encountered when using the Cit'ergie system to identify energy-saving opportunities in municipalities include several complex aspects like other systems. Firstly, data collection can be difficult due to the diversity of energy infrastructures and systems in place, requiring consistent integration of various measuring devices such as energy meters and sensors [38] [27]. Data management and analysis also represent a challenge, as they require advanced software solutions to process large quantities of data and identify energy trends or anomalies [27]. In addition, compliance with standards and regulations, such as ISO 50001, requires continuous adaptation of systems to meet legal requirements [32]. Municipalities must also overcome obstacles related to financing the installation and maintenance of metering systems, which may require access to subsidies or specific funding [39]. Finally, skills development and staff training are essential to ensure effective system management, which can be a challenge in terms of available human resources [27] [39]. These challenges require a structured approach and innovative solutions if they are to be overcome effectively.
2.6. Sequential Approach to Existing Methods
The identification of energy savings potential scope (ESPS) by these systems is based on several methods aimed at selecting the energy-intensive units most relevant to energy optimization. One of the most common approaches is a sequential selection, focusing on units with the highest energy consumption. However, this method has its limitations, as it risks excluding certain low-consumption units which, due to their age or regulatory non-compliance, could nevertheless offer significant potential for energy savings.
To refine this selection, some methods incorporate additional criteria such as the state of obsolescence and regulatory compliance of equipment. A data sheet is generally drawn up to evaluate these criteria, with a rating used to classify energy-hungry units. This assessment then results in a multi-criteria classification, combining energy consumption, obsolescence and regulatory compliance. However integrating, these criteria requires additional resources and often time-consuming engineering activities.
Based on this classification, a weighted ranking of energy-intensive units is carried out using tools such as Excel, to identify the most relevant energy-saving opportunities. Depending on the resources available, municipalities can then select the first ‘n’ opportunities to create an optimized ESPS. The advantage of this approach lies in its ability to include certain units that were initially underestimated due to their low consumption, but which present a high potential for optimization thanks to the criteria of obsolescence and regulation.
Thus, the identification of an ESPS cannot be limited to a single criterion of energy consumption. A combined approach is essential to ensure a more relevant and effective selection.
2.7. Limits of Existing Systems Methods
Metering-based methods for identifying Energy Savings Potential Scopes (ESPS) have a number of intrinsic limitations that can hamper their effectiveness. Firstly, traditional metering systems are often based on technologies that don't allow for sufficiently fine-grained and detailed data collection. This can lead to excessive aggregation of data, making it difficult to accurately identify sources of energy waste. When considering a large number of community assets, this limitation is exacerbated by the growing complexity of data management and analysis, and in particular the identification of energy saving potential scope (ESPS). Figure 9 shows a simulation based on energy consumption data for the town of Quesnoy Sur Deûle (QSD).
The graph in Figure 9 shows the evolution of the number of energy saving potential scope (ESP) as a function of the number of energy-consuming units in the municipality of Quesnoy-Sur-Deûle (QSD). It can be seen that :
- For 1 energy-intensive unit, no ESPS has been identified.
- For 5 energy-intensive units, 30 ESPS can be implemented.
- From upwards 8 energy-intensive units, the number of ESPS explodes: 254 ESPS with 8 units, 510 ESPS with 9 units and 1022 ESPS with 10 units.
The number of ESPS is growing exponentially. Indeed, as long as the number of energy-intensive units is low (between 1 and 5), the number of ESPS remains limited, but as soon as are reached 6 to 10 energy-intensive units, the realization of ESPS becomes very important and complex. This reveals that energy interactions between units increase drastically, making it difficult to identify optimal scope accurately by hand. This analysis highlights the limitations of manual methods for identifying ESPS once a certain threshold of energy-intensive units is reached. The exponential increase in the number of possible combinations calls for the use of advanced analysis tools to optimize community energy management quickly and efficiently.
To support our finding that existing systems are manual, our field survey revealed the solutions and software currently used by municipalities to identify the ESPS (Figure 10).
The results of this survey reveal a heavy reliance on manual methods, particularly spreadsheets (77%), and a virtual absence of advanced software solutions for the identification of ESPS. Only a minority (31%) combine a metering system with a spreadsheet, and no respondents use Energy Information Systems (EIS) or software solutions to improve the efficiency of this task. These results underline the crucial need to modernize the tools used by local authorities to optimize their energy-saving efforts.
The need to assess numerous buildings and infrastructures simultaneously means a significant increase in the time and human and material resources required. Teams need to be sufficiently trained and available to install, monitor and maintain metering devices, which can represent a high cost for municipalities, especially smaller ones. In addition, traditional metering systems can suffer from accuracy and reliability problems. Sensors and meters can be subject to measurement errors, failures or drift over time, compromising the quality of the data collected. These problems can lead to inaccurate assessments of potential energy savings, limiting the effectiveness of any corrective action taken. Finally, interpreting the data from these systems often requires advanced technical skills, which can represent an additional challenge for municipalities who do not have the resources to hire or train qualified personnel. In short, although metering systems are essential for the identification of ESPS, their intrinsic limitations call for technological and organizational improvements to maximize their effectiveness.
3. Methodology of the New Solution
Our approach is based on a combination of empirical observations, mathematical concepts and models of set theory with accessible statistical criteria, eliminating dependence on the time-consuming processes of traditional approaches, and field surveys, integrating a critical realist epistemological posture.
This approach enabled us to expose the shortcomings of existing systems, in this case the Local Measurement System (LMS), Cit'ergie (a management and labelling program for local authorities) and the Real-Estate and Energy Master Plan (REMP) system, used in energy diagnostics for municipality. With this in mind, we followed an inductive approach, starting with observation of the perceived reality of our case study. From this observation and an empirical generalization, as well as field surveys, we developed a model based on mathematical science theory to improve existing systems.
These inductive approaches (Figure 11) [40] and abductive (Figure 12) approaches were necessary, as the development of the PG2E methodology is part of an emerging field of research, where academic references remain limited and theory concerning the inadequacy of existing systems is poorly developed or even non-existent in the scientific academic literature. In the absence of specific methodologies in the literature, this study adopted an innovative combinatorial approach, relying on set theory to generate and analyze energy-intensive sub-assemblies. In addition, the simplified criteria of average consumption and upper quartile, introduced in this research, constitute an original and accessible alternative to traditional approaches, which are often time-consuming and complex.
3.1. Combinatorial Approach to the New PG2E Method
Identifying energy savings potential scope (ESPS) is a major challenge for local authorities wishing to optimize their energy consumption through energy management systems that comply with current standards, such as ISO 50001. However, traditional approaches, generally based on criteria such as energy consumption, obsolescence and regulatory compliance of energy-intensive units, require significant resources and time-consuming engineering activities, making them particularly complex to implement for small and medium municipalities (SMM) energy management compliant with current standards, such as ISO 50001. However, traditional approaches, generally based on criteria such as energy consumption, obsolescence and regulatory compliance of energy-intensive units, require significant resources and time-consuming engineering activities, making them particularly complex to implement for small and medium municipalities (SMM).
To overcome these limitations, the PG2E method adopts a combinatorial approach, enabling the rapid identification of an optimal ESPS while reducing the analytical workload. In contrast to the sequential approach, the PG2E method introduces, within the ESPS, substitute criteria that are highly correlated to the classic criteria (obsolescence and regulatory compliance) as well as to energy consumption, in order to simplify the process of identifying the optimal ESPS. It is important to point out that data collection, while essential to any energy analysis, is a separate process and not part of the PG2E methodology illustrated in Figure 13.
3.1.1. ESPS Constitution (Candidate Subsets)
The first step is to generate all possible subsets (scope) of a set of energy-consuming units in a local authority, without including the empty set or the complete set. These scope are made up of buildings or equipment, for example, with measurable energy consumption. The aim is to create several combinations of scope that can represent an ESPS.
Let , all the energy-consuming units identified within a municipality.
The total number of possible subsets of , including the empty set and the complete set , is given by :
However, for the identification of ESPS, it is necessary to exclude :
- The empty set , which contains no energy-guzzling units.
- The complete set which represents all the energy-consuming units and does not allow for an optimal ESPS.
The number of candidate sub-assemblies selected by PG2E is :
To form these subsets, PG2E generates all possible combinations of elements from with a size such that :
The number of subsets of size is given by the binomial coefficient :
The set of candidate subsets (candidate ESPS) is therefore defined by :
Where
- is a subset of energy-consuming units fro .
- is the set of eligible ESPS candidate subsets excluding the empty set and the complete set .
3.1.2. Selection of Eligible ESPS (Filtering of Eligible Subsets)
An initial filter is applied to identify the scope that meet the threshold of 65 % [41] of the organization's total energy consumption, in line with the recommendations of the ISO 50001 standard, which is based on experience. Although this threshold is a benchmark, it is not rigid: local authorities can choose a higher threshold depending on their energy policy and energy management maturity.
Scopes meeting this criterion are considered "eligible scopes", i.e. potential candidates for identification of the optimum ESPS.
- Calculation of energy consumption of sub-assemblies : :
For each subset , the total energy consumption is calculated :
Where is the individual consumption of the energy-consuming unit .
- Filtering eligible subsets.
is the total energy consumption of a subset. A subset is considered an eligible ESPS if :
Where : is the total energy consumption of the complete assembly .
Subsets that meet this criterion are then retained for the next stage of the PG2E methodology.
3.1.3. Definition of Substitute Criteria
Rather than directly assessing obsolescence and regulatory compliance - criteria that require resources and in-depth technical studies - PG2E proposes an alternative approach (Figure 14).
- Calculated indicators are extracted from eligible perimeter variables and tested to determine their correlation with conventional criteria.
- Statistical analysis is performed using Pearson correlation coefficients and p-values, allowing the identification of indicators most strongly associated with obsolescence and regulatory compliance.
- These indicators thus become the new criteria, called substitute criteria, for refining the ESPS selection.
Once the eligible ESPS have been identified, based on the threshold of 65% of total energy consumption, the next step is to calculate several key indicators that will serve as the basis for identifying substitute criteria. These criteria are designed to effectively replace the often time-consuming traditional variables of obsolescence and regulatory compliance.
This calculation phase was carried out during tests carried out in several municipalities, including Quesnoy-sur-Deûle, where 6,623 ESPS eligible for the certification scope of EMS (Energy Management System) were identified. For each eligible ESPS, the following variables were calculated and integrated into a table comprising seven main columns:
- Total ESPS surface area: sum of the surface areas of the energy-intensive units making up the ESPS.
- Total ESPS energy consumption: sum of annual energy consumption of all ESPS units.
- ESPS average energy consumption: Arithmetic mean of the energy consumption of the units making up the ESPS.
- Energy consumption per m2 of ESPS: Ratio between total energy consumption and the total surface area of the energy-consuming units making up the ESPS.
- Quartile 75 of ESPS energy consumption: value located at the 75th percentile of individual energy consumption of ESPS units, highlighting energy-hungry units with the highest consumption.
- ESPS total obsolescence value: sum of the obsolescence indices of the units making up the ESPS.
- Total ESPS regulatory status value: sum of ESPS unit regulatory compliance indices.
The data obtained are grouped together in a comprehensive table, which serves as the basis for calculating Pearson correlation coefficients and p-values (Table 5). These statistical analyses enable us to identify the substitute criteria that correlate most strongly with the obsolescence and regulatory compliance variables.
The next step is a second filter applied to eligible ESPS, based on the identified surrogate criteria. The optimal ESPS is determined by maximizing the value of the chosen substitution criterion. This approach effectively selects the perimeter with the best potential for energy optimization.
The coefficients obtained reveal a negative, moderately strong and statistically significant correlation (p-value < 0.05) between the variables analyzed, although correlation does not necessarily imply a causal relationship. We observe that older or dilapidated buildings seem, counter-intuitively, to consume less on a heritage scale, which may be explained by reduced usage. Furthermore, technical "age" and compliance with regulations do not systematically translate into higher energy consumption. These observations suggest that using average consumption and the 75th percentile as substitute criteria for obsolescence and regulatory status, would be a relevant choice, in the fourth stage, for identifying the certification scope (CS) of the energy management system (EMS) according to ISO 5001.
In the rest of our study, these two criteria (average consumption and 75th quartile) will be used in the PG2E method to help identify the optimum ESPS, taking into account energy consumption, equipment obsolescence and regulatory compliance.
In the PG2E method, average energy consumption and quartile 75 (Q3) are used as proxy criteria to simplify the identification of relevant ESPS.
Calculation of substitute criteria: for each eligible ESPS, two simplified criteria are calculated:
- Average consumption :
- Upper quartile :
The upper quartile is determined by ordering the of in ascending order, then selecting the value at the position corresponding to 75 % of the workforce. Its determination follows the formula :
Where :
- 🗸
- is the total number of data items.
- 🗸
- denotes the value at position in the sorted series.
For data sets where the calculated position is not an integer, linear interpolation is performed to determine the exact value of . For example, if the calculated position is then
The use of the 75 quartile thus makes it possible to prioritize energy-intensive units which, although less consumptive in appearance, may be critical due to their obsolescence or regulatory non-compliance. This ensures a more inclusive and robust approach to identifying relevant ESPS.
3.1.4. Selecting the Right ESPS
Among the eligible subsets, the optimal perimeter is the one that maximizes the statistical criteria defined above (mathematical formula of the 2 criteria in a contracted calculation) :
This scope has been selected as the optimum ESPS.
In other words, the relevant ESPS is selected by maximizing one of the two alternative criteria chosen by the energy decision-makers (mathematical formula of the 2 criteria in 2 separate calculations) :
- Selection by maximum average consumption
This criterion makes it possible to prioritize
sub-assemblies (ESPS) whose energy-hungry units have a high average
consumption, often associated with outdated or non-compliant infrastructures.
This scope has been selected as the optimum ESPS.
- Selection by maximum 75 quartile :
This criterion favors sub-assemblies (ESPS) containing energy-intensive units with particularly high consumption, even if these units are in the minority in the ESPS identified.
This scope has been selected as the optimum ESPS.
Further explanations
The maximum average consumption criterion identifies the ESPSs that, on average, consume the most energy, which is often linked to outdated or non-compliant equipment.
The maximum 75 quartile criterion focuses on energy-intensive units with the highest consumption, even if they are few in number, which is particularly useful when some units are under-utilized due to obsolescence or non-compliance.
The choice between these two criteria is left to the energy decision-maker, depending on local priorities and the specific objectives of the study or the community's energy policy strategy.
3.1.5. Evaluation and Validation of the Relevant ESPS
The final step is to assess the relevance of the ESPS identified by PG2E by comparing it with a reference scope derived from an existing method within a community or organization.
- Calculation of the match rate between the relevant ESPS and the reference ESPS :
- Evaluation of the correspondence rate according to the majority principle: if a strong intersection is observed between the scopes identified by PG2E and those of traditional methods, then the method is deemed effective and usable. Thus, the correspondence rate, a key evaluation indicator, will be deemed sufficient if the ratio of the number of common units of the relevant ESPS and reference ESPS to the total number of units of the relevant ESPS reaches a rate greater than or equal to 50% according to the traditional methods scenario; this will enable us to verify the accuracy and effectiveness of the PG2E method.
- Validation and final decision: Energy decision-makers evaluate the identified scope, adjusting it if necessary in line with the local authority's objectives and strategic policy. Once validated after evaluation, the relevant ESPS becomes the certification scope (CS) for the ISO 50001-compliant energy management system.
3.1.6. Schematic Summary of the Methodology of the Combinatorial Approach to the Solution (Figure 15)
3.2. Justifying the Combinatorial Approach
The use of this combinatorial approach ensures that no potential subset is overlooked, guaranteeing that all possible combinations of energy-intensive units are evaluated before applying the selection criterion. In addition, it allows us to identify energy-intensive units which, despite low individual consumption, may be relevant due to their obsolescence or regulatory non-compliance, thanks to the introduction of the average substitute criterion, as well as the 75 quartile criterion, which favors subsets containing energy-intensive units with particularly high consumption.
4. PG2E—Digital Solution for Identifying the Right ESPS
4.1. Introducing the PG2E Application
PG2E is an innovative, fully digital solution that uses a combinatorial approach to automatically identify the ISO 50001 certification scope based on monthly or annual energy consumption data and the definition of substitute criteria (Figure 16).
4.2. Automating the PG2E Process
The PG2E methodology is fully automated using a combinatorial programming algorithm implemented in Python. The algorithm follows the following steps :
- Generate all possible subsets using Python's combinatorial library (itertools.combinations) (I) + (II) + (III) + (IV) + (V).
- Calculation of energy consumption for each subset and filtering of eligible ESPS: (VI) + (VII).
- Identification of substitute criteria (mean and quartile 75) for obsolescence and regulatory compliance using Pearson coefficients and p-values. Calculation of substitute criteria and for eligible subsets: (VIII) + (IX) + (X).
- Automatic selection of the relevant perimeter (XI) or ((XII) and (XIII)).
- Evaluation and validation of the relevant ESPS.
The originality of this research lies in the development of PG2E, a new method and innovative digital solution based on set theory and simplified statistical criteria. It automatically identifies energy-saving potential scope (ESPS) from a single data source, notably energy consumption, with results comparable to conventional methods, while being faster, less costly and better suited to Small and Medium Municipalities (SMM).
4.3. Case Study : Municipality of “Quesnoy-sur-Deûle” (QSD)
4.3.1. Case Study Background
Quesnoy-sur-Deûle, a French municipality of 7,000 inhabitants, is an ideal setting for testing the innovative PG2E solution. This community represents a common typology of Small and Medium Municipalities (SMM), characterized by :
- A diverse range of buildings, including administrative, school and sports facilities.
- Limited technical and financial resources for energy management.
- A regulatory obligation to comply with standards such as the tertiary sector decree and ISO 50001.
The case study conducted on the municipality of Quesnoy-sur-Deûle aims to assess the relevance and reliability of the PG2E method in a real-life context, by comparing its results with those of traditional approaches used by the local authority. In particular, the application of the REMP (Real-Estate and Energy Master Plan) method to identify the reference ESPS revealed several issues :
- Complexity: Taking into account outdated infrastructures and regulatory compliance has considerably slowed down the process of identifying ESPS.
- Excessive duration: The Energy Savings Potential Scope project took nine months to complete, illustrating the slowness of conventional approaches such as REMP.
To verify the effectiveness of PG2E, this study carried out in the municipality of Quesnoy-sur-Deûle was selected on the basis of several criteria :
- Accessibility of the energy data needed to apply the PG2E method.
- Diversity of energy-consuming units, enabling a representative analysis of the municipality's buildings.
- The local authority's interest in and commitment to improving its energy efficiency and ISO 50001.certification.
4.3.2. Data Preparation and Preliminary Analysis
Before applying the PG2E method, a preliminary data analysis is required to better characterize the building stock in the municipality of Quesnoy-sur-Deûle. The data studied include :
- Annual energy consumption in kWh of electricity (reference 2021).
- Total surface area of buildings (in m²).
- The state of disrepair of the infrastructure is assessed on a scale of 0 to 100. A score above 50 indicates significant disrepair, while a score above 70 suggests that intervention or replacement should be considered within 2 to 3 years.
- The regulatory compliance of buildings is rated on a scale of 0 to 1. The closer the rating is to 1, the higher the level of non-compliance with regulatory requirements.
This preliminary analysis is essential for identifying the heterogeneities that influence energy consumption and optimization potential. By highlighting buildings requiring priority action, it improves the relevance of the criteria used by PG2E, notably average energy consumption and quartile 75.
The main aim of this stage is to provide an in-depth understanding of trends and disparities within the building stock, in order to better interpret the results obtained by the PG2E method. By validating methodological choices, this analysis ensures that PG2E's combinatorial approach is adapted to the specific features of the buildings studied.
Table 6 shows data on the annual energy consumption, obsolescence and regulatory status of buildings in the municipality of Quesnoy-sur-Deûle. These data will serve as a basis for evaluating the effective application of the PG2E method and comparing the results obtained with those of traditional approaches.
Data on the obsolescence (rated out of 100) and regulatory status (rated out of 1) of buildings have exceptionally been integrated into the table structure for a correlation assessment of the alternative criteria of average consumption and quartile 75 of eligible ESPS, thus enabling us to identify the certification scope (CS) dedicated to the Energy Management System (EMS).
A preliminary analysis has been carried out on the annual consumption, surface area, obsolescence and regulatory compliance of buildings in the municipality of QSD (Figure 17).
The graphs in Figure 17 show the distribution of normalized values for four variables relating to buildings in the town of Quesnoy Sur Deûle (QSD) : annual energy consumption, total surface area, dilapidated condition and regulatory status. Overall, we observe the following analysis :
- The graph shows that energy consumption (red curve) and building surface area (blue curve) have different distributions, with notable deviations, suggesting that energy consumption could be influenced by factors other than simple building size, such as obsolescence or regulatory status.
- Obsolescence (orange curve) and regulatory status (green curve) appear to play an important role in the variability of energy data, with obsolescence particularly asymmetrical, indicating that a proportion of buildings are significantly older.
In conclusion, the distributions presented in the graphs (Figure 17) reveal significant variability in the characteristics (obsolescence and regulatory compliance) of the buildings analyzed, highlighting the need for a differentiated approach to optimizing energy consumption management. Larger, older buildings could benefit from targeted interventions to improve their energy efficiency. Hence the importance of quickly identifying them using a combinatorial approach based on a simple, effective methodology.
4.3.3. Results Obtained with REMP Scenarios
In our case study, the commune of Quesnoy-sur-Deûle (QSD) identified 3 reference ESPS through their REMP system according to political mandates. These reference ESPS, identified after 9 months of activity, are :
- P05 Réf . = {CD09, CD08, CD04, CD17, CD16}: a reference scope of 5 energy-consuming units.
- P08 Ref. = {CD09, CD08, CD04, CD17, CD16, CD06, CD11, CD14}: a reference scope of 8 energy-consuming units.
- P10 Réf . = {CD09, CD08, CD04, CD17, CD16, CD06, CD11, CD14, CD07, CD18}: a reference scope of 10 energy-consuming units.
Our job is to identify the best ESPS, which could correspond to the different reference ESPS, using the innovative PG2E solution of the new method.
4.3.4. Description of the Execution Scheme and Result of PG2E
As a reminder, the PG2E solution is based on a combinatorial methodology that enables the efficient identification of the Certification Scope (CS) for the Energy Management System (EMS) according to the ISO 50001 standard. It takes as input the consumption data for energy-intensive units, their characteristics (total surface area, obsolescence, regulatory compliance) and several dynamic parameters: name of local authority, reference year, 65% minimum consumption threshold and choice of substitute criteria (average consumption or 75 quartile). By following the five methodological steps, PG2E produces an optimized certification scope (CS) with a summary report presenting the criteria used, the results obtained and a list of relevant ESPS for informed decision-making. Figure 18 illustrates this flow chart.
The application of the PG2E tool identifies 6,623 potential ESPS candidates for the certification scope (CS). Using the average consumption criterion, PG2E identifies the CS among the eligible ESPS (Table 7) :
Pconso-m = {CD09, CD11, CD16, CD17, CD18}.
Table 7.
Detailed CS results identified by the PG2E solution.
| Certification Scope (CS) details | ||||
|---|---|---|---|---|
| Building Code | Annual Consumption (kWh) | Old | Condition Regulatory | Comments |
| CD09 | 85 228 | 56,30 | 0,29 | Presence of ageing. Savings potential |
| CD11 | 31 243 | 61,71 | 0,14 | Presence of agein. Savings potential |
| CD16 | 69 680 | 57,96 | 0,14 | Presence of ageing. Savings potential |
| CD17 | 76 966 | 57,50 | 0,14 | Presence of ageing. Savings potential |
| CD18 | 35 575 | 74,21 | 0,14 | High age and potential. Change in 2 to 3 years |
Table 7 details the certification perimeter identified by the PG2E solution, which will then be compared with the municipality's reference perimeters in the "Benchmarking results" section of the article.
These five buildings have the highest energy consumption of the 15 units studied, which justifies their being seen as priorities in terms of optimization potential. All buildings are over 50 years old, which means they are obsolete and potentially a source of energy loss. CD18 (74.21) exceeds the critical threshold of 70, suggesting that it requires improvement within 2 to 3 years, indicating a high potential for savings. The poor regulatory status of CD09 (0.29) is another signal. The combination of high consumption and average to high obsolescence confirms that these buildings are not only energy-hungry, but also candidates for corrective action.
The PG2E solution does more than simply classify buildings according to their absolute energy consumption. It applies a combinatorial optimization logic based on proxy criteria - average consumption and upper quartile (Q3) - which have shown a strong negative correlation with obsolescence and regulatory status (values between -0.55 and -0.81 with p-values < 0.05). These correlations justify their use as indirect indicators of energy-saving potential.
Figure 19 provides a summary of the parameters used to obtain certain results, as well as the ISO 50001-compliant certification Scope (CS), generated as a report by the PG2E solution. This report also includes, in Figure 20, a list of the top 10 relevant ESPS, made available to decision-makers for analysis and orientation of the energy policy of the municipality of Quesnoy-Sur-Deûle.
The scope of certification (CS) of the SME according to ISO 50001 remains identical, whether the criterion of average consumption is used or that of the upper quartile, which is as follows :
Quartile 75 consumption Pqrt-75 = {CD09, CD11, CD16, CD17, CD18}.
5. Results of the Comparative Study of ESPSReference and ESPSPg2e
5.1. Scenario 10: The First 10 Energy-Generating Units
With a reference perimeter of 10 energy-intensive units identified by the town of Quesnoy sur Deûle, we observed a 100 % correspondence rate (Table 8) with the "PG2E" tool according to the criteria of average and upper quartile energy consumption for the scope identified by the solution.
5.2. Scenario 08: The First 8 Energy-Generating Units
With a reference perimeter of 8 energy-intensive units identified by the town of Quesnoy sur Deûle, we observed a correspondence rate of 83 % (Table 9 with the "PG2E" tool according to the criteria of average and upper quartile energy consumption of the perimeter identified by the solution.
5.3. Scenario 05: The First 5 Energy-Generating Units
With a reference scope of 5 energy-intensive units identified by the town of Quesnoy sur Deûle, we observed a correspondence rate of 60 % (Table 10) with the "PG2E" tool according to the criteria of average and upper quartile energy consumption of the perimeter identified by the solution.
It is important to emphasize that all the scenarios were carried out in just half a day to identify the Certification Perimeters compliant with the ISO 50001 standard, thanks to the use of the innovative PG2E solution. This rapid completion was made possible by the prior collection of data and the identification of the reference Certification Perimeters associated with each scenario.
The results obtained from this comparative study confirm that the PG2E method offers accuracy comparable to traditional methods, while significantly reducing the time and resources required.
6. Discussions
6.1. Observations and Analysis of the Case Study
In this case study, the innovative PG2E solution was applied to the commune of Quesnoy-sur-Deûle to assess its effectiveness in identifying Energy Savings Potential Scope (ESPS). The methodology is based on a combinatorial approach to building ESPS, using a threshold of 65% of total ESPS consumption to select eligible ESPS, and then using average consumption and upper quartile as priority criteria to identify the relevant ESPS or certification scope (CS).
The results were analyzed across three scenarios, comparing the ESPS identified by PG2E with the reference ESPS established by the municipality. For a large scope (Scenario 10) the reference ESPS captured 100% of the ESPS units identified by the PG2E solution, thus validating the relevance of the criteria used. For an intermediate scope (Scenario 08), the match rate was 83%, demonstrating a high degree of compatibility between the units selected by PG2E and those of the reference ESPS. On the other hand, for a more restricted scope (Scenario 05), the match rate drops to 60%, revealing the limits of the solution when the perimeter becomes more selective. These results show that PG2E is particularly effective in identifying ESPS with extended configurations. However, adjustments to the criteria could be considered to improve matching in smaller perimeters. The 65% threshold recommended by ISO 50001 proved to be relevant for large scope, but could be modulated according to the diversity of infrastructures. What's more, the average consumption and upper quartile criteria proved robust enough to effectively prioritize energy-intensive scope, including those comprising low-consumption units that are potentially outdated or not compliant with regulations. PG2E therefore appears to be a suitable solution for local authorities wishing to quickly identify relevant ESPS, while offering scope for improvement to adapt to more specific configurations.
6.2. Evaluation the Innovative PG2E Solution
Analysis of the PG2E solution highlights several key advantages, including its simplicity and accessibility, enabling rapid, automated identification of Energy Savings Potential Scopes (ESPS) without requiring significant human or financial resources. Unlike traditional methods based on complex technical audits, PG2E offers a streamlined approach tailored to Small and Medium Municipalities (SMM). One of its major advantages is the significant time saving, estimated at over 95% (Appendix A) compared with conventional methods, a budget saving of up to 80% (Appendix B), and the reduction in resources mobilized, with simulations taking just a few seconds compared with several months for conventional methods such as REMP (Appendix C), facilitating proactive decision-making and reducing the cost of energy diagnostics. What's more, its flexibility and adaptability mean that the perimeters identified can be adjusted according to local priorities, thanks to the introduction of dynamic thresholds, making PG2E scalable even for restricted scope.
However, certain limitations were identified, notably its dependence on data quality, as an incomplete or inconsistent database could affect the accuracy of results. Furthermore, while PG2E is well suited to SMM, its application in larger communities with more complex infrastructures would require methodological adjustments to incorporate a more detailed analysis of interactions between infrastructures. Another point to note is the absence of exhaustive technical assessments, since PG2E does not take into account elements such as infrastructure ageing, regulatory status or maintenance needs, which may limit its scope in certain situations even if it uses substitute criteria.
Table 11 summarizes a comparison between existing systems and the PG2E system.
7. Conclusion and Outlook
Small and Medium Municipalities (SMMs) face a number of obstacles in identifying their energy-saving potential, confronted as they are with conventional methods that are time-consuming (between 3 and 18 months), costly and often ill-suited to their specific needs.
The work presented in this article highlights the limitations of current approaches for efficiently identifying energy savings potential scope (ESPS). Faced with this observation, the PG2E solution is positioned as an innovative, rapid and easily deployable digital alternative, designed to meet the constraints of SMM.
Tests carried out on data from the commune of Quesnoy-sur-Deûle confirm the performance of PG2E: success rates of 60% to 100% are achieved depending on the perimeters analyzed, with time savings of over 95% and an estimated reduction in diagnostic costs of up to 80%.
Unlike a simple prioritization of consumption, PG2E is based on an optimized combinatorial approach incorporating substitute criteria - average consumption and upper quartile (Q3) - which are strongly correlated with indicators of obsolescence and regulatory status (with negative coefficients between -0.55 and -0.81 and significant p-values). This enables it to identify not only energy-hungry units, but also those with high energy-saving potential.
Finally, the integration of additional variables and validation in other territories would consolidate PG2E's effectiveness and extend its use to a wider range of communities committed to the energy transition.
Funding
This research received no external funding. And The APC is funded by Safir Consulting Paris.
CRediT Authorship Contribution Statement
Ebagninin Séraphin Kouaho: Conceptualization, Methodology, Software, Validation, Formal analysis, Investigation, Data Curation, Writing - Original Draft, Writing - Review & Editing, Visualization. Yao N’guessan: Writing - Review & Editing, Visualization, Supervision, Project administration. Christophe Marvillet: Writing - Review & Editing, Visualization, Supervision, Project administration.
Declaration of competing interest
The authors declare that they have no known competing financial interests or personal relationships that could have appeared to influence the work reported in this paper.
Abbreviations
The following abbreviations are used in this manuscript:
| ADEME : | Agence De l'Environnement et de la Maîtrise de l'Energie.(French Environment and Energy Management Agency). |
| Cit'ergie : | A management and certification program that rewards local authorities for implementing an ambitious climate-air-energy policy. |
| CS : | Certification Scope |
| EIS : | Energy Information System |
| EMS : | Energy Management System |
| ESPS : | Energy Savings Potential Scope |
| EU : | European Union |
| GHG : | Green House Gas |
| IPCC : | Intergovernmental Panel on Climate Change |
| ISO : | International Standards Organization |
| LMS : | Local Measurement System |
| OECD | Organization for Economic Co-operation and Development |
| PG2E : | It is an innovative solution software for identifying ESPA |
| PIP : | Pluriannual Investment Plan |
| QSD : | Quesnoy-Sur-Deûle |
| REMP : | Real-Estate and Energy Master Plan |
| SMM : | Small and Medium Municipalities |
| TCAEP: | Territorial Climate-Air-Energy Plan |
Appendix A. Estimated Time Savings
Scientific justification for time savings
Time saving calculation method
Time savings are based on the formula :
Comparative data used
Table A1.
Calculation data for time reduction estimation.
| Method | Estimated Duration | Source or Reference |
|---|---|---|
| Existing methods | 3 to 18 months (≈ 90 to 540 days) | ADEME - Rouen 2020 conference feedback (survey). |
| REMPmethod used at QSD | 9 months (≈270 days) | ESPS identification project in Quesnoy-sur-Deûle (QSD). |
| PG2E Solution | Less than half a day ≈ 4 hours (≈ 0,17 days) | QSD experimentation + PG2E practical tests. |
Calculation example (moderate case)
Assuming an average REMP diagnosis of 90 days (≈ 3 months)
In the shortest scenario (30 days) :
So to say that PG2E delivers time savings of over 95% is scientifically well-founded.
Conclusion
These justifications are empirical, but based on field practices and reasonable numerical comparisons.
Appendix B. Estimated Cost Savings:
Scientific justification for cost savings
Method for calculating budget savings
The cost reduction is based on the formula :
Estimated comparative data used
Calculation data for estimating cost savings.
Table A2.
Calculation data for cost reduction estimates.
| Expense Item | REMP Classic (€/ESPS) | PG2E (€/ESPS) | Detail |
|---|---|---|---|
| Initial diagnosis + audit | 10.000 à 25.000 € | 0 € (if internal) or < 1 000 € | External audit versus automatic analysis |
| Engineering time (man.days) | 10 à 30 days (~6 000 – 15 000 €) | < 1 days (~300 à 420 €) | Salaries / day energy engineer at QSD (420 €) |
| Data processing / Excel | Long, manual | Automated | Indirect costs |
| Estimated total | ~15 000 € (low range) | ~3000 to 4 200 € max (including development / training) |
Example of calculation with QSD cost 3000 € min to 4 200 € max
Savings can even exceed 72% to 80% if the PG2E tool is reused in several communities or over several years.
Conclusion
These justifications are empirical, but based on field practices and reasonable numerical comparisons.
Appendix C. Assessment of PG2E's Comparative Benefits
Table A3.
REMP and PG2E comparative evaluation criteria.
| Evaluation Criteria | Classic Methods (ex. REMP) | PG2E Solution | Estimated Profits |
|---|---|---|---|
| Processing time | 3 to 18 months (≈ 90 to 540 days) | Less than half a day (≈ 4 h) |
 Time savings > 95 % Time savings > 95 % |
| Execution time (calculation) | Several hours to days (manual Excel) | Few seconds | ⚡ Near-instant execution |
| Engineering mobilization | High (audit, technical expertise) | None required | 👷 100% local autonomy |
| Estimated cost per ESPS | 15 000 à 25 000 € | < €3,000 - €4,200 (depending on local adaptation) | 💰 70% to 80% savings |
| Reproducibility / Transferability | Low (depends on context and experts) | High (based on energy data) | 🔄 Standardized model |
| Observed match rate | - | 60% to 100% (depending on scenario) | ✅ Validated by case studies |
| Accessibility for SMM | Limited (cost, complexity) | High (simple, fast, economical) | 🏛 Adapted to local realities |
Note: The data in this table is based on experiments carried out in the commune of Quesnoy-sur-Deûle, feedback from the field and a comparative analysis between the REMP and PG2E approaches.
References
- L. Dr Hoesung et B. Dr Fatih, « Energy is at the heart of the solution to the climate challenge — IPCC », IPCC-Energy is at the heart of the solution to the climate challenge. Consulté le: 20 juillet 2024. [En ligne]. Disponible sur: https://www.ipcc.ch/2020/07/31/energy-climatechallenge/.
- GIEC, « Sixième rapport du GIEC sur le climat : le seuil des +1.5°C sera atteint en 2030, soit dix ans plus tôt qu’estimé auparavant », RTBF. Consulté le: 18 janvier 2025. [En ligne]. Disponible sur: https://www.rtbf.be/article/sixieme-rapport-du-giec-sur-le-climat-le-seuil-des-1-5-c-sera-atteint-en-2030-soit-dix-ans-plus-tot-qu-estime-auparavant-10820767.
- J. Rockström, O. Gaffney, J. Rogelj, M. Meinshausen, N. Nakicenovic, et H. J. Schellnhuber, « A roadmap for rapid decarbonization », Science, mars 2017. [CrossRef]
- IEA, « Net Zero by 2050 - A Roadmap for the Global Energy Sector », IEA Publications, p. 224, oct. 2021.
- A. Grubler et al., « A low energy demand scenario for meeting the 1.5 °C target and sustainable development goals without negative emission technologies », Nat Energy, vol. 3, no 6, p. 515-527, juin 2018. [CrossRef]
- U. N. Environment, « Emissions Gap Report 2019 U. N. » Consulté le: 18 janvier 2025. [En ligne]. Disponible sur: https://www.unep.org/resources/emissions-gap-report-2019.
- L. Pérez-Lombard, J. Ortiz, et C. Pout, « A review on buildings energy consumption information », Energy and Buildings, vol. 40, no 3, p. 394-398, janv. 2008. [CrossRef]
- L. Zhou, J. Li, F. Li, Q. Meng, J. Li, et X. Xu, « Energy consumption model and energy efficiency of machine tools: a comprehensive literature review », Journal of Cleaner Production, vol. 112, p. 3721-3734, janv. 2016. [CrossRef]
- X. Zhou, F. Liu, et W. Cai, « An energy-consumption model for establishing energy-consumption allowance of a workpiece in a machining system », Journal of Cleaner Production, vol. 135, p. 1580-1590, nov. 2016. [CrossRef]
- P. Bertoldi, B. Atanasiu, et European Commission, Éd., Electricity consumption and efficiency trends in the enlarged European Union: status report 2006. Luxembourg: Publications Office, 2007.
- Intergovernmental Panel on Climate Change, Éd., « Residential and commercial buildings », in Climate Change 2007 - Mitigation of Climate Change: Working Group III contribution to the Fourth Assessment Report of the IPCC, Cambridge: Cambridge University Press, 2007, p. 387-446. [CrossRef]
- K. Gillingham, R. G. Newell, et K. Palmer, « Energy Efficiency Economics and Policy », Annual Review of Resource Economics, vol. 1, no Volume 1, 2009, p. 597-620, juill. 2009. [CrossRef]
- E. Sardianou, « Estimating energy conservation patterns of Greek households », Energy Policy, vol. 35, no 7, p. 3778-3791, juill. 2007. [CrossRef]
- E. Vine, G. Kats, J. Sathaye, et H. Joshi, « International greenhouse gas trading programs: a discussion of measurement and accounting issues », Energy Policy, févr. 2003.
- H. Geller, P. Harrington, A. H. Rosenfeld, S. Tanishima, et F. Unander, « Polices for increasing energy efficiency: Thirty years of experience in OECD countries », Energy Policy, vol. 34, no 5, p. 556-573, mars 2006. [CrossRef]
- M. Kavgic, A. Mavrogianni, D. Mumovic, A. Summerfield, Z. Stevanovic, et M. Djurovic-Petrovic, « A review of bottom-up building stock models for energy consumption in the residential sector », Building and Environment, vol. 45, no 7, p. 1683-1697, juill. 2010. [CrossRef]
- A. B. Jaffe et R. N. Stavins, « The energy-efficiency gap: What does it mean? », Energy Policy, oct. 1994. [CrossRef]
- C. C. Koopmans et D. W. te Velde, « Bridging the energy efficiency gap: using bottom-up information in a top-down energy demand model », Energy Economics, p. 19, janv. 2001. [CrossRef]
- M. Sharmina, C. Broussous, et C. Jover, « Counting good: quantifying the co-benefits of improved efficiency in buildings », in Act! Innovate! Deliver! Reducing energy demand sustainably, Kph Trycksaksbolaget AB, juin 2009, p. 185-195. Consulté le: 16 février 2025. [En ligne]. Disponible sur: https://research.manchester.ac.uk/en/publications/counting-good-quantifying-the-co-benefits-of-improved-efficiency-.
- Schneider Electric, « Des gisements d’économies d’énergie — Guide de l’Installation Electrique », Wiki Installation Electrique. Consulté le: 22 août 2024. [En ligne]. Disponible sur: https://fr.electrical-installation.org/frwiki/Des_gisements_d%E2%80%99%C3%A9conomies_d%E2%80%99%C3%A9nergie.
- Le Conseil économique social et environnemental, « Efficacité énergétique ; un gisement d’économies ; un objectif prioritaire », CESE. Consulté le: 22 août 2024. [En ligne]. Disponible sur: https://www.lecese.fr/travaux-publies/efficacite-energetique-un-gisement-deconomies-un-objectif-prioritaire.
- B. A. Khalil, « Méthodologie d’analyses énergétique et exergétique des procédés de transformation de produits dans l’industrie », Mines Paris Tech, Paris, 2008. [En ligne]. Disponible sur: https://pastel.hal.science/pastel-00005064/file/These_BAK.pdf.
- « Le schéma Directeur Immobilier et Energétique », Mairie de Lempdes. Consulté le: 27 août 2024. [En ligne]. Disponible sur: https://ville-lempdes.fr/le-schema-directeur-immobilier-et-energetique/.
- « >Le schéma directeur immobilier et énergétique : un outil indispensable à l’évaluation des responsabilités et à l’équilibre des finances des collectivités », La Lettre du Financier Territorial. Consulté le: 27 août 2024. [En ligne]. Disponible sur: http://www.financierterritorial.fr/article_le-schema-directeur-immobilier-et-energetique-un-outil-indispensable-a-l-evaluation-des-responsabilites-et-a-l-equilibre-des-finances-des-collectivites_679A50833471B2.html.
- ALTEREA Ingénierie, « Tout savoir sur le Schéma Directeur Energie ». Consulté le: 27 août 2024. [En ligne]. Disponible sur: https://www.alterea.fr/le-lab/tout-savoir-schema-directeur-energie.
- ATEE, « Guide des logiciels de gestion énergétique ». mars 2016. Consulté le: 21 août 2022. [En ligne]. Disponible sur: https://atee.fr/efficacite-energetique/maitrise-de-lenergie/mesurer-la-consommation-denergie-audits.
- marie.empson@fujielectric.fr, « Fiche IND-UT-134 : Votre Système de mesurage d’Indicateurs de Performance Énergétique financé grâce aux CEE », Fuji Electric. Consulté le: 30 août 2024. [En ligne]. Disponible sur: https://www.fujielectric.fr/blog/systeme-de-mesurage-indicateurs-de-performance-energetique-ipe/.
- P. Baron, « La data, un levier de performance énergétique pour les entreprises », L’ADN Data. Consulté le: 30 août 2024. [En ligne]. Disponible sur: https://data.ladn.eu/blog/tendances-com/data-levier-sobriete-energetique-entreprises/.
- L. Durdon, « Comment se déroule une étude énergétique ? », Deal Eco. Consulté le: 30 août 2024. [En ligne]. Disponible sur: https://deal-eco.fr/comment-se-deroule-une-etude-energetique/.
- « Analyse des données énergétiques », www.cognizant.com. Consulté le: 30 août 2024. [En ligne]. Disponible sur: https://www.cognizant.com/fr/fr/glossary/energy-data-analytics.
- T. d’Alincourt, « Les 3 méthodes pour identifier les économies d’énergie sur un parc de bâtiments », Deepki. Consulté le: 30 août 2024. [En ligne]. Disponible sur: https://www.deepki.com/fr/blog/3-methodes-identifier-economies-energie-parc-batiments/.
- « Les Indicateurs de Performance Énergétique (IPÉ) », Green systèmes - pilotage énergétique des bâtiments. Consulté le: 30 août 2024. [En ligne]. Disponible sur: https://www.greensystemes.com/actualites-du-monde-de-lenergie/les-indicateurs-de-performance-energetique/.
- F. Streiff et ADEME, « IND-UT-134_FC_Système de mesurage d’indicateurs de performance énergétique ». 28 août 2019. Consulté le: 30 août 2024. [En ligne]. Disponible sur: https://atee.fr/system/files/2020-01/IND-UT-134_FC_Syst%C3%A8me%20de%20mesurage%20d%27indicateurs%20de%20performance%20%C3%A9nerg%C3%A9tique.pdf.
- A. Razafinjatovo, « L’analyse des données pour faire des économies d’énergie », Ryax Technologies. Consulté le: 30 août 2024. [En ligne]. Disponible sur: https://ryax.tech/fr/lanalyse-des-donnees-pour-faire-des-economies-denergie/.
- KPMG ADVISORY, « Quels défis actuels et futurs pour les dirigeants RH des collectivités ? » novembre 2023. Consulté le: 31 août 2024. [En ligne]. Disponible sur: https://www.lagazettedescommunes.com/telechargements/2023/11/fr-kpmg-secteur-public-les-defis-et-chantiers-rh-des-collectivites-vus-par-60-dirigeants-territoriaux-novembre-2023-compressed-002.pdf.
- « Démarche Cit’ergie - Chatellerault - Liferay Default », Chatellerault. Consulté le: 31 août 2024. [En ligne]. Disponible sur: https://www.ville-chatellerault.fr/grands-projets/developpement-durable/demarche.
- DGALN, ANCT, et DGITM, « S’engager dans le programme de labellisation Climat-Air-Énergie Cit’ergie », Aides-territoires. Consulté le: 31 août 2024. [En ligne]. Disponible sur: https://aides-territoires.beta.gouv.fr/aides/a3ba-sengager-dans-le-programme-de-labellisation-c/.
- Acsio Energie, « Le système de mesurage d’indicateur de performance énergétique (IPE) », Calculcee. Consulté le: 1 septembre 2024. [En ligne]. Disponible sur: https://www.calculcee.fr/article/systeme-mesurage-IPE/.
- « 2006 - 2012 : De l’éco-citoyenneté à Cit’ergie », Ville de Malaunay. Consulté le: 1 septembre 2024. [En ligne]. Disponible sur: https://www.malaunay.fr/Malaunay-en-transition-s/Malaunay-en-transition-s-pourquoi-comment/2006-2012-De-l-eco-citoyennete-a-Cit-ergie.
- J.-N. Fauchille, « Spatial Justice as Pragmatic. An Experimental Approach to the Reorganisation of the Swiss Hospital Map. », Ecole Polytechnique Fédérale de Lausanne, Lausanne - Suisse, 2016. [CrossRef]
- ADEME, Guide pratique de la mise en place d’un système de management de l’énergie : Retour d’expérience des coopératives agricoles et agroalimentaires. 2016.
Figure 1.
Example of P5 energy saving potential scope with a set of 5 units.
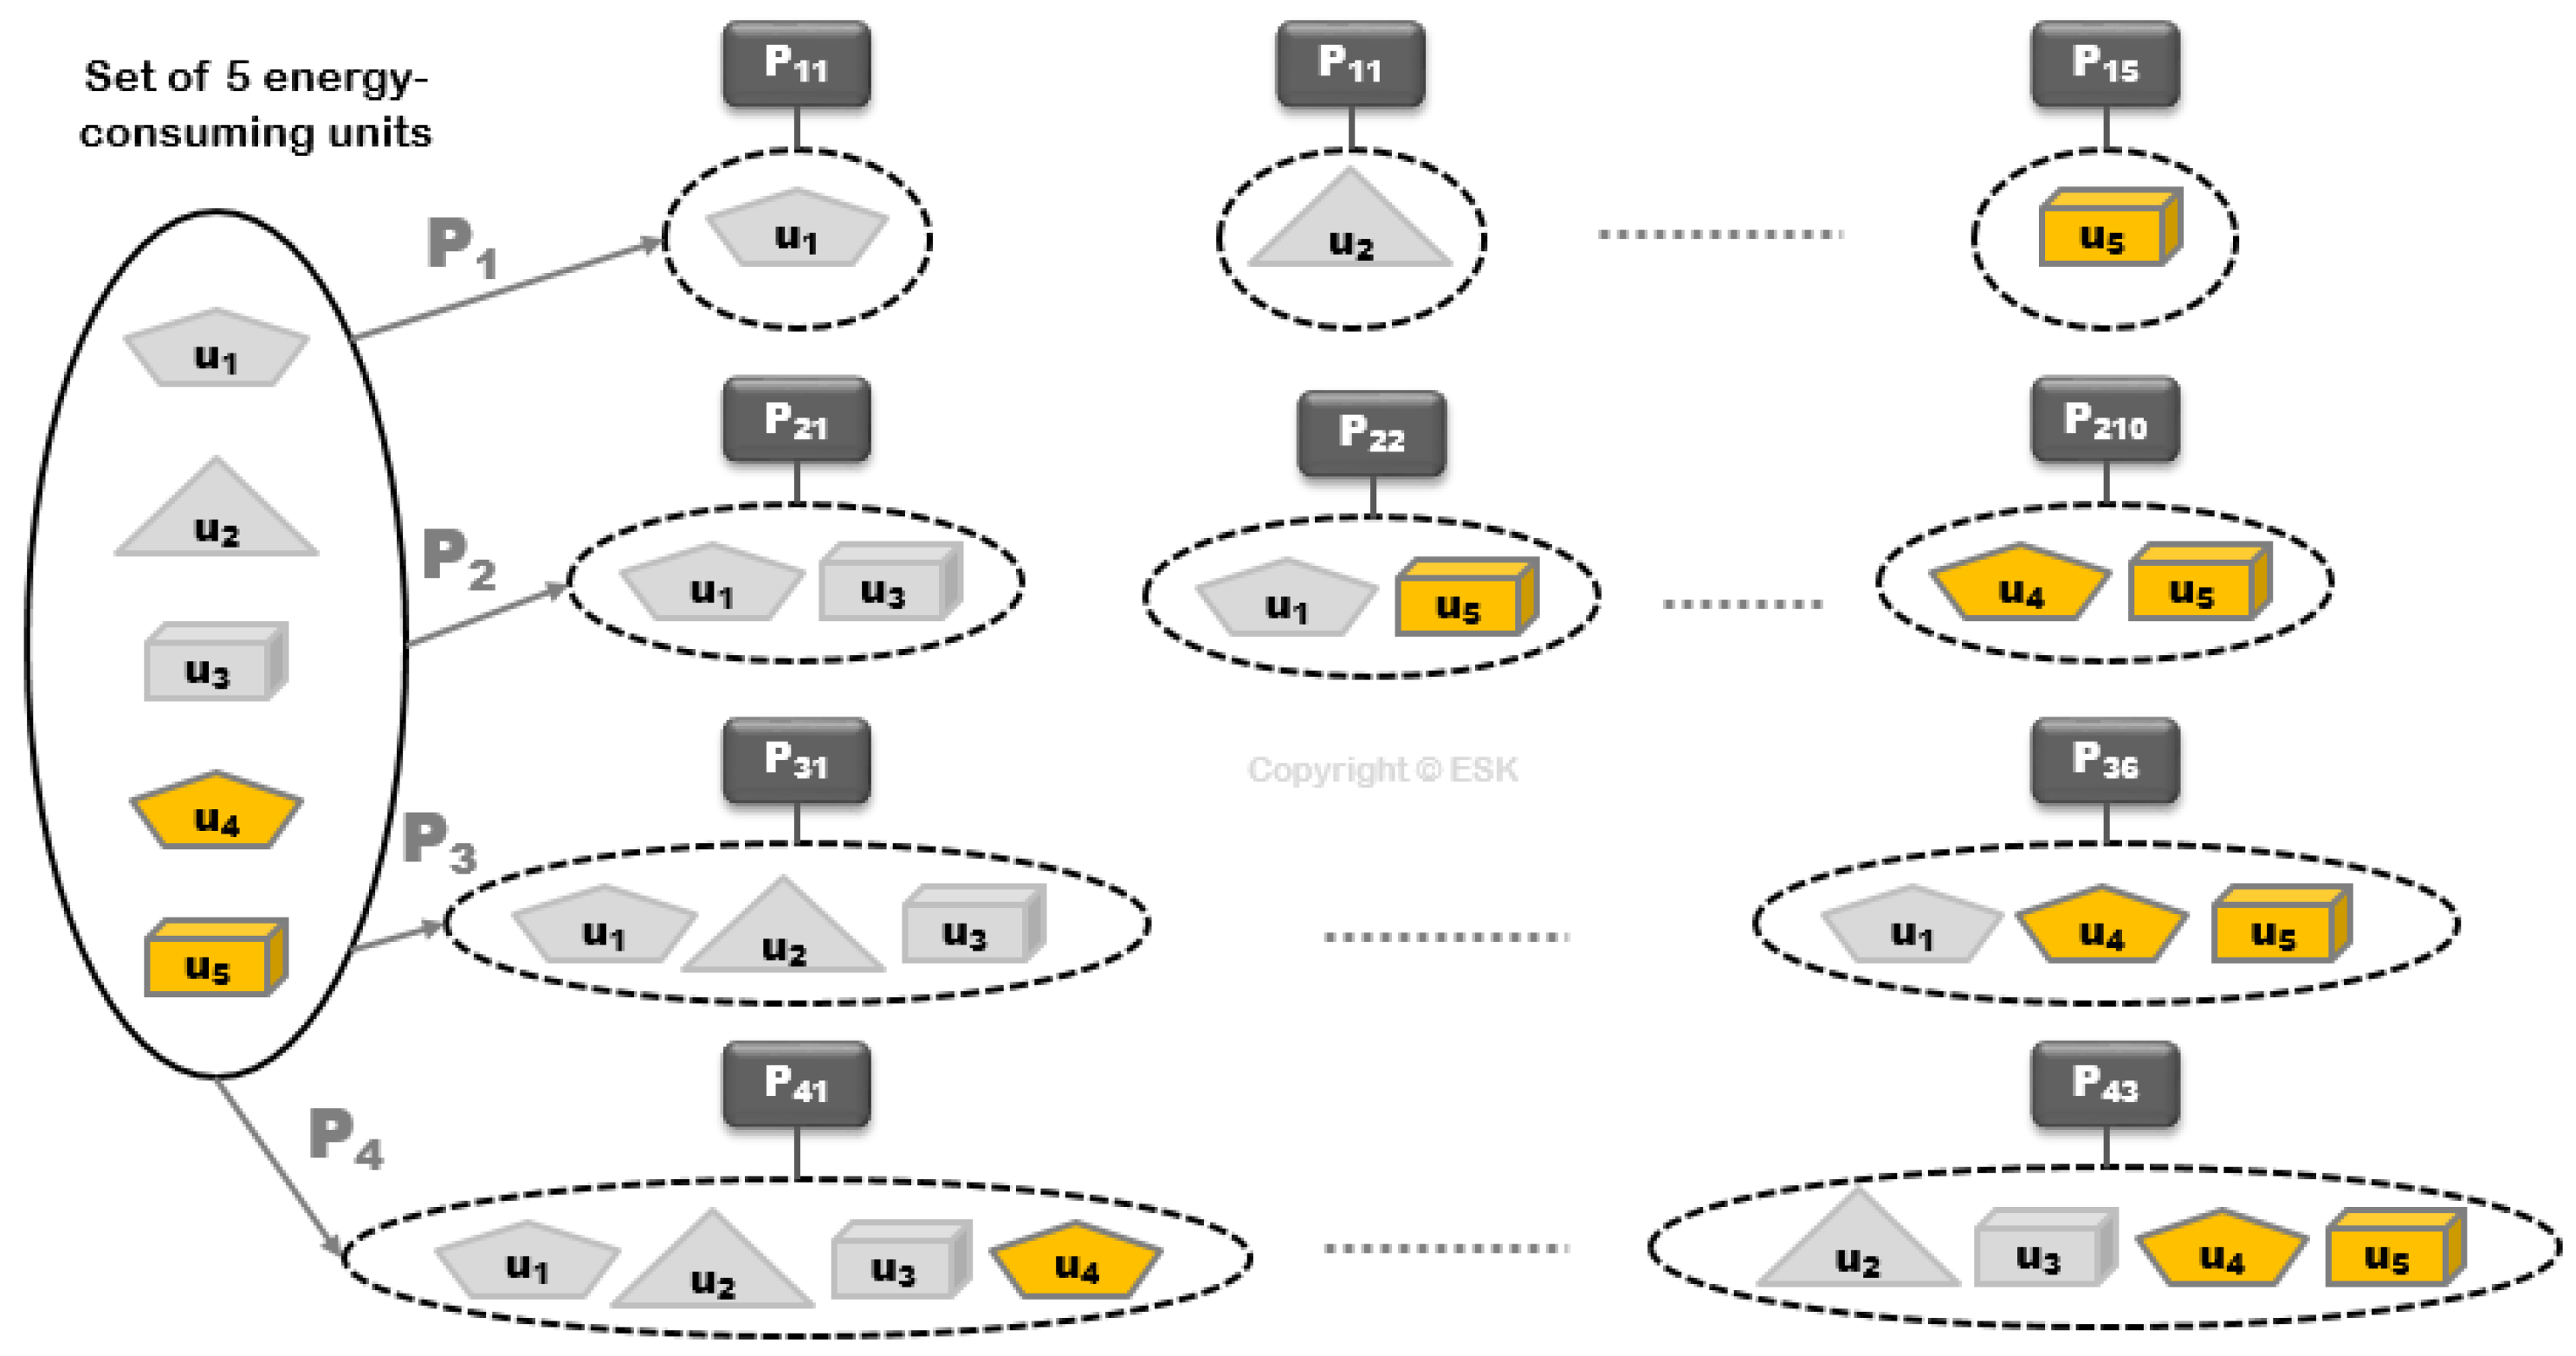
Figure 2.
Existing methods for collecting data and identifying ESPS.
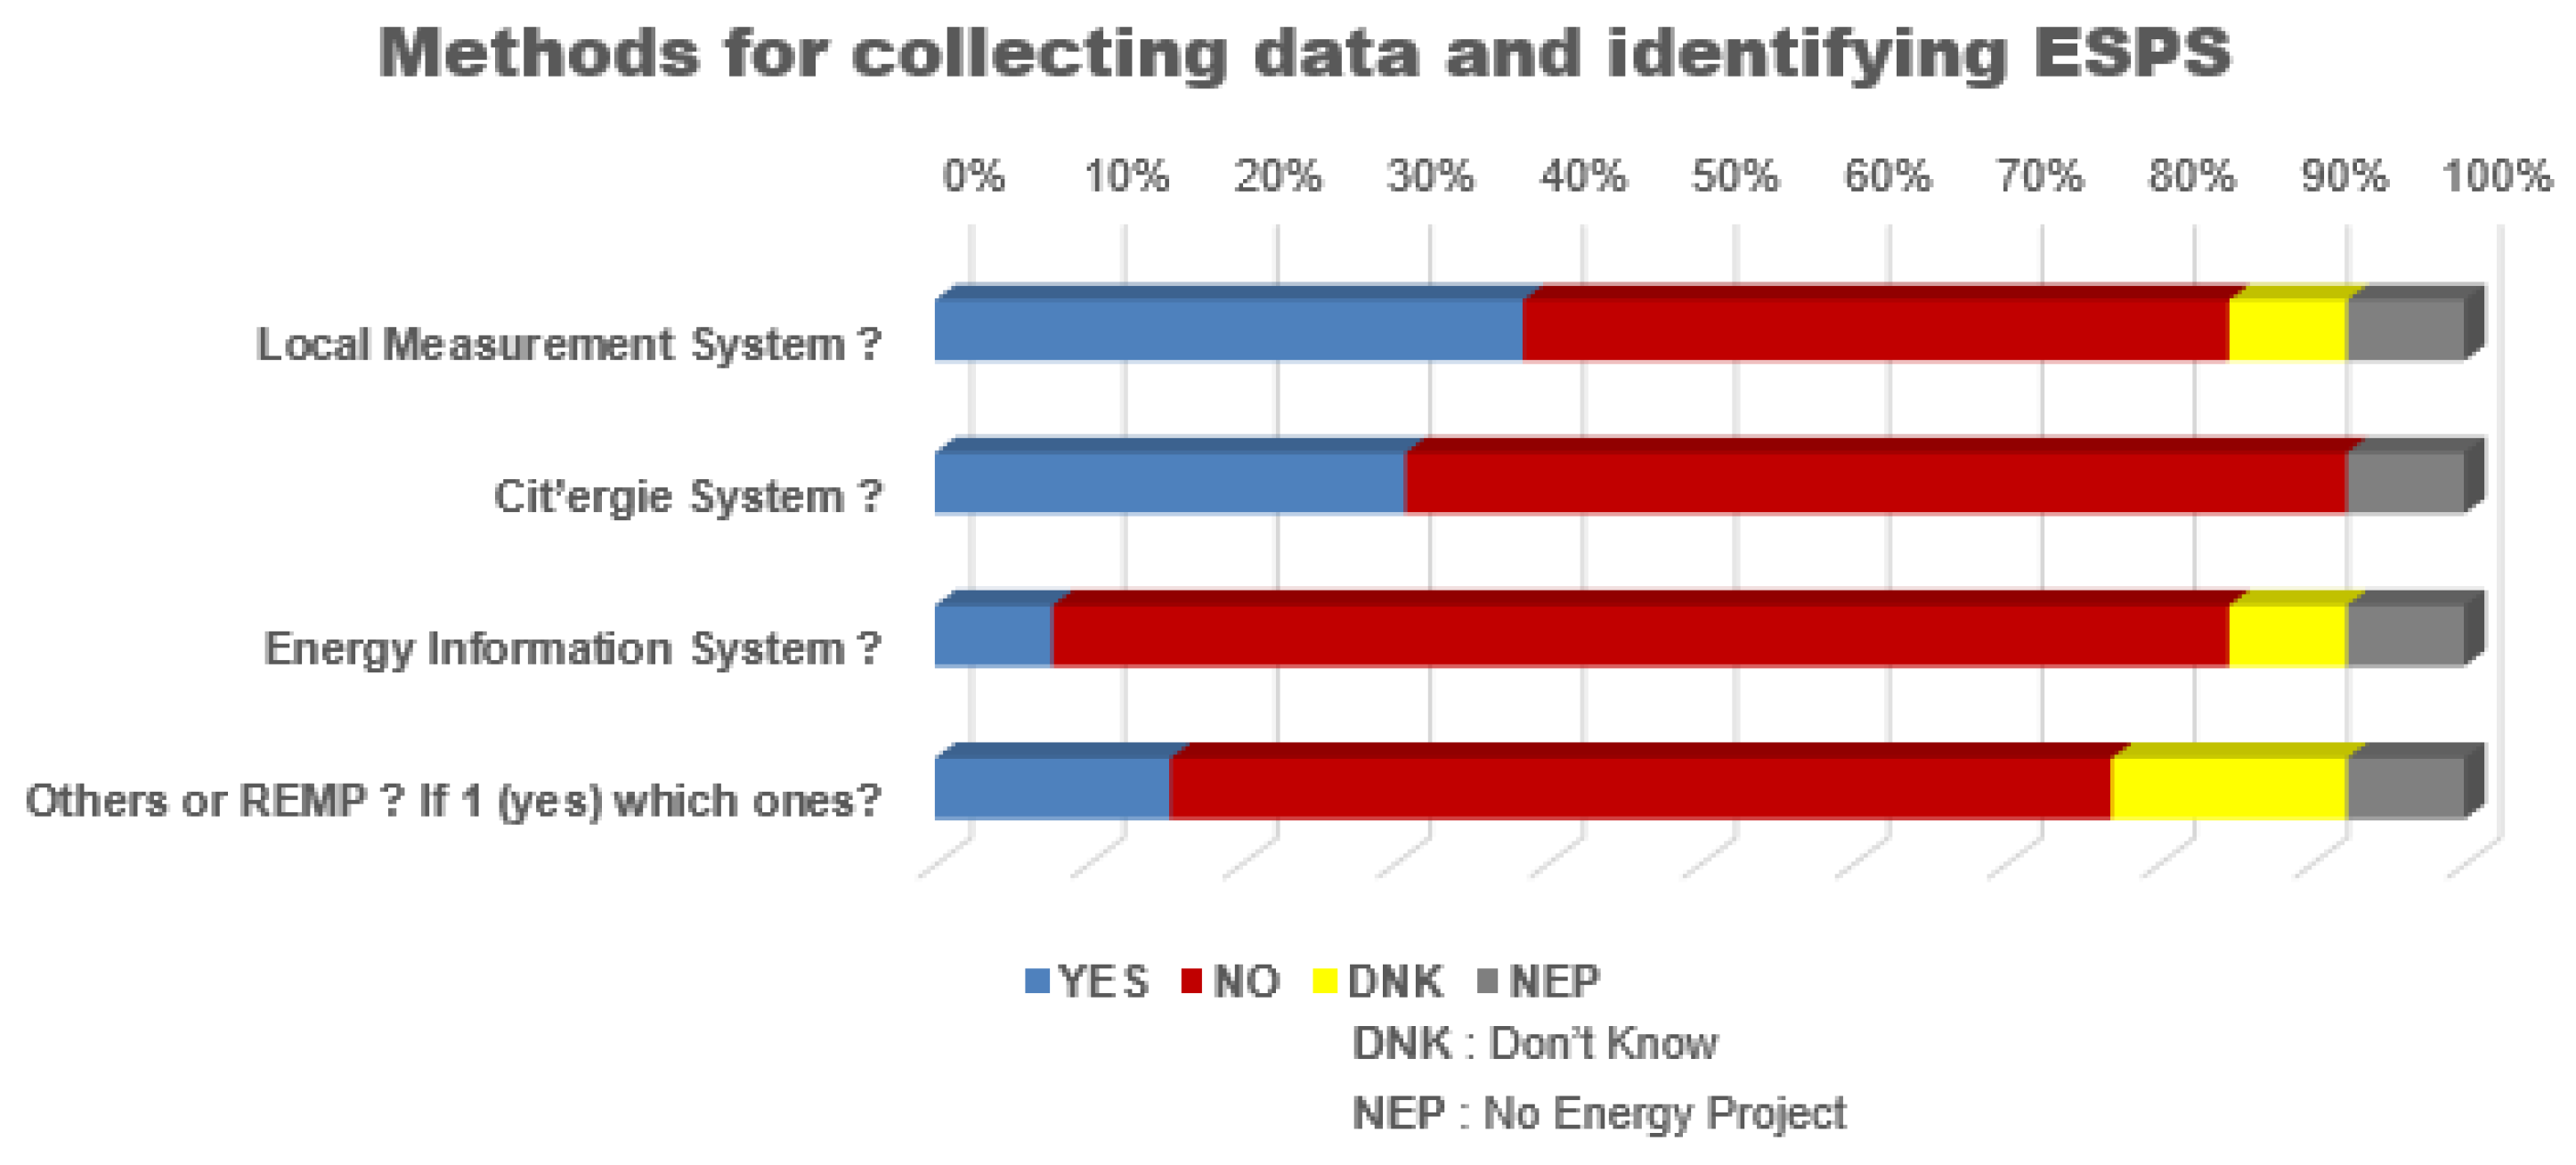
Figure 3.
Survey results on the criteria used by municipalities to identify the ESPS.
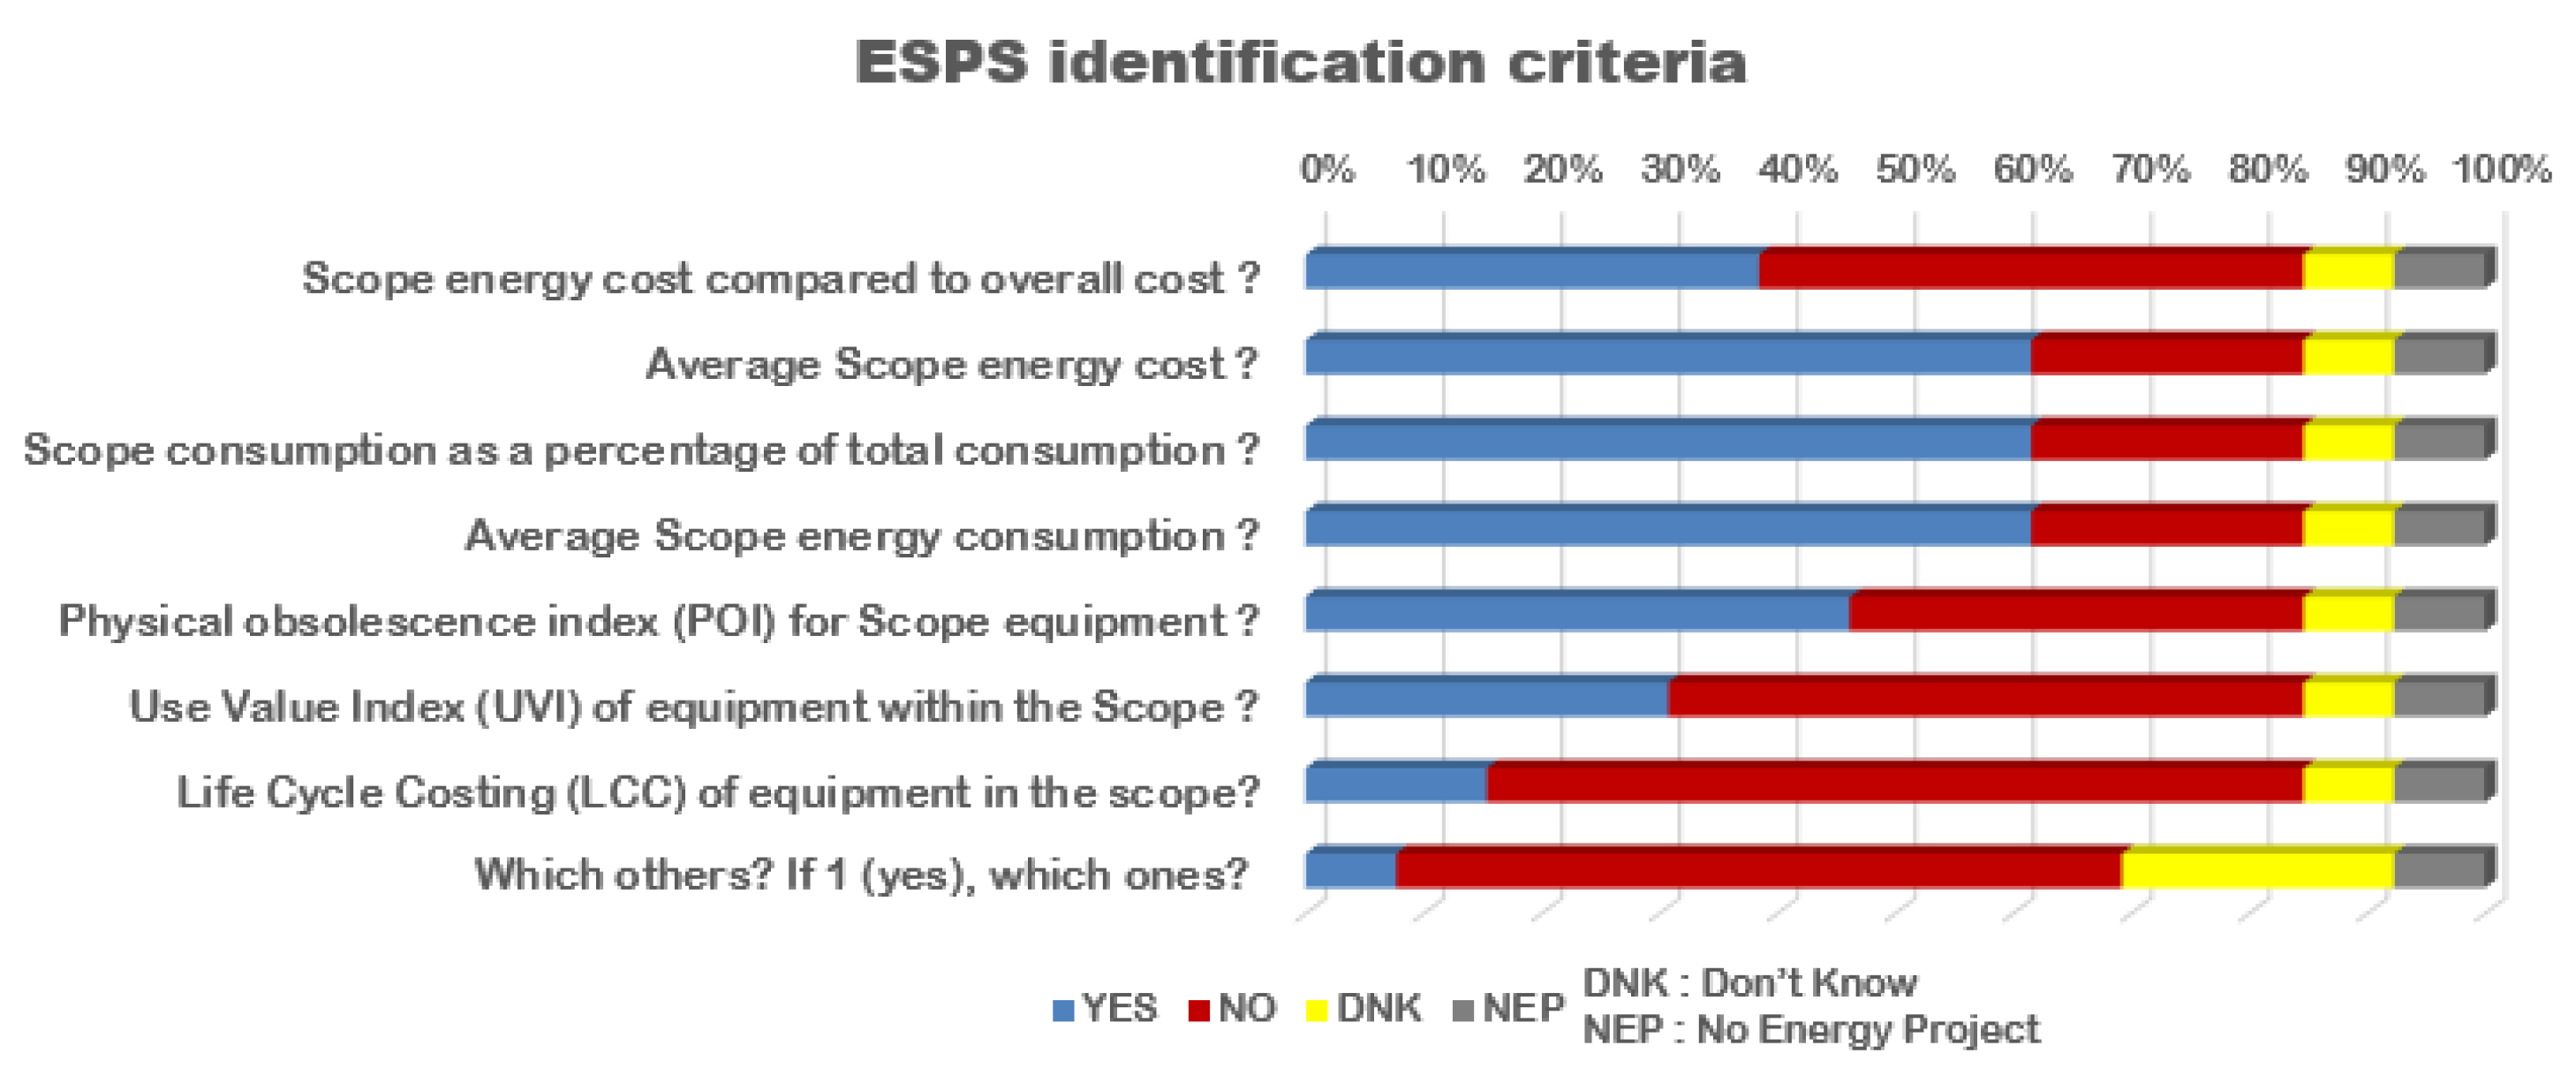
Figure 4.
Classic methods of the ESPS identification process.
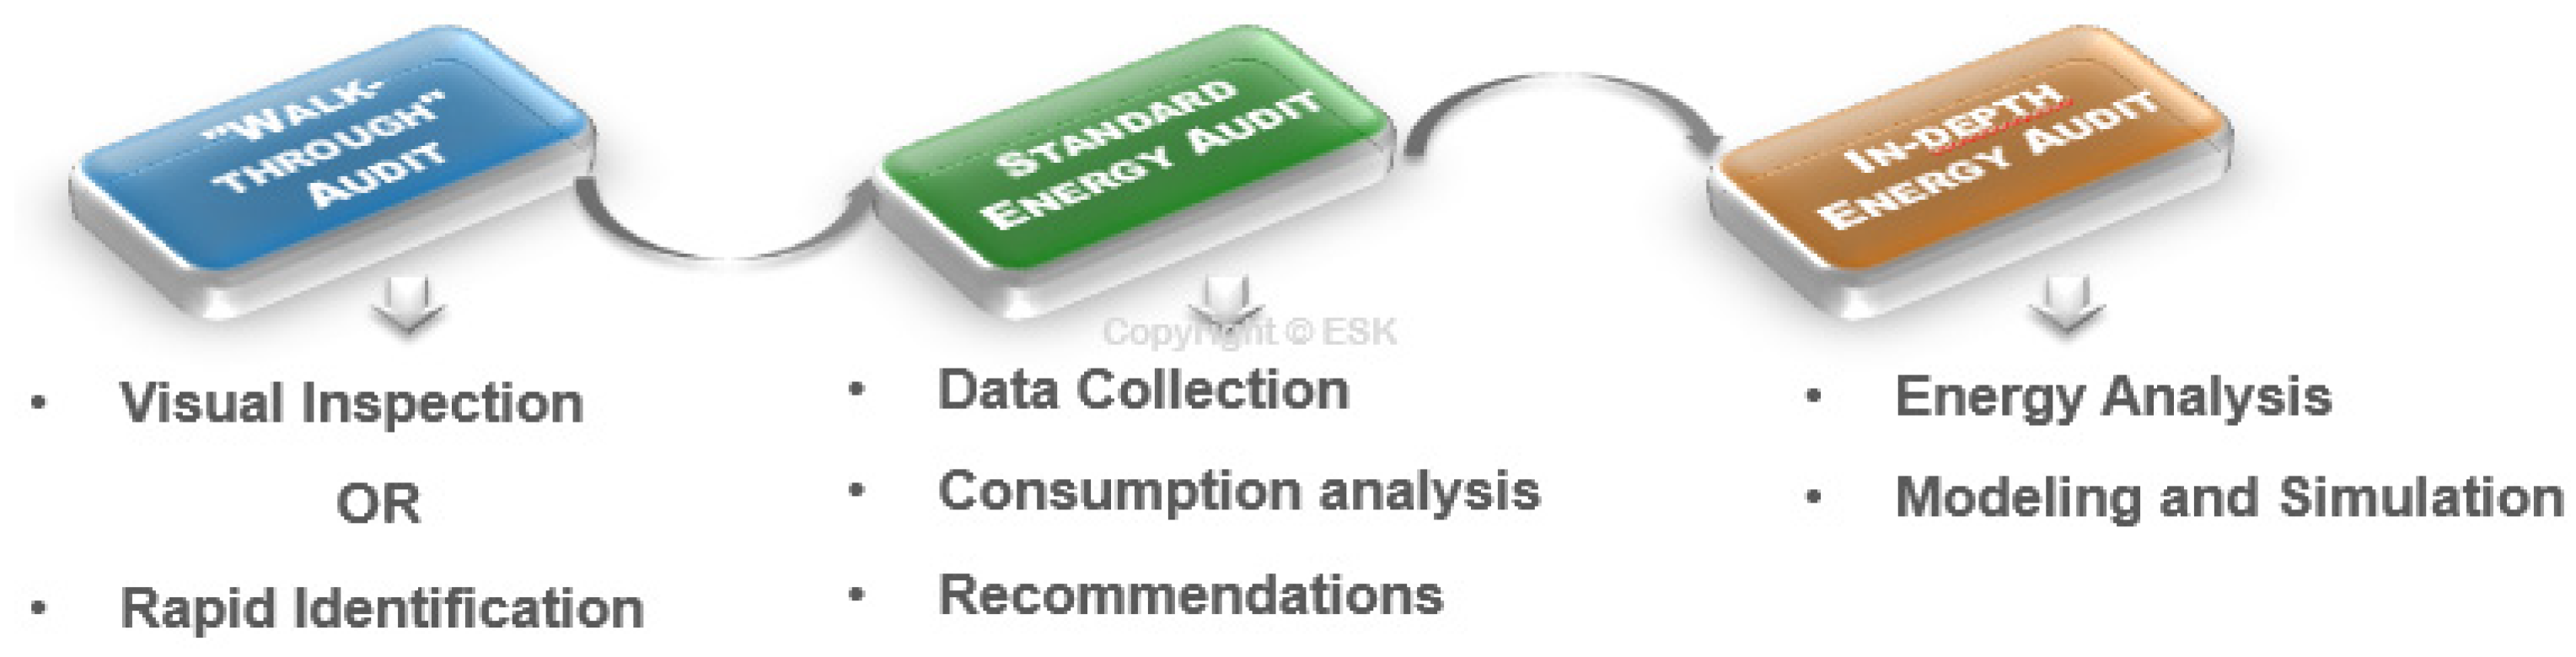
Figure 5.
Steps in the REMP structured methodology.

Figure 6.
The 3 building blocks of a local measurement system in detail.
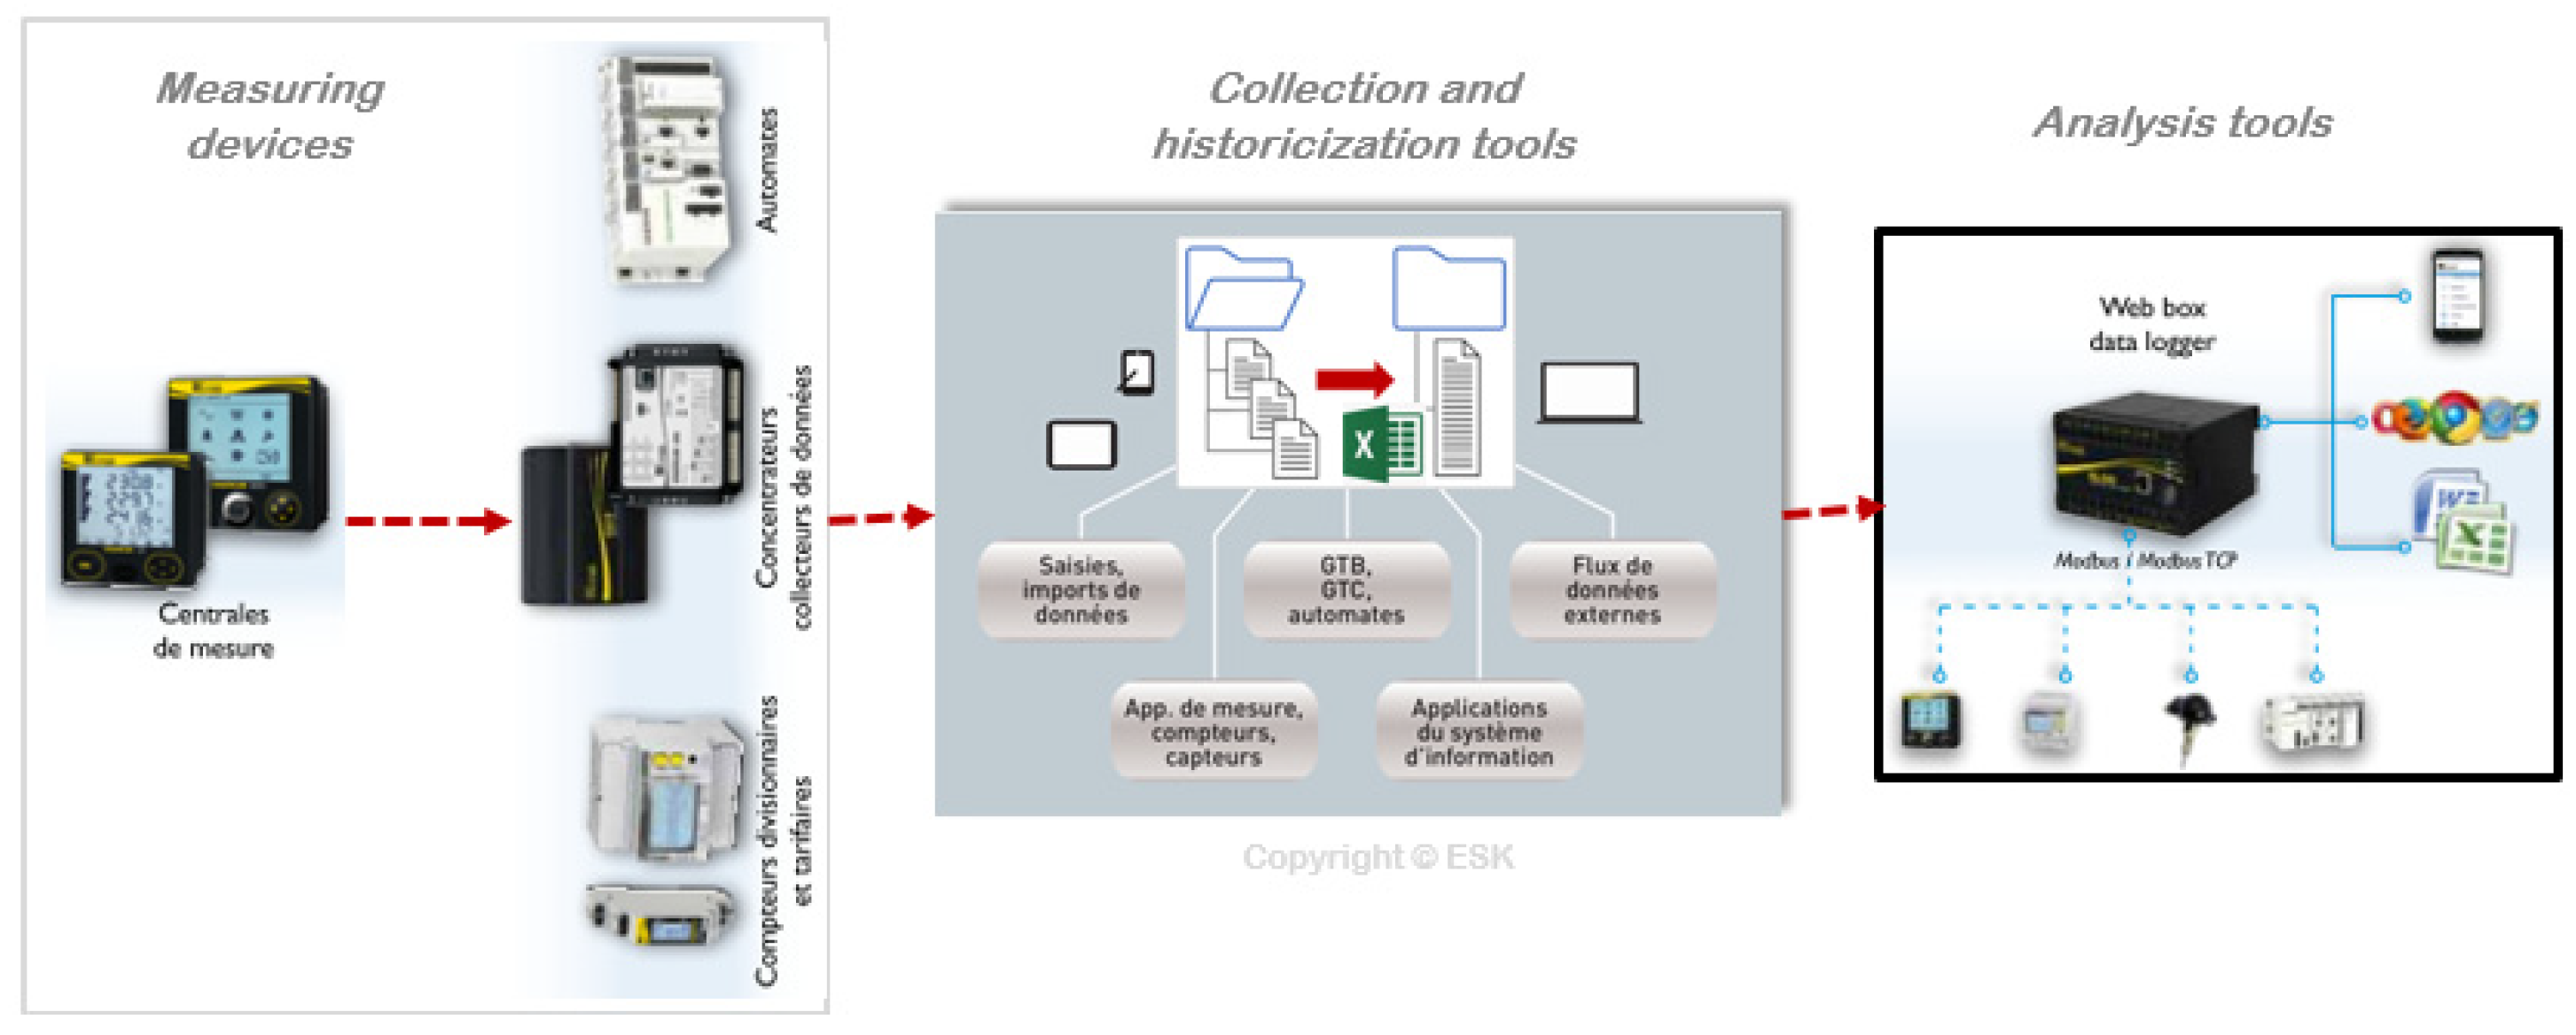
Figure 7.
Process for identifying energy savings using the Local Measurement System (LMS).
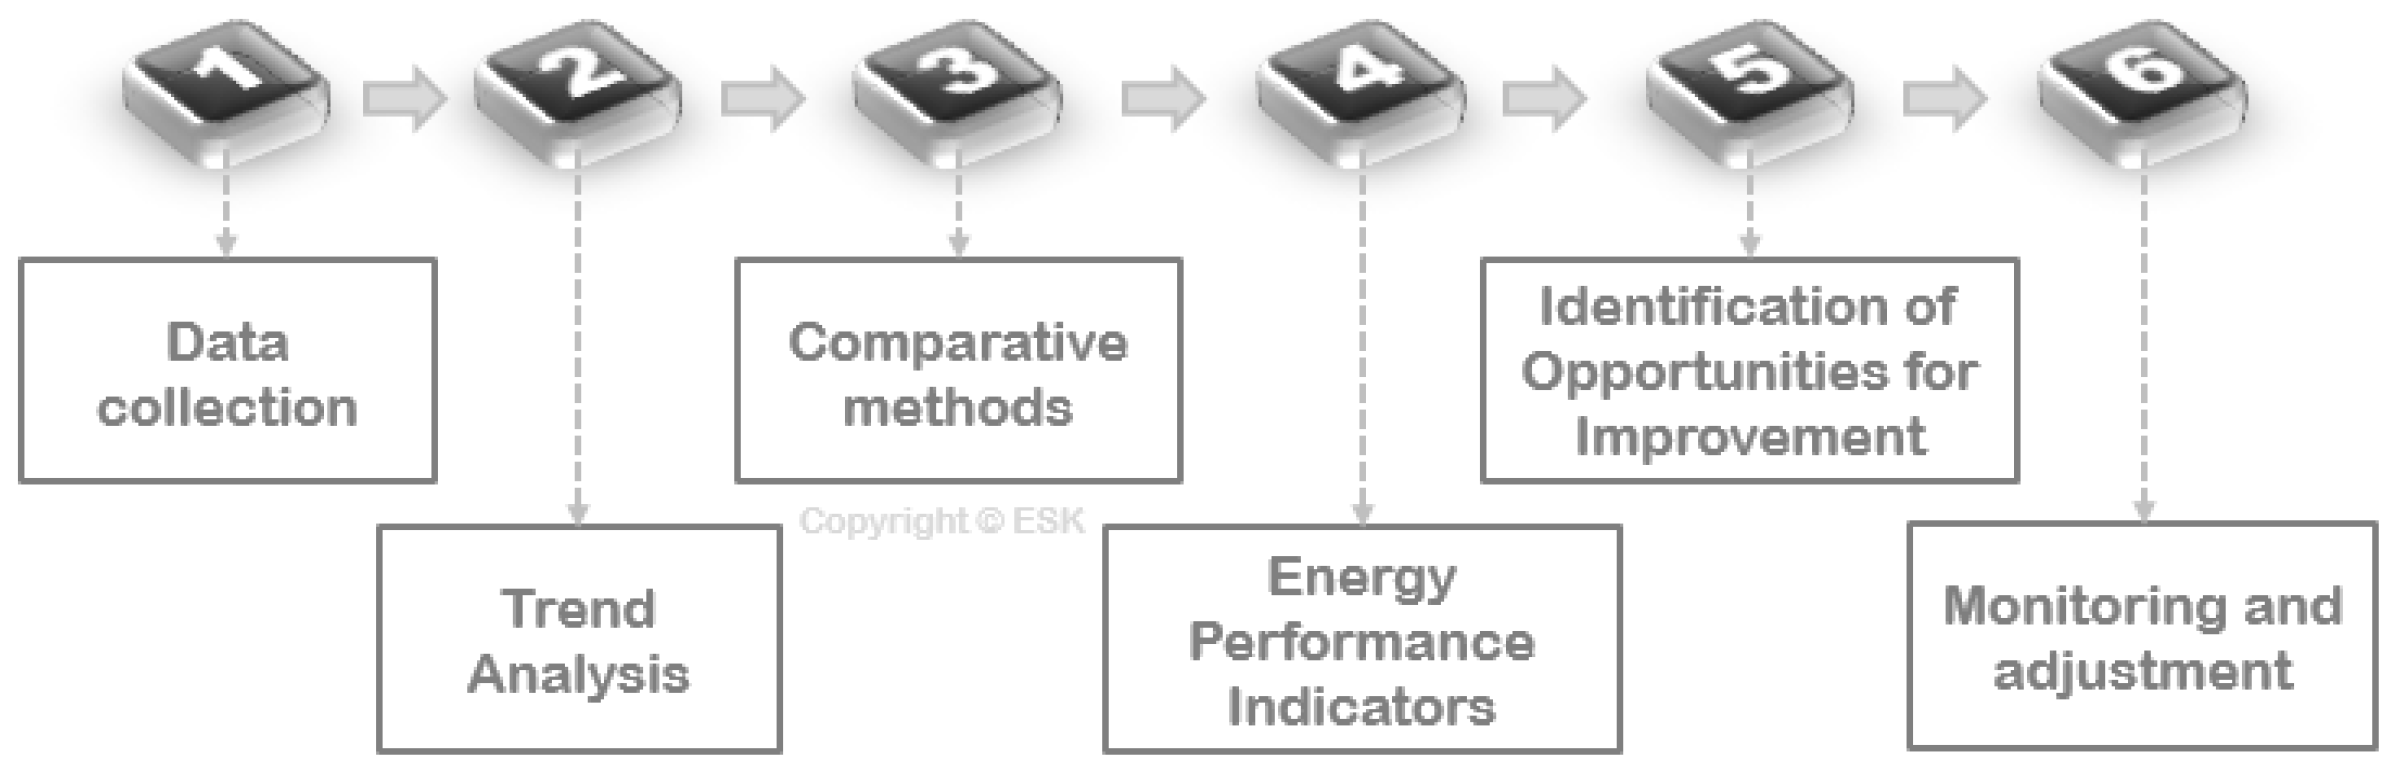
Figure 8.
Cit'ergie system process for identifying ESPS.

Figure 9.
Number of ESPS identified with 10 energy-intensive units in the city of QSD.
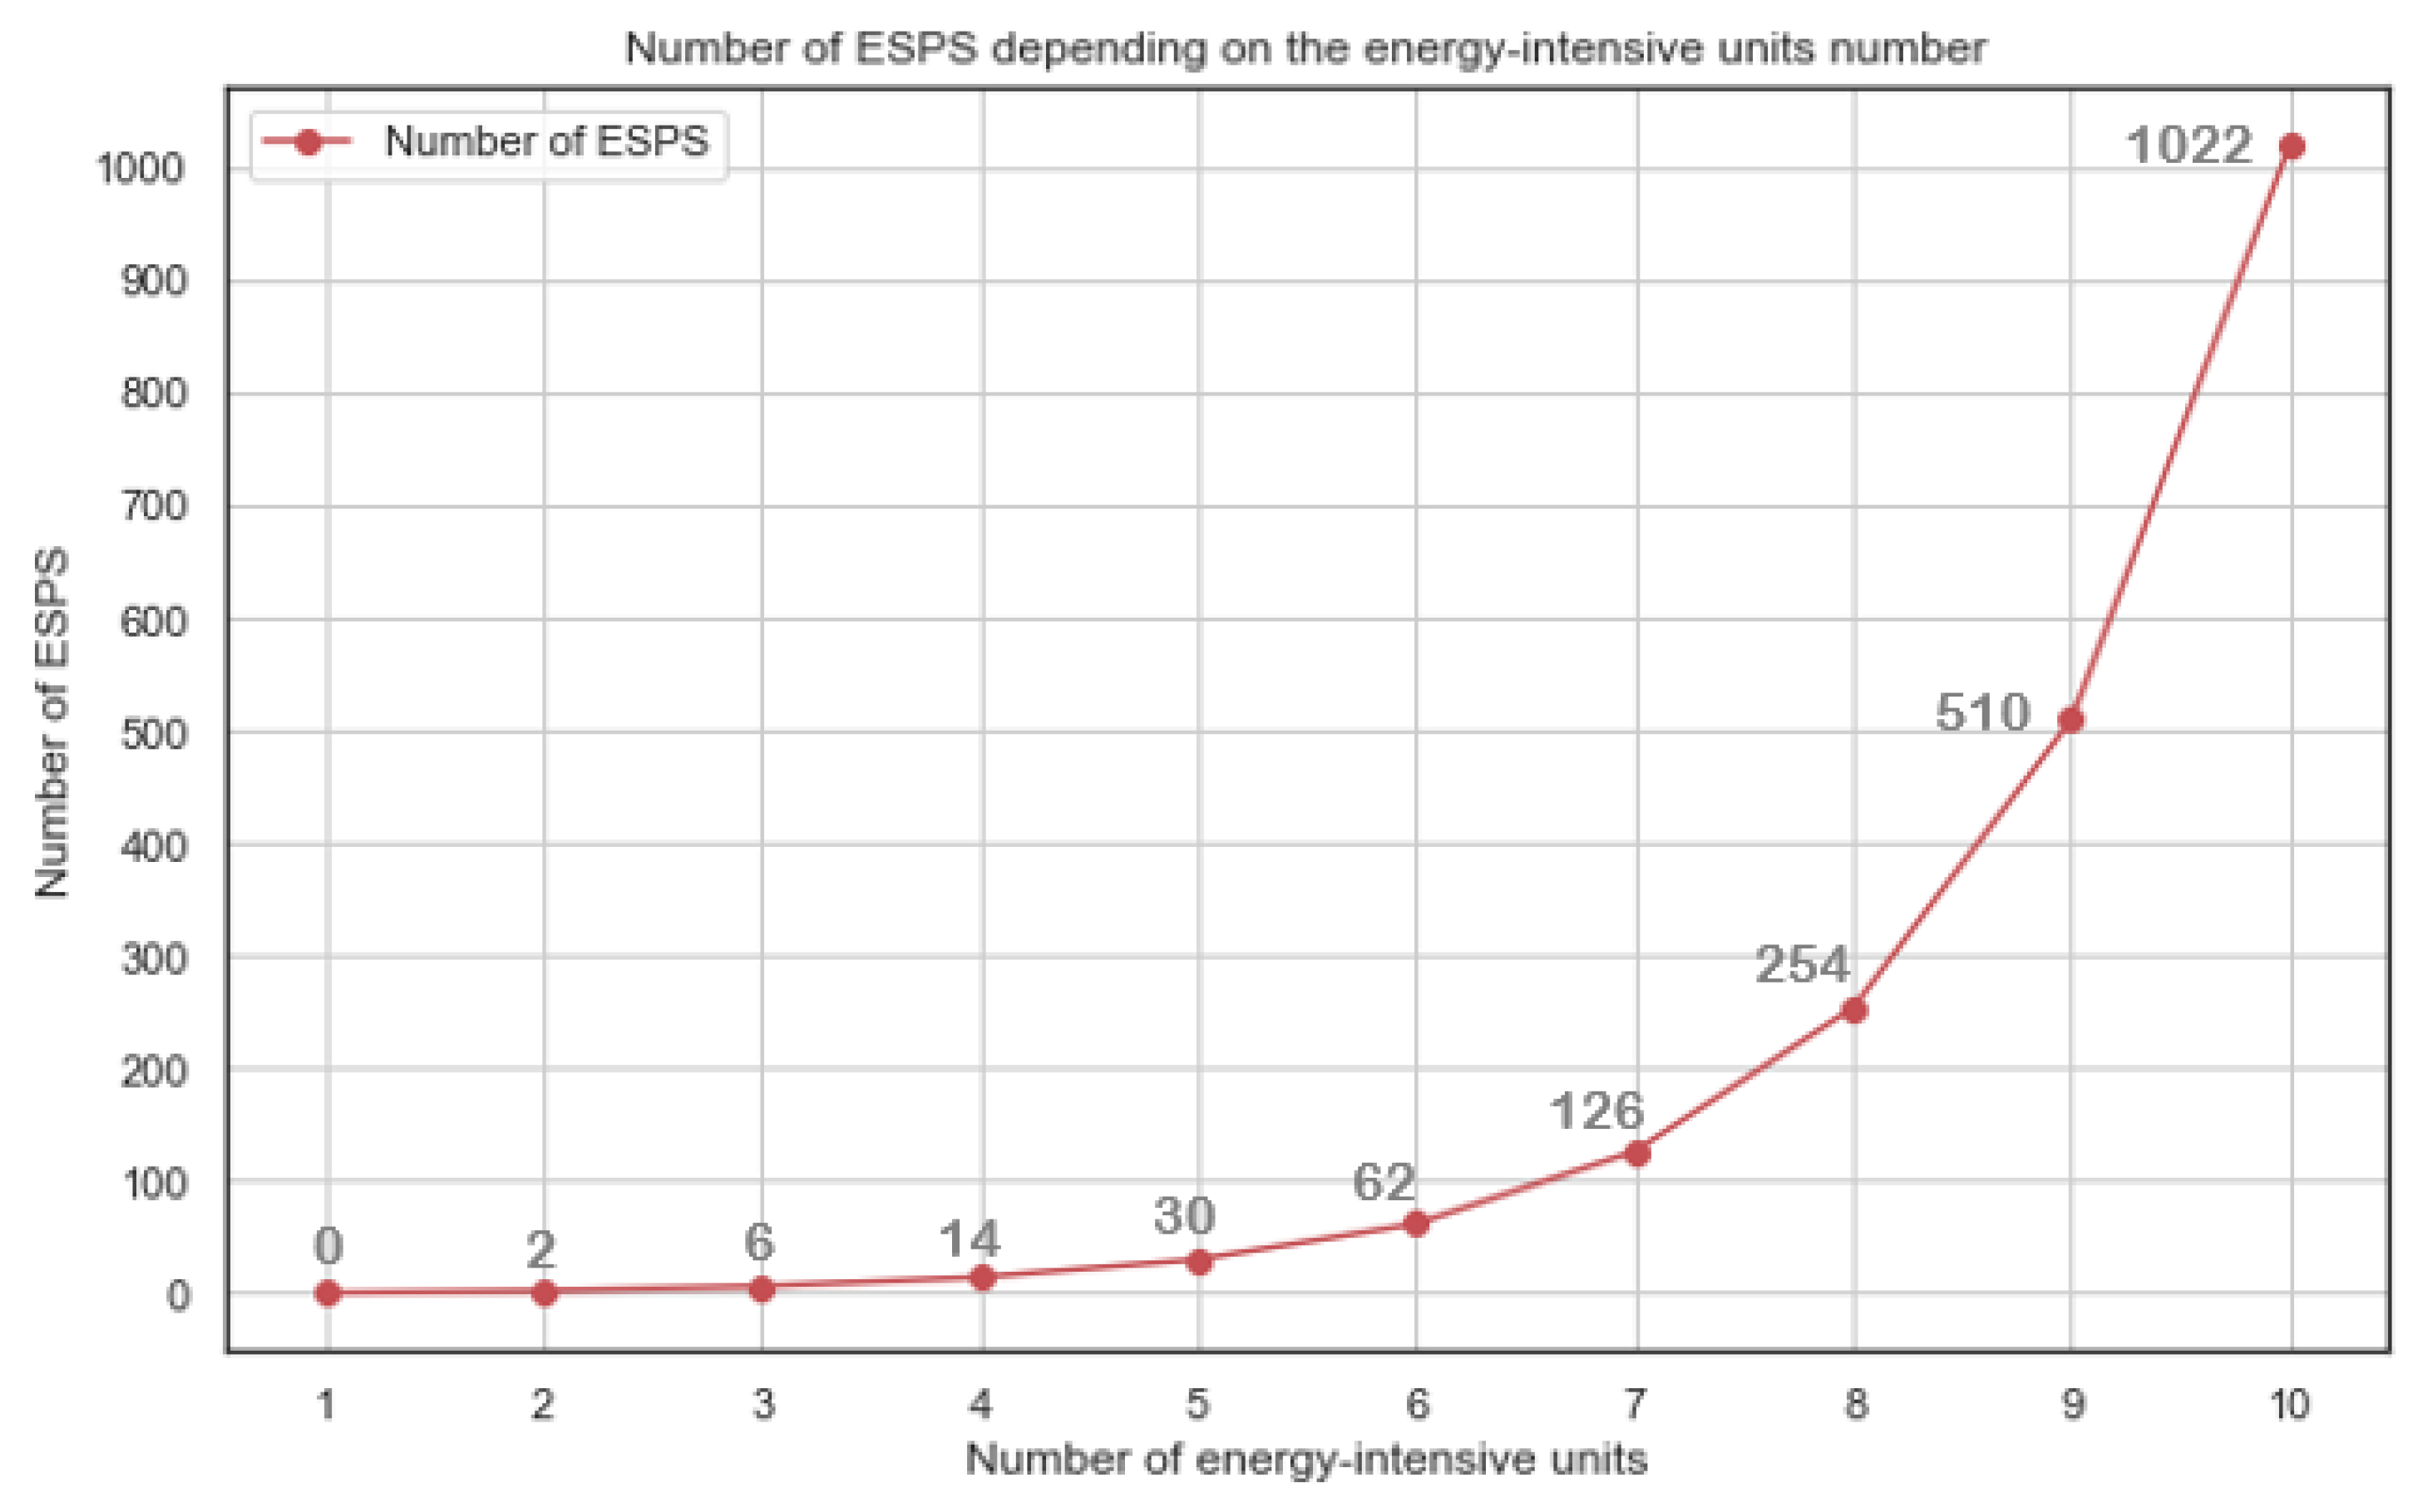
Figure 10.
Survey results for solutions used by communities to identify the ESPS.
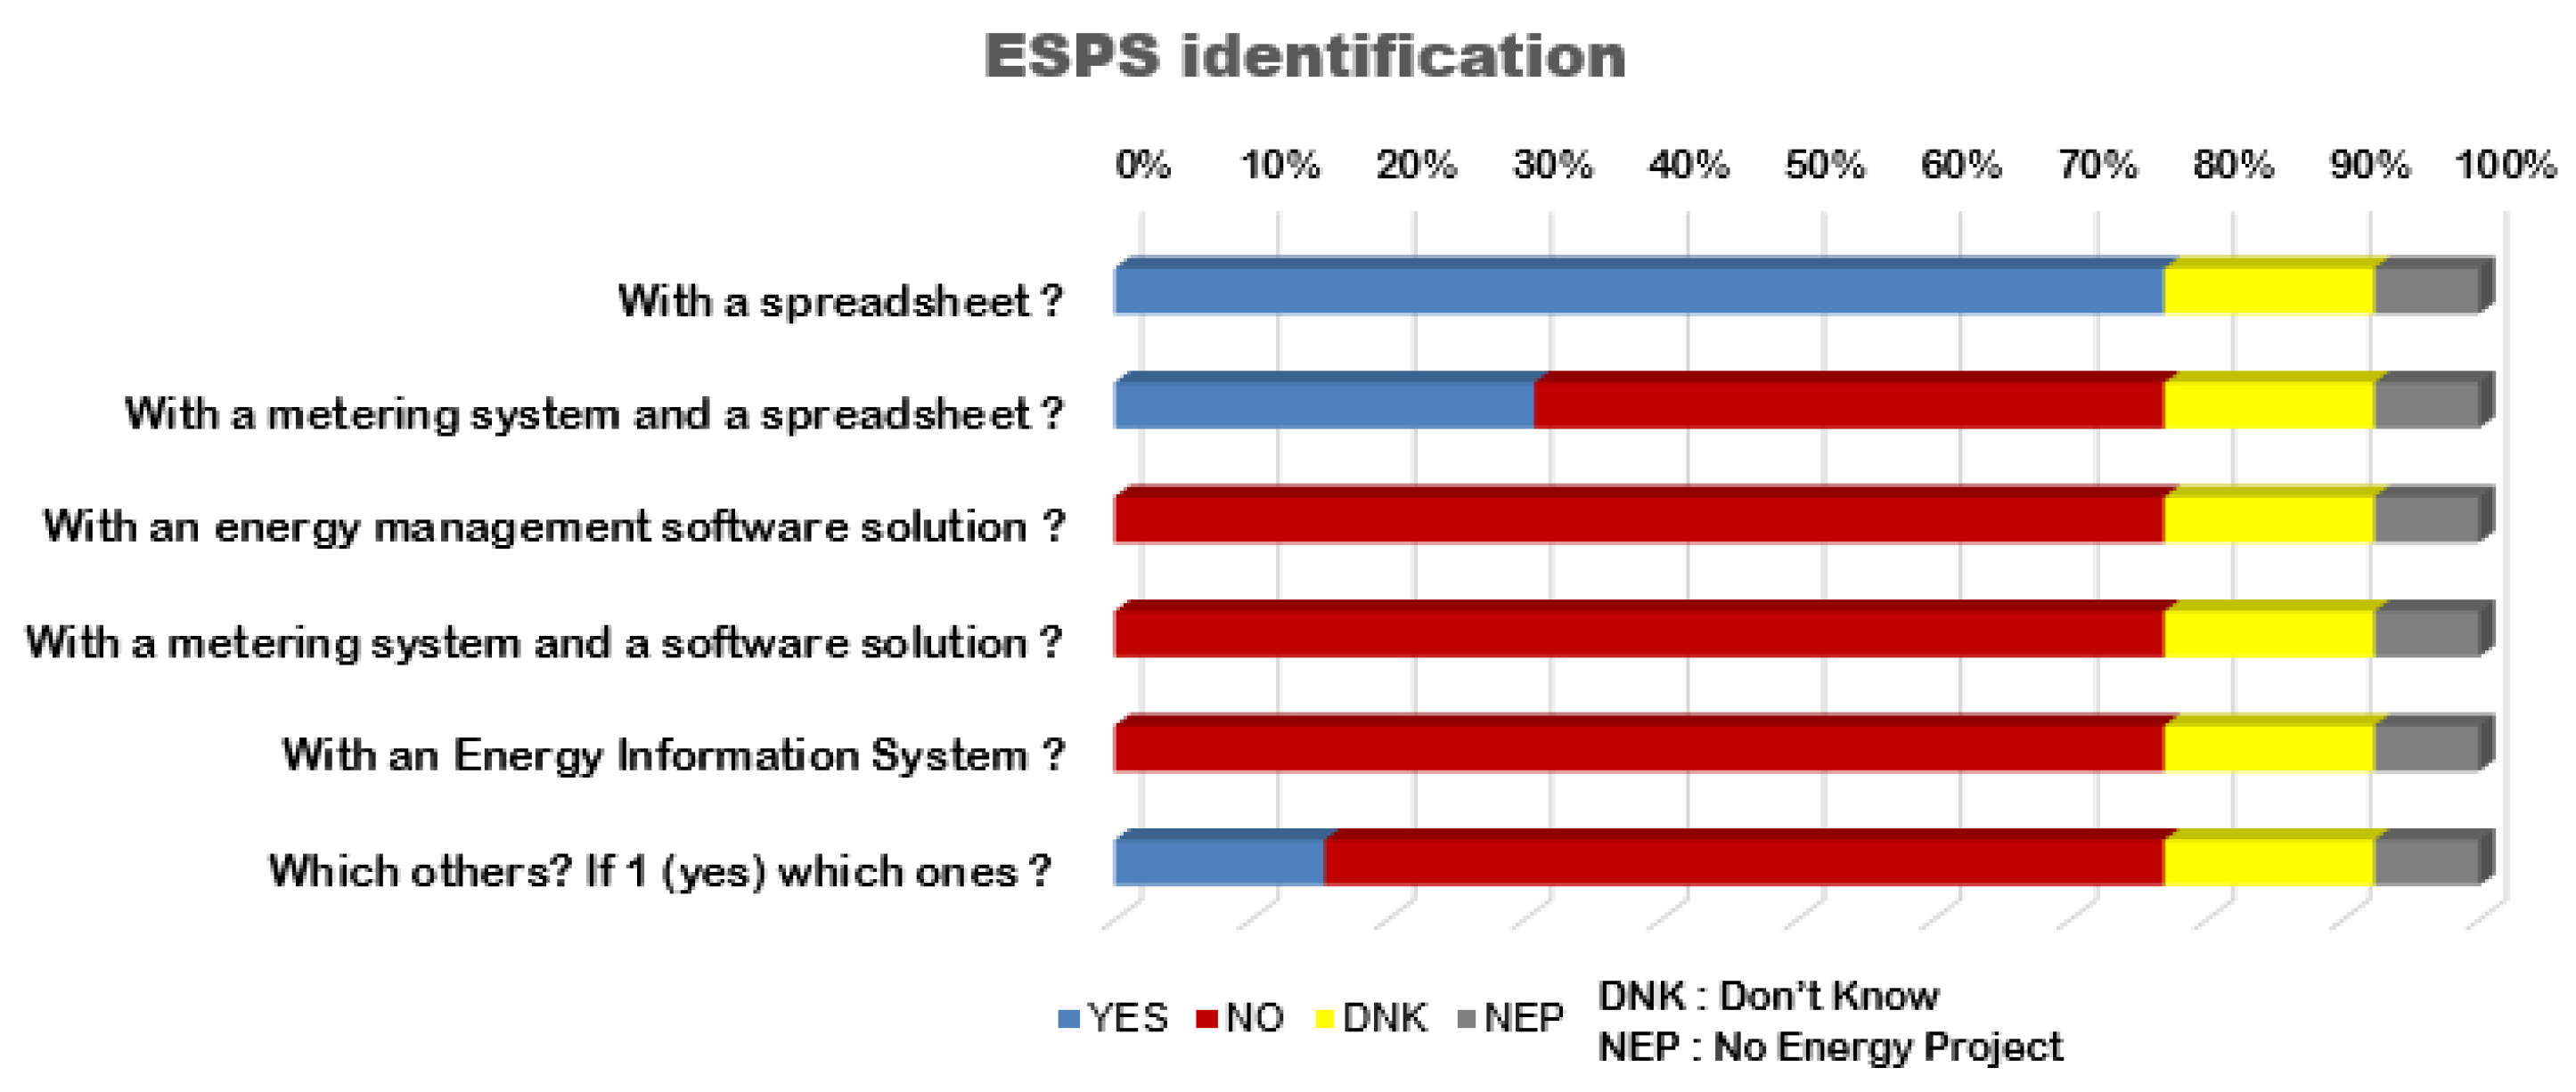
Figure 11.
The wheel of scientific knowledge inspired by Walter Wallace's wheel of scientific knowledge.
Figure 11.
The wheel of scientific knowledge inspired by Walter Wallace's wheel of scientific knowledge.
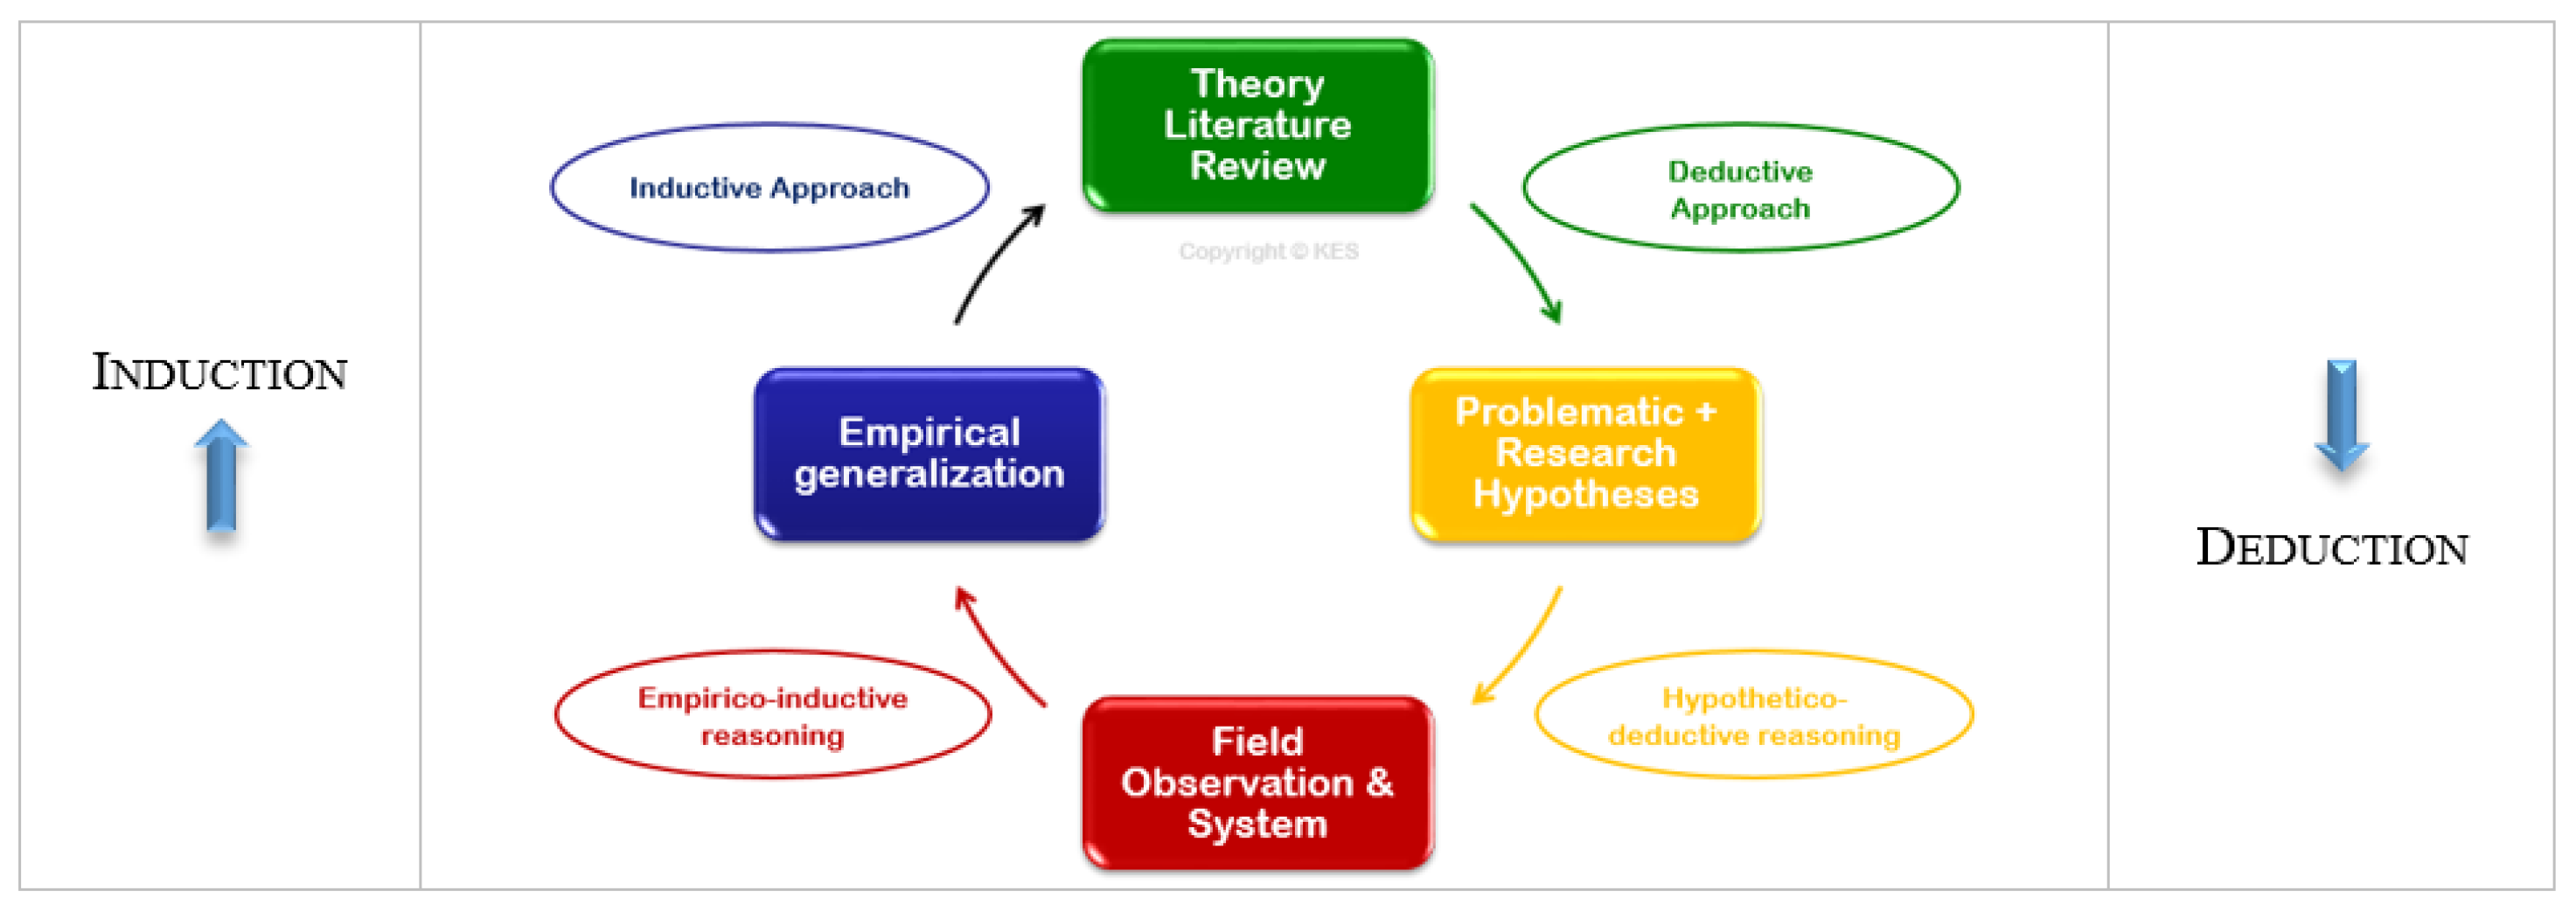
Figure 12.
The scientific abductive approach.

Figure 13.
Methodology of the combinatorial approach of the new PG2E solution.
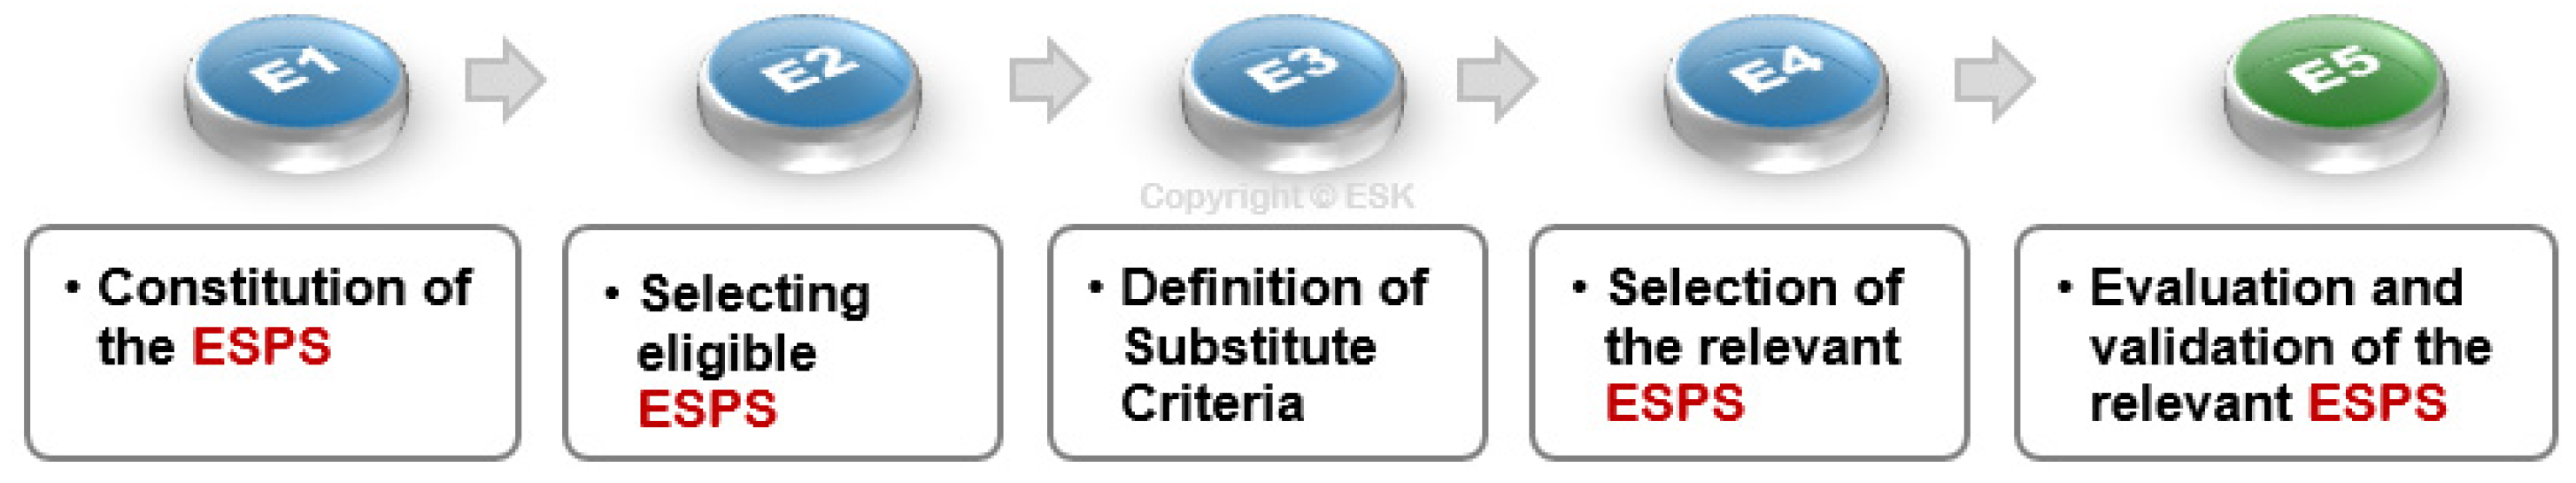
Figure 14.
Identification of substitution criteria for the obsolescence and regulatory states of energy-intensive units.
Figure 14.
Identification of substitution criteria for the obsolescence and regulatory states of energy-intensive units.

Figure 15.
Detailed methodology of the PG2E combinatorial approach.
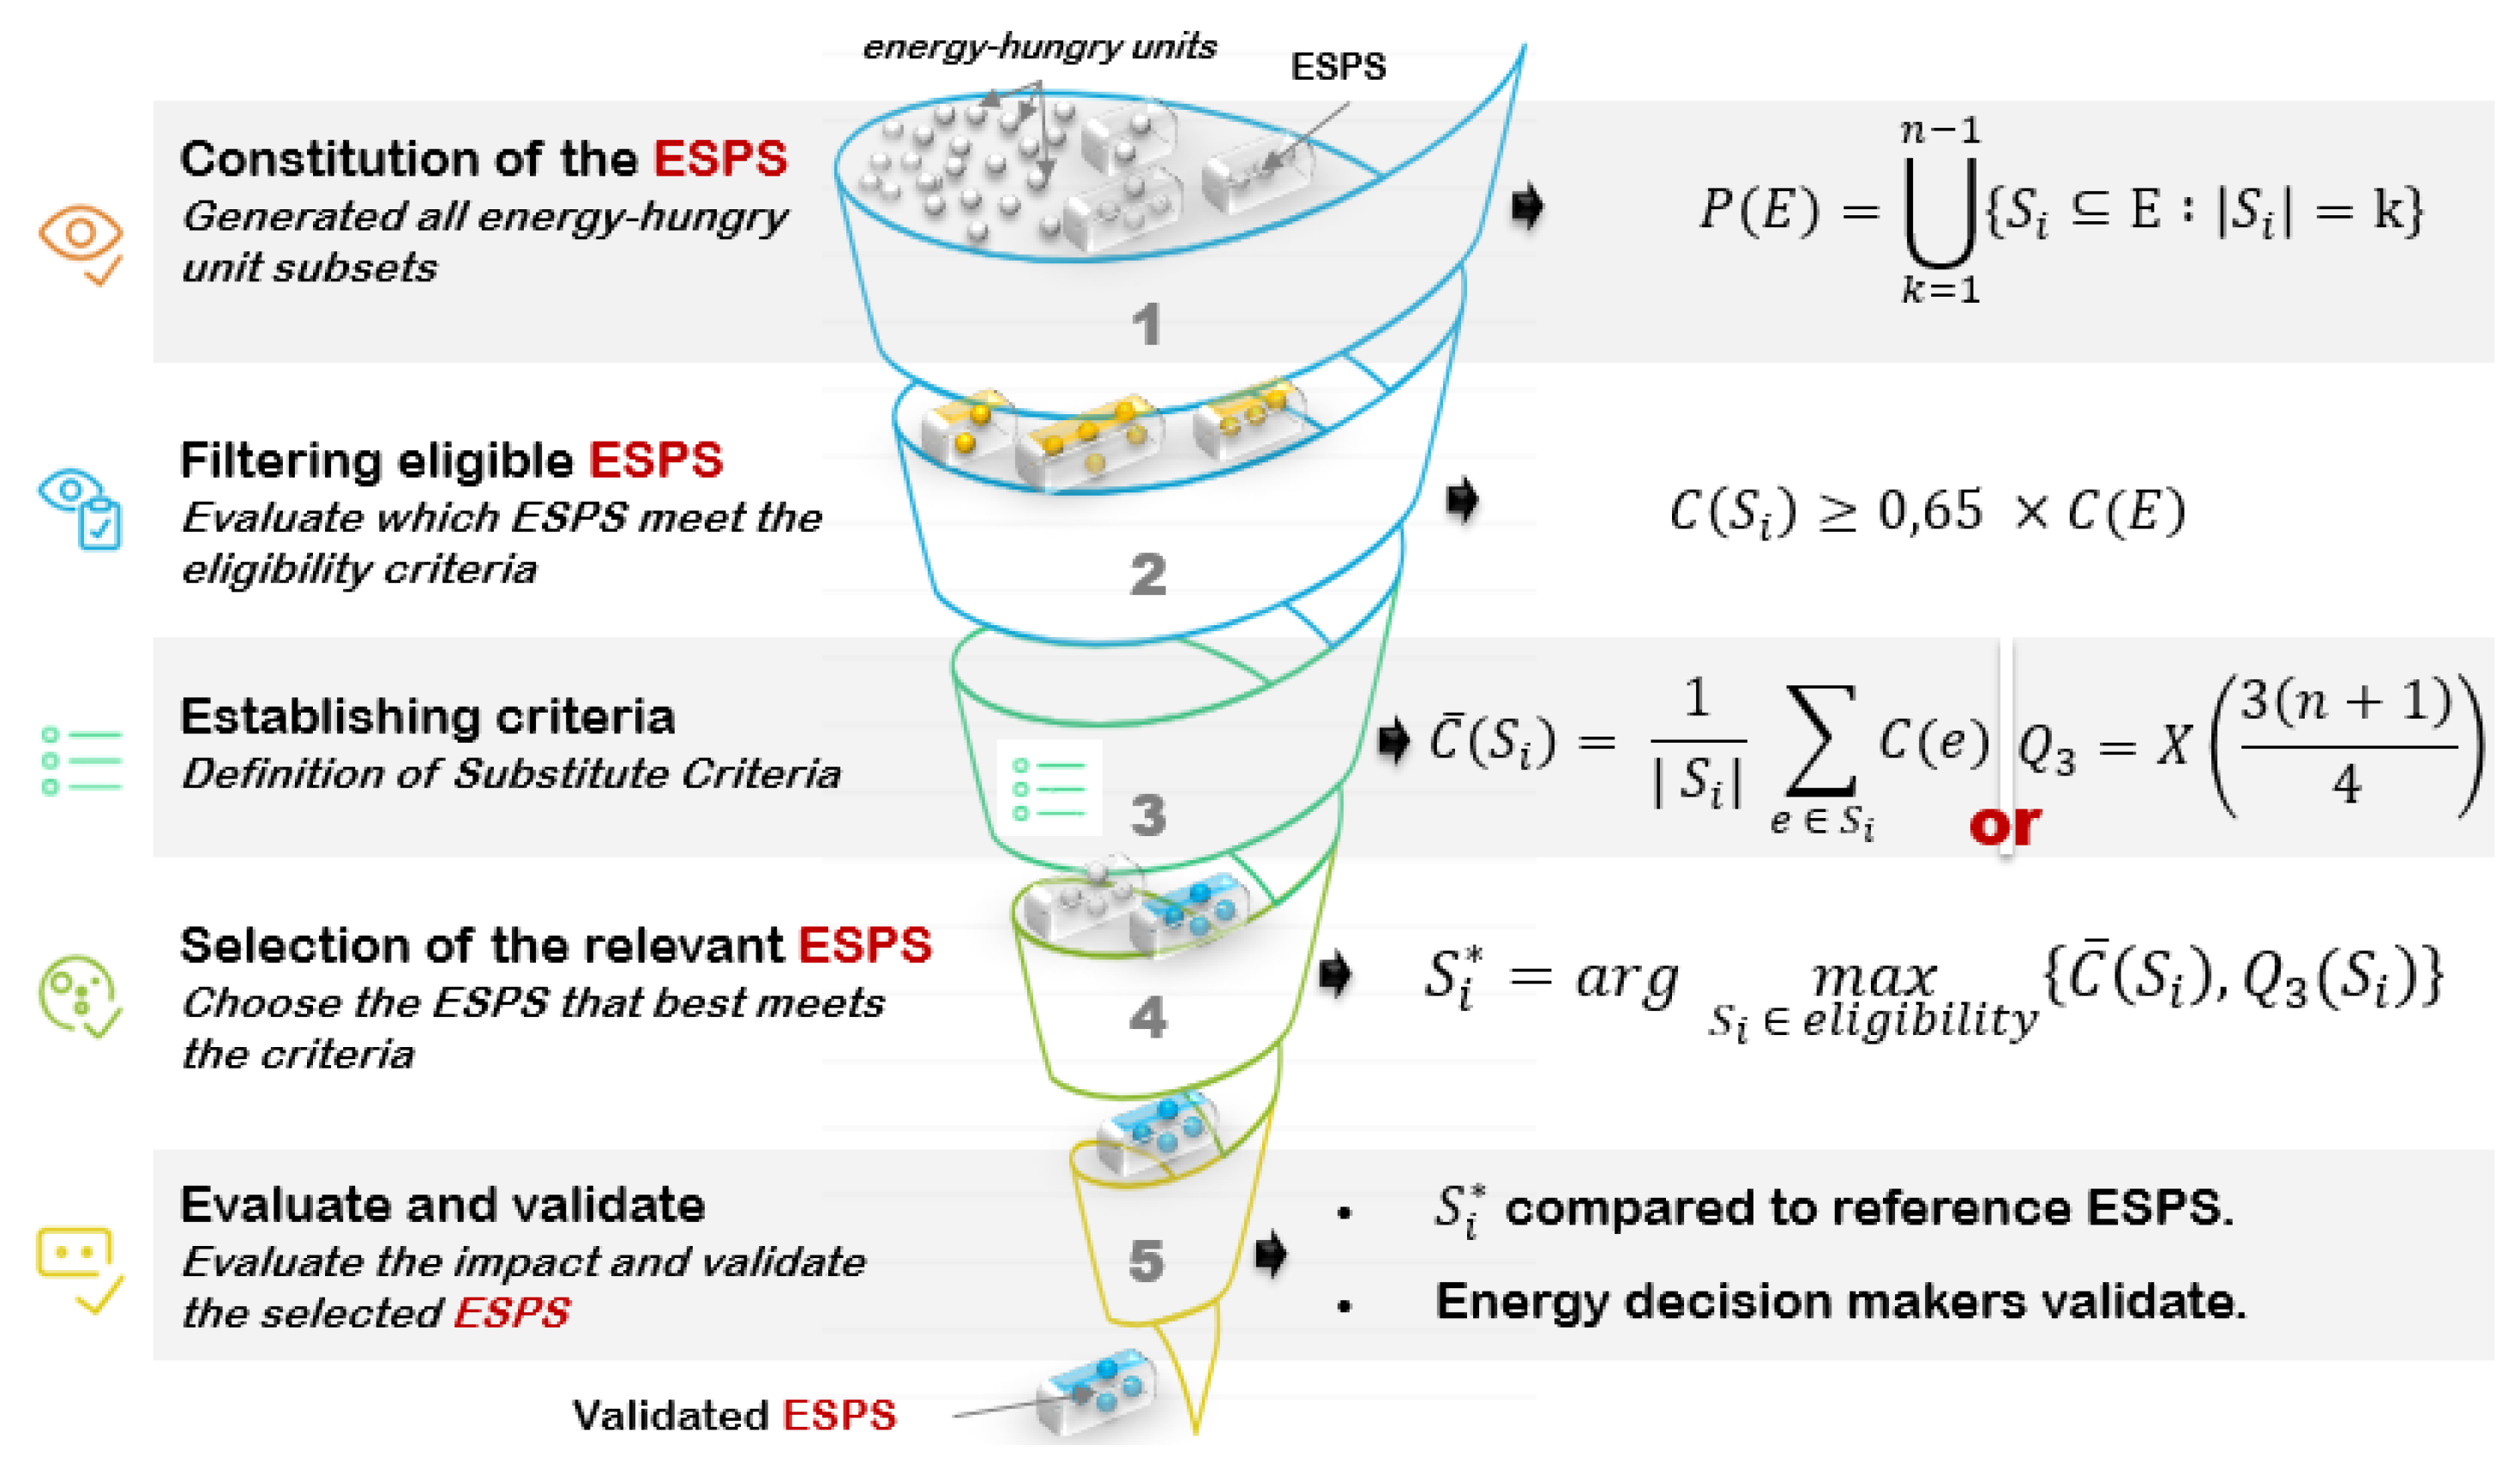
Figure 16.
Simplified diagram of the PG2E tool for identifying the ISO 50001 Certification Scope.
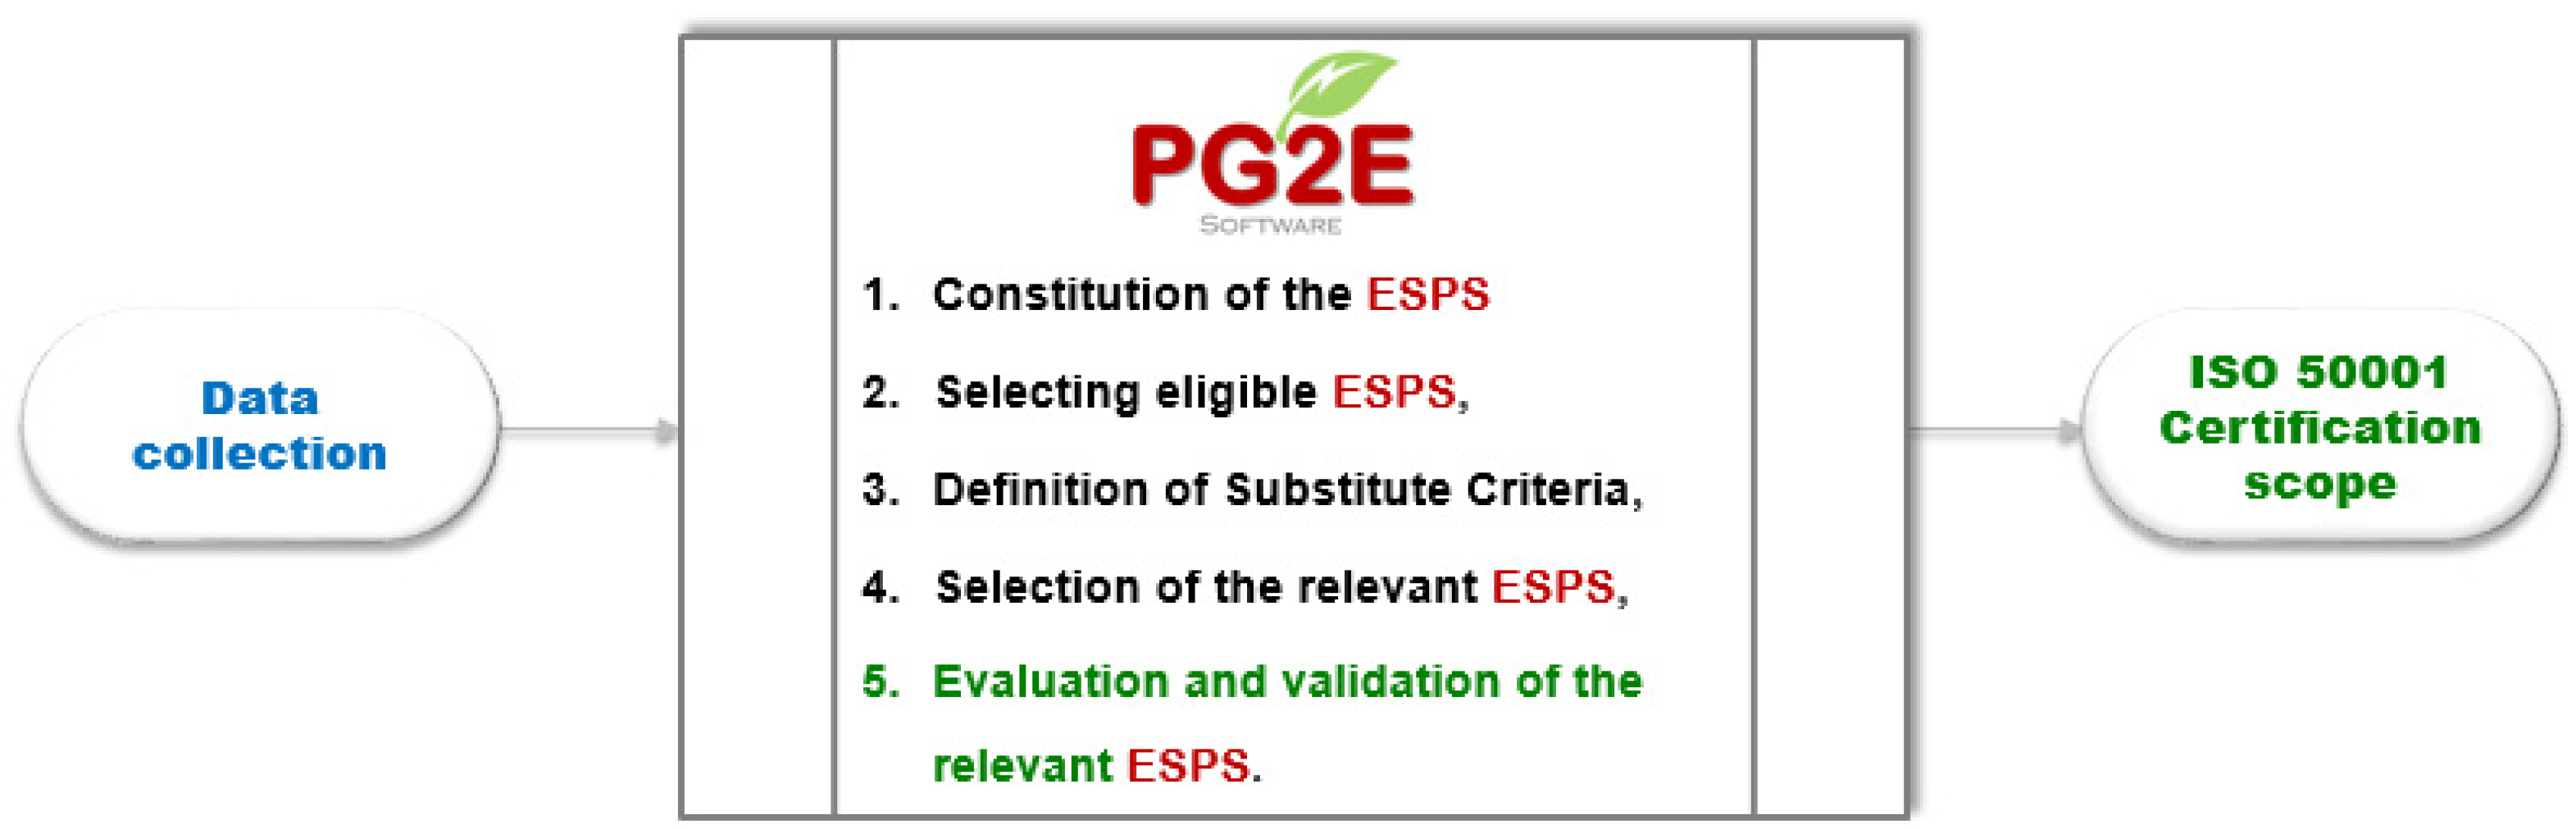
Figure 17.
Standardized data values for QSD building characteristics variables.
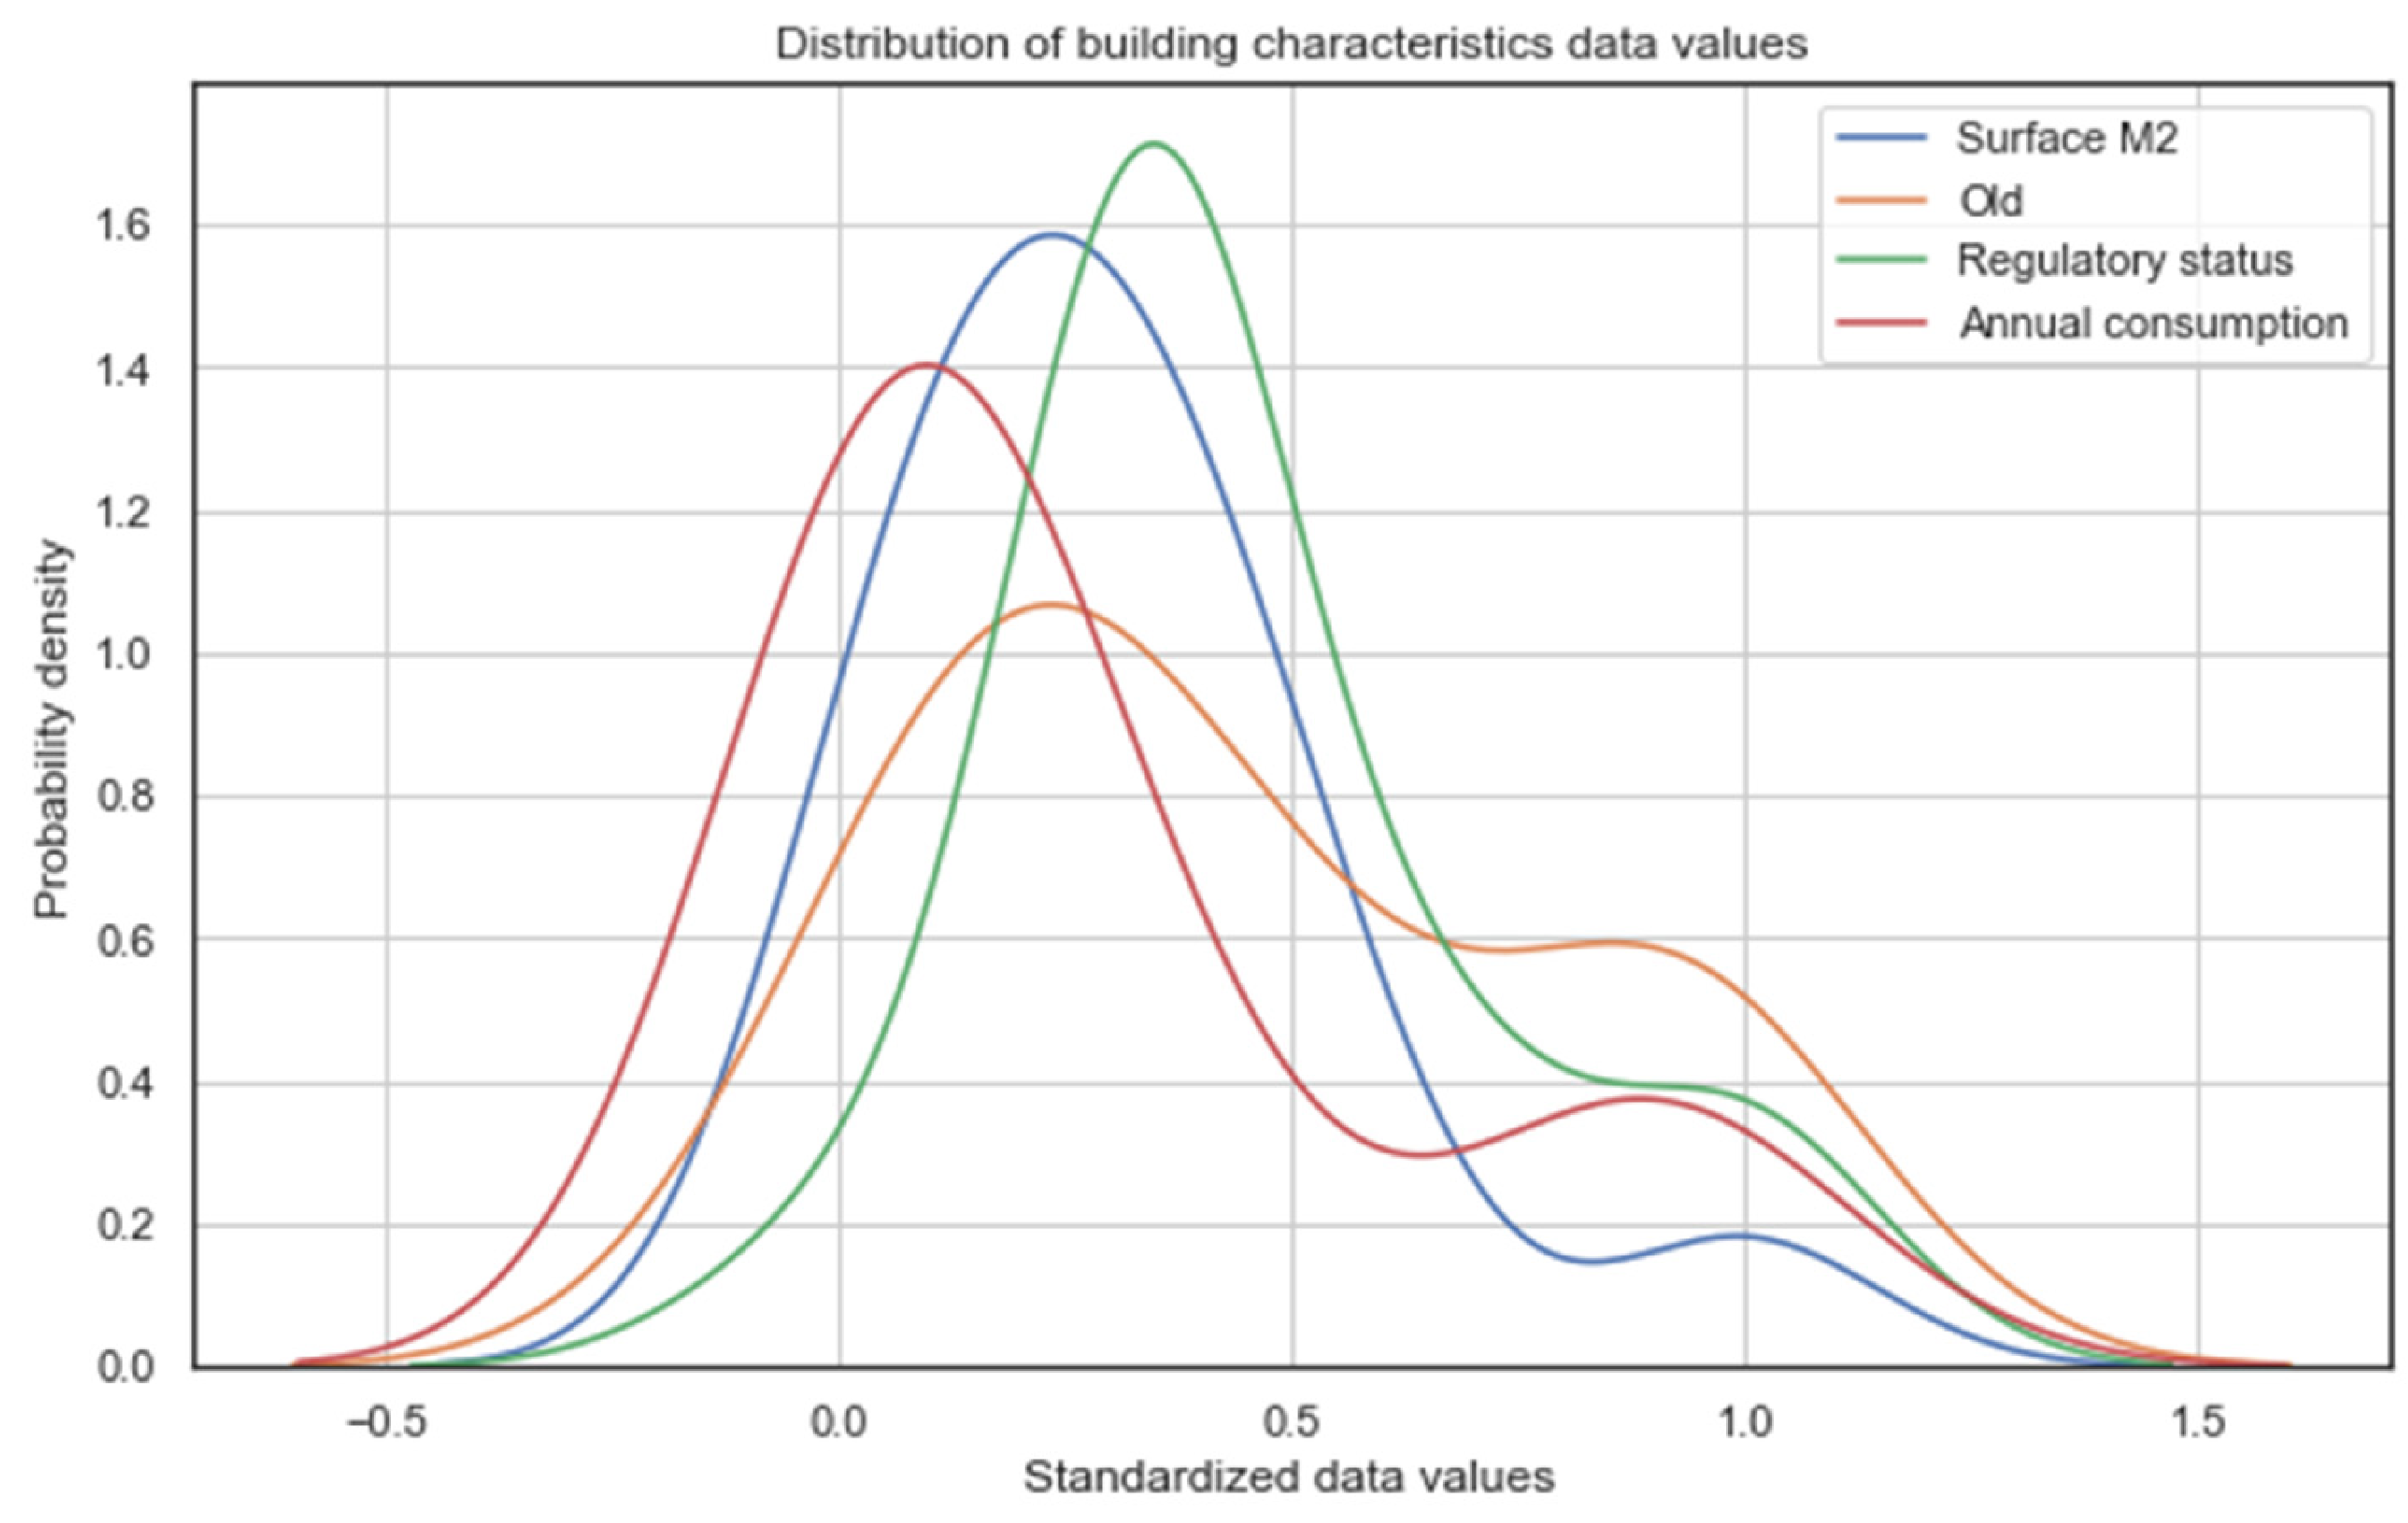
Figure 18.
Execution diagram of the PG2E method for Identifying the Certification Scope.
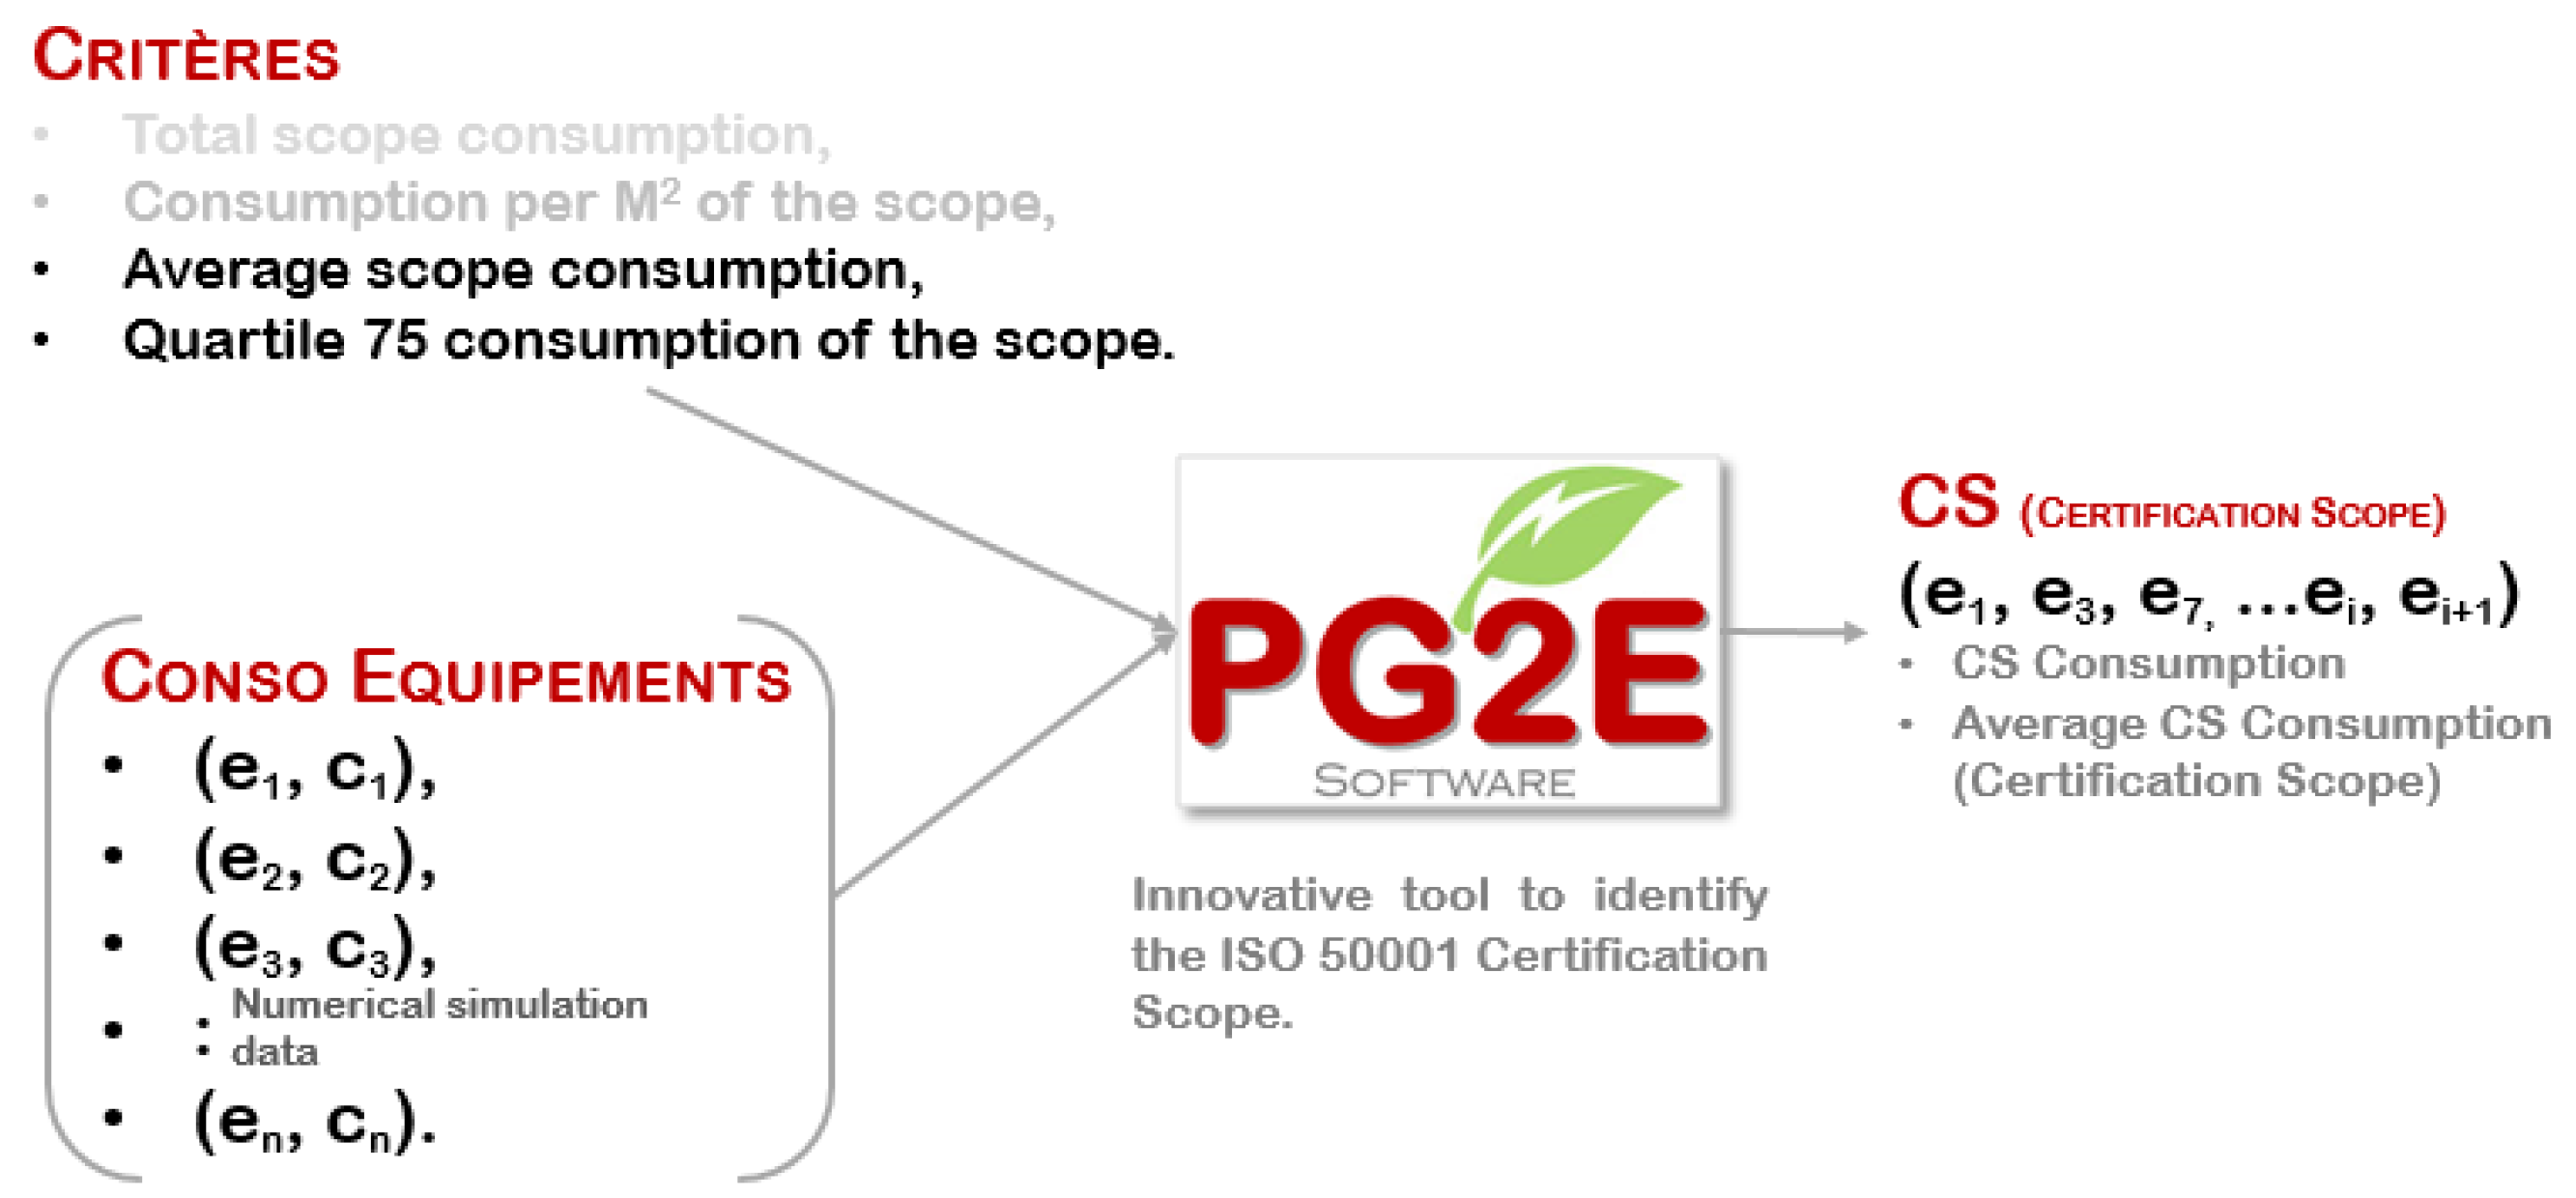
Figure 19.
Results of the CS dedicated to the SME for electricity in Quesnoy-Sur-Deûle.
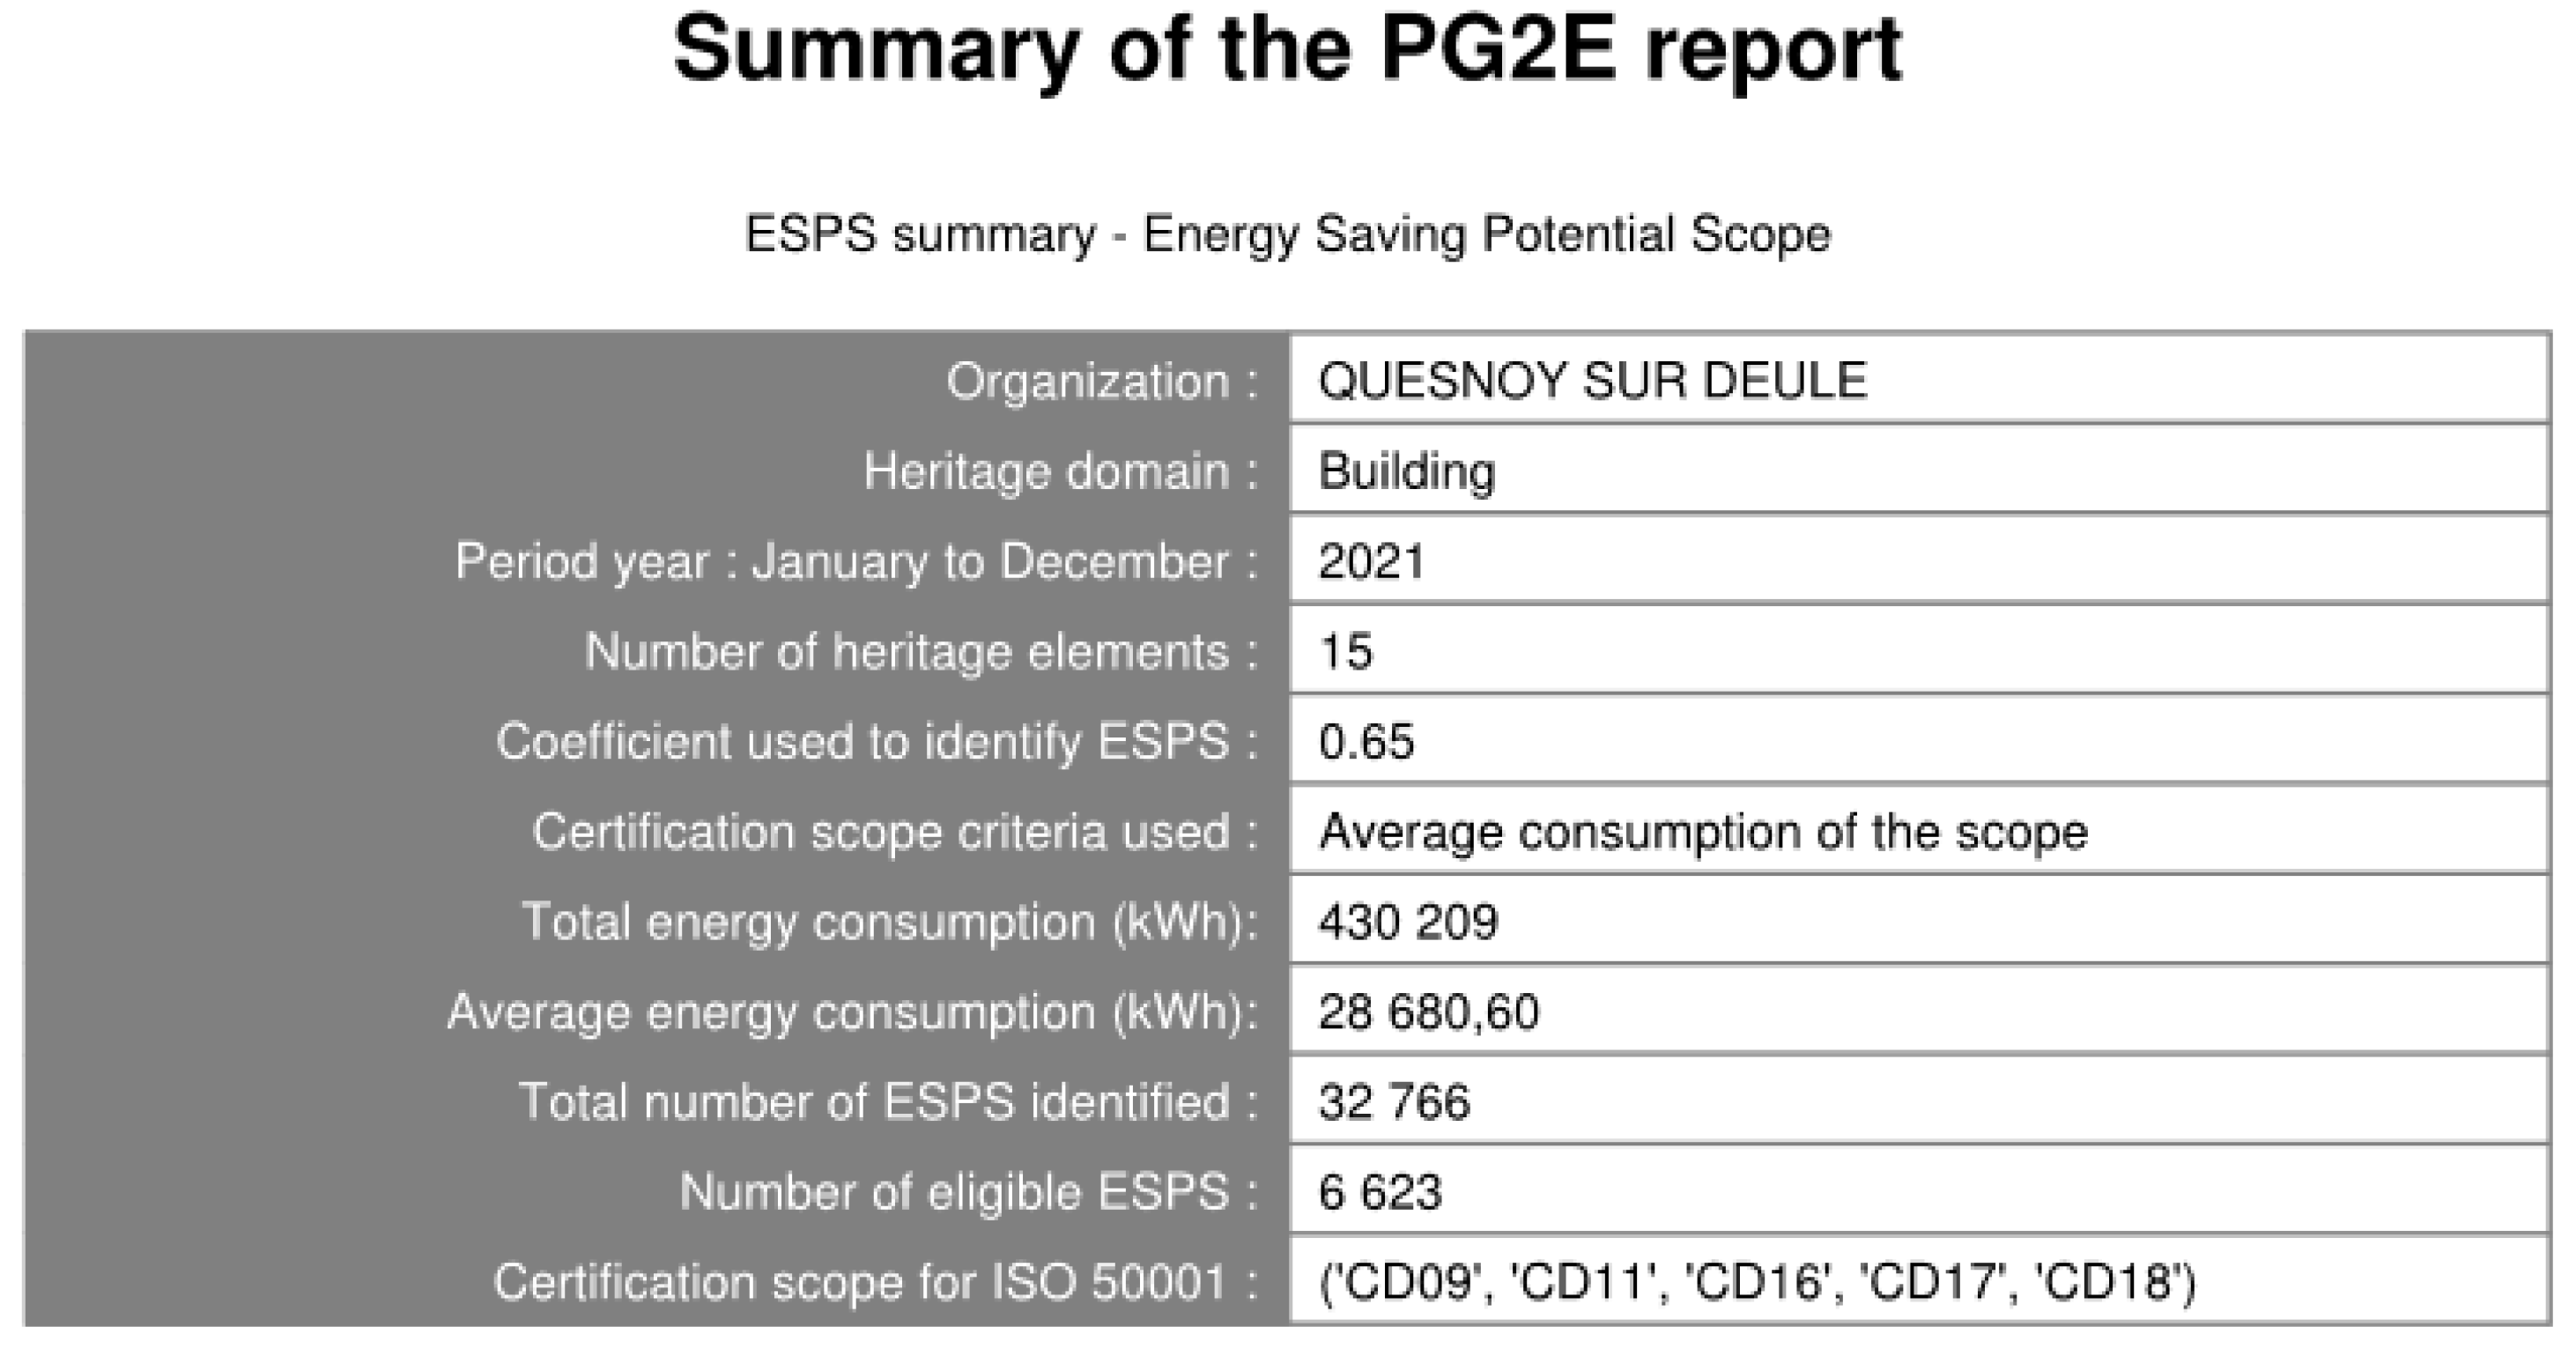
Figure 20.
List of the top 10 CS for ISO 50001 using the average consumption criterion.
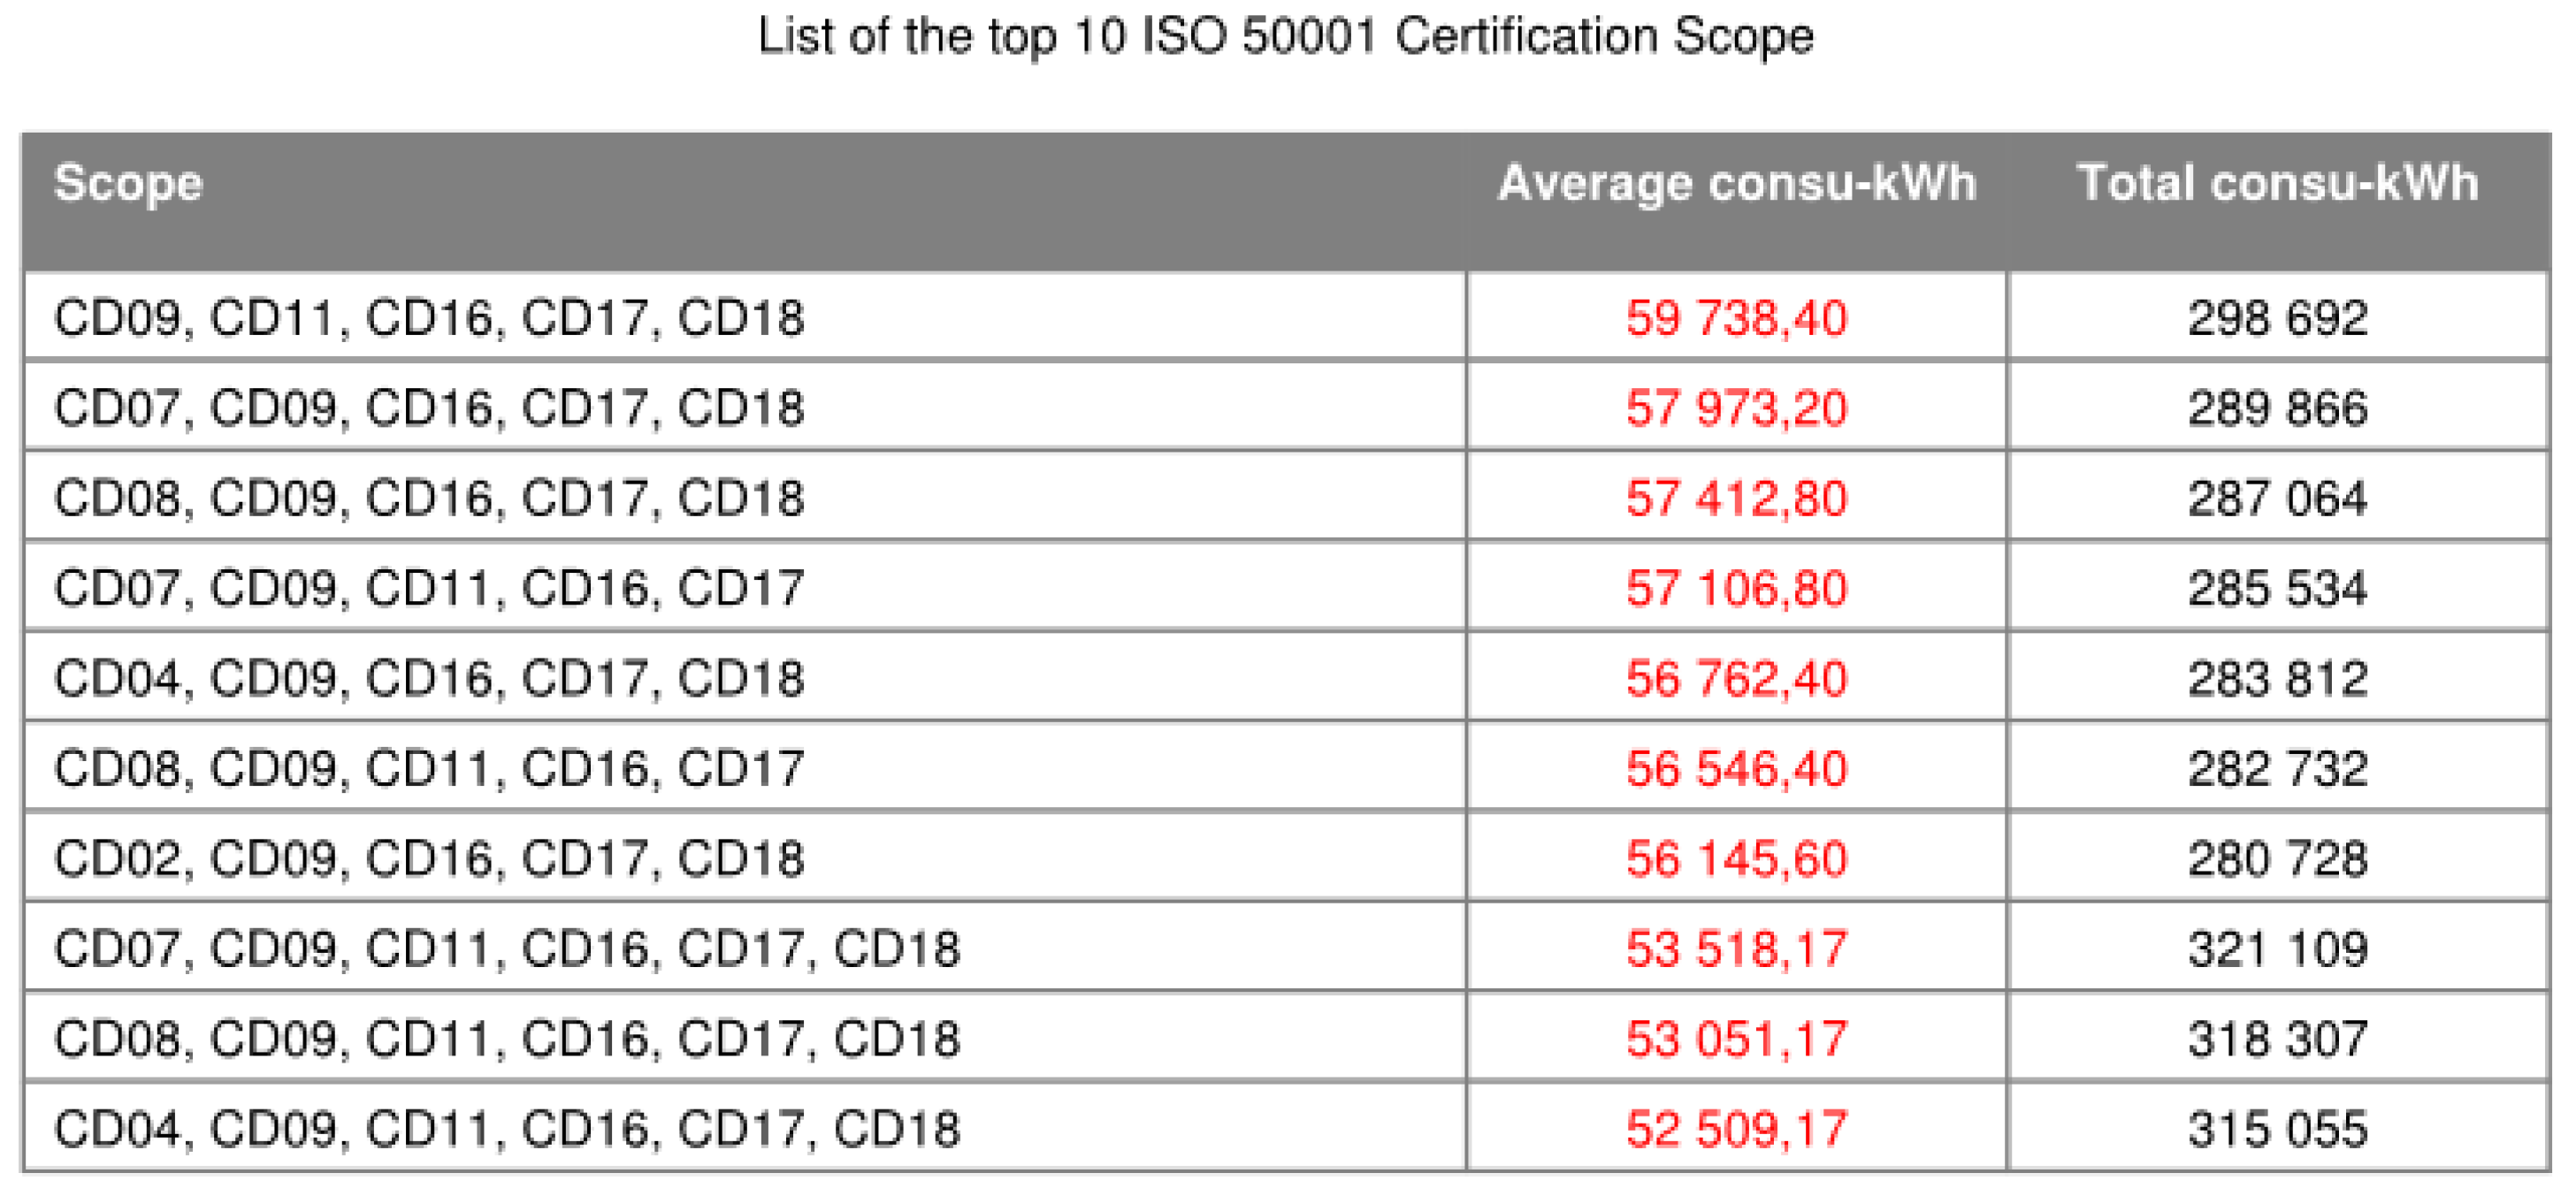
Table 1.
Comparison of main contributions focused on energy consumption.
| Reference | Main Objective | Methodology | Main Contribution |
|---|---|---|---|
| [7] | Analysis of building energy consumption. | Data review and cross-country comparison. | Highlighting the growing weight of the building sector in global consumption, particularly through HVAC systems. |
| [8] | Modeling the energy consumption of machine tools. | Classification of energy consumption models. | Identification of the three main categories of energy models applied to industrial processes. |
| [9] | Development of an Energy-consumption allowance (ECA). | Segmentation of energy-consumption-step (ECS). | Proposal of a modular approach to quantify and optimize energy consumption in manufacturing systems |
Table 2.
Comparison of main contributions based on energy-saving potential.
| Reference | Main Objective | Methodology | Main Contribution |
|---|---|---|---|
| [10] | Provide an overview of electricity consumption and efficiency trends in the enlarged EU and candidate countries, as well as the current market share of efficient appliances and equipment. Estimate the potential for electricity savings in buildings. | Analysis of existing data on electricity consumption, market share of efficient equipment and energy policies. | Provides a baseline for electricity consumption and energy efficiency in the enlarged EU. Identifies key areas for energy savings. |
| [11] | Assess the mitigation potential of greenhouse gas (GHG) emissions in residential and commercial buildings. | Review of over 80 recent studies from 36 countries and 11 country groups. | Provides a comprehensive assessment of the potential for mitigating GHG emissions in the building sector, as well as the associated costs. Highlights the barriers to realizing this potential, and the policies that can be used to overcome them. |
| [12] | Examine the economic concepts underlying consumer decision-making on energy efficiency and conservation, and review the related empirical literature. Assess the extent to which these conditions motivate policy intervention in energy-using product markets. | Review of the economic literature on market barriers, market failures and behavioral failures that have been cited in the context of energy efficiency. | Provides an economic perspective on why energy efficiency policies can be justified. Highlights gaps in knowledge about the extent of certain market and behavioral failures. |
| [13] | Examine the factors influencing Greek households' intentions to adopt energy-saving measures. | Survey of 586 Greek households. Econometric analysis of survey data. | Identifies the economic, demographic, housing-related and attitudinal factors that influence the energy-saving intentions of Greek households. |
| [14] | Examine five possible approaches to assessing energy savings, which could form the basis of an international agreement. | Examination of the strengths and weaknesses of each approach, and discussion of the lessons learned from carrying out this evaluation process. | Provides an overview of the different approaches to assessing energy savings and their implications for the establishment of an international GHG emissions trading system. |
Table 3.
Comparison of main contributions based on the measure energy-saving.
| Reference | Main Objective | Methodology | Main Contribution |
|---|---|---|---|
| [15] | Examine energy efficiency policies in OECD countries. | Analysis of energy intensity trends. | Identify effective policies and key factors for improving energy efficiency. |
| [16] | Analyze bottom-up models to assess energy consumption in the residential sector. | Critical review of bottom-up physical models, comparison of five models for the UK. | Highlighting the strengths and weaknesses of different models, identifying future modeling needs. |
| [17] | Analyze the gap between actual and optimal energy use. | Distinguish between different notions of optimality (economic potential, social optimum). | Identification of market failures and non-market failures as causes of the gap. |
| [18] | Combining bottom-up and top-down approaches in an energy demand model. | Estimation of model parameters from bottom-up information, taking into account the energy efficiency gap. | Proposal of a model that reconciles bottom-up and top-down approaches, improved policy analysis. |
| [19] | Examine the co-benefits of improving energy efficiency in buildings. | Review of the literature on quantifying co-benefits, and proposal of a methodology for incorporating them into cost-benefit analyses. | Highlighting the importance of co-benefits and proposing a methodology for quantifying them and integrating them into decision-making analyses. |
Table 5.
Correlation coefficients of ESPS variables to identify substitute criteria.
| ESPS Variable Pairs | Pearson Coefficients | P-Value | Comments |
|---|---|---|---|
| Total surface area & total obsolescence value | 0,73 | 0 | Promotes energy consumption. |
| Total surface area & total value of regulatory status. | 0,76 | 0 | |
| Energy consumption per m 2 & total obsolescence value. | -0,54 | 0 | Favors energy consumption, obsolescence and regulation. But less effective criteria for energy-hungry ESPS units. |
| Energy consumption per m 2 & total regulatory value. | -0,64 | 0 | |
| Average energy consumption & total obsolescence value. | -0,81 | 0 | Favors energy consumption, obsolescence and regulation. Criterion effective for up to 5 energy-hungry units in an ESPS. |
| Average energy consumption & total regulatory value. | -0,65 | 0 | |
| Quartile 75 energy consumption & total obsolescence value. | -0,67 | 0 | Favors energy consumption, obsolescence and regulation. Criterion effective for up to 5 energy-hungry units in an ESPS. |
| Quartile 75 energy consumption & total regulatory value. | -0,55 | 0 |
Table 6.
2021 electricity consumption data in kWh, obsolescence and regulatory status of buildings.
| List of Study Elements : Electricity Consumption 2021 in kWh | ||||
|---|---|---|---|---|
| Building Code | Surface M2 | Old | Regulatory Status | Annual Consumption |
| CD02 | 601 | 75,00 | 0,14 | 13 279 |
| CD03 | 207 | 76,25 | 0,00 | 10 278 |
| CD04 | 700 | 57,04 | 0,43 | 16 363 |
| CD05 | 670 | 62,96 | 0,19 | 8 689 |
| CD06 | 1 070 | 53,42 | 0,29 | 7 513 |
| CD07 | 620 | 67,31 | 0,14 | 22 417 |
| CD08 | 798 | 52,50 | 0,43 | 19 615 |
| CD09 | 2 275 | 56,30 | 0,29 | 85 228 |
| CD11 | 1 383 | 61,71 | 0,14 | 31 243 |
| CD12 | 439 | 63,27 | 0,14 | 12 028 |
| CD14 | 262 | 57,04 | 0,14 | 11 293 |
| CD15 | 338 | 73,19 | 0,14 | 10 042 |
| CD16 | 1 004 | 57,96 | 0,14 | 69 680 |
| CD17 | 1 171 | 57,50 | 0,14 | 76 966 |
| CD18 | 983 | 74,21 | 0,14 | 35 575 |
Table 8.
Results of scenario 10 with the PG2E solution and the ESPSRef. P10.
| P10 – Electricity 2021 | ||||
| Politicalmandate | Scenarios for the Quesnoy-Sur-Deûle reference scope | Top 10 energy-generating units | ||
| Criterion by Average Energy Consumption | ||||
| Quesnoy Sur Deûlereferencescope | "PG2E" | OKunits | Rates | Bias |
| CD09, CD08, CD04, CD17, CD16, CD06, CD11, CD14, CD07, CD18 | CD09, CD11, CD16, CD17, CD18 | 5/5 | 100% | 0% |
| Criteria by Quartile 75 of Energy Consumption | ||||
| Quesnoy Sur Deûlereferencescope | "PG2E" | OK units | Rates | Bias |
| CD09, CD08, CD04, CD17, CD16, CD06, CD11, CD14, CD07, CD18 | CD09, CD11, CD16, CD17, CD18 | 5/5 | 100% | 0% |
Table 9.
Results of scenario 08 with the “PG2E” solution and the ESPSRéf. P08.
| P08 – Electricity 2021 | ||||
| Politicalmandate | Scenarios for the Quesnoy-Sur-Deûle reference scope | Top 08 energy-generating units | ||
| Criterion by Average Energy Consumption | ||||
| Quesnoy Sur Deûlereferencescope | "PG2E" | OK units | Rates | Bias |
| CD09, CD08, CD04, CD17, CD16, CD06, CD11, CD14 | CD09, CD11, CD16, CD17, CD18 | 5/6 | 83% | 17% |
| Criteria by Quartile 75 of Energy Consumption | ||||
| Quesnoy Sur Deûlereferencescope | "PG2E" | OK units | Rates | Bias |
| CD09, CD08, CD04, CD17, CD16, CD06, CD11, CD14 | CD09, CD11, CD16, CD17, CD18 | 5/6 | 83% | 17% |
Table 10.
Results of scenario 05 with the “PG2E” solution and the ESPSRéf. P05.
| P05 - Electricity 2021 | ||||
| Politicalmandate | Scenarios for the Quesnoy-Sur-Deûle reference scope | Top 05 energy-generating units | ||
| Criterion by Average Energy Consumption | ||||
| Quesnoy Sur Deûlereferencescope | "PG2E" | OK units | Rates | Bias |
| CD09, CD08, CD04, CD17, CD16 | CD09, CD11, CD16, CD17, CD18 | 3/5 | 60% | 40% |
| Criteria by Quartile 75 of Energy Consumption | ||||
| Quesnoy Sur Deûlereferencescope | "PG2E" | OK units | Rates | Bias |
| CD09, CD08, CD04, CD17, CD16 | CD09, CD11, CD16, CD17, CD18 | 3/5 | 60% | 40% |
Table 11.
Comparative summary of existing systems and the PG2E solution.
| Criteria | Existing Systems | PG2E Solution |
|---|---|---|
| Methodological approach | Unit-by-unit sequential approach based on detailed analysis of building and energy equipment characteristics to build up the reference ESPS. | Combinatorial approach based on a set of units (ESPS) meeting the threshold of 65% of total energy consumption and statistical criteria (mean and quartile 75) to identify the relevant ESPS. |
| Main objective | Identify the most energy-intensive buildings and analyze their performance in detail. | Quickly identify an ISO 50001-compliant energy savings potential scopes (ESPS). |
| Accuracy of results | Very accurate, but depends on data availability and quality. | Results comparable with existing systems using relevant statistical criteria, but dependent on data availability and quality. |
| Analysis time | Long (requires in-depth data collection and analysis). | Reduced in the area of the relevant ESPS identification process, but dependent on data collection activities. |
| Resource requirements | Important (technical expertise, specialized software, energy audits). | Limited (no need for complex technical analyses, accessible to SMM). |
| Complexity of implementation | High (requires specific skills and advanced tools). | Low (simplified methodology, suitable for communities with few resources). |
| Accessibility for MMS | Difficult to implement due to cost and technical complexity. | Easy to adopt thanks to a simplified, fast approach. |
| Taking outliers into account | Based on in-depth analysis of buildings and their consumption history. | Identified by statistical criteria (mean and upper quartile), without requiring in-depth analysis. |
| Adaptability and flexibility | Requires frequent database updates and manual analysis. | Adaptable method, with the possibility of adjusting thresholds and criteria as required. |
| Difficulties in collecting data : | YES. Lack of data available at municipal level with a semi-automated system. | YES. A lack of available data at municipal level; but can integrate an energy information system (EIS) to automate and propose relevant ESPS. |
Disclaimer/Publisher’s Note: The statements, opinions and data contained in all publications are solely those of the individual author(s) and contributor(s) and not of MDPI and/or the editor(s). MDPI and/or the editor(s) disclaim responsibility for any injury to people or property resulting from any ideas, methods, instructions or products referred to in the content. |
© 2025 by the authors. Licensee MDPI, Basel, Switzerland. This article is an open access article distributed under the terms and conditions of the Creative Commons Attribution (CC BY) license (http://creativecommons.org/licenses/by/4.0/).
Copyright: This open access article is published under a Creative Commons CC BY 4.0 license, which permit the free download, distribution, and reuse, provided that the author and preprint are cited in any reuse.


