
Submitted:
03 June 2025
Posted:
04 June 2025
You are already at the latest version
Abstract
In recent years, the exploration and utilization of geothermal energy have received growing attention as a sustainable alternative to conventional energy sources. Data-driven reliable identification of geothermal reservoirs, particularly in crystalline basement terrains, is crucial for reducing exploration uncertainties and costs. In these geological settings, magnetic susceptibility and radioactive heat production, along with seismic wave characteristics, play a vital role in evaluating geothermal energy potential. Building on this foundation, our study integrates in situ and laboratory measurements, collected using advanced sensors from spatially diverse locations, with statistical and unsupervised artificial intelligence (AI) clustering models. This integrated framework improves the effectiveness and reliability of identifying clusters of potential geothermal sites. We applied this approach to the migmatitic gneisses within the Simav Basin in western Türkiye. Among the selected statistical models, Density-Based Spatial Clustering of Applications with Noise, and among the AI-based models, the Autoencoder-based Deep Clustering identified the most promising and narrowly defined subregions with high geothermal production potential. The potential geothermal sites predicted by the AI models align closely with those identified by statistical models and show strong agreement with independent datasets, including existing drilling locations, thermal springs, and the distribution of major earthquake epicenters in the region.
Keywords:
geothermal energy potential
; radioactive heat production
; artificial intelligence models
; statistical models
; seismic characteristics
1. Introduction
Despite its vast potential, geothermal energy currently accounts for only 0.34% to global energy production [1]. Nevertheless, it holds considerable promise as a sustainable and renewable energy source, due to its low environmental impact, high efficiency, and ability to reduce dependence on fossil fuels [2]. By harnessing the Earth’s internal heat from beneath the crust, geothermal energy enables a wide range of economically viable applications, including electricity generation, as well as residential and industrial heating and cooling [3,4].
Geothermal energy production is primarily driven by the temperature gradient within the Earth’s crust, which results from radioactive heat production (RHP) due to the decay of radioactive isotopes. Isotopes such as 26Al, 26Cl, and 60Fe belong to the group of short-lived radioactive isotopes, while 235U, 238U, 232Th, and 40K have significantly longer half-lives. In the early stages of Earth’s formation, isotopes with shorter half-lives were more effective in the production of heat energy. However, since Earth’s formation, isotopes with long half-lives have becomes the primary contributors to sustained heat generation. Tectonic movements in active zones further influence the heat flux within the crust, with some of this heat being derived from radioactive decay [5]. The decay of uranium (U) and thorium (Th) isotopes within these rocks produces heat that can be harnessed for geothermal energy [6].
The geothermal exploration process has an integrated approach involving geology, geochemistry, hydrogeology, geophysics. Field investigations are conducted to analyze the structural framework and petrographic characteristics of the region, supported by detailed geological mapping. Hydrogeologic studies aim to define aquifer systems and elucidate the subsurface flow mechanisms of geothermal fluids, including their interactions with bedrock. Geochemical analyses of water and rock samples from surface and borehole sources help characterize the hydrochemical composition and origin of geothermal fluids, providing insight into the reservoir, cap rock, and heat source. Geophysical investigations incorporate both surface and borehole techniques to delineate the spatial extent of geothermal systems. Surface methods, including gravity, magnetic, electrical, seismic, and electromagnetic surveys, are used to identify the cap rock, reservoir zones, and fluid pathways. Borehole geophysics is used to assess formation properties and temperature profiles. More recently, data from geological and geophysical surveys have been used to develop synthetic subsurface models, enhancing the understanding and visualization of geothermal systems [7,8,9]. Additionally, a two-dimensional electrical conductivity model derived from magnetotelluric data has been utilized to reveal electrically anisotropic features associated with tectonic deformation and magmatic intrusions. This model has identified a deeper hydrothermal system above a magmatic structure, providing valuable insights for future geothermal exploration [10] .
In recent years, the integration of artificial intelligence (AI) into geothermal energy exploration has garnered significant attention for its potential to improve the efficiency and accuracy of geothermal resource assessment. AI offers innovative solutions for processing and interpreting complex datasets, thereby improving the efficiency and accuracy of geothermal energy evaluations. AlGaiar et al. [11] investigated the role of AI in geothermal resource exploration, highlighting its potential to improve efficiency, data interpretation, and prediction accuracy, key factors in advancing sustainable renewable energy solutions. Duan et al. [12] presents an AI-based approach for clustering and classifying geothermal reservoirs in the Ying-Qiong Basin, China. By applying AI algorithms to geological and geophysical data, the authors identified patterns and grouped reservoirs with similar characteristics. Their study demonstrated the potential of AI to automate and refine the classification process, providing valuable insights for more effective reservoir management and resource utilization.
In this study, we extend the work of Duan et al. [12] by incorporating spatially varying magnetic susceptibility, seismic, and geochemical data, while using RHP as a key indicator for assessing geothermally favorable sites. RHP is closely linked to the concentration of heat-producing elements, primarily U, Th, and K, which contribute significantly to subsurface thermal anomalies. RHP-based approaches have been widely used for identification of geothermal heat sources and preliminary assessment of geothermal energy potential [13,14,15,16,17,18,19,20,21]. Our modeling framework uses AI-based and statistical models to enhance prediction accuracy for locating potential geothermal-rich sites. We test predictive performance of the models in evaluating geothermal energy potential of Precambrian-age migmatitic gneisses of the northern Menderes Massif, within the Simav Basin in western Türkiye. Moreover, we examined the AI-predicted geothermal sites in relation to the spatial distribution of earthquake epicenters to investigate potential correlations between tectonic activity and the localization of geothermal resources.
2. Study Area
The study area is located in the Simav Basin in the northern Menderes Massif of western Anatolia, Türkiye (Figure 1). This region forms part of the Alpine–Himalayan orogenic belt and has undergone significant extensional tectonics from the late Neogene to the present. This setting provides a geodynamically active environment shaped by complex structural deformation and magmatic activity. Within this tectonic framework, the Demirci, Simav, and Dursunbey basins in the northeastern Menderes Massif, have been the focus of extensive multidisciplinary research due to their pull-apart basin structures, magmatic–metamorphic evolution [22,23,24,25,26,27] and rich geothermal resources.
The Simav region and its surroundings have emerged as one of Türkiye’s prominent geothermal energy zones. Numerous studies, including those by [28,29], have evaluated the hydrogeochemical properties and reservoir potential of the area’s thermal fluids. Geothermal resources in Simav are actively used for residential and greenhouse heating, as well as electricity generation. The heat potential of the Simav geothermal field is 1.3x10¹⁴ kJ, and the electricity generation potential is 26 MW, with an average probability of 50%, while the most possible value is calculated as 19 MW [29].
Figure 1.
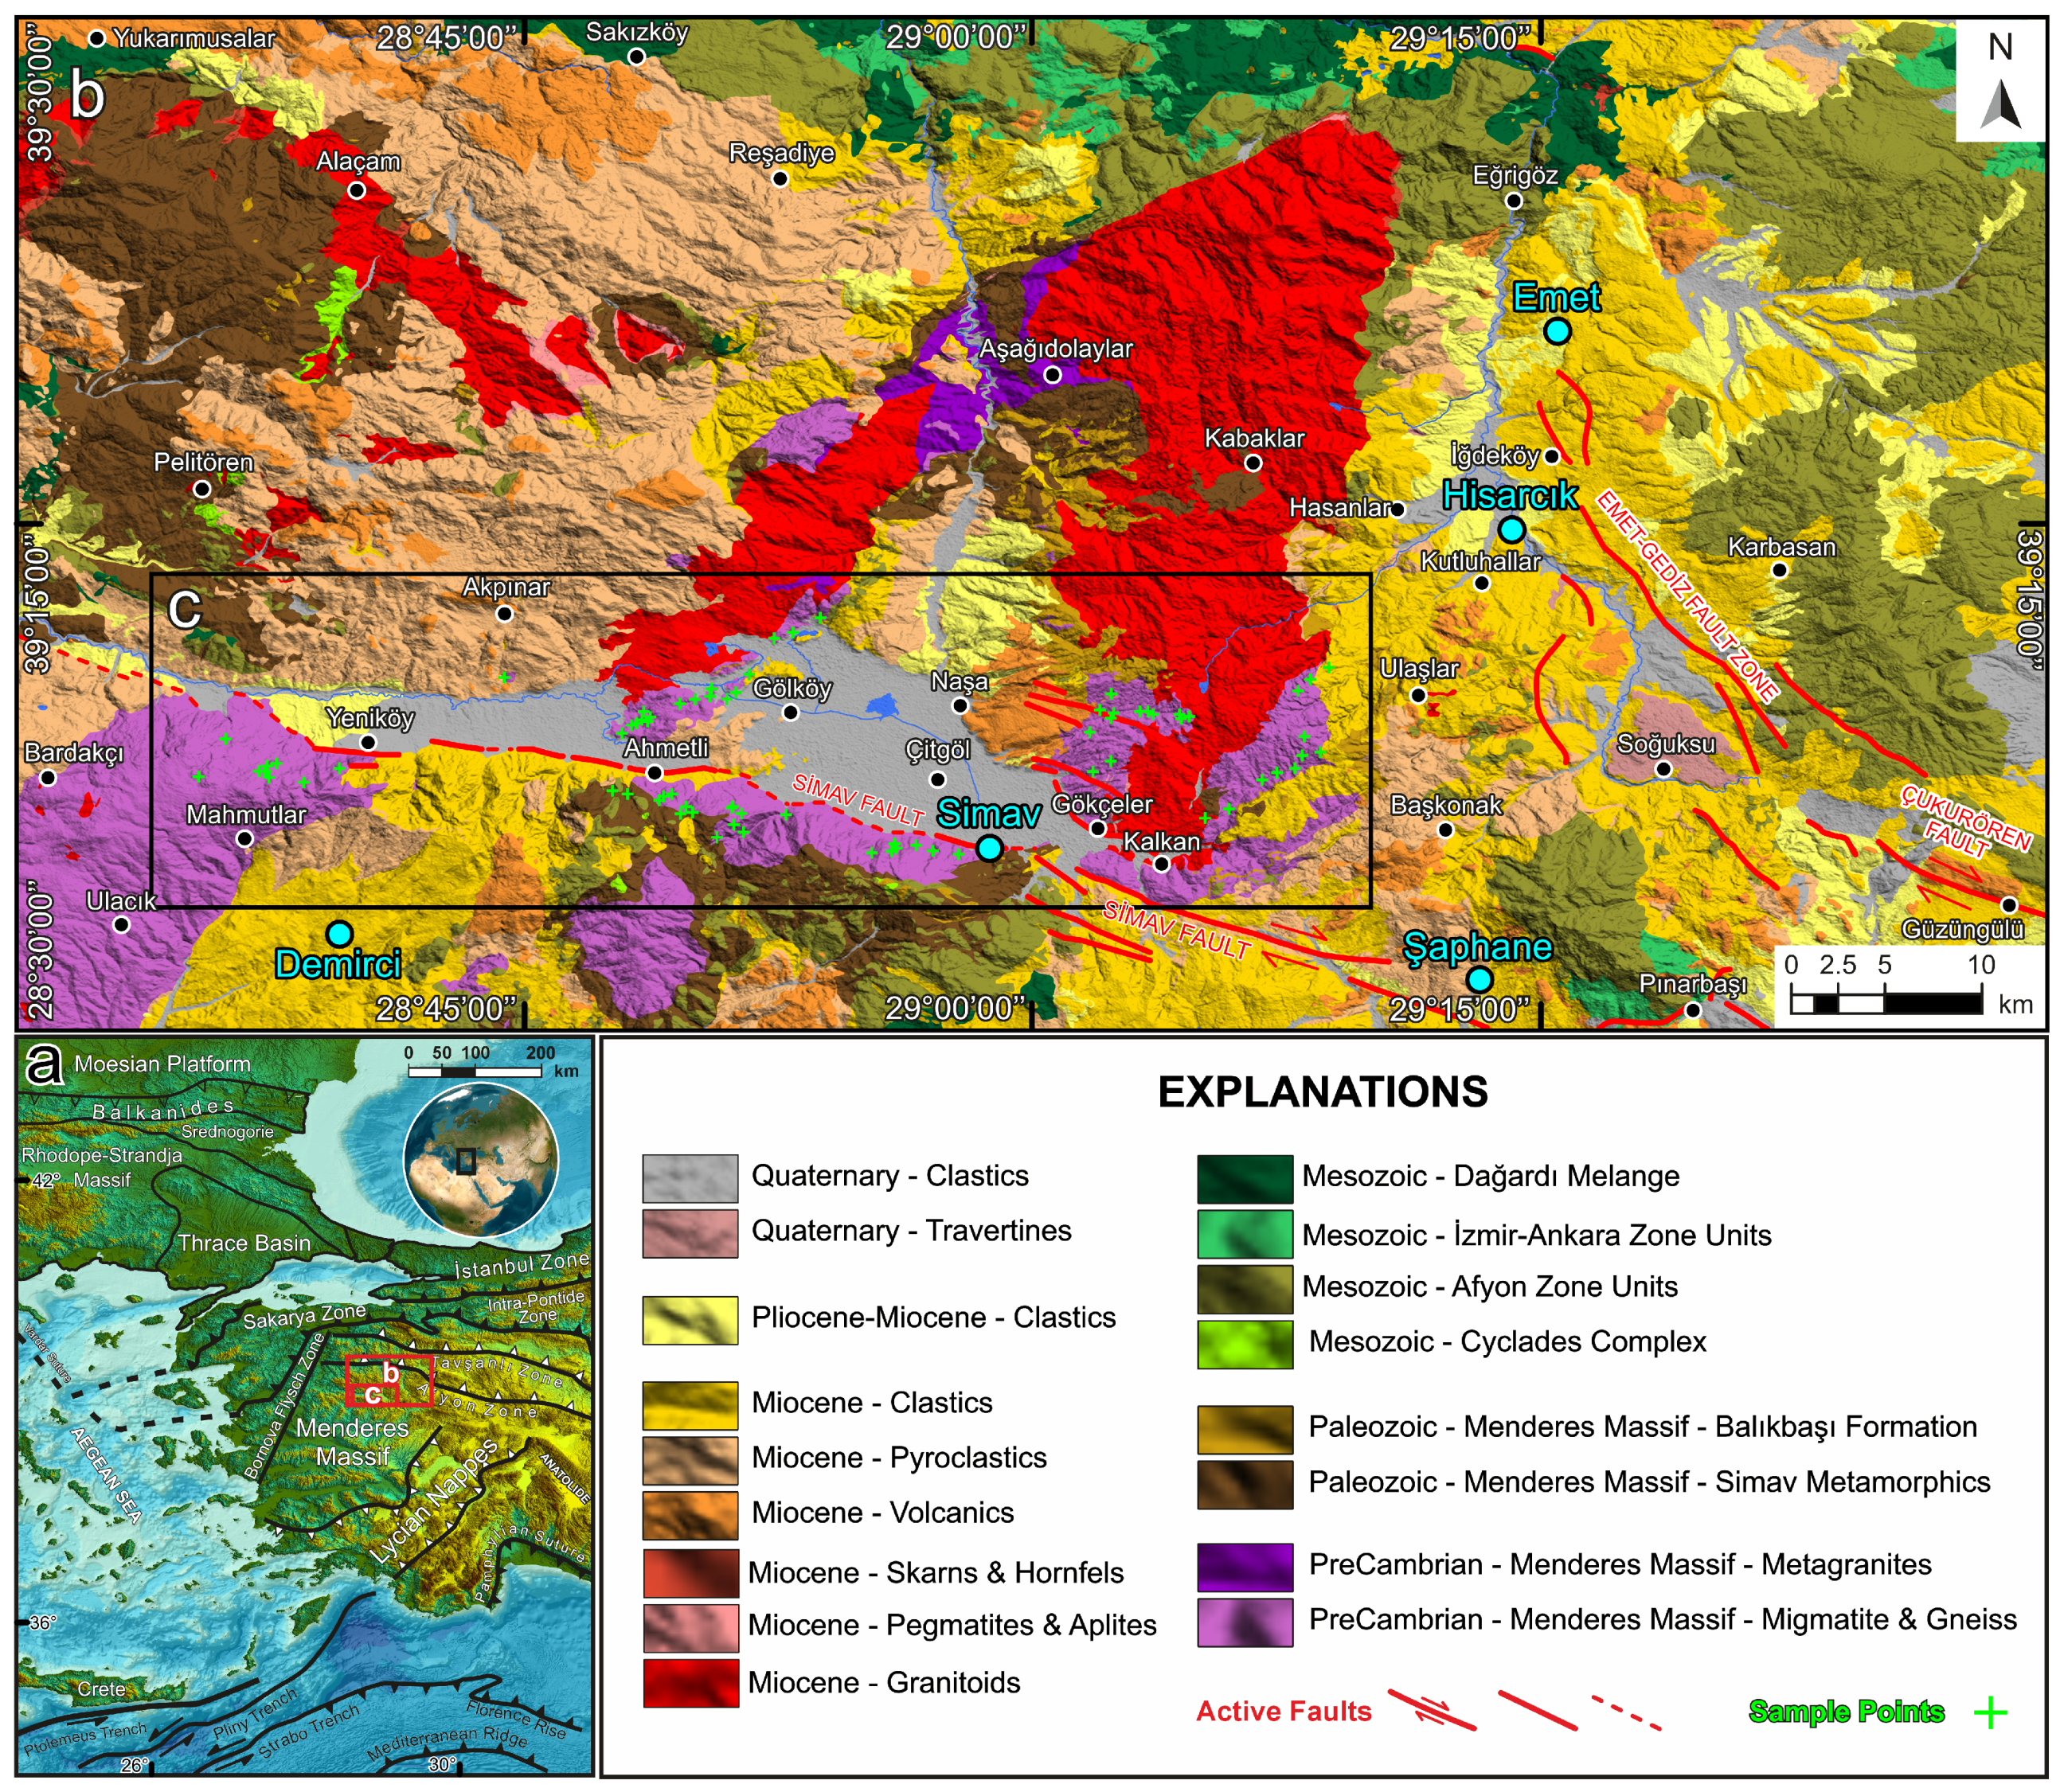
(a) Location of the study area on a regional map, modified from [30] and [31] (b) 1:100,000-scale geological map of the Kütahya J21 and J22 quadrangles, modified from [32,33]. The base elevation data are derived from the Terra Advanced Spaceborne Thermal Emission and Reflection Radiometer (ASTER) Global Digital Elevation Model (GDEM), Version 3, covering the N39E028 and N39E029 grids, with a spatial resolution of approximately 30 meters.
Figure 1.
(a) Location of the study area on a regional map, modified from [30] and [31] (b) 1:100,000-scale geological map of the Kütahya J21 and J22 quadrangles, modified from [32,33]. The base elevation data are derived from the Terra Advanced Spaceborne Thermal Emission and Reflection Radiometer (ASTER) Global Digital Elevation Model (GDEM), Version 3, covering the N39E028 and N39E029 grids, with a spatial resolution of approximately 30 meters.
3. Geological Settings
The geological map and column section of the study area are presented in Figure 1 and Figure 2, respectively. The geothermal energy resources in the Simav Graben, where the study area is located, are associated with lithologies that possess potential for heat generation, in addition to featuring permeable reservoir rocks and impermeable cap rocks essential for geothermal system development [34]. This study focuses on the migmatitic gneisses of the Kalkan Formation, which constitute the basement rocks of the Menderes Massif and exhibit significant potential for RHP. The formation displays depth-dependent brittle and ductile deformation features [35,36], indicating complex tectonometamorphic processes. Normal faults within the basin, along with intersecting transfer faults, are believed to facilitate the upward migration of geothermal fluids. The most lithologically suitable reservoir rocks for hosting geothermal fluids within the basin include the limestones of the Budağan Formation, the marbles of the Balıkbaşı Formation, and quartzite layers within the Simav Metamorphites (Figure 2).
The Budağan Limestone Formation contains interbedded banded schist layers, reflecting a complex depositional and metamorphic history [34,37,38]. The Balıkbaşı Formation is notable for its extensive fracturing and the development of micro- to macro-scale dissolution features, including karstic voids, which significantly enhance its capacity as a geothermal reservoir [33]. Additionally, the quartzite layers within the Simav Metamorphites demonstrate favorable reservoir characteristics due to their structural integrity and permeability [33,34].
The Simav Graben, which cuts across the northern Menderes basins, trends predominantly in a north–south direction and is structurally defined by high-angle normal faults [39]. In the context of geothermal fluid transport within the graben, zones where transfer faults intersect with these high-angle normal faults are of particular significance, as they frequently serve as key conduits for fluid migration. Fault focal mechanism analyses of ongoing seismicity north of Simav further underscore the importance of regions where strike-slip and normal faults converge. These structurally complex zones are likely to enhance the permeability and facilitate the upward migration of geothermal fluids, making them critical targets for exploration.
The Simav Graben is located on the active Simav fault zone, which was formed as a result of the extensional tectonic regime in the northern Menderes Massif region. The approximately east-west trending and north-trending Simav active fault cuts north of the Demirci and Selendi Basins in the NE-SW trending northern Menderes Massif, which was opened in the early Miocene [25,39,40,41].
4. Data Availability
Field sampling was conducted on the migmatitic gneisses within the J21 and J22 quadrangles on the 1:25000-scale geological map (Figure 1). A total 90 rock samples were collected from various locations within the Kalkan Formation. These samples underwent geochemical analysis to determine the concentrations of major oxides, including SiO2, Al2O3, K2O, CaO, MgO, FeO, Fe2O3, TiO2, P2O5, and MnO. The following elements are present in the compound: Cr2O3, BaO, SrO, and trace elements, including Rb, Ni, Nb, Y, Ta, V, W, U, Th, Zr, Pb, Cu, Zn, Mo, Co, Cd, Re, Au, Ag, Hg, Sn, As, Sb, Cl, Se, and S. Magnetic susceptibility measurements were also conducted on these rock samples at both low and high frequencies, resulting in mass-dependent and frequency-dependent magnetic susceptibility values.
Seismic data for the study area between January 1, 1900, and March 27, 2025, were acquired from the Boğaziçi University Kandilli Observatory and Earthquake Research Institute (KOERI) Earthquake Query System1. The earthquake magnitude and frequency distribution is as follows: 0–1 (4,306 events), 1–2 (2,434 events), 2–3 (2,909 events), 3–4 (599 events), 4–5 (104 events), and 5–6 (6 events). Notably, no seismic events exceeding magnitude 6 were recorded in the region during the specified period.
Additionally, the designated study area includes 59 geothermal boreholes, as reported by the General Directorate of Mineral Research and Exploration. Of these, approximately 10 are classified as high-temperature geothermal wells, while the remaining wells fall into the medium- to low-temperature categories.
5. Sample Preparation and Methods
Laboratory analyses were carried out in two main categories including magnetic susceptibility measurements and radioactive heat production assessments.
5.1. Magnetic Susceptibility Measurement
The magnetic susceptibility method is a well-established geophysical technique used to assess the magnetic properties of rocks and sediments. Magnetic susceptibility quantifies the degree to which a material becomes magnetized when exposed to an external magnetic field. This property provides critical insights into the mineralogical composition of geological materials, particularly the presence of magnetic minerals such as magnetite. For example, rocks enriched in ferromagnetic minerals like magnetite typically exhibit high magnetic susceptibility, whereas rocks with low iron oxide content display lower values. In geophysical practice, magnetic susceptibility is expressed either in SI units (m3/kg) or in cgs units (dimensionless), depending on the measurement system and study objectives. These measurements serve as a cost-effective and non-destructive means of characterizing the magnetic and compositional characteristics of subsurface materials [42].
In this study, measurements were conducted using the MS2B sensor of the Bartington device. Rock samples were initially crushed and ground to a grain size of approximately 75 µm using a tungsten carbide vibratory grinder. For measurement purposes, samples were shaped into cylindrical forms with a diameter of approximately 10 mm and a length ranging between 10–20 mm. Prior to measurement, all samples were thoroughly cleaned and dried to eliminate moisture and contaminants that could interfere with the results [42]. Prepared powdered rock samples were placed in 10 cc plastic pots and inserted into the measurement chamber. Readings were taken at both low (0.47 kHz) and high (4.7 kHz) frequencies, with a sensitivity of 0.1 SI units. To determine the mass-specific magnetic susceptibility, the measured magnetic susceptibility values, , were normalized by the corresponding sample densities, , following the approach outlined by Dearing et al.[42],
The percent frequency-dependent magnetic susceptibility, %, is derived from the values obtained from Eq. 1 through
The mass-specific and frequency-dependent magnetic susceptibility, , is calculated using the values obtained from Eq.1, along with the density,
5.2. Radioactive Heat Production (RHP)
Radioactive heat generation is the process by which heat energy is released through the decay of radioactive isotopes (e.g., uranium (U), thorium (Th), potassium (K)) in rock-forming minerals. This form of heat production plays a critical role in assessing the geothermal energy potential of a region.
In this study, RHP potential was determined using X-ray fluorescence, XRF, measurements. The activity concentrations of radioactive isotopes present in the sample can be derived from these elemental values, which in turn are used to estimate the RHP of the samples. The spatial distributions of U, Th, and K are presented in Figure 3. As shown in the figure, the eastern part of the Simav district exhibits higher concentrations and greater variability in U, Th, and K compared to the western region, which is dominated by migmatitic rocks. Notably, Th concentrations are significantly elevated in the eastern region, while they remain consistently low in the western part of the study area.
The RHP potential at the sampling sites can be estimated using the isotope concentrations and the correlative relationships given in Eq.4. In these expressions, RHP represents the amount of heat energy released per unit volume of the sample as a result of the radioactive decay of isotopes. Based on data from 90 sampling locations, these relationships yielded RHP values with a coefficient of determination, R2, of 1.00 and root mean square error, RMSE, values ranging from 0.01 to 0.04 Wkg−1. These results indicate that any of the listed expressions can be reliably applied to estimate RHP in the study region.
We applied the expression by [13] to estimate the spatial distribution of RHP across the region, as shown in Figure 4. The results indicate that geothermal potential is predominantly concentrated in the eastern part of the study area, with a smaller hotspot located in the north-northwestern region. These findings serve as a basis for evaluating the predictive accuracy of both statistical and AI-based models in identifying potential geothermal sites.
In estimating RHP potential across the study area using statistical and AI-based models, we also incorporated variables related to magnetic susceptibility, along with seismic velocities. Although these parameters are not included in the RHP expressions in Eq. 4, they were incorporated into the clustering analysis due to observed correlations between tectonic activity, seismic characteristics, and changes in the temperature and discharge rates of geothermal springs [43,44]. The Simav region is located within the extensional tectonic regime of Western Turkey and is characterized by intense neotectonic activity. The area is structurally controlled by normal faults that trend NE–SW and strike-slip faults that trend NW–SE. The Simav Fault Zone is one of the primary active tectonic structures responsible for both the regional deformation and the development of geothermal systems in the area [43].
As discussed in Section 3, the geothermal systems in the Simav Basin are closely linked to active fault zones. These faults act as conduits for the upward migration of deep hydrothermal fluids. The presence of elevated heat flow and surface hot springs near fault intersections strongly support for this structural control. Notably, the increase in seismic activity since 2000 indicates ongoing tectonic deformation, which further facilitates fluid circulation within the geothermal reservoirs [44].
A notable example of this tectonic–geothermal interaction was observed during the Mw=5.8 earthquake that occurred on May 19, 2011, in the Simav region. Post-earthquake geophysical and hydrogeological observations revealed significant changes in the temperature and discharge rates of several geothermal springs, suggesting a dynamic link between seismicity and geothermal fluid pathways [45].
6. Cluster Analysis Using Statistical and Unsupervised Artificial Intelligence Models
The RHP estimates obtained using Eq. 4 do not account for the effects of magnetic susceptibility and seismic velocity, both of which directly influence RHP, as discussed in Section 5.2. To address this, we applied three statistical models and three unsupervised artificial intelligence (AI) models to identify clusters of the most favorable sites for geothermal energy exploration in the study region. The models used magnetic susceptibility, seismic velocity, and geochemical variables as input features for clustering. All features were normalized. This is a critical step, as some algorithms, such as KMeans, are sensitive to the scale of the data. Normalization also helps prevent features with larger ranges from dominating the clustering process. The target variable is RHP, which does not require standardization.
For the statistical models, we applied Principal Component Analysis (PCA) to reduce the dimensionality of the feature set while preserving as much variance as possible. PCA achieves this by projecting the data into a lower-dimensional space; in our case, the feature space was reduced to two principal components. All statistical models were applied using the PCA-transformed variables.
We then used the Elbow method to determine the optimal number of clusters. The elbow point, identified in the inertia plot, marking where the rate of decrease in inertia begins to level off. This method indicated that four clusters were optimal for our analysis. The identified optimal number of clusters was used as an input parameter for the statistical and AI models.
We used the Silhouette Score and Davies-Bouldin Index to evaluate the quality of clustering results. The Silhouette Score measures how similar a data point is to its own cluster (cohesion) compared to other clusters (separation). It lies in the range of 1≤ Silhouette Score ≤1, where negative values indicate possible misclassification, 0 suggested overlapping clusters, and values closer to 1 reflect well-separated and compact clusters. The Davies-Bouldin Index evaluates clustering quality by measuring the average similarity between each cluster. Its value is always zero or positive, where lower values represent tight, well-separated clusters, while higher values represent loose clustering.
We used the commonly applied K-Means clustering method [46] as the baseline. However, it resulted in a Silhouette Score of -0.112 and a Davies-Bouldin Index of 6.129, indicating poor clustering quality and significant misclassification. Consequently, the K-Means method was excluded from further consideration.
Among the statistical models chosen, unlike many traditional clustering algorithms, Density-Based Spatial Clustering of Applications with Noise (DBSCAN) [47] does not require the user to predefine the number of clusters. It can identify clusters of arbitrary shape and is especially effective for geospatial data or datasets with varying densities. It works by grouping together closely packed points, those in high-density regions, while labeling points in low-density areas as noise or outliers.
The second statistical clustering model used in the analysis is the Gaussian Mixture Model (GMM) [48]. Unlike K-Means, which assigns each data point to exactly one cluster, GMM provides a probabilistic approach, allowing data points to belong to multiple clusters with varying probabilities. This flexibility makes GMM particularly effective for identifying complex, overlapping clusters with different shapes, sizes, and densities. The model employs the Expectation-Maximization algorithm to iteratively estimate the parameters of the underlying Gaussian distributions, enabling more nuanced clustering compared to hard-assignment methods like K-Means.
The third statistical clustering model used in our analysis is the Agglomerative Clustering Model (ACM). Agglomerative clustering is a hierarchical clustering technique that constructs clusters by iteratively merging the closest pairs of data points or existing clusters. It does not require the number of clusters to be specified in advance. Furthermore, agglomerative clustering is capable of identifying clusters with complex shapes and structures, as it does not assume any predefined cluster geometry.
In addition to the statistical models, we used three AI-based methods, including Autoencoder-based Deep Clustering, Self-Organizing Maps, and Deep Embedded Clustering to detect complex patterns and clusters that traditional algorithms like KMeans often fail to capture, particularly in cases involving non-spherical or highly overlapping clusters. The autoencoder-based deep clustering (ADC) [49] combines unsupervised learning with deep neural networks to extract meaningful features from the data. An autoencoder first compresses the input into a low-dimensional latent space that captures essential data structures. KMeans is then applied to this compact representation. The model iteratively refines both the learned features and the cluster assignments, enhancing clustering accuracy by aligning the feature space with the clustering objective.
The second AI-based clustering model used in the analysis is the Self-Organizing Map (SOM) [50], which is based on artificial neural networks. SOMs are particularly well-suited for visualizing and clustering high-dimensional data by projecting it onto a low-dimensional (typically 2D) grid. The algorithm organizes input data based on similarity so that neighboring nodes (or neurons) on the grid respond similarly to similar inputs. This spatial organization makes SOMs highly effective for identifying underlying structures and patterns in complex datasets.
Another AI-based clustering model used in the analysis Deep Embedded Clustering (DEC) [51] is an advanced clustering method that integrates deep learning with unsupervised clustering. It begins by using an autoencoder to learn a compact, low-dimensional representation of the input data, capturing complex, nonlinear patterns. Unlike traditional clustering methods that operate on raw data or fixed features, DEC simultaneously refines both the feature space and the cluster assignments through iterative optimization. It uses a soft assignment approach, using a Student’s t-distribution, to assign data points to clusters probabilistically. This joint learning framework enables DEC to perform especially well on high-dimensional and complex datasets, where conventional clustering algorithms often struggle.
Clustering results for the analysis of potential geothermal sites from each model are shown in Figure 6, and the corresponding clustering metrics are presented in Table 1. When earthquake epicenters, production drilling sites, and the Eynal hot spring, formed by hot water redirected from nearby drilling are overlaid with the clustering results, overlapping zones of the clusters designate the most promising geothermal energy locations. Among all the clustering models, DBSCAN and ADC identified the most narrowly defined overlapping areas as potential geothermal zones, effectively enclosing the existing drilling sites and thermal springs, located near the seismically active regions.
7. Discussion and Results
During the formation of metamorphic rocks, variations in environmental conditions, such as pressure, temperature, and fluid activity, can lead to changes in the concentrations of naturally occurring radioactive elements. As a result, the diversity and abundance of these radioelements may vary depending on the composition of the original source rock that formed the migmatite, as well as the specific metamorphic processes and stages it experienced. These variations in radioelement concentrations can provide valuable indicators of a region’s geothermal energy potential. Migmatites typically form near the base of the crust through partial melting, a process that facilitates the mobilization and redistribution of minerals, including radioactive elements, within the rock.
In the study region, spatial variations in K (wt.%), Th (ppm), and U (ppm) concentrations reveal that zones with elevated K and Th levels in migmatitic rocks are closely associated with known geothermal activity. K concentrations range from 0.002 to 8.164 wt.%, Th values from 1 to 65 ppm, and U concentrations from 0.50 to 15 ppm (Figure 3). These variations were observed in migmatite samples collected near geothermal wells drilled by the General Directorate of Mineral Research and Exploration in the Simav region. The spatial association between high radioelement concentrations in migmatitic gneisses and geothermal activity suggests a strong geothermal energy potential in the area.
Radioactive heat production (RHP), an indicator of geothermal energy potential, was estimated using the first expression in Eq. 4, as the differences among the available formulations were found to be negligible. The estimation, based on the measured spatial distribution of K, U, and Th concentrations, was used to identify areas with high geothermal energy potential and the resulting spatial distribution of RHP is shown in Figure 4. The RHP values in the study area range from 0.291 to 6.784 µWkg−1. RHP values exceeding 2.0 µWkg−1 are generally considered indicative of significant heat producing rocks [16,18]. In the study area, migmatites with RHP values exceeding this threshold are primarily concentrated in the eastern region, in close proximity to seismically active zones. This spatial association suggests that these migmatites may represent the primary heat-producing lithology contributing to the region’s geothermal energy potential.
The expressions provided in Eq. 4, and hence the resultant geothermal potential assesssment, do not account for the influence of magnetic susceptibility, specifically, low- and high-frequency dependent and mass-specific magnetic susceptibility, despite the relevance of these parameters in evaluating the region’s RHP potential. To address this, we analyzed magnetic susceptibility from laboratory measurements of rock samples collected across the study area. As shown in Figure 5, the green, red, and purple regions represent areas with high magnetic susceptibility, while yellow and blue regions indicate lower values. Notably, zones with elevated magnetic susceptibility correspond with mineral-rich areas and locations where geothermal energy is actively utilized. This is likely due to the dissolution of minerals in the presence of hot water and their subsequent interactions under elevated temperatures. Elevated magnetic susceptibility values observed in areas of hydrothermal alteration suggest that geothermal processes enhance mineral transformations. These findings contribute to a more comprehensive understanding of the geothermal potential of the study area.
Moreover, RHP-based assessment of geothermal energy potential in Eq. 4 does not account for the effect of the primary seismic waves (P-wave) velocity, . However, the relationship between and RHP, as demonstrated by Rybach and Buntebarth [18], provides valuable insights for both geothermal system identification and the interpretation of seismotectonic processes. Low values are typically associated with increased fracture density, high porosity, and advanced hydrothermal alteration, features commonly found in high-RHP geothermal regions and seismically active fault zones. In geothermal environments, elevated heat flow and hydrothermal alteration reduce the elastic properties of rocks, resulting in lower values and seismic wave anomalies. These low zones also influence the mechanical behavior of fault systems, potentially facilitating earthquake occurrence. Therefore, the frequent seismic activity observed in geothermal areas with low values may reflect elevated geothermal potential and active tectonic deformation that facilitates the upward migration of hydrothermal fluids. Consequently, anomalies serve as valuable geophysical indicators for delineating brittle zones in the crust and assessing geothermal energy potential, as they are often associated with regions of high thermal output and increased seismicity.
Statistical and unsupervised AI models allow for the integration of all measured chemical elements, beyond U, Th, and K, along with magnetic susceptibility and P-wave velocity data, and RHP estimates, enabling a more effective identification of areas with geothermal energy potential. Among the statistical models evaluated, DBSCAN demonstrated the strongest predictive performance by identifying a narrow, well-defined wedge-shaped zone formed by overlapping clusters. This zone encompasses majority of the production drilling sites as well as thermal springs, which are sustained by discharge from production wells.
Among the AI models, ADC emerged as the most promising unsupervised method. It identified a relatively compact overlapping cluster zone, also enclosing the drilling sites near the seismically active portion of the study area. Notably, while DBSCAN excluded the Ahmetli region as a potential geothermal zone, ADC included it within its prediction. Future exploratory drilling in the Ahmetli area could serve as a valuable validation step to assess and compare the predictive reliability of DBSCAN and ADC.
Overall, the potential geothermal zones identified based on RHP values calculated using Eq. 4, derived from U, TH, and K concentrations, are generally consistent with the results obtained from DBSCAN and ADC models. However, the statistical and AI-based models delineated more localized and narrowly defined zones. These narrower zones result from the inclusion of additional variables, especially magnetic susceptibility measures and seismic velocities, that were not considered in the RHP formulations but were integrated into the clustering analyses.
8. Conclusion
Correlative relationships, given in Eq. 4, based on the concentrations of radioactive elements, U, Th, and K, and radioactive heat production (RHP) were used to identify potential geothermal sites across the study area. This analysis revealed three distinct zones within the Simav Basin: western, central, and eastern regions. Migmatitic gneisses from the eastern region, where geothermal energy is actively exploited, exhibited RHP values exceeding 2.0 µWkg−1, whereas the central and western regions showed values below this threshold. Thus, based on field and laboratory analysis, the eastern region neear demonstrates a higher potential for geothermal energy production. Notably, this area is located closer to seismically active zones, where recent earthquake magnitudes have exceeded 4.
Statistical and unsupervised artificial intelligence (AI) models enabled the integration of magnetic susceptibility and seismic characteristics alongside concentrations of radioactive and other chemical elements. Among the statistical approaches, Density-Based Spatial Clustering of Applications with Noise (DBSCAN) effectively delineated a narrow, well-defined, wedge-shaped zone, formed by overlapping clusters, that marks the most favorable subregion for further geothermal exploration and potential production. Similarly, the Autoencoder-based Deep Clustering (ADC) model emerged as the most promising AI method for narrowing the search area for geothermal resources. Notably, the subregions identified by both DBSCAN and ADC encompass the existing geothermal production wells and thermal springs, which were not included as model features but served as independent validation. Although these identified zones are more spatially constrained, they align well with geothermally favorable areas previously identified through field investigations and laboratory analyses.
Our results demonstrate that, unlike traditional correlative approaches, statistical and unsupervised AI models can incorporate magnetic and seismic data to more effectively narrow down potential geothermal exploration zones, providing time and cost savings. In both modeling approaches, the zones formed by the overlap of all clusters consistently highlighted the most favorable subregions for geothermal energy production. The outcomes from the AI models were found to be comparable to those from the statistical models, suggesting that both approaches should be evaluated in conjunction to enhance reliability. Future drilling of exploration wells and additional sampling across the study area will be valuable for validating the clustering accuracy of each model against the other.
Acknowledgments
This study is part of the first author’s Ph.D. dissertation. The authors gratefully acknowledge the support of the Council of Higher Education 100/2000 (YÖK 100/2000) and the Society of Exploration Geophysicists (SEG) for their scholarship funding. Additional support was provided by the Pamukkale University Scientific Research Projects Unit (Project No: 2021FEBE042), Zorlu Energy Company, and the Zorlu Energy Geochemistry Department, with special thanks to Geological Engineer (M.Sc.) Raziye Şengün Çetin. The authors also extend their appreciation to the Governorship of Kütahya, the Kütahya Special Provincial Administration, and the Simav Municipality. Gratitude is further extended to the General Directorate of Mineral Research and Exploration – Energy Raw Material Survey and Exploration Department – Geothermal Reservoir Exploration and Protection Areas Unit, and to Dr. Nilgün Doğdu for her valuable contributions.
Conflicts of Interest
The authors declare no conflict of interest.
Abbreviations
Commonly used abbreviations in the paper:
| ACM | Agglomerative Clustering Model |
| ADC | Autoencoder-based Deep Clustering |
| AI | Artificial Intelligence |
| DBSCAN | Density-Based Spatial Clustering of Applications with Noise |
| DEC | Deep Embedded Clustering |
| GMM | Gaussian Mixture Model |
| PCA | Principal Component Analysis |
| RHP | Radioactive Heat Production |
| SOM | Self-Organizing Map |
References
- Nkinyam, C.M.; Ujah, C.O.; Asadu, C.O.; Kallon, D.V. Exploring geothermal energy as a sustainable source of energy: A systemic review. Unconventional Resources 2025, 6, 100149. [Google Scholar] [CrossRef]
- Ouerghi, F.H.; Omri, M.; Nisar, K.S.; Abd El-Aziz, R.M.; Taloba, A.I. Investigating the potential of geothermal energy as a sustainable replacement for fossil fuels in commercial buildings. Alexandria Engineering Journal 2024, 97, 215–229. [Google Scholar] [CrossRef]
- Kanoğlu, M.; Çengel, Y.A. Economic evaluation of geothermal power generation, heating, and cooling. Energy 1999, 24, 501–509. [Google Scholar] [CrossRef]
- Pazuki, M.M.; Kolahi, M.R.; Ebadollahi, M.; Amidpour, M. Enhancing efficiency in an innovative geothermal poly-generation system for electricity, cooling, and freshwater production through integrated multi-objective optimization: A holistic approach to energy, exergy, and enviroeconomic effects. Energy 2024, 313, 133862. [Google Scholar] [CrossRef]
- Vitorello, I.; Pollack, H.N. On the variation of continental heat flow with age and the thermal evolution of continents. Journal of Geophysical Research: Solid Earth 1980, 85, 983–995. [Google Scholar] [CrossRef]
- Cuney, M. Uranium and Thorium: The Extreme Diversity of the Resources of the World’s Energy Minerals. In Non-renewable Resource Issues; Sinding-Larsen, R., Wellmer, F.W., Eds.; Springer: Dordrecht, 2012; pp. 1–252. [Google Scholar] [CrossRef]
- Bruhn, D.; Manzella, A.; Vuataz, F.; Faulds, J.; Moeck, I.; Erbas, K. Exploration methods. Geothermal energy systems: exploration, development, and utilization 2010, pp. 37–112.
- Kana, J.D.; Djongyang, N.; Raïdandi, D.; Nouck, P.N.; Dadjé, A. A review of geophysical methods for geothermal exploration. Renewable and Sustainable Energy Reviews 2015, 44, 87–95. [Google Scholar] [CrossRef]
- AlGaiar, M.; Hossain, M.; Petrovski, A.; Lashin, A.; Faisal, N. Applications of artificial intelligence in geothermal resource exploration: A review. Deep Underground Science and Engineering 2024, 3, 269–285. [Google Scholar] [CrossRef]
- Aden, A.H. Hydrothermal Reservoir and Electrical Anisotropy Investigated by Magnetotelluric Data, Case Study of Asal Rift, Republic of Djibouti. Applied Sciences 2023, 13. [Google Scholar] [CrossRef]
- AlGaiar, M.; Hossain, M.; Petrovski, A.; Lashin, A.; Faisal, N. Applications of artificial intelligence in geothermal resource exploration: A review. Deep Underground Science and Engineering 2024, 3, 269–285. [Google Scholar] [CrossRef]
- Duan, Y.; Liang, Y.; Ji, Q.; Wang, Z. A Machine Learning Approach for the Clustering and Classification of Geothermal Reservoirs in the Ying-Qiong Basin. Journal of Marine Science and Engineering 2025, 13. [Google Scholar] [CrossRef]
- Birch, F. Heat from radioactivity. Nuclear geology 1954, 148, 174. [Google Scholar]
- Hamza, V.e.; Beck, A. Terrestrial heat flow, the neutrino problem, and a possible energy source in the Core. Nature 1972, 240, 343–344. [Google Scholar] [CrossRef]
- Emsley, J. The elements: Oxford University Press. New York 1998, p. p300.
- Rybach, L. Radioactive heat production in rocks and its relation to other petrophysical parameters. Pure and Applied Geophysics 1976, 114, 309–317. [Google Scholar] [CrossRef]
- Rybach, L. Determination of heat production rate. Handbook of terrestrial heat-flow density determination 1988, 4, 125–142. [Google Scholar]
- Rybach, L.; Buntebarth, G. Relationships between the petrophysical properties density, seismic velocity, heat generation, and mineralogical constitution. Earth and Planetary Science Letters 1982, 57, 367–376. [Google Scholar] [CrossRef]
- Ilkişik, O.M. Regional heat flow in western Anatolia using silica temperature estimates from thermal springs. Tectonophysics 1995, 244, 175–184. [Google Scholar] [CrossRef]
- Uyanık, N.A.; Kurt, H.B.; Uyanık, O. Potansiyel jeotermal kaynaklar için radyojenik ısı üretiminden sıcak kuru kayanın belirlenmesi ve Isparta-Yakaören örneği. Pamukkale Üniversitesi Mühendislik Bilimleri Dergisi 2020, 26, 1170–1177. [Google Scholar] [CrossRef]
- Uyanık, N.A.; Öncü, Z.; Uyanık, O.; Bozcu, M. Determination of alteration zones and geological unit limits using natural radioactivity properties of Sandıklı-Suhut areas. Journal of Applied Geophysics 2022, 196, 104525. [Google Scholar] [CrossRef]
- Hasozbek, A.; Satir, M.; Erdogan, B.; Akay, E.; Siebel, W. Magmatic evolution of the northwestern edge of Tauride-Anatolide Platform: geochronological and isotopic implications. Geochimica et Cosmochimica Acta Supplement 2009, 73, A499. [Google Scholar]
- Hasözbek, A.; Akay, E.; Erdoğan, B.; Satır, M.; Siebel, W. Early Miocene granite formation by detachment tectonics or not? A case study from the northern Menderes Massif (Western Turkey). Journal of Geodynamics 2010, 50, 67–80. [Google Scholar] [CrossRef]
- Hasözbek, A.; Satır, M.; Erdoğan, B.; Akay, E.; Siebel, W. Early Miocene post-collisional magmatism in NW Turkey: geochemical and geochronological constraints. International Geology Review 2011, 53, 1098–1119. [Google Scholar] [CrossRef]
- Ersoy, Y.E.; Helvacı, C.; Palmer, M.R. Stratigraphic, structural and geochemical features of the NE–SW trending Neogene volcano-sedimentary basins in western Anatolia: implications for associations of supra-detachment and transtensional strike-slip basin formation in extensional tectonic setting. Journal of Asian Earth Sciences 2011, 41, 159–183. [Google Scholar] [CrossRef]
- Catlos, E.; Jacob, L.; Oyman, T.; Sorensen, S. Long-term exhumation of an Aegean metamorphic core complex granitoids in the Northern Menderes Massif, western Turkey. American Journal of Science 2012, 312, 534–571. [Google Scholar] [CrossRef]
- Cenki-Tok, B.; Expert, M.; Işık, V.; Candan, O.; Monié, P.; Bruguier, O. Complete Alpine reworking of the northern Menderes Massif, western Turkey. International Journal of Earth Sciences 2016, 105, 1507–1524. [Google Scholar] [CrossRef]
- Gemici, Ü.; Tarcan, G. Distribution of boron in thermal waters of western Anatolia, Turkey, and examples of their environmental impacts. Environmental Geology 2002, 43, 87–98. [Google Scholar] [CrossRef]
- Karakuş, H.; Özkul, C.; Ergüler, Z.A.; Kibici, Y.; Yanık, G. Geothermal Resource Estimation of the Simav Field Using Monte Carlo Simulation. Pamukkale University Journal of Engineering Sciences 2017, 23, 323–329. [Google Scholar] [CrossRef]
- Okay, A.I.; Tüysüz, O. Tethyan sutures of northern Turkey. Geological Society, London, Special Publications 1999, 156, 475–515. [Google Scholar] [CrossRef]
- Barbot, S.; Weiss, J. Connecting subduction, extension and shear localization across the Aegean Sea and Anatolia. Geophysical Journal International 2021, 226, 422–445. [Google Scholar] [CrossRef]
- Akdeniz, N.; Konak, N. Geology of Simav-Tavşanlı-Emet-Dursunbey areas. General Directorate of Mineral Research and Exploration, Ankara, (in Turkish).
- Bilgiç, T. 1/100,000 Scale Kütahya - J21 Quadrangle, Turkey Geological Maps Series, No: 248. General Directorate of Mineral Research and Exploration, Ankara, 1–18 (in Turkish).
- Doğdu, N.; Aydoğdu, O.; Şahan, M.; Akar, M.; Duran, Y. Simav Municipality Kütahya-Simav-Eynal geothermal area 14–18 corporate consultancy studies technical inspection report. Technical report, General Directorate of Mineral Research and Exploration, Ankara, 2019. in Turkish, unpublished. 20 December.
- Işık, V.; Seyitoğlu, G.; Cemen, I. Ductile–brittle transition along the Alaşehir detachment fault and its structural relationship with the Simav detachment fault, Menderes massif, western Turkey. Tectonophysics 2003, 374, 1–18. [Google Scholar] [CrossRef]
- Işık, V. Kuzey Menderes Masifinde Simav Makaslama Zonunun Mikro-tektonik Özellikleri, Batı Anadolu, Türkiye. Türkiye Jeoloji Bülteni 2004, 47, 49–91. [Google Scholar]
- Kaya, O. Tavşanlı Yöresi’Ofiolit’Sorununun Ana Çizgileri. Türkiye Jeoloji Bülteni 1972, 15, 26–108. [Google Scholar]
- Akdeniz, N.; Konak, N. The rock units of the Simav region of Menderes Massive and the situation of metabazic and metaultramafic rocks. Bulletin of the Geological Society of Turkey 1979, 22, 175–184. [Google Scholar]
- Seyitoğlu, G. The Simav Graben: An example of young E-W trending structures in the Late Cenozoic extensional system of Western Turkey. Turkish Journal of Earth Sciences 1997, 6, 135–141. [Google Scholar] [CrossRef]
- Bozkurt, E. Origin of NE-trending basins in western Turkey. Geodinamica acta 2003, 16, 61–81. [Google Scholar] [CrossRef]
- Ersoy, Y.E.; Helvacı, C.; Sözbilir, H. Tectono-stratigraphic evolution of the NE–SW-trending superimposed Selendi basin: Implications for late Cenozoic crustal extension in Western Anatolia, Turkey. Tectonophysics 2010, 488, 210–232. [Google Scholar] [CrossRef]
- Dearing, J.A.; Dann, R.J.L.; Hay, K.; Lees, J.A.; Loveland, P.J.; Maher, B.A.; O’Grady, K. Frequency-dependent susceptibility measurements of environmental materials. Geophysical Journal International 1996, 124, 228–240. [Google Scholar] [CrossRef]
- Bozkurt, E. Neotectonics of Turkey—a synthesis. Geodinamica Acta 2001, 14, 3–30. [Google Scholar] [CrossRef]
- Kose, R. Geothermal energy potential for power generation in Turkey: A case study in Simav, Kutahya. Renewable and Sustainable Energy Reviews 2007, 11, 497–511. [Google Scholar] [CrossRef]
- Emre, O.; Duman, T.Y.; Özalp, S.; Elmacı, H.; Olgun, Ş. Active Fault Map of Turkey; General Directorate of Mineral Research and Exploration (MTA), Special Publication Series: Ankara, Turkey, 2013. [Google Scholar]
- Lloyd, S. Least squares quantization in PCM. IEEE Transactions on Information Theory 1982, 28, 129–137. [Google Scholar] [CrossRef]
- Ester, M.; Kriegel, H.P.; Sander, J.; Xu, X. A density-based algorithm for discovering clusters in large spatial databases with noise. Proceedings of the Second International Conference on Knowledge Discovery and Data Mining (KDD-96). AAAI Press, 1996, pp. 226–231.
- Dempster, A.P.; Laird, N.M.; Rubin, D.B. Maximum likelihood from incomplete data via the EM algorithm. Journal of the Royal Statistical Society: Series B (Methodological) 1977, 39, 1–22. [Google Scholar] [CrossRef]
- Leiber, C.; Miklautz, L.; Plant, C.; Böhm, C. An Introductory Survey to Autoencoder-Based Deep Clustering: Sandboxes for Combining Clustering with Deep Learning. arXiv preprint arXiv:2504.02087 2025. [CrossRef]
- Kohonen, T. Self-organized formation of topologically correct feature maps. Biological Cybernetics 1982, 43, 59–69. [Google Scholar] [CrossRef]
- Xie, J.; Girshick, R.; Farhadi, A. Unsupervised deep embedding for clustering analysis. Proceedings of the 33rd International Conference on International Conference on Machine Learning (ICML). PMLR, 2016, pp. 478–487.
| 1 |
Figure 2.
A stratigraphic column of the Simav Basin (not to scale), adapted from Burçak et al. [34] was developed using data from [33] to construct the geological section.
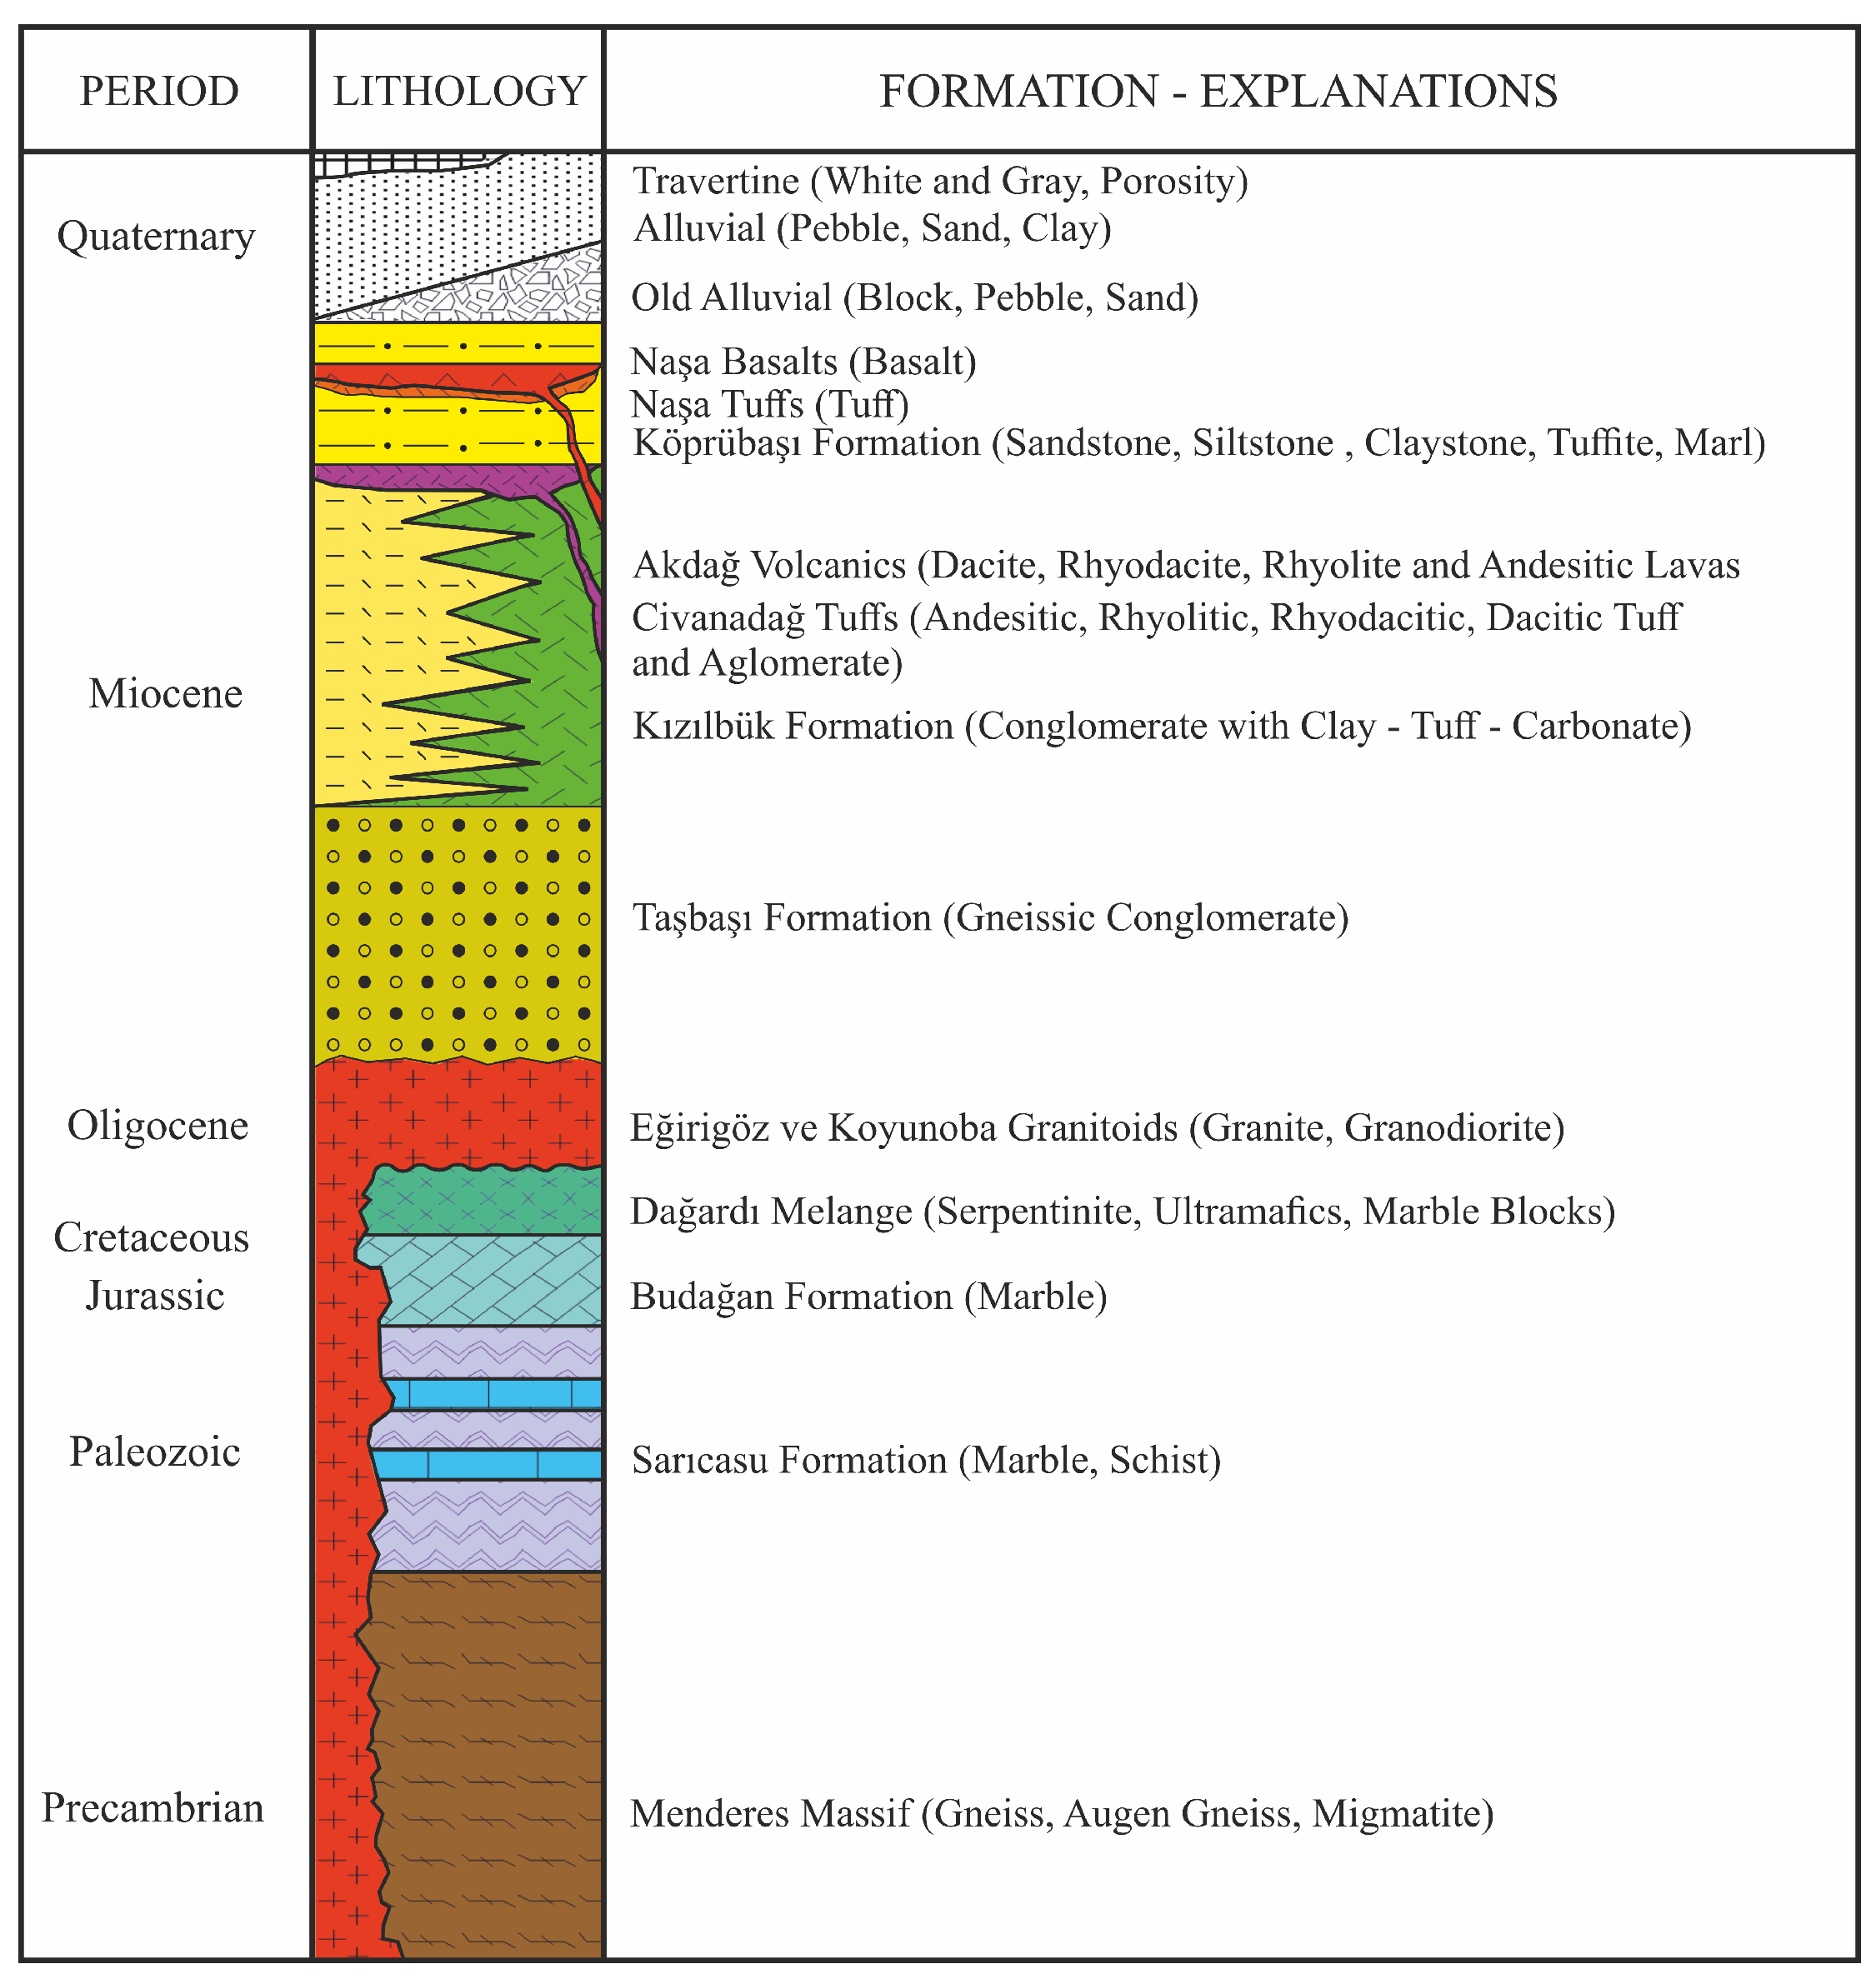
Figure 3.
Spatial distributions of the radioactive elements potassium (K), thorium (Th), and uranium (U), obtained from sampling points across the study area, were utilized to estimate the corresponding distribution of radioactive heat production (RHP).
Figure 3.
Spatial distributions of the radioactive elements potassium (K), thorium (Th), and uranium (U), obtained from sampling points across the study area, were utilized to estimate the corresponding distribution of radioactive heat production (RHP).
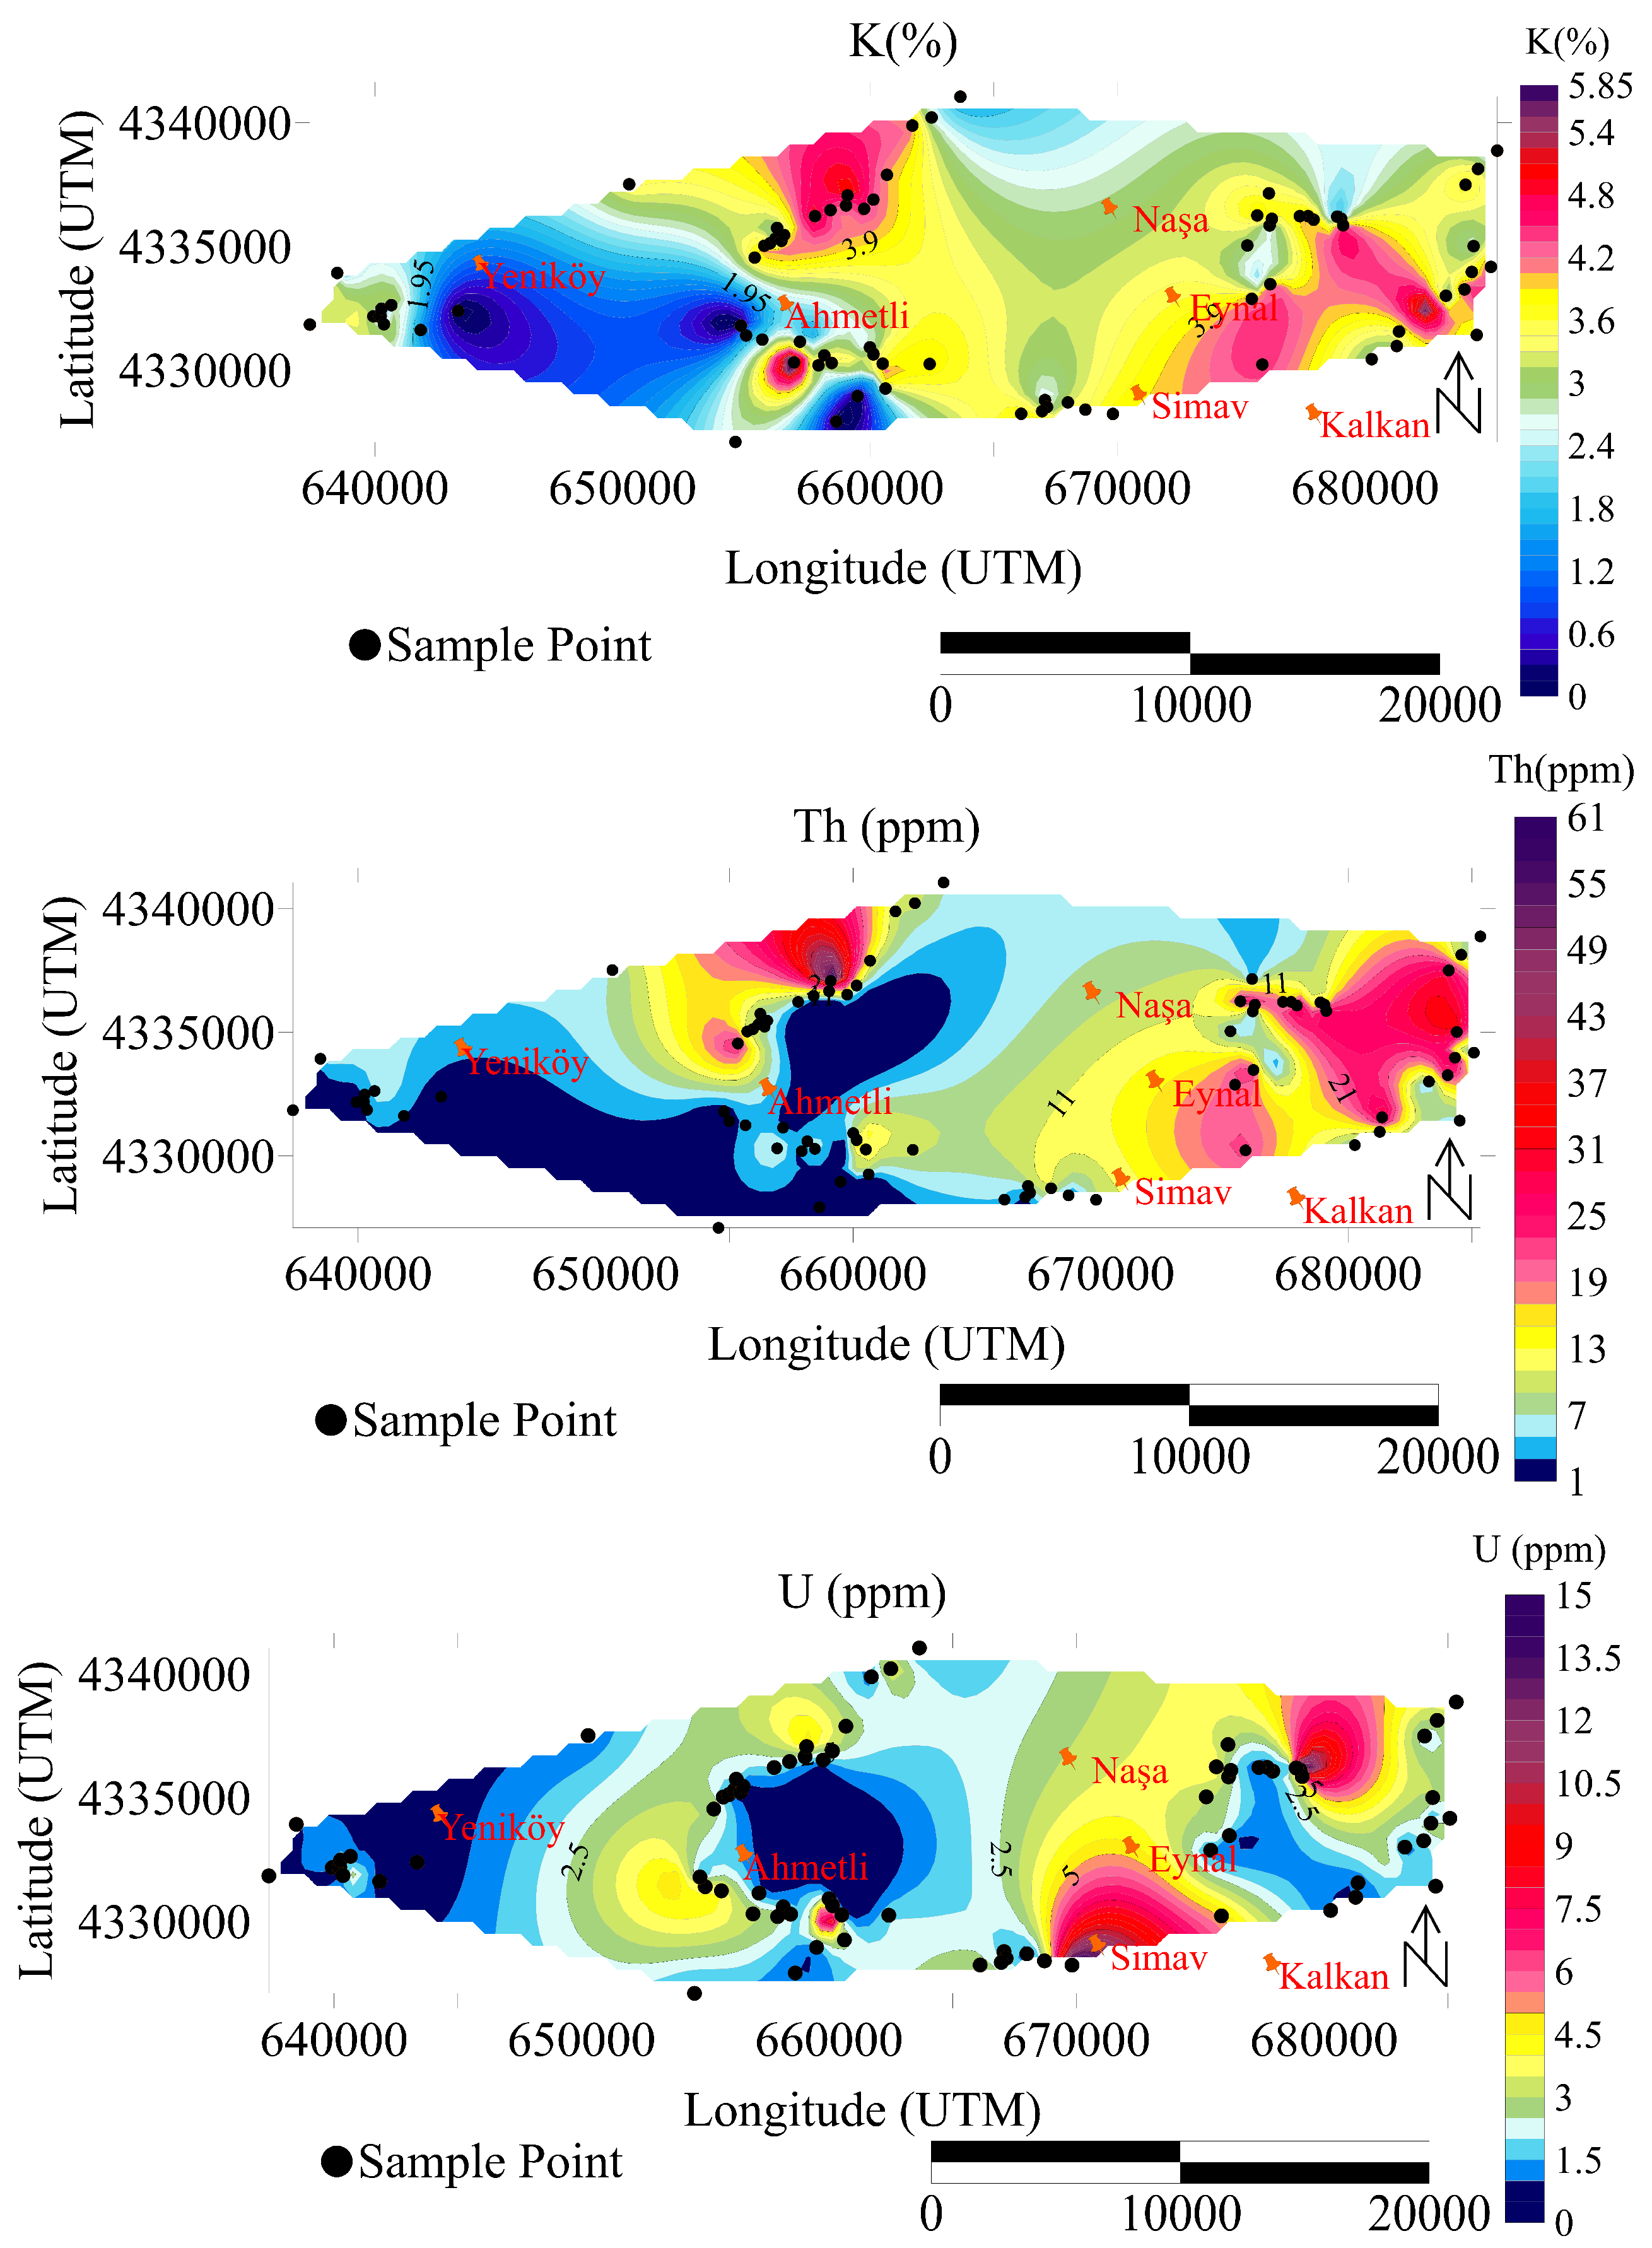
Figure 4.
Spatial variations of RHP, estimated from the concentrations of U, Th, and K, from sampling points, denoted by black-filled dots, and the correlative relationship by [13].
Figure 4.
Spatial variations of RHP, estimated from the concentrations of U, Th, and K, from sampling points, denoted by black-filled dots, and the correlative relationship by [13].
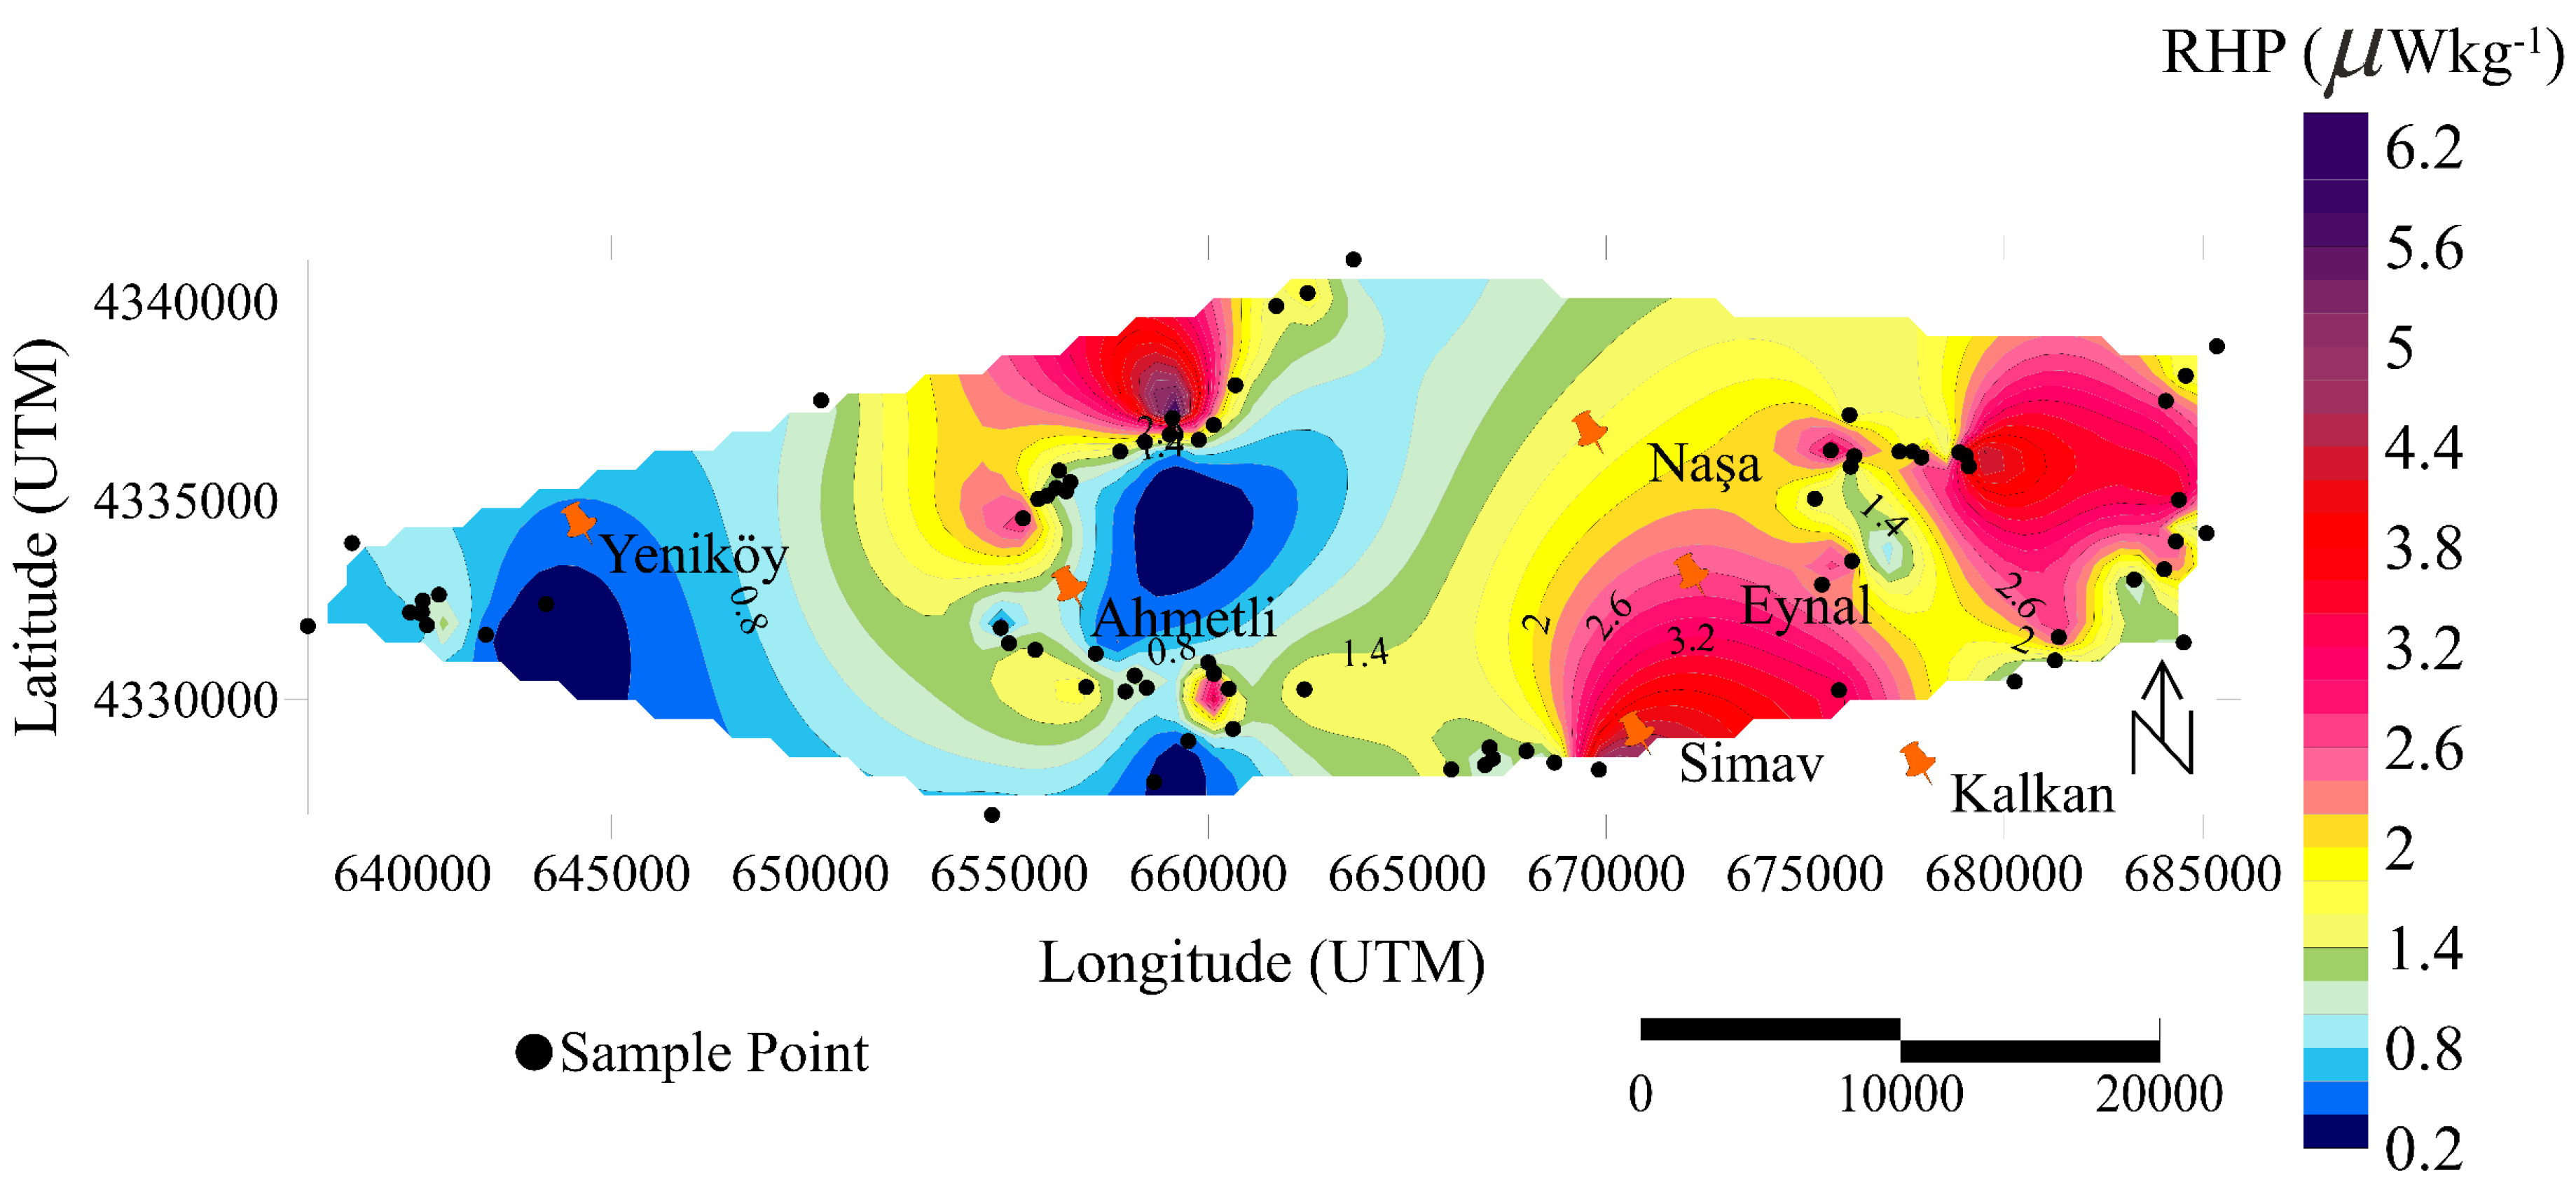
Figure 5.
Spatial variations of magnetic susceptibility: (a) measured values at low frequency, (b) measured values at high frequency, (c) computed values at low-frequency susceptibility using Eq.1, (d) computed values at high-frequency susceptibility using Eq.1, (e) percent frequency-dependent susceptibility values calculated with Eq.2, and (f) mass-specific, frequency-dependent susceptibility values derived from Eq.3.
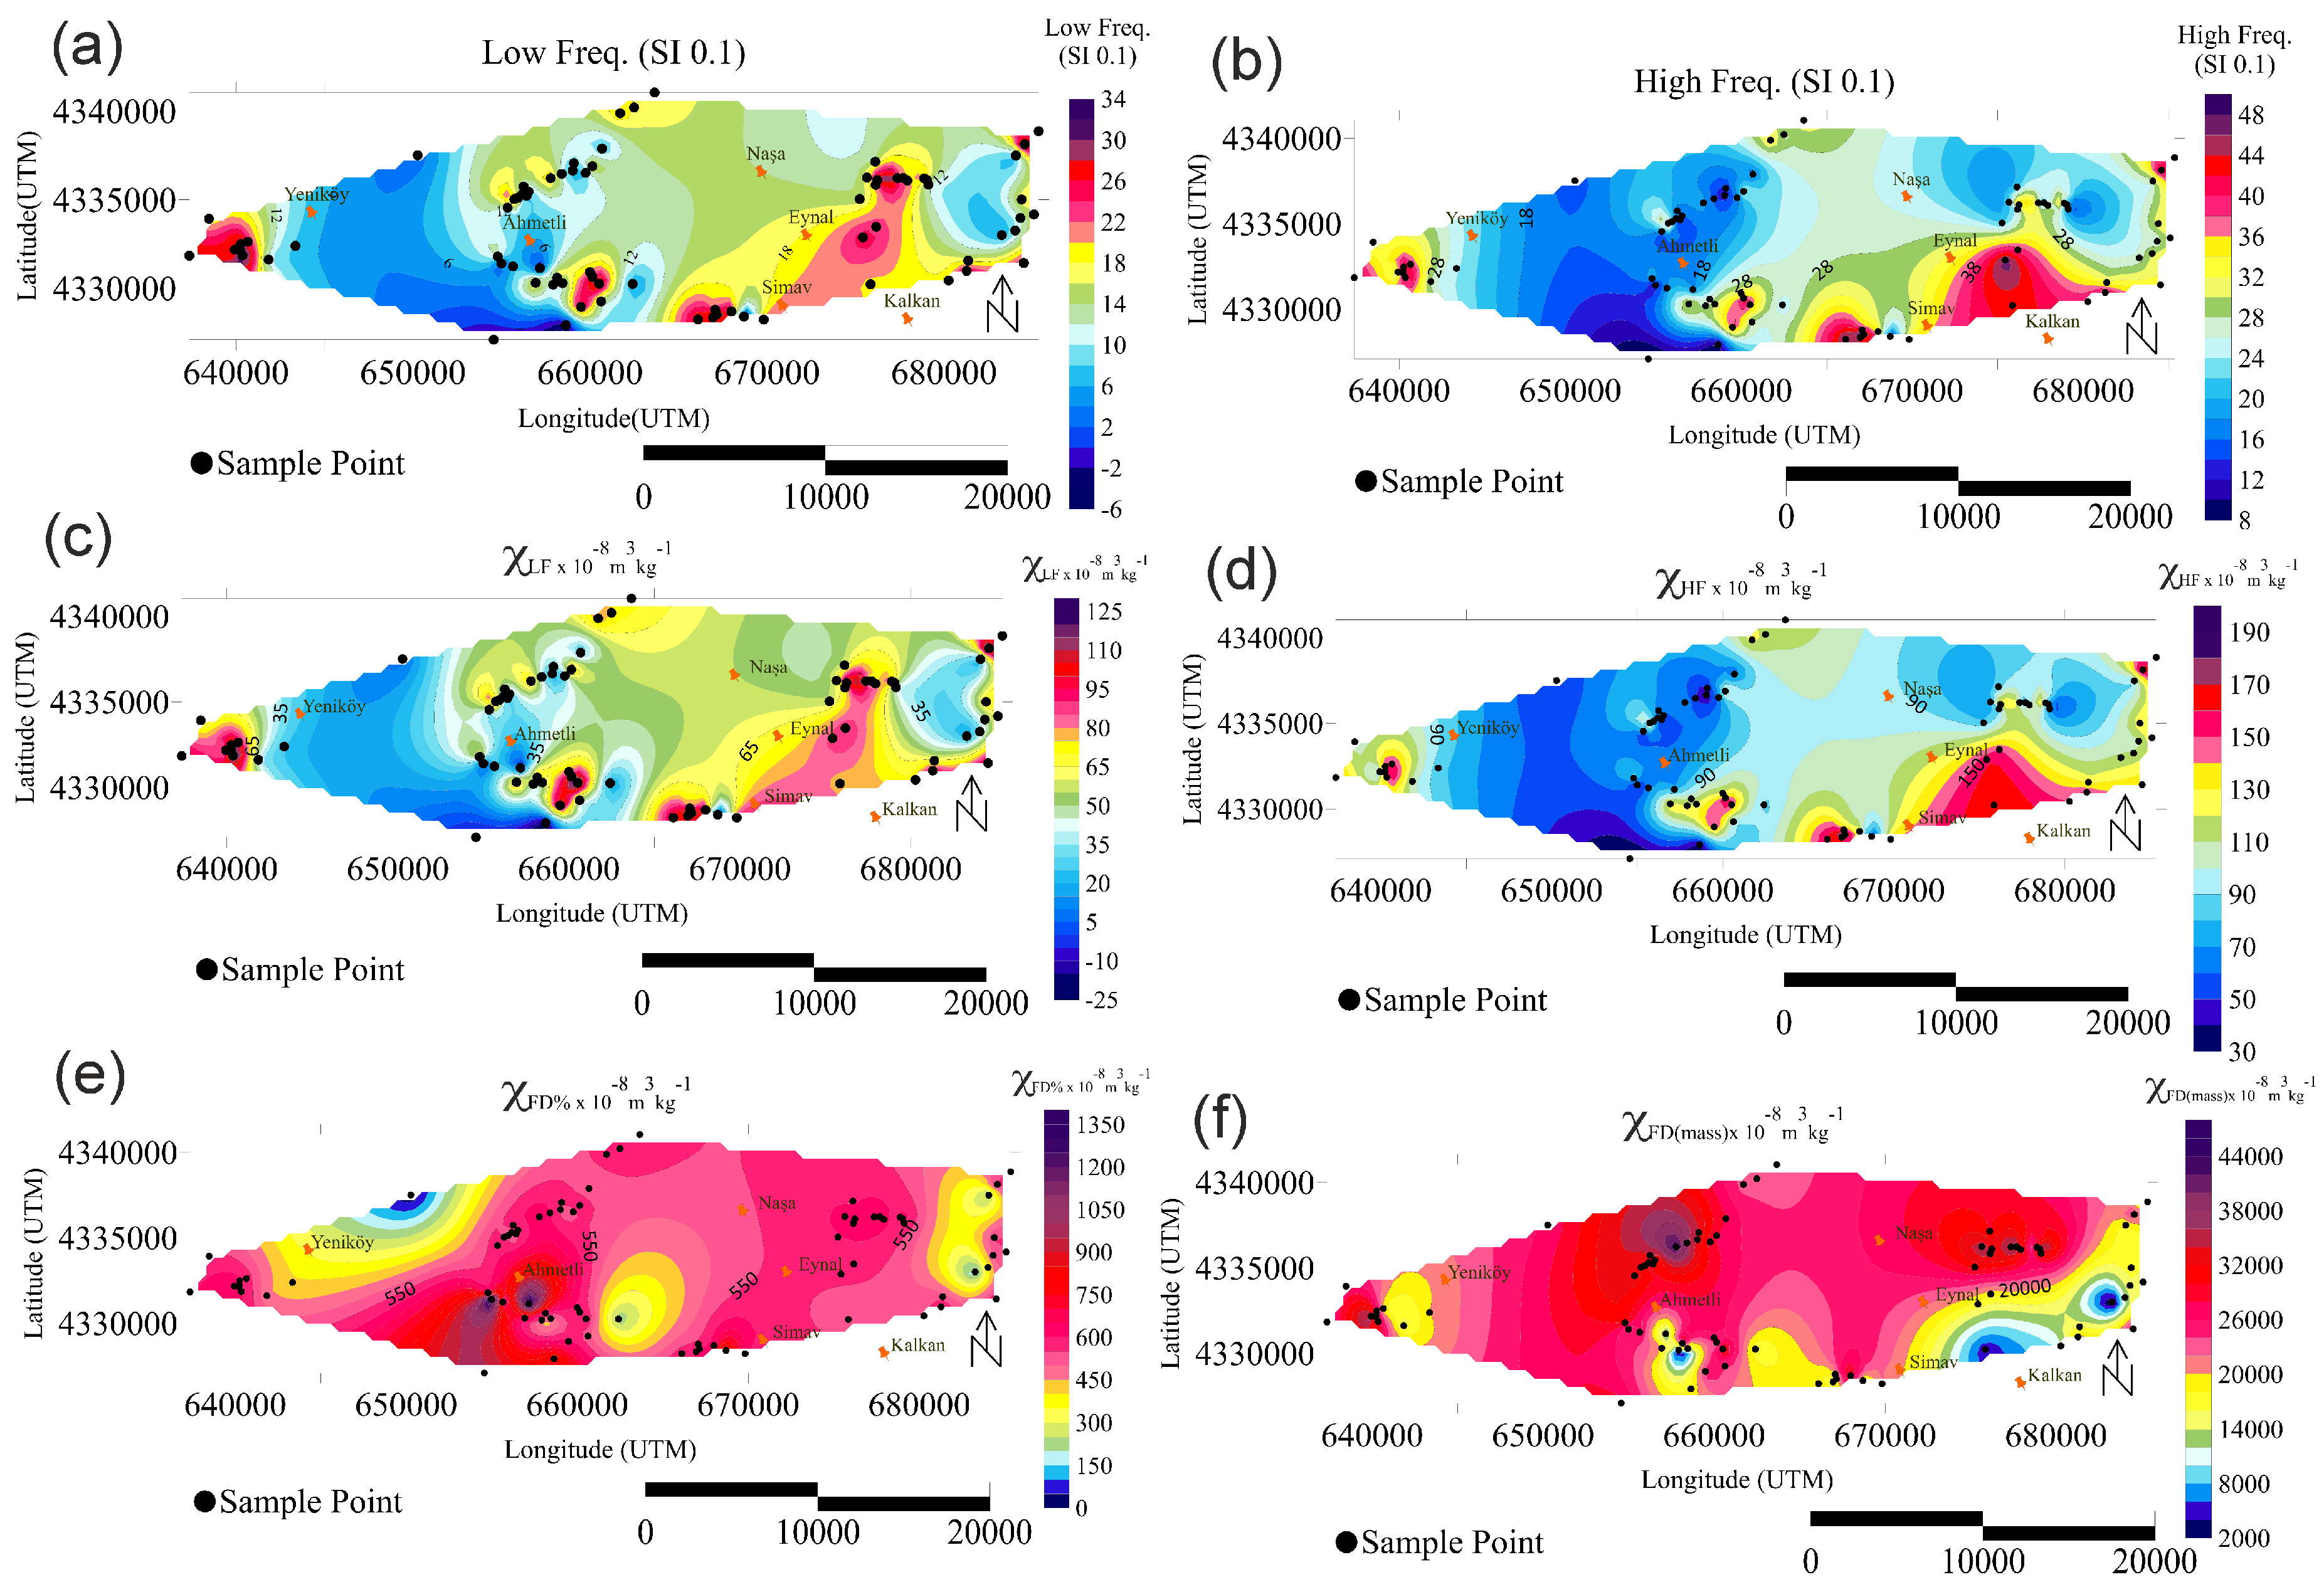
Figure 6.
Identification of potential geothermal energy regions using statistical models, including DBSCAN (a), GMM (b), and ACM (c), along with unsupervised artificial intelligence models, including ADC (d), SOMs (e), and DEC (f). For reference, the locations of production drilling sites and the epicenters of significant earthquakes (magnitude ≥ 4) are also displayed on the plots.
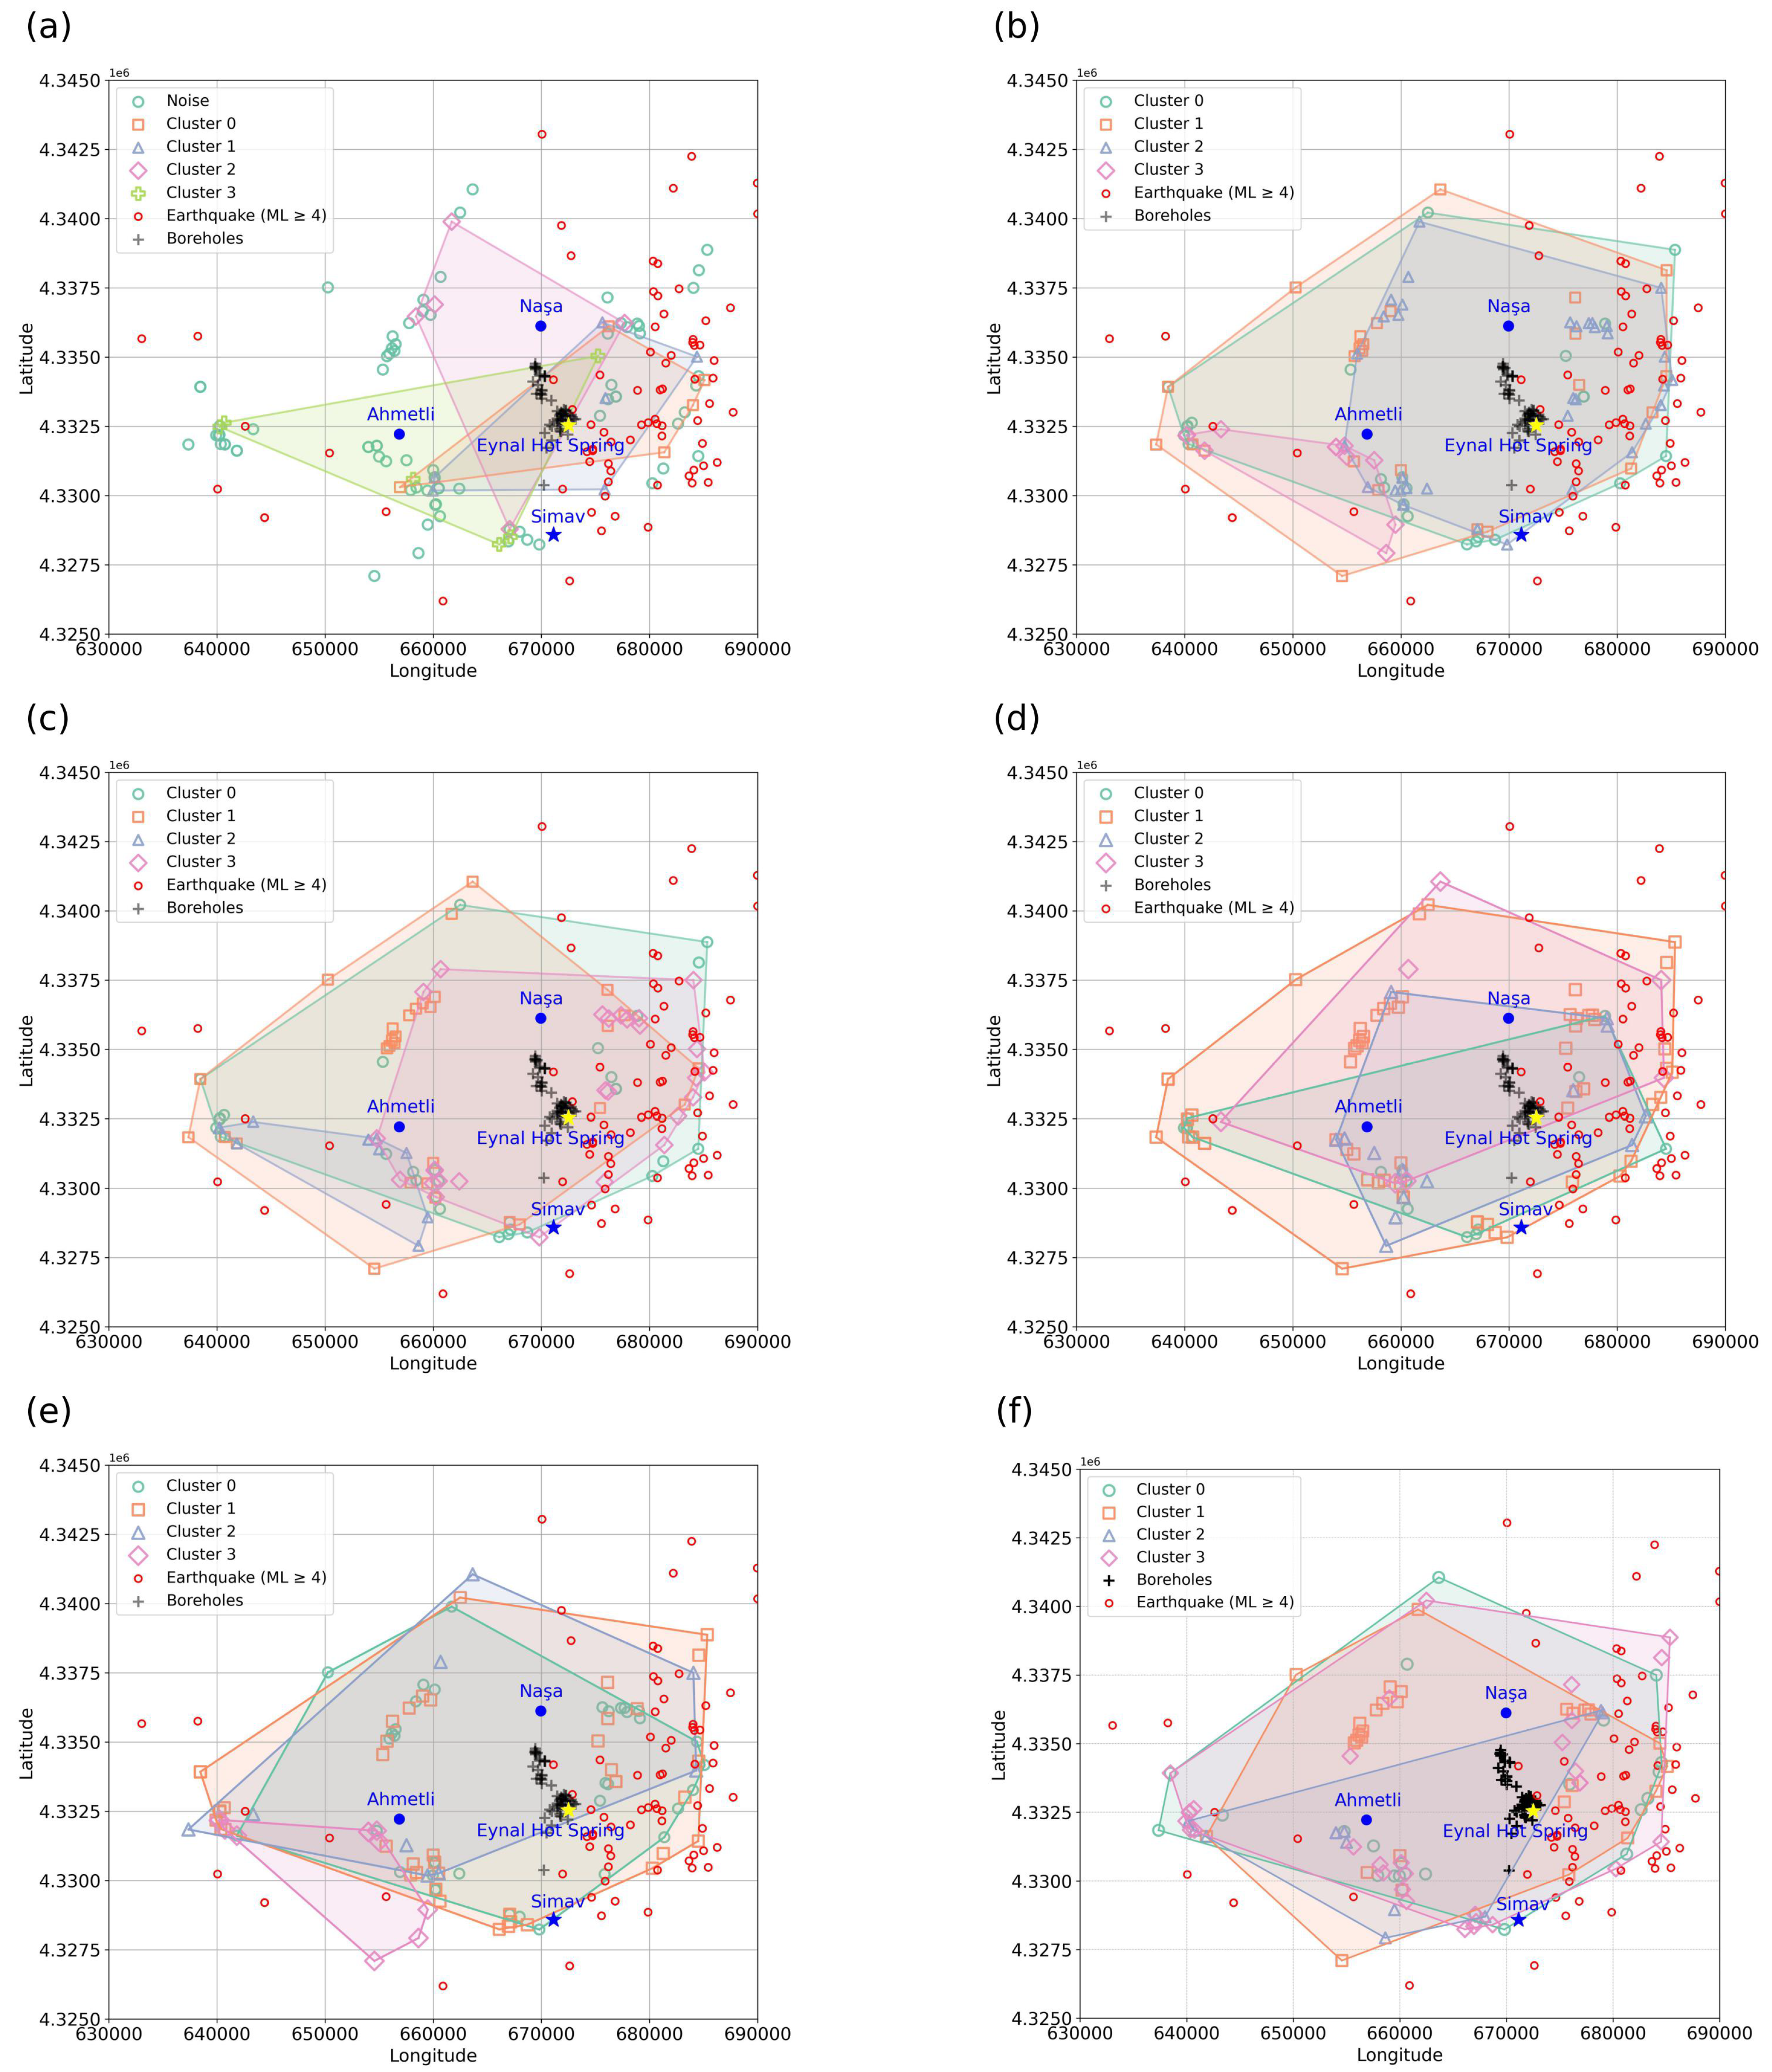

Table 1.
Comparison of Clustering Models Based on Evaluation Metrics.
| Model | ||||||
| Metric | DBScan | GMM | ACM | ADC | SOMs | DEC |
| Silhouette Score | 0.717 | 0.433 | 0.445 | 0.340 | 0.177 | 0.134 |
| Davies-Bouldin Index | 0.392 | 0.732 | 0.684 | 1.333 | 1.680 | 2.447 |
Disclaimer/Publisher’s Note: The statements, opinions and data contained in all publications are solely those of the individual author(s) and contributor(s) and not of MDPI and/or the editor(s). MDPI and/or the editor(s) disclaim responsibility for any injury to people or property resulting from any ideas, methods, instructions or products referred to in the content. |
© 2025 by the authors. Licensee MDPI, Basel, Switzerland. This article is an open access article distributed under the terms and conditions of the Creative Commons Attribution (CC BY) license (http://creativecommons.org/licenses/by/4.0/).
Copyright: This open access article is published under a Creative Commons CC BY 4.0 license, which permit the free download, distribution, and reuse, provided that the author and preprint are cited in any reuse.


