
Submitted:
03 June 2025
Posted:
04 June 2025
You are already at the latest version
Abstract
Neuroendocrine tumors (NETs) are considered between the most aggresive cancers; NETs develop in several tissues particularly gastrointestinal tract, pancreas, thyroid and lungs; lung cancer is also the most mortal type globally. There are limited models for NETs, although the neuroendocrine phenotype of adenocarcinoma A549 cells (A549NED) has been studied, and has been shown to produce biogenic amines in a differential pattern. This neuroendocrine phenotype of lung cancer cells regulates the immune response in vitro and in vivo, although the complete molecular pathways to achieve the immunomodulation have not been studied. In this regard, the transmembrane protein death ligand 1 (PD-L1) is overexpressed in some types of cancer cells, giving them the ability to camouflage themselves against the immune system. Nowadays, therapeutic has taken advantage of this molecular target, with well documented safety and efficacy for PD-L1 inhibitors in neuroendocrine lung cancer tumors. On the other hand, melatonin can exert immunomodulatory effects and is considered a significant molecule for the neuro-immuno-endocrine axis. It has also been proposed as a promising agent to modulate the tumor microenvironment. In this work we evaluated the effect of melatonin on the neuroendocrine phenotype of A549 cells deprived from fetal bovine serum in the culture media or with 2% of the supplementation; the expression of PD-L1 was evaluated in these conditions. There was an inhibitory effect in proliferation exerted by 2.5 mM melatonin, in both neuroendocrine phenotype models of A549 cells at 24 and 48 hours. The expression of PD-L1, melatonin receptors and KRAS was assessed by rt-PCR and flow cytometry (PD-L1 only) demonstrating for the first time the presence of PD-L1 in the neuroendocrine phenotypes of A549. Our results suggest that in these conditions melatonin supplementation could not prevent PD-L1 expression, but it had an anti-proliferative effect on A549 and A549NED cells, therefore making it viable as an adyuvant therapy in lung cancer.
Keywords:
neuroendocrine tumor
; PD-L1
; melatonin and lung cancer
1. Introduction
Cancer is one of the main pathologies in incidence and mortality worldwide. Lung cancer represents 12.4% of cases worldwide with different subtypes, including the more aggressive neuroendocrine tumors. [1,2,3,4,5]. Adenocarcinoma is the most common lung cancer [4], and A549 cells representing this subtype of human lung cancer is a frequently used model for research [6]. A549 cells can undergo a transdifferentiation process, with the expression of neuroendocrine markers and modified secretion of indoleamines, and may regulate the immune system in vitro and in vivo [7,8]
Among several NET biomarkers, serotonin and 5-hydroxyindoleacetic acid (5-HIAA), have been widely used due to the early recognition of NET, as well as a broad spectrum marker such as chromogranin, although the latest has some limitations in sensitivity, specificity and reproducibility [9].
On the other hand, the biosynthetic pathway of melatonin, which is considered an important molecule for the neuro-immune-endocrine axis, initiates with serotonin (5-HT), with tryptophan as their precursor [10,11,12]. Melatonin (MEL) can exert immunomodulatory effects in cells of the immune system, including the thymus and leukocytes. Many immune cells possess melatonin receptors and even peripheral blood mononuclear leukocytes can produce melatonin from 5-HT [10,11]. Melatonin exhibits high affinity for its primary receptors (MTNR), MT1 and MT2, which are members of the G protein-coupled receptor (GPCR) family. Activation of these receptors initiates signaling cascades with anticancer properties, including inhibition of cell proliferation, suppression of invasion and metastasis, induction of apoptosis and immunomodulatory effects [13]. It has been found that melatonin downregulates PD-L1 expression in non-small cell lung cancer cells such as A549 cells [14], although there is not actual research for the neuroendocrine phenotype of this cell type that regulates the immune response [7,8]
It is well known that Death ligand 1 (PD-L1) and the PD-1 / PD-L1 pathway regulate immune induction and tolerance within the microenvironment tumor. The activity of PD-1 and its ligands PD-L1 or PD-L2 are responsible for the T cell activation, proliferation, and cytotoxic secretion in cancer to degenerate anti-tumor immune responses [15].
Tumors can evade the immune system by expressing programmed death ligand 1 (PD-L1), which allows them to bind to PD-1 receptor expressed on T cells, using it as camouflage and avoiding recognition by part of the immune system [15,16].
In the present work, the immunomodulatory effect of melatonin on the expression of PD-L1 on the neuroendocrine A549 cells was evaluated.
2. Materials and Methods
2.1. Cell Culture
A549 cell line (lung cancer, HTB-201 ATCC®) and Jurkat cell line (TIB-152 ATCC®). Cell lines were cultured in DMEM and RPMI respectively added with 10% the fetal bovine serum (FBS, BIOWEST, #S1810-500,) and 1% penicillin and streptomycin (cDMEM) and incubated at 37 °C in 5% CO2. Cells grow in this condition up to 60-80% confluence, then they were detached with trypsin-EDTA 0.25 %.
2.2. Differentiation to Neuroendocrine Lineage
The A549 cell line was used for neuroendocrine transdifferentiation based on the previously published methodology [7].
Briefly 2 x 10⁵ of A549 cells were seeded in 24-well plates will be DMEM medium for 24 hours. After 24 hours for adaptation, the cells were washed with PBS and will be treated with two different methodologies. The differentiation medium was prepared with 3-isobutyl-1-methylxanthine (IBMX, 0.5 mM) and forskolin (FSK, 0.5 mM) added to DMEM medium with 2% fetal bovine serum or without fetal bovine serum (w/oFBS), thus giving the NED 2% and NED w/oFBS groups. The differentiation medium was placed for 48 hours to perform a medium change that was left for another 24 hours, giving a total of 72 hours of exposure with the differentiation medium.
2.3. Identification of Neuroendocrine Markers and Presence of PD-L1 in A549 and A549NED Cells
For RNA extraction, the Direct-zol RNA Miniprep Plus kit from Zymo Research was used and cDNA was subsequently synthesized with the RevertAid First Strand cDNA Synthesis Kit. PCR was performed to confirm the expression of Syp (Fw-GTGCTGCAATGGGTCTTCG; Rv-CCGTGGCCAGAAAGTCCAG) and actin as a reference (Fw-CCATCATGAAGTGTGACGTTG; Rv-ACAGAGTACTTGCGCTCAGGA) as neuroendocrine markers in A549 cells exposed to the differentiation treatment. For the presence of PD-L1 (Fw-AAGGCGCAGATCAAAGAGAGCC; Rv-CAACCACCAGGGTTTGGAACTG) [17]. To evaluate the expression of melatonin receptors (MTNRs) MT1 (Fw-GGGACCATGCAGGGCAA; Rv-TGCGTTCCTGAGCTTCTTGT) MT2 (Fw-TCTGCGATGTCAGAGAACGG; Rv-TCAGGAATGGTGCTCACCTG) and for KRAS (Fw- CCCAGGTGCGGGAGAGA; Rv- CCCTCCCCAGTCCTCATGTA).
2.4. Identification of Neuroendocrine Markers by Means of Flow Cytometry
For PD-L1 expression, flow cytometry was used with the BD FACSverse blue laser equipment. The cells were detached with 2 mL of versene per plate for 1 hour, alternating with mechanical action. The PD-L1 antibody (ABCAM 28-8) was incubated 2:100 for 2 hours at 4°C in the dark.
2.5. Melatonin Treatments in Neuroendocrine Models
Following the 72-hour differentiation treatment, the medium was removed, and the cells were washed with 3 mL of 1X PBS. Fresh medium without inducers was then added, according to the corresponding treatment conditions (medium with 2% FBS or FBS-free medium). Melatonin was added at a final concentration of 2.5 mM (M5250, Sigma-Aldrich). After 24 hours of exposure, the medium was removed, and the cells were used for subsequent treatments.
2.6. Statistical Analysis
Data for in vitro experiments are the media of three independent tests in triplicate. In the graph bars the results will be shown with means and standard error. The data was analyzed using the GraphPad Prism statistical 8.0.1 package with Student’s t test or ANOVA with Dunnett’s as post hoc test. Different letters or * were used to show significant differences. p<0.05 will be considered for significant differences.
3. Results
3.1. Differentiation to Neuroendocrine Lineage
For the neuroendocrine differentiation we used the cAMP inductors forskolin and IBMX; the treatment was carried out deprived from fetal bovine serum (FBS) as reported previously (w/oFBS) [7,8] and, for this research 2% of supplementation was also investigated. In Figure 1, changes in cell morphology can be observed; as we expected for the FBS-deprived group treatment of A549 cells resulted in characteristic morphology changes (rounding of cell body and neurite like extensions) and a decreased proliferation rate. In addition, for 2% of FBS supplementation (NED 2%) the morphology changes and decreased proliferation rate were observed also since 48 h of treatment.
The evaluation of the neuroendocrine markers expression was assesed by RT-PCR (Figure 2). The results showed differential expression of synaptophysin (SYP) between controls, where control w/o FBS showed higher expression than control with 2% FBS. Additionally, we observed an overexpression of SYP marker in NED w/o FBS compared to the control group, as expected. Interestingly a statistically significant greater expression of SYP was observed in the NED 2% compared to the control 2% group (ctrl 2%).
3.2. Effect of Melatonin in the Proliferation of A549 Cells and Neuroendocrine Models (NED 2% and NED w/oFBS)
Different concentrations of melatonin were used to evaluate the proliferation effect on A549 cell (Figure 3) for 24 (Figure 3A,C) and 48 hours (Figure 3B,C). Melatonin promoted a concentration-dependent inhibition of the proliferation of A549 cells with 2% and without FBS. Nevertheless the inhibition was more pronounced at 24 hours for A549 cells without FBS compared with the 2% FBS supplemented treatment, particularly with the concentrations of 2.5 and 5 mM. Melatonin for 24 hours at 2.5 mM inhibited 50% of the proliferation of A549 cells with 2% FBS supplemented treatment, and inhibition of 80% was observed in A549 cells deprived of FBS. The inhibition effect of melatonin was higher after incubating cells for 48 hours.
3.3. Expression of Melatonin Receptors in A549 Cells
After the decreased proliferation obtained with melatonin in A549 cells, the expression levels of the specific receptors MT1 and MT2 were evaluated after 72 hours of differentiation treatment. The results confirmed the expression of the MT1 receptor in the neuroendocrine models and their respective controls; however, no statistically significant difference was observed between them (Figure 4).
MT2 receptor expression was also confirmed for A549 cells, in both, controls and neuroendocrine phenotypes. Under 2% FBS conditions, MT2 expression was lower in the control group but significantly increased in the NED 2% model. In the absence of FBS, an overall increase in MT2 expression was observed compared to the 2% FBS treatments; however, the NED w/o FBS model did not show a statistically significant difference compared to its respective control (Figure 5).
3.4. Effect of Melatonin in Neuroendocrine Models
The effect of melatonin (2.5 mM) was also evaluated in neuroendocrine models. For the NED 2% model, a significant decrease was observed between undifferentiated cells treated with melatonin and their controls at both 24 (Figure 6A) and 48 hours (Figure 6C). Regarding neuroendocrine cells, a significant decrease was also observed at both 24 (Figure 6B) and 48 hours (Figure 6D). Furthermore, a higher percentage of cells was observed in the neuroendocrine models compared to undifferentiated cells.
The effect of a 2.5 mM melatonin concentration was evaluated in the neuroendocrine model without fetal bovine serum. For the undifferentiated models, a significant decrease in the cell percentage between melatonin-treated and control cells was observed at both 24 (Figure 7A) and 48 hours (Figure 7C). For the transdifferentiated cells, a significant difference was also observed at both 24 (Figure 7B) and 48 hours Figure 7D). However, this model exhibited a lower percentage of cells compared to its control. The inhibition effect of melatonin was higher in NED w/o FBS compared to the NED 2% model.
3.5. Expression of MT1 and MT2 in Neuroendocrine Models Treated with Melatonin
Melatonin also showed an effect on cell proliferation after 24 hours of exposure in the neuroendocrine models; therefore, we investigated whether this exposure also affected the expression of the MT1 and MT2 receptors.
MT1 receptor expression was evidenced after 24 hours of melatonin exposure for all groups. A decrease in MT1 expression was observed in the NED 2% group treated with melatonin, showing a statistically significant difference compared to its control (Figure 8A). The groups without FBS showed increased expression with melatonin, but no significant differences were found (Figure 8B).
The effect of melatonin on MT2 receptor expression was also evaluated in NED models. After 24 hours of treatment with 2.5 mM melatonin no changes in MT2 expression were observed under any treatment conditions (Figure 9).
3.6. Presence of PD-L1 in Neuroendocrine Lung Model
In addition, PD-L1 expression was evaluated by means of, RT-PCR obtaining amplicons of 147 bp. There were no significant differences in mRNA expression between controls (Figure 10). The relative expressions of the NED 2% and NED w/o FBS models are higher than their respective controls. The NED 2% model showed a significant expression increase compared to its respective control.
Flow cytometry was performed to find out if protein of PD-L1 was also expressed in the neuroendocrine models and if there was a difference between them. The results showed the presence of PD-L1 in all groups (Figure 11). The A549 NED 2% model presented a significant increase with respect to its control. There were no significant differences in PD-L1 expression between A549 NED w/o FSB and its respective control.
3.7. Effect of Melatonin on PD-L1 in Neuroendocrine Models
To determine if melatonin has an effect on the expression of the PD-L1 ligand, neuroendocrine models were exposed to melatonin for 24 hours and analyzed by flow cytometry. In the contour plots, we can observe that the presence of PD-L1 is found in all treatments (Figure 12) as expected, but a trend toward a decrease is observed in those exposed to melatonin (Figure 13). However, the difference is not statistically significant.
3.8. KRAS Expression in Neuroendocrine Models
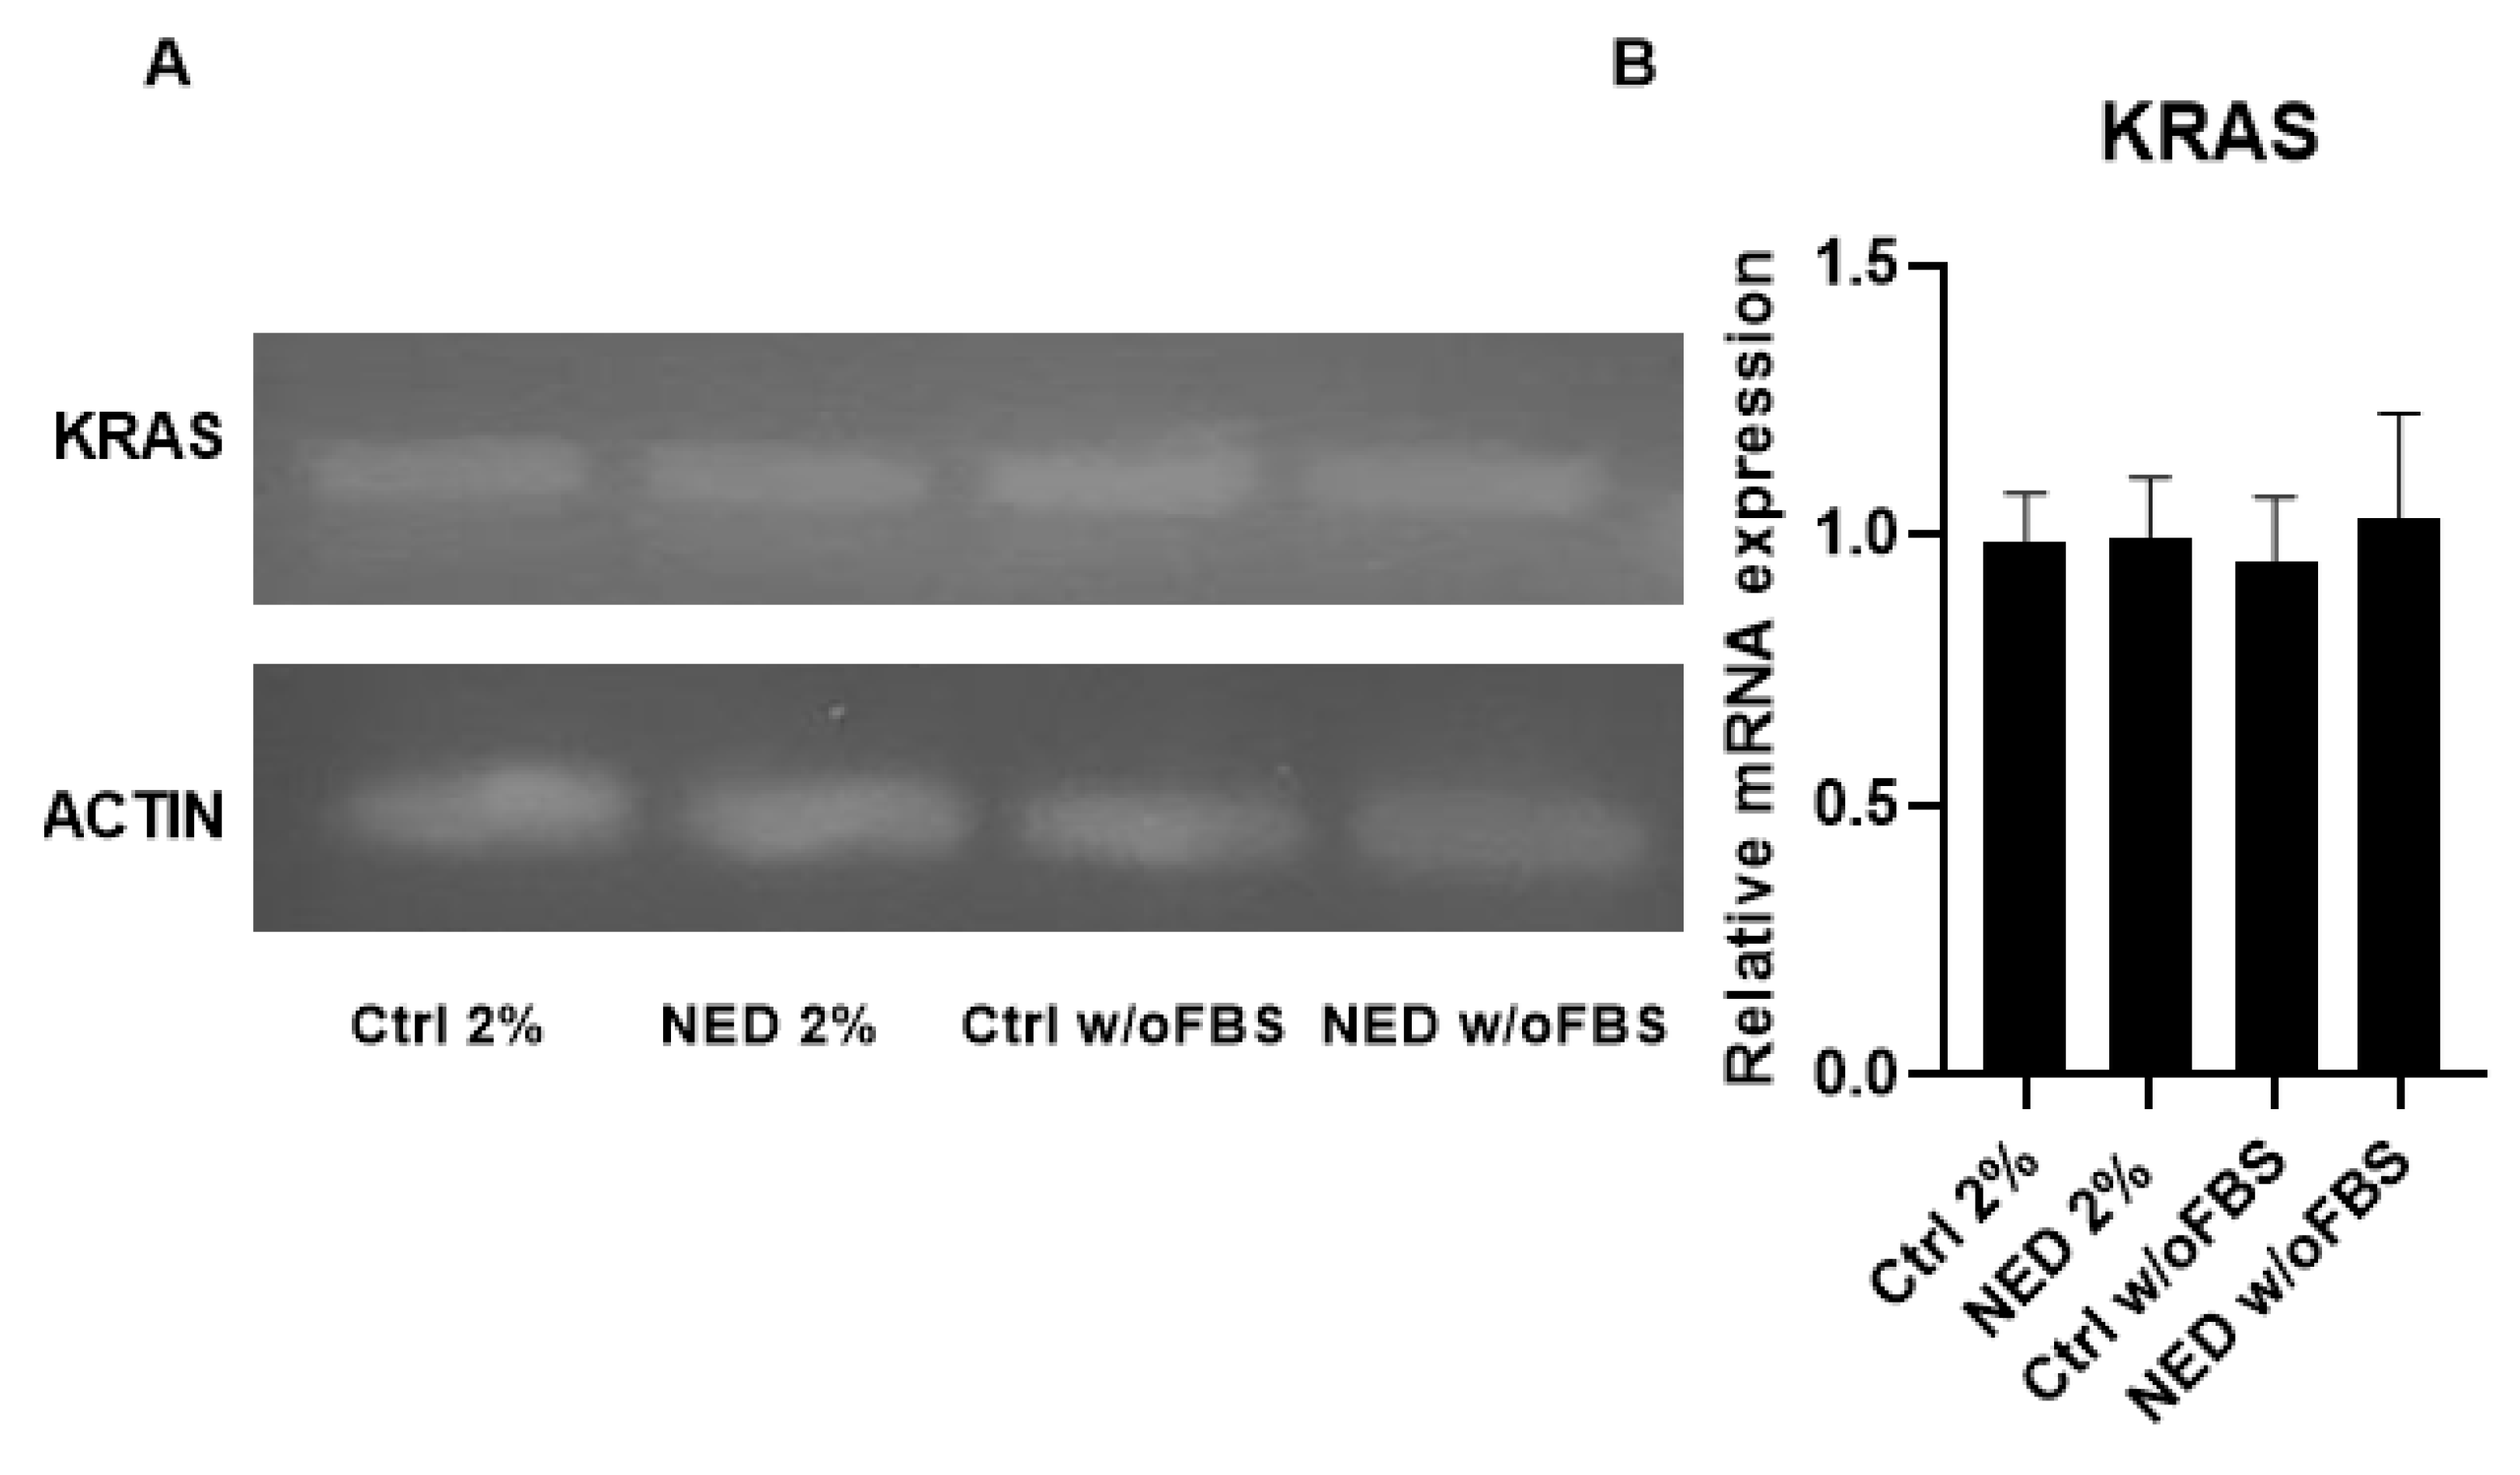
After confirming that melatonin did not reduce PD-L1 expression, it became relevant to investigate the behavior of its main inducer, KRAS. KRAS expression previous to treatment with melatonin was assessed in the control groups and neuroendocrine models, and no statistically significant differences were observed between them (Figure 14).
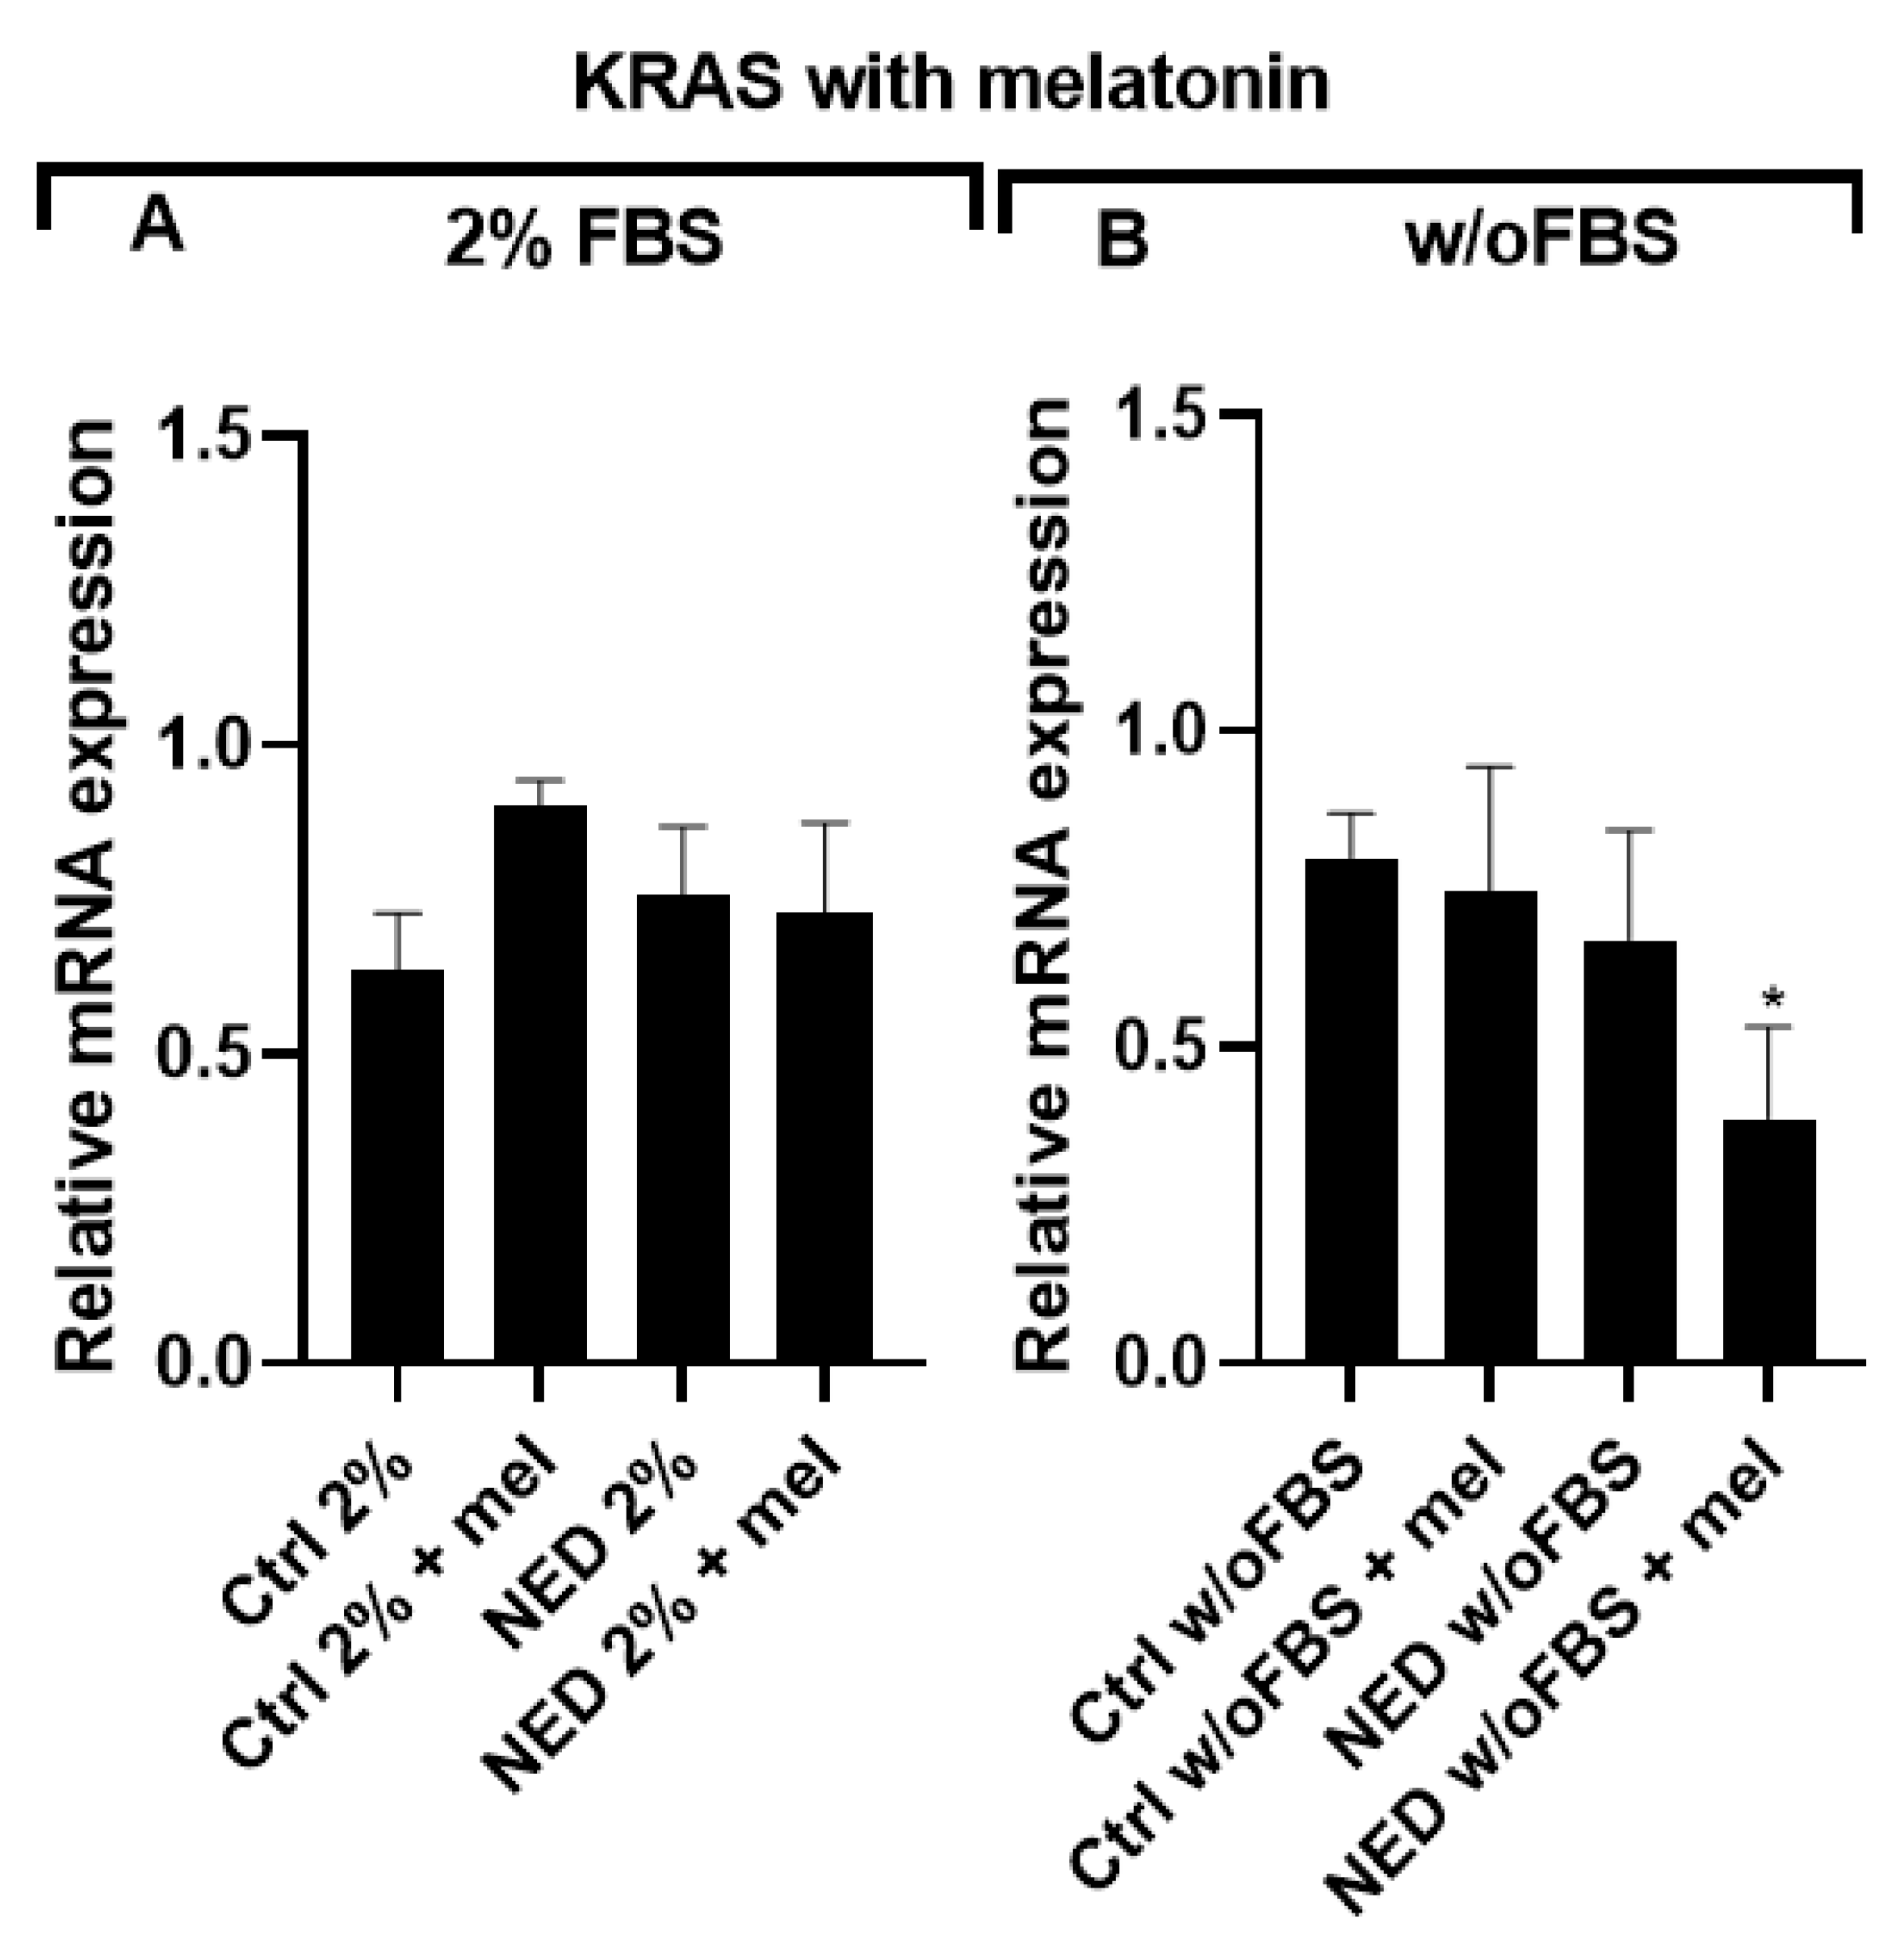
On the other hand, upon evaluating KRAS expression after 24 hours of melatonin exposure expression was observed among all groups. However, no statistically significant differences were found between the melatonin-treated groups and their respective controls for 2% FBS supplementation. Under FBS-free conditions, the NED w/o FBS + mel group showed a significant decrease in KRAS expression.
Figure 15.
KRAS in neuroendocrine models treated with melatonin. Treatment with Forskolin and IBMX 0.5 mM each for 72 hours and following 24 hours of exposure to 2.5 mM melatonin. A)A549 cells treated with 2% of FBS and B) A549 cells treated without FBS. Statistical analysis was performed using the post hoc Dunnett ANOVA test, * p < 0.01 respect each of its control.
4. Discussion
In recent years, immunotherapies have had a significant advancement in cancer treatments. This advancement has led to the understanding that treatment of tumors should not only focus on cancer cells, but also to take the tumor microenvironment into account [18]. Neuroendocrine tumors are secreting tumors that have been studied due to their aggressiveness and malignancy, and their mechanisms involved to achieve the immunotolerance have not been fully studied yet. For that matter, in this work, we evaluated the immunomodulatory effect of melatonin on the expression of PD-L1 on two in vitro models of neuroendocrine cells.
To carry out the differentiation of the neuroendocrine models, FSK and IBMX were used to increase cAMP intracellular concentrations. FSK binds to adenylate cyclase to convert ATP to cAMP, while IBMX prevents cAMP from being converted to 5’AMP by inhibiting phosphodiesterase, maintaining cAMP concentrations. This cAMP may bind to the regulatory subunit of PKA, leading to its translocation to the nucleus to activate CREB, initiating the transcription of genes for neuroendocrine differentiation [7].
The transdifferentiation of A549 cells into the neuroendocrine phenotype by means of FSK and IBMX resulted in the characteristic morphologic changes previously reported for the FBS-deprived group, rounded cell body and the development of neurite-like extensions, in addition to the decreased proliferation rate. Interestingly, supplementation with only 2% of FBS did not nurtured A549 cells enough to prevent the inhibition in proliferation, although the characteristic neuroendocrine morphology was also obtained. Fetal bovine serum is widely used to supplement cell culture to stimulate proliferation, due to its content of plasma proteins, peptides, fats, growth factors, hormones, organic substances and other little-known small molecules [19]. The FBS content in cell cultures promotes the cell to divide and proliferate in its continuous cell cycle; however, our results indicate that in these models (w/o FBS and 2% FBS) the absence of essential nutrients causes cell arrest, leading the cells to the G0 phase to begin differentiation processes [20].
The changes in morphology of the A549 cells with 2% of FBS supplemented media were observed right after 24 hours as well as projections like those of neuroendocrine cells. On the other hand, the cAMP increasing agents forskolin and IBMX have a cytotoxic effect on the cells, so the loss or decrease in the number of cells is noticeable, coupled with the absence of FBS, which eliminates the nutrients necessary for the cell; in the NED 2% model we caused cell arrest, keeping the nutrients necessary to live to a minimum, but not enough to proliferate.
The transdifferentiation of the neuroendocrine models was confirmed with the expression of specific markers as the vesicular integral membrane protein synaptophysin (SYP), one of the most specific markers of neuroendocrine differentiation, manifesting a much higher sensitivity than chromogranin A and NSE, SYP is present in a 426/570 rate [21,22]. Interestingly, the RT-PCR results showed differences in the expression of SYP of the two control groups, an increased expression of SYP was observed in the deprived model compared to the 2% FBS model. In addition, both models with cAMP increasing treatments promoted the overexpression of SYP, more significant for the 2% FBS model. The SYP expression differences among control groups might be partially explained by Hardwick’s observation, that the absence of the essential nutrients may lead the cells to arrest in G0 phase causing a more suitable state for cell plasticity processes, such as transdifferentiation [20]. In addition, proteomic studies showed the activation of several signaling pathways in different tumor cells depending on the concentration of FBS used [23]. The differences in the expression of markers suggest that the presence of 2% FBS causes a different neuroendocrine model compared to that obtained in the complete absence of FBS.
After the validation of the neuroendocrine models, the effect of melatonin supplementation was tested. Melatonin treatment showed a concentration-dependent effect in cell proliferation for both models. A significant decrease was observed with 2.5 mM melatonin for 2% FBS model conserved for 48 hours, and also in the deprived model after 48 hours of treatment. These results indicate that melatonin exerts an anti-proliferative and probably pro-apoptotic effect in the A549 control groups (2% and w/o FBS); the pro-apoptotic effect of 2.5 mM melatonin has been reported for NSCLC cell lines [14].
An additional difference was observed when 2.5 mM melatonin supplementation was evaluated in the transdifferentiated models. The inhibiting effect of melatonin decreased compared to its effect in control groups (inhibition effect: 85% in control groups vs 65% in transdifferentiated groups). This difference may be explained by the differential pathways triggered by the MT1 and MT2 receptors. Melatonin can inhibit the protein Bcl-2 and increase Bax in pulmonary adenocarcinoma, which would lead to an increase in apoptosis through the activation of the caspase pathway [24]. In addition, it is known that melatonin can inhibit the nuclear factor kappa B (NFκB) in various types of cancer, such as liver and lung cancer [25].
MT1 and MT2 melatonin receptors were expressed in controls and neuroendocrine differentiation (NED) models. For the MT1 receptor, no significant differences in expression were observed between cells cultured under 2% FBS and serum-free conditions, nor between their respective controls. This is consistent with previous reports indicating the presence of melatonin receptor MT1 in approximately 90% of NSCLC cases [13]. However, following a 24-hour treatment with melatonin, a reduction in MT1 receptor expression was observed in the NED 2% model. This finding suggests a regulatory effect of melatonin on MT1 expression in differentiated neuroendocrine cells. A similar downregulation of MT1 has been reported by Sun et al. (2022) [26], who showed that treatment of A549 cells with 1 mM melatonin under 10% FBS conditions led to a time-dependent decrease in MT1 protein levels within 0–12 hours. The authors proposed that this rapid change was likely due to receptor endocytosis and degradation, indicating a post-translational regulatory mechanism. In contrast, our experimental design involved a longer exposure period and a higher melatonin concentration (2.5 mM), raising the possibility that the observed MT1 downregulation in our model may involve transcriptional regulation, potentially affecting mRNA expression levels in addition to protein turnover. The MT2 receptor is known to be present in approximately 86.5% of NSCLC cases [13]. Interestingly, an inverse correlation has been reported between MT2 expression levels and tumor malignancy, where lower MT2 expression is associated with higher degrees of malignancy. In our models, MT2 expression was generally lower than that of MT1, consistent with previously reported. Moreover, MT2 expression remained stable across both neuroendocrine differentiation models and was not significantly affected by melatonin treatment, of the presence or absence of FBS. These findings suggest that, unlike MT1, MT2 may be less responsive to melatonin-mediated regulation under the conditions tested, and its expression appears to be maintained independently of differentiation status or melatonin exposure.
The primary signaling pathway activated by melatonin through its receptors MT1 and MT2 involves coupling to heterotrimeric Gi/o protein subunits, leading to the inhibition of adenylyl cyclase and a subsequent reduction in intracellular cyclic AMP (cAMP) levels. In addition to this canonical pathway, MT1 also can activating several alternative signaling cascades, including the Gi/PI3K/Akt, Gi/PKC/ERK1/2, and Gq/PLCβ/IP₃/Ca²⁺ pathways. Notably, the MT1/MT1 homodimer also inhibits adenylyl cyclase activity, reinforcing the suppression of cAMP production. The MT2 receptor, on the other hand, inhibits intracellular levels of cyclic GMP (cGMP), thereby decreasing the activity of cGMP-dependent protein kinases (PKG). The MT2/MT2 homodimer has been shown to modulate the MAPK signaling pathway, while the MT1/MT2 heterodimer activates phospholipase C (PLC), leading to IP₃ generation and subsequent intracellular calcium release. These diverse signaling mechanisms highlight the pleiotropic roles of melatonin receptors in regulating various cellular processes, including those implicated in tumor suppression [27].
Afterward, it was analyzed whether PD-L1 was present in the A549 cell line and in the neuroendocrine models derived from it, by RT-PCR and flow cytometry. The results showed no significant difference among the expression of PD-L1 in the control groups. In addition, the immunomodulator PD-L1 showed a similar average expression in both neuroendocrine phenotype cells (88.47% and 75.07% of PD-L1 in the NED 2% and NED w/oFBS models, respectively). The most significant difference was showed for the NED 2% FBS model. This result indicates that the increase in PD-L1 expression is dependent on supplementation with FBS. In this regard, the PD-1/PD-L1 pathway is involved in the escape of cancer cells from the immune system. When the antigen binds to the TCR to activate T cells and induce the death of cancer cells, the overexpression of PD-L1 on the membrane of cancer cells promote the binding with its receptor PD-1, thus preventing the immune system’s attack and triggering a signaling cascade that inhibits the secretion of IL-2, and causes inhibition of the NFκB and mTOR pathways, as well as the inhibition of the Bcl-xl protein in T cells [28]. These results suggest a possible escape mechanism of neuroendocrine cells from the immune system. Previous reports of our group reported a decreased cytotoxic effect of lymphocytes on the neuroendocrine model [7,8]. The results of this work led us to suggest for the first time a mechanism used by the neuroendocrine cells to decrease the cytotoxic effect of T Cells. It is possible that the binding of PD-1 with PD-L1 restrain the immune attack, inhibiting the secretion of IL-2, which is mainly responsible for the increase in the proliferation of immune cells.
It was expected a decrease of PD-L1 in neuroendocrine models with melatonin, however, the difference was not statistically significant. Chao et al. (2021) [14] have shown that melatonin decreases the expression of PD-L1 in cancer cell lines, however, this was not the effect found in our neuroendocrine models. Otherwise, the presence of PD-L1 is confirmed in neuroendocrine cancer models for the first time. It is known that cAMP concentrations indirectly increase the PD-L1 RNA expression [29], which might be in concordance with our findings. Our transdifferentiation process is caused by the increase in cAMP, which consequently might be increasing the expression of PD-L1.
KRAS is one of the key oncogenes associated with PD-L1 overexpression in cancer cells and is also among the most frequently mutated oncogenes in NSCLC. Therefore, the presence of KRAS expression in our models was expected. Surprisingly, no significant differences in KRAS expression were observed between the 2% FBS and w/o FBS NED models or their respective controls. This suggests that KRAS is not responsive to the neuroendocrine differentiation process applied to our NED models.
Subsequently, the effect of melatonin on KRAS expression was assessed in the differentiated NED models. Notably, no significant changes were observed in the control or 2% FBS conditions following melatonin treatment. In contrast, in the serum-free condition (NED w/o FBS), KRAS expression was reduced in response to melatonin, when compared to the corresponding control (Ctrl w/o FBS + mel). Chao et al. (2021) [14] previously reported that a 2.5 mM concentration of melatonin suppressed PD-L1 expression via downregulation of KRAS, although their study was conducted using culture media supplemented with 7% of FBS. Our results showed a decrease in MT1 receptor expression following 24 hours of melatonin treatment in NED 2% cells, consistent with receptor internalization as reported by Sun et al. (2022) [26]. Conversely, in the serum-free condition, MT1 expression remained stable regardless of melatonin exposure.
The aggressive characteristics of neuroendocrine tumors can possible be explained by their ability to evade the immune system by expressing immunomodulators such as PD-L1. The presence of this immunomodulator gives an advantage when applying treatments that target PD-L1 [30]. The effect of melatonin in all the groups decreasing proliferation is very interesting as well as intriguing, so it can be proposed as an adyuvant in lung cancer therapies. The proposal of new inhalated formulations for melatonin (and other anti-cancer therapies) might be of interest for these results [31,32]. Some of these results and conclusions have been presented in international conference [33].
5. Conclusions
The transdifferentiation of A549 cells to neuroendocrine model was performed and the overexpression of PD-L1 in A549NED cells was evaluated. Melatonin did not prevent PD-L1 expression but it had anti-proliferative effects in NSCLC cells and A549NED cells, making it viable as an adyuvant therapy in lung cancer. Formulations with air jet mixing or other inhalation bias for melatonin could be proposed.
Supplementary Materials
The following supporting information can be downloaded at the website of this paper posted on Preprints.org
Author Contributions
Conceptualization, D.C, I. M., J.E.C., G.G.A. and L.C.B.; methodology, D.C. and A. R.C.; validation, L.C.B.; formal analysis, D. C and L.C.B.; investigation, D.C, L.C.B. and I.M.; data curation, D.C and L.C.B.; writing—original draft preparation, D.C, L.C.B. and I.M writing—review and editing, D.C, L.C.B., I. M., J.E.C. and G.G.A.; visualization, D.C.; supervision, L.C.B.; project administration, L.C.B. All authors reviewed and agreed with the published data.
Funding
This work was financially supported by grants: Consejo Nacional de Ciencia y Tecnología (CONACYT), Mexico CB2017-2018-A1-S-25275, PhD 779270 for Dulce Caraveo; FOPES2023-2024 and FCQ2024 from Universidad Autónoma de Querétaro.
Acknowledgments
The authors thank Dr. Romero for equipment.
Conflicts of Interest
The authors declare no conflicts of interest.
Abbreviations
The following abbreviations are used in this manuscript:
| NETs | Neuroendocrine tumors |
| NED | Neuroendocrine differentiation |
| PD-L1 | protein death ligand 1 |
| 5-HIAA | 5-hydroxyindoleacetic acid |
| 5-HT | Serotonin |
| MEL | Melatonin |
| MT1 | Melatonin receptor 1 |
| MT2 | Melatonin receptor 2 |
| MTNR | Melatonin receptors |
| GPCR | G protein-coupled receptor |
| IBMX | 3-isobutyl-1-methylxanthine |
| FSK | Forskolin |
| cAMP | Cyclic AMP |
| cGMP | Cyclic GMP |
| PKG | cGMP-dependent protein kinases |
| PLC | Phospholipase C |
| SYP | Synaptophysin |
| FBS | Fetal bovine serum |
| NSCLC | Non-Small Cell Lung Cancer |
References
- Globocan [En línea]. Estado Unidos [Fecha de consulta: 23 de octubre del 2020]. Disponible https://www-dep.iarc.fr/WHOdb/WHOdb.htm.
- Arrieta, O., Zatarain-Barrón, Z. L., & Cardona, A. F. (2020). New opportunities in a challenging disease: lurbinectedin for relapsed small-cell lung cancer. The Lancet. Oncology, 21(5), 605–607. [CrossRef]
- Pelosi G, Bianchi F, Hofman P, et al. Recent advances in the molecular landscape of lung neuroendocrine tumors. Expert Rev Mol Diagn. 2019;19(4):281-297. [CrossRef]
- Bray, F., Laversanne, M., Sung, H., Ferlay, J., Siegel, R.L., Soerjomataram, I., Jemal, A. (2024) Global cancer statistics 2022: GLOBOCAN estimates of incidence and mortality worldwide for 36 cancers in 185 countries. CA Cancer J Clin. 2024 May-Jun;74(3):229-263. Epub 2024 Apr 4. PMID: 38572751. [CrossRef]
- Ear, P.H., Marinoni, I., Dayton, T., et al. NET Models Meeting 2024 white paper: the current state of neuroendocrine tumour research models and our future aspirations. Endocr Oncol. 2024;4(1):e240055. Published 2024 Dec 19. [CrossRef]
- Mohtar, N., Parumasivam, T., Gazzali, A.M., et al. Advanced Nanoparticle-Based Drug Delivery Systems and Their Cellular Evaluation for Non-Small Cell Lung Cancer Treatment. Cancers (Basel). 2021;13(14):3539. Published 2021 Jul 15. [CrossRef]
- Mendieta, I., Nuñez-Anita, R. E., Pérez-Sánchez, G., Pavón, L., Rodríguez-Cruz, A., García-Alcocer, G., & Berumen, L. C. (2018). Effect of A549 neuroendocrine differentiation on cytotoxic immune response. Endocrine connections, 7(5), 791–802. [CrossRef]
- Fosado, R., Soto-Hernández, J. E., Núñez-Anita, R. E., Aceves, C., Berumen, L. C., & Mendieta, I. (2023). Neuroendocrine Differentiation of Lung Cancer Cells Impairs the Activation of Antitumor Cytotoxic Responses in Mice. International journal of molecular sciences, 24(2), 990. [CrossRef]
- Modlin, I. M., Bodei, L., & Kidd, M. (2016). Neuroendocrine tumor biomarkers: From monoanalytes to transcripts and algorithms. Best practice & research. Clinical endocrinology & metabolism, 30(1), 59–77. [CrossRef]
- Robinson, M., Turnbull, S., Lee, B. Y., & Leonenko, Z. (2020). The effects of melatonin, serotonin, tryptophan and NAS on the biophysical properties of DPPC monolayers. Biochimica et biophysica acta. Biomembranes, 1862(9), 183363. [CrossRef]
- Moradkhani, F., Moloudizargari, M., Fallah, M., Asghari, N., Heidari Khoei, H., & Asghari, M. H. (2020). Immunoregulatory role of melatonin in cancer. Journal of cellular physiology, 235(2), 745–757. [CrossRef]
- Wu, K.K. Cytoguardin: A Tryptophan Metabolite against Cancer Growth and Metastasis. Int J Mol Sci. 2021;22(9):4490. Published 2021 Apr 26. [CrossRef]
- Jablonska, K., Nowinska, K., Piotrowska, A., Partynska, A., Katnik, E., Pawelczyk, K., Glatzel-Plucinska, N., Podhorska-Okolow, M., & Dziegiel, P. (2019). Prognostic Impact of Melatonin Receptors MT1 and MT2 in Non-Small Cell Lung Cancer (NSCLC). Cancers, 11(7), 1001. Kasprzak, A., Zabel, M., & Biczysko, W. (2007) Selected markers (chromogranin A, neuron-specific enolase, synaptophysin, protein gene product 9.5) in diagnosis and prognosis of neuroendocrine pulmonary tumours. Pol J Pathol. 58(1):23-33. [CrossRef]
- Chao, Y. C., Lee, K. Y., Wu, S. M., Kuo, D. Y., Shueng, P. W., & Lin, C. W. (2021). Melatonin Downregulates PD-L1 Expression and Modulates Tumor Immunity in KRAS-Mutant Non-Small Cell Lung Cancer. International journal of molecular sciences, 22(11), 5649. [CrossRef]
- Han, Y., Liu, D., & Li, L. (2020). PD-1/PD-L1 pathway: current researches in cancer. American journal of cancer research, 10(3), 727–742.
- Patsoukis N, Wang Q, Strauss L, Boussiotis VA. Revisiting the PD-1 pathway. Sci Adv. 2020;6(38):eabd2712. Published 2020 Sep 18. [CrossRef]
- Huang, J., Weng, Q., Shi, Y., Mao, W., Zhao, Z., Wu, R., Ren, J., Fang, S., Lu, C., Du, Y., & Ji, J. (2020). MicroRNA-155-5p suppresses PD-L1 expression in lung adenocarcinoma. FEBS open bio, 10(6), 1065–1071. [CrossRef]
- Rui, R., Zhou, L., & He, S. (2023) Cancer immunotherapies: advances and bottlenecks. Front Immunol. 2023;14:1212476. [CrossRef]
- Liu, S., Yang, W., Li, Y., & Sun, C. (2023). Fetal bovine serum, an important factor affecting the reproducibility of cell experiments. Scientific reports, 13(1), 1942. [CrossRef]
- Hardwick, L. J., Ali, F. R., Azzarelli, R., & Philpott, A. (2015). Cell cycle regulation of proliferation versus differentiation in the central nervous system. Cell and tissue research, 359(1), 187–200. [CrossRef]
- Kasprzak, A., Zabel, M., & Biczysko, W. (2007) Selected markers (chromogranin A, neuron-specific enolase, synaptophysin, protein gene product 9.5) in diagnosis and prognosis of neuroendocrine pulmonary tumours. Pol J Pathol. 58 (1): 23-33.
- Yang, L., Fan, Y., & Lu, H. (2022). Pulmonary Large Cell Neuroendocrine Carcinoma. Pathology oncology research: POR, 28, 1610730. [CrossRef]
- Rashid, M. U., & Coombs, K. M. (2019). Serum-reduced media impacts on cell viability and protein expression in human lung epithelial cells. Journal of cellular physiology, 234(6), 7718–7724. [CrossRef]
- Lu JJ, Fu L, Tang Z, et al. Melatonin inhibits AP-2β/hTERT, NF-κB/COX-2 and Akt/ERK and activates caspase/Cyto C signaling to enhance the antitumor activity of berberine in lung cancer cells. Oncotarget. 2016;7(3):2985-3001. [CrossRef]
- Talib, W. H., Alsayed, A. R., Abuawad, A., Daoud, S., & Mahmod, A. I. (2021). Melatonin in Cancer Treatment: Current Knowledge and Future Opportunities. Molecules (Basel, Switzerland), 26(9), 2506. [CrossRef]
- Sun, Q., Zhang, J., Li, X., Yang, G., Cheng, S., Guo, D., Zhang, Q., Sun, F., Zhao, F., Yang, D., Wang, S., Wang, T., Liu, S., Zou, L., Zhang, Y., & Liu, H. (2022). The ubiquitin-specific protease 8 antagonizes melatonin-induced endocytic degradation of MT1 receptor to promote lung adenocarcinoma growth. Journal of advanced research, 41, 1–12. [CrossRef]
- Okamoto, H. H., Cecon, E., Nureki, O., Rivara, S., & Jockers, R. (2024). Melatonin receptor structure and signaling. Journal of pineal research, 76(3), e12952. [CrossRef]
- Hwang, S., Kwon, A. Y., Jeong, J. Y., Kim, S., Kang, H., Park, J., Kim, J. H., Han, O. J., Lim, S. M., & An, H. J. (2020). Immune gene signatures for predicting durable clinical benefit of anti-PD-1 immunotherapy in patients with non-small cell lung cancer. Scientific reports, 10(1), 643. [CrossRef]
- Sasi, B., Ethiraj, P., Myers, J., et al. (2021) Regulation of PD-L1 expression is a novel facet of cyclic-AMP-mediated immunosuppression. Leukemia. ;35(7):1990-2001. [CrossRef]
- Liu, W., Yu, L., Feng, Y., et al. Which Is More Suitable for First-Line Treatment of Extensive-Stage Small Cell Lung Cancer, PD-L1 Inhibitors Versus PD-1 Inhibitors? A Systematic Review and Network Meta-Analysis. Clin Respir J. 2024;18(7):e13804. [CrossRef]
- Zhang, Q., Kou, S., Cui, Y., et al. Ternary Dry Powder Agglomerate Inhalation Formulation of Melatonin With Air Jet Mixing to Improve In Vitro And In Vivo Performance. J Pharm Sci. 2024;113(2):434-444. [CrossRef]
- Yousry, C., Goyal, M., & Gupta, V. (2024) Excipients for Novel Inhaled Dosage Forms: An Overview. AAPS PharmSciTech. 2024;25(2):36. [CrossRef]
- Caraveo Gutiérrez, M.D., Berumen Segura L.C., Mendieta Trejo, A. I., Escobar Cabrera, J.E., García Alcocer, M.G. A new neuroendocrine model and in vitro effect of melatonin and serotonin on the PD-L1 ligand and its immunomodulatory action. ESMO Immuno-oncology congress 2024, 11-13 December 2024.
Figure 1.
Neuroendocrine differentiation models. Micrography of A549 cells treatment with forskolin 0.5 mM and IBMX 0.5 mM in DMEM 2% FBS and without FBS for 0, 48 and 72 hours. Control groups (Ctrl) were not exposed to cAMP inducers. Bar: 100 μm.
Figure 1.
Neuroendocrine differentiation models. Micrography of A549 cells treatment with forskolin 0.5 mM and IBMX 0.5 mM in DMEM 2% FBS and without FBS for 0, 48 and 72 hours. Control groups (Ctrl) were not exposed to cAMP inducers. Bar: 100 μm.
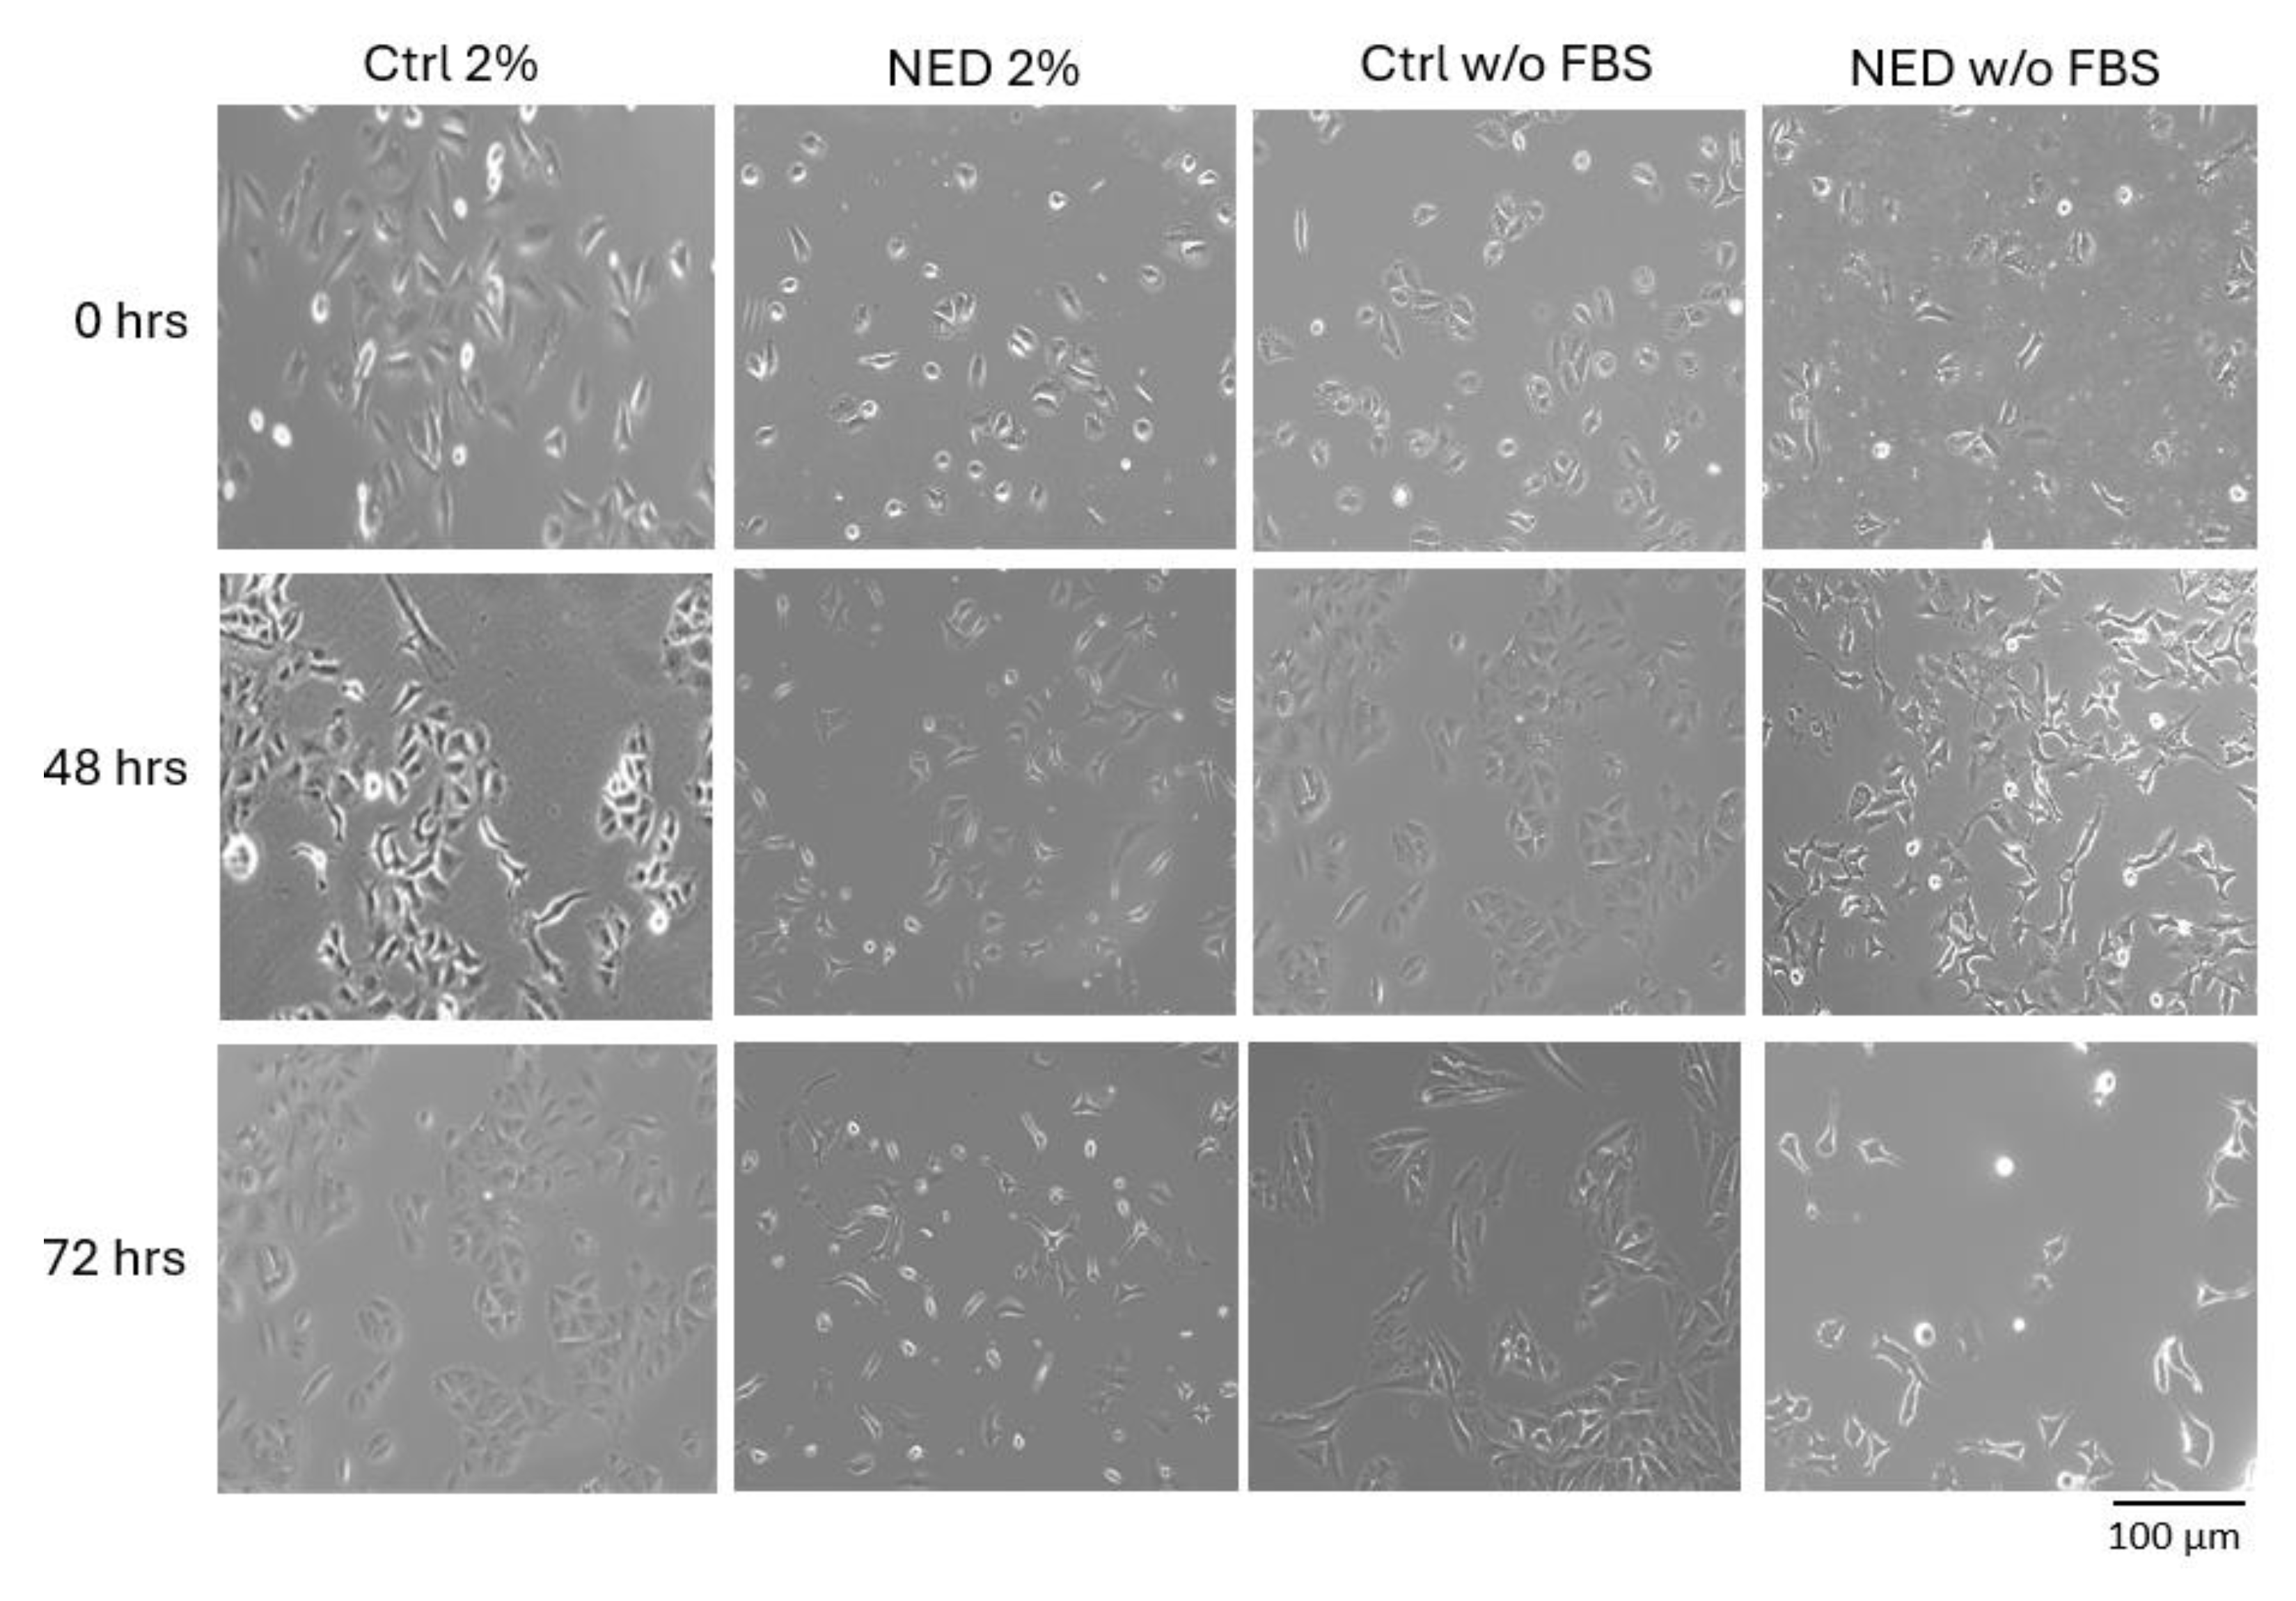
Figure 2.
Synaptophysin as specific marker of neuroendocrine tumors. Treatment with Forskolin and IBMX 0.5 mM each for 72 hours, A) 2% agarose gel to observe the presence of Syp with a band of 349 bp in the neuroendocrine models and their respective controls and B) SYP mRNA relative expression. Statistical analysis was performed using the post hoc Dunnett ANOVA test, ** p < 0.001 respect each of its controls.
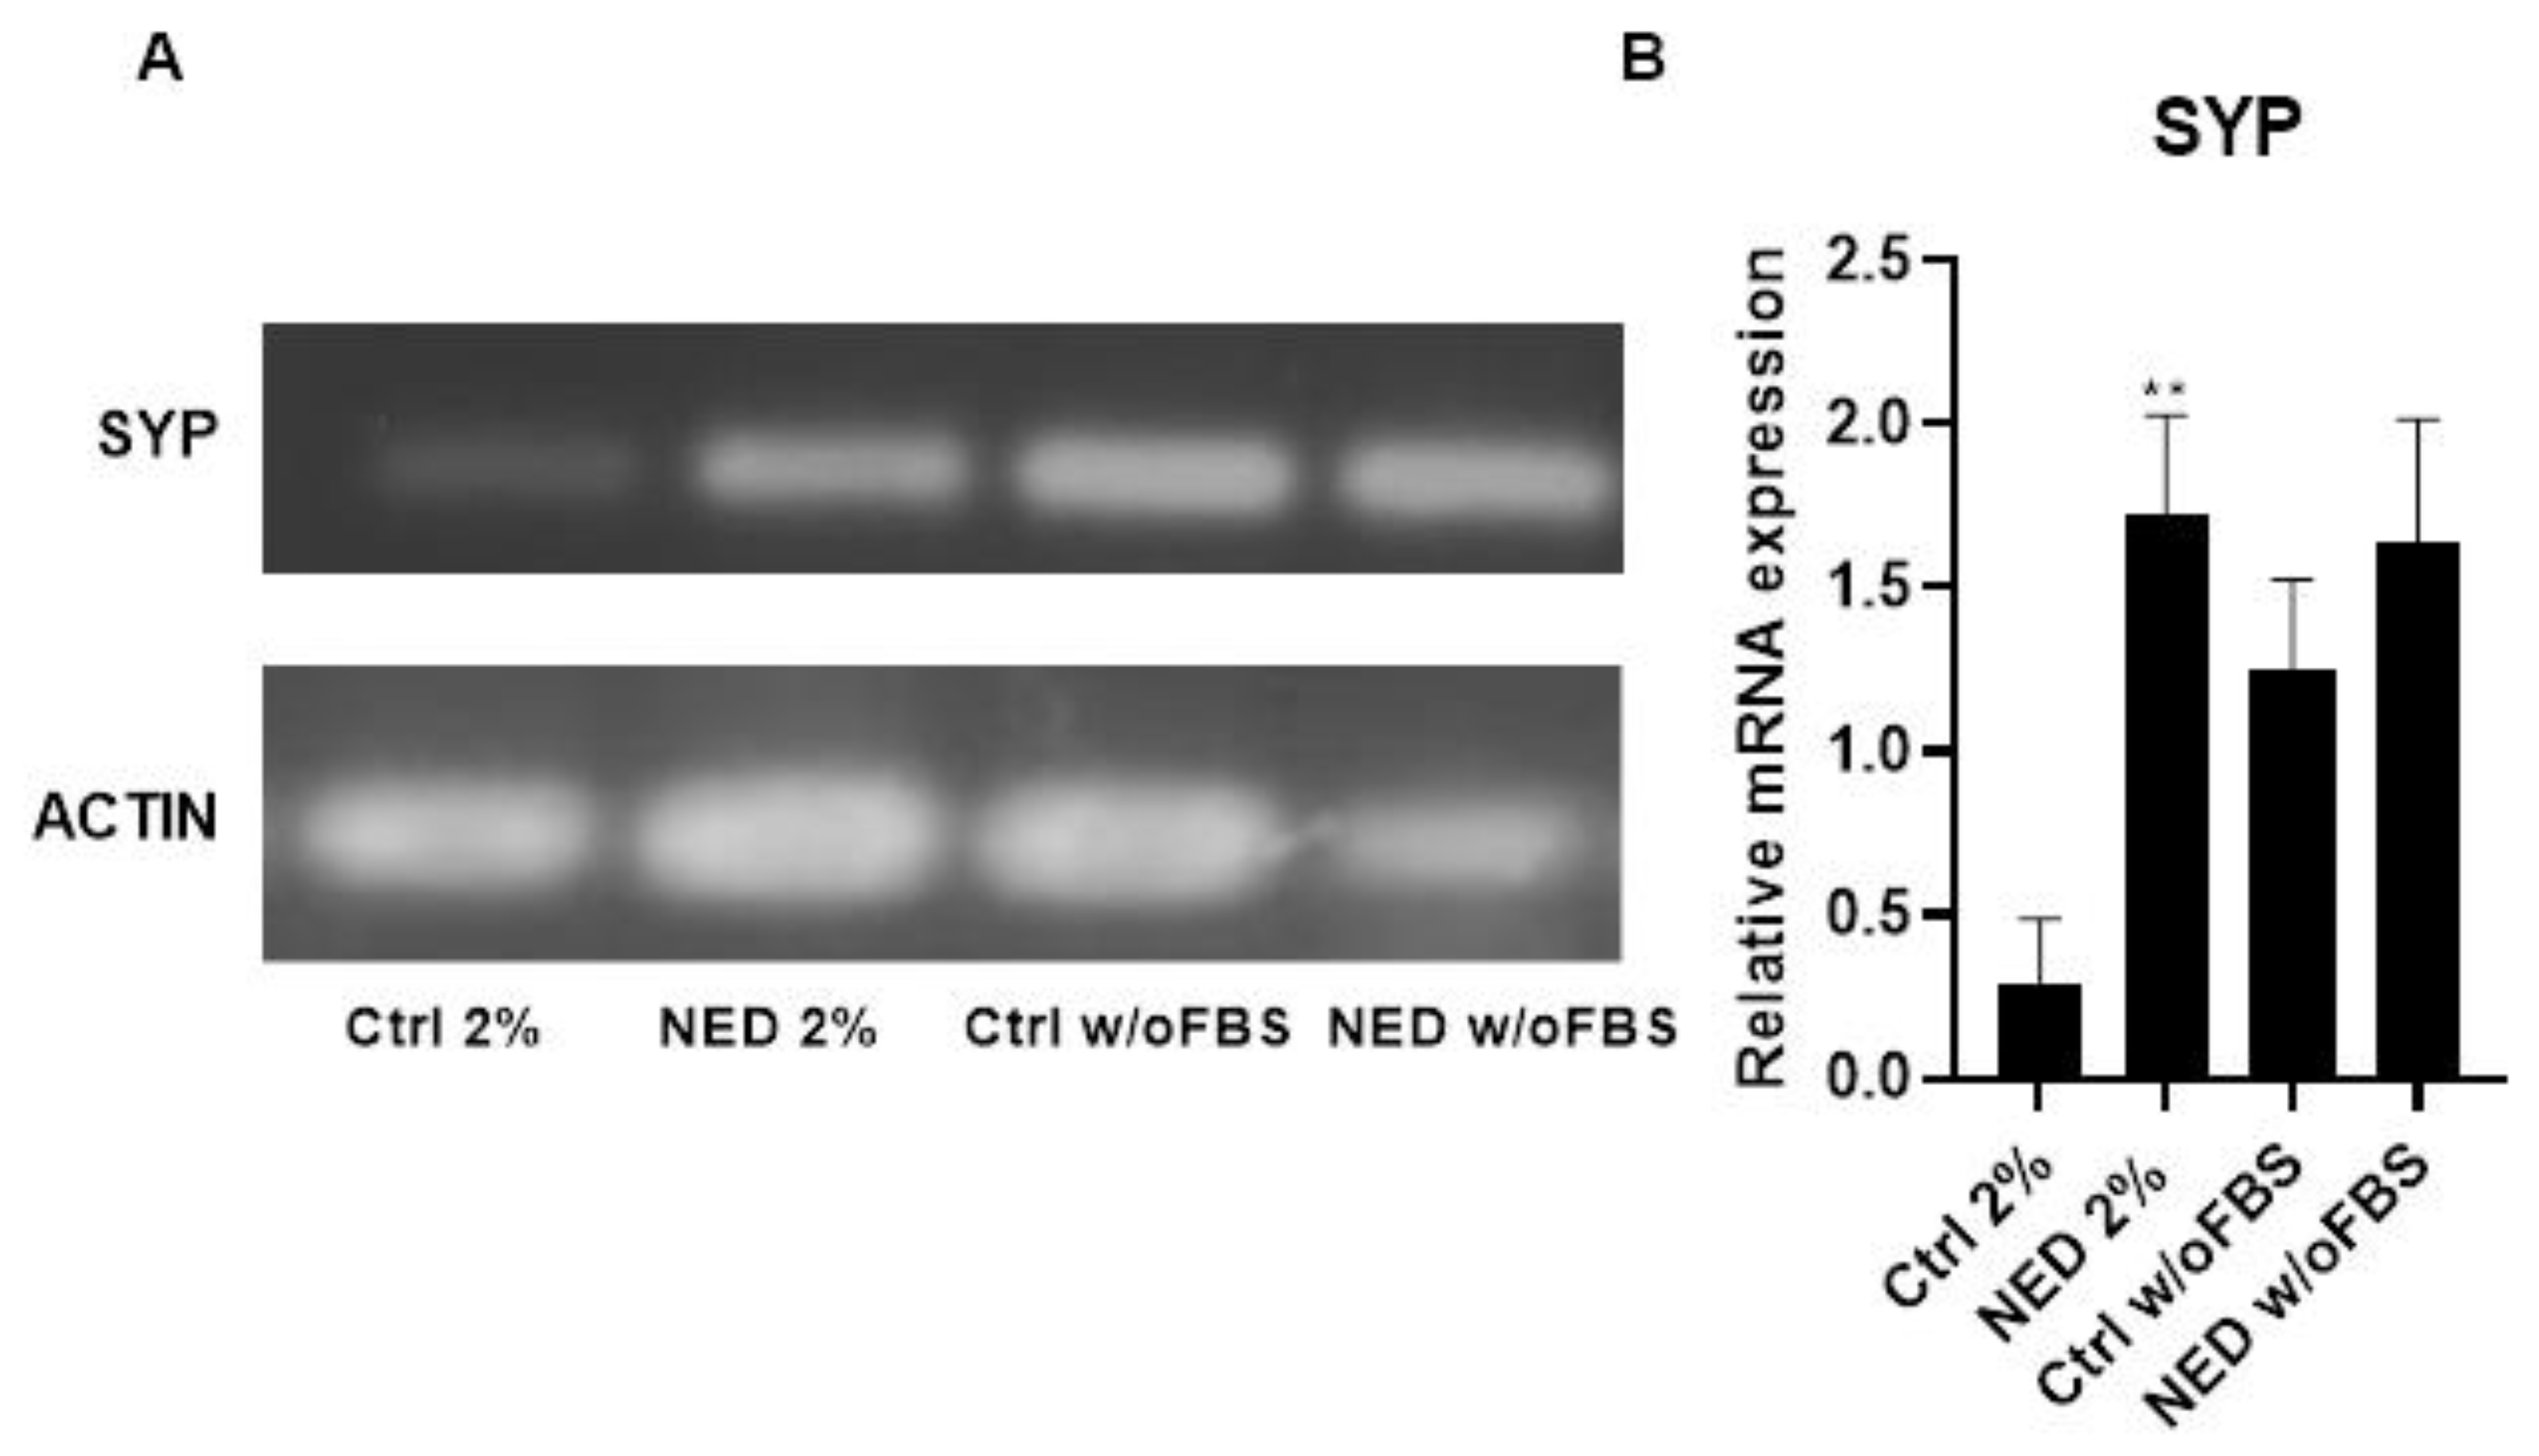
Figure 3.
Effect of melatonin in A549 lung cancer cells. Concentrations of melatonin (0.5, 1, 2.5 and 5 mM) in A549 cells during A) 24 and B) 48 hours with 2% FBS, C) 24 and D) 48 without (w/o) FBS. Statistical analysis was performed with the post hoc Dunnett ANOVA test, **p<0.001 **** p < 0.0001 relative to the control.
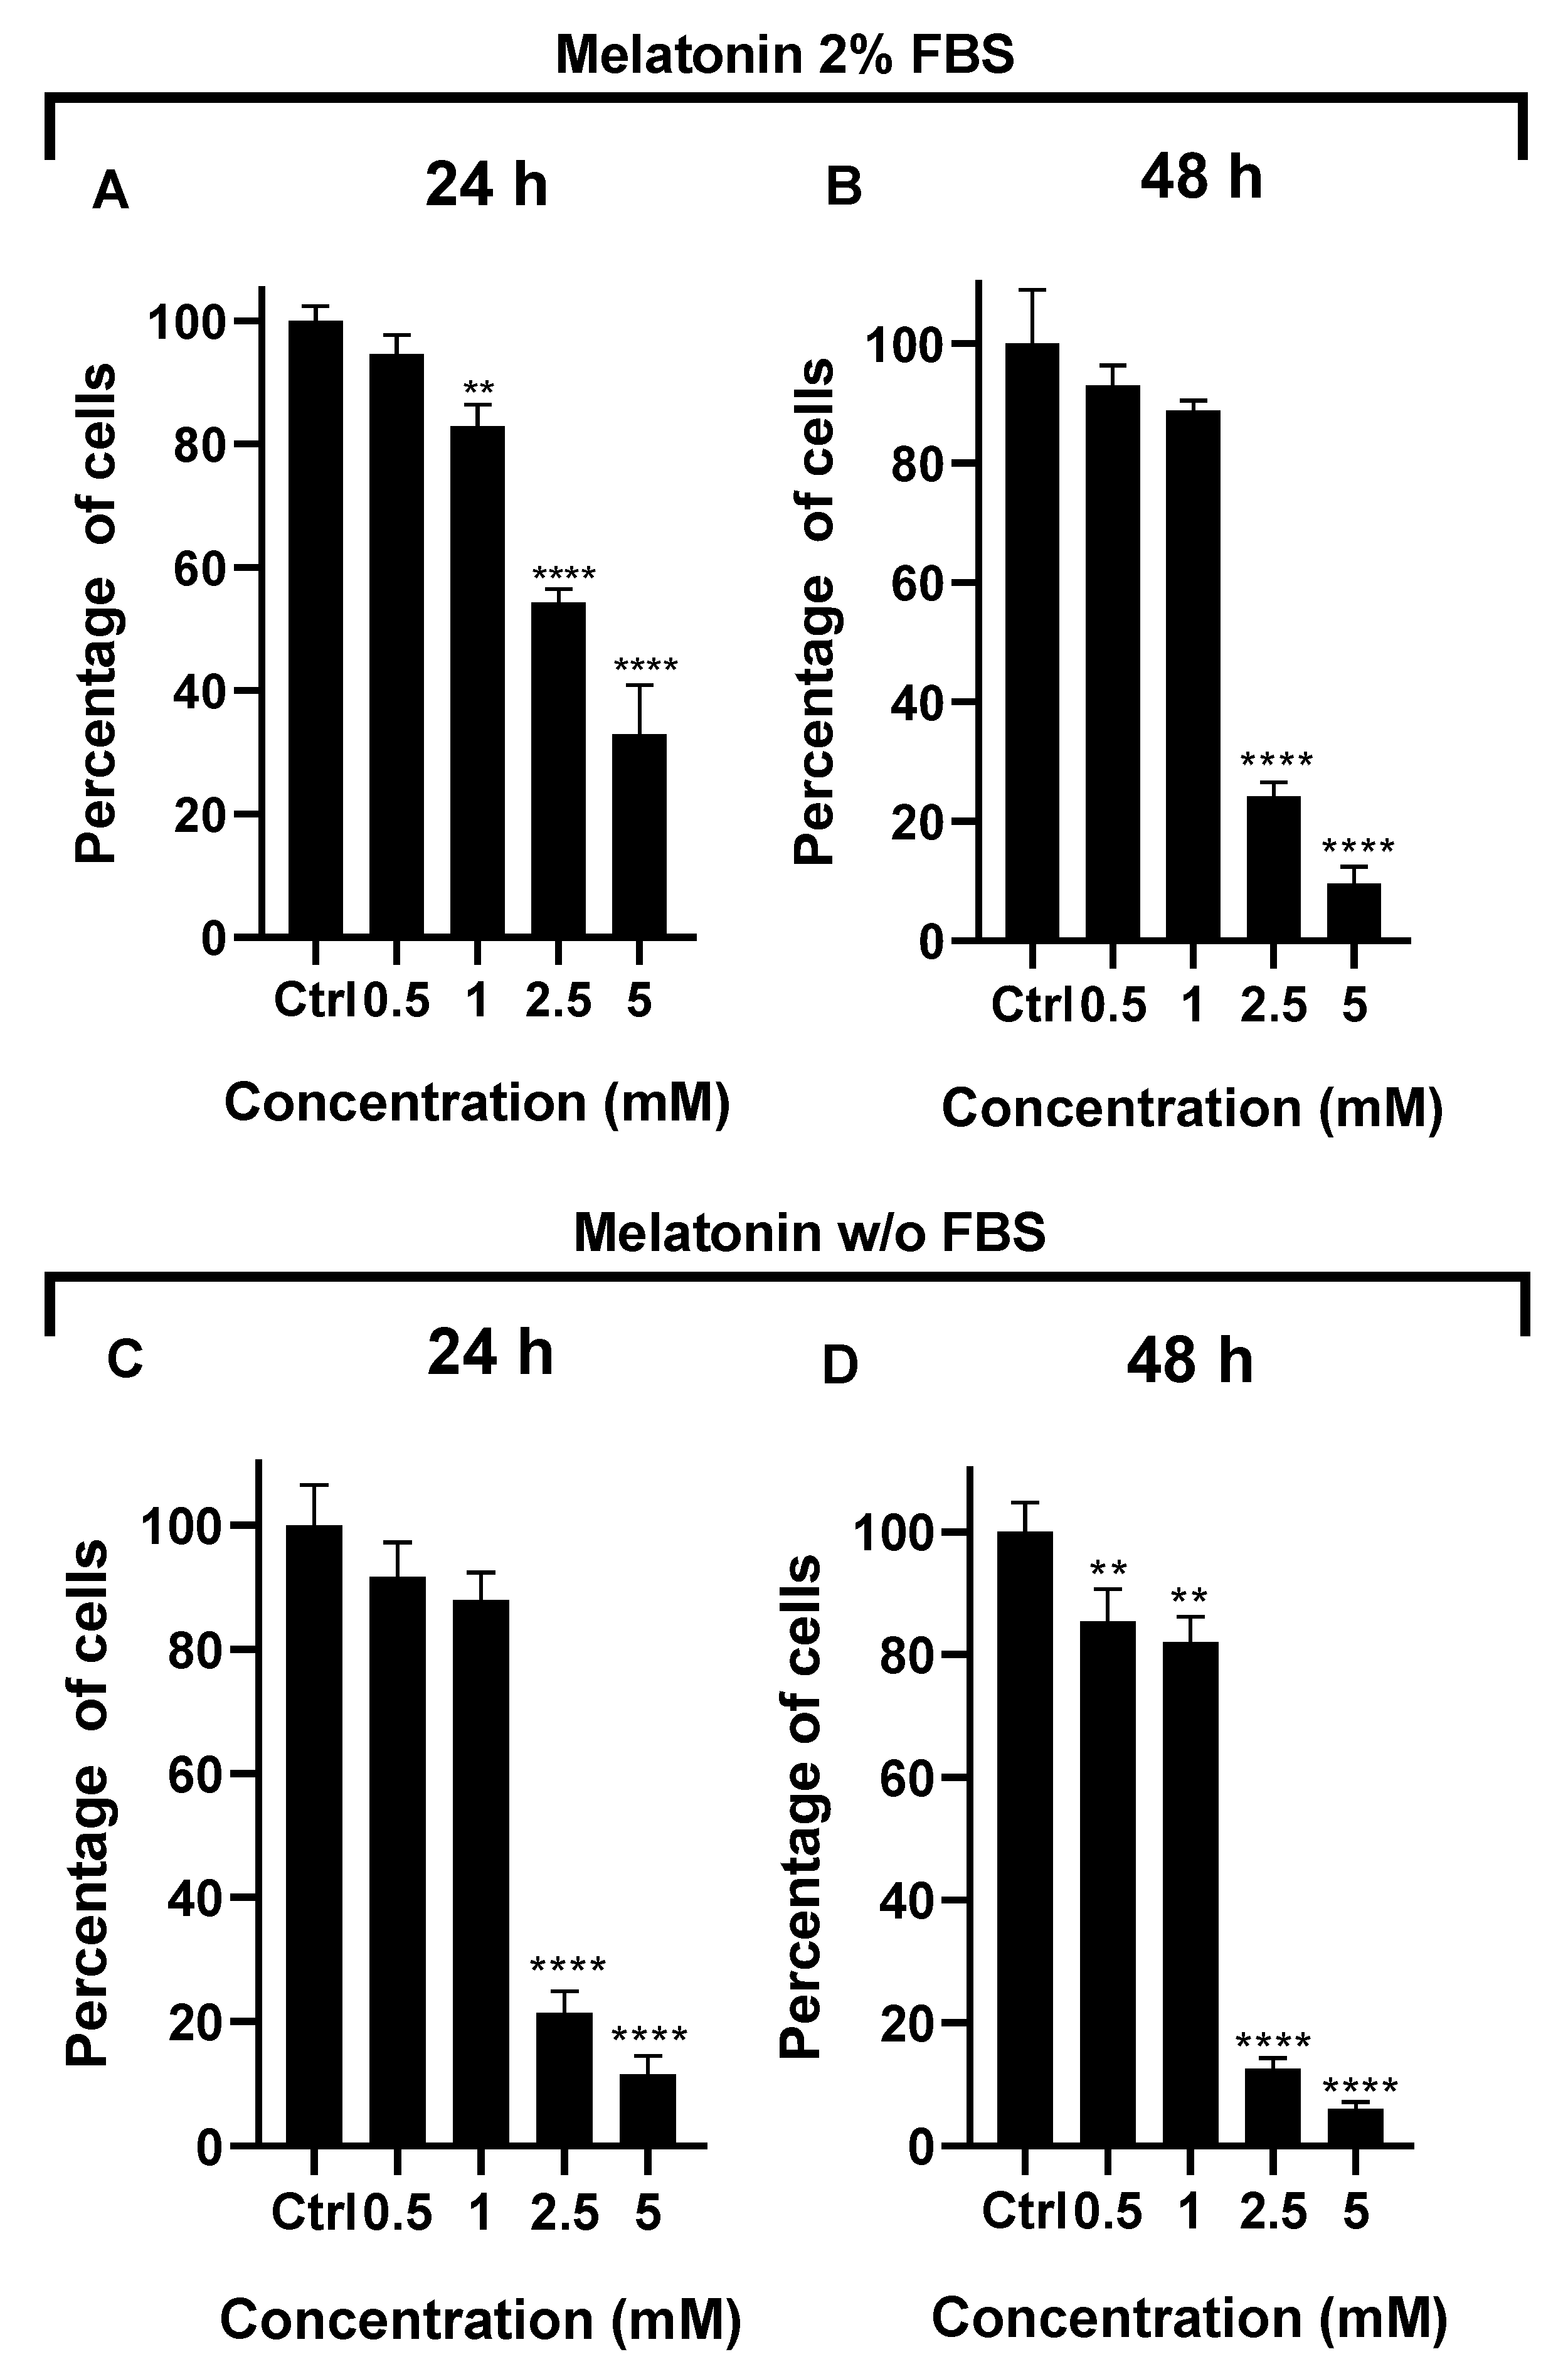
Figure 4.
MT1 receptor in A549 cells and NED model. Treatment with Forskolin and IBMX 0.5 mM each for 72 hours, A) 2% agarose gel that evidence the presence of MT1 with a band of 169 bp in the neuroendocrine models and their respective controls and B) MT1 mRNA relative expression. No statistical differences were found with ANOVA test.
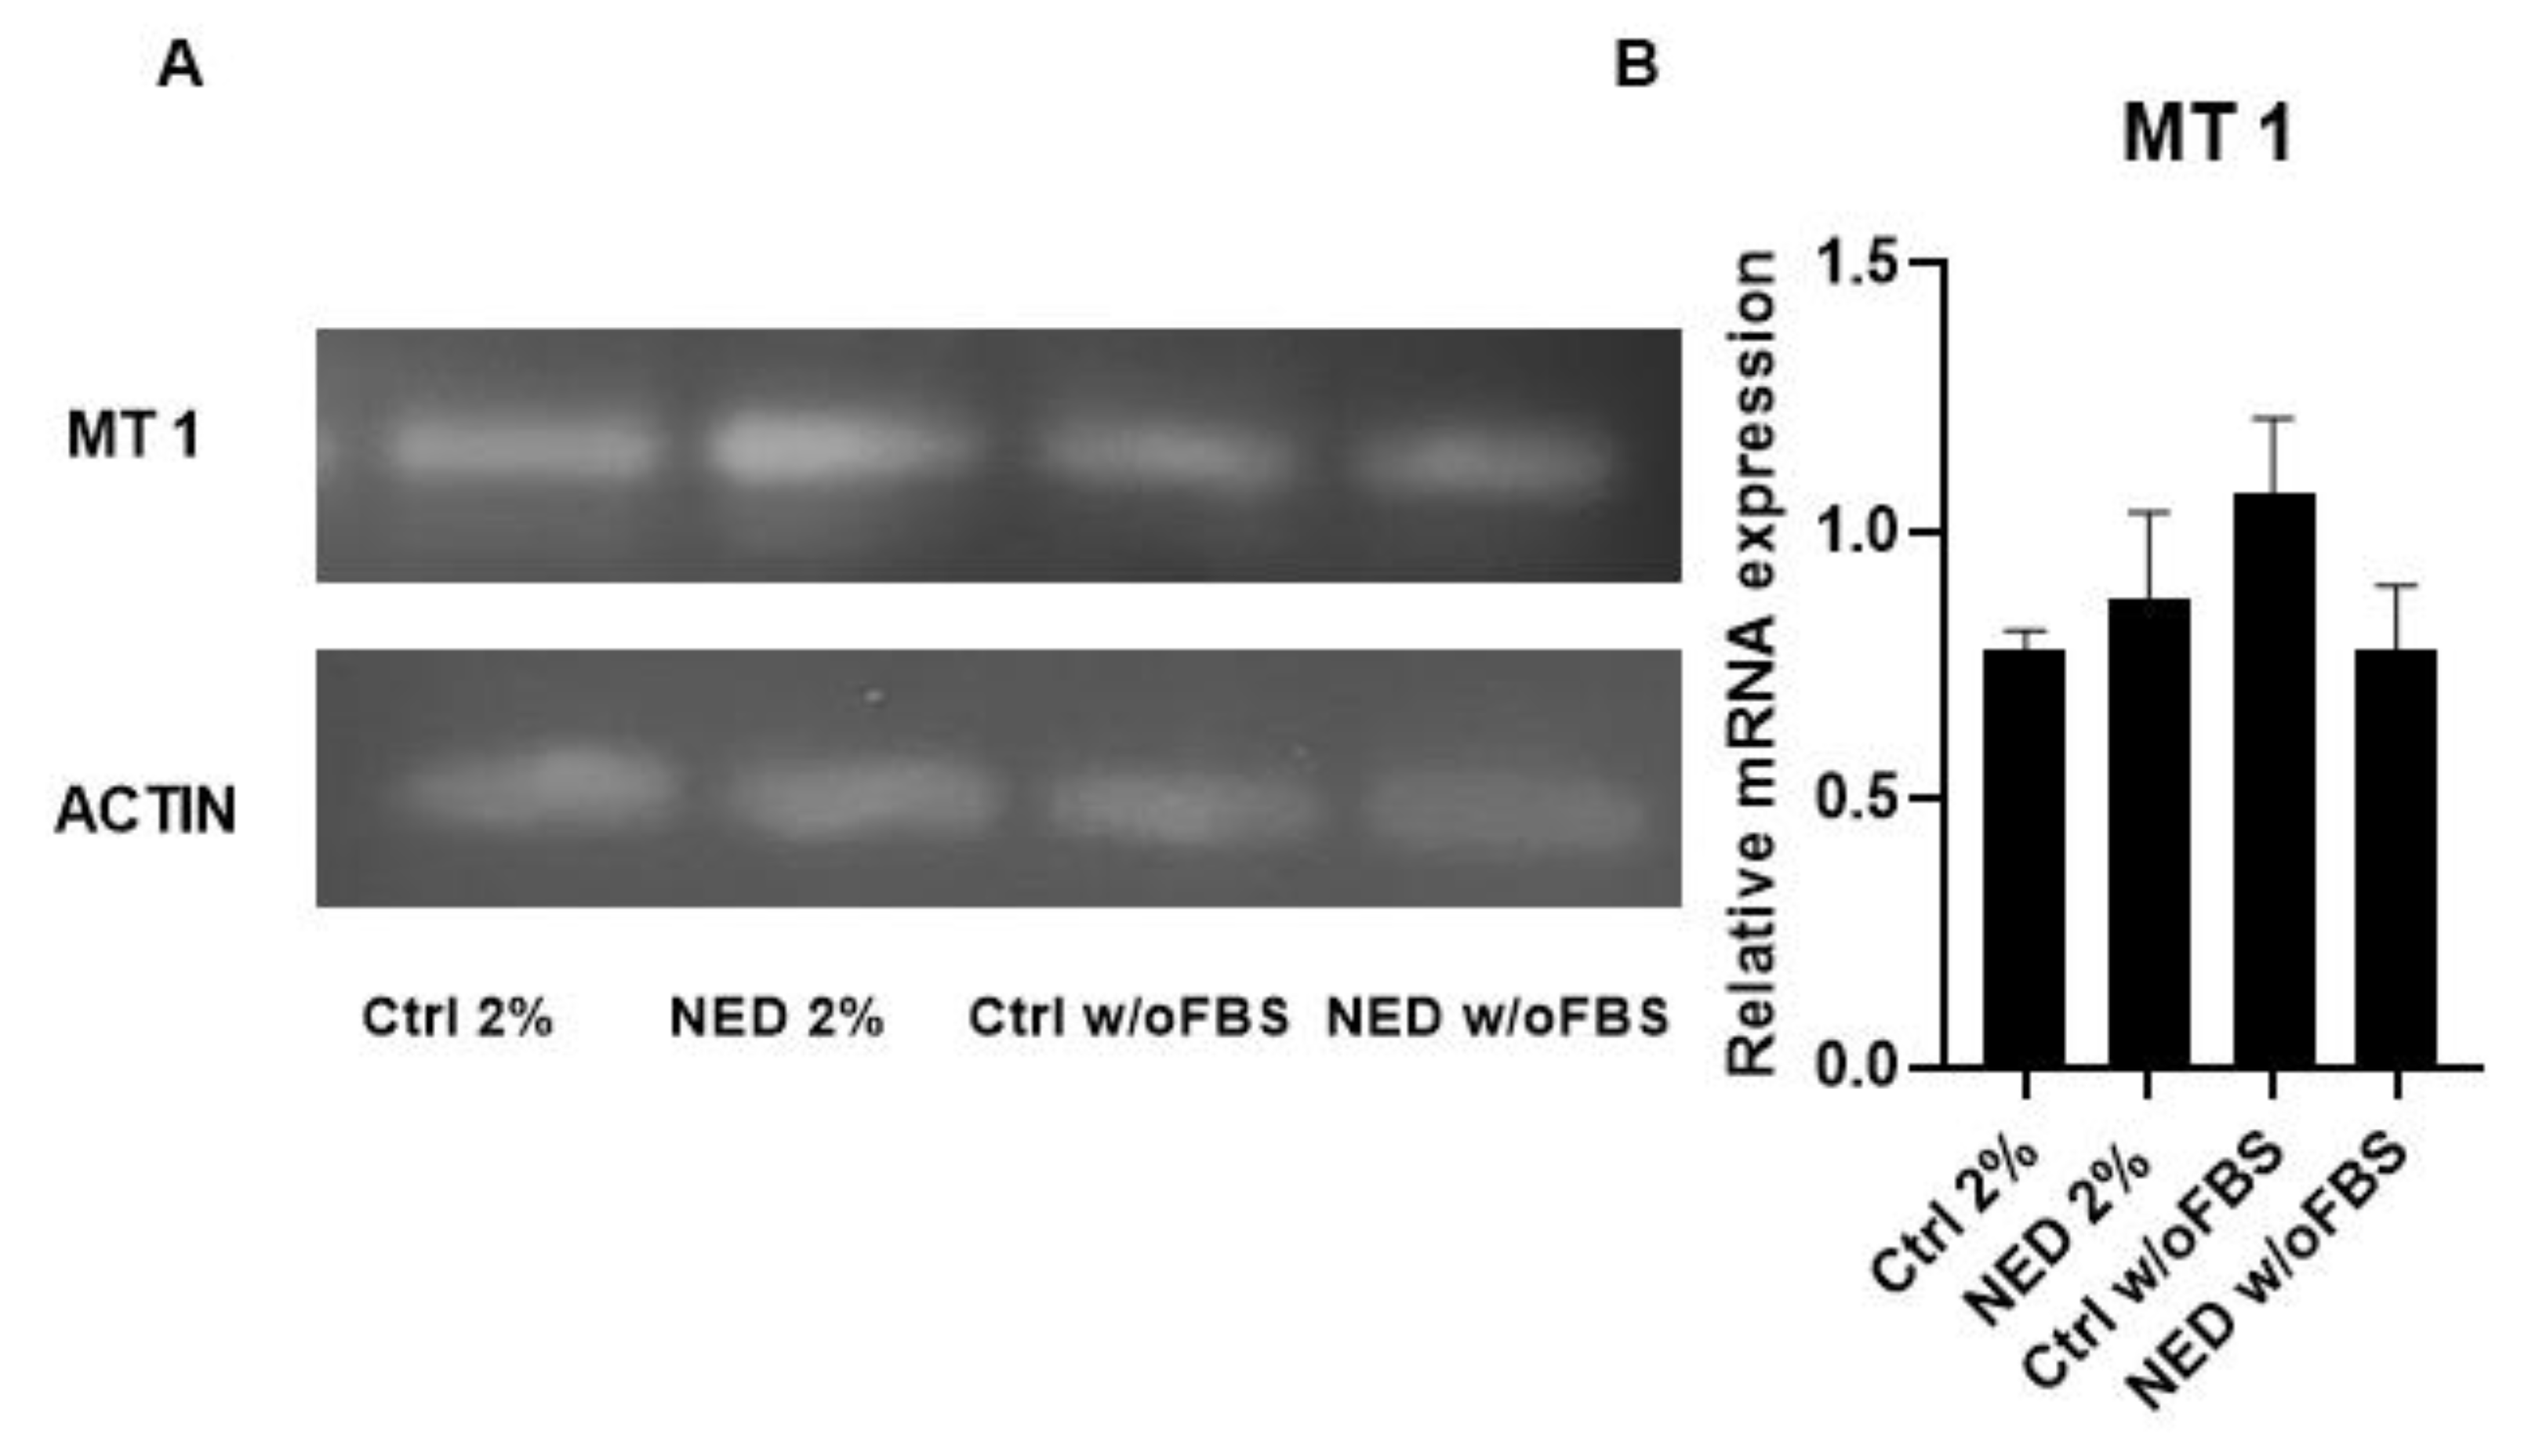
Figure 5.
MT2 receptor in A549 cells and NED model. Treatment with Forskolin and IBMX 0.5 mM each for 72 hours, A) 2% agarose gel that evidence the presence of MT2 with a band of 226 bp in the neuroendocrine models and their respective controls and B) MT2 mRNA relative expression. Statistical analysis was performed using the post hoc Dunnett ANOVA test, ** p < 0.01 respect each of its control.
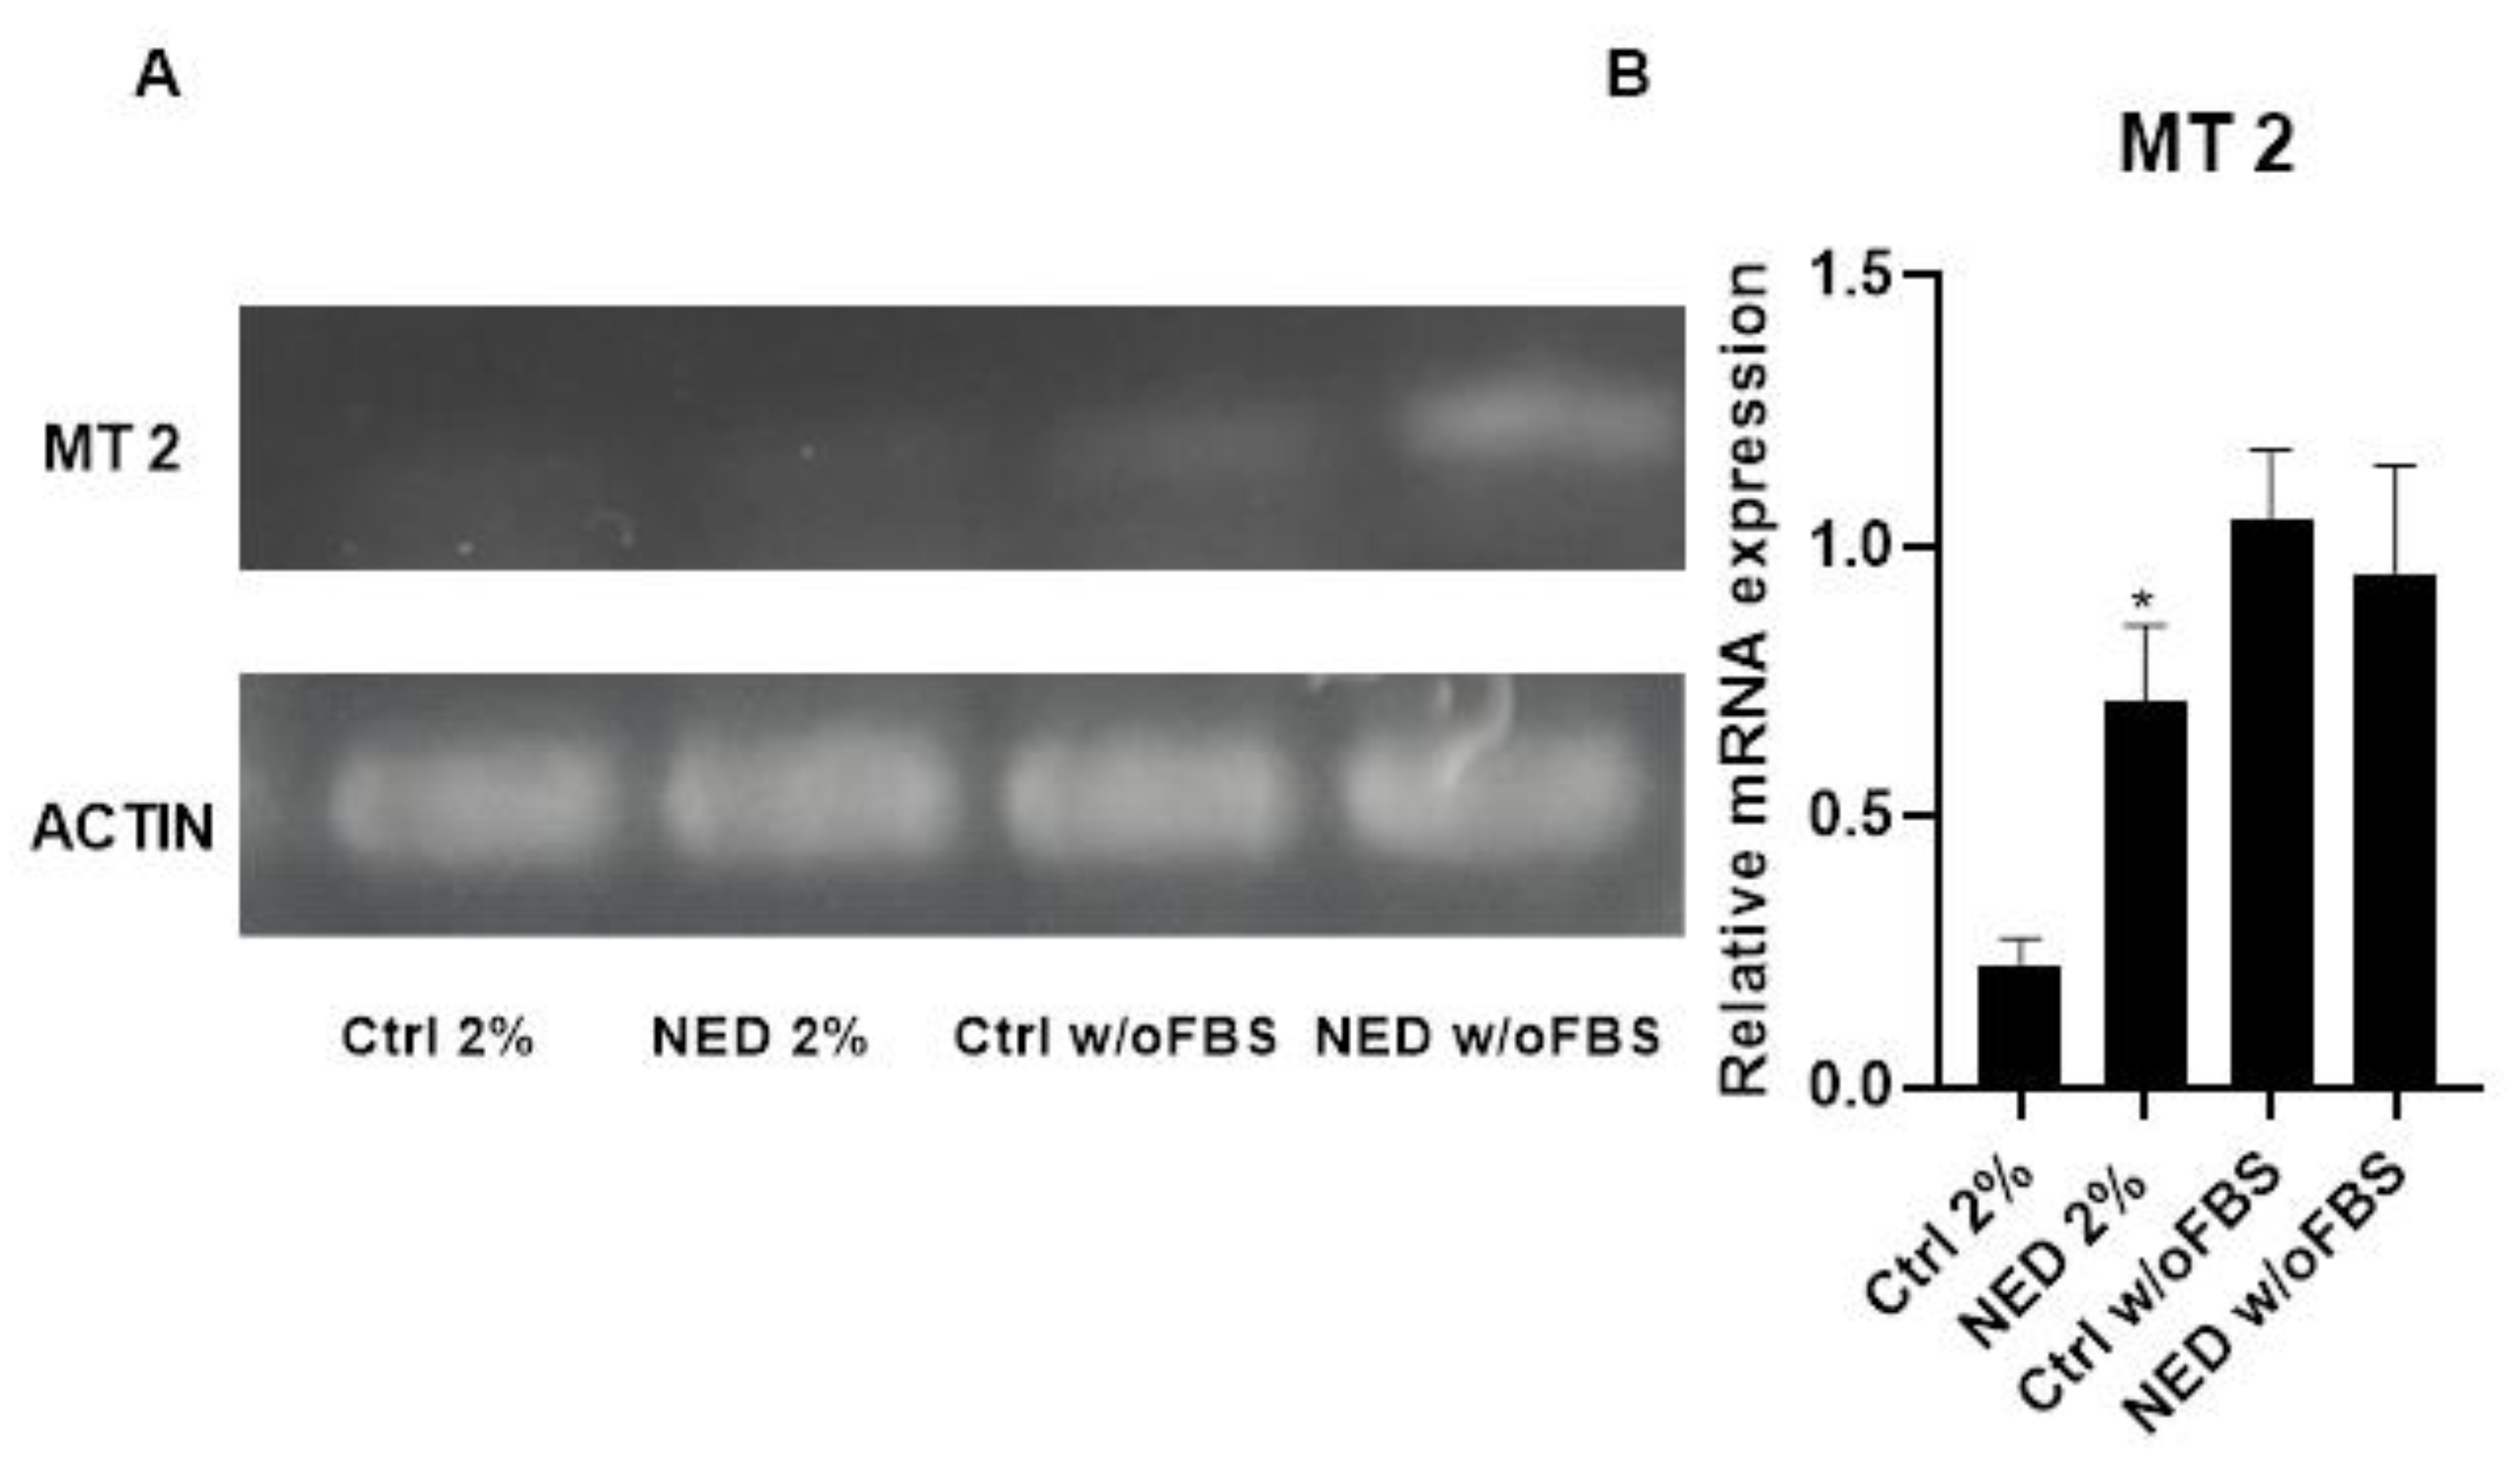
Figure 6.
Effect of melatonin in neuroendocrine models. Concentration of 2.5 mM melatonin in the neuroendocrine model A) Ctrl 2% B) NED with 2% FBS in 24 hours and C) Ctrl 2% D) NED with 2% FBS for 48 hours. Statistical analysis were performed using the Student’s t test, ** p< 0.001 respect each of its controls.
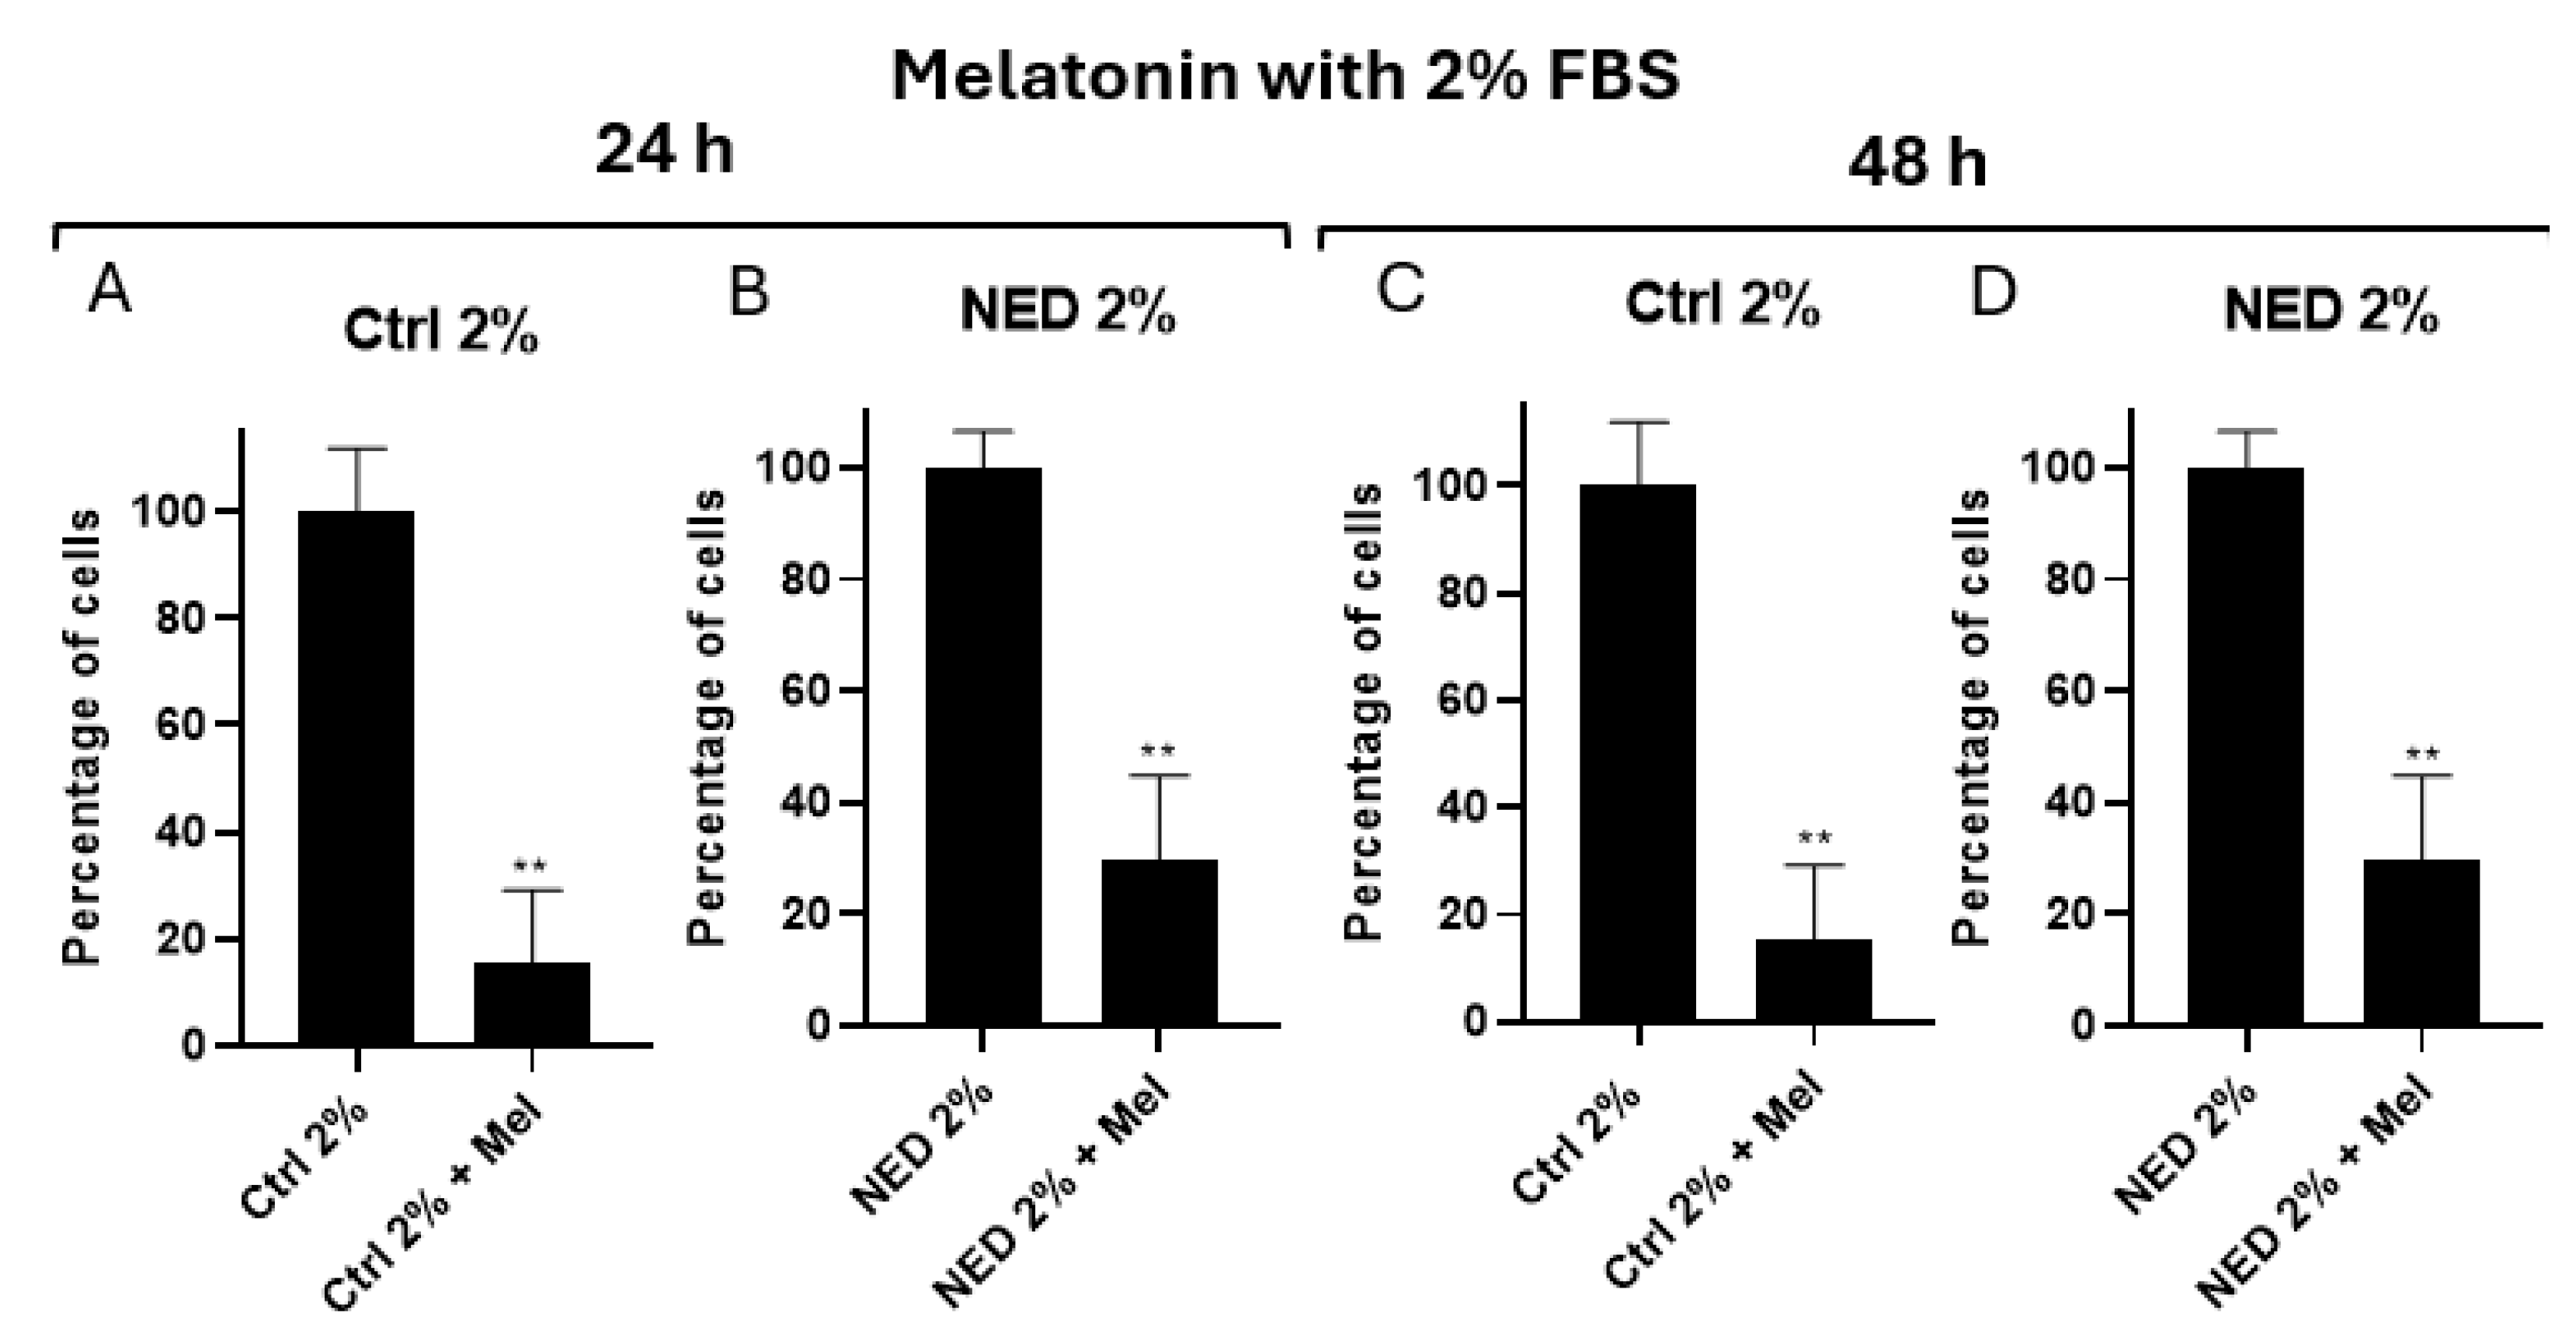
Figure 7.
Effect of melatonin in neuroendocrine models. Concentration of 2.5 mM melatonin in the neuroendocrine model A) Control (ctrl) without FBS, B) NED without FBS in 24 hours and C) Control without FBS D) NED without FBS for 48 hours. Statistical analysis were performed using the Student’s t test, ** p< 0.001 *** p< 0.0001 respect each of its controls.
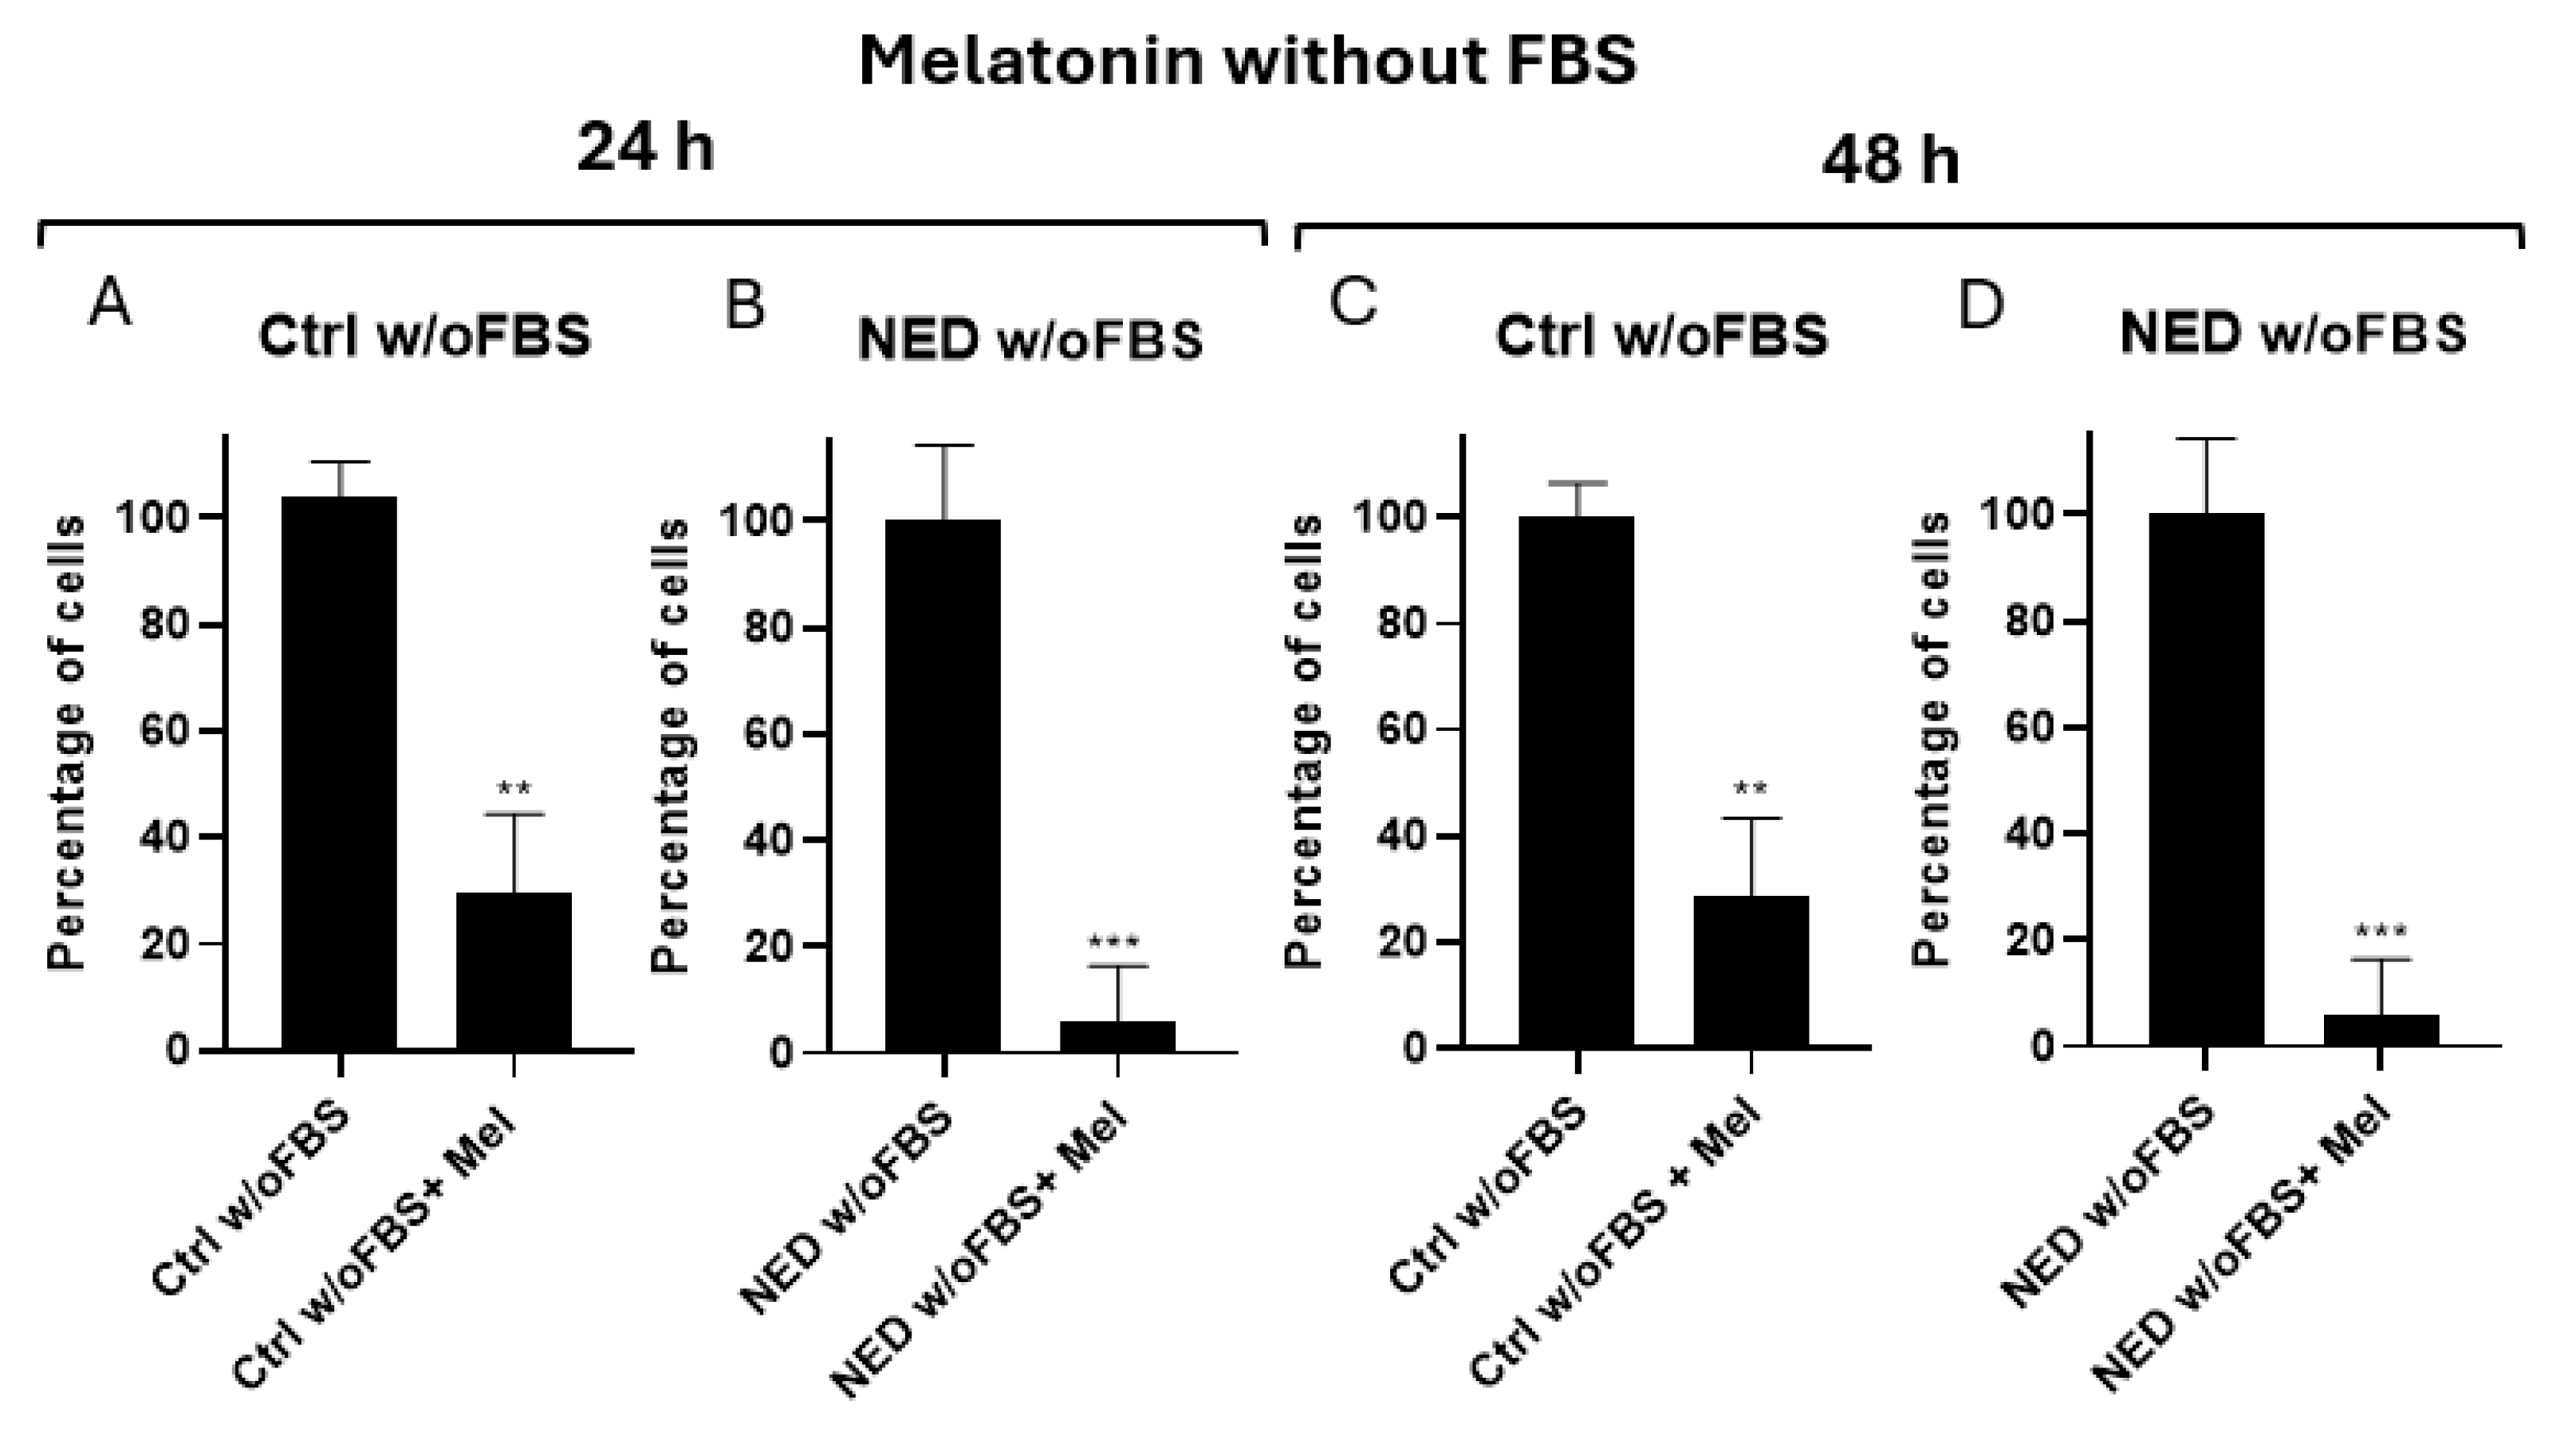
Figure 8.
MT1 receptor in neuroendocrine models treated with melatonin. Treatment with Forskolin and IBMX 0.5 mM each for 72 hours and following 24 hours of exposure to 2.5 mM melatonin. A) A549 cells treated with 2% of FBS, B) A549 cells treated without FBS. Statistical analysis were performed using the post hoc Dunnett ANOVA, ** p < 0.001 respect each of its control.
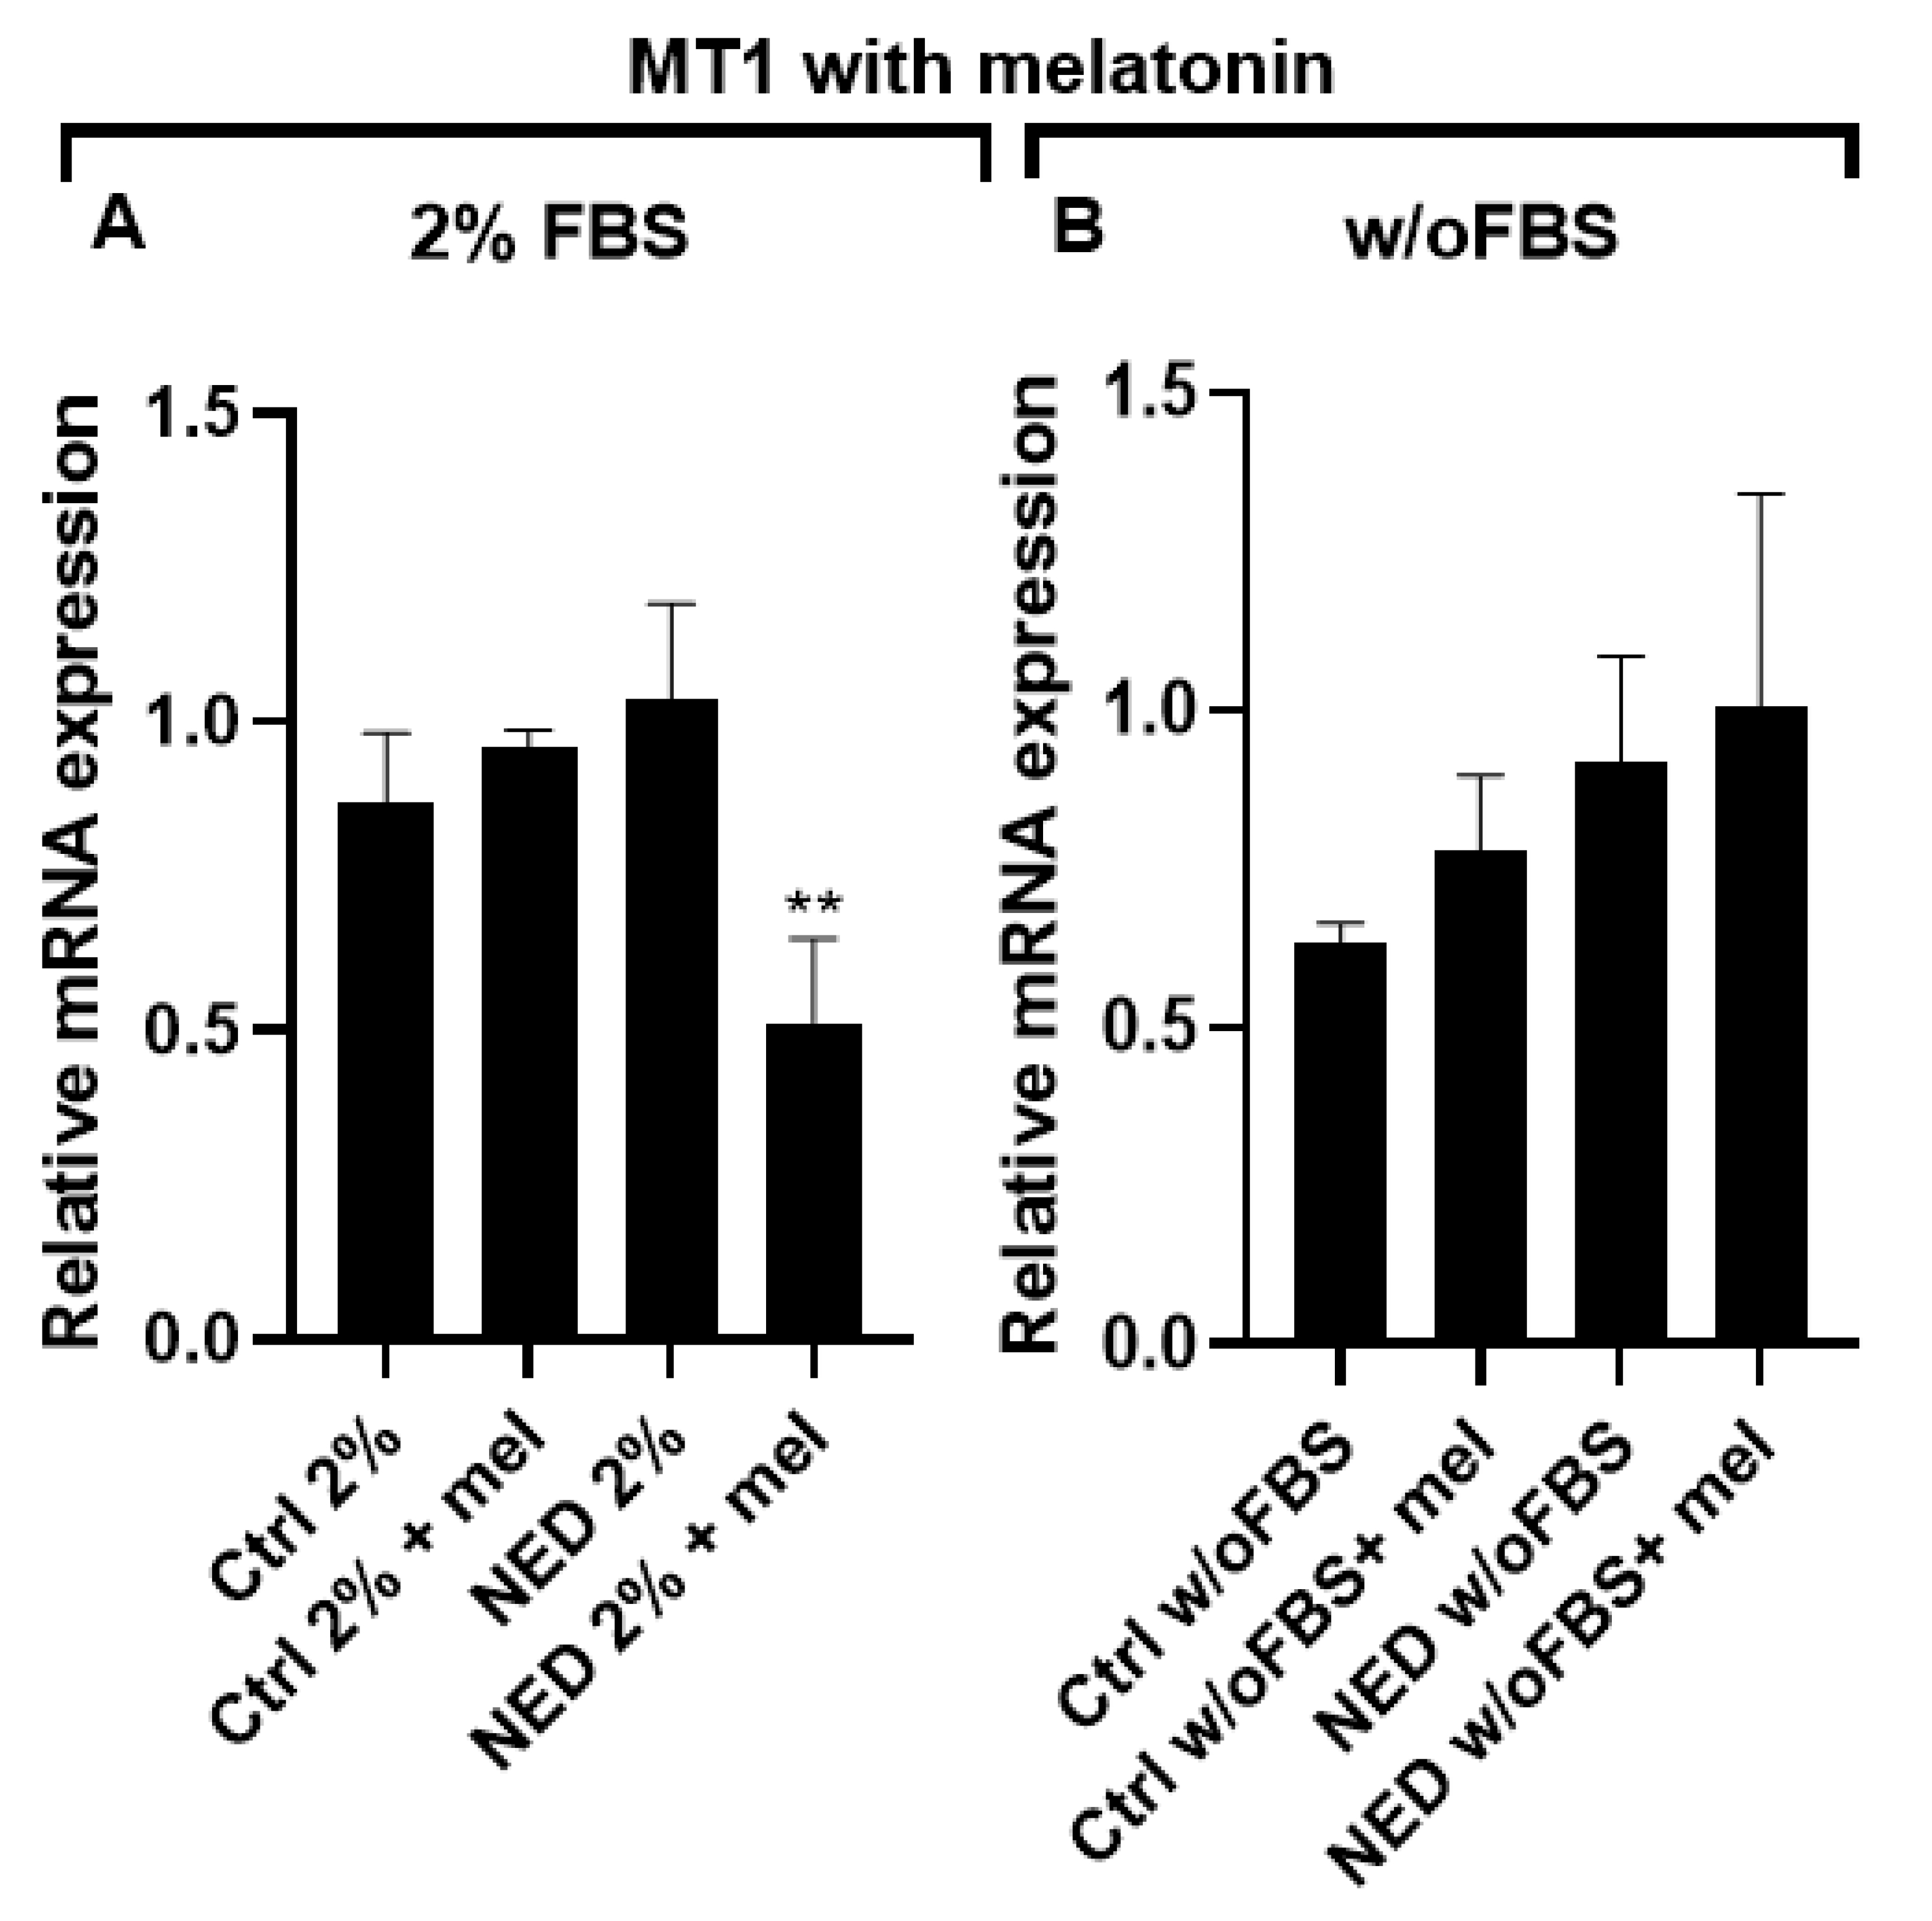
Figure 9.
MT2 receptor in neuroendocrine models treated with melatonin. Treatment with Forskolin and IBMX 0.5 mM each for 72 hours and following 24 hours of exposure to 2.5 mM melatonin. A) A549 cells treated with 2% of FBS and B) A549 cells treated without FBS. No significant differences were found after statistical analysis performed using ANOVA test.
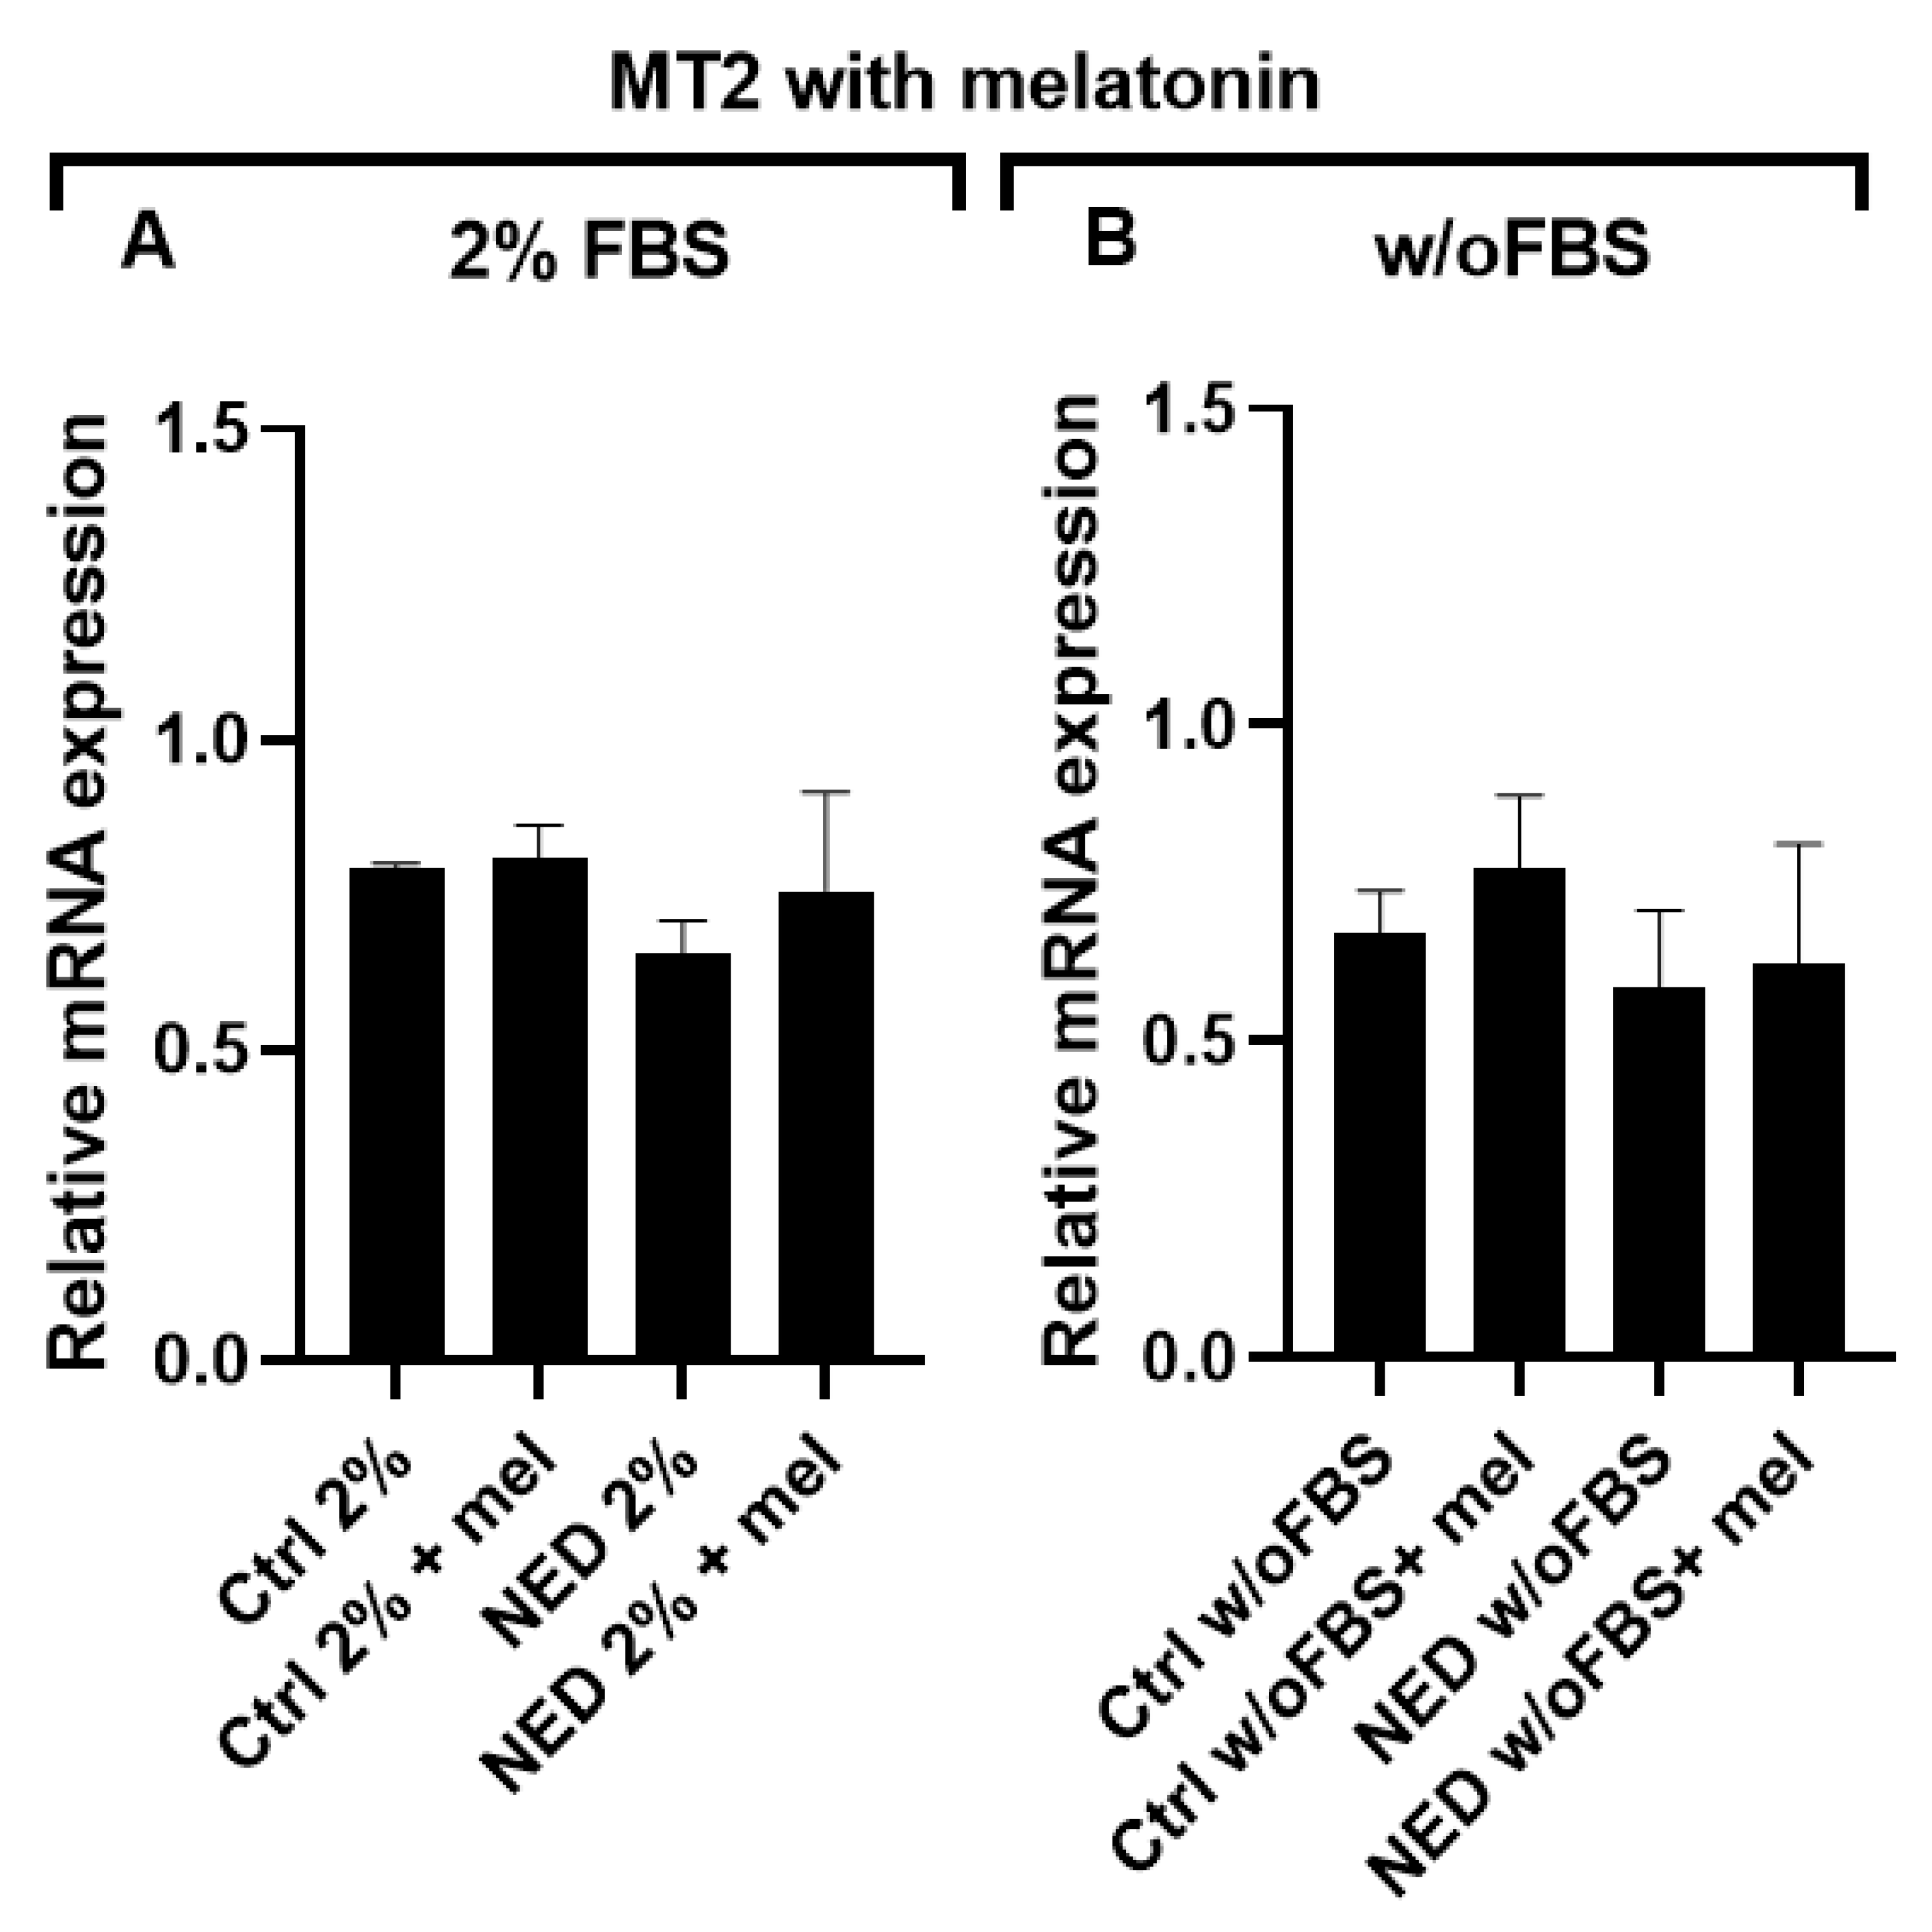
Figure 10.
Presence of PD-L1 in neuroendocrine models. RT-PCR for PD-L1 in neuroendocrine model, A) 2% agarose gel to observe the presence of PD-L1 with a band of 147 bp in the neuroendocrine models and their respective controls b) PD-L1 mRNA relative expression. Statistical analysis were performed using the post hoc Dunnett ANOVA test *** p< 0.0001 respect each of its control.
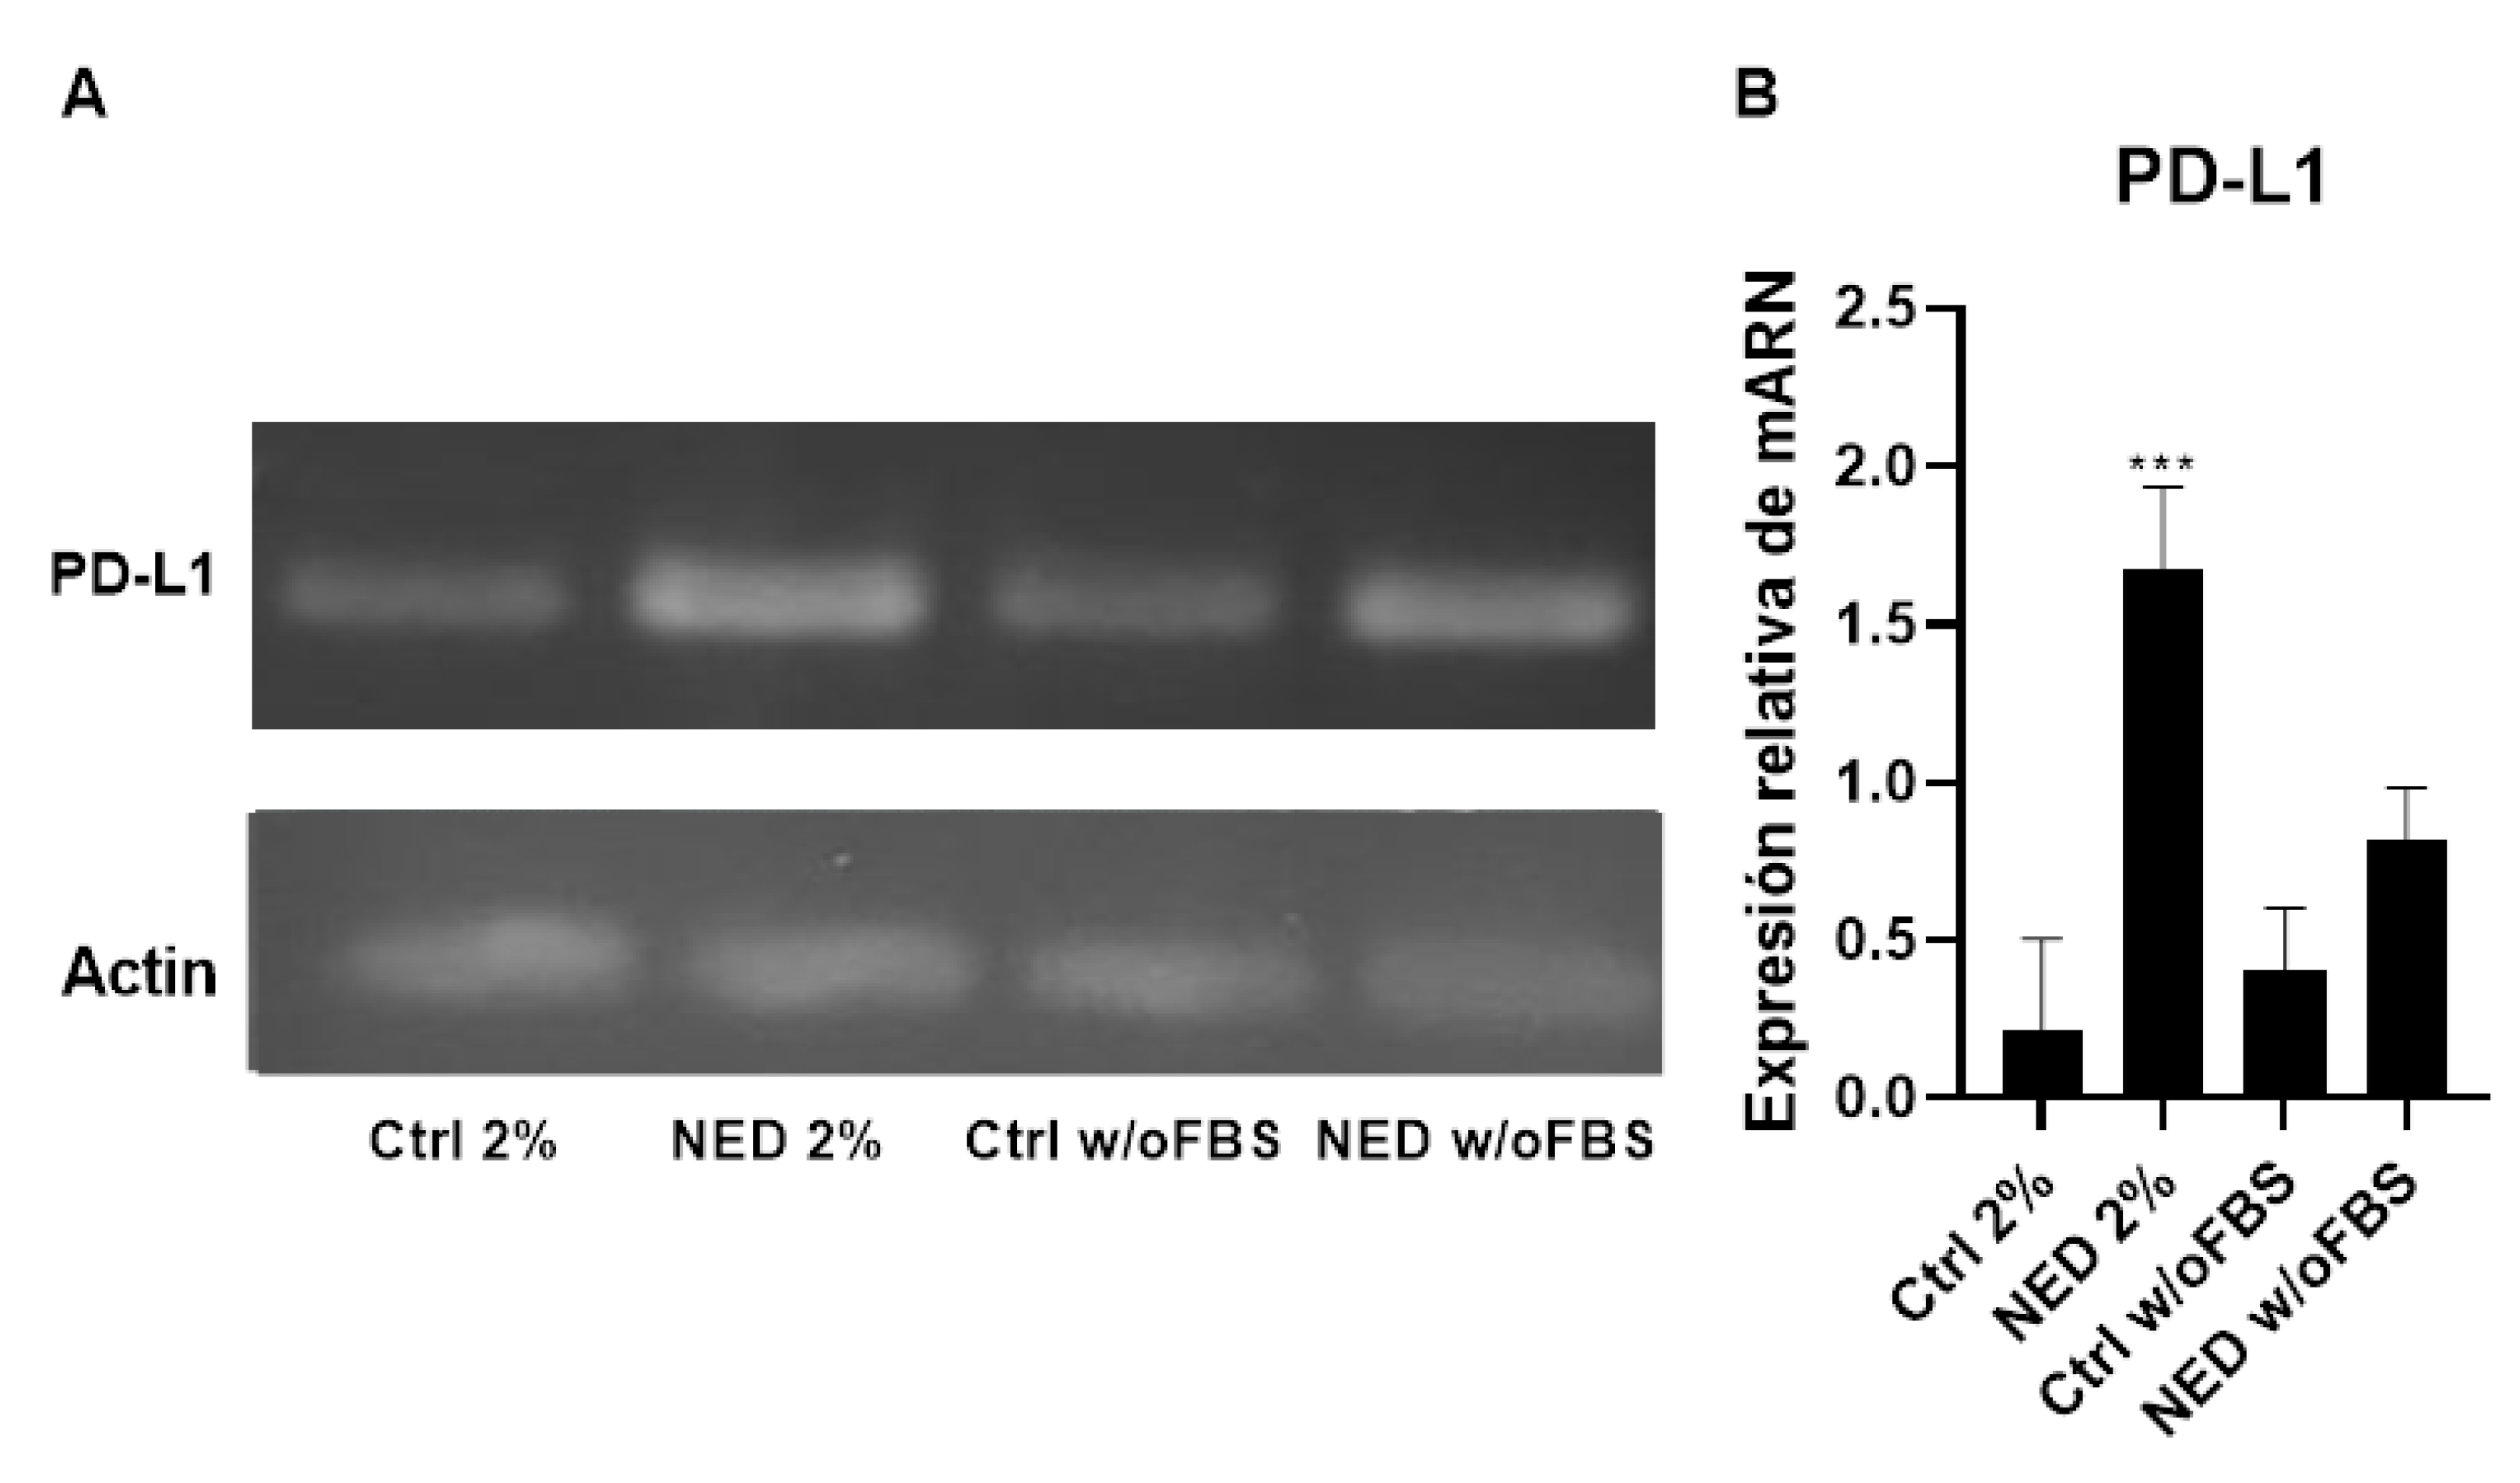
Figure 11.
PD-L1 in neuroendocrine models. Flow cytometry contour plots in A) 2% control (ctrl 2%) B) NED 2% C) control without FBS and D) NED without FBS after 72 hours, for the detection of PD-L1 with phycoerythrin conjugated antibody. E,F) PD-L1 expression percentage. Statistical analysis were performed using Student’s t test, ** p< 0.001 respect each of its control.
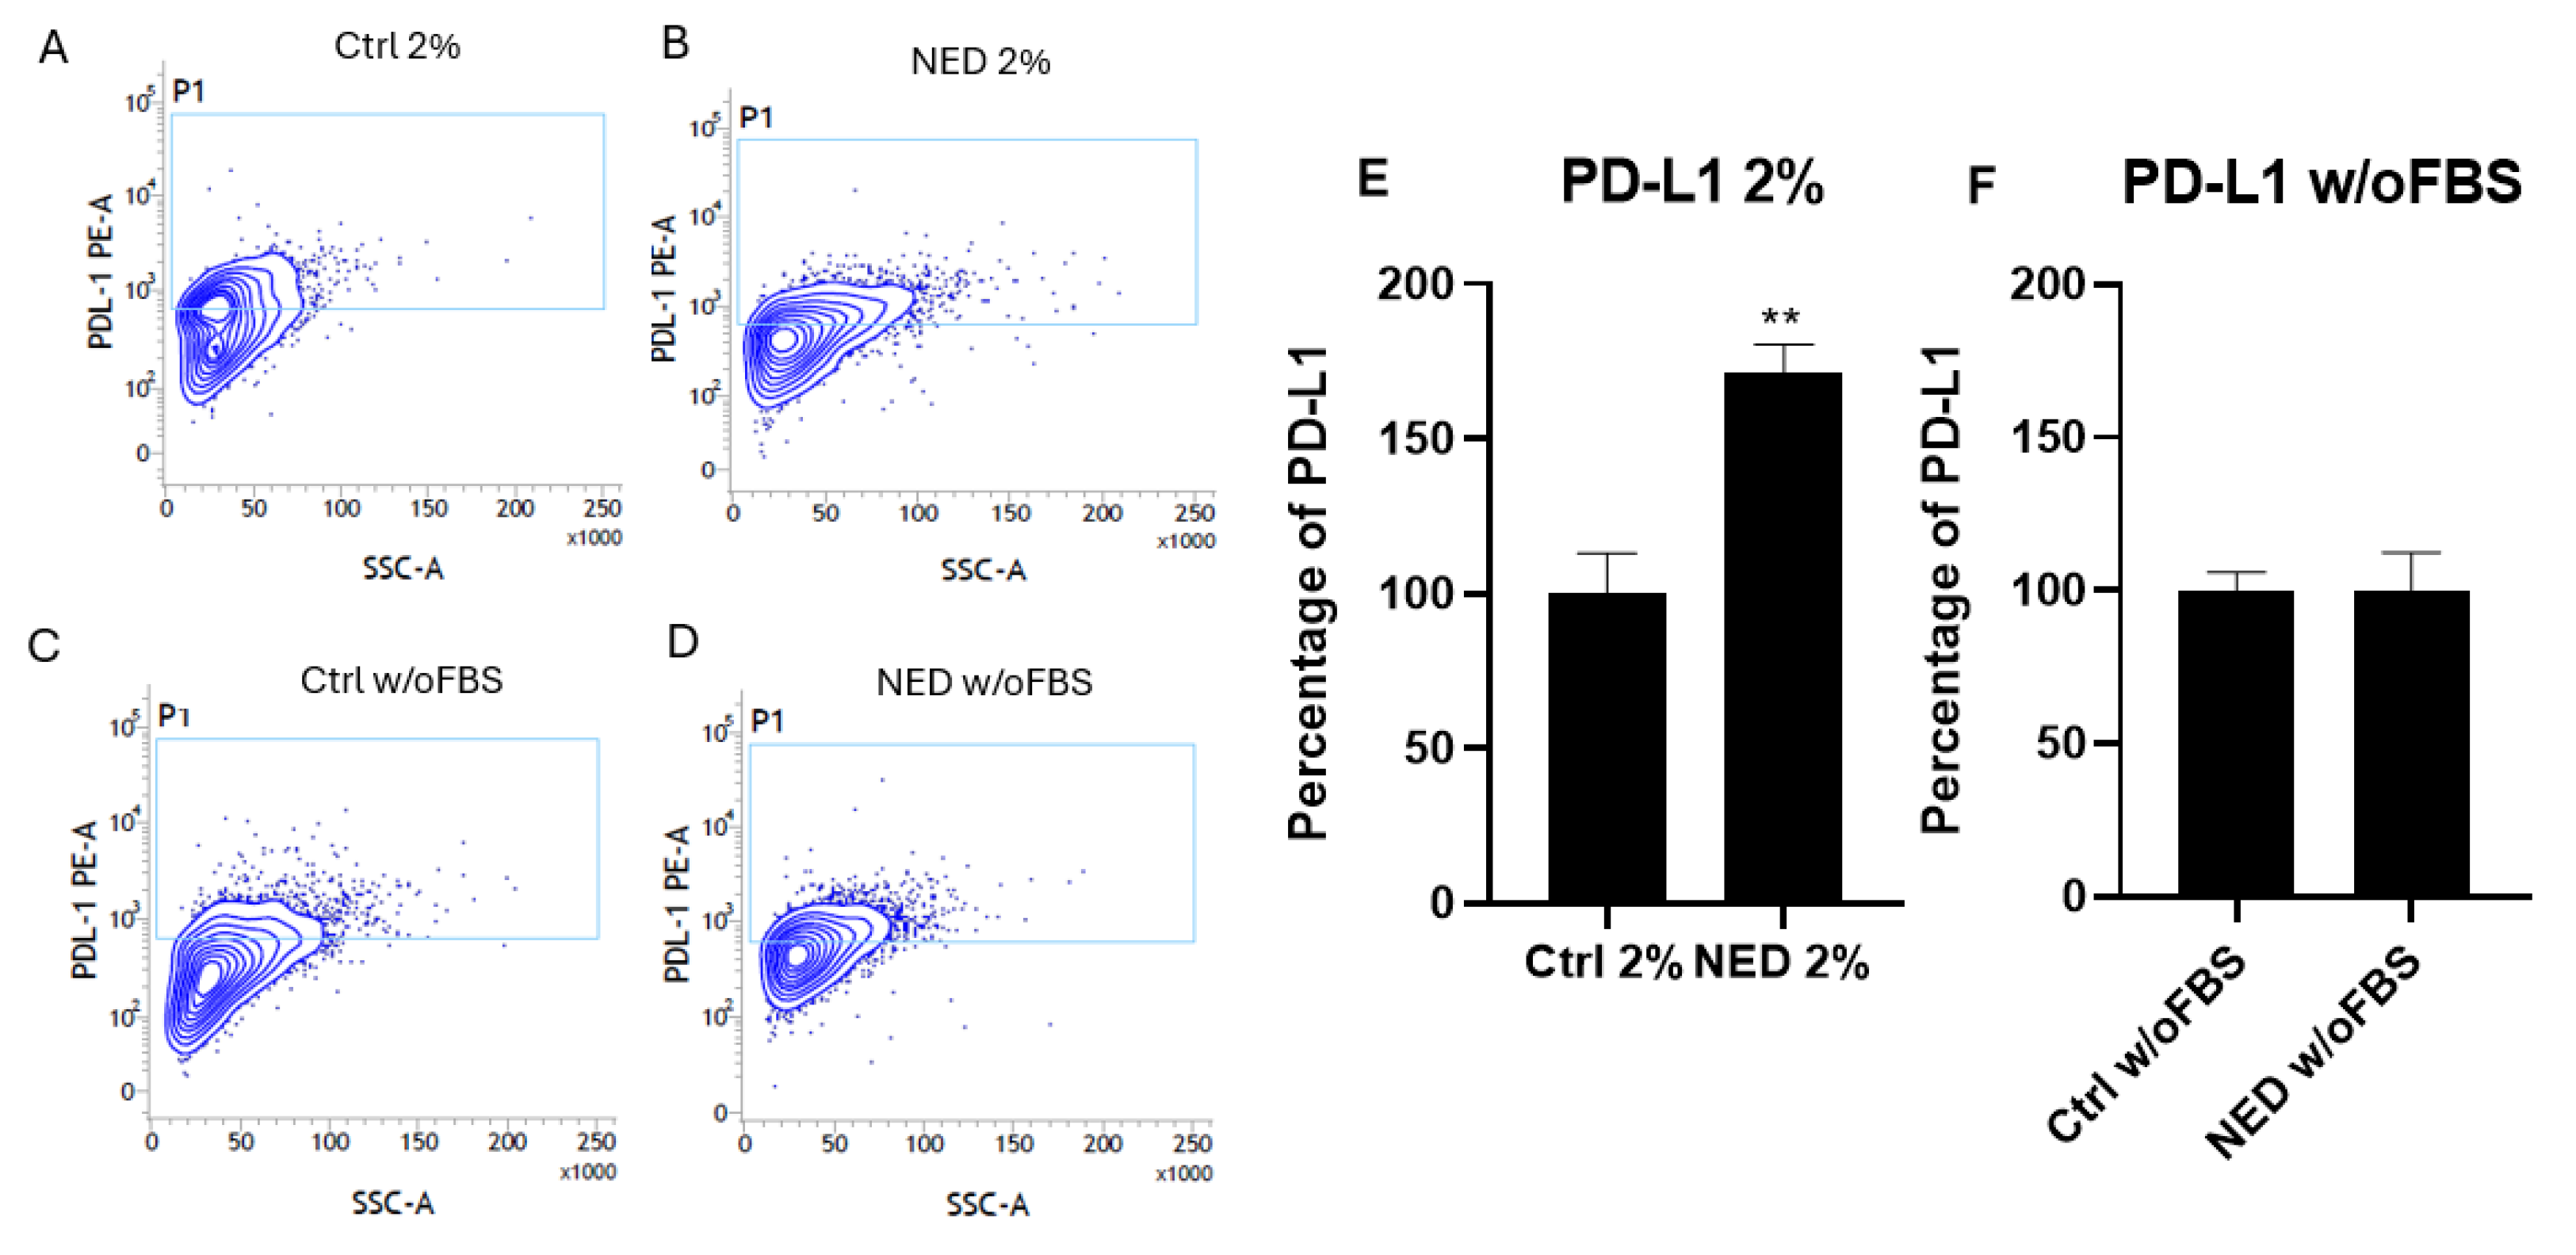
Figure 12.
Efect of melatonin in neuroendocrine models. Flow cytometry contour plots in A) 2% control (ctrl 2%), B) 2 % control with melatonin, C) NED 2%, D) NED 2% with melatonin, E) control without FBS, F) control without FBS with melatonin, G) NED without FBS and H) NED without FBS with melatonin. Detection was performed after 72 hours of differentation and 24 hours with melatonin, for the detection of PD-L1 with phycoerythrin-conjugated antibody.
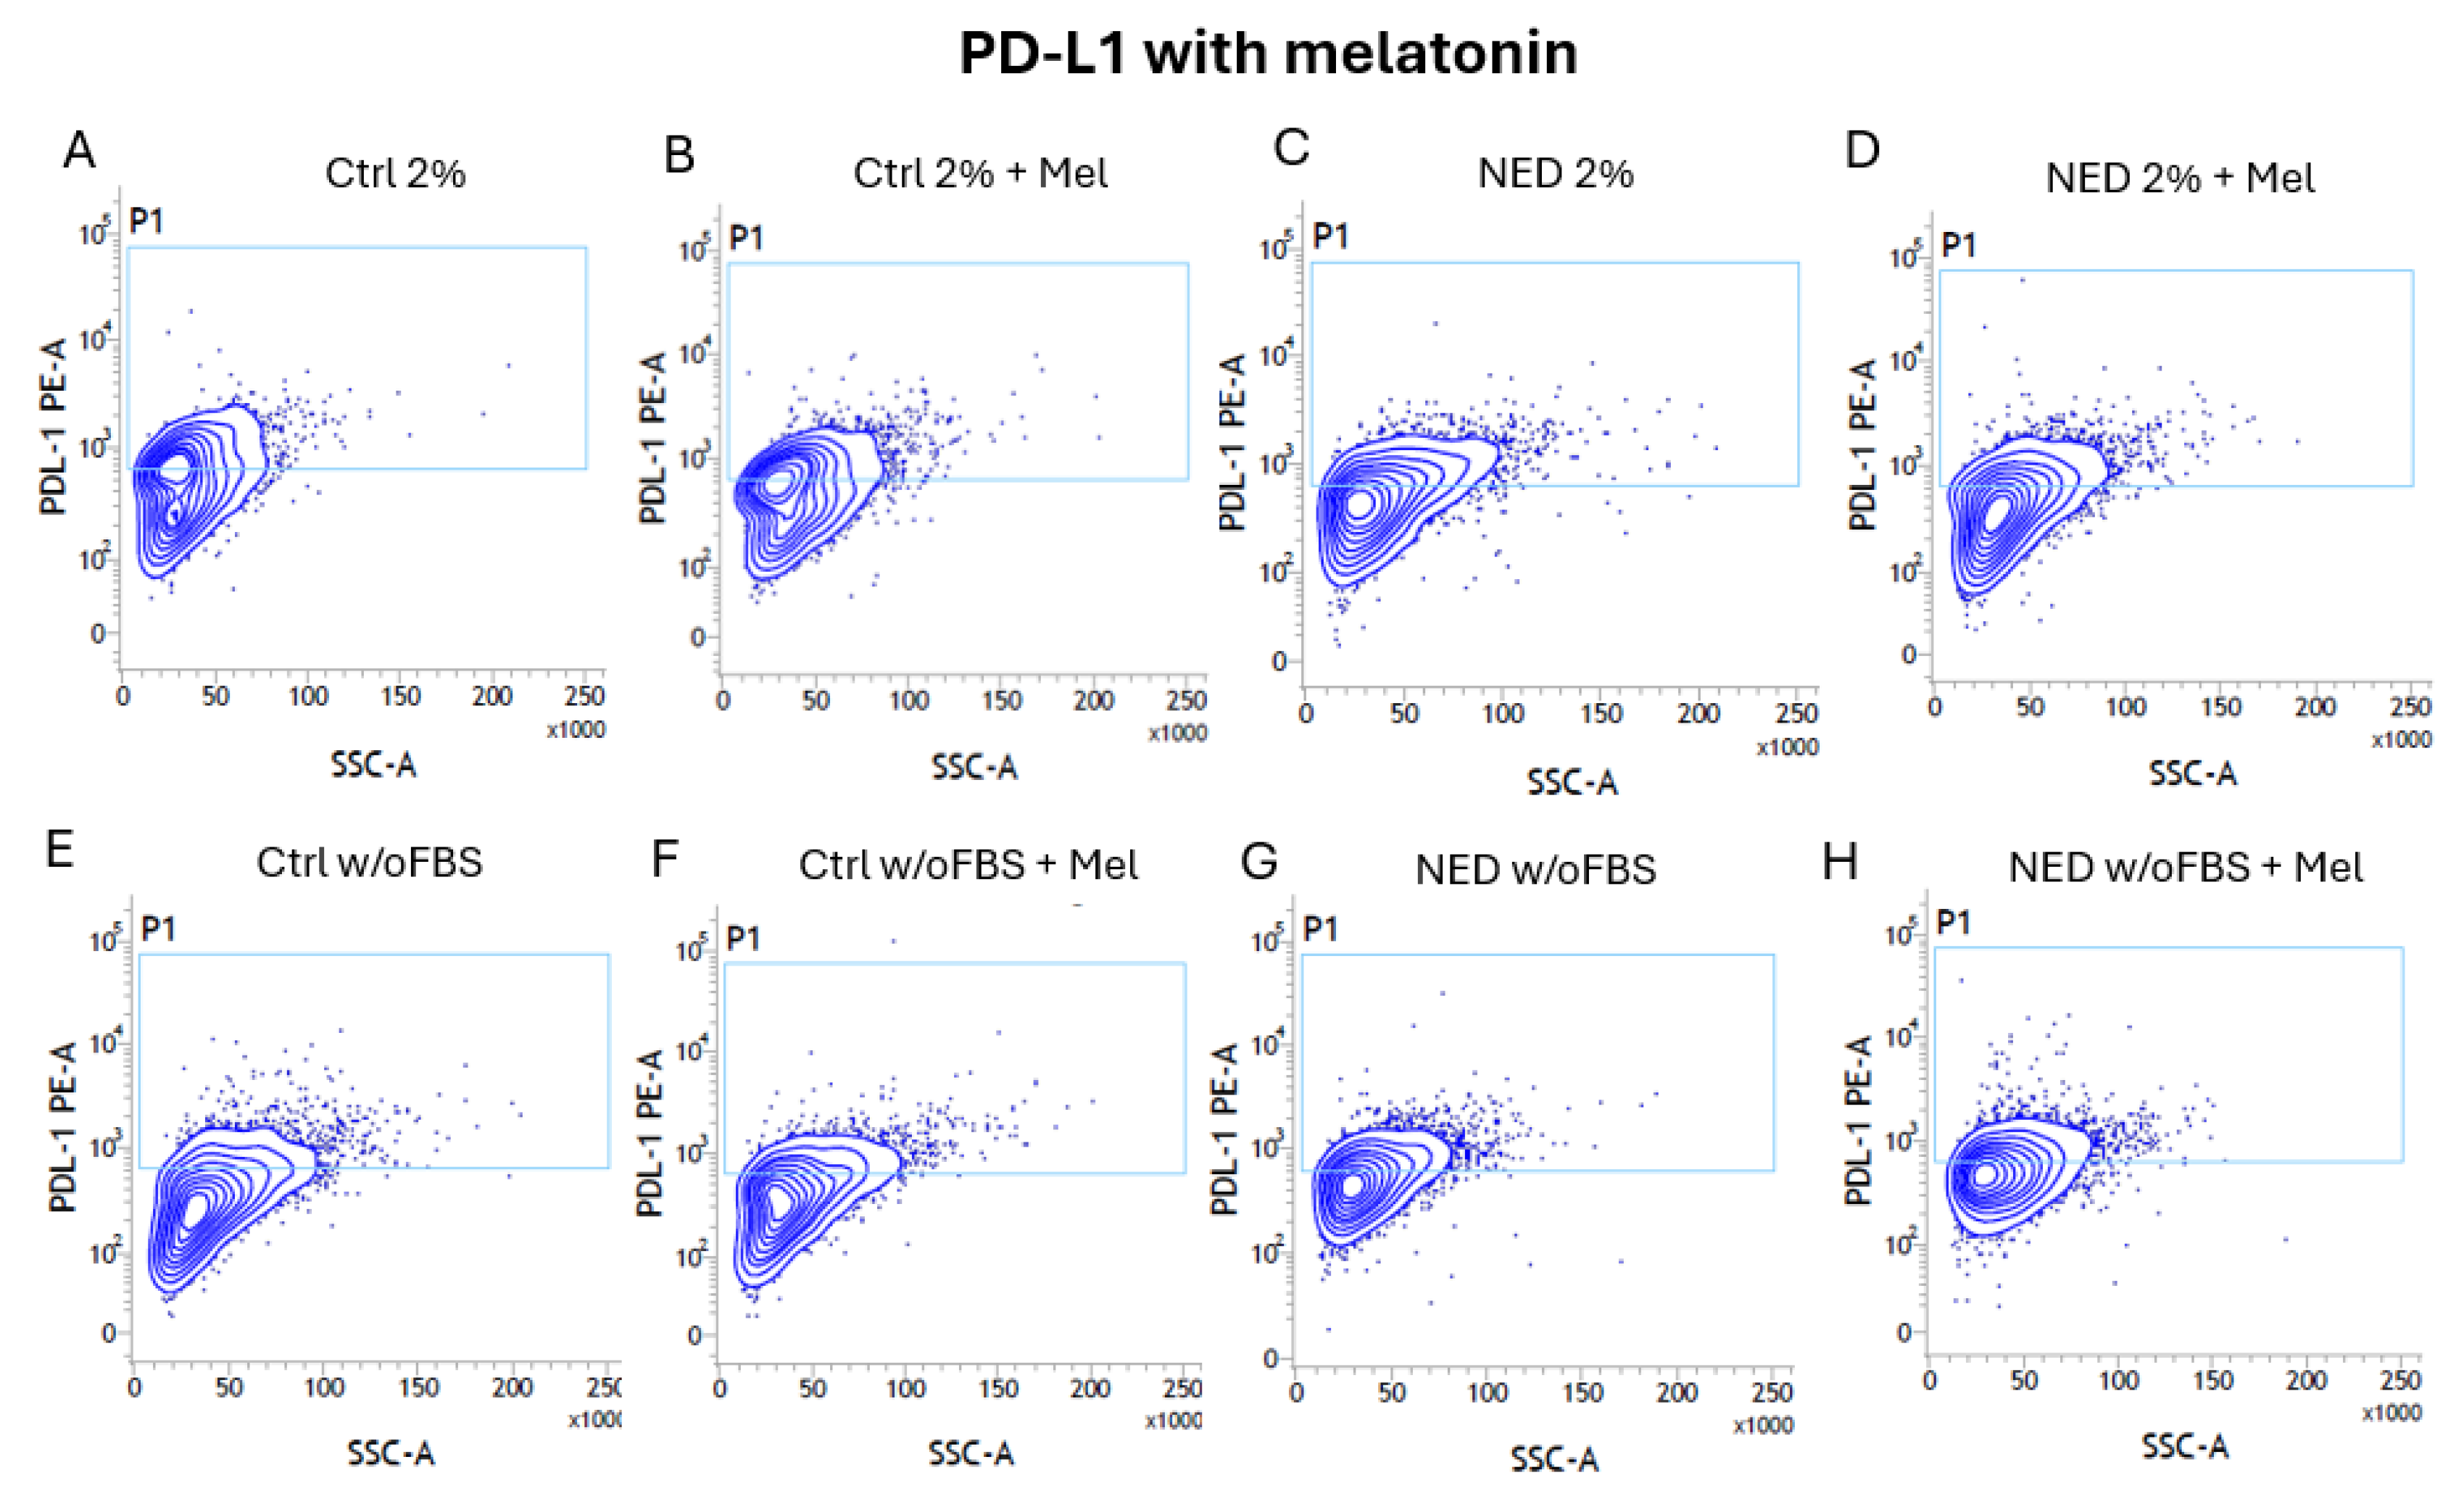
Figure 13.
Efect of melatonin in neuroendocrine models. PD-L1 expression percentage A) 2% control (ctrl 2%), B) NED 2% C) control without FBS and D) NED without FBS after 72 hours of differentation and 24 hours with melatonin. No statistical differences were found using Student’s t test.
Figure 13.
Efect of melatonin in neuroendocrine models. PD-L1 expression percentage A) 2% control (ctrl 2%), B) NED 2% C) control without FBS and D) NED without FBS after 72 hours of differentation and 24 hours with melatonin. No statistical differences were found using Student’s t test.
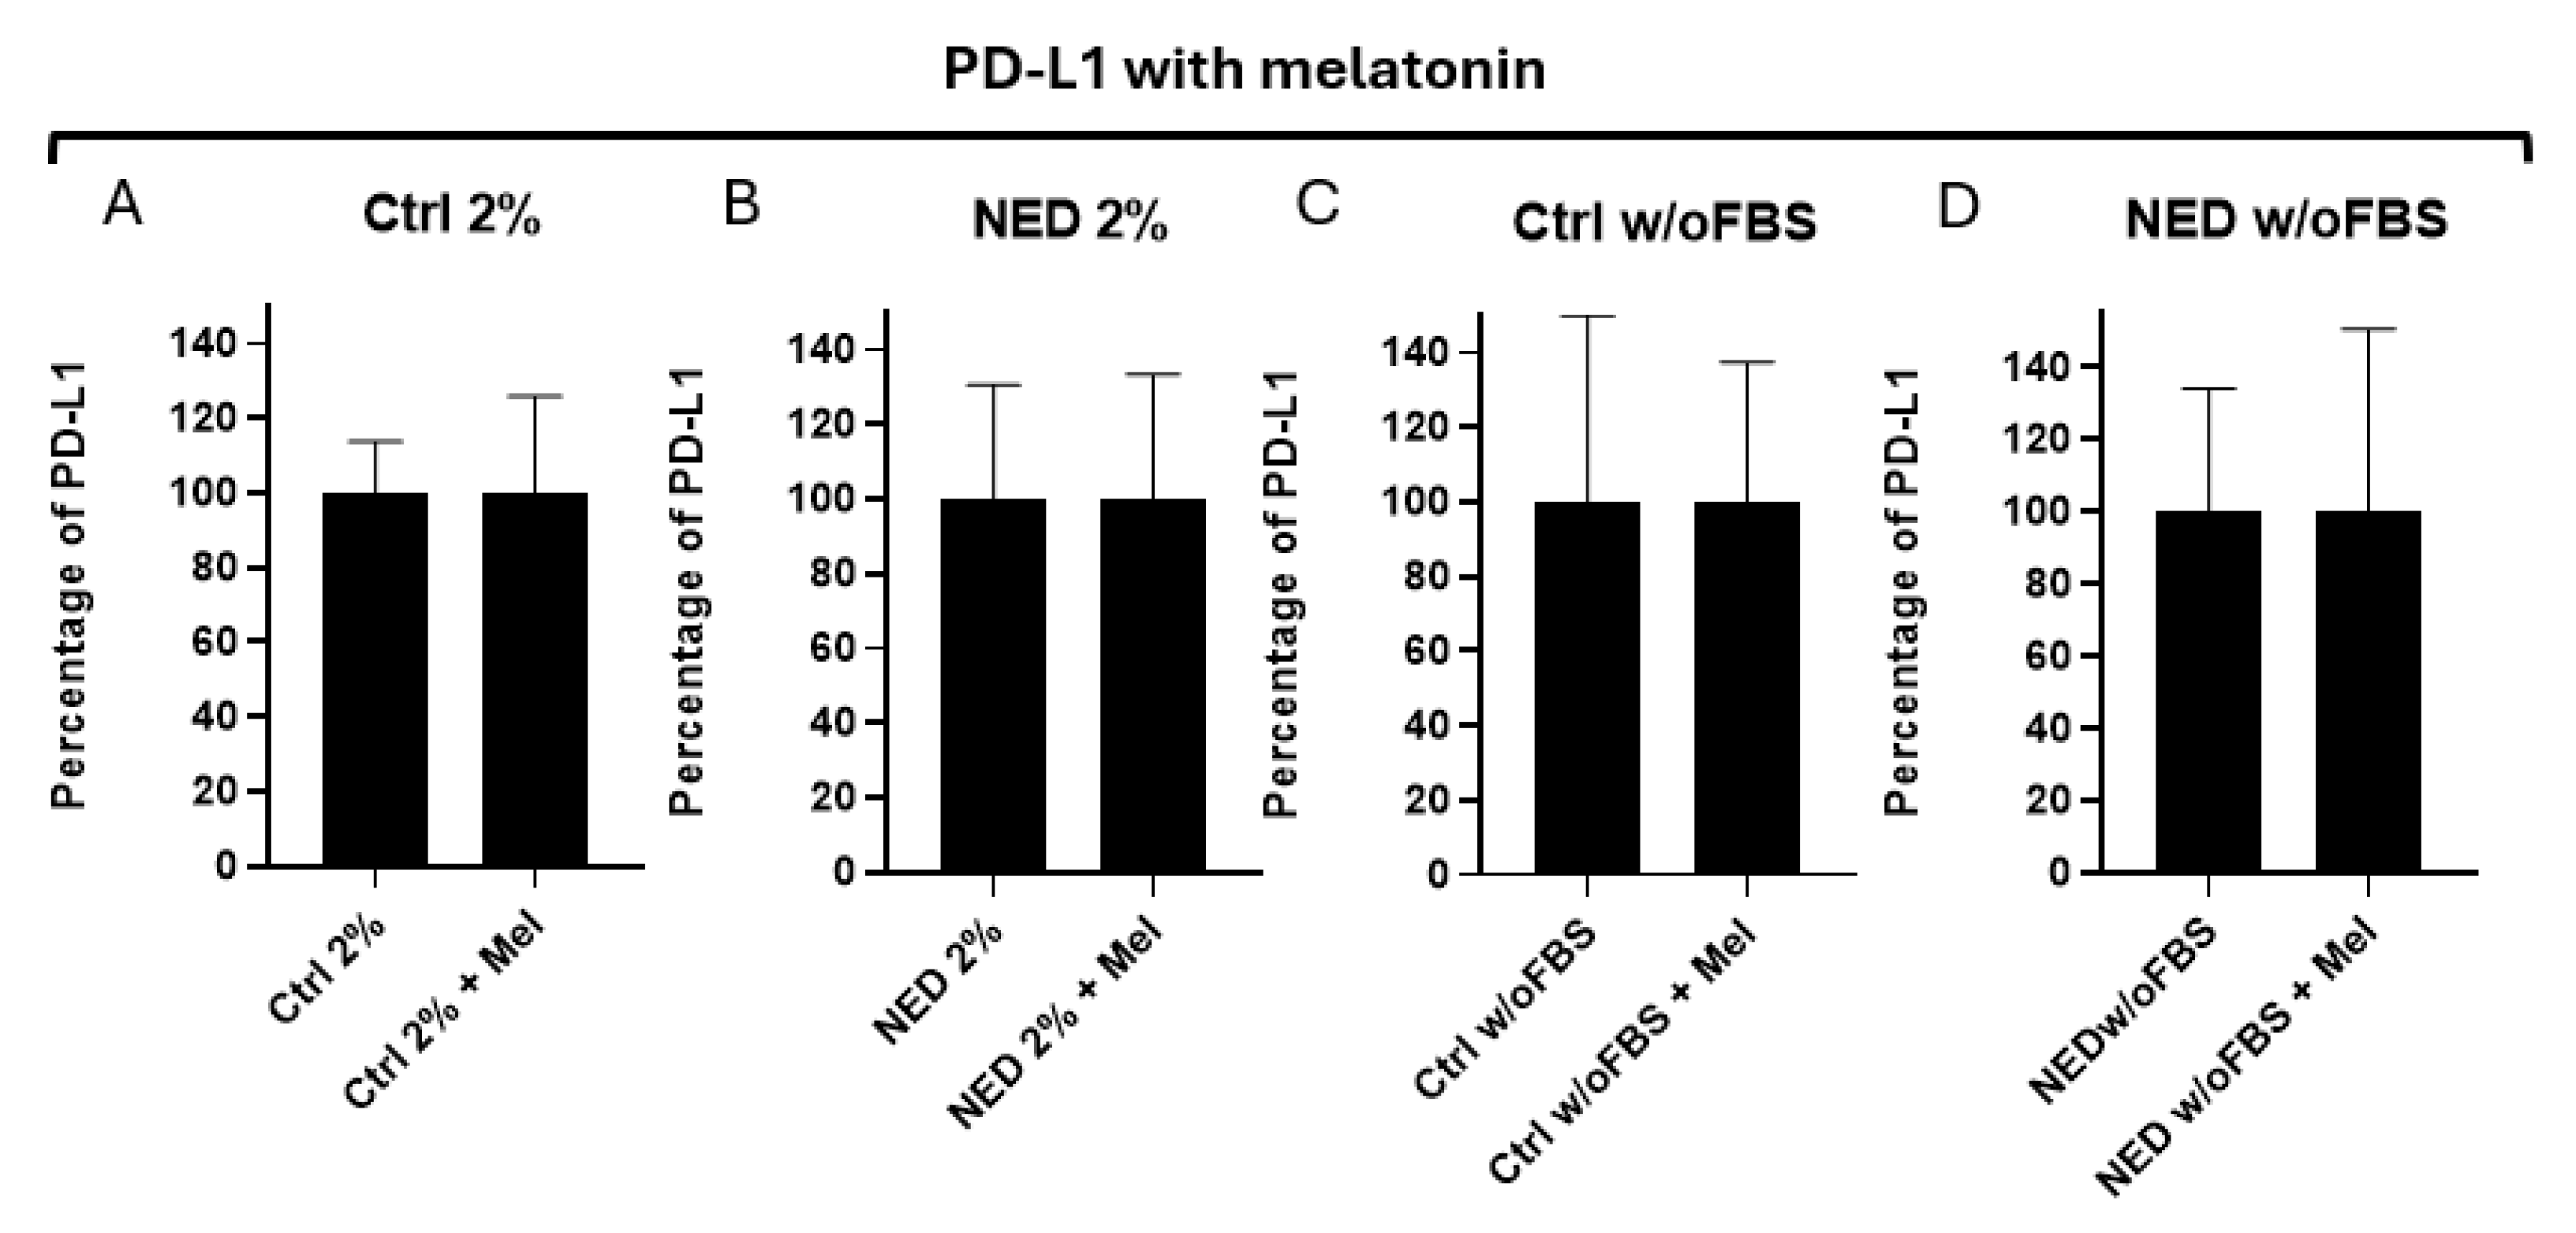
Figure 14.
Presence of KRAS in neuroendocrine models. RT-PCR for KRAS in neuroendocrine model, A) 2% agarose gel to evidence the presence of KRAS with a band of 169 bp in the neuroendocrine models and their respective controls B) KRAS mRNA relative expression. No statistical differences were found with ANOVA test.
Disclaimer/Publisher’s Note: The statements, opinions and data contained in all publications are solely those of the individual author(s) and contributor(s) and not of MDPI and/or the editor(s). MDPI and/or the editor(s) disclaim responsibility for any injury to people or property resulting from any ideas, methods, instructions or products referred to in the content. |
© 2025 by the authors. Licensee MDPI, Basel, Switzerland. This article is an open access article distributed under the terms and conditions of the Creative Commons Attribution (CC BY) license (http://creativecommons.org/licenses/by/4.0/).
Copyright: This open access article is published under a Creative Commons CC BY 4.0 license, which permit the free download, distribution, and reuse, provided that the author and preprint are cited in any reuse.


