

Submitted:
03 June 2025
Posted:
04 June 2025
You are already at the latest version
Abstract
Aim: To compare the three-year surgical outcomes among the Kahook dual blade (KDB), Tanito micro hook (TMH), T hook and 360° suture trabeculotomy (S-lot) co-horts
Study design: Retrospective interventional comparative study conducted at a single eye center
Subjects and Methods: A total of 224 eyes that underwent combined cataract surgery with either KDB, TMH, T hook or S-lot procedures were retrospectively analyzed over the three-year period.
Results: According to Tukey’s multiple comparison test, postoperative intraocular pressure (IOP) in S-lot cohort was significantly lower than that in the TMH cohort from 1 month to 3 years (P=0.01 to < 0.001), lower than the KDB cohort between 6 month and 1 year (P=0.026 to < 0.001), lower than in the T hook cohort at 1 month (P=0.012) and from 6 to 12 months (P< 0.001). Survival probability to achieve ≤15mmHg and ≤18mmHg in S-lot was better than others by P< 0.001 and 0.005, respectively. At 3 months, the T hook cohort showed significantly lower IOP than TMH (P=0.029), and 1 week, IOP was marginally lower than that in the KDB (P=0.063) and TMH (P=0.052) cohorts, based on Dunnett’s test. However, no significant differences in postoperative IOP were observed among the three sectorial canal-opening surgery (COS) groups be-yond 6 months.
Conclusion: Among the four MIGS cohorts, S-lot provided the most substantial mid-term postoperative IOP reduction. The T-hook cohort showed marginally superior IOP reduction at 1 week compared to the KDB and TMH groups.
Keywords:
minimally invasive glaucoma surgery (MIGS)
; Kahook dual blade
; T hook
; Tanito micro hook
; 360-degree suture trabeculotomy
; surgical outcome
; surgical outome
1. Introduction
Canal opening surgeries (COS), performed from inside the eye, are increasingly used to treat mild to moderate glaucoma.
A variety of devices, such as Trabectome, BANG and others, are employed to open Schlemm’s canal. These procedures preserve the conjunctiva, are associated with fewer severe postoperative complications, and maintains good postoperative visual acuity. Previous reports suggest that both the technique and the extent of trabecular meshwork incision may influence surgical outcomes; however, expert opinions remain divided. Some reports indicate that a wider incision results in better intraocular pressure (IOP) reduction [1,2,3], whereas others report no significant impact[4,5,6]. Wider incisions may increase the risk of hyphema[7], which may be associated with postoperative IOP spikes and potentially affect final surgical outcomes[8].
Although most cases of postoperative hyphema are resolved shortly after surgery, the design of the surgical instrument -whether hook, blade or suture- may influence the incidence and severity of bleeding. Devices with a curved distal tip[9], or those using sutures (as in 360° trabeculotomy), may reduce the risk of damaging the posterior wall of Schlemm’s canal and thereby minimize bleeding. However, evidence remains limited regarding how different surgical techniques affect postoperative bleeding and long-term IOP control.
In this study, we aimed to compare the mid-term surgical outcomes and complication profiles of four canal-opening procedures.
2. Materials and Methods
This retrospective study included patients with mild to moderate primary open angle glaucoma, exfoliation glaucoma or ocular hypertension, all of whom were indicated for concomitant internal COS and small-incision cataract surgery. Patients who underwent stent-based procedures or mini-tube insertions were excluded.
A total of 389 eyes from 279 patients who underwent concomitant phacoemulsification, implantation of intraocular lens and COS between May 2018 and July 2024 at Sensho-kai Eye Institute were included. The three-year outcomes of four different COS procedures; Kahook dual blade (KDB: New World Medical, CA USA 22BAIBZX00022000 JFC ), Tanito micro hook (TMH: Inami Tokyo M2215S), T hook (Inami Tokyo M-2225, and Handaya Tokyo HS-9939) and 360° suture trabeculotomy (S-lot: Handaya Tokyo HS 2756); were analyzed. The choice of procedure was at the discretion of the operating surgeon.
Preoperative intraocular pressure (IOP) was defined as the highest IOP recorded within the three months prior to surgery. Additionally, the “preoperative 3-mean IOP” was calculated as the average of three consecutive IOP measurement taken under medications before surgery.
Inclusion criteria: Patients were aged 40 years or older (range: 44 - 90 years), and had a documented preoperative IOP≥18 mmHg within three months prior to surgery. If both eyes were eligible, only the right eye was included in the analysis.
Exclusion criteria : Patients were excluded if they met any of the following conditions.
A mean of three consecutive preoperative IOP measurements under topical medications exceeded 35 mmHg. History of prior glaucoma surgery or selective laser trabeculoplasty. Intraoperative rupture of the posterior capsule or lens luxation. Diagnosis of primary angle-closure glaucoma, secondary glaucoma, congenital glaucoma or normal tension glaucoma. Underwent standalone COS without combined cataract surgery. Postoperative follow-up period less than 6 months.
After applying the exclusion criteria, one eye from 224 patients (43 KDB, 57 TMH, 86 T hook and 38 S-lot eyes) was enrolled and included in the final analysis.
Low vision visual acuity was converted to logMAR values according to the British conversion method[10]: counting fingers, hand motion, positive light sense, and no light sense were converted to logMAR value of 2.1, 2.4, 2.7, and 3.0, respectively.
Classification of intracameral bleedings.
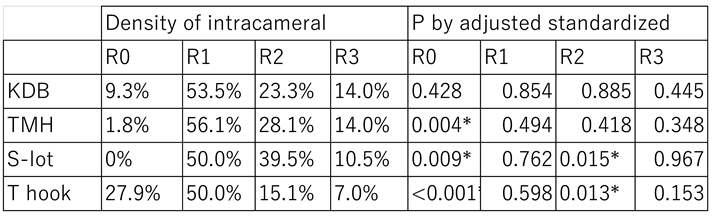
Post-surgical bleeding into the anterior chamber in these patients was classified using the Shimane University grading system[11], which categorizes hyphema based on severity and density, as well as the presence of clot formation. Severity of hyphema (layering) was classified into 4 categories; L0: no hyphema, L1: layered blood less than 1 mm; L2: layered blood ≥1 mm but not exceeding the inferior pupillary margin, L3: layered blood exceeding the inferior pupillary margin. Density of intracameral bleeding was classified into 4 categories; R0: no floating red blood cell, R1: iris patterns clearly visible despite the presence of floating red blood cells, R2: Iris patterns are not clearly visible due to floating red blood cells, R3: iris pattern completely obscured. Intracameral clot formation was classified into 2 categories; C0: no blood clot formation, C1: presence of intracameral blood clot formation.
Statistical analysis: Statistical analyses were performed using Bell Curve for Excel (Social Survey Research Information Co., Tokyo, Japan). Multiple comparisons were evaluated using Tukey’s and Dunnett’s test. Kaplan-Meier survival analysis was used to assess surgical success over time. The Wilcoxon signed-rank test was employed for paired comparison, Haberman residual analysis was used for categorical data.
3. Results
Demographic baseline data are presented in Table 1. There was no significant difference among the cohorts in baseline age, logMAR best-corrected visual acuity, preoperative IOP, the mean of three consecutive preoperative IOP measurements under topical medications, or the number of preoperative medications. However, the refractive error in the T hook cohort was significantly less than that in the S-lot cohort (P=0.048). The mean deviation (MD) of the Humphrey Visual Field Analyzer was significantly worse in the S-lot cohort compared to the other three COS cohorts (P<0.005).
The extent of canal opening in the S-lot cohort was 325 ± 87°, which was significantly greater than that in the T hook (153 ± 52), KDB (137 ± 28), TMH (129 ± 23°) cohorts (P<0.001). While the difference between T hook and TMH (P=0.067), and between T hook and KDB (P=0.43) were not statistically significant according to Tukey’s multiple comparison test.
The mean follow-up periods were as follows: KDB, 47.9±16.8 months; TMH, 30.3±18.9 months; T hook, 16.0±9.7 months; and S-lot, 35.1±21.1 months. The follow up period for the T hook cohort was significantly shorter (P<0.001), while that for the KDB cohort was significantly longer than the other three COS cohorts (P<0.005) as determined by Tukey’s multiple comparison test.
IOP between 1 month and 3 years postoperatively was significantly lower than pre-operative IOP in all four cohorts with a P<0.001 using Wilcoxon signed rank test. A short-term elevation in IOP was observed at 1 week in the KDB, TMH and S-lot cohorts, likely reflecting the effects of postoperative intracameral bleeding. Despite this early increase, the IOP at 1 week remained significantly lower than preoperative levels in the TMH (P=0.005), S-lot (P=0.011) and T hook (P<0.001) cohorts; however, the reduction in the KDB cohort was not significant (P=0.198).
The number of anti-glaucoma medications significantly decreased from baseline in all cohorts. Preoperative medications used in the KDB, TMH, S-lot and T hook cohorts was 2.6±1.3, 2.7±1.5, 3.2±1.1 and 2.8±1.3, respectively. At 3 months postoperatively, the number of medications decreased to 1.2±1.0, 1.7±1.4, 2.1±1.3 and 1.8±1.3, respectively (all P<0.001, Wilcoxon signed rank test). A gradual increase in medication use was observed at 2 years, reaching 1.6±1.2, 1.8±1.3,2.4±1.4, and 2.4±0.9, respectively. Despite this increase, the number of medications at two years remained significantly lower than pre-operative baseline in all cohorts (P<0.05 Wilcoxon signed rank test).
Figure 1.
Time course of postoperative IOP in the four canal-opening surgery cohorts.
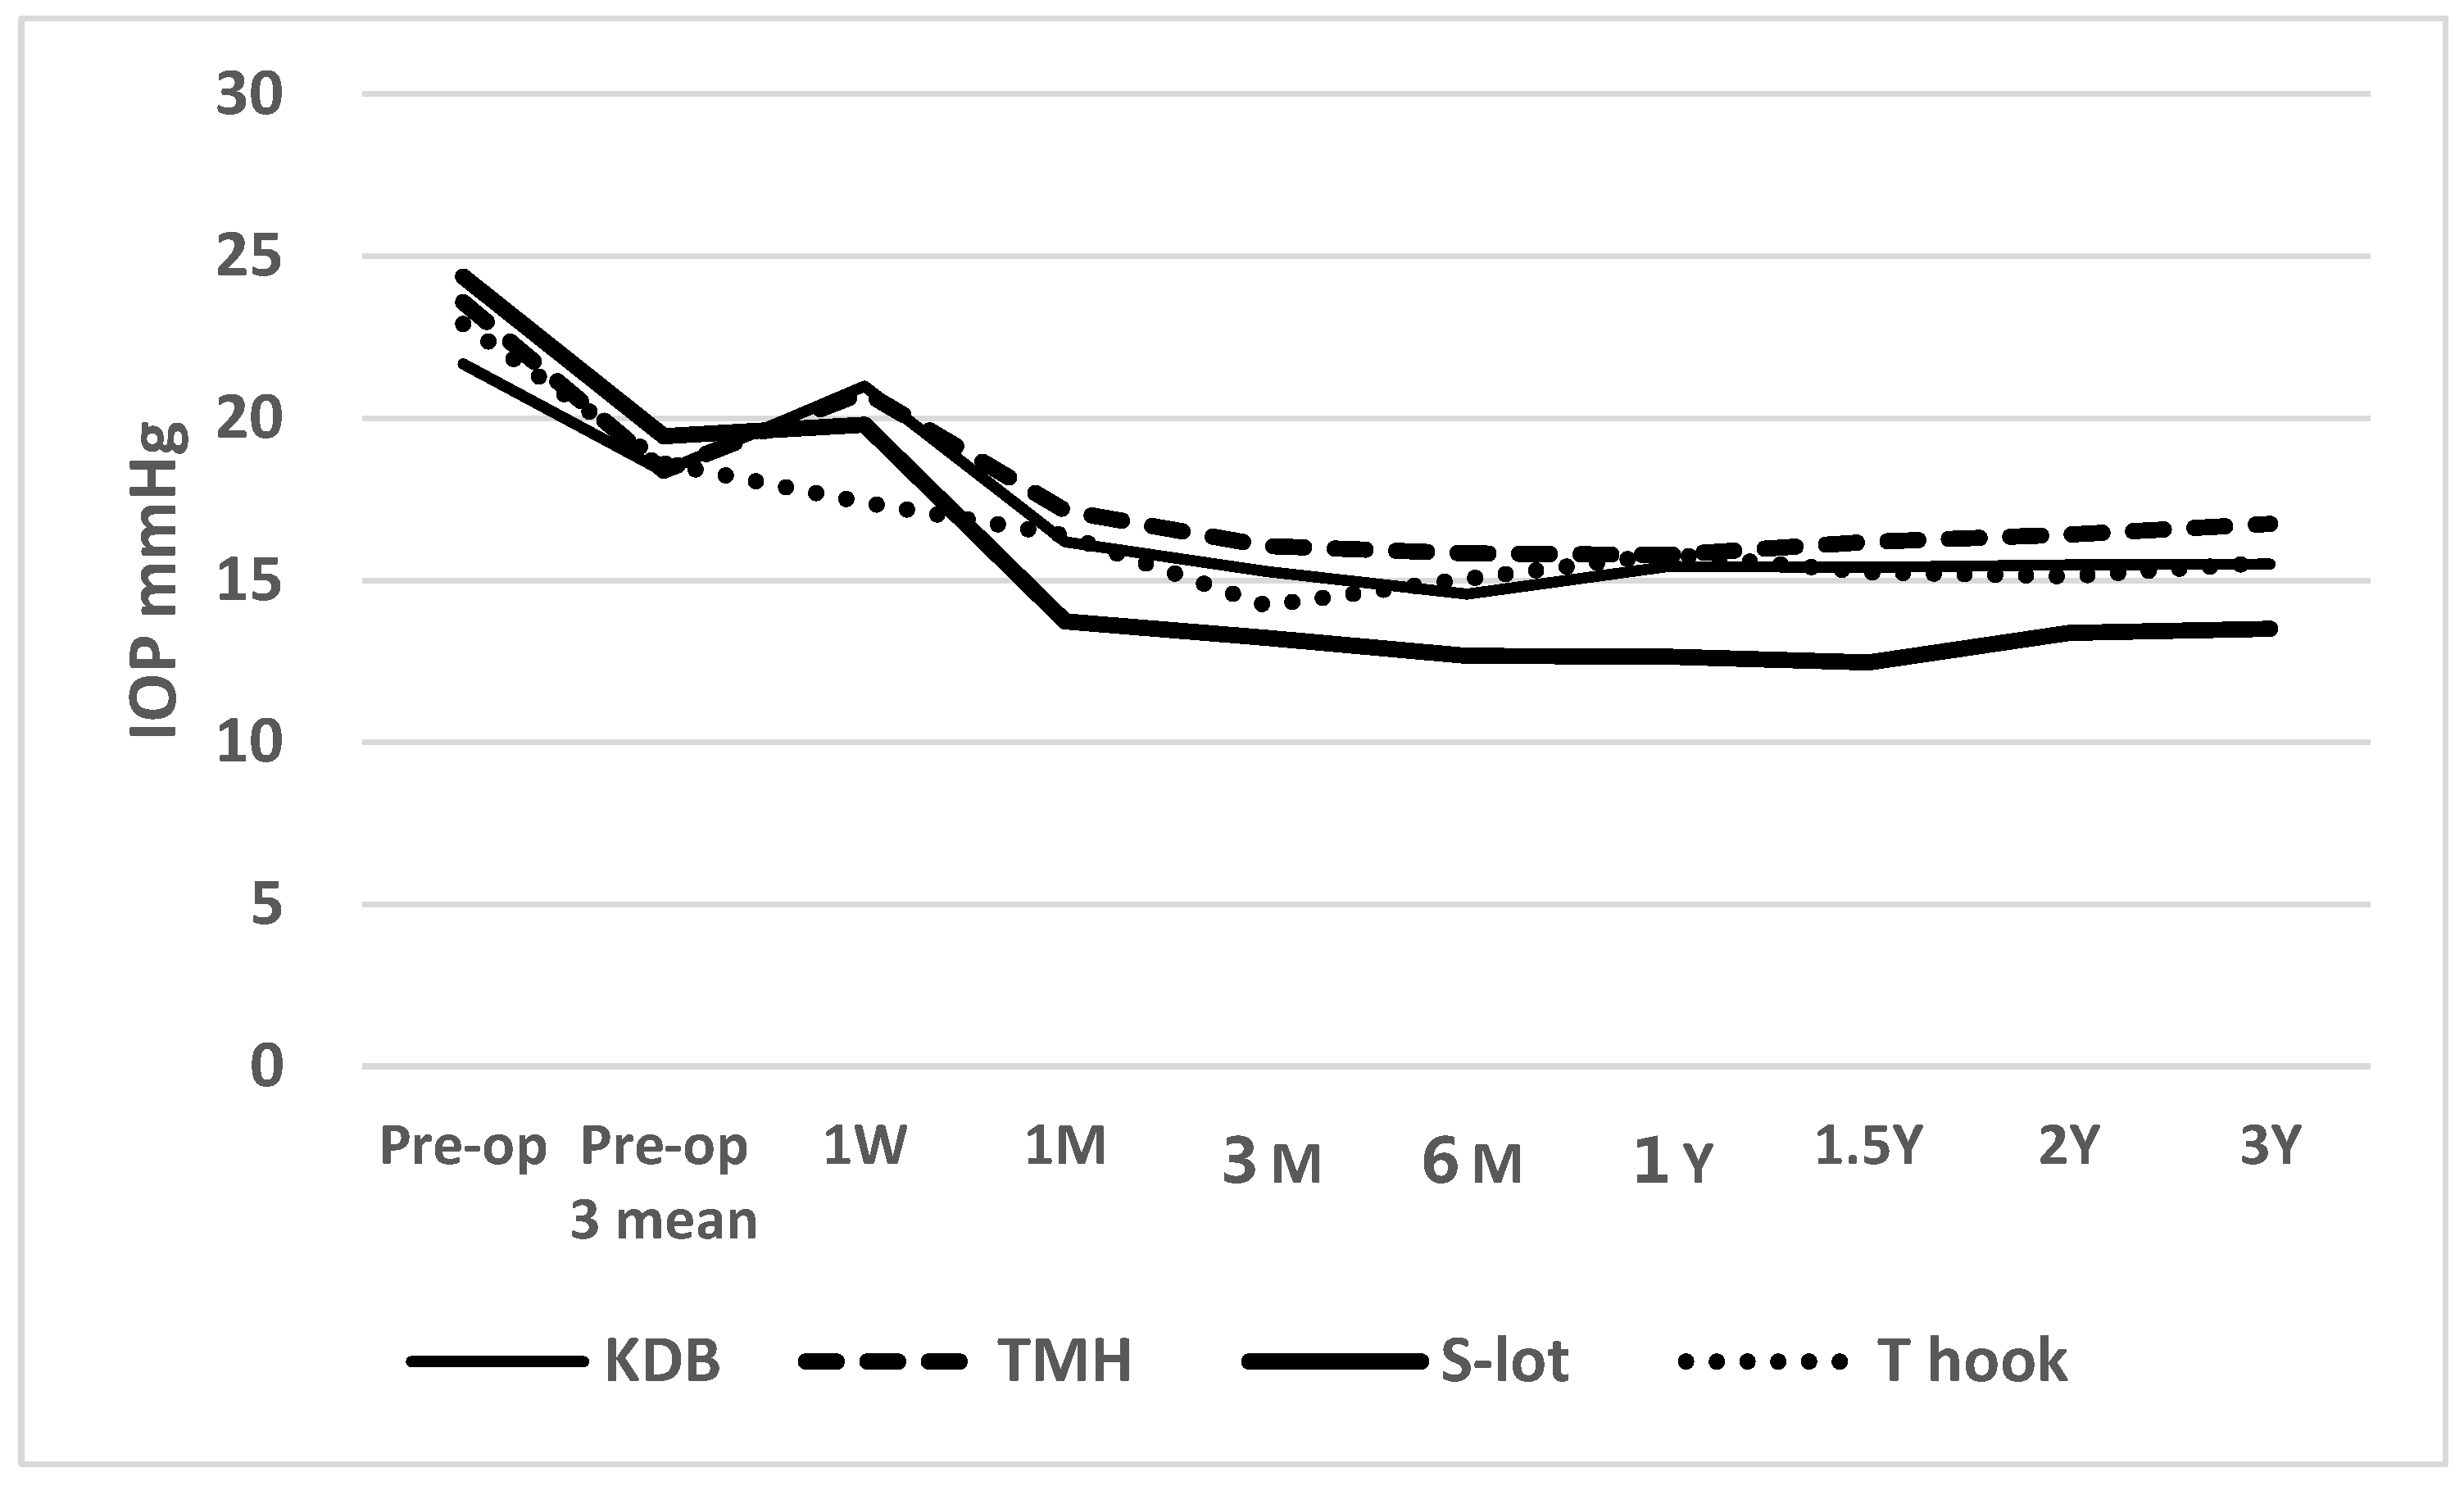
Figure legends for Figure 1: A transient elevation (“hump”) in IOP was observed at 1 week postoperatively in the KDB, TMH and S-lot cohorts, likely reflecting a response to postoperative intracameral bleeding. Following this initial rise, IOP decreased significantly in all cohorts and remained reduced through 3 years of follow-up. Postoperative IOP in the S-lot cohort was significantly lower than in the other three sectorial COS cohorts, as determined by Tukey’s multiple comparison test (Table 2)
Although there was no difference in baseline preoperative IOP or the mean of three preoperative IOP measurements under medication among the four COS cohorts, one way ANOVA revealed a significant difference in postoperative IOP among the cohorts over the follow up period from 1 month to 3 years (P<0.05, Table 2).
According to Tukey’s multiple comparison test, the postoperative IOP in the S-lot cohort was significantly lower than that in the TMH cohort at 1 month through 3 years, the KDB cohort at 6 months and 12 months, and the T hook cohort at 1month, 6 month and 1 year, respectively (Table 2).
A significant difference in the percentage reduction of IOP was observed among the four COS cohorts between 3 months and 2 years, as determined by one-way ANOVA (Table 3). Using Tukey’s multiple comparison test, the percentage IOP reduction in the S-lot cohort was significantly greater than that in the KDB cohort between 3 months and 1 year, the TMH cohort between 6 months and 2 years, and the T hook cohort between 6 months and 1 year. In contrast, no significant differences were observed in the percentage IOP reduction among the three sectorial COS procedures (KDB, TMH and T hook).
According to Dunnett’s multiple comparison test, the comparison between T hook and KDB cohorts yielded a P value of 0.089 at 3 months. Although the T hook cohort tends to show greater IOP reduction, this difference was not statistically significant.
Figure 2.
Time course of postoperative IOP in the three sectorial COS cohorts.
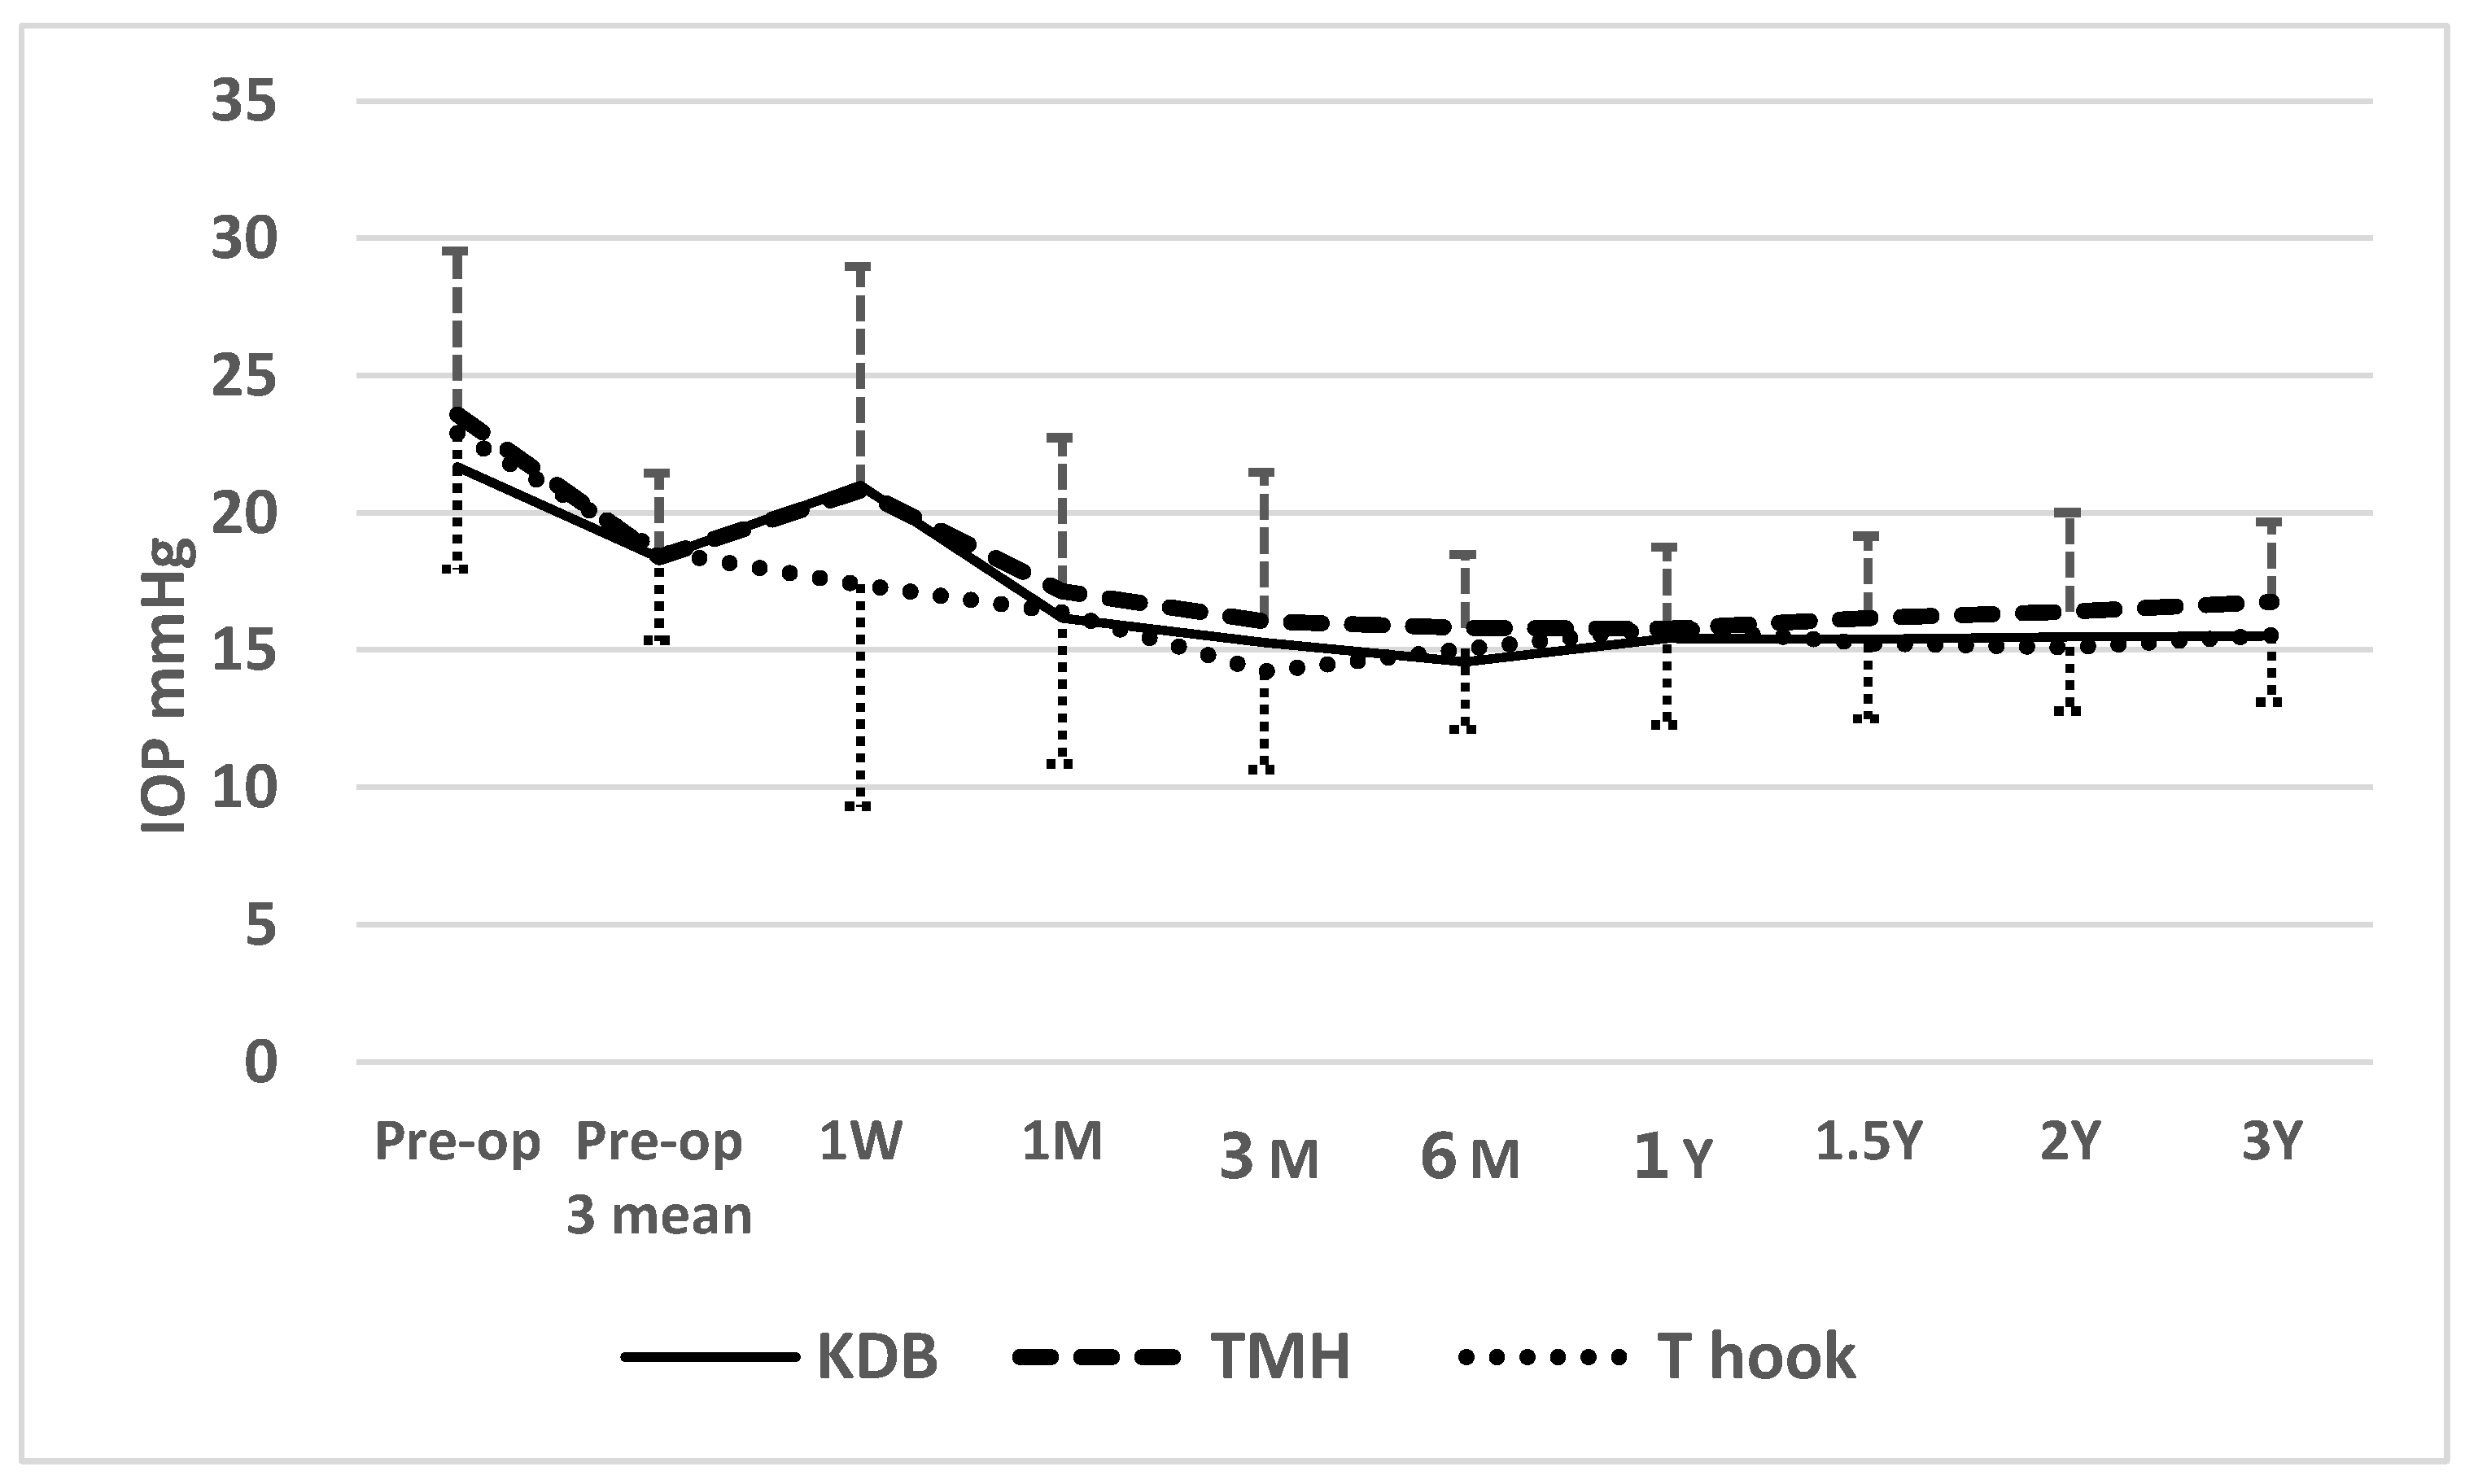
Figure legend for Figure 2: At 1 week postoperatively, IOP in the KDB (P=0.063) and TMH (P=0.052) cohorts was marginally higher than in the T hook cohort. At 3 months, IOP in the TMH cohort was significantly higher than in the T hook cohort (P=0.029; Table 2), potentially reflecting a higher prevalence of postoperative clot formation and a greater density of red blood cell in the anterior chamber (Table 5 and Table 6). However, from 6 months onward, no differences in IOP were observed among the three sectorial COS cohorts.
When comparing postoperative IOP among three sectorial COS cohorts (KDB, TMH, and T hook), a transient elevation above the mean of three preoperative IOP measurements at 1 week was observed in KDB and TMH cohorts (Figure 2). According to Dunnett’s multiple comparison test, IOP in the KDB (P=0.063)and TMK(P=0.052) cohorts at 1 week were marginally higher than in the T hook cohort, possibly due to greater intracameral bleeding and clot formation in the KDB and TMH cohorts (Tables 5,6). The significant difference in IOP between the T hook cohort and TMH cohort at 3 months (P=0.029) according to Dunnett’s multiple comparison test may also reflect effects of intracameral bleedings (Table 2). After 3 months, no significant differences in IOP were detected among the three sectorial COS groups through 3 years of follow-up (Table 2).
Kaplan Meier life table analysis supported these findings. A significant difference was observed among the four COS cohorts in achieving postoperative IOP targets of ≤15 mmHg and ≤18 mmHg under medication. At 3 years, cumulative success probability for achieving IOP ≤15 mmHg was highest in the S-lot cohort (65.9±9.4%), compared to KDB (23.9±7.0%), T hook (39.9±7.4%) and TMH (18.4±6.4%), with a significant difference by log rank test (P<0.001). In contrast, no significant difference was found among the three sectorial COS procedures for this outcome (P=0.478, log-rank test)
Figure 3.
Kaplan-Meier Survival Curves: Probability of Achieving Postoperative IOP ≤15 mmHg Following Four Types of Canal-Opening Minimally Invasive Glaucoma Surgeries (MIGS).
Figure 3.
Kaplan-Meier Survival Curves: Probability of Achieving Postoperative IOP ≤15 mmHg Following Four Types of Canal-Opening Minimally Invasive Glaucoma Surgeries (MIGS).
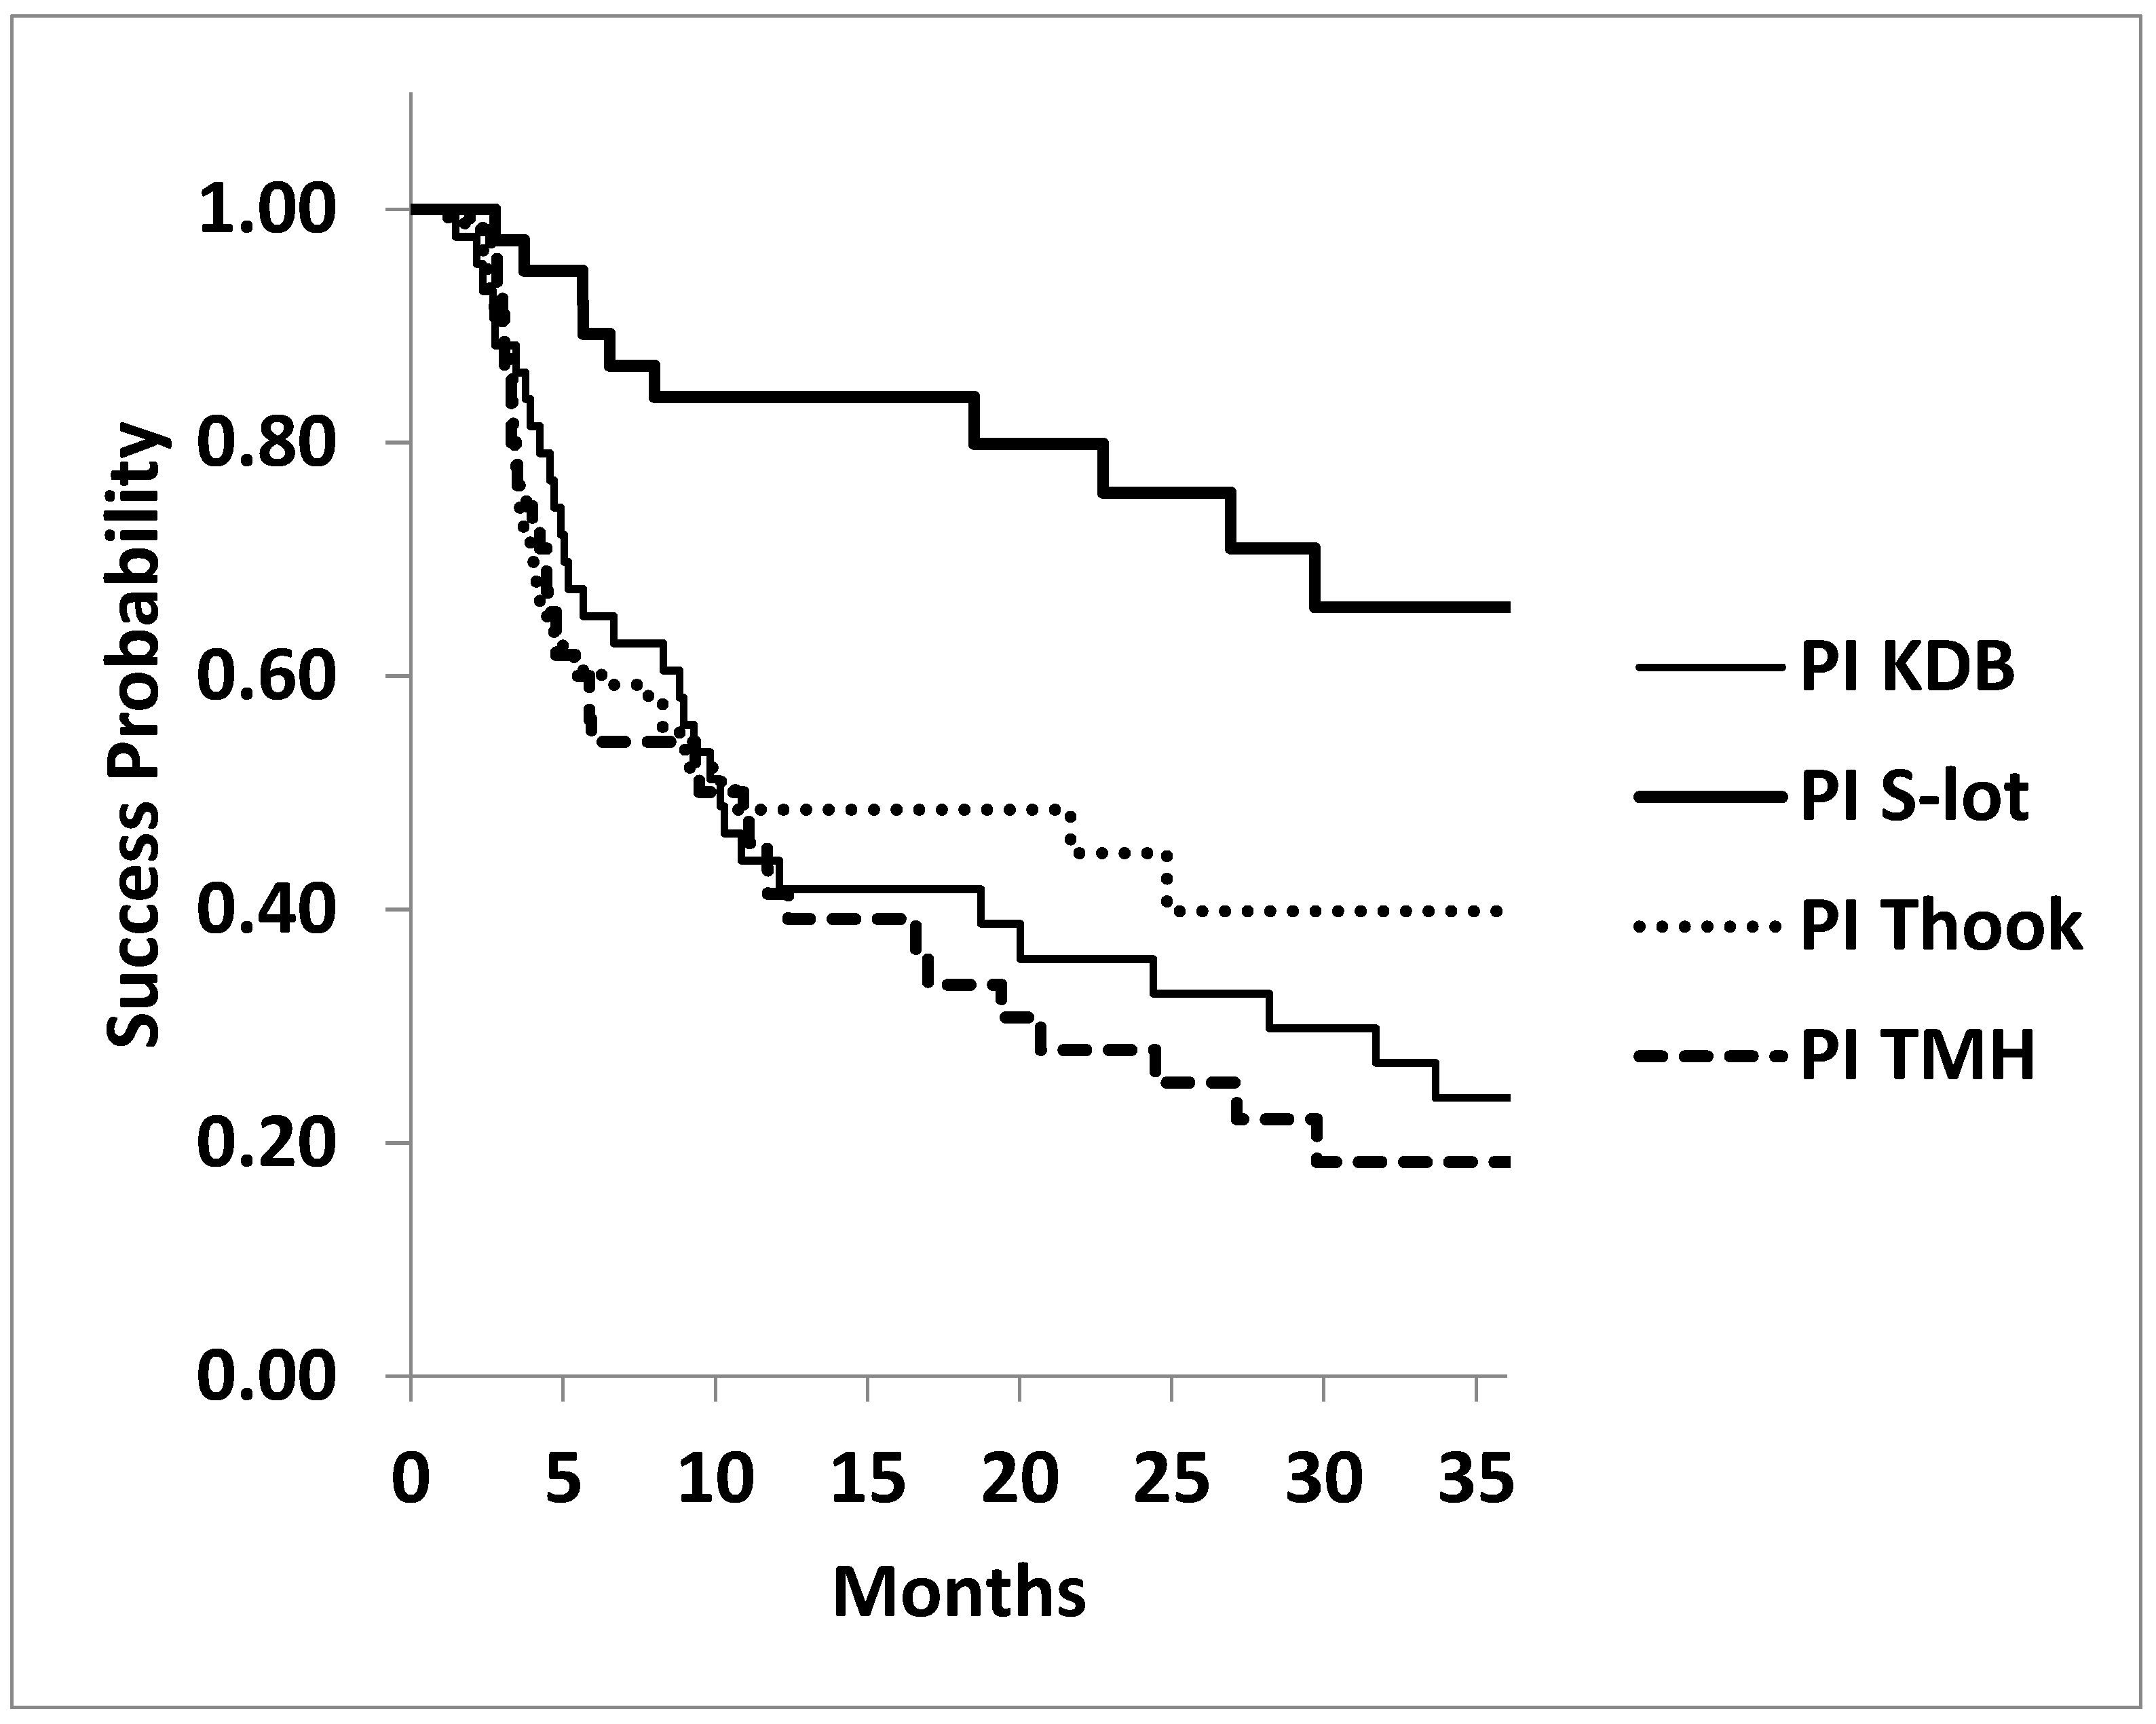
Legends for Figure 3: The cumulative success probability of achieving postoperative IOP ≤15 mmHg at three years was significantly higher in the 360º canal-opening procedure (S-lot cohort) compared to the three sectorial canal-opening procedures (Kahook dual blade, Tanito micro hook and T hook) by P<0.001, log-rank test.
No statistically significant differences were found among the three sectorial canal-opening procedures (P=0.478, log rank test)
The success probability at three years for achieving IOP≤18 mmHg under medications was also significantly higher in the S-lot cohort (93.1±4.9%) compared to the KDB (73.9±7.8%), T hook (77.7±5.7%) and TMH (56.2±8.3%) cohorts (P=0.0052, log rank test). However, no significant differences were observed among the 3 sectorial COS procedures (P=0.121, log rank test).
Figure 4.
Kaplan-Meier Analysis: Probability of Achieving Postoperative IOP≤18 mmHg at 3 Years Under Medications Following Four Types of Canal-Opening Minimally Invasive Glaucoma Surgery (MIGS).
Figure 4.
Kaplan-Meier Analysis: Probability of Achieving Postoperative IOP≤18 mmHg at 3 Years Under Medications Following Four Types of Canal-Opening Minimally Invasive Glaucoma Surgery (MIGS).
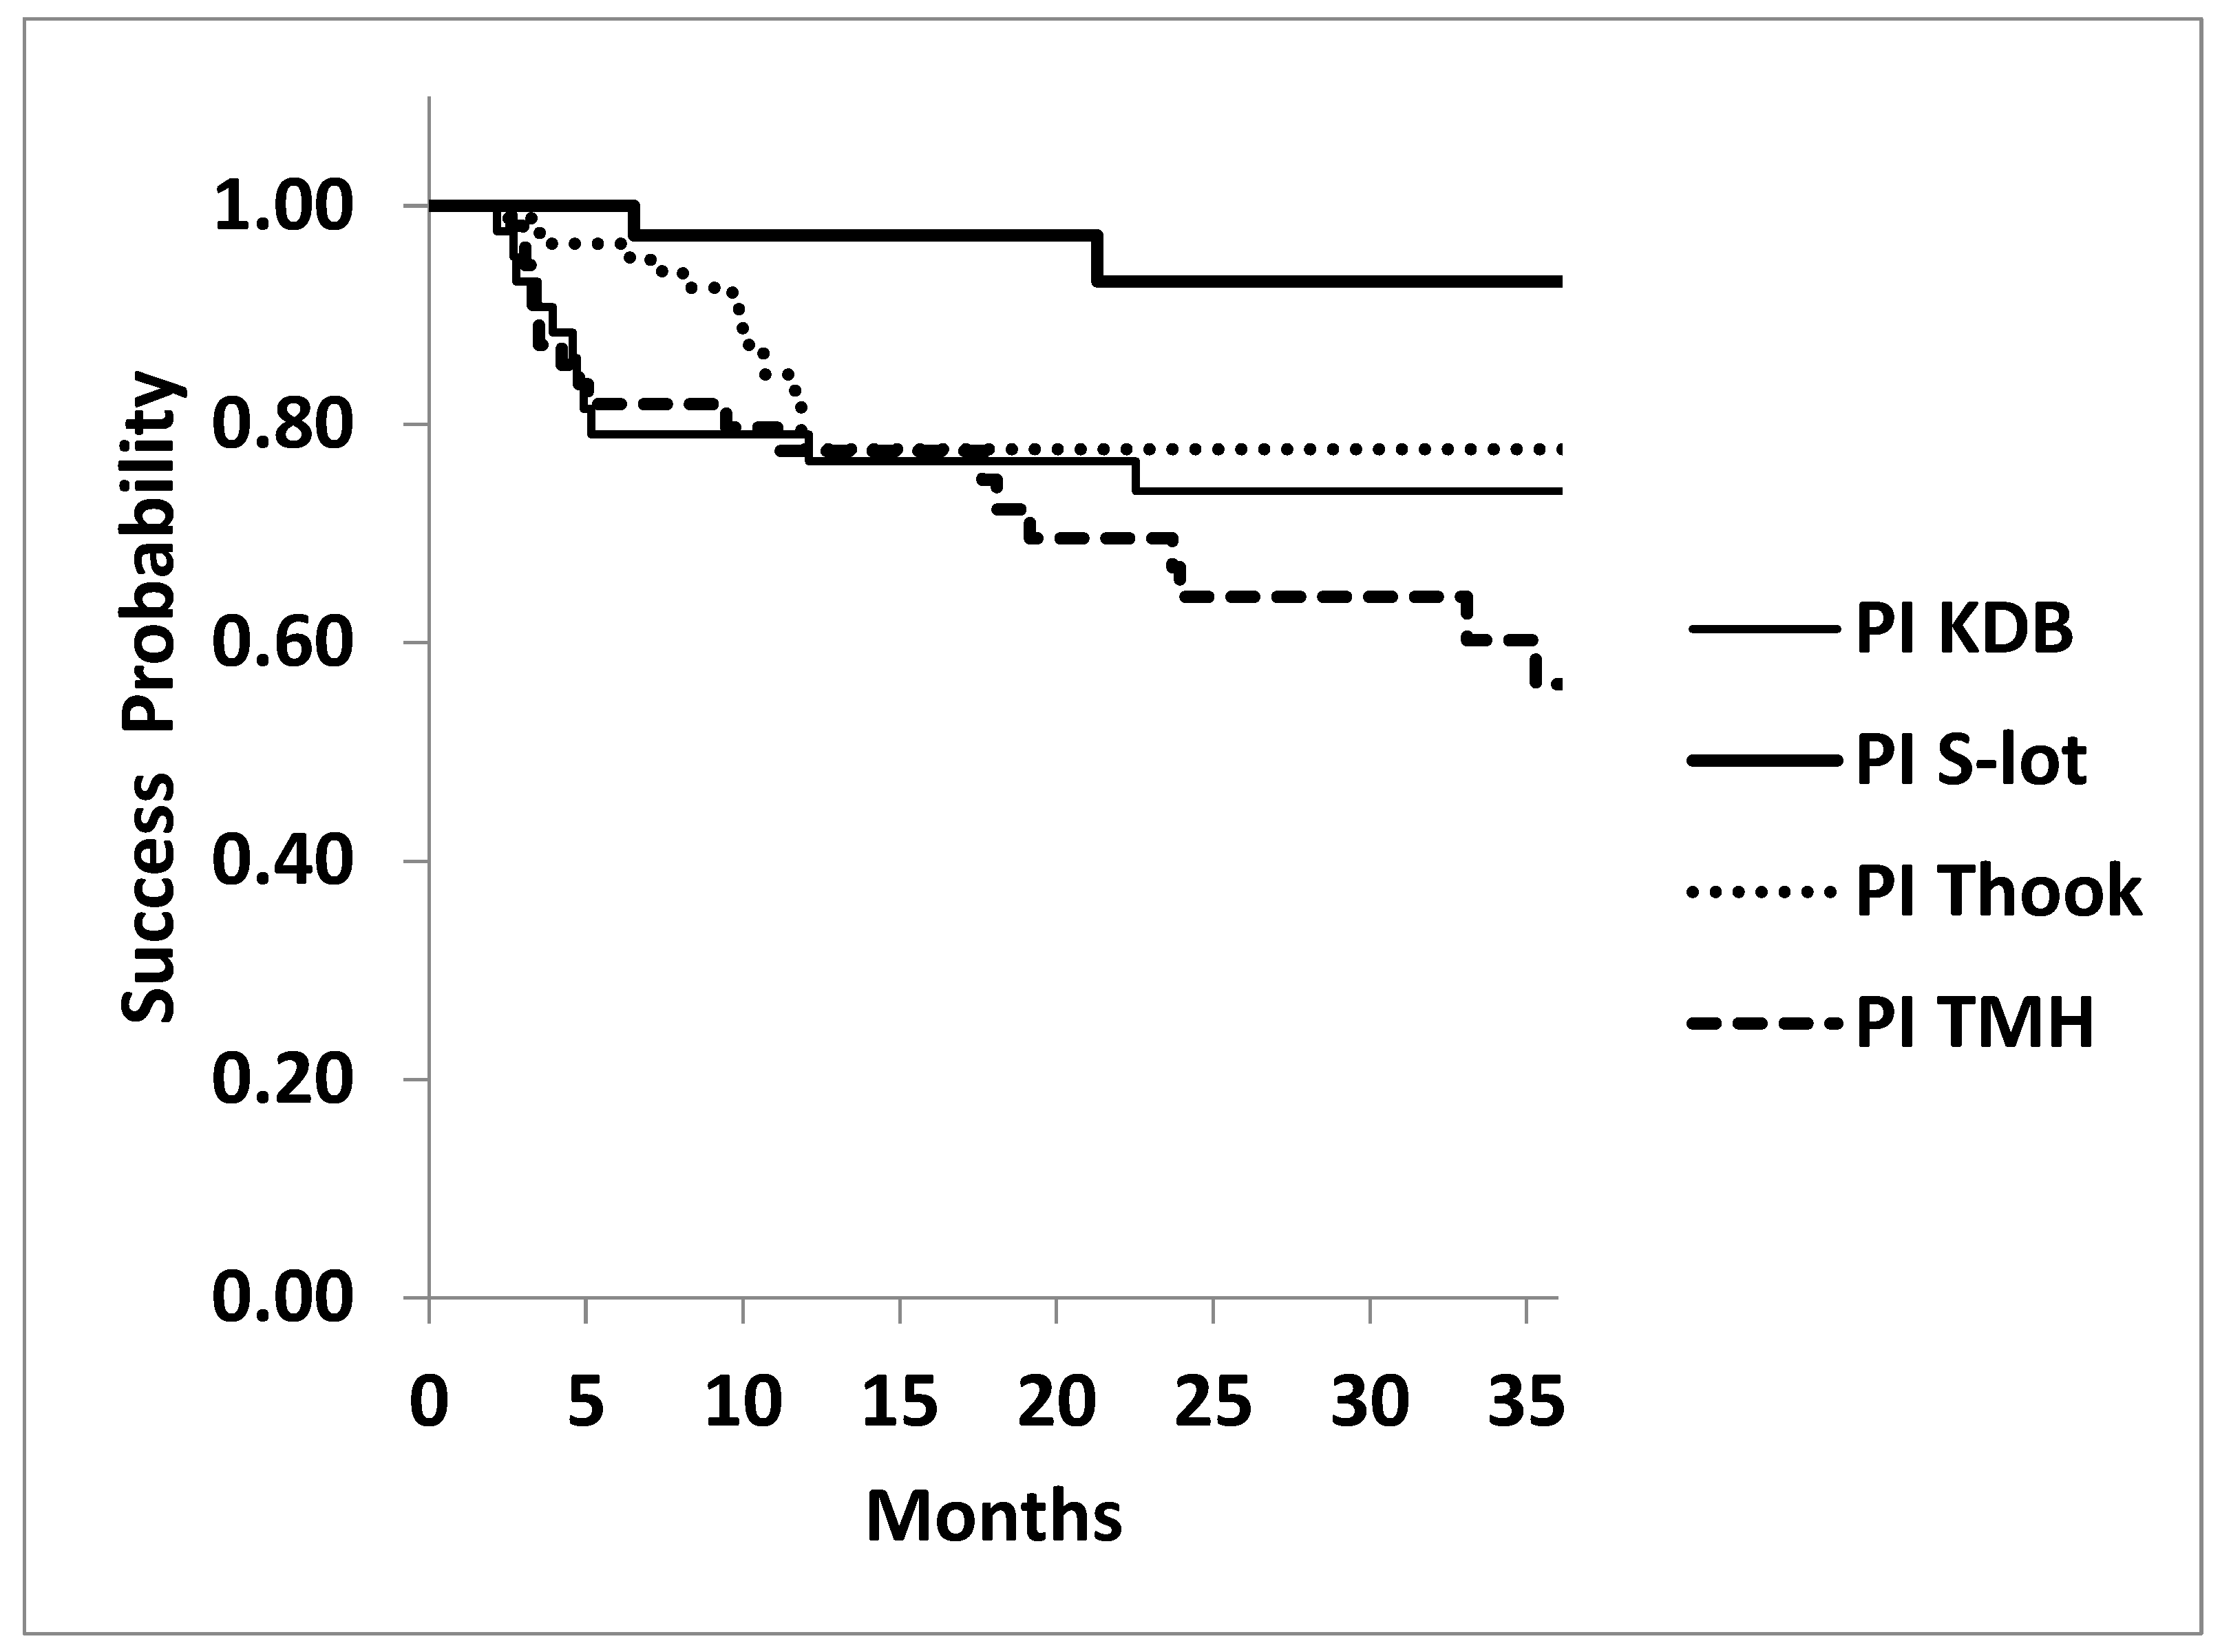
Legends for Figure 4: The cumulative success probability of achieving postoperative IOP≤18 mmHg at three years was again significantly higher in 360º canal-opening procedure (S-lot cohort) compared to the other three sectorial canal-opening procedures (Kahook dual blade, Tanito micro hook and T hook) by P=0.0052, log-rank test.
No significant differences in success probability were observed among the three sectorial canal-opening procedures (P=0.121, log rank test).
The success probability for achieving ≥20% IOP reduction at three years in KDB, S-lot, T hook and TMH were 59.2±7.7%, 78.4±7.7%, 56.3±10.0% and 45.1±8.1%, respectively. And the difference was marginally significant (P=0.0518 by log rank test).
There was no significant difference among the four COS procedures at 3 years in achieving an IOP≤21 mmHg at three years. The success probability in KDB, S-lot, T hook and TMH cohorts were 95.0±3.4%, 93.1±4.8%, 92.0±3.9% and 88.6±4.4%, respectively, (P =0.511, log rank test).
Postoperative intracameral bleeding
When post-surgical intracameral bleeding was compared among the 4 cohorts,
L1 layer bleeding was observed in 36.8% of patients who underwent S-lot, which was the highest incidence among the four COS cohort (P= 0.001, Haberman residual analysis).

Table 4.
Difference in Incidence of Intracameral Layer Bleeding Among Four COS Cohorts.
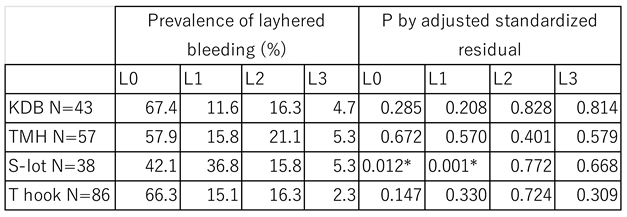 |
Table 5.
Prevalence of Intracameral Blood Coagula Formation in Each COS Cohort.
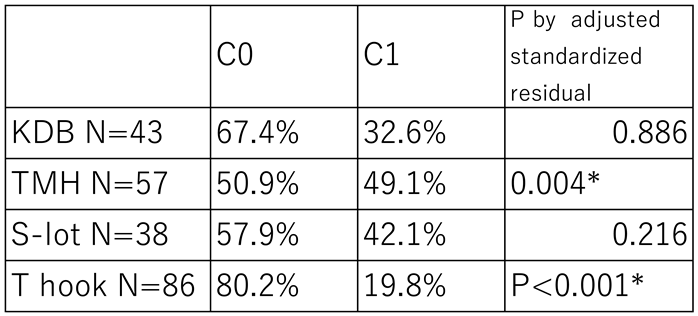 |
Table 6.
Density of intracameral bleeding the next day after surgery.
 |
Blood coagula formation in the anterior chamber was observed in 19.8% of cases in T hook cohort, which was significantly lower than in the other three COS cohorts (P<0.001). In contrast, coagula were observed in 49.1% of cases in the TMH cohort, representing the highest prevalence among the four groups(P=0.004).
R0 (no floating red blood cell on the first postoperative day) was observed in 27.9% of patients who underwent the T hook procedure, significantly more frequent than in the other cohorts (P<0.001). In contrast, the R0 was rare in TMH (P=0.004) and S-lot (P=0.009) cohorts. R2 (iris pattern not clearly visible due to floating red blood cells) was noted in 39.5% of S-lot cases, which was significantly higher than in other cohorts. While it was observed in only 15.1% of T hook cases, which was significantly lower than others (P=0.013).
The average time required for resolution of intracameral bleeding was shorter in the S-lot cohort at 3.1±2.4 days, significantly faster than that in the KDB cohort, which required 9.1±6.0 days (P=0.006, Tukey’s multiple comparison test).
The resolution time for the T hook and TMH cohort were 6.4±8.1 days and 6.3±6.8 days, respectively. Difference among the KDB, T hook and TMH groups were not statistically significant (P=0.43 -1.00, multiple comparison test).
Postoperative IOP spike
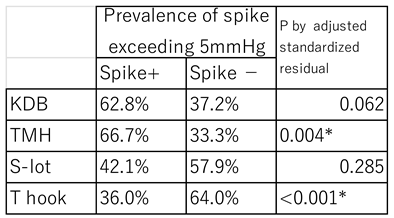
A postoperative spike was defined as an elevation of ≥5mmHg above the mean of 3 consecutive preoperative IOP measurements occurring within two weeks after surgery. The T hook cohort had the lowest spike rate at 36.0%, which was significantly less than in the other three COS groups (P<0.001; Haberman residual analysis, Table 7). In contrast, the TMH cohort had the highest spike rate at 66.7%, significantly more frequent than in other cohorts (P=0.004, Table 7)
Table 7.
Prevalence of postoperative IOP spike in each COS cohort.
 |
4. Discussion
There are several factors which may influence postoperative IOP following canal opening surgery. One such factor is the extent of Schlemm’s canal opening. Theoretically, a wider opening of the canal should result in greater IOP reduction [12]. However, if one or two intact aqueous veins are sufficient to drain enough amount of aqueous humor [13], a broad canal opening may not be necessary. It is reported that active aqueous veins are located in the infero-nasal quadrant of the angle [14,15], suggesting that a sectorial opening in this region alone may be sufficient to reduce IOP. Several reports suggest that an opening of 90 to 120 degrees can be sufficient for significant IOP reduction [7,16,17,18,19]. Some reports even suggest that implantation of a single iStent may achieve an IOP reduction comparable to that seen with KDB procedures [20,21]. Conversely, other studies have shown that 360° goniotomy results in greater IOP reduction than sectorial goniotomy [1,2,22,23].
Since blood coagula tend to settle in the inferior half of the eye, peripheral anterior synechia (PAS), which also commonly develop in this region, may obstruct the inferior canal opening. In this study, the mid-term IOP reduction in eyes that underwent sectorial opening of Schlemm’s canal in the inferior quadrant was less pronounced compared to that in the S-lot cohort, where the trabecular meshwork was opened circumferentially. This finding suggests that enhanced aqueous outflow through the superior quadrant in eyes with 360° trabecular meshwork incision may have contributed to greater IOP reduction than in eyes treated with inferior sectorial incisions (KDB, TMH and T hook cohorts).
Postoperative intracameral bleeding may contribute to PAS formation, transient IOP spikes and poor IOP control[8,24]. In this study, the IOP at 1 week postoperatively was marginally higher in the TMH and KDB cohorts compared to the T hook cohort, in which the incidence of clot formation and the density of intracameral bleeding were significantly lower. As shown in Figure 2, the IOP at 1 week in the KDB and TMH cohorts exceeded the mean of three consecutive preoperative IOP measurements, whereas the T hook cohort showed a lower IOP. These findings suggest that the higher incidence of clot formation and intracameral bleeding may have contributed to the transient IOP elevation observed in KDB and TMH cohorts at 1 week. Despite the short-term IOP rise in KDB and TMH at 1week and the higher IOP in TMH cohort at 3 months, no significant differences in postoperative IOP were observed among the three sectorial COS groups after 6 months. This finding suggests that the impact of postoperative bleeding on IOP is transient and does not persist long-term.
In the S-lot cohort, intracameral bleeding resolved in an average of only 3.1 days, which was shorter than in the other cohorts. This suggests that the wide circumferential opening of the trabecular meshwork may have facilitated efficient clearance of red blood cells from the anterior chamber.
Another potential confounding factor affecting surgical outcome is the wound healing response at the trabecular meshwork. Suture trabeculotomy does not involve excision of the trabecular meshwork, whereas KDB excises the meshwork tissue. In contrast, TMH and T hook do not remove the trabecular meshwork but instead displace it to create a “double door” opening. Despite these differences in the mechanism of canal opening, previous studies comparing KDB, TMH and T hood have not demonstrated significant difference in surgical outcomes [25,26]. The findings of the current study similarly suggest that, in terms of mid-term outcomes, there is no significant difference in IOP reduction among the three sectorial COS procedures.
Therefore, excision of the trabecular meshwork tissue may not be essential to achieve mid-term IOP reduction.
Although postoperative bleeding typically resolves shortly after surgery in most cases, severe complications such as corneal blood staining can occasionally occur. In case of massive hyphema accompanied by intense pain, surgical interventions such as paracentesis and anterior chamber wash out may be required. The lower incidence of postoperative bleeding and IOP spikes in the T hook cohort suggests that the use of the T hook may offer clinical benefit for patients.
The T-hook features blades on both sides of the shaft, allowing it to incise the trabecular meshwork bilaterally. Compared to other canal-opening surgery (COS) devices, it has the advantage of enabling a broader incision with a single insertion into the anterior chamber. Furthermore, the rounded distal tip minimizes the risk of damaging the outer wall of Schlemm’s canal, thereby reducing the likelihood of traumatic bleeding.
5. Conclusions
Postoperative IOP reduction was compared among four canal-opening MIGS procedures. The most significant IOP reduction was observed in the S-lot cohort.
The T hook cohort showed the least postoperative intracameral bleeding. While intracameral bleeding in the KDB and TMH cohorts was associated with short-term IOP elevation, it did not impact long-term IOP outcomes between 6 months and 3 years.
6. Limitation of This study
This study is retrospective and non-randomized. Although preoperative IOP was comparable among cohorts, the S-lot cohort exhibited significantly more advanced visual field defects, suggesting that surgeons may have preferentially selected S-lot for more severe glaucoma cases. Additionally, the follow-up period for the T hook cohort was significantly shorter, likely due to the recent introduction of the device.
To allow for a more accurate and unbiased comparison of surgical procedures, future studies should adopt a prospective, randomized design.
Author Contributions
Conceptualization, EC.; methodology, EC.; software, EC.; validation, EC., and TC.; formal analysis, EC.; investigation, EC.; resources, EC.; data curation, EC.; writing—original draft preparation, EC.; writing—review and editing, TC.; visualization, EC.; supervision.TC; project administration, EC.; funding acquisition, EC. All authors have read and agreed to the published version of the manuscript.
Funding
This research received no external funding.
Institutional Review Board Statement
The study was conducted in accordance with the Declaration of Helsinki and approved by the Institutional Review Board of Sensho-kai Eye Institute #25000009 (protocol code C2023-01R dated Sept 5, 2023).
Informed Consent Statement
Informed consent was obtained from all subjects involved in the study. Written informed consent for publication was not specifically obtained from the participating patients; however, the possibility of publication was disclosed during the process of obtaining consent for surgical agreement.
Data Availability Statement
The research data used in this research is available upon request from the corresponding author.
Acknowledgments
We extend our gratitude to the technicians at Sensho-kai for providing data that contributed to this study. During the preparation of this manuscript, the authors used Chat GPT 4 for the purposes to edit English. The authors have reviewed and edited the output and take full responsibility for the content of this publication.
Conflicts of Interest
The authors declare no conflicts of interest.
Abbreviations
The following abbreviations are used in this manuscript:
| KDB | Kahook dual blade |
| TMH | Tanito micro hook |
| S-lot | 360° suture trabeculotomy |
| COS | Canal-opening surgery |
| MIGS | Minimally invasive glaucoma surgery |
| PAS | Peripheral anterior synechia |
References
- Takata, M.; Ishikawa, H.; Ikeda, T.; Gomi, F. Conventional Trabeculotomy versus Gonioscopy-Assisted Transluminal Trabeculotomy: A Retrospective Cohort Study. J Clin Med. 2021, 11 . [CrossRef]
- Chen, J.; Wang, Y.E.; Quan, A.; Grajewski, A.; Hodapp, E.; Vanner, E.A.; Chang, T.C. Risk Factors for Complications and Failure after Gonioscopy-Assisted Transluminal Trabeculotomy in a Young Cohort. Ophthalmol Glaucoma. 2020, 3, 190-195 . [CrossRef]
- Irie, A.; Nakashima, K.I.; Inoue, T.; Kojima, S.; Takihara, Y.; Takahashi, E. Trabeculotomy Using the Kahook Dual Blade for Exfoliation Glaucoma and Primary Open Angle Glaucoma: Comparison of Outcomes According to Incision Range. J Glaucoma. 2024, 33, 270-276 . [CrossRef]
- Sugihara, K.; Shimada, A.; Ichioka, S.; Harano, A.; Tanito, M. Comparison of Phaco-Tanito Microhook Trabeculotomy between Propensity-Score-Matched 120-Degree and 240-Degree Incision Groups. J Clin Med. 2023, 12 . [CrossRef]
- Kuerten, D.; Walter, P.; Baumgarten, S.; Fuest, M.; Plange, N. 12-month outcomes of ab interno excisional goniotomy combined with cataract surgery in primary open-angle glaucoma and normal tension glaucoma. Int Ophthalmol. 2023, 43, 2605-2612 . [CrossRef]
- Wecker, T.; Anton, A.; Neuburger, M.; Jordan, J.F.; van Oterendorp, C. Trabeculotomy opening size and IOP reduction after Trabectome® surgery. Graefes Arch Clin Exp Ophthalmol. 2017, 255, 1643-1650 . [CrossRef]
- Song, Y.; Zhu, X.; Zhang, Y.; Shu, J.; Dang, G.; Zhou, W.; Sun, L.; Li, F.; Lin, F.; Zhang, Y.; et al. Outcomes of Partial Versus Complete Goniotomy With or Without Phacoemulsification for Primary Open Angle Glaucoma: A Multicenter Study. J Glaucoma. 2023, 32, 563-568 . [CrossRef]
- Shi, Y.; Wang, H.; Oatts, J.T.; Xin, C.; Yin, P.; Zhang, L.; Tian, J.; Zhang, Y.; Cao, K.; Han, Y.; et al. A Prospective Study of Intraocular Pressure Spike and Failure After Gonioscopy-Assisted Transluminal Trabeculotomy in Juvenile Open-Angle Glaucoma: A Prospective Study of GATT in JOAG. Am J Ophthalmol. 2022, 236, 79-88 . [CrossRef]
- Chihara, E.; Chihara, T. Development and Application of a New T-shaped Internal Trabeculotomy Hook (T-hook). Clin Ophthalmol. 2022, 16, 3919-3926 . [CrossRef]
- Day, A.C.; Donachie, P.H.; Sparrow, J.M.; Johnston, R.L. The Royal College of Ophthalmologists’ National Ophthalmology Database study of cataract surgery: report 1, visual outcomes and complications. Eye (Lond). 2015, 29, 552-560 . [CrossRef]
- Ishida, A.; Ichioka, S.; Takayanagi, Y.; Tsutsui, A.; Manabe, K.; Tanito, M. Comparison of Postoperative Hyphemas between Microhook Ab Interno Trabeculotomy and iStent Using a New Hyphema Scoring System. J Clin Med. 2021, 10 . [CrossRef]
- Rosenquist, R.; Epstein, D.; Melamed, S.; Johnson, M.; Grant, W.M. Outflow resistance of enucleated human eyes at two different perfusion pressures and different extents of trabeculotomy. Curr Eye Res. 1989, 8, 1233-1240 . [CrossRef]
- Stepanik, J. Measuring velocity of flow in aqueous veins. Am J Ophthalmol. 1954, 37, 918-922. .
- Vries, d. De Zichtbare Afvoer Van Het Kammerwater.; Drukkerij Kinsbergen: Amsterdam, 1947. .
- Cha, E.D.K.; Xu, J.; Gong, L.; Gong, H. Variations in active outflow along the trabecular outflow pathway. Exp Eye Res. 2016, 146, 354-360 . [CrossRef]
- Manabe, S.I.; Sawaguchi, S.; Hayashi, K. The effect of the extent of the incision in the Schlemm canal on the surgical outcomes of suture trabeculotomy for open-angle glaucoma. Jpn J Ophthalmol. 2017, 61, 99-104 . [CrossRef]
- Zhang, Y.; Yu, P.; Sugihara, K.; Zhu, X.; Yang, X.; Li, X.; Liu, Y.; Zhang, H.; Yan, X.; Lin, F.; et al. Influence of Goniotomy Size on Treatment Safety and Efficacy for Primary Open-Angle Glaucoma: A Multicenter Study. Am J Ophthalmol. 2023, 256, 118-125 . [CrossRef]
- Sugihara, K.; Ida, C.; Ohtani, H.; Tanito, M. Comparison of Standalone Tanito Microhook Trabeculotomy Between Unilateral and Bilateral Incision Groups. J Clin Med. 2025, 14 . [CrossRef]
- Hirabayashi, M.T.; Lee, D.; King, J.T.; Thomsen, S.; An, J.A. Comparison Of Surgical Outcomes Of 360° Circumferential Trabeculotomy Versus Sectoral Excisional Goniotomy With The Kahook Dual Blade At 6 Months. Clin Ophthalmol. 2019, 13, 2017-2024 . [CrossRef]
- Le, C.; Kazaryan, S.; Hubbell, M.; Zurakowski, D.; Ayyala, R.S. Surgical Outcomes of Phacoemulsification Followed by iStent Implantation Versus Goniotomy With the Kahook Dual Blade in Patients With Mild Primary Open-angle Glaucoma With a Minimum of 12-Month Follow-up. J Glaucoma. 2019, 28, 411-414 . [CrossRef]
- Asaoka, R.; Nakakura, S.; Mochizuki, T.; Ishida, A.; Fujino, Y.; Ishii, K.; Obana, A.; Tanito, M.; Kiuchi, Y. Which is More Effective and Safer? Comparison of Propensity Score-Matched Microhook Ab Interno Trabeculotomy and iStent Inject. Ophthalmol Ther. 2023, 12, 2757-2768 . [CrossRef]
- Qiao, Y.; Tan, C.; Chen, X.; Sun, X.; Chen, J. Gonioscopy-assisted transluminal trabeculotomy versus goniotomy with Kahook dual blade in patients with uncontrolled juvenile open-angle glaucoma: a retrospective study. BMC Ophthalmol. 2021, 21, 395 . [CrossRef]
- Elhusseiny, A.M.; El Sayed, Y.M.; El Sheikh, R.H.; Gawdat, G.I.; Elhilali, H.M. Circumferential Schlemm’s Canal Surgery in Adult and Pediatric Glaucoma. Curr Eye Res. 2019, 44, 1281-1290 . [CrossRef]
- Rao, A.; Khan, S.M.; Mukherjee, S. Causes of Immediate and Early IOP Spikes After Circumferential Gonioscopy-Assisted Transluminal Trabeculotomy Using ASOCT. Clin Ophthalmol. 2023, 17, 313-320 . [CrossRef]
- Mori, S.; Tanito, M.; Shoji, N.; Yokoyama, Y.; Kameda, T.; Shoji, T.; Mizoue, S.; Saito, Y.; Ishida, K.; Ueda, T.; et al. Noninferiority of Microhook to Trabectome: Trabectome versus Ab Interno Microhook Trabeculotomy Comparative Study (Tram Trac Study). Ophthalmol Glaucoma. 2022, 5, 452-461 . [CrossRef]
- Omoto, T.; Fujishiro, T.; Asano-Shimizu, K.; Sugimoto, K.; Sakata, R.; Murata, H.; Asaoka, R.; Honjo, M.; Aihara, M. Comparison of 12-month surgical outcomes of ab interno trabeculotomy with phacoemulsification between spatula-shaped and dual-blade microhooks. Jpn J Ophthalmol. 2021, 65, 402-408 . [CrossRef]
Table 1.
Baseline characteristics of the four canal-opening surgery cohorts.
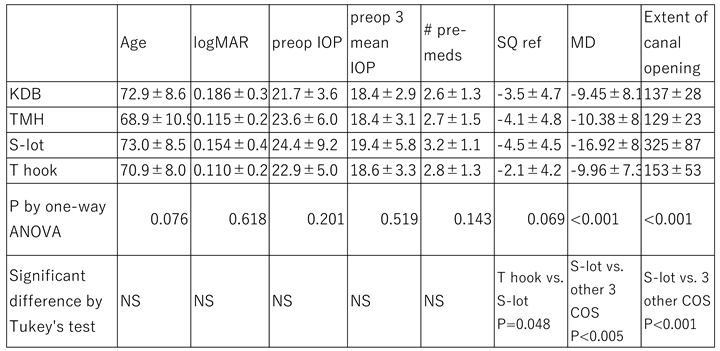 |
IOP: intraocular pressure, # pre-med: number of preoperative medications, SQ ref: spherical equivalent refractive error, MD: mean deviation using Humphrey Visual Field Analyzer, KDB: concomitant cataract surgery with Kahook dual blade, TMH: concomitant cataract surgery with Tanito microhook, S-lot: concomitant cataract surgery with 360° suture trabeculotomy, T hook: concomitant cataract surgery with T hook, ANOVA: analysis of variance, NS: not significant, COS: canal- opening surgery.
Table 2.
Time course of IOP after four different COS procedures, and differences among them assessed by multiple comparison test.
Table 2.
Time course of IOP after four different COS procedures, and differences among them assessed by multiple comparison test.
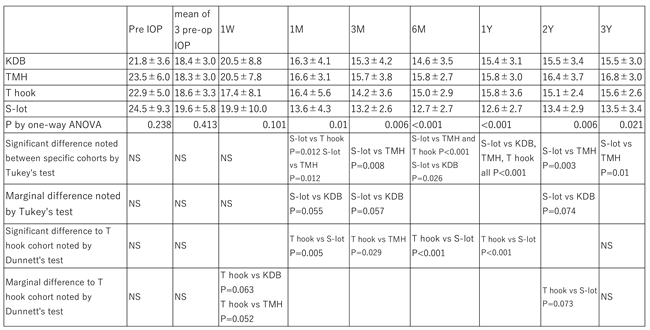 |
Table 3.
Comparison of percentage IOP reduction among four COS procedures and statistical differences assessed by multiple comparison test.
Table 3.
Comparison of percentage IOP reduction among four COS procedures and statistical differences assessed by multiple comparison test.
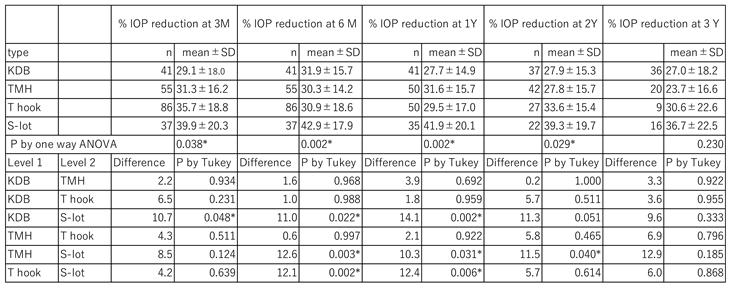 |
M: months, Y: years, n: sample size, SD: standard deviation, Tukey: Tukey’s multiple comparison test.
Disclaimer/Publisher’s Note: The statements, opinions and data contained in all publications are solely those of the individual author(s) and contributor(s) and not of MDPI and/or the editor(s). MDPI and/or the editor(s) disclaim responsibility for any injury to people or property resulting from any ideas, methods, instructions or products referred to in the content. |
© 2025 by the authors. Licensee MDPI, Basel, Switzerland. This article is an open access article distributed under the terms and conditions of the Creative Commons Attribution (CC BY) license (http://creativecommons.org/licenses/by/4.0/).
Copyright: This open access article is published under a Creative Commons CC BY 4.0 license, which permit the free download, distribution, and reuse, provided that the author and preprint are cited in any reuse.


