
Submitted:
29 May 2025
Posted:
06 June 2025
You are already at the latest version
Abstract
The properties of mannosylerythritol lipids-B (MEL-B) have been widely investigated, especially in skincare, food, and therapeutic fields. Despite that, few studies address the toxicity of this glycolipid on mammalian cells. Therefore, this work aimed to evaluate the in vivo oxidative stress of MEL-B in Swiss mice. MEL-B (50 and 150 mg/kg) was administered intraperitoneally at two exposure times, 24 and 72 h. The biochemical damage was quantified from gastrocnemius, lung, kidney, cardiac, liver, and spleen. In this study, we evaluated the measurements of reactive oxygen species, oxidative damage marker, antioxidant defenses, protein content, triglyceride, creatine kinase (CK-MB), and lactate dehydrogenase (LDH) levels. The DCF (2′,7′-dichlorofluorescein), sulfhydryl, and SOD (superoxide dismutase) content were used to verify the oxidative damage and antioxidant defenses of cells. The results indicate that the MEL-B does not trigger acute toxicity in the tested animal systemic context. Oxidative stress was observed in the liver samples, likely due to the metabolization of MEL-B. The triglyceride levels, CK-MB, and LDH enzymes do not present any significant alteration (p < 0.05), indicating that glycolipids do not trigger tissue damage. These findings open new perspectives for the safety use of MEL-B in cosmetic and medicinal products.

Keywords:
biosurfactant
; glycolipid
; mannosylerythritol lipids
; acute toxicity
; oxidative stress
1. Introduction
Mannosylerythritol lipids (MELs) are natural glycolipids produced under submerged fermentation by Pseudozyma spp. and Ustilago spp. [1,2,3]. From the 2000s onwards, published studies went beyond the topic of MELs production and began to explore their biological properties. In the pharmaceutical, medical, and skincare fields, it has been shown that MELs have antitumor, antimicrobial, moisturizing, and anti-melanogenic properties [4,5]. Recent studies highlight the potential of MEL-A and MEL-B in the food industry, with great emphasis on their antimicrobial, preservative, and emulsifying properties [6,7,8].
Several in vitro studies suggested the potential of MELs for biomedical applications [9,10,11]. Takahashi et al. [12] demonstrated the anti-inflammatory and antioxidant activity of MEL-C over human fibroblasts after exposure of cells to stress oxidative conditions. Previous studies [4,5,9,10,11] showed that MEL-A and -B inhibited the exocytotic release of serotonin and histamine of RBL-2H3 cells (rat basophilic leukemia cell line) after eight hours of exposure. A similar result was observed for TNF-α (tumor necrosis factor) and leukotriene mediators after treatment of RBL-2H3 cells with MELs for four hours and twenty minutes, respectively. Additionally, Ca2+, SNARE (soluble N-ethylmaleimide-sensitive factor attachment protein receptors), and MAP (mitogen-activated protein kinase) signaling pathways, were modified by the action of glycolipids, evidencing anti-inflammatory aspects of them [4,5,9,10,11]. In the skincare field, Bae et al. [13] suggest that MEL-B acts by inhibiting, at mRNA levels, the expression of tyrosinases, a melanogenic enzyme. Bae et al. [14] showed that MELs can restore the signaling pathway involved in aquaporin-3 overexpression after exposure of keratinocytes to UVA radiation.
However, an in vivo toxicity assessment of any novel potential drug is essential before further development. Cheng et al. [15] developed a berberine-loaded MEL-B nanomicelle delivery system to combat biofilm-induced Helicobacter pylori resistance. The in vivo test shows significantly reduced H. pylori levels, repaired the gastric mucosal barrier, and decreased inflammation, offering a safe nanodrug strategy for eradicating H. pylori biofilms. The study performed by Liu et al. [16] demonstrated that combining high hydrostatic pressure with the biosurfactant MEL-A has a synergistic bactericidal effect against Listeria monocytogenes. Additionally, the in vivo safety of MEL-A was confirmed using mouse models, suggesting its promising safe application in the food industry. Another study combines MELs with nanocarriers and targeting ligands for controlled and targeted delivery [17]. The toxicological profile of biosurfactant-encapsulated polymeric nanoparticles of Polylactic acid-Polyethylene glycol in mice find no significant differences in hematological, biochemical, or histopathological parameters between the control and treated groups, suggesting that nanoparticles are non-toxic and could provide a safe platform for future biomedical applications.
Recently, Feuser and collaborators [5] demonstrated that direct contact of MEL-B with erythrocytes promotes the lysis of these cells at a concentration of 80 µg/mL and is effective in inducing apoptosis in B16F10 cells (murine melanoma) in a dose-dependent manner. Furthermore, in vitro cytotoxicity analysis showed that MEL-B did not induce inflammatory or vasodilatation responses in healthy cells [5,18]. However, beyond these data, there is limited knowledge regarding the effect of MELs on healthy cells and tissues. In this sense, biochemical and toxicity studies are needed to evaluate possible allergic effects and acute or chronic health complications occasioned by MEL-B.
Thus, this study aimed to evaluate in vivo acute toxicity of MEL-B (50 and 150 mg/Kg), administered in Swiss mice intraperitoneally. The animals were euthanized after 24 h and 72 h of administration, and the biochemical parameters were evaluated in different organs. This study indicates minimal side effects of MEL-B, which could support the safe dosing and its biocompatibility for therapeutic, pharmacological, and medical applications.
2. Materials and Methods
2.1. Materials and Reagents
MEL-B (≥ 95% purity) was produced by submerged fermentation using yeast-like Pseudozyma spp., according to the method previously described [11]. The glycolipid was recovered from fermentation broth using liquid-liquid extraction using a Silica open column.
The 2′,7′-dichlorodihydrofluorescein diacetate (DCFH-DA) and phosphate buffer sodium (PBS), 5,5′-dithiobis (2-nitrobenzoic acid), superoxide dismutase (SOD), bovine serum albumin, and phosphomolybdic phosphotungstic reagent (Folin phenol) were purchased from Sigma Aldrich, Brazil. The creatine kinase (CK-MB), lactate dehydrogenase (LDH), and triglycerides were acquired from Liquiform were purchased from Labtest Diagnostic.
2.2. Animals
Experiments were performed using 36 adult Swiss mice animals (25–30 g), eighteen male and eighteen female. The animals were divided into three groups: (i) control group without MEL-B, PBS was used instead; (ii) MEL-B at a concentration of 50 mg/kg and (iii) MEL-B at a concentration of 150 mg/kg. MEL-B was administered intraperitoneally (IP) to the animals, intraperitoneal administration usually led to faster absorption when compared to other administration via and can be used to administer large volumes of fluid safely, thus it is proper via of administration (Silva et al. 2021). The doses and treatment time used in this study were selected based on our in vitro experiments in previous studies [5].
Five animals were housed per cage under controlled conditions: 22 ± 1 °C, humidity level (55–65%), and free access to food and water. After 24 hours of administration, 50% of the animals were euthanized. A similar procedure was performed after 72 hours of administration. The mice were euthanized by cervical dislocation, and the tissue was surgically removed, processed, and stored in a freezer at -80 °C until further analysis. All experimental protocols were approved by the research ethics committee of UNESC (protocol number 13/2020). The doses used in this study were selected based on our pilot experiments and previous studies (data not shown).
2.3. Analysis of Biochemical Parameters
2.3.1. Preparation of Samples for Biochemical Analyses
The tissues/organs used for the biochemical study were surgically removed and included the region of the gastrocnemius, liver, lung, kidney, cardiac, and spleen. The material obtained was homogenized in PBS buffer, centrifugated (1,000 rpm, 4 °C), and frozen at -80 °C. The liquid of homogenization was also stored (-80 °C) for analysis. The maximum storage period was five days.
2.3.2. Intracellular Determination of Reactive Oxygen Species (ROS)
Oxidized intracellular 2′,7′-dichlorofluorescein (DCF) levels were monitored in samples after incubation with 2′,7′-dichlorodihydrofluorescein diacetate (DCFH-DA). The formation of the oxidized fluorescent derivative was monitored at excitation and emission wavelengths of 488 and 525 nm, respectively, using a fluorescence spectrophotometer SpectraMax [19].
2.3.3. Determination of Oxidative Damage Marker Levels
The total thiol content was used to determine the oxidative damage marker levels using a 5,5′-dithiobis (2-nitrobenzoic acid) reagent. The incorporation of the compound was measured at 412 nm using a spectrophotometer and expressed in sulfhydryl content levels [20].
2.3.4. Determination of Antioxidant Defenses
Antioxidant defenses were estimated by superoxide dismutase (SOD) activity, quantified by inhibition of adrenaline autoxidation at 480 nm [21]. Results were expressed in U SOD/mg protein.
2.3.5. Protein Content
The protein content of muscle tissue was measured according to the protocol by Lowry protein assay [22].
2.3.6. Creatine Kinase (CK-MB) and Lactate Dehydrogenase (LDH) Levels
Biochemical analyses were performed with animal blood serum. The blood was collected retro-orbitally in Eppendorf tubes. Then, the samples were centrifuged at 10,000 rpm for five minutes, and the serum obtained was stored in microcentrifuge tubes at -80 ºC until analysis. The following variables were measured: triglycerides, activity of creatine kinase, and lactate dehydrogenase. All readings measurements were performed using a spectrophotometer (SpectraMax® M3) [19,20,21].
2.4. Statistical Analysis
The biochemical data were analyzed statistically to verify differences between the treatments. A two-way ANOVA was used for all assays (p < 0.05) followed by Turkey’s test as a post hoc comparison. The software GraphPad Prism software version 8.0 (San Diego, CA, USA) was used.3. Results
This section may be divided by subheadings. It should provide a concise and precise description of the experimental results, their interpretation, as well as the experimental conclusions that can be drawn.
4. Results and Discussion
Figures 1 to 6 present the oxidants, oxidative damage, and antioxidant defense data for tissue samples from animals treated with two concentrations of MEL-B (50 and 150 mg/kg) administered for 24 and 72 hours. Oxidant levels are presented as DCF, oxidative damage as sulfhydryl content, and antioxidant defenses were expressed by SOD. The animals from the control group were treated with the administration of PBS solution.
In the period of 24 h (Figure 1a), the DCF levels were reduced (p < 0.05) compared to the untreated group, while after 72 h, an increase in DCF content was observed (Figure 1d) at a dose of 150 mg/kg. There was no significant difference between the sulfhydryl content of samples (Figure 1b) after treatment with MEL-B for 24 h. An increase in sulfhydryl activity was observed for both doses tested (Figure 1e) after 72 hours of IP administration. The groups exposed to MEL-B differed statistically from the samples treated with PBS (control group), with the exception of sulfhydryl content (Figure 1). The SOD levels presented a significant reduction in the spleen (Figure 1c-f) for both doses and exposition times (24 and 72 h), which was more pronounced at 24 h.
Figure 3a shows that MEL-B influenced the level of DCF in liver samples compared to untreated ones when incubated for 24 h. Interestingly, when the glycolipid was administered for 72 h (Figure 2d), the treated samples differed from the control (p < 0.05) and each other (p < 0.05). Regarding the sulfhydryl content, both treatments decreased (p < 0.05) the sulfhydryl levels at 24 h, which was more pronounced when 150 mg/kg of MEL-B was used (Figure 3b). No significant difference in sulfhydryl content was observed 72 h after administration of MEL-B (Figure 3e). SOD activity decreased (p < 0.05) for both treated groups at 24 h (Figure 3c). Figure 3f suggests that the lung tissue treated for 72 h with 50 mg/kg of MEL-B was similar to the control, a significant decrease was only observed for a dose of 150 mg/kg.
For kidney samples, a significant increase (p < 0.05) in DCF levels was observed for treatment conditions of 50 mg/kg/24 h (Figure 4a) and 150 mg/kg/72 h (Figure 4d). Sulphydryl levels were only altered after administration of MEL-B at 50 mg/kg for 72 h (Figure 4b and Figure 4e). The glycolipid concentrations modify SOD levels differently after 24 h of treatment (Figure 4c), being however similar to the sample without MEL-B. No alterations were observed in SOD activity at 72 h (Figure 4f).
The DCF levels of cardiac tissue were not altered after 24 h IP administration (Figure 5a). For samples of the animals in which MEL-B was administered for 72 h, 150 mg/kg influenced the DCF levels (Figure 5d), while 50 mg/kg has no effect (p < 0.05). Regarding the sulfhydryl content, there was a significant decrease (p < 0.05) at a dose of 150 mg/kg for IP administration of 24 h (Figure 5b). At 72 h, no significant differences were observed (Figure 5e). After 24 h of MEL-B administration, the SOD activity was significantly higher (p < 0.05) at a dose of 50 mg/kg compared to 150 mg/kg and control group (Figure 5c). The samples of the animals treated with 50 mg/kg/72 h (Figure 5f) differed from the control, presenting a lower SOD activity.
Figure 6a reveals that treatment of gastrocnemius samples of animals treated with MEL-B/24 h promoted differences in DFC levels. At 50 mg/kg, the glycolipid was more expressive in the elevation of DFC levels (p < 0.05). Similar behavior was observed for the samples of the animals administered for 72 hours, except that the control and the 150 mg/kg dose showed the same influence (p < 0.05). MEL-B effects on the sulfhydryl content were observed only after 72 h (Figure 6b and Figure 6e) of administration, where sulfhydryl levels were significantly higher (p < 0.05) at a dose of 50 mg/kg. As observed in Figure 6c and Figure 6f, SOD activity decreased (p < 0.05) for animals treated with 50 and 150 mg/kg of MEL-B.
Table 1 summarizes the data observed from Figure 1 to 6, showing the DCF, SOD and sulfhydryl content of the region of the gastrocnemius, liver, lung, kidney, cardiac, and pulmonary tissue, with and without MEL-B administration.
Figure 7 shows the effect of MEL-B doses (50 and 150 mg/kg) on the triglyceride, CK-MB, and LDH levels. No significant differences were observed between samples of animals treated with and without the glycolipid.
MELs have drawn attention to cosmetic and pharmaceutical industries due to their non-toxicity and excellent biological interactions with human skin, particularly with the deepest epidermal layer. MEL-B can be arranged in a lamellar phase, a structure similar to the stratum corneum molecular arrangement, and that also has a role in the tumor cells’ deregulation. Previous in vitro results showed the cytotoxic effect of MEL-B against B16F10 tumor cells [4,5]. Despite the reported properties, the oxidative levels and antioxidant defense effects of MEL-B in mammalian cells are unknown and poorly investigated.
Oxidative stress comes from an imbalance between oxidizing and antioxidant defenses. Therefore, oxidative damage occurs and promotes the oxidation of biomolecules [23,24]. When ROS exceeds detoxification capacities, oxidative damage to lipids, nucleic acids, and proteins can occur. If this damage is irreparable, the cell will die by apoptosis (programmed cell death) or necrosis, depending on the extent of the damage. These mechanisms can result in the loss of enzyme or protein properties [25].
From spleen tissue analysis, it was concluded that 50 mg/kg of MEL-B/24 h does not promote ROS generation, suggesting its non-toxicity properties in mammals. The reduction of SOD activity indicates that glycolipid can display an antioxidant effect because DCF and sulfhydryl levels were not affected. This behavior was more evident for the 150 mg/kg dose, where the DCF levels were even lower. After 72 h of administration of MEL-B, the oxidant parameters indicate an increase in ROS production and a decrease in the antioxidant defense at 150 mg/kg. Regarding the sulfhydryl levels, the results suggest no protein damage effect. Moreover, the data set indicates that 150 mg/kg of glycolipid induced ROS production, which was not a condition to trigger oxidative stress.
On the lungs, the DCF levels indicate that there was no ROS production after MEL-B administration. In addition, a dose of 50 mg/kg suggests an antioxidant effect of glycolipid. On the contrary, oxidative stress was evidenced for liver samples. The liver is an organ related to several metabolic cycles of adverse biological compounds. Therefore, even low concentrations of some molecules (food or drugs) can trigger ROS production. The data from liver assays suggest that long periods (72 h) are required for full metabolization of biosurfactants. Similar results were reported by Feuser et al. [5], who evaluated the acute toxicity of polymeric nanoparticles. From such research, the authors demonstrated that synthesized material promoted alterations in the sulfhydryl and SOD levels of the liver, suggesting that the glutathione route is an alternative to contouring the nanoparticle’s effects.
The assays with kidneys showed that the lower MEL-B dose (50 mg/kg) induced ROS production after 24 h of administration. No alterations were observed in the antioxidant defenses and protein damage. After 72 h, the concentration of 150 mg/kg of MEL-B induced ROS production, while the dose of 50 mg/kg did not produce any alterations. The results showed that both DCF and SOD content increases, culminating in an oxidative balance [24].
Analysis of cardiac tissue showed the antioxidant role of MEL-B at a dose of 50 mg/kg. On the other hand, the concentration of 150 mg/kg induced oxidative stress, evidenced by the increase in the level of ROS. Furthermore, the concentration of 150 mg/kg also caused oxidative damage, as shown by the sulfhydryl levels.
MEL-B induced ROS production at 24 and 72 h in the gastrocnemius muscle. A specific condition of 150 mg/kg MEL-B/72 h reduced the antioxidant levels with no alteration in ROS production, suggesting an antioxidant effect of glycolipid. In addition, the sulfhydryl levels suggest no protein damage in this tissue.
In general, in the analysis of tissues/organs, it can be assumed that MEL-B presents antioxidant activity, mainly at a concentration of 50 mg/kg. Liver samples were an exception to this behavior, as the data indicated oxidative cell damage.
The radical scavenging activity of MEL-B was reported by Takahashi et al. [12]. The authors suggest that the radical scavenging activity of MEL-B is related to their arrangement. Radical scavenging was more evident when MEL-B was in free form, while superoxide anion-scavenging was observed for self-assembled structure. These data are aligned with our findings since MEL-B showed scavenging activity for free radicals, but no superoxide anion activity was observed. The liver and spleen tend to have high superoxide anion levels, which can justify the absence of a reduction in DCF levels for these organs.
Morita et al. [26] showed that MELs decrease oxidative damage of cells by reducing ROS production. A similar result was obtained for almost all structures analyzed in the current study. The spleen samples were an exception because a significant increase in the DCF levels and decrease of thiol groups was observed after exposure of cells to 150 mg/kg of MEL-B for 72 h. The results of the other organs agree with the literature data, which demonstrated that MELs have no adverse effect on the cells, and their antioxidant effect can be due to free radicals scavenging [12,26].
No alterations were observed in the activity of LDH and CK-MB enzymes, indicating the lack of tissue damage evaluated by these parameters.
The results presented in this study showed that MEL-B does not induce compromising changes in healthy animals. Indeed, previous findings showed that MEL-B presented promising cytotoxic results in cancer cells, whereas an innoxious effect was observed in fibroblasts [4,5,12,26].
The data presented in the current study show that MEL-B does not provide acute toxicity on the gastrocnemius, lung, kidney, cardiac, and pulmonary tissue when intraperitoneal administration is used. Moreover, it was demonstrated that MEL-B can cross cell membranes, increasing ROS levels however enzymatic activity is not compromised, indicating a reversible oxidative damage [12,26]. Thus, the current results open new perspectives for the investigation of the cosmetic, therapeutic, and pharmacological properties of MEL-B.
5. Conclusions
MEL-B does not trigger acute toxicity in the animal systemic context: gastrocnemius muscle, lung, kidney, cardiac, and spleen. The ROS production and oxidative stress were expressive for liver samples. Both doses of MEL-B, 50 and 150 mg/kg, were considered safe for in vivo administration, suggesting non-toxic properties in mammals. The biochemical test conditions do not promote tissue damage. These results suggest a little side effect of MEL-B, which may provide a subsidy for the extrapolation of safe dose administrations and their biocompatibility for therapeutic, pharmacological, and medical research.
Supplementary Materials
The following supporting information can be downloaded at the website of this paper posted on Preprints.org, Figure S1. Spleen, lung, liver, kidney, heart, and gastrocnemius: Analysis of the levels of DCFH in the period of 24 hours, after administration of MEL-B in concentrations of 50mg/kg and 150mg/kg through IP administration in mice. *p<0,05, **p<0,005, p<0,0005 compared to the control group and #p<0,05, compared to the group 150mg/kg, according to One-way ANOVA followed by Tukey’s Multiple Comparison Test; Figure S2. Spleen, lung, liver, kidney, heart, and gastrocnemius: Analysis of the levels of DCFH in the period of 72 hours, after administration of MEL-B in concentrations of 50mg/kg and 150mg/kg through IP administration in mice. *p<0,05, **p<0,005, p<0,0005 when compared to the control group and #p<0,05, ##p<0,005, ###p<0,0005 when compared to the group 150mg/kg, according to One-way ANOVA followed by Tukey’s Multiple Comparison Test; Figure S3. Spleen, lung, liver, kidney, heart, and gastrocnemius: Analysis of the sulfhydryl content in the period of 24 hours, after administration of MEL-B in concentrations of 50mg/kg and 150mg/kg, through IP administration in mice. *p<0,05, **p<0,005, ***p<0,0005 when compared to the control group, according to One-way ANOVA followed by Tukey’s Multiple Comparison Test; Figure S4. Spleen, lung, liver, kidney, heart, and gastrocnemius: Analysis of the sulfhydryl content in the period of 72 hours, after administration of MEL-B in concentrations of 50mg/kg and 150mg/kg, through IP administration in mice. *p<0,05, **p<0,005, when compared to the control group, and ##p<0,005 when compared to the group 150mg/kg, according to One-way ANOVA followed by Tukey’s Multiple Comparison Test; Figure S5. Spleen, lung, liver, kidney, heart, and gastrocnemius: Analysis of the antioxidant activity of the enzyme SOD in the period of 24 hours, after administration of MEL-B in concentrations of 50mg/kg and 150mg/kg, through 0IP administration in mice. *p<0,05, **p<0,005, when compared to the control group and #p<0,05, ##p<0,005 when compared to the group 150mg/kg, according to One-way ANOVA followed by Tukey’s Multiple Comparison Test; Figure S6. Spleen, lung, liver, kidney, heart, and gastrocnemius: Analysis of the antioxidant activity of the enzyme SOD in the period of 72 hours, after administration of MEL-B in concentrations of 50mg/kg and 150mg/kg, through IP administration in mice. *p<0,05, **p<0,005, when compared to the control group, according to the ANOVA one-way test, followed by Tukey’s Multiple Comparison Test.
Author Contributions
The authors declare that all data were generated in-house and that no paper mill was used: PME, ALSC, MMC, RS, MIV, and LTWT conducted experiments. PMF, RAMA, PCLS, DO and, CJA contributed new reagents or analytical tools. PME, ALSC, MMC, RS, MIV, LTWT, PMF, RAMA, PCLS, DO and, CJA analyzed data. PME, ALSC, MMC, RS, MIV, IKDF and LTWT wrote the manuscript. All authors read and approved the manuscript, and all data were generated in-house and that no paper mill was used.
Funding
The authors are grateful to PNPD-CAPES (Process number 88882.316483/2019-01).
Institutional Review Board Statement
UNESC ethics committee for animal experimentation (protocol number 13/2020)
Informed Consent Statement
Not applicable.
Conflicts of Interest
The authors declare no conflicts of interest
References
- Arutchelvi, J.I., Bhaduri, S., Uppara, P.V., Doble, M. 2008. Mannosylerythritol lipids: a review. J. Ind. Microbiol. 35, 1559-1570. [CrossRef]
- Beck, A., Werner, N., Zibek, S., 2019. Mannosylerythritol lipids: biosynthesis, genetics and production strategies, In: Hayes, D.G., Solaiman, D.K.Y., Ashby, R.D. (Eds.), Biobased surfactants – synthesis, properties, and applications. AOCS Press., pp. 121-167. [CrossRef]
- Niu, Y., Wu, J., Wang, W., Chen, Q., 2019. Production and characterization of a new glycolipid, mannosylerythritol lipid, from waste cooking oil biotransformation by Pseudozyma aphidis ZJUDM34, Food Sci. Nutr. 7, 937–948. [CrossRef]
- Coelho, A.L.S., Feuser, P.E., Carciofi, B.A.M., Andrade, C.J., Oliveira, D., 2020. Mannosylerythritol lipids: antimicrobial and biomedical properties. Appl. Microbiol. Biotechnol. 104:2297–2318. [CrossRef]
- Feuser, P.E., Coelho, A.L.S., Melo, M.E., Scussel, R., Carciofi, B.A.M., Machado-de-Ávila, R.A., Oliveira, D., Andrade, C.J., 2021. Apoptosis induction in murine melanoma (B16F10) cells by mannosylerythritol lipids-B; a glycolipid biosurfactant with antitumoral activities. 193, 3855–3866. [CrossRef]
- Liu, X., Shu, Q., Chen, Q., Pang, X., Wu, Y., Zhou, W., Wu, Y., Niu, J., Zhang, X., 2020. Antibacterial efficacy and mechanism of mannosylerythritol lipids-A on Listeria monocytogenes. Molecules. 25, 4857. [CrossRef]
- Shu, Q., Wei, T., Liu, X., Liu, S., Chen, Q. 2022. The dough-strengthening and spore-sterilizing effects of mannosylerythritol lipid-A in frozen dough and its application in bread making. Food Chemistry, 369, 131011. [CrossRef]
- Silva, I.A., Veras, B.O., Ribeiro, B.G., Aguiar, J.S., Guerra, J.M.C., Luna, J.M., Sarubbo, L. A. 2020. Production of cupcake-like dessert containing microbial biosurfactant as an emulsifier. Peer J, 8, e9064. [CrossRef]
- Fan, L., Li, H., Niu, Y., Chen, Q., 2016. Characterization and inducing melanoma cell apoptosis activity of mannosylerythritol lipids-a produced from Pseudozyma aphidis. PLoS One. 11, e0148198. [CrossRef]
- Zhao, X., Murata, T., Ohno, S., Day, N., Song, J., Nomura, N., Nakahara, T., Yokoyama, K.K., 2001. Protein kinase Cα plays a critical role in mannosylerythritol lipid-induced differentiation of melanoma B16 cells. J. Biol. Chem. 276, 39903–39910. [CrossRef]
- Wakamatsu, Y., Zhao, X., Jin, C., Day, N., Shibahara, M., Nomura, N., Nakahara, T., Murata, T., Yokoyama, E.E. 2001. Mannosylerythritol lipid induces characteristics of neuronal differentiation in PC12 cells through and ERK-related signal cascade. Eur j Biochem. 268, 373-383. [CrossRef]
- Takahashi, M., Morita, T., Fukuoka, T., Imura, T., Kitamoto, D., 2012. Glycolipid biosurfactants, mannosylerythritol lipids, show antioxidant and protective effects against H2O2-induced oxidative stress in cultured human skin fibroblasts. J. Oleo Sci. 61, 457–464. [CrossRef]
- Bae, I.H., Lee, E.S., Yoo, J.W., Lee, S.H., Ko, J.Y., Kim, Y.J., Lee, T.R., Kim, D.Y., Lee, C.S., 2019a. Mannosylerythritol lipids inhibit melanogenesis via suppressing ERK-CREB-MiTF-tyrosinase signalling in normal human melanocytes and a three-dimensional human skin equivalent. Exp. Dermatol. 28:738–741. [CrossRef]
- Bae, I.H., Lee, S.H., Oh, S., Choi, H., Marinho, P.A., Yoo, J.W., Ko, J.Y., Lee, E.S., Lee, T.R., Lee, C.S., Kim, D.Y., 2019b. Mannosylerythritol lipids ameliorate ultraviolet A-induced aquaporin-3 downregulation by suppressing c-Jun N-terminal kinase phosphorylation in cultured human keratinocytes. Korean J. Physiol. Pharmacol. 23,113–120. [CrossRef]
- Cheng, X., Geng, J., Wang, L., Ma, X., Su, Y., Arif, M., Liu, C. Berberine-loaded mannosylerythritol lipid-B nanomicelles as drug delivery carriers for the treatment of Helicobacter pylori biofilms in vivo, European Journal of Pharmaceutics and Biopharmaceutics, 193, 2023, 105-118, 0939-6411, . [CrossRef]
- Liu, X., Zhang, L., Pang, X., Wu, Y., Wu, Y., Shu, Q., Chen, Q., Zhang, X., 2022. Synergistic antibacterial effect and mechanism of high hydrostatic pressure and mannosylerythritol lipid-A on Listeria monocytogenes. Food Control. 135, 108797. [CrossRef]
- Rana, R., Singh, J., Wadhawan, A., Khanna, A., Singh, G., Chatterjee, M. Evaluation of In Vivo toxicity of Novel Biosurfactant from Candida parapsilosis loaded in PLA-PEG Polymeric Nanoparticles. Journal of Pharmaceutical Sciences, 110, 2021, 1727-1738, 0022-3549, . [CrossRef]
- Liou, G.Y., Storz, P., 2010. Reactive oxygen species in cancer. Free Radic. Res. 44, 1-31 . [CrossRef]
- Eruslanov, K.E., 2010. Identification of ROS using DCFDA and flow-cytometry, In: Donald Armstrong, D. (Eds.), Advanced protocols in oxidative stress II. Springer., pp. 57-72. [CrossRef]
- Aksenov, M.Y., Markesbery, W.R., 2001. Changes in thiol content and expression of glutathione redox system genes in the hippocampus and cerebellum in Alzheimer’s disease. 2001. Neurosci. Lett. 302, 141–145. [CrossRef]
- Bannister, J.V., Calabrese, L., Assays for superoxide dismutase. 1987. Methods Biochem. Anal. 32,279–312. [CrossRef]
- Lowry, H., Rosebrough, O.N.J., Farr, A.L., Randall, R.J. 1951. Protein measurement with the folin phenol reagent. J. Biol. Chem. 193:265–275. [CrossRef]
- Cooke, M.S., Evans, M.D., Dizdaroglu, M., Lunec, J., 2003. Oxidative DNA damage: mechanisms, mutation, and disease. FASEB. 17, 1195-1214. [CrossRef]
- Hernández-Ruiz, Á., García-Villanova, B., Guerra-Hernández, E., Amiano, P., Ruiz-Canela, M., Molina-Montes, E., 2019. A review of a priori defined oxidative balance score relative to their components and impact on health outcomes. Nutrients. 11:1-36. [CrossRef]
- Kupsco, A., Schlenk, D., 2015. Oxidative stress, unfolded protein response, and apoptosis in developmental toxicity. I. Rev. Cell Mol. Biol. 317:1-66. [CrossRef]
- Morita, T., Konishi, M., Fukuoka, T., Imura, T., Kitamoto, D., 2006. Discovery of Pseudozyma rugulosa NBRC 10877 as a novel producer of the glycolipid biosurfactants, mannosylerythritol lipids, based on rDNA sequence. Appl. Microbiol. Biotechnol. 73,305–313. [CrossRef]
Figure 2.
Analysis of DCF, Sulfhydryl Content, and SOD levels, 24 h (a, b, and c) and 72 h (d, e, and f) after IP administration of MEL-B at concentrations of 50 mg/kg and 150 mg/kg in mice lung. *p<0.05, **p<0.05 when compared to the control group, according to One-way ANOVA followed by Tukey’s Multiple Comparison Test.
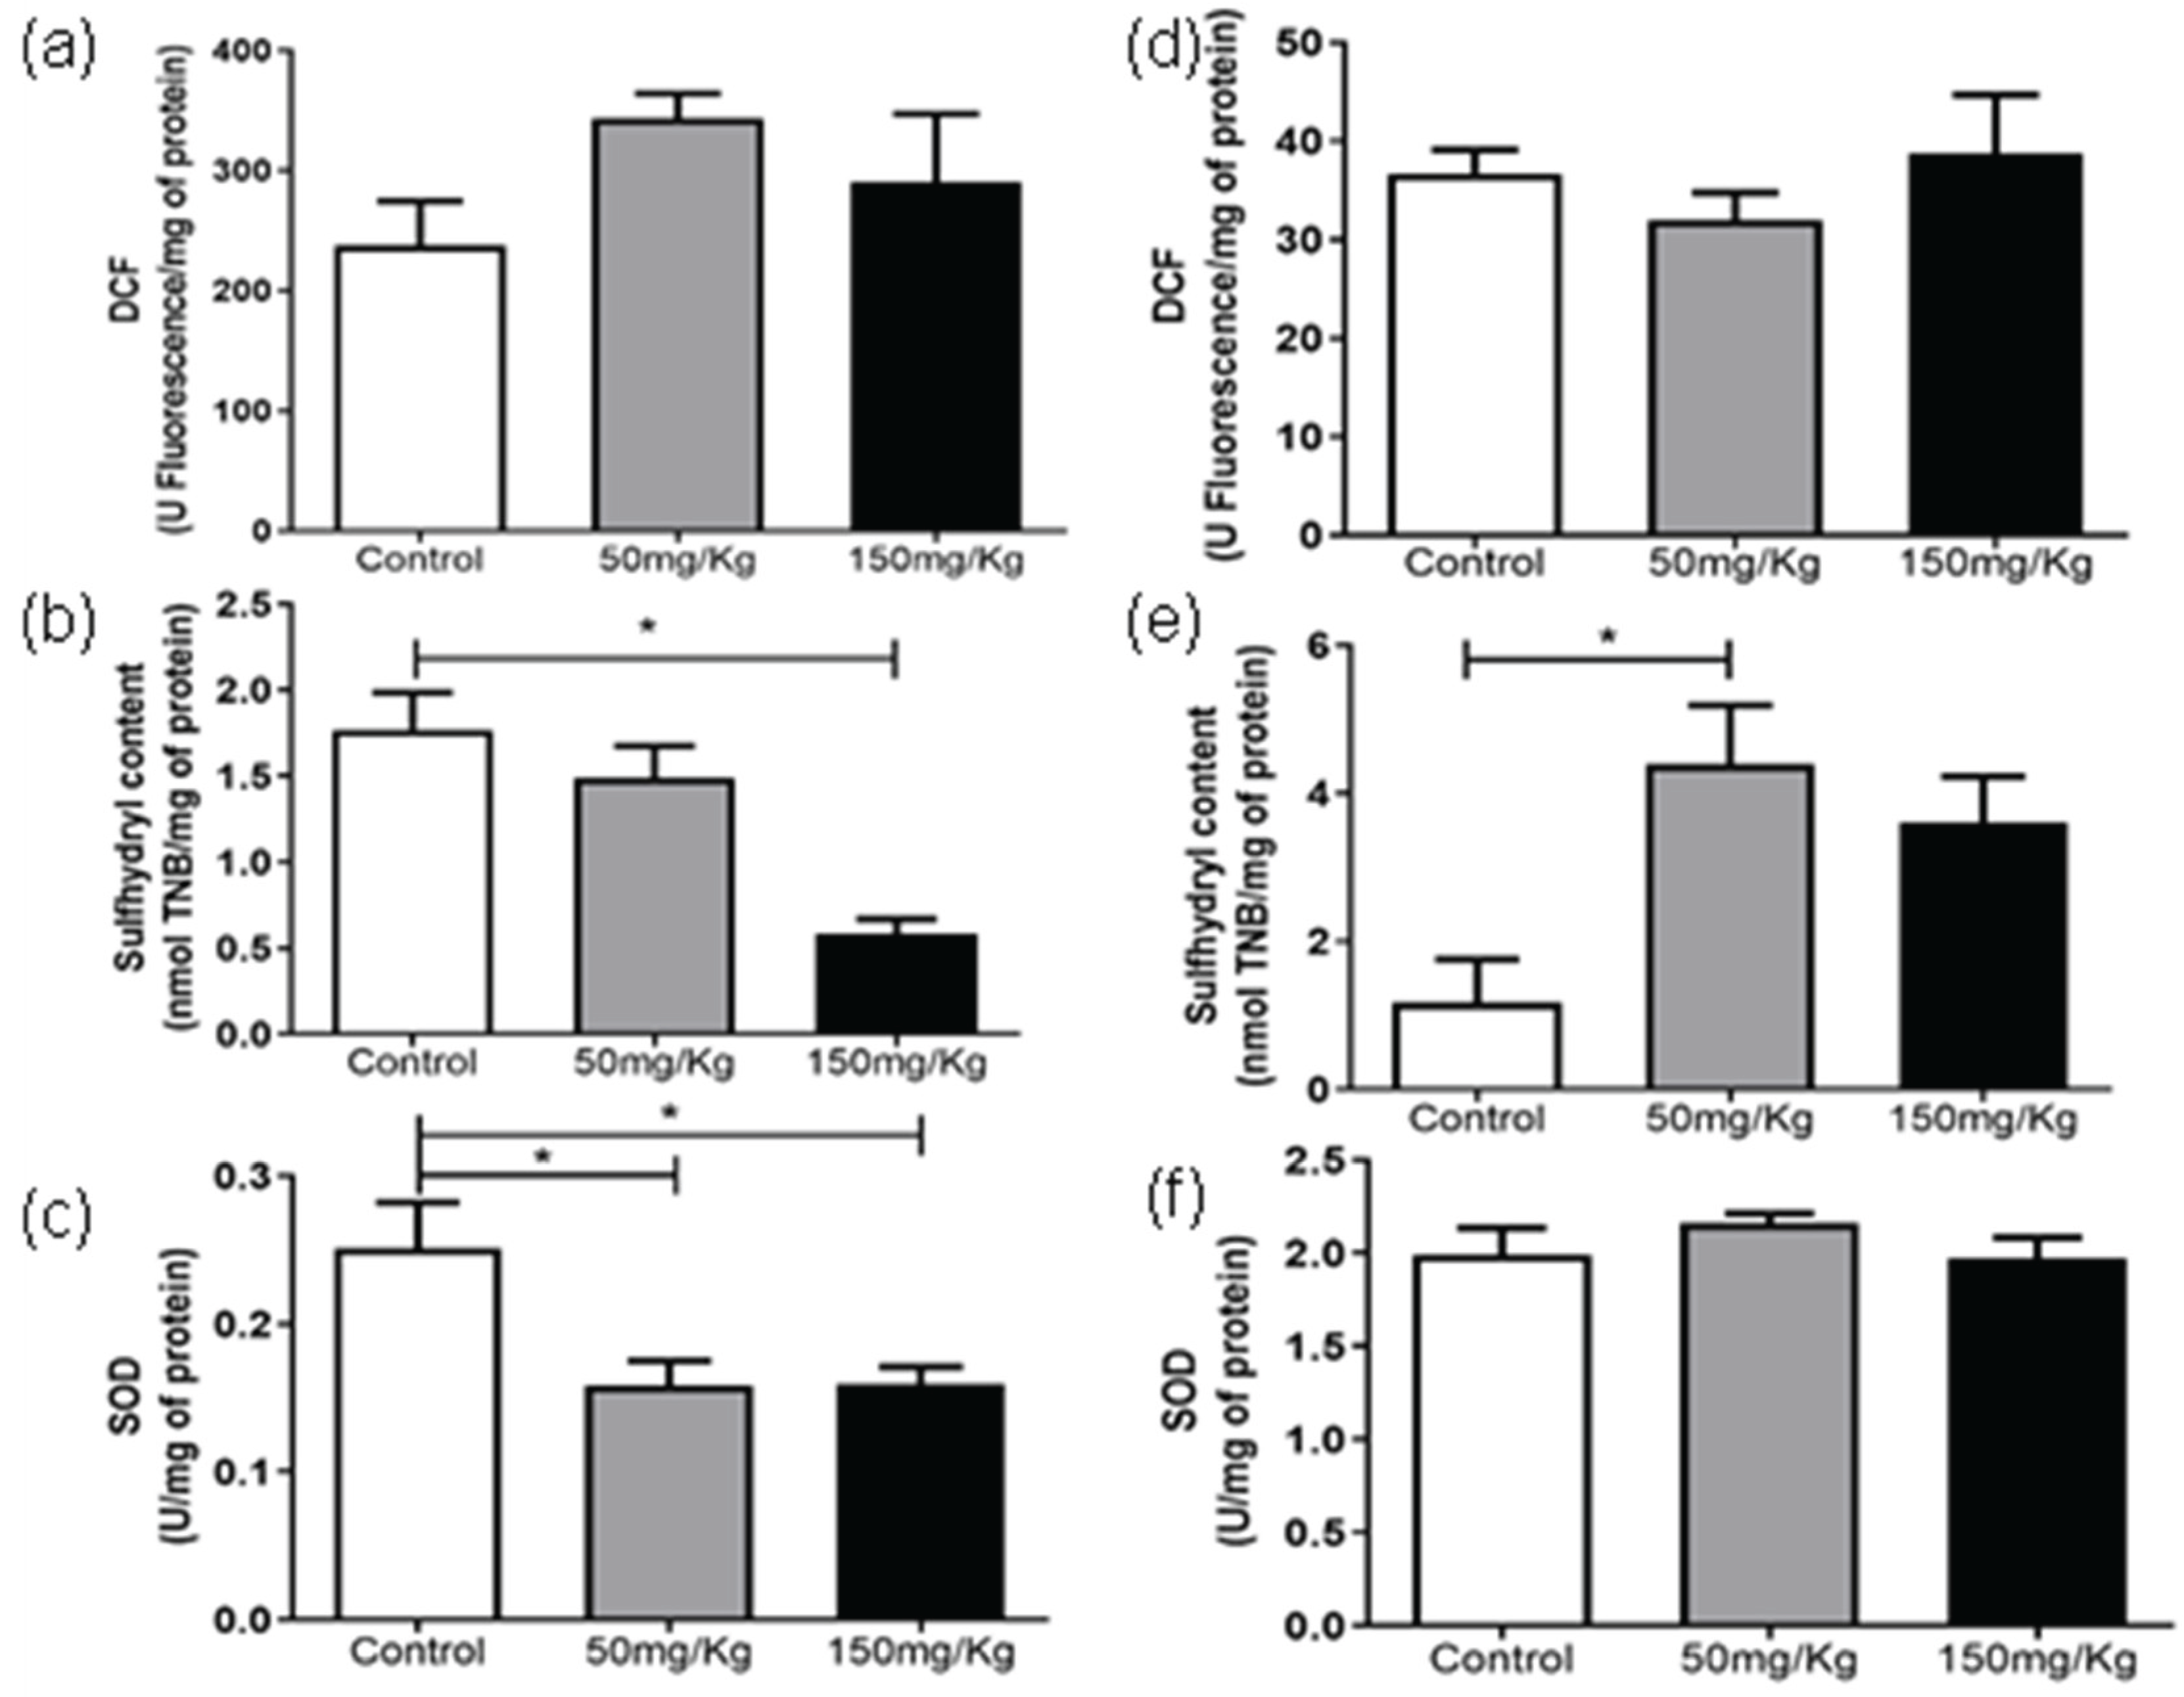
Figure 3.
Analysis of DCF, Sulfhydryl Content, and SOD levels, 24 h (a, b, and c) and 72 h (d, e, and f) after IP administration of MEL-B at concentrations of 50mg/kg and 150 mg/kg in mice liver. *p<0.05, **p<0.05 when compared to the control group, ##p<0.05 compared to the 150mg/kg group. according to One-way ANOVA followed by Tukey’s Multiple Comparison Test.
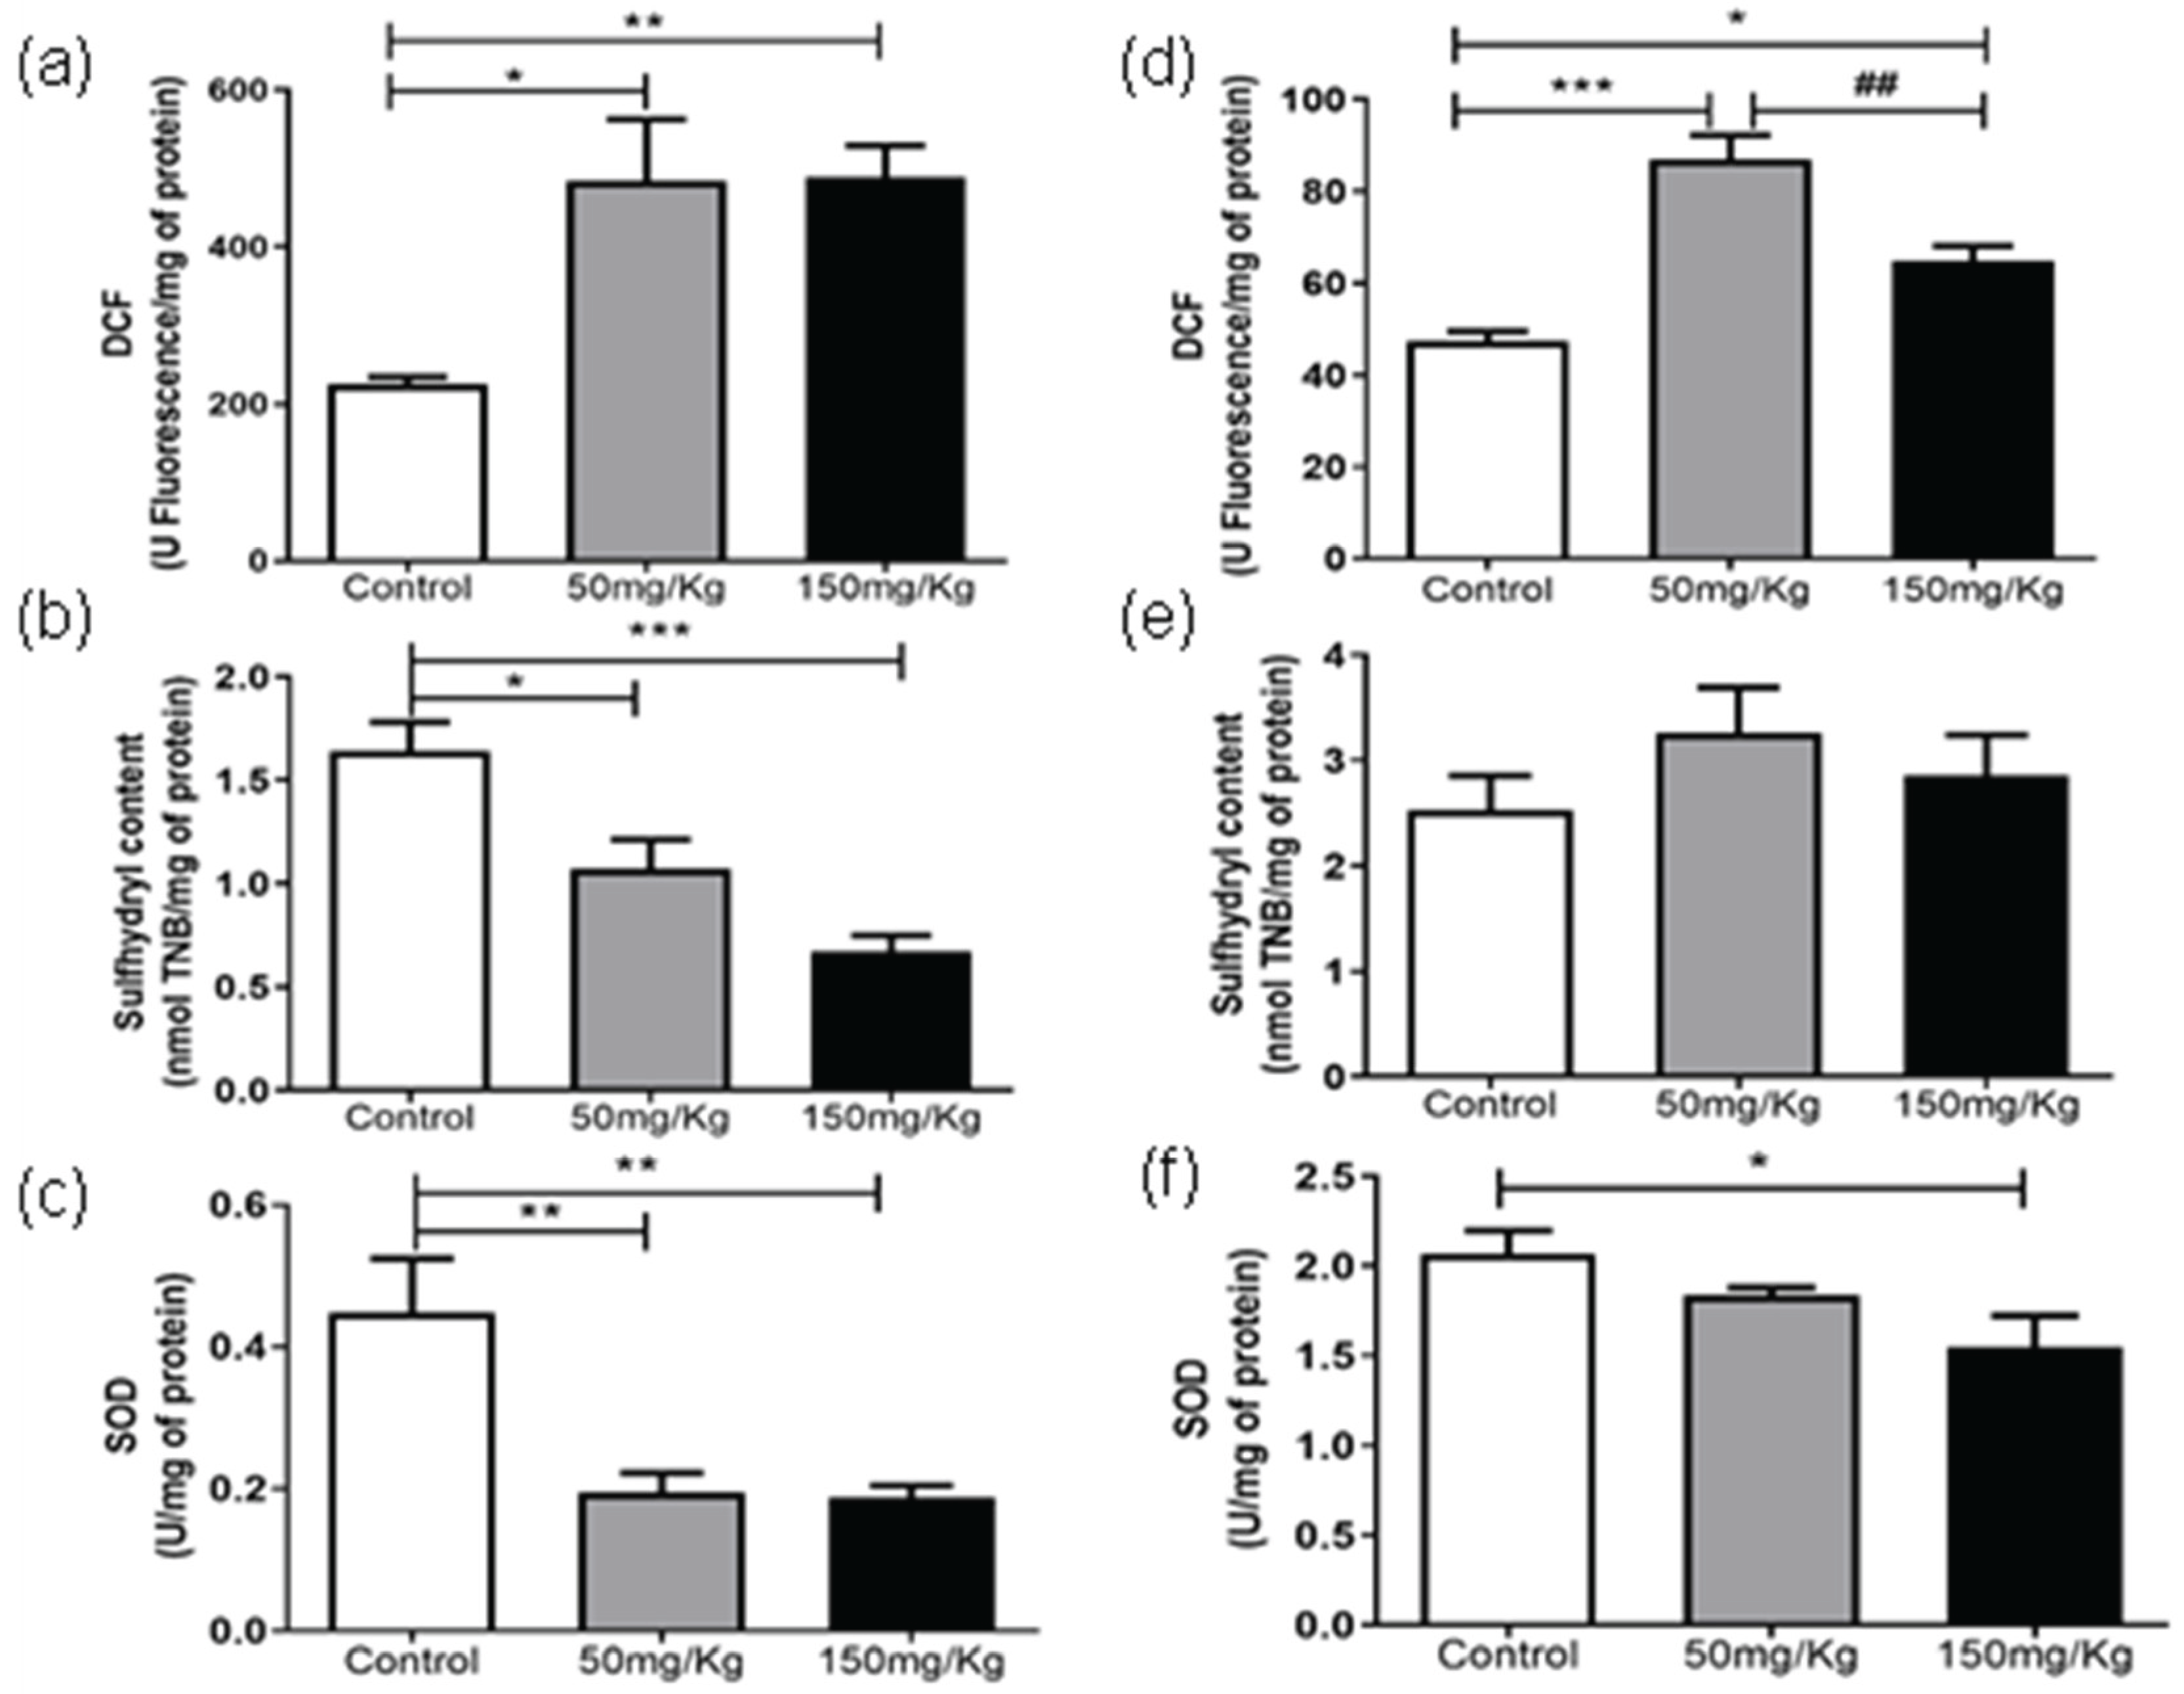
Figure 4.
Analysis of DCF, Sulfhydryl Content and SOD levels, 24 h (a, b, and c) and 72 h (d, e, and f) after IP administration of MEL-B at concentrations of 50 mg/kg and 150 mg/kg in mice kidney. *p<0.05, **p<0.05 when compared to the control group, #p<0.05 compared to the 150 mg/kg group. according to One-way ANOVA followed by Tukey’s Multiple Comparison Test.
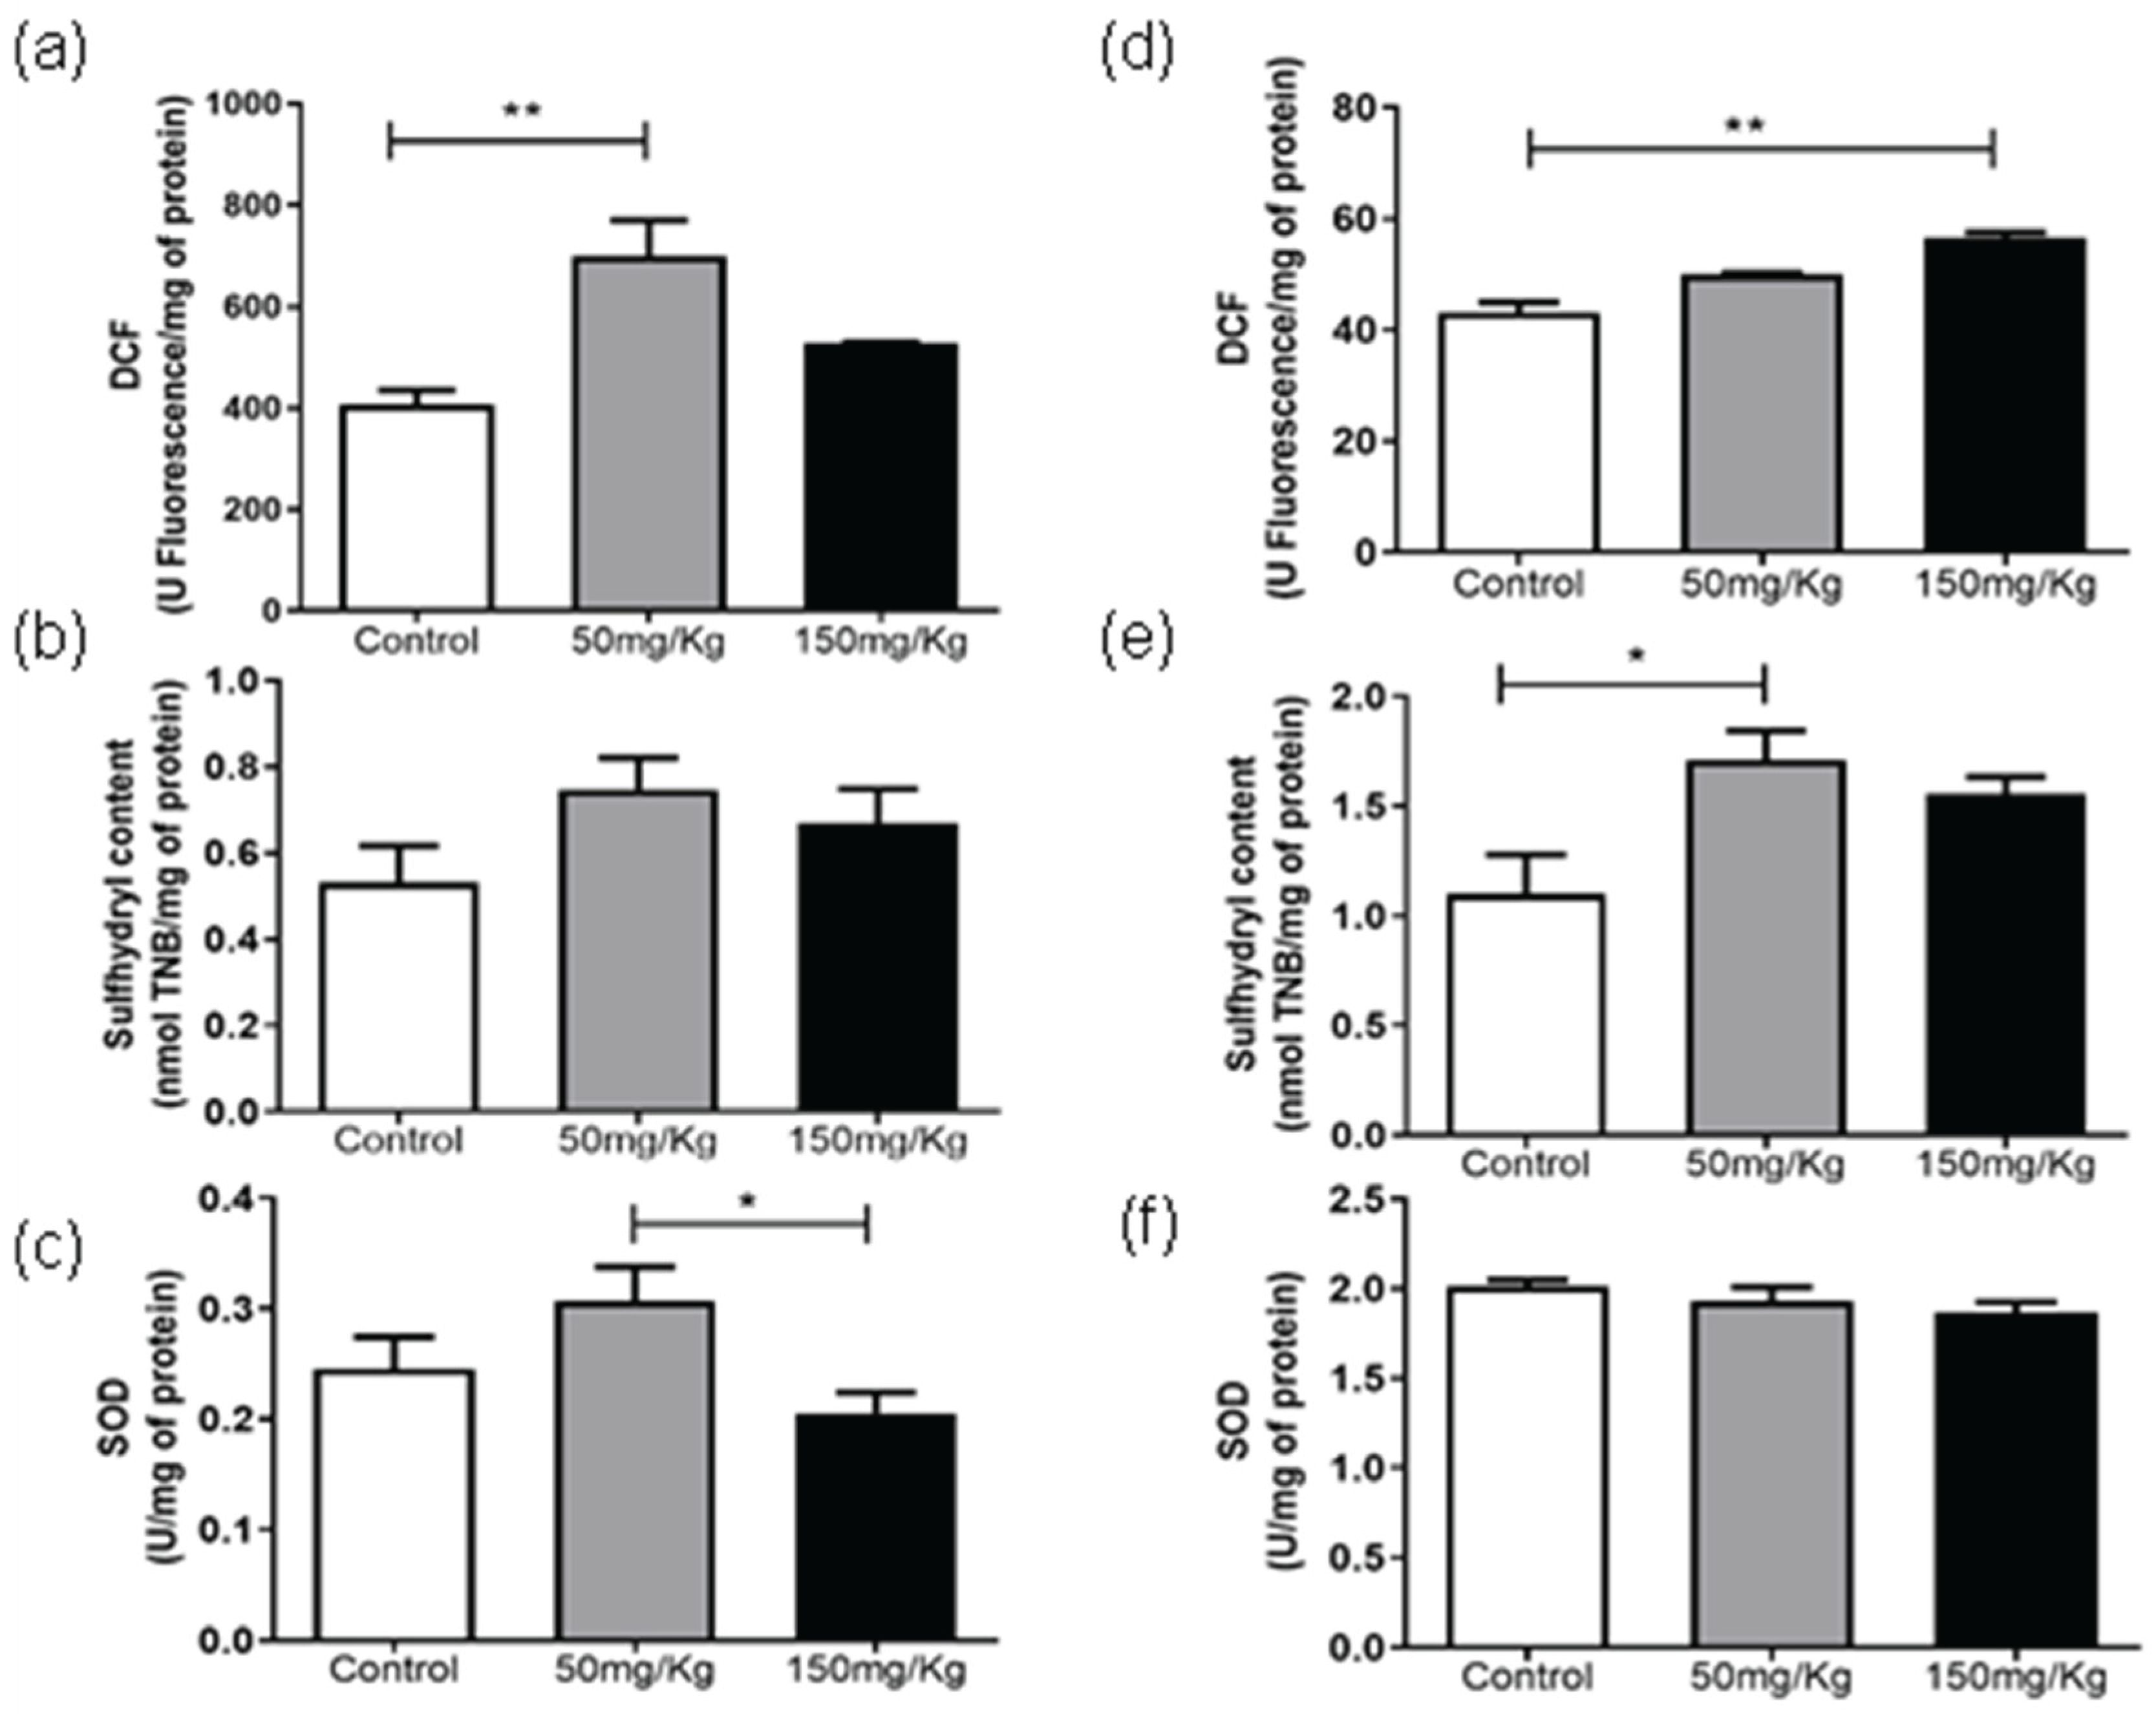
Figure 5.
Analysis of DCF, Sulfhydryl Content, and SOD levels, 24 h (a, b, and c) and 72 h (d, e, and f) after IP administration of MEL-B at concentrations of 50 mg/kg and 150 mg/kg in cardiac tissue. *p<0.05, **p<0.05 when compared to the control group, ##p<0.05 compared to the 150 mg/kg group. according to One-way ANOVA followed by Tukey’s Multiple Comparison Test.
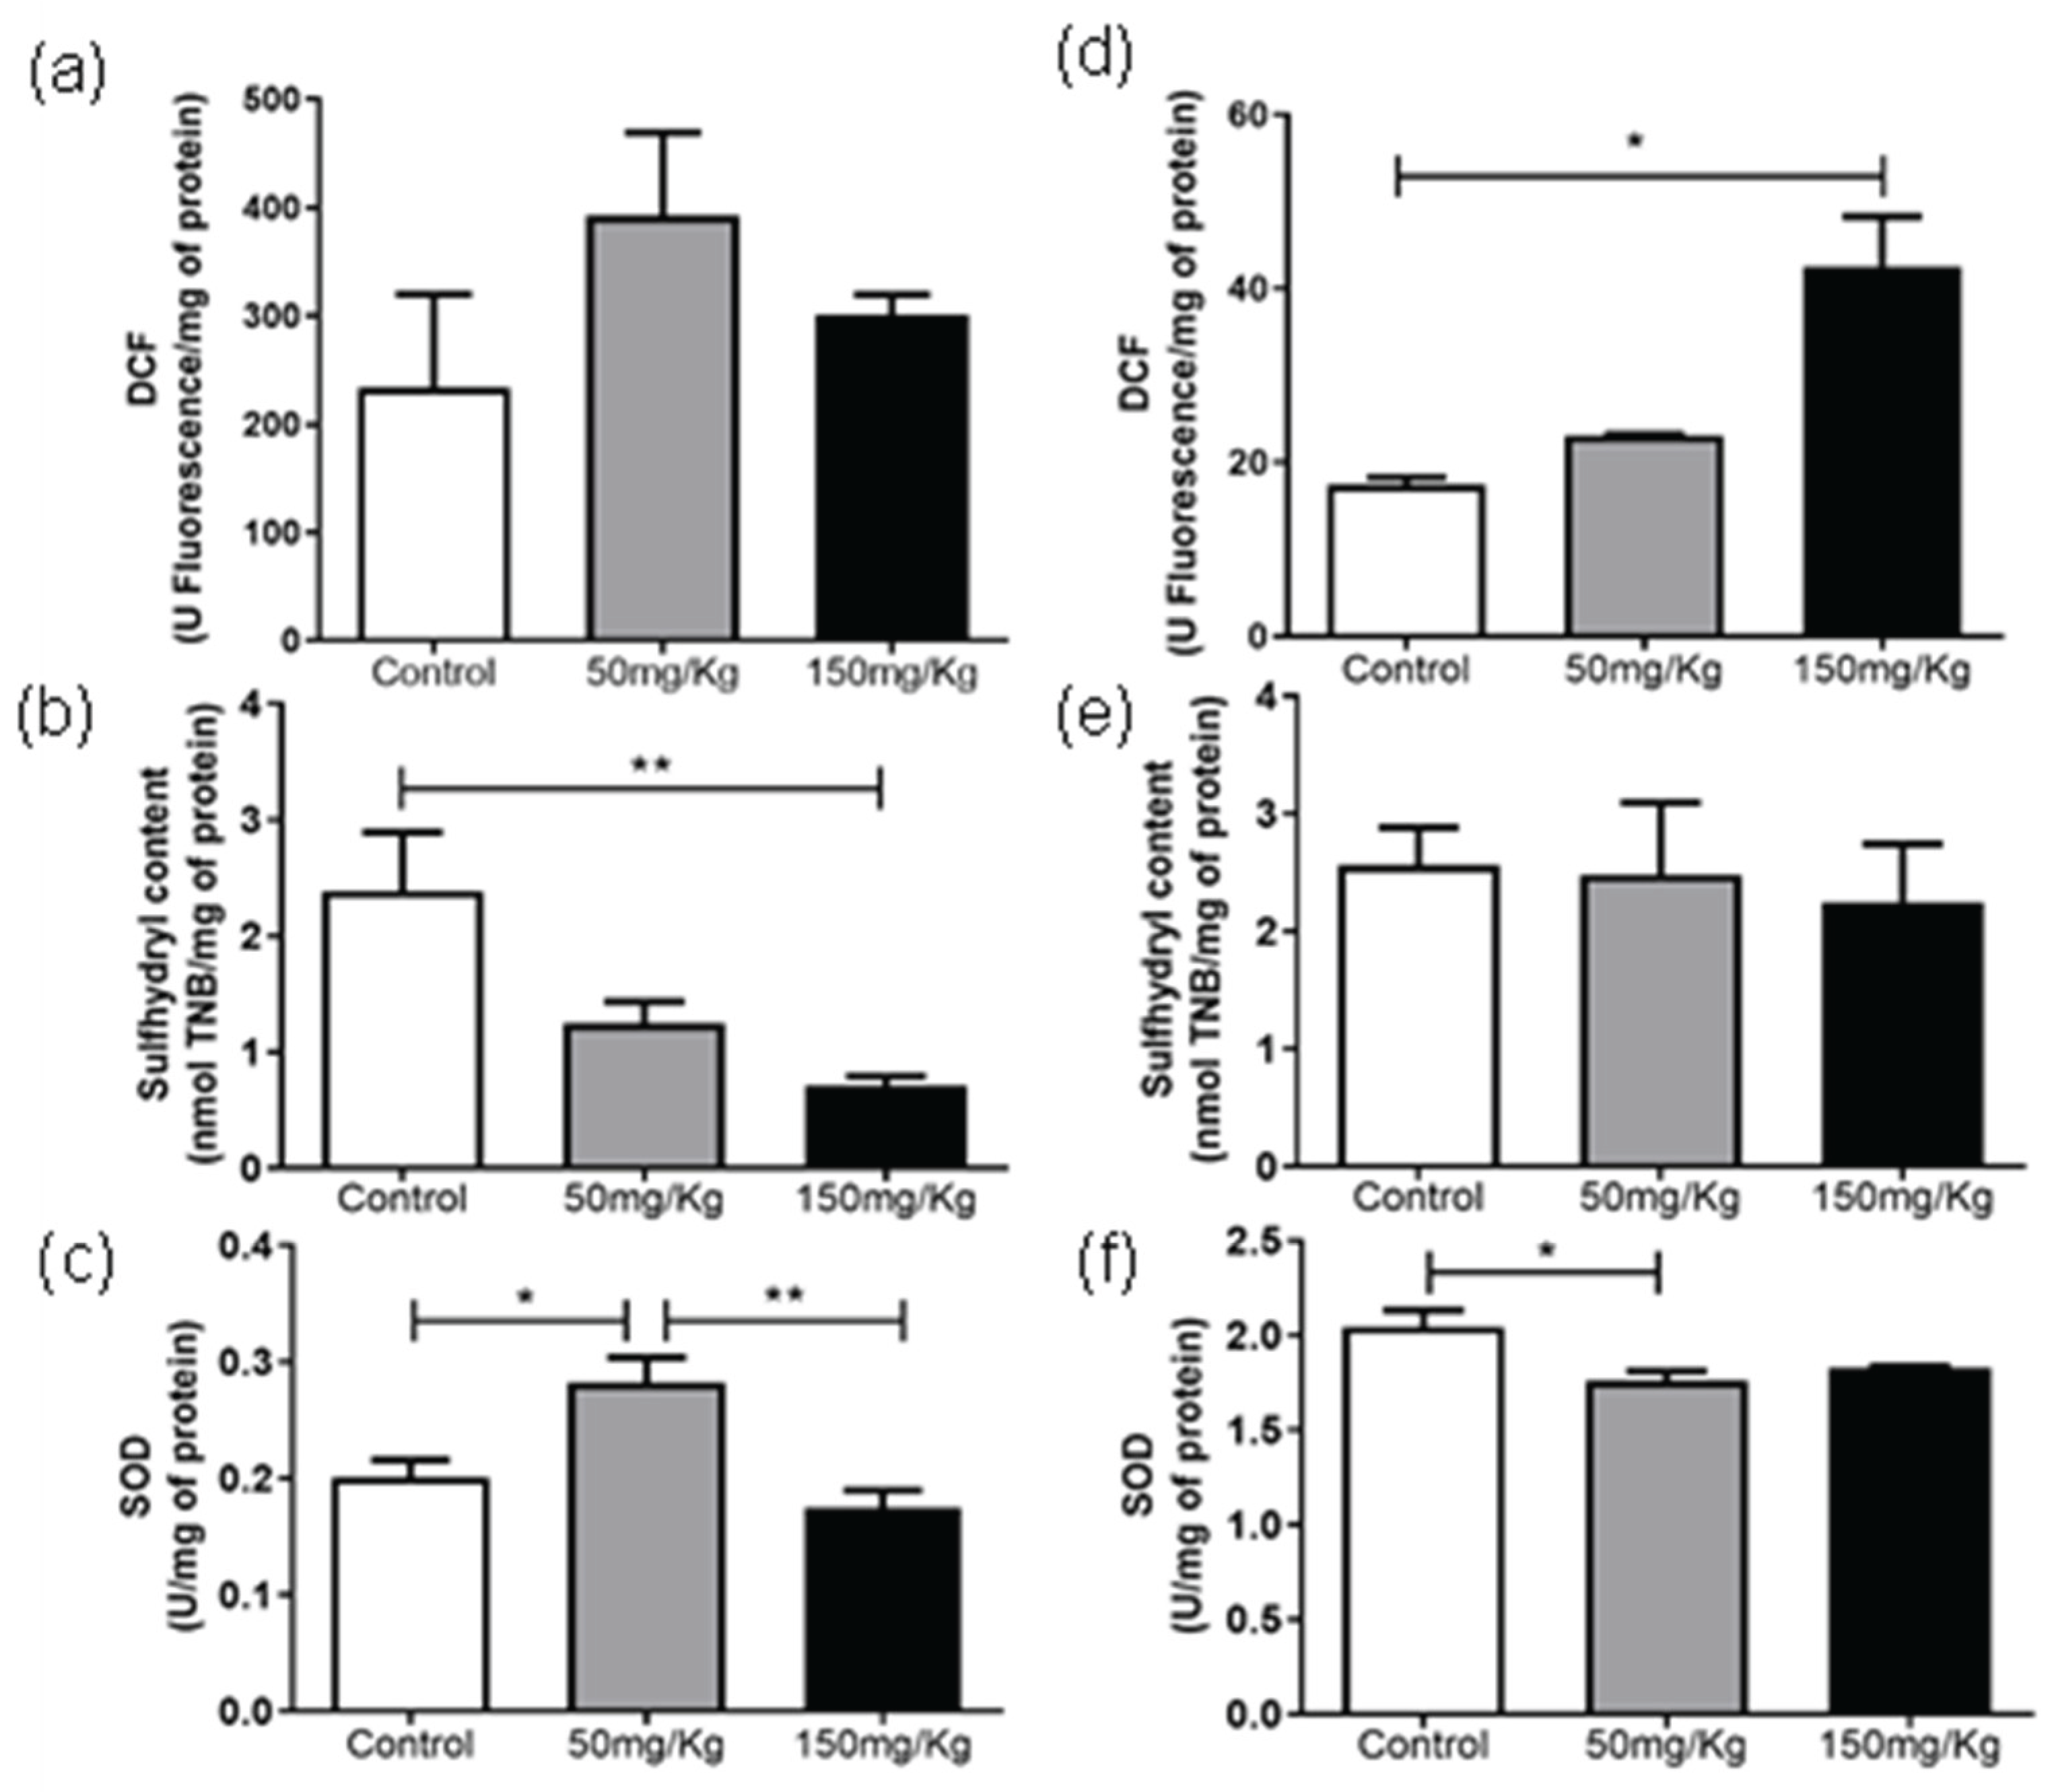
Figure 6.
Analysis of DCF, Sulfhydryl Content, and SOD levels, 24 h (a, b and c) and 72 h (d, e and f) after IP administration of MEL-B at concentration of 50 mg/kg and 150 mg/kg in mice gastrocnemius. *p<0.05, **p<0.05 when compared to the control group, ##p<0.05, ###p<0.05 compared to the 150 mg/kg group. according to One-way ANOVA followed by Tukey’s Multiple Comparison Test.
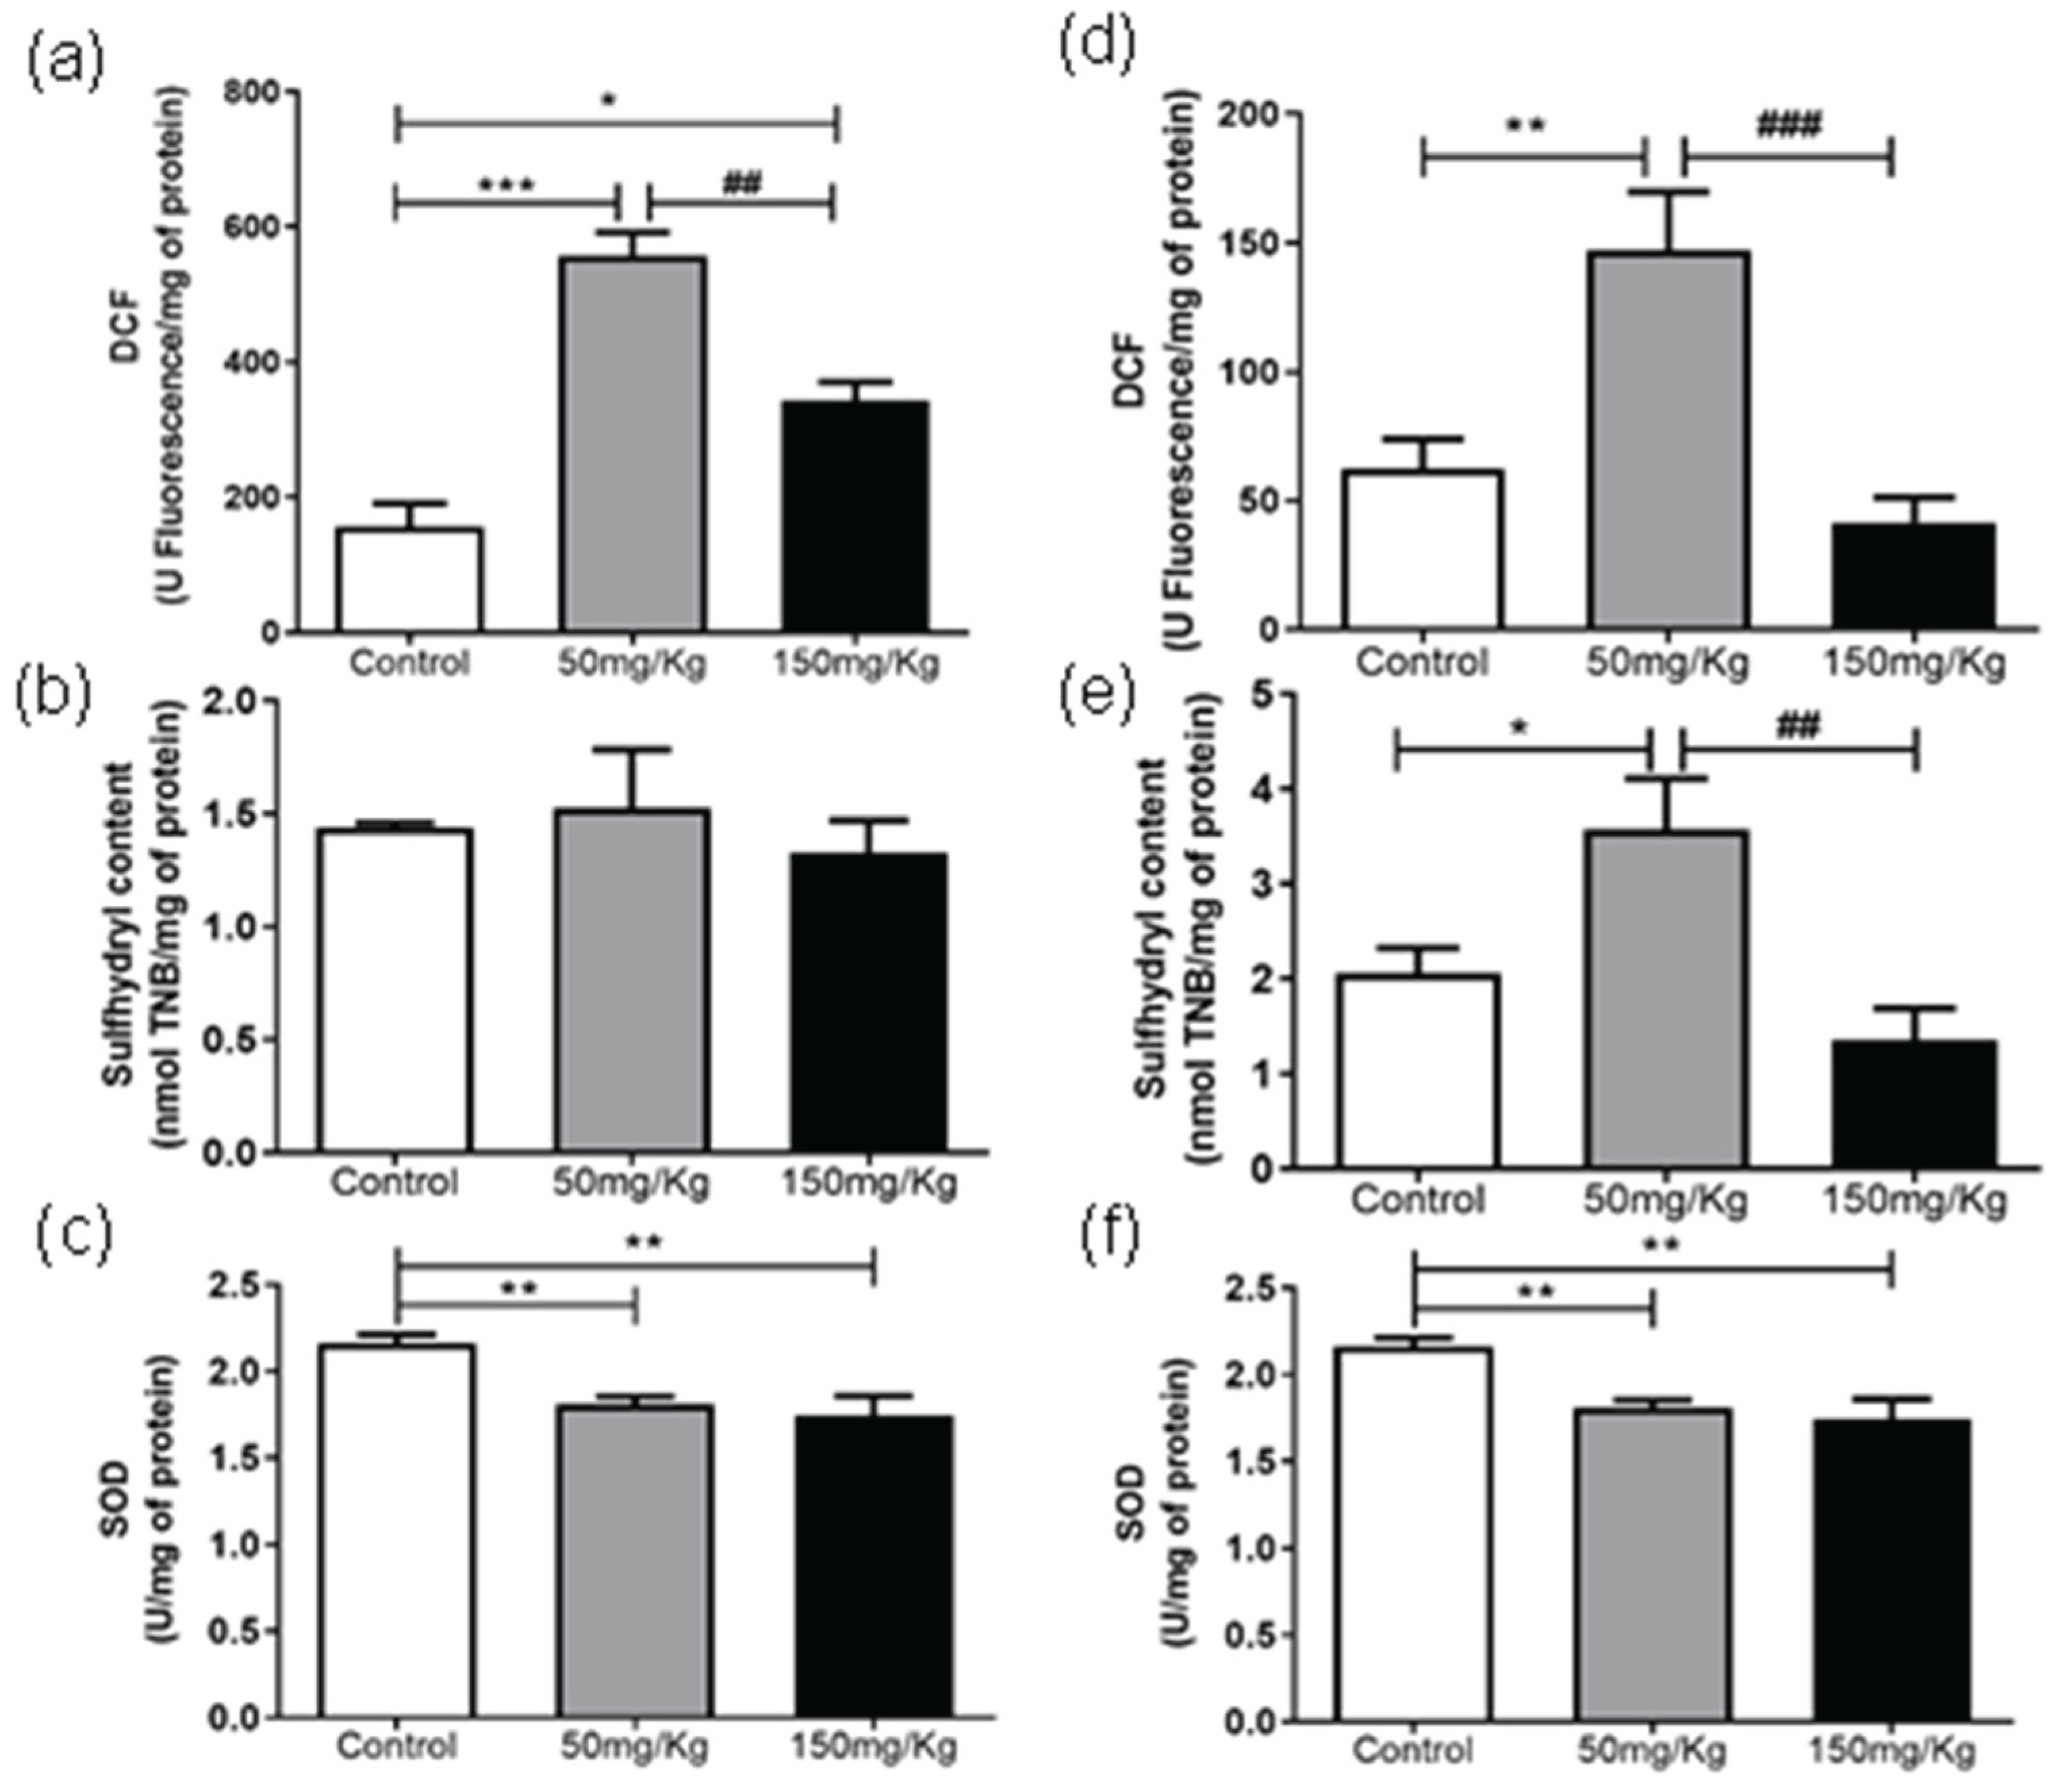
Figure 7.
Analysis of triglyceride levels, CK-MB and LDH enzymes, Sulfhydryl 24 and 72 h after IP administration of MEL-B at concentrations of 50 and 150 mg/kg in mice serum. No significative differences were observed according to One-way ANOVA followed by Tukey’s Multiple Comparison Test.
Figure 7.
Analysis of triglyceride levels, CK-MB and LDH enzymes, Sulfhydryl 24 and 72 h after IP administration of MEL-B at concentrations of 50 and 150 mg/kg in mice serum. No significative differences were observed according to One-way ANOVA followed by Tukey’s Multiple Comparison Test.
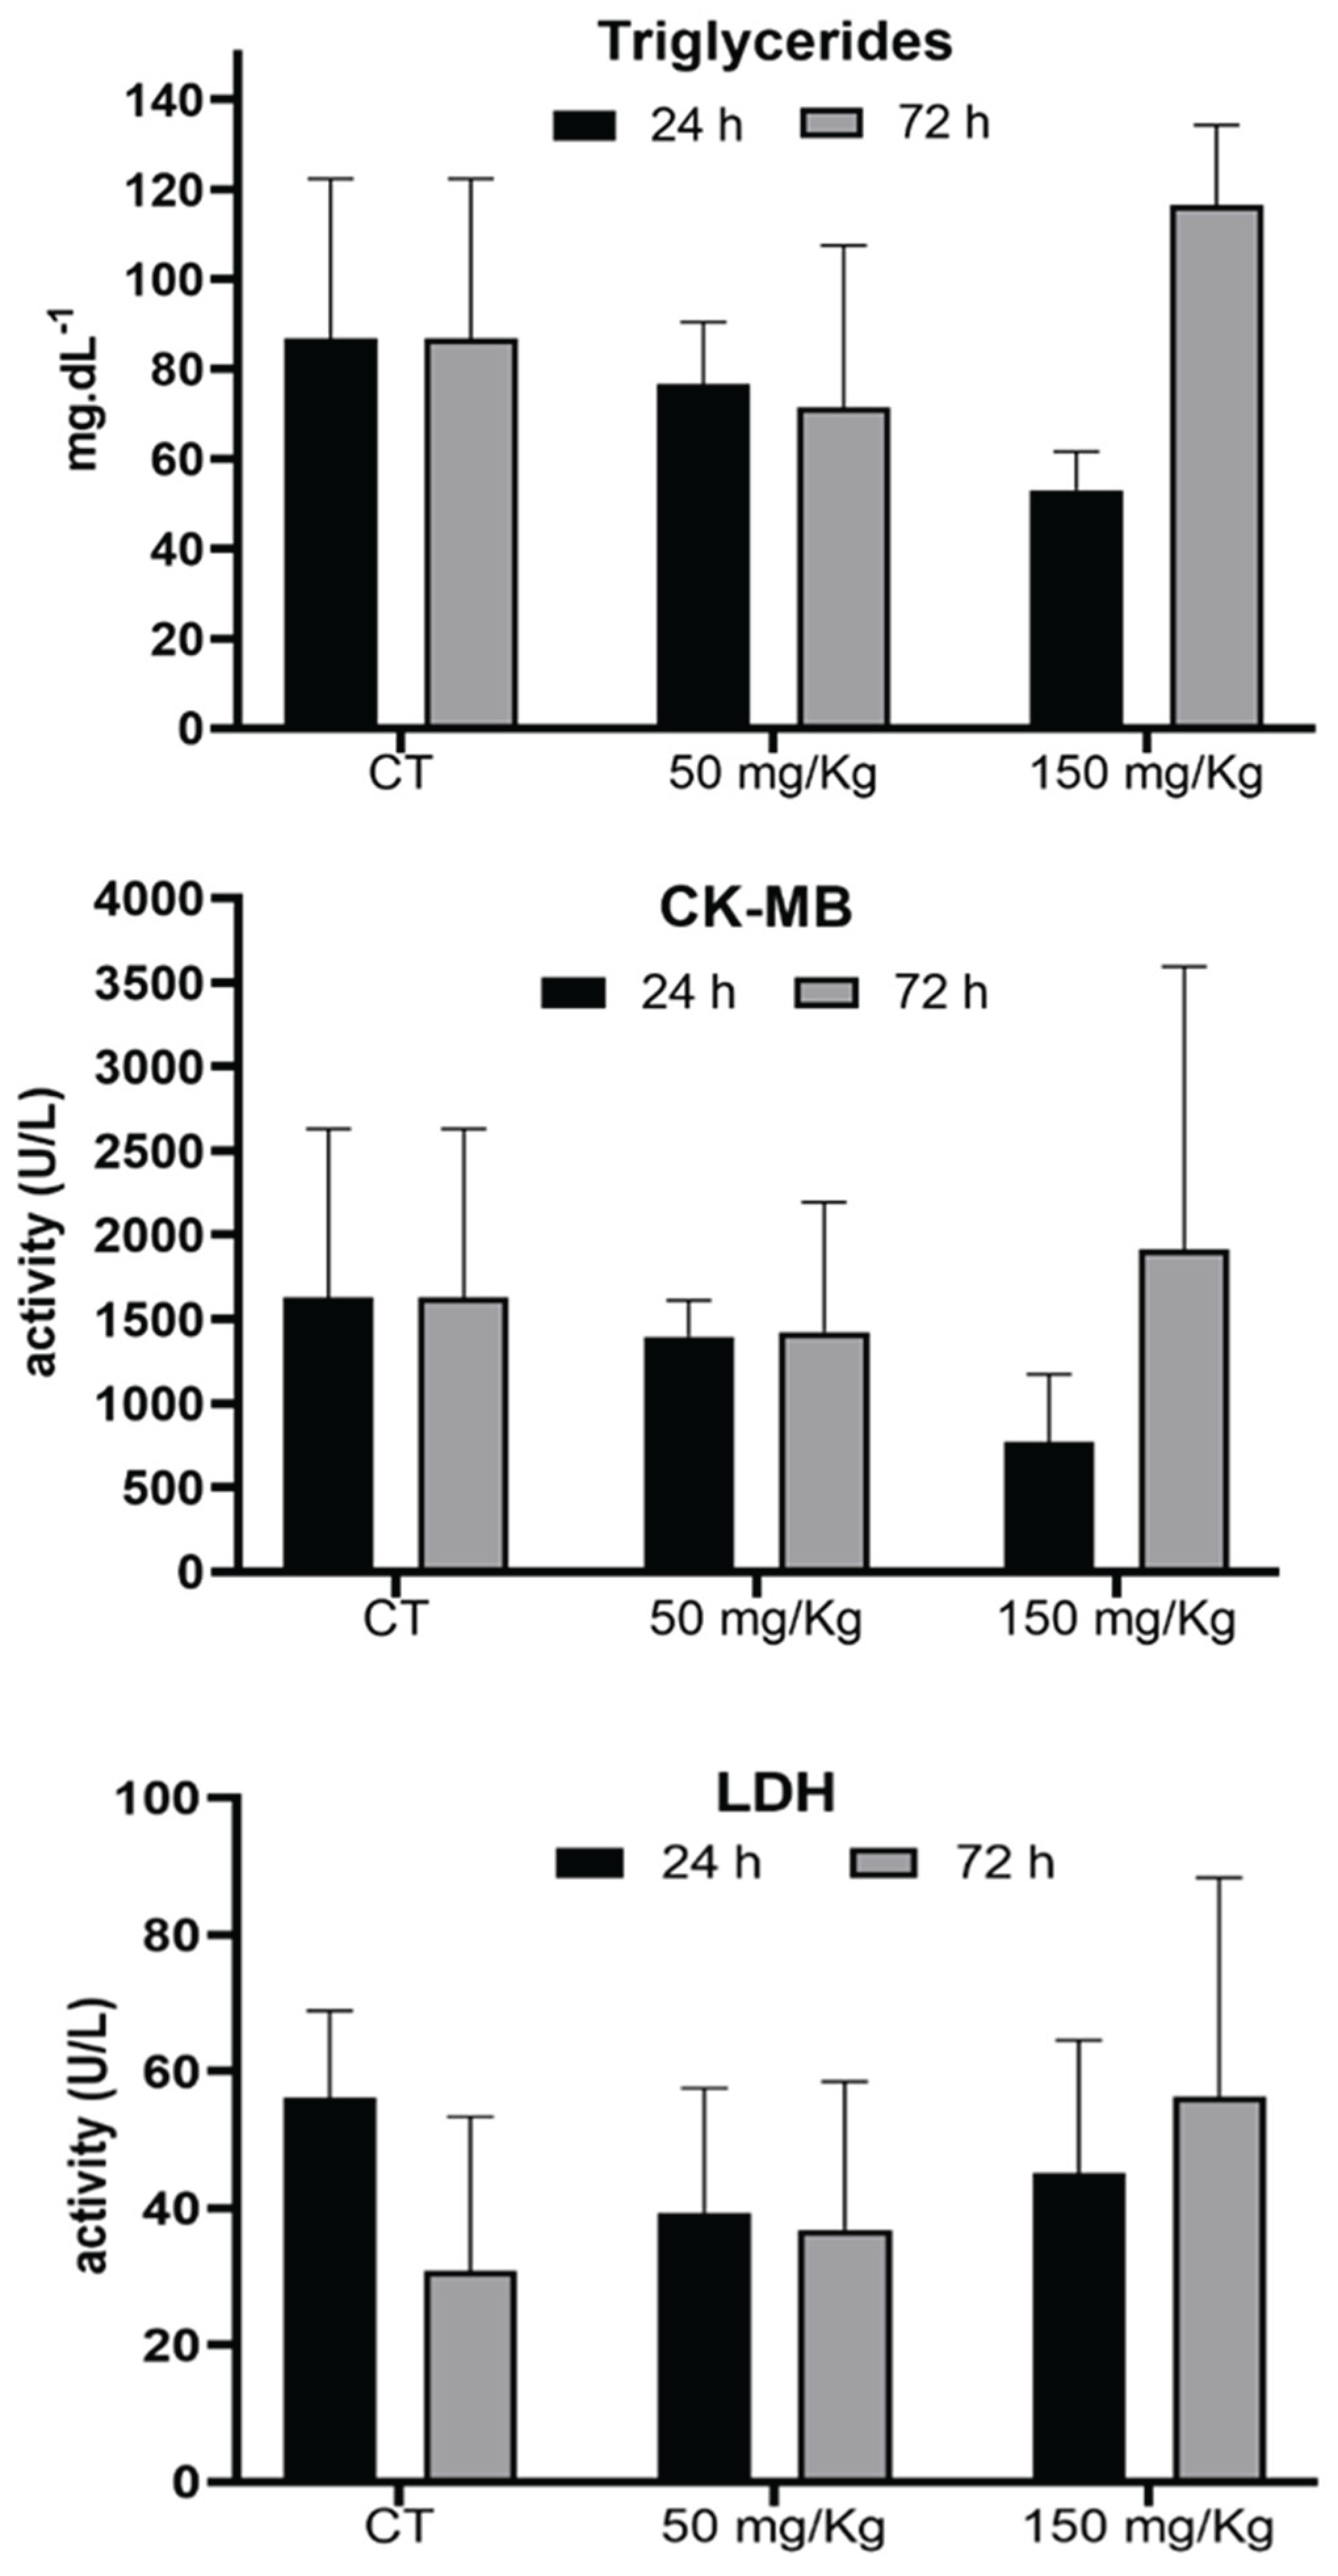

Table 1.
Different biochemical parameters (DCF, Sulfhydryl and SOD) were evaluated after the IP administration of MEL-B at dose of 50 mg/kg and 150 mg/kg.
Table 1.
Different biochemical parameters (DCF, Sulfhydryl and SOD) were evaluated after the IP administration of MEL-B at dose of 50 mg/kg and 150 mg/kg.
| 50 mg/kg – 24 h | 50 mg/kg – 72 h | ||||||
|---|---|---|---|---|---|---|---|
| Organs | DCF | Sulfhydryl | SOD | DCF | Sulfhydryl | SOD | |
| Spleen | = | = | - | Spleen | = | + | -- |
| Lung | = | = | - | Lung | = | + | = |
| Liver | + | + | -- | Liver | +++ | = | = |
| Kidney | ++ | = | = | Kidney | = | + | = |
| Heart | = | = | + | Heart | = | = | - |
| Gastrocnemius | +++ | = | -- | Gastrocnemius | ++ | + | -- |
| 150 mg/kg – 24 h | 150 mg/kg – 72 h | ||||||
| Organs | DCF | Sulfhydryl | SOD | DCF | Sulfhydryl | SOD | |
| Spleen | - | = | - | Spleen | ++ | ++ | -- |
| Lung | = | - | - | Lung | = | = | = |
| Liver | ++ | +++ | -- | Liver | + | = | - |
| Kidney | = | = | = | Kidney | ++ | = | = |
| Heart | = | -- | = | Heart | + | = | = |
| Gastrocnemius | + | = | -- | Gastrocnemius | = | = | -- |
+: increase of p<0,05; ++: increase of p<0,005; +++: increase of p<0,0005; -: decrease of p<0,05; --: decrease of p<0,005; =: No statistical difference. All compared to the control group, according to One-way ANOVA followed by Tukey’s Multiple Comparison Test.
Disclaimer/Publisher’s Note: The statements, opinions and data contained in all publications are solely those of the individual author(s) and contributor(s) and not of MDPI and/or the editor(s). MDPI and/or the editor(s) disclaim responsibility for any injury to people or property resulting from any ideas, methods, instructions or products referred to in the content. |
© 2025 by the authors. Licensee MDPI, Basel, Switzerland. This article is an open access article distributed under the terms and conditions of the Creative Commons Attribution (CC BY) license (http://creativecommons.org/licenses/by/4.0/).
Copyright: This open access article is published under a Creative Commons CC BY 4.0 license, which permit the free download, distribution, and reuse, provided that the author and preprint are cited in any reuse.


