
Submitted:
29 May 2025
Posted:
04 June 2025
You are already at the latest version
Abstract
The Mauritanian-Senegalese Coastal Upwelling exhibits strong interannual variability, which has been found to be driven by El Niño and the Southern Oscillation (ENSO). In addition, ENSO has been found to be driven by the Indian Ocean and Atlantic Sea Surface Temperature (SST) variability. Nevertheless, how all these basins impact on the upwelling predictability has not been analyzed so far. Using a satellite product of surface chlorophyll-a as a proxy of marine productivity, this work makes an assessment of the predictability of the Mauritanian-Senegalese Coastal Upwelling marine ecosystem.
Different statistical approaches are used to evaluate the relative contribution of the tropical basins, including the Pacific, Indian, equatorial and Tropical North Atlantic SSTs. Results indicate that although most of the upwelling variability stands for ENSO, the Indian and Atlantic contributions play a fundamental role in shaping the seasonal prediction skill. These results may have strong implications for fisheries and marine ecosystem management in the region.
Keywords:
Mauritanian-Senegalese coastal upwelling
; chlorophyll-a
; tropical basin interactions
; seasonal prediction
; fisheries
1. Introduction
The coast of West Africa hosts one of the most important marine ecosystems worldwide: the Mauritanian-Senegalese Coastal Upwelling (MSCU) system. The MSCU is characterized by a marked seasonal cycle in which, from February to May (FMAM), N-S alongshore winds blow parallel to the coast (Figure 1). The friction transferred by the wind stress to the underneath water layers together with the effect of the Coriolis force produce an integrated westward current named Ekman current. Following the continuity equation under the Boussinesq approximation, the divergence of surface waters produce the upwelling of nutrient rich and cold waters from the seabed, supporting primary production, which is closely associated with chlorophyll-a (chl-a) concentrations (Figure 1). Chl-a is, thus, an estimate of upwelling strength in the region, as nutrients are the main limiting factor for primary production synthesis [1,2], and there is no critical light-limitation at tropical latitudes [3].
In the MSCU, predicting changes in the alongshore winds can be translated in predicting changes in chl-a. Changes in alongshore winds can be driven by changes in Sea Surface Temperature (SST) anomalies in remote regions, in the form of SST variability modes. These changes in SST can affect, locally, convection, producing changes in the Hadley and Walker circulation cells. As a result, atmospheric tropical and extratropical Rossby waves and equatorial Kelvin waves can be triggered, being the former due to conservation of potential vorticity [4,5,6]. These mechanisms drive the connection between tropical ocean basins, i.e., producing pantropical interactions [7]. Therefore, the ocean-atmosphere interaction processes developed in one basin can be responsible of part of the variability in other basins [8,9]. In particular, El Niño-Southern Oscillation (ENSO) has a strong influence on the Tropical North Atlantic (TNA) during boreal spring. During El Niño, an atmospheric Rossby wave train is excited over the northern hemisphere in a Pacific-North American (PNA) configuration, which produces a weakening of the Azores high pressure system. As a consequence, there is a reduction of the TNA trade winds. The opposite occurs for La Niña. Also, ENSO can affect the TNA through alterations in the Walker and Hadley cells [10,11] or through a secondary Gill-type response over the Amazon basin [12].
ENSO is known to influence the MSCU through its impact on surface alongshore winds [13,14]. In fact, some studies have linked ENSO to chl-a concentration, e.g. the 1998-1999 ENSO event [15] and marine ecosystem variability, e.g, the migratory patterns of round sardinella [16]. Other modes of interannual SST variability have also been linked to chl-a concentration. In the equatorial Atlantic, the Atlantic El Niño [17] modulates chl-a concentrations during boreal summer in the eastern equatorial basin through ocean dynamics [18]. Chl-a concentrations in the Indian Ocean seems to be modulated primaly by the Indian Ocean Dipole (IOD) [19] and ENSO [20].
An remarkable fact is that ENSO can be triggered, in turn, by other modes of ocean variability, such as the Atlantic El Niño [21,22,23], SST anomalies in the TNA [6,24] and the Indian Ocean [19,25]. Additionally, the IOD has been found to be followed by a basin-wide warming known as the Indian Ocean Basin (IOB) mode [26,27]. These two Indian Ocean modes can occur independently and affect ENSO [28,29,30]. Thus, different tropical ocean basins can interact with the Pacific, predicting its variability [31].
Impacts and underlying mechanisms of SST variability modes, beyond ENSO, on anomalous chl-a concentrations in the MSCU have been little analyzed. Given that ENSO influences chl-a variability in the MSCU and that ENSO itself can be predicted from SST signals in other ocean basins, it is reasonable to hypothesize that SST variability in these other basins may also serve as a predictor of chl-a fluctuations, potentially extending the horizon of chl-a predictability. To test this, chl-a satellite data is used to assess the influence of different modes of oceanic variability on chl-a concentration in the MSCU in FMAM. In addition, statistical cross-validated hindcasts are generated using SST information from distinct ocean basins as predictors.
2. Materials and Methods
Along this work, SST and chl-a data will be used to feed statistical prediction models. The SST data (∘C) have been obtained from the Hadley Centre Global Sea Ice and Sea Surface Temperature dataset (HadISST 1.1) [32], which has a 1∘ spatial resolution. It covers the period from 1870 to the present. A chl-a product (https://doi.org/10.48670/moi-00281), obtained from satellite observations from the Copernicus Marine Service [33,34], has been used. This product contains the surface chl-a concentration (mg m−3), with a 4 km resolution for the period September 1997-present. Geopotential height at 200 hPa (m2 s−2), Sea Level Pressure (SLP, Pa) and 10 m wind speed (m s−1) have been used to assess atmospheric teleconnections. These variables come from the ERA5 reanalysis [35], covering the period from January 1940 to the present, with a 0.25∘ horizontal resolution. Due to the availability of chl-a data, the analysis in this work is restricted to the period 1998–2024.
Data have been preprocessed by calculating seasonal anomalies. This involved selecting a 4-month season and subtracting the seasonal mean over the entire study period from each year’s data. To remove the anthropogenic climate change signal, a linear trend was also subtracted from seasonal anomalies.
To evaluate spatial patterns of co-variability between SST and chl-a, as well as associated atmospheric teleconnections, many results are presented as regression maps. Their statistical significance is assessed using a non-parametric Monte Carlo test, based on 1000 random permutations. Only those values exceeding the 95% confidence interval are considered statistically significant, and are highlighted accordingly in the figures.
2.1. Identification of Predictors
To identify the tropical basin variability modes preceding chl-a in the MSCU, an Extended Maximum Covariance Analysis (EMCA) is applied. The EMCA is an extension of the classical Maximum Covariance Analysis (MCA) [36], which allows for the inclusion of multiple fields either in the predictor or the predictand fields. As designed here, the EMCA involves taking into account several seasons of the tropical SSTs in the predictor field, starting with AMJJ (-1yr), where -1yr refers to the year prior to the MSCU upwelling season (FMAM (0yr)). AMJJ was chosen as the starting season because it precedes by two months the peak of the Atlantic Niño variability (JJAS), which has been identified as a potential precursor of ENSO [21,22,23]. From that point, five additional seasons are considered (JJAS (-1yr), ASON (-1yr), ONDJ (-1yr), DJFM (-1yr), and FMAM (0yr)) thus covering from -10 months to 0 lead time before the target chl-a season. The predictand field is defined as the anomalous chl-a concentration in the MSCU (20∘-15∘W, 12∘-20∘N, Figure 1 domain) during the upwelling season (FMAM (0yr)).
As a result of the EMCA, two time series are obtained: the expansion coefficient Us, which reflects the temporal evolution of the predictor SST field, and the expansion coefficient Vs, which captures the time evolution of the predictand chl-a field (Figure 2a). By regressing the Us series onto the original SST field, a time-evolving SST mode is identified (Figure 2b–g), while the associated chl-a pattern is derived by regressing the same Us series onto the original chl-a field (Figure 2h). These regression patterns describe the spatial structure of the co-variability mode identified between the tropical SST anomalies and chl-a concentration in the MSCU during the upwelling season. The description that follows refers to the positive phase of the mode (positive values of the Us expansion coefficients) while the opposite patterns apply during its negative phase. For an increase in chl-a, a summer Atlantic Niño in AMJJ (-1yr) appears together with a incipient cooling in the tropical and northern subtropical Pacific (Figure 2b). This Pacific cooling intensifies in subsequent seasons, leading to a fully developed La Niña pattern by ASON (-1yr), which coincides with a negative IOD (Figure 2d). The IOD subsequently evolves into a basin-wide Indian Ocean cooling, known as the IOB mode in ONDJ (-1yr) (Figure 2e). From DJFM (-1yr) onward, a cooling signal also emerges in the TNA (Figure 2f), persisting through FMAM (0yr), in phase with the ongoing Pacific La Niña (Figure 2g). This specific SST configuration — characterized by La Niña conditions in the Pacific and concurrent cooling in the TNA during boreal late winter — has previously been linked to enhanced upwelling in the MSCU region [14].
This leading co-variability mode explains 22.56% of the total covariance between tropical SSTs and chl-a in the MSCU region, with a correlation coefficient between the expansion coefficients of 0.68, indicating a strong and significant (99% confidence interval) coupling between the two fields. The reliability of this mode is supported by its strong temporal coherence with independent indices: the SST expansion coefficient (Us) closely follows the Niño 3.4 SST anomaly index during DJFM (-1yr), suggesting that the mode is predominantly influenced by ENSO-related variability. Simultaneously, the chl-a expansion coefficient (Vs) resembles the anomalous chl-a index over the MSCU during the upwelling season (FMAM (0yr)), highlighting the link between this tropical SST - chl-a mode and surface productivity in the region.
Although the temporal evolution of this tropical SST pattern is largely dominated by ENSO, it provides a useful framework for identifying, season by season, other drivers of chl-a variability in the MSCU. This, in turn, enables the development of statistical models to predict chl-a anomalies several months in advance. Based on this mode, five potential predictors have been identified, each corresponding to a specific oceanic domain: the Pacific Ocean (red box in Figure 2(b) to (g)), the equatorial Atlantic (blue box), the TNA (orange box), the Indian Ocean (purple box), and the entire tropical latitudinal belt (green box). The potential of each region to predict chl-a anomalies in FMAM (0yr), in connection with the tropical mode identified in Figure 2, will be explored through skill assessment.
2.2. Statistical Prediction Models
To generated cross-validated hindcasts in each of the seasons and using different SST drivers, two statistical prediction tools implemented in python are used: Spy4CAST and NN4CAST.
The Spy4CAST tool applies MCA, similarly to Figure 2, but using a single predictor field. The tool identifies the leading modes of co-variability between a predictor and a predictand field (here, SST and chl-a anomalies). In addition, Spy4CAST produces cross-validated hindcasts using a leave-one-year-out methodology: the MCA is repeated omitting one year at a time, and for each omitted year, a reconstructed predictand (chl-a) field is generated using the predictor (SST) information from the remaining years. Prediction skill is evaluated through Anomaly Correlation Coefficient (ACC) maps, which are computed by correlating the original and reconstructed predictand (chl-a) fields. The statistical significance of the ACC values is assessed using a Student’s t-test. Values exceeding the 95% confidence interval are highlighted in the figures. For more information about the model, please refer to [37].
The predictor regions identified in the previous section include the Pacific Ocean, the equatorial Atlantic, the TNA, and the Indian Ocean. For each of the basins, four predictor seasons are considered: AMJJ (-1yr), JJAS (-1yr), ASON (-1yr), and ONDJ (-1yr), which correspond to lead times of -10, -8, -6, and -4 months with respect to the chl-a season (FMAM (0yr)). The last season considered is ONDJ (-1yr), to avoid overlapping with the chl-a predictand season.
For each basin and season, a MCA is applied using Spy4CAST, and the mode that better resembles the EMCA-derived mode related to chl-a varibility (Figure 2) is selected by correlating the SST expansion coefficients (Us) from both analyses. This selected mode is then used to reconstruct the chl-a field by generating a cross-validated hindcast. The similarity of the mode to that obtained with the EMCA ensures that the reconstructed fields are consistent with the dominant mode of co-variability previously identified.
In addition, and in order to corroborate and validate the existence of predictability of chl-a from ocean variability, a deep learning methodology is applied. This methodology has been implemented in python by the creation of an easy Neural Network forecast library. NN4CAST is a deep learning model library which provides a versatile tool for prediction and non-linear statistical analysis, which can help to the assessment of seasonal predictability [38]. It is based on Deep Neural Networks (DNNs), providing the possibility of building simple yet powerful and scalable models, following either a convolutional architecture or an encoder-decoder type, depending on the specific problem to be modeled [39]. As Spy4CAST, NN4CAST produces cross-validated hindcasts. The prediction skill is evaluated, again, by computing ACC maps between the original and reconstructed chl-a fields. The statistical significance of these correlations is assessed using a Student’s t-test (95% confidence interval).
3. Results
In this section, the main results derived from the application of both prediction techniques are summarized. The performance of the Spy4CAST model is examined alongside that of the NN4CAST model, which also serves to corroborate and complement the findings from Spy4CAST.
3.1. Assessment of SST Drivers and chl-a Predictability Derived from MCA. Spy4CAST Model
Figure 3 shows the predictive skill of Spy4CAST by considering SST anomalies from the tropics and from individual oceanic regions - Pacific, Indian, equatorial Atlantic, and TNA - as predictors of chl-a anomalies in the MSCU region during FMAM (0yr). For each predictor region, the MCA was computed independently for four lead seasons: AMJJ (-1yr), JJAS (-1yr), ASON (-1yr), and ONDJ (-1yr), corresponding to lead times of -10, -8, -6, and -4 months, respectively.
Panels (a) in each row display the SST homogeneous regression patterns, associated with the individual leading MCA modes using the full tropical band as predictor in each season. These patterns closely resemble those obtained through the EMCA (Figure 2), reinforcing the idea that the dominant structure of co-variability between tropical SSTs and MSCU chl-a is primarily controlled by ENSO. The spatial coherence across different seasons, together with the gradual evolution of the SST patterns, supports the presence of a consistent and evolving coupled mode linking tropical SST variability to chl-a in the MSCU. This temporal continuity is further confirmed by strong correlations between the Us from each MCA and that of the EMCA, as well as by high correlations among the individual MCA Us expansion coefficients themselves (not shown, all greater than 0.75), confirming the temporal continuity across seasons.
In AMJJ (-1yr) (Figure 3a first row), a warm SST anomaly emerges in the equatorial Atlantic, although it is notably weaker and narrower than the anomaly identified in the EMCA. This discrepancy may arise because the EMCA integrates information from multiple lead times, including periods when the Pacific has already integrated the potential forcing from the equatorial Atlantic [21]. In contrast, the MCA at AMJJ (-1yr) captures an earlier stage of the evolution. As such, the SST signal at this lag may not yet reflect the cumulative effect of the Atlantic forcing integrated by the Pacific. This possibility is further explored in a dedicated section examining the Atlantic SSTs role.
In JJAS (-1yr) (Figure 3a second row), the Atlantic warming persists, but by ASON (-1yr), it dissipates, while a negative IOD pattern begins to emerge (Figure 3a third row). Throughout all seasons, the Pacific La Niña remains active, intensifying toward ONDJ (-1yr), where the teleconnection patterns become more pronounced (Figure 3a fourth row). The geopotential height field at 200 hPa reveals a clear Rossby wave train in the Northern Hemisphere, a counterpart pattern in the Southern Hemisphere, a Gill-type response in the tropical Pacific and a secondary Gill response in the tropical Atlantic — all consistent with the large-scale atmospheric adjustment to persistent La Niña forcing. Additionally, by ONDJ (-1yr), a cooling signal begins to develop in the TNA, a pattern probably associated with increased upwelling-favorable wind anomalies over the MSCU region in boreal late winter.
Panels (b) display the heterogeneous regression maps of chl-a anomalies associated with the MCA modes for each season. These patterns are consistent with the EMCA-derived chl-a structure (Figure 2h), showing strong resemblance across seasons. In all cases, a pronounced maximum appears between 15∘ and 18∘N, just beyond the continental shelf, while further south the largest positive anomalies are concentrated over the shelf. The chl-a response to tropical SST variability is consistent with previous studies highlighting the influence of ENSO on the MSCU [14,15]. From the 1990s onward, the period analyzed in this study, ENSO impact in the MSCU has been associated with a secondary Gill-type atmospheric response over the tropical Atlantic. During La Niña events, this response generates a surface cyclonic wind gyre near the West African coast, which enhances upwelling through Ekman pumping [40]. Ekman pumping plays a key role in nutrient supply to the surface layer, thereby supporting increased chl-a concentrations [2,41].
Panels (c) to (g) present ACC maps, illustrating the skill of the statistical predictions based on SST anomalies from the tropical band, the Pacific, Indian Ocean, equatorial Atlantic, and TNA, respectively. Panels (c) and (d), corresponding to the tropics and the Pacific Ocean, show very similar skill maps across all seasons, further confirming that both the detected co-variability mode and the associated predictability are primarily driven by the Pacific. The region with the highest skill is consistently located between 15∘ and 18∘N, offshore and beyond the continental shelf — matching the area of maximum chl-a anomalies captured by the different tropical MCA modes (Figure 3b).
In the case of the Indian Ocean (panels (e)), the seasons most related to the SST–chl-a co-variability mode are JJAS (-1yr), ASON (-1yr), and ONDJ (-1yr) (second, third, and fourth rows, respectively). For these cases, the skill maps - though showing more spatially confined areas of skill - are again highly similar to those obtained for the tropics and the Pacific (Figure 3c,d). This suggests that Indian Ocean variability is strongly linked to that of the Pacific. For AMJJ (-1yr) (Figure 3e, first row), the mode most related to the EMCA is the second one, with a relatively low correlation coefficient between the respective Us (0.31), while the corresponding chl-a pattern shows a much higher correlation (0.84) with the EMCA Vs. This indicates that, although the SST signal differs from the EMCA, it still captures key aspects of the chl-a variability.
Regarding the equatorial Atlantic (panels (f)), this region does not act as a good predictor in JJAS (-1yr) or ASON (-1yr). In AMJJ (-1yr), although the SST signal in the equatorial Atlantic is weak in the MCA done with tropical SSTs (Figure 3a, first row), the mode shows some connection with that identified by the EMCA (ruu = 0.48). Nevertheless, it also captures variability that is not fully linked to this relationship and contributes primarily to the skill in the southern sector of the MSCU region. In ONDJ (-1yr), the equatorial Atlantic (panel (f), fourth row) exhibits a relatively weak structural connection to the EMCA, as indicated by a modest correlation between the expansion coefficients (ruu = 0.48). So, even if the SST - chl-a co-variability structure differs from the dominant EMCA pattern, equatorial Atlantic SSTs still carry relevant predictive information. Therefore, this region emerges as a potentially strong predictor of chl-a anomalies in FMAM (0yr), especially in the southern part of the upwelling system. The mechanisms behind the different skill and teleconnection found for the tropical Atlantic will be analyzed in a separate section later on.
Panels (g) show the ACC skill maps for TNA SSTs as predictor. In general, the predictive skill increases as the predicted season (FMAM (0yr)) approaches, with ONDJ (-1yr) (Figure 2g fourth row) showing the highest skill. This progression mirrors the seasonal development of cold SST anomalies in the TNA seen in the EMCA and in the MCA regression maps (Figure 2 and Figure 3a), showing that TNA variability becomes increasingly influential closer to the target season. This influence may operate through changes in surface winds over the TNA and the MSCU region, potentially linked to ENSO but also involving local variability. In contrast, AMJJ (-1yr) (Figure 2g firt row) shows negligible skill, reflecting the lack of a clear SST signal in this region during early boreal summer (Figure 2a first row). JJAS (-1yr) exhibits modest predictive capacity, but it is associated with the second MCA mode rather than the leading one, indicating that while some relevant variability exists, it is not dominant in the overall co-variability structure at that lead time (Figure 2g second row).
3.2. Assessment of chl-a Predictability Derived from DNN. NN4CAST Model
To assess the potential predictability of chl-a in the MSCU identified in the previous section, a DNN approach is applied through the NN4CAST model. Figure 4 displays the prediction skill, expressed as an ACC, across the same lead times and SST predictor regions as in Spy4CAST (Figure 3), allowing for a comparison between the two approaches.
Regarding the tropics and the Pacific (Figure 4a and b, respectively), the skill maps remain highly consistent between them across lead times, once again highlighting the central role of the Pacific in driving predictability. The most extended skill appears at the shorter lead times (ASON (-1yr) and ONDJ (-1yr)) where NN4CAST appears to outperform Spy4CAST, particularly in the southern sector of the MSCU, south of 15∘N.
For the Indian Ocean (Figure 4c), the predictive skill patterns differ from those associated with the Pacific, suggesting that the covariability between both basins— prominent in the Spy4CAST approach — is not as strongly reflected here. In this case, NN4CAST does not improve skill in the southern part of the MSCU, unlike what was observed for the Pacific. Instead, it shows improved predictive skill in the north, especially during ONDJ (-1yr), suggesting that the model may be capturing aspects of Indian Ocean variability that are not as tightly linked to the Pacific as in the Spy4CAST framework. This points to the potential of NN4CAST to extract predictive signals from more localized or independent dynamics within the basin.
As for the equatorial Atlantic (Figure 4d), NN4CAST captures some predictability in regions not fully aligned with those highlighted by Spy4CAST, particularly in JJAS and ASON (-1yr), where skill emerges in the southern MSCU. In AMJJ (-1yr), the model performace shows some agreement with Spy4CAST, especially between 15∘ and 17∘N. While ONDJ (-1yr) remains the lead season with the highest overall skill, as in the statistical approach, the area of strong predictability is less extensive, suggesting that NN4CAST may be detecting a more spatially focused or distinct component of the Atlantic-related variability.
In the case of the TNA (Figure 4e), NN4CAST reveals predictive skill even during AMJJ (-1yr), a season in which Spy4CAST did not show any significant signal. While Spy4CAST relied on the second MCA mode to extract predictive information from this region, NN4CAST appears to capture TNA-related variability not directly linked to the extended MCA structure. Agreement between the two models improves in JJAS (-1yr) and ASON (-1yr), with both displaying enhanced skill particularly in the southern MSCU. Interestingly, for ONDJ (-1yr), expected to be the best predictive season, NN4CAST shows a notable reduction in skill compared to Spy4CAST, with the region of highest predictability shifting northward, around 18–19∘N.
Overall, NN4CAST shows predictive skill patterns that generally align with those obtained using Spy4CAST, lending support to the signals identified through the statistical approach. However, unlike Spy4CAST, which predicts chl-a anomalies based on the extended co-variability mode identified in the methodology (and therefore provides clearer insights into the origin of predictability), NN4CAST does not offer direct information about the underlying physical linkages driving its forecasts. Although efforts are being made to develop attribution methods that can identify the predictor regions contributing to the predictability, it remains unclear, without further analysis, whether the model relies on the same coupled mode linking tropical basins, or instead draws from different sources of variability. Some of the discrepancies between both approaches may stem from this fundamental difference. Nevertheless, NN4CAST often provides predictive skill in regions where Spy4CAST is less effective — especially in the southern MSCU. This may reflect its capacity to detect nonlinear or more complex relationships not accessible through linear statistical methods.
3.3. Role of the Atlantic Niño in AMJJ (-1yr) and Atmospheric Impact in the MSCU
In this section, the role of the Atlantic Niño during AMJJ (-1yr) in shaping the atmospheric and oceanic conditions that may lead to changes in chl-a concentrations in the MSCU during FMAM (0yr) is explored. To this end, the Us expansion coefficient from the MCA between equatorial Atlantic SSTs in AMJJ (-1yr) and MSCU chl-a anomalies in FMAM (0yr) is regressed onto SST fields at various seasons, both prior to and following AMJJ (-1yr) (Figure 2f first row).
Four months before AMJJ (-1yr) (DJFM (-2yr)) (Figure 5a), a warm anomaly resembling an Atlantic Niño is already present. This winter Atlantic Niño co-occurs with cold anomalies in the western equatorial Pacific and the North Pacific, particularly in the extratropical northwest region. During the subsequent seasons, the Atlantic warming persists, especially in the western basin, with potential to modulate the Walker circulation. In AMJJ (-1yr), enhanced divergence of the trade winds over the central equatorial Pacific, contributing to the development of La Niña, are displayed (Figure 5c). This cooling in the equatorial Pacific becomes more defined in ASON (-1yr), With a clear propagation of the cold tongue anomalies to the east, resembling an oceanic Kelvin wave (Figure 5e), and continues into ONDJ (-1yr), albeit with a weaker intensity than observed in previous sections. These findings suggest that part of the Pacific variability may be influenced or supported by antecedent conditions in the Atlantic, particularly via atmospheric teleconnections, involving changes in the Walker cell, initiated by the Atlantic Niño.
To further investigate the link between equatorial Atlantic SSTs in AMJJ (-1yr) and the anomalous chl-a concentrations in the MSCU during FMAM (0yr), the associated atmospheric response is analyzed (Figure 6a). At sea level, a pressure anomaly pattern resembling a positive NAO emerges, characterized by a strengthened Azores High, although this signal does not reach statistical significance. This NAO response could be link to a La Niña in the Pacific [42]. More prominently, over the equatorial Atlantic, a baroclinic structure becomes evident, with corresponding anomalies in both the upper-level geopotential height and the surface pressure. This pattern is consistent with the secondary Gill-type response to an anomalous cooling in the equatorial Pacific. Together, these features help drive the wind field in a cyclonic circulation centered over the southern MSCU. Such a circulation could enhance local upwelling via anomalous Ekman pumping, thus explaining the increased chl-a concentrations observed in this region.
When comparing this response to that associated with Pacific SSTs in AMJJ (-1yr) (Figure 6c), some differences emerge. In this case, the NAO-like response is absent. However, the Gill-type baroclinic response appears more intense, particularly at upper levels. The associated surface pressure anomalies now form are located further north compared to the Atlantic case. This shift could account for the observed northward shift in chl-a anomalies (Figure 6d).
As the EMCA mode is largely dominated by Pacific variability, its associated atmospheric response (Figure 6e) closely resembles the pattern linked to Pacific SSTs alone. However, signs of Atlantic influence are also evident. Specifically, the Gill-type secondary response over the equatorial Atlantic appears more prominent than in the pure Pacific case. Additionally, positive sea level pressure anomalies develop near the Azores, and together with the surface low pressure anomalies induced by the baroclinic structure of the secondary Gill response, they establish a pressure gradient that drives the wind field into a cyclonic circulation over the MSCU. This configuration mirrors the conditions favorable for anomalous upwelling, and indeed, the chl-a pattern (Figure 6f) exhibits southern anomalies similar to those found in the Atlantic-only case.
These results support the idea that the La Niña associated with Atlantic Niño forcing produces a distinct atmospheric teleconnection compared to a La Niña that evolves without important SST anomalies in the equatorial Atlantic. Both processes, operating at interannual scales, may act as separate sources of predictability. The EMCA captures a coupled Atlantic–Pacific mode of variability, where the Atlantic Niño could help modulate the Pacific response. In this sense, the La Niña events that are preceded by an Atlantic warming seem to generate a different teleconnection than those developing independently. Both may contribute to predictability in the MSCU region, and the EMCA structure reflects, in part, their combined influence, although it is largely controlled by the Pacific.
4. Discussion and Conclusions
The Mauritanian-Senegalese Coastal Upwelling (MSCU) is home of one of the world’s richest and most diverse marine ecosystems [43]. Assessing its predictability is crucial for the management and conservation of the region and its fisheries, which are threatened by overfishing and climate change [44,45]. Chlorophyll-a (chl-a) concentration serves as a key proxy for phytoplankton biomass and, consequently, for the base of the marine food web. Understanding the mechanisms that control its variability is therefore essential for anticipating fluctuations in biological productivity and ecosystem health.
Changes in Sea Surface Temperature (SST) anomalies are, among climatic information, one of the most widely approached used to predict living marine resources [46,47]. The ocean’s large heat capacity provides memory/inertia that can be used to train predictive models. In this context, predicting chl-a variability based on SST anomalies has become a promising avenue.
To investigate this link, this study applies statistical models trained with historical SST anomalies across different regions and seasons, aiming to evaluate the seasonal predictability of chl-a concentrations in the MSCU during the upwelling season, FMAM. Two statistical tools implemented in python are used: Spy4CAST [37], a statistical model based on Maximum Covariance Analysis (MCA), and NN4CAST [38], a deep learning framework based on Deep Neural Networks (DNN). These approaches offers a valuable alternative to dynamical models, especially in areas like the tropical Atlantic and coastal upwelling systems, where physical models still show significant biases [48,49].
Related to the variability of surface chl-a concentration in the MSCU in FMAM, a tropical SST variability mode dominated by El Niño-Southern Oscillation (ENSO) has been identified, evolving from boreal spring (AMJJ) to the following late winter, involving a chain of mechanisms across different tropical ocean basins.
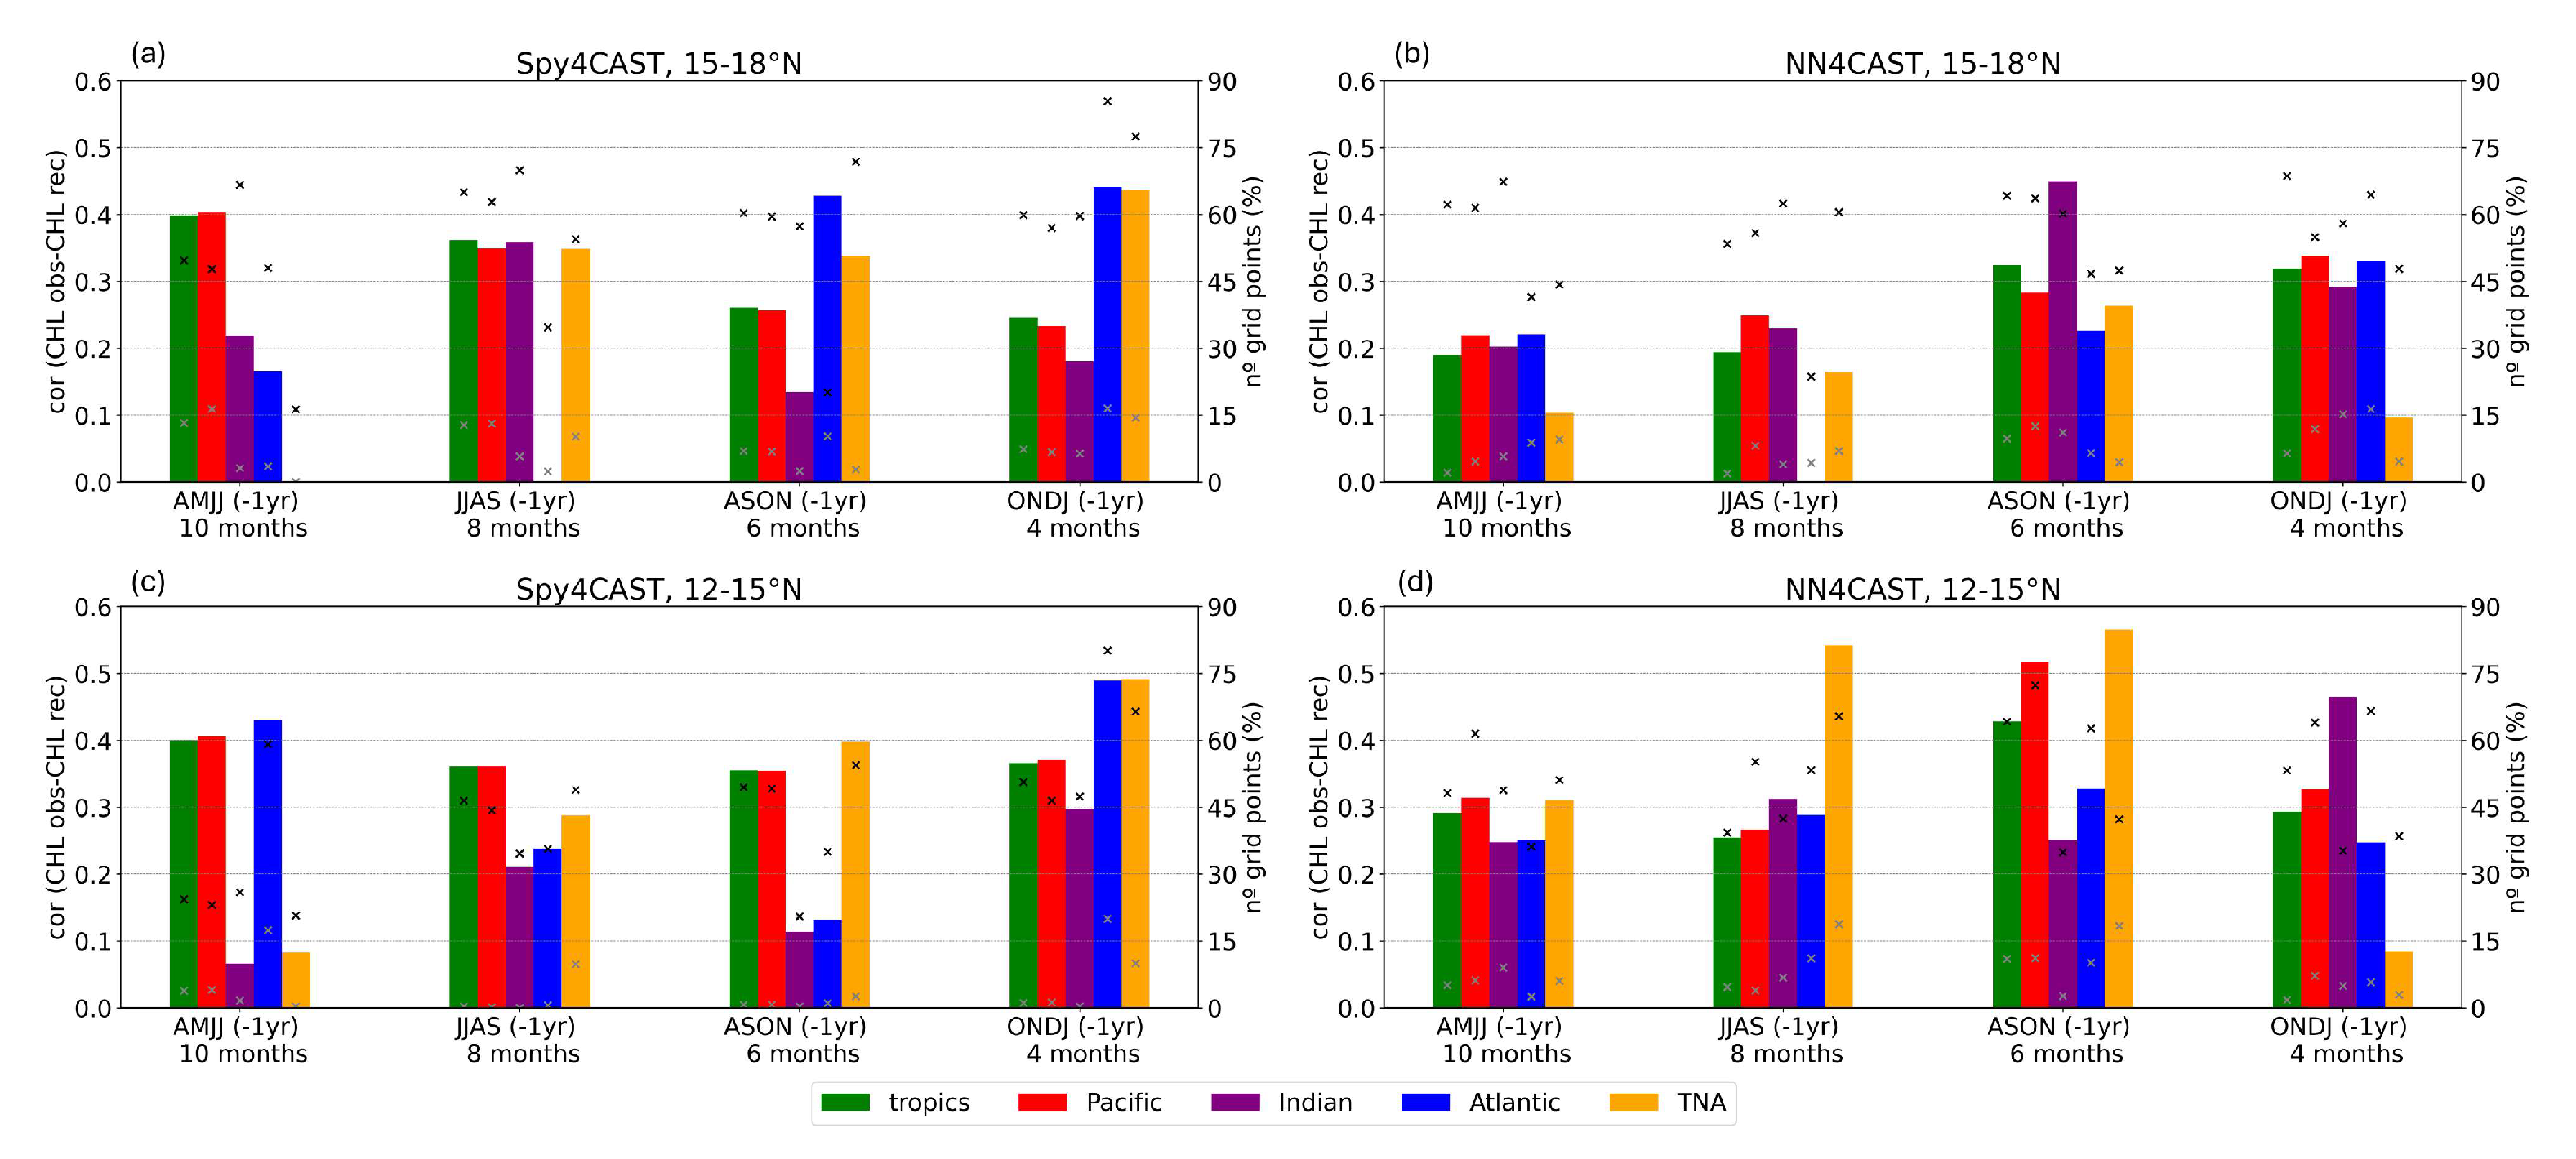
As a synthesis of the study, Figure 7 shows the impact on the chl-a predictability in the MSCU, given by the contribution of each of the basins along time, in a way to wrap up the outcomes from Figure 3 and Figure 4. In the previous spring, 10 months before the peak in chl-a (FMAM), the whole tropics are involved with the main contribution coming from the Pacific. This contribution reflects the dominant influence of the Pacific ENSO on the chl-a variability, in agreement with other authors [14,40]. Nevertheless, in the southern region of the upwelling system, it can be seem how the equatorial Atlantic plays a crucial role (Figure 7(a) and (c)), a feature that has been also analyzed in this work, highlighting the important role of equatorial Atlantic on ENSO predictability [21]. As ENSO evolves in time, its relation to tropical North Atlantic SST variability increases, due to the associated teleconnections, increasing as well the role of Tropical North Atlantic (TNA) on chl-a predictability. From ASON (-1yr), the equatorial Atlantic increases its influence on the predictability, although as part of the ENSO pattern. This signal is stronger in the northern MSCU, while the TNA shows a more pronounced influence in the southern sector. The DNN hindcast highlights a stronger contribution from the TNA in the south (Figure 7(c)), compared to the MCA-based hindcast (Figure 7(d)).
The present study provides, for the first time, a comprehensive analysis of observed surface chl-a concentration predictability from SST variability at seasonal time scales in the MSCU. Considering that chl-a can be used as an estimator of primary productivity in marine ecosystems, the results obtained here represent a useful springboard for the prediction of marine resources in the region. Specifically, with recently released global marine ecosystem simulations forced by historical climate from the Fisheries and Marine Ecosystem Model Intercomparison Project (FishMIP) [47,50]. Using these models an assessment of fisheries predictability can currently be done [51]. In addition, individual based models calibrated for this region can be also applied to test the impact of each of the individual basins, or the time-evolving tropical mode in the way that it was done by [16], including different species.
The results from this study have important implications for climate services, as they can support the effective management of local resources in the region and contribute to the protection of its marine ecosystem.
Author Contributions
Conceptualization, E.C.M., B.R.F., and I.G.; methodology, E.C.M., B.R.F., V.G.F., and I.G.; software, E.C.M., B.R.F. and V.G.F.; validation, E.C.M., B.R.F., V.G.F., and I.G.; formal analysis, E.C.M., B.R.F., V.G.F., and I.G.; investigation, E.C.M., B.R.F., V.G.F., and I.G.; writing—original draft preparation, E.C.M. and B.R.F.; writing—review and editing, E.C.M., B.R.F., V.G.F., and I.G.; visualization, E.C.M., B.R.F., V.G.F., and I.G.; project administration, B.R.F.; funding acquisition, B.R.F. All authors have read and agreed to the published version of the manuscript.
Funding
This research was funded by the EU H2020 project TRIATLAS (No. 817578), the Spanish AEI under the project DISTROPIA with reference PID2021-125806NB-I00 and the project OFF TED2021-130106B-I00. Iñigo Gómara was supported by research project CONSCIENCE (PID2023-146344OB-I00), funded by MICIU/AEI /10.13039/501100011033 and by FEDER, UE.
Data Availability Statement
The data presented in this study are available in [repository name] at https://zenodo.org/records/15546638, reference number [52]. These data were derived from the following resources available in the public domain: HadISST 1.1 (https://www.metoffice.gov.uk/hadobs/hadisst/data/download.html), ERA5 (https://cds.climate.copernicus.eu/datasets/reanalysis-era5-single-levels-monthly-means?tab=overview) and Copernicus Marine Services (https://data.marine.copernicus.eu/product/OCEANCOLOUR_GLO_BGC_L4_MY_009_108/download?dataset=c3s_obs-oc_glo_bgc-plankton_my_l4-multi-4km_P1M).
Conflicts of Interest
The authors declare no conflicts of interest. The funders had no role in the design of the study; in the collection, analyses, or interpretation of data; in the writing of the manuscript; or in the decision to publish the results.
References
- Lathuiliere, C.; Echevin, V.; Lévy, M. Seasonal and intraseasonal surface chlorophyll-a variability along the northwest African coast. Journal of Geophysical Research: Oceans 2008, 113. [Google Scholar] [CrossRef]
- Messié, M.; Chavez, F.P. Seasonal regulation of primary production in eastern boundary upwelling systems. Progress in Oceanography 2015, 134, 1–18. [Google Scholar] [CrossRef]
- Arteaga, L.; Pahlow, M.; Oschlies, A. Global patterns of phytoplankton nutrient and light colimitation inferred from an optimality-based model. Global Biogeochemical Cycles 2014, 28, 648–661. [Google Scholar] [CrossRef]
- Cassou, C.; Deser, C.; Terray, L.; Hurrell, J.W.; Drévillon, M. Summer sea surface temperature conditions in the North Atlantic and their impact upon the atmospheric circulation in early winter. Journal of Climate 2004, 17, 3349–3363. [Google Scholar] [CrossRef]
- García-Serrano, J.; Losada, T.; Rodríguez-Fonseca, B.; Polo, I. Tropical Atlantic variability modes (1979–2002). Part II: Time-evolving atmospheric circulation related to SST-forced tropical convection. Journal of Climate 2008, 21, 6476–6497. [Google Scholar] [CrossRef]
- Ham, Y.G.; Kug, J.S.; Park, J.Y.; Jin, F.F. Sea surface temperature in the north tropical Atlantic as a trigger for El Niño/Southern Oscillation events. Nature Geoscience 2013, 6, 112–116. [Google Scholar] [CrossRef]
- Cai, W.; Wu, L.; Lengaigne, M.; Li, T.; McGregor, S.; Kug, J.S.; Yu, J.Y.; Stuecker, M.F.; Santoso, A.; Li, X.; et al. Pantropical climate interactions. Science 2019, 363, eaav4236. [Google Scholar] [CrossRef] [PubMed]
- Latif, M.; Barnett, T.P. Interactions of the tropical oceans. Journal of Climate 1995, 8, 952–964. [Google Scholar] [CrossRef]
- Rodríguez-Fonseca, B.; Ham, Y.G.; Lee, S.K.; Martín-Rey, M.; Polo, I. Interacting Interannual Variability of the Pacific and Atlantic Oceans. Interacting climates of ocean basins: Observations, mechanisms, predictability, and impacts 2020, p. 120.
- Saravanan, R.; Chang, P. Interaction between tropical Atlantic variability and El Niño–Southern oscillation. Journal of climate 2000, 13, 2177–2194. [Google Scholar] [CrossRef]
- Wang, C. Atlantic climate variability and its associated atmospheric circulation cells. Journal of climate 2002, 15, 1516–1536. [Google Scholar] [CrossRef]
- García-Serrano, J.; Cassou, C.; Douville, H.; Giannini, A.; Doblas-Reyes, F.J. Revisiting the ENSO teleconnection to the tropical North Atlantic. Journal of Climate 2017, 30, 6945–6957. [Google Scholar] [CrossRef]
- Roy, C.; Reason, C. ENSO related modulation of coastal upwelling in the eastern Atlantic. Progress in Oceanography 2001, 49, 245–255. [Google Scholar] [CrossRef]
- Wade, M.; Rodríguez-Fonseca, B.; Martín-Rey, M.; Lazar, A.; López-Parages, J.; Gaye, A.T. Interdecadal changes in SST variability drivers in the Senegalese-upwelling: the impact of ENSO. Climate Dynamics 2023, 60, 667–685. [Google Scholar] [CrossRef]
- Pradhan, Y.; Lavender, S.J.; Hardman-Mountford, N.J.; Aiken, J. Seasonal and inter-annual variability of chlorophyll-a concentration in the Mauritanian upwelling: Observation of an anomalous event during 1998–1999. Deep Sea Research Part II: Topical Studies in Oceanography 2006, 53, 1548–1559. [Google Scholar] [CrossRef]
- López-Parages, J.; Auger, P.A.; Rodríguez-Fonseca, B.; Keenlyside, N.; Gaetan, C.; Rubino, A.; Arisido, M.W.; Brochier, T. El Nino as a predictor of round sardinella distribution along the northwest African coast. Progress in Oceanography 2020, 186, 102341. [Google Scholar] [CrossRef]
- Zebiak, S.E. Air–sea interaction in the equatorial Atlantic region. Journal of Climate 1993, 6, 1567–1586. [Google Scholar] [CrossRef]
- Chenillat, F.; Illig, S.; Jouanno, J.; Awo, F.M.; Alory, G.; Brehmer, P. How do climate modes shape the chlorophyll-a interannual variability in the tropical Atlantic? Geophysical Research Letters 2021, 48, e2021GL093769. [Google Scholar] [CrossRef]
- Saji, N.; Goswami, B.N.; Vinayachandran, P.; Yamagata, T. A dipole mode in the tropical Indian Ocean. Nature 1999, 401, 360–363. [Google Scholar] [CrossRef]
- Ma, X.; Chen, G.; Li, Y.; Zeng, L. Interannual variability of sea surface chlorophyll a in the southern tropical Indian Ocean: Local versus remote forcing. Deep Sea Research Part I: Oceanographic Research Papers 2022, 190, 103914. [Google Scholar] [CrossRef]
- Rodríguez-Fonseca, B.; Polo, I.; García-Serrano, J.; Losada, T.; Mohino, E.; Mechoso, C.R.; Kucharski, F. Are Atlantic Niños enhancing Pacific ENSO events in recent decades? Geophysical Research Letters 2009, 36. [Google Scholar] [CrossRef]
- Losada, T.; Rodríguez-Fonseca, B.; Polo, I.; Janicot, S.; Gervois, S.; Chauvin, F.; Ruti, P. Tropical response to the Atlantic Equatorial mode: AGCM multimodel approach. Climate Dynamics 2010, 35, 45–52. [Google Scholar] [CrossRef]
- Kucharski, F.; Syed, F.; Burhan, A.; Farah, I.; Gohar, A. Tropical Atlantic influence on Pacific variability and mean state in the twentieth century in observations and CMIP5. Climate Dynamics 2015, 44, 881–896. [Google Scholar] [CrossRef]
- Jiang, L.; Li, T. Impacts of tropical North Atlantic and equatorial Atlantic SST anomalies on ENSO. Journal of Climate 2021, 34, 5635–5655. [Google Scholar] [CrossRef]
- Webster, P.J.; Moore, A.M.; Loschnigg, J.P.; Leben, R.R. Coupled ocean–atmosphere dynamics in the Indian Ocean during 1997–98. Nature 1999, 401, 356–360. [Google Scholar] [CrossRef]
- Klein, S.A.; Soden, B.J.; Lau, N.C. Remote sea surface temperature variations during ENSO: Evidence for a tropical atmospheric bridge. Journal of climate 1999, 12, 917–932. [Google Scholar] [CrossRef]
- Huang, G.; Hu, K.; Qu, X.; Tao, W.; Yao, S.; Zhao, G.; Jiang, W. A review about Indian Ocean basin mode and its impacts on East Asian summer climate. Chin. J. Atmos. Sci 2016, 40, 121–130. [Google Scholar]
- Xie, S.P.; Hu, K.; Hafner, J.; Tokinaga, H.; Du, Y.; Huang, G.; Sampe, T. Indian Ocean capacitor effect on Indo–western Pacific climate during the summer following El Niño. Journal of climate 2009, 22, 730–747. [Google Scholar] [CrossRef]
- Izumo, T.; Vialard, J.; Lengaigne, M.; de Boyer Montegut, C.; Behera, S.K.; Luo, J.J.; Cravatte, S.; Masson, S.; Yamagata, T. Influence of the state of the Indian Ocean Dipole on the following year’s El Niño. Nature Geoscience 2010, 3, 168–172. [Google Scholar] [CrossRef]
- Okumura, Y.M.; Deser, C. Asymmetry in the duration of El Niño and La Niña. Journal of Climate 2010, 23, 5826–5843. [Google Scholar] [CrossRef]
- Martín-Gómez, V.; Rodríguez-Fonseca, B.; Polo, I.; Martín-Rey, M. Observed global mean state changes modulating the collective influence of the tropical Atlantic and Indian oceans on ENSO. Journal of Climate 2024, 37, 3869–3886. [Google Scholar] [CrossRef]
- Rayner, N.; Parker, D.E.; Horton, E.; Folland, C.K.; Alexander, L.V.; Rowell, D.; Kent, E.C.; Kaplan, A. Global analyses of sea surface temperature, sea ice, and night marine air temperature since the late nineteenth century. Journal of Geophysical Research: Atmospheres 2003, 108. [Google Scholar] [CrossRef]
- Gohin, F.; Druon, J.; Lampert, L. A five channel chlorophyll concentration algorithm applied to SeaWiFS data processed by SeaDAS in coastal waters. International journal of remote sensing 2002, 23, 1639–1661. [Google Scholar] [CrossRef]
- Hu, C.; Lee, Z.; Franz, B. Chlorophyll aalgorithms for oligotrophic oceans: A novel approach based on three-band reflectance difference. Journal of Geophysical Research: Oceans 2012, 117. [Google Scholar] [CrossRef]
- Hersbach, H.; Bell, B.; Berrisford, P.; Hirahara, S.; Horányi, A.; Muñoz-Sabater, J.; Nicolas, J.; Peubey, C.; Radu, R.; Schepers, D.; et al. The ERA5 global reanalysis. Quarterly Journal of the Royal Meteorological Society 2020, 146, 1999–2049. [Google Scholar] [CrossRef]
- Martín-Rey, M.; Rodríguez-Fonseca, B.; Polo, I. Atlantic opportunities for ENSO prediction. Geophysical Research Letters 2015, 42, 6802–6810. [Google Scholar] [CrossRef]
- Duran-Fonseca, P.; Rodríguez-Fonseca, B. Spy4Cast v1. 0: a Python Tool for statistical seasonal forecast based on Maximum Covariance Analysis. Geoscientific Model Development Discussions 2024, 2024, 1–20. [Google Scholar]
- Fraile, V.G.; Rodríguez-Fonseca, B.; Polo, I.; Martín-Rey, M.; Moreno-García, M.N. NN4CAST: An end-to-end deep learning application for seasonal climate forecasts.
- Goodfellow, I.; Bengio, Y.; Courville, A.; Bengio, Y. Deep learning; Vol. 1, MIT press Cambridge, 2016.
- Calvo-Miguélez, E.; Rodriguez-Fonseca, B.; Gómara, I. Competing mechanisms in ENSO’s influence on the Mauritanian-Senegalese Coastal Upwelling since the late 1990s. Under Review in Journal of Geophysical Research, Oceans.
- Pastor, M.V.; Palter, J.B.; Pelegrí, J.L.; Dunne, J.P. Physical drivers of interannual chlorophyll variability in the eastern subtropical North Atlantic. Journal of Geophysical Research: Oceans 2013, 118, 3871–3886. [Google Scholar] [CrossRef]
- Zhang, W.; Wang, Z.; Stuecker, M.F.; Turner, A.G.; Jin, F.F.; Geng, X. Impact of ENSO longitudinal position on teleconnections to the NAO. Climate Dynamics 2019, 52, 257–274. [Google Scholar] [CrossRef]
- Chavez, F.P.; Messié, M. A comparison of eastern boundary upwelling ecosystems. Progress in Oceanography 2009, 83, 80–96. [Google Scholar] [CrossRef]
- Bindoff, N.L.; Cheung, W.W.; Kairo, J.G.; Arístegui, J.; Guinder, V.A.; Hallberg, R.; Hilmi, N.; Jiao, N.; Levin, L.; O’Donoghue, S.; et al. Changing ocean, marine ecosystems, and dependent communities 2022.
- Elhadj Bara, D.; Pierre, F. Analysis of Fish Consumption in the ECOWAS Region and Mauritania: Current Constraints and Future Challenges. Sustainability 2024, 16, 5429. [Google Scholar] [CrossRef]
- Park, J.Y.; Stock, C.A.; Dunne, J.P.; Yang, X.; Rosati, A. Seasonal to multiannual marine ecosystem prediction with a global Earth system model. Science 2019, 365, 284–288. [Google Scholar] [CrossRef] [PubMed]
- Gómara, I.; Rodríguez-Fonseca, B.; Mohino, E.; Losada, T.; Polo, I.; Coll, M. Skillful prediction of tropical Pacific fisheries provided by Atlantic Niños. Environmental Research Letters 2021, 16, 054066. [Google Scholar] [CrossRef]
- Richter, I. Climate model biases in the eastern tropical oceans: Causes, impacts and ways forward. Wiley Interdisciplinary Reviews: Climate Change 2015, 6, 345–358. [Google Scholar] [CrossRef]
- Richter, I.; Xie, S.P. On the origin of equatorial Atlantic biases in coupled general circulation models. Climate Dynamics 2008, 31, 587–598. [Google Scholar] [CrossRef]
- Tittensor, D.P.; Eddy, T.D.; Lotze, H.K.; Galbraith, E.D.; Cheung, W.; Barange, M.; Blanchard, J.L.; Bopp, L.; Bryndum-Buchholz, A.; Büchner, M.; et al. A protocol for the intercomparison of marine fishery and ecosystem models: Fish-MIP v1. 0. Geoscientific Model Development 2018, 11, 1421–1442. [Google Scholar] [CrossRef]
- Rodriguez-Fonseca, B.; Calvo-Miguélez, E.; Montoya-Carramolino, L.; Rodrigues, R.; et al. ENSO impact on marine ecosystems and fisheries in the tropical and South Atlantic. Accepted in Nature Reviews Earth and Environment.
- Calvo-Miguélez, E. Predicting chlorophyll-a in the Mauritanian-Senegalese Coastal Upwelling from tropical Sea Surface Temperature - Data, 2025. [CrossRef]
Figure 1.
Surface chl-a concentration (mg m−3), mean (colors) and standard deviation (contours) in FMAM during the period 1998-2024. Surface wind (m s−1) mean is indicated by arrows.
Figure 1.
Surface chl-a concentration (mg m−3), mean (colors) and standard deviation (contours) in FMAM during the period 1998-2024. Surface wind (m s−1) mean is indicated by arrows.
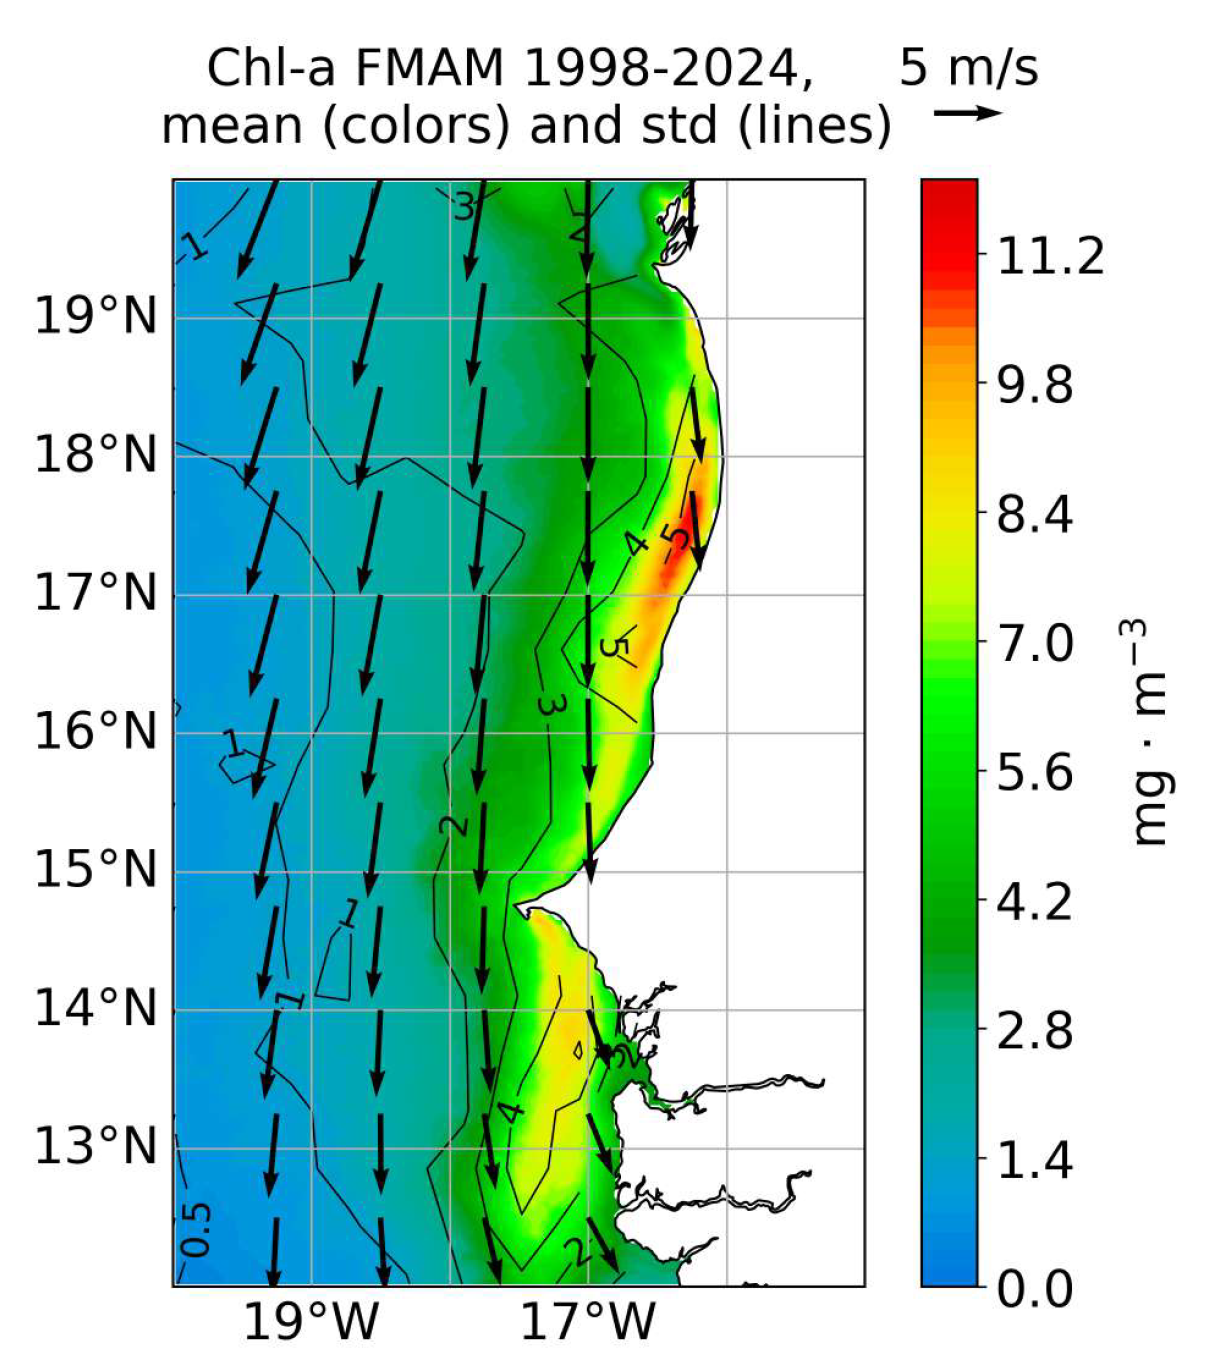
Figure 2.
Leading co-variability mode between tropical Sea Surface Temperatures (SSTs) and chlorophyll-a (chl-a) in the Mauritanian-Senegalese Coastal Upwelling (MSCU) for 1998-2024. (a) Standardized expansion coefficients associated with the first mode of variability. In solid blue line Us (associted with SSTs) and in green Vs (associated with chl-a). The dashed blue line represents the standardized SST anomaly index of Niño 3.4 at DJFM (-1yr). In purple dashed line the chl-a standardized anomaly index at MSCU in FMAM (0yr) in green dashed line. From (b) to (g): homogeneous SST regression maps (∘C/std) for AMJJ (-1yr), JJAS (-1yr), ASON (-1yr), ONDJ (-1yr), DJFM (-1yr) and FMAM (0yr). Dots indicate the 95% confidence interval based on a Monte Carlo test. The green box, covering all tropics, on each map indicates the region considered for the predictor field in the application of the EMCA. The red, purple, blue and yellow boxes indicate the Pacific, Indian, equatorial Atlantic and TNA regions to be used in the statistical prediction models. (h) Heterogeneous regression maps of chl-a (mg m−3/std) over the MSCU region in FMAM (0yr). Dots indicate the 95% confidence interval based on a Monte Carlo test. The 100 m isobath is shown as a black line representing the continental shelf.
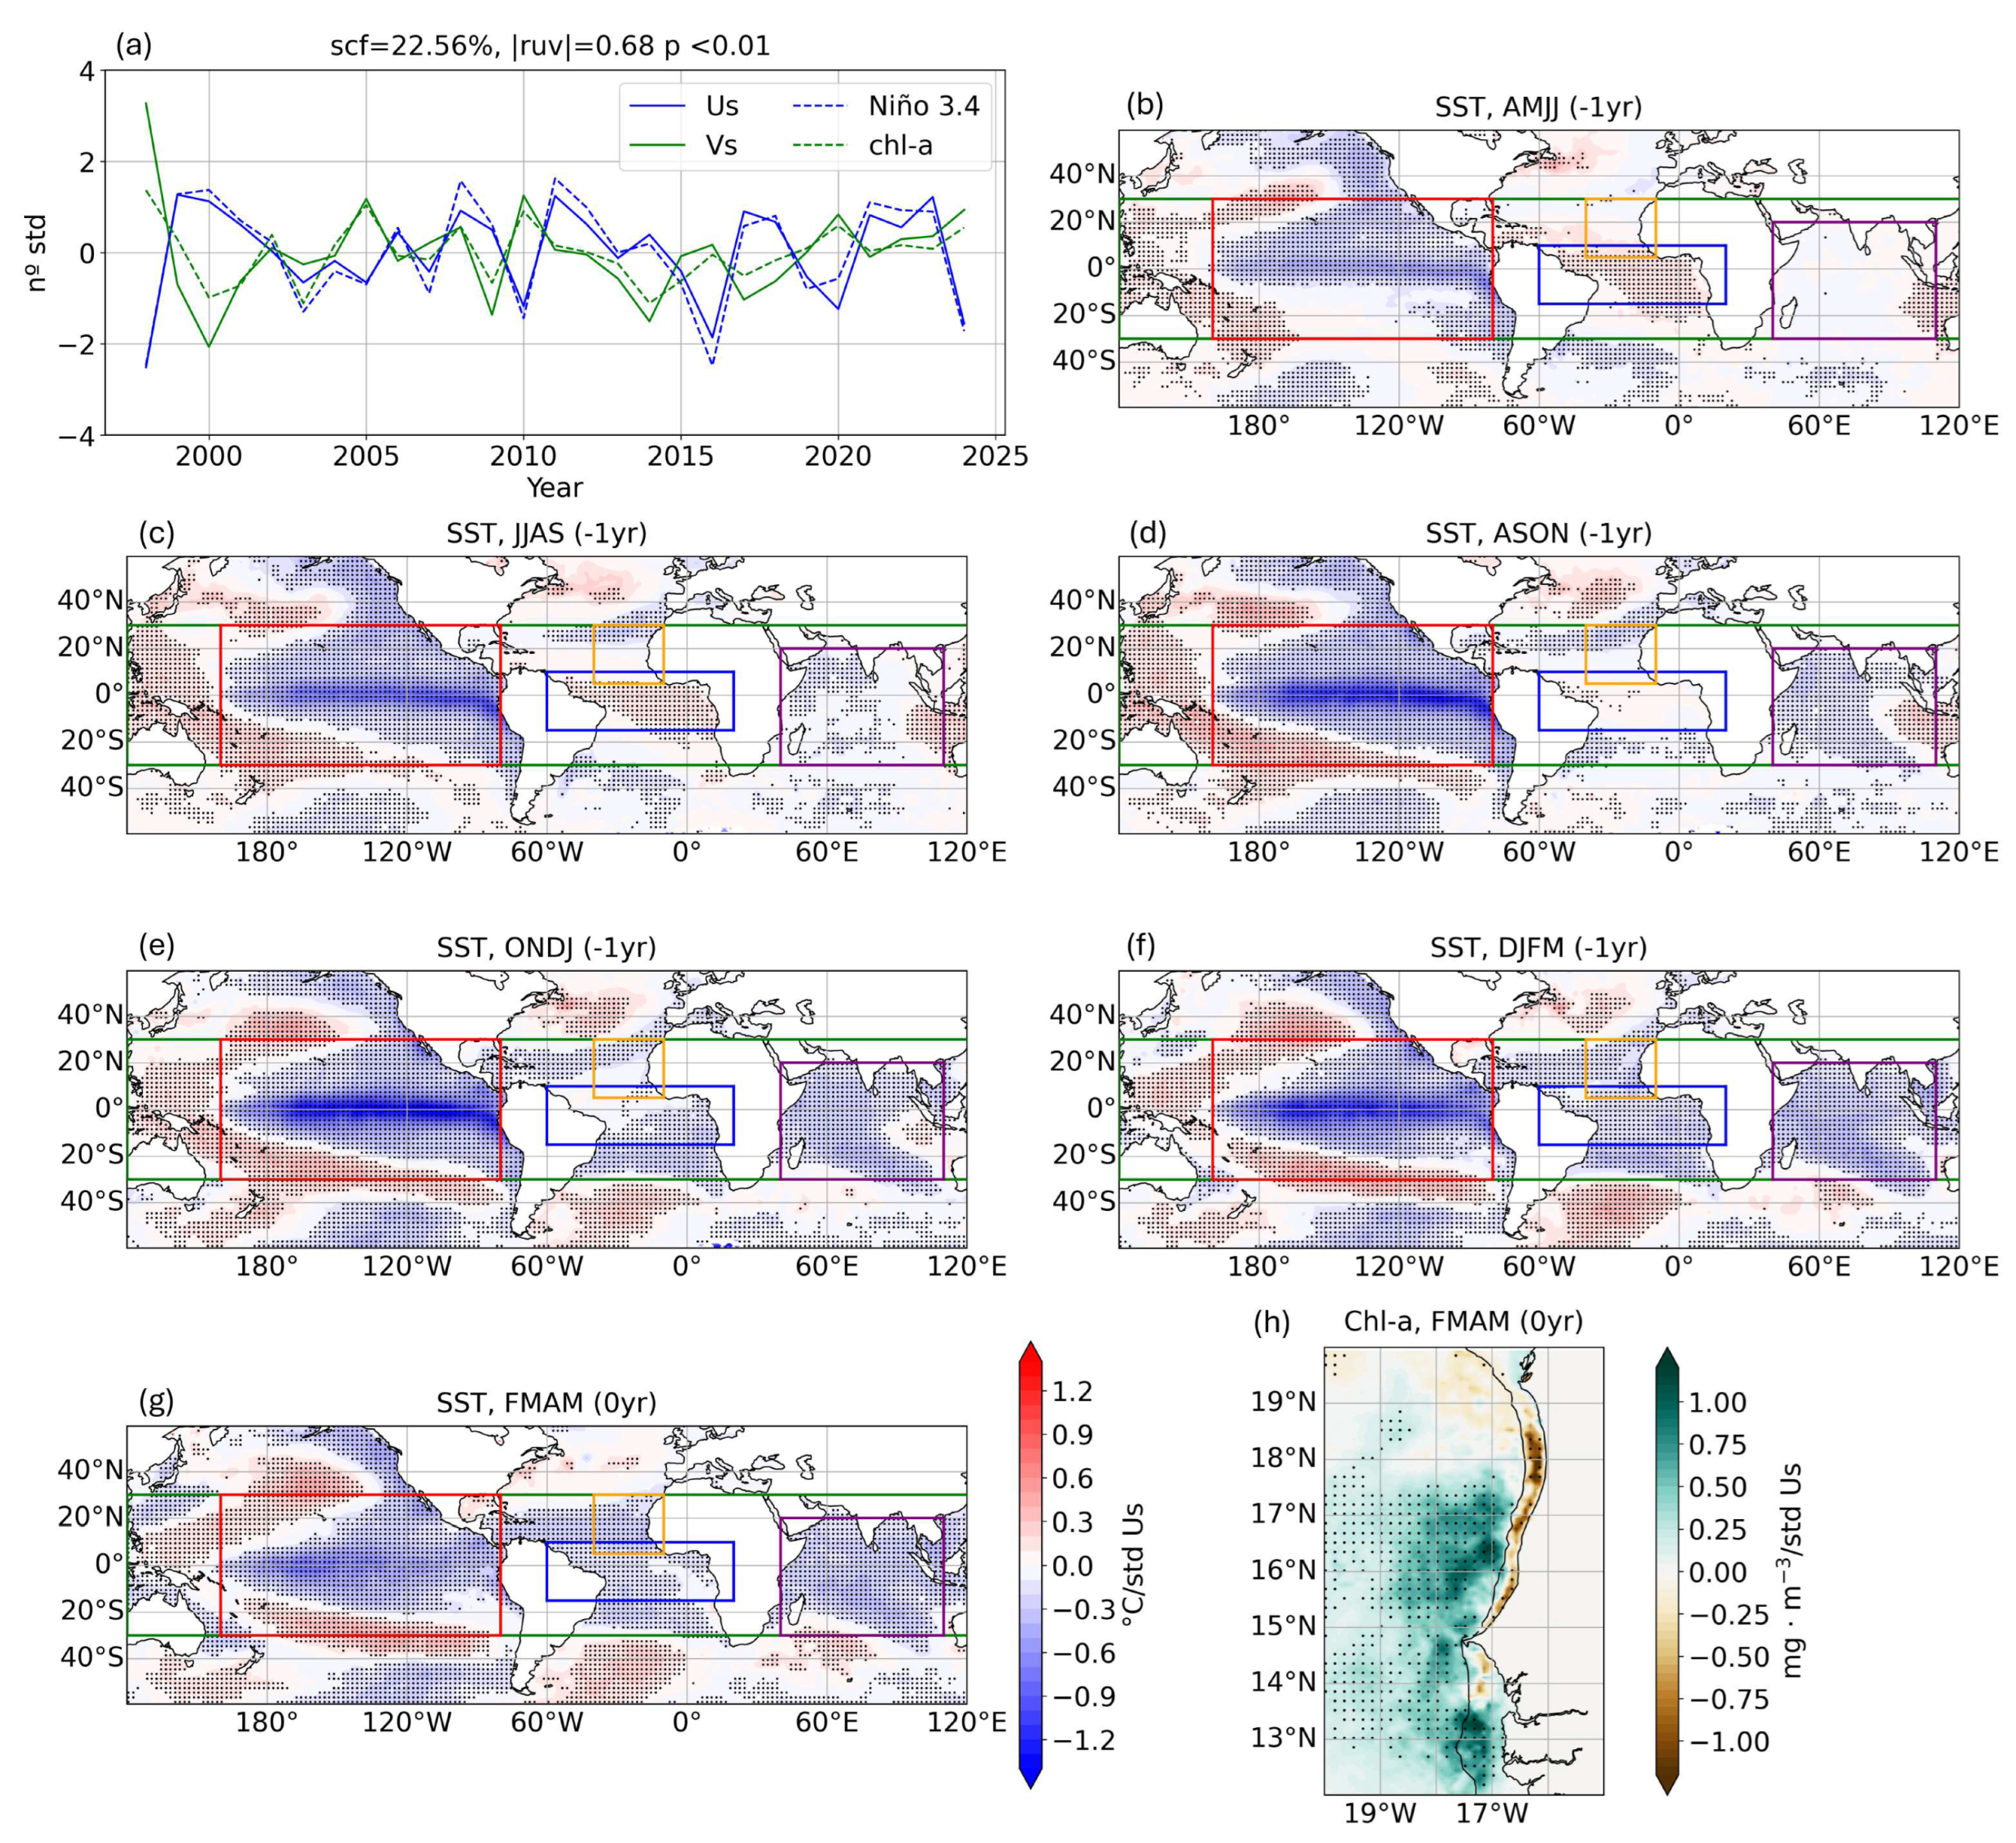
Figure 3.
Cross-validated prediction skill maps derived from Spy4CAST. Each row represents a different season/lead time of the Sea Surface Temperature (SST) relative to chlorophyll-a (chl-a) in FMAM (0yr) for the period 1998-2024, from top to bottom: AMJJ (-1yr)/-10 months, JJAS (-1yr)/-8 months, ASON (-1yr)/-6 months and ONDJ (-1yr)/-4 months. Column (a): Homogeneous SST (colors, ∘C/std) regression map derived from the leading co-variability mode between tropical SSTs and chlorophyll-a (chl-a) in the Mauritanian-Senegalese Coastal Upwelling (MSCU). Only values significant at the 95% confidence interval based on a Monte Carlo test are shown. Regressions onto atmospheric variables are also included: geopotential height at 200 hPa (contours, m2 s−2/std) and surface tropical (30∘N–30∘S) winds (arrows, m s−1/std). Significant values at the 95% level are indicated in black contours/arrows. Column (b): Heterogeneous regression map of chl-a (mg m−3/std) over the MSCU region in FMAM (0yr). Dots indicate significance at the 95% confidence interval according to a Monte Carlo test. The 100 m isobath is shown as a black line, representing the continental shelf. Columns (c) to (g): Skill maps as an Anomaly Correlation Coefficient (ACC) between observed chl-a fields and the corresponding cross-validated hindcasts reconstructed using MCA-derived information from SSTs in the: (c) tropics, (d) Pacific Ocean, (e) Indian Ocean, (f) equatorial Atlantic, and (g) Tropical North Atlantic (TNA). Dots indicate significance at the 95% confidence interval based on a t-test. The MCA mode (m) used for the chl-a field reconstruction is indicated above each map, along with the correlation coefficients between the expansion coefficients Us and Vs from the Extended Maximum Covariance Analysis (EMCA, Figure 2) and those of the selected MCA mode (ruu and rvv, respectively). Asterisks denote correlations that are statistically significant at the 95% confidence interval based on a t-test.
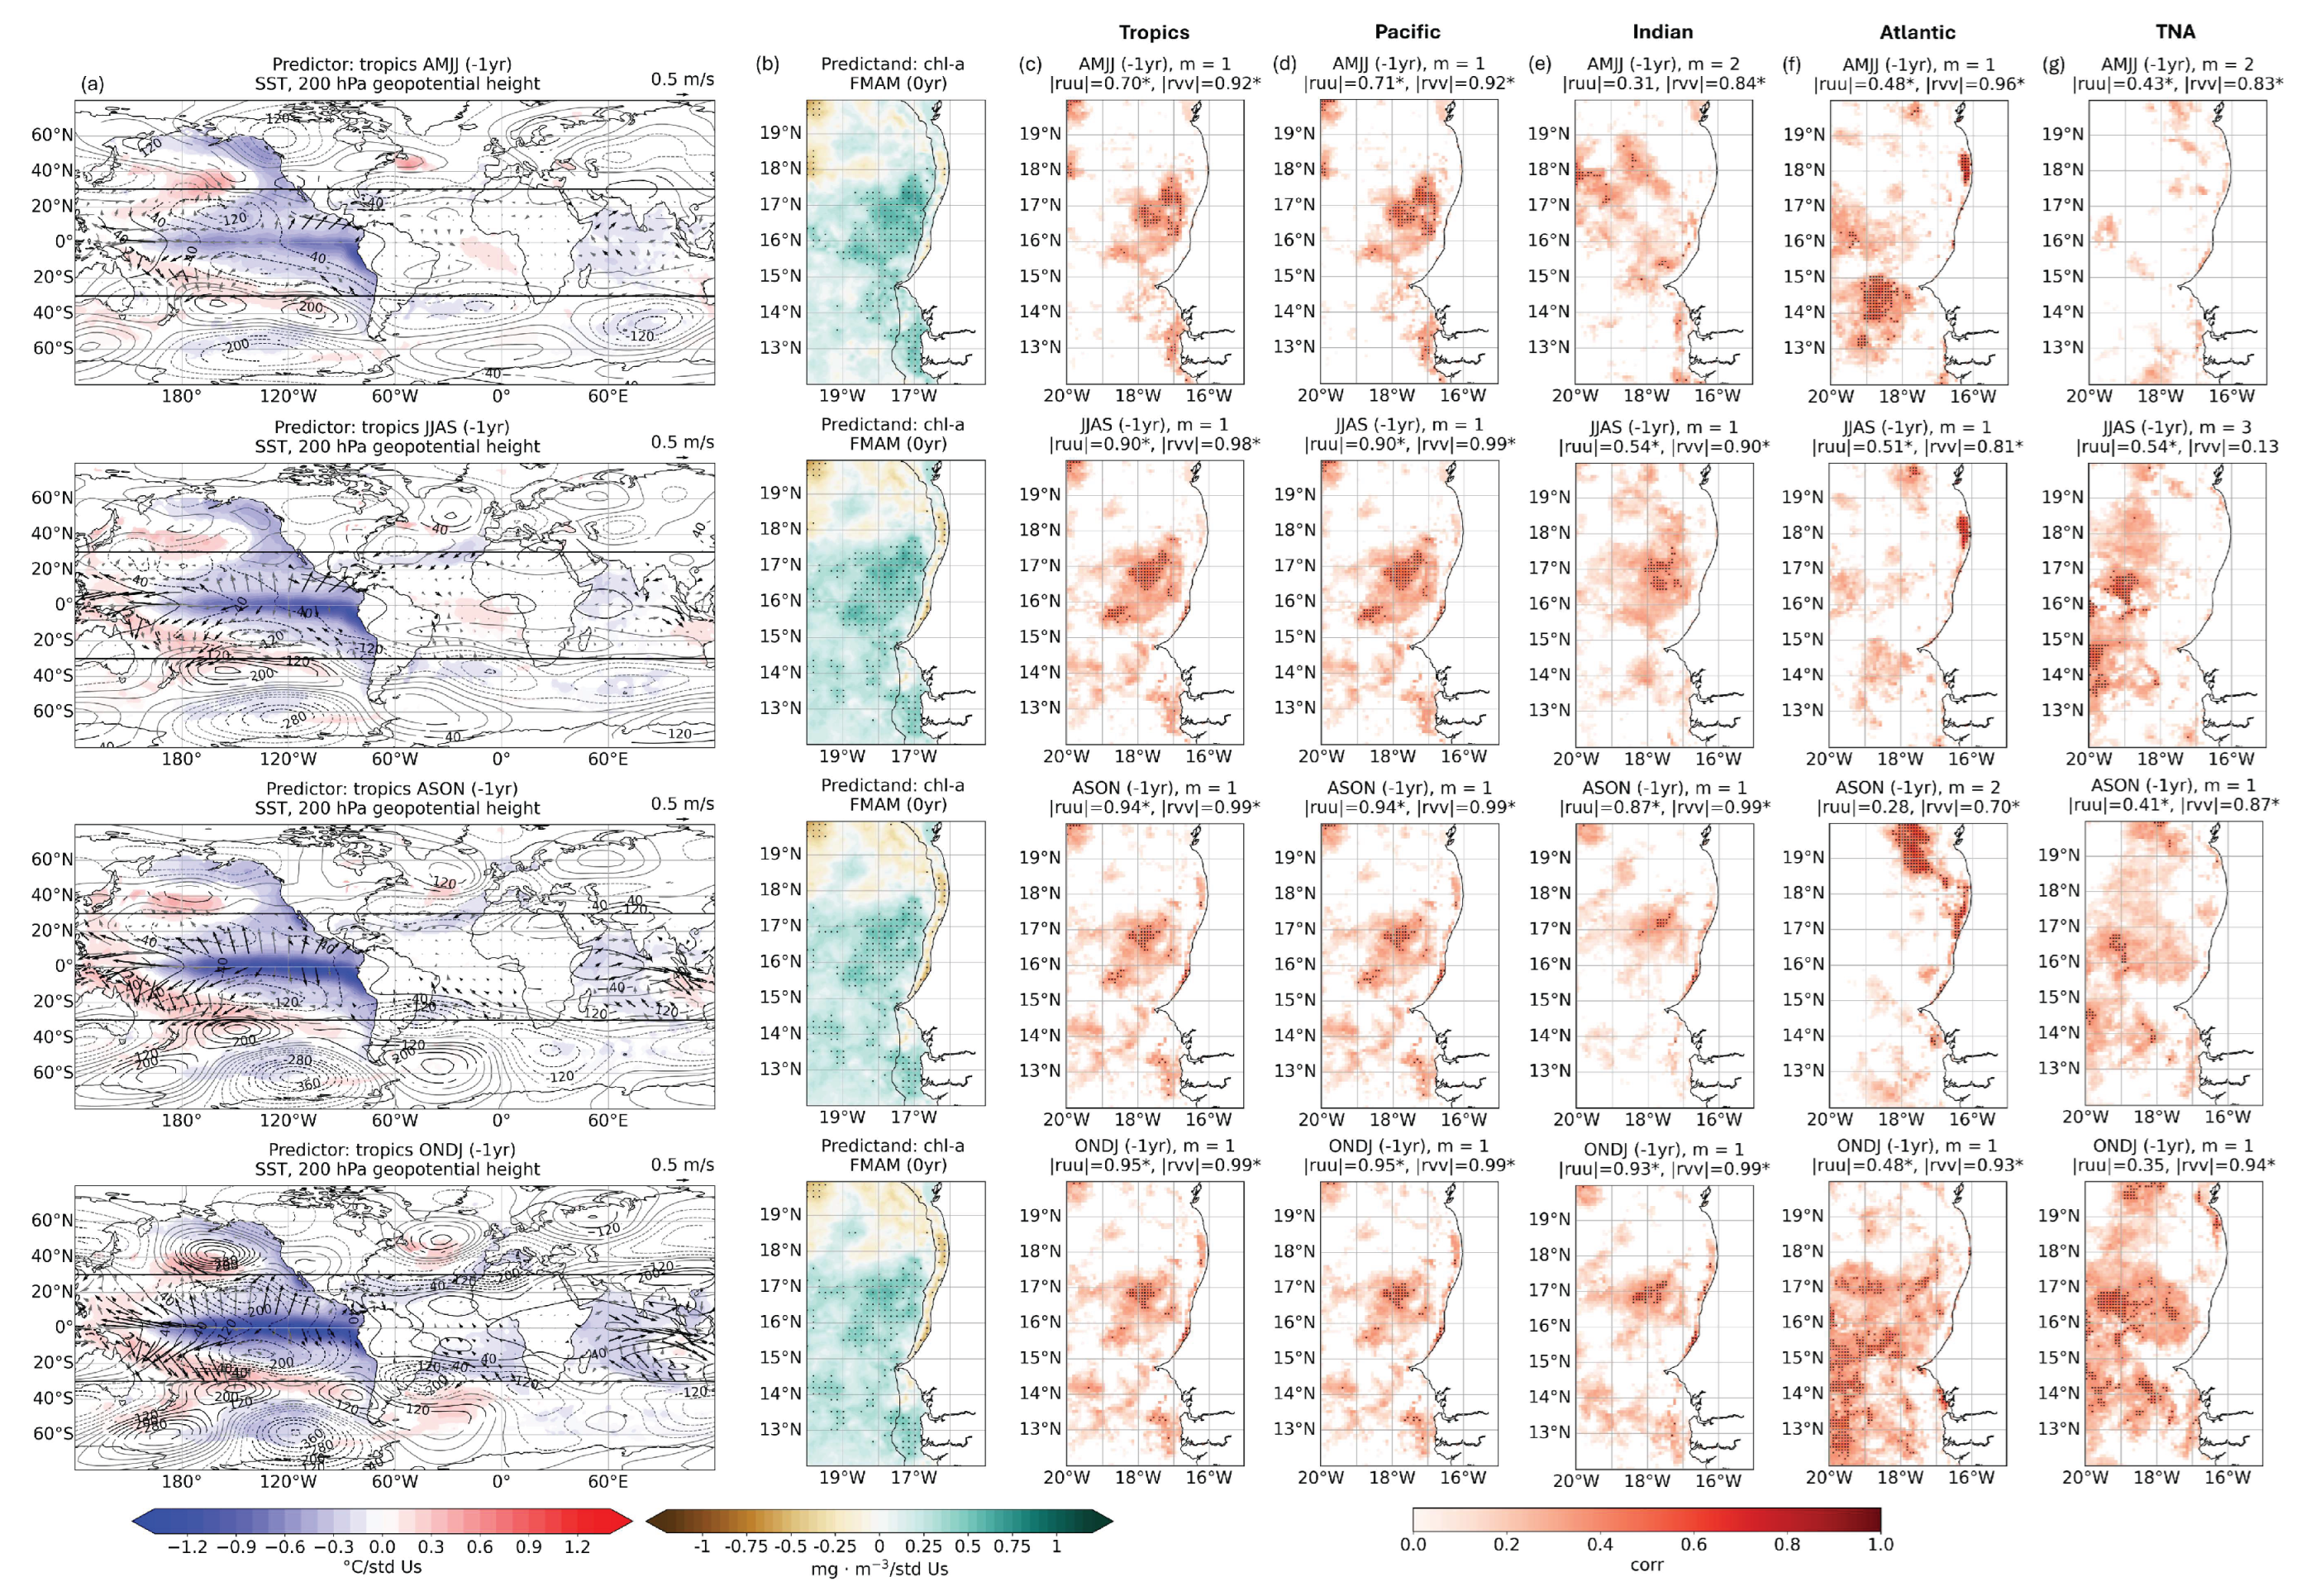
Figure 4.
Cross-validated prediction skill maps derived from NN4CAST. Skill maps as an Anomaly Correlation Coefficient (ACC) between observed chl-a fields and those reconstructed using a neuronal network information from SSTs in the: column (a) tropics, column (b) Pacific Ocean, column (c) Indian Ocean, column (d) equatorial Atlantic, and column (e) Tropical North Atlantic (TNA). Each row corresponds a different season/lead time of the Sea Surface Temperature (SST) relative to chlorophyll-a (chl-a) in FMAM (0yr), covering the period 1998–2024. From top to bottom: AMJJ (-1yr)/-10 months, JJAS (-1yr)/-8 months, ASON (-1yr)/-6 months and ONDJ (-1yr)/-4 months. Dots indicate significance at the 95% confidence interval based on a t-test. Grey contours highlight areas where Spy4CAST does not exhibit skill.
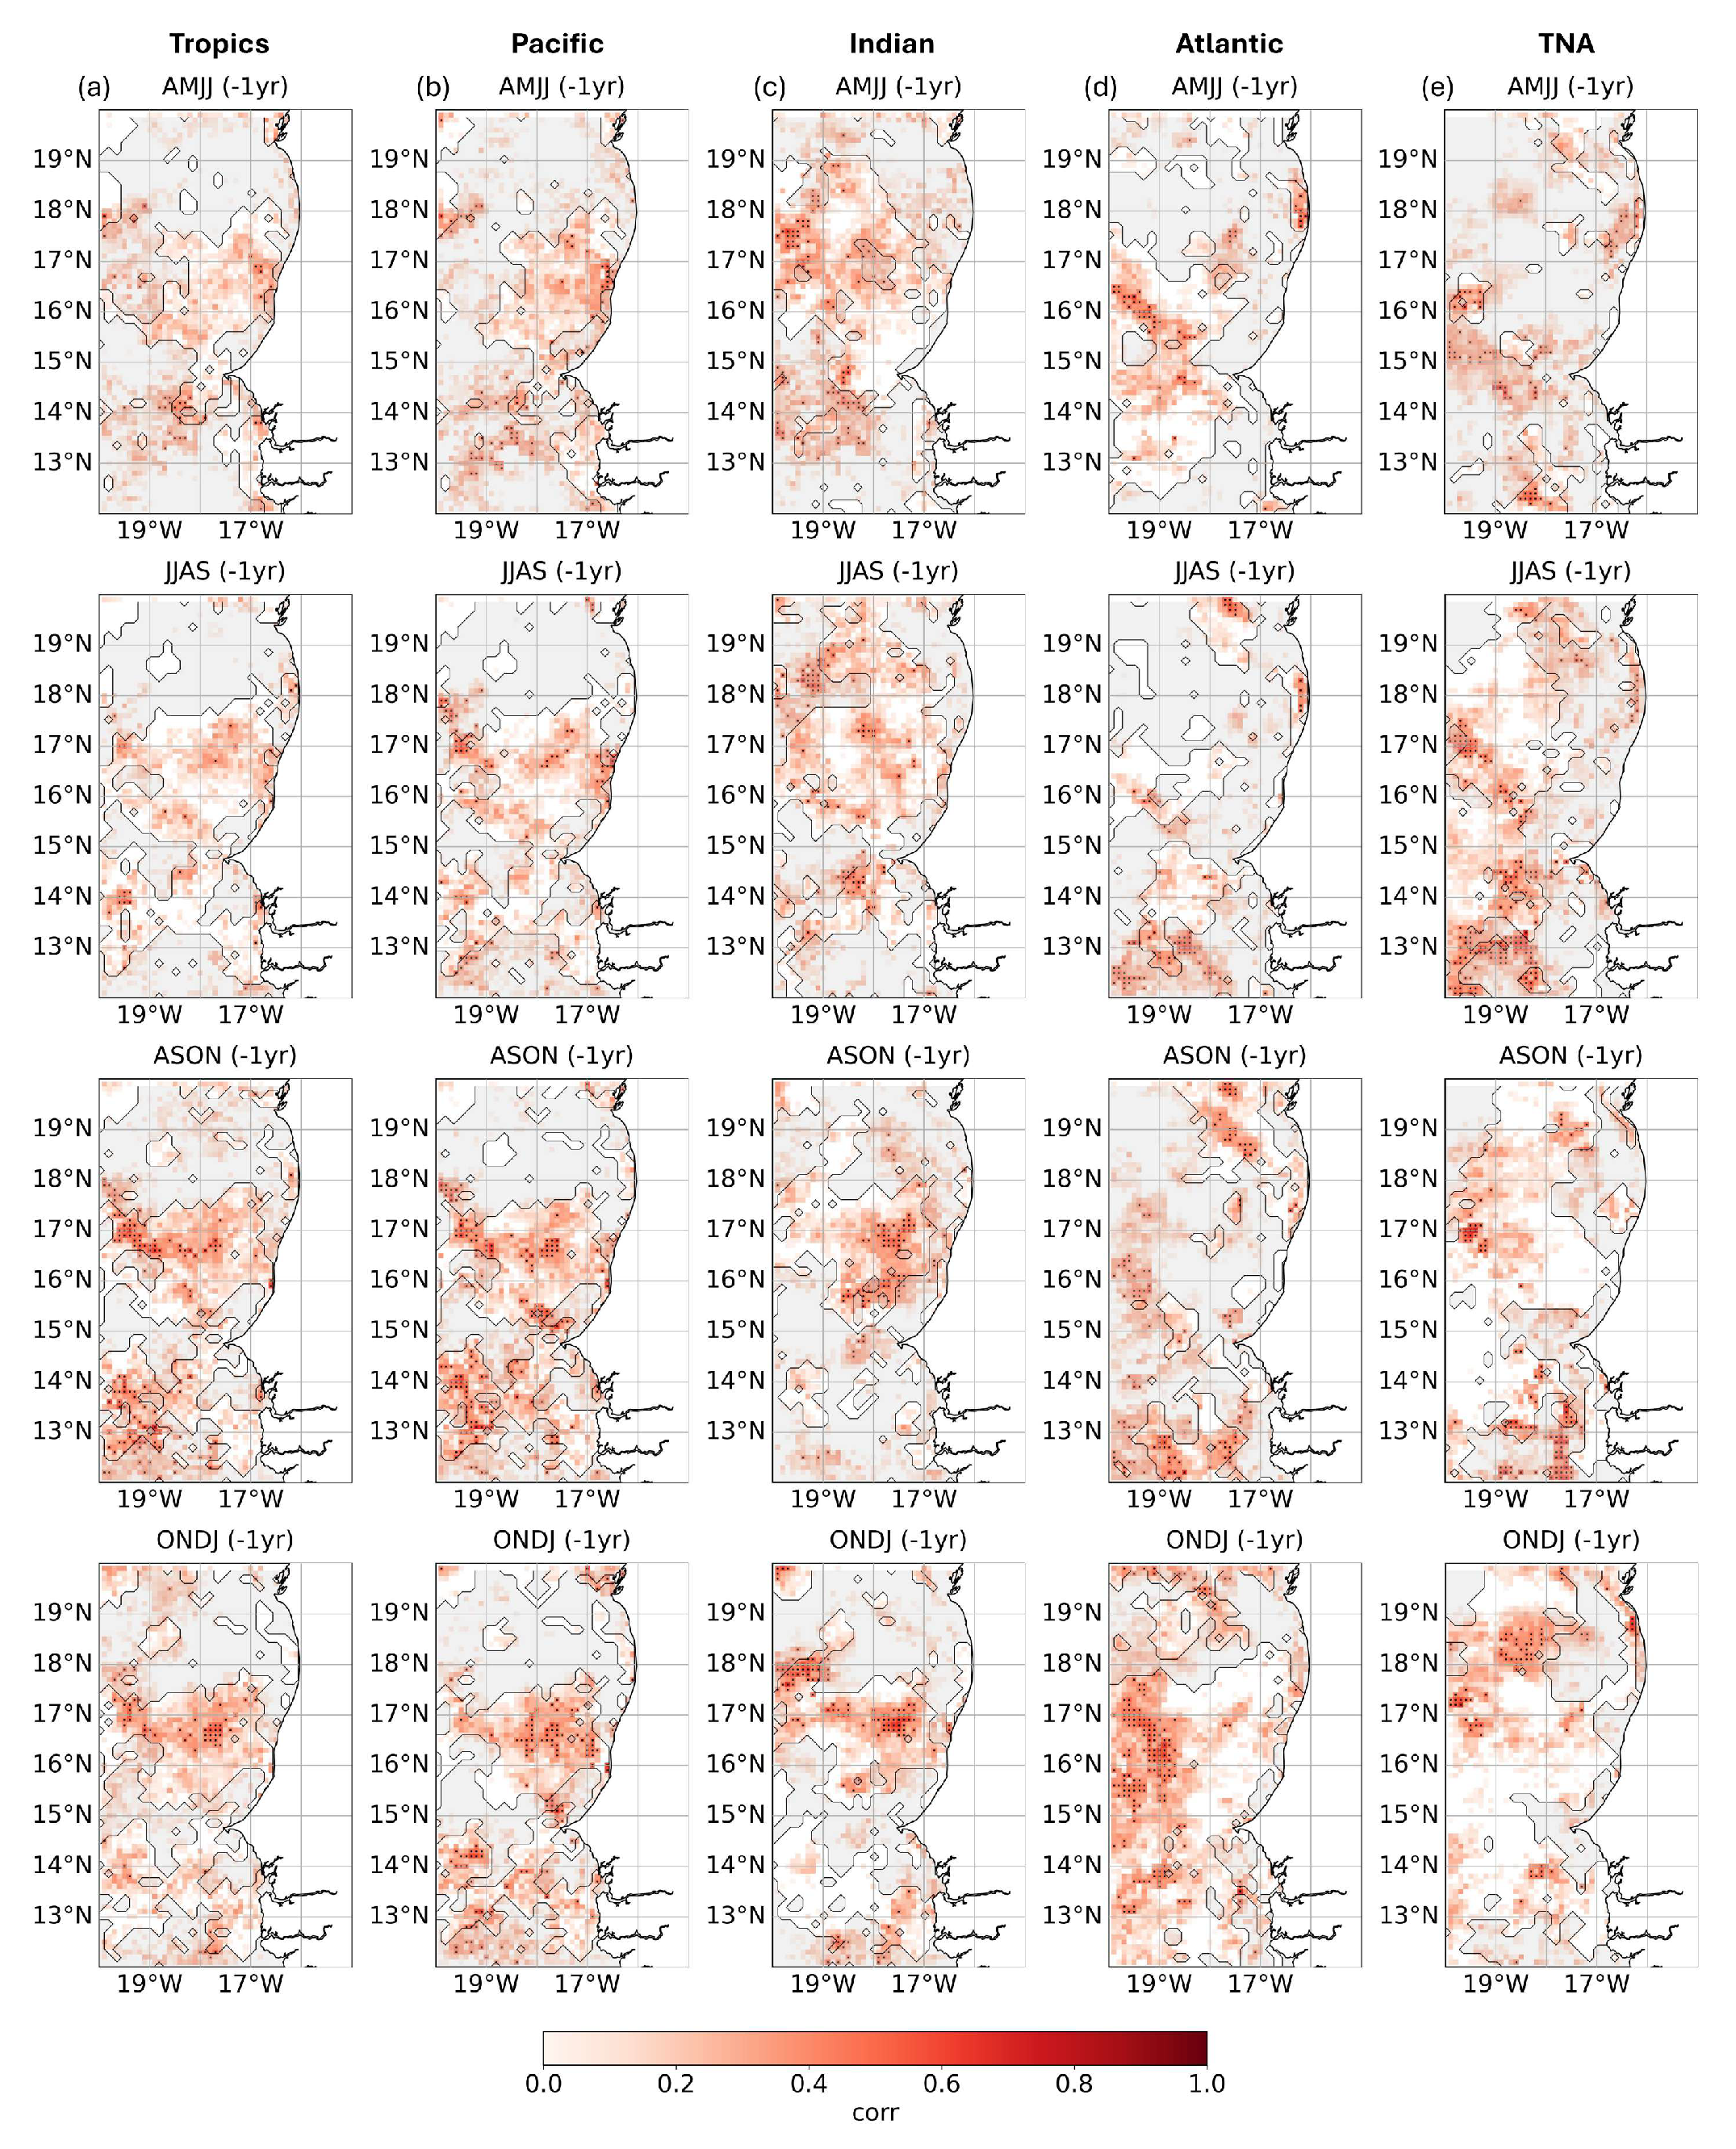
Figure 5.
Evolution of global anomalous SSTs regressed onto the Atlantic mode in AMJJ (yr-1) impacting on chlorophyll-a (chl-a). Regression maps of the Us expansion coefficient resulting from the Maximum Covariance Analysis (MCA) between equatorial Atlantic SSTs in AMJJ (-1yr) and chl-a concentration in the Mauritanian-Senegalese Coastal Upwelling (MSCU) in FMAM (0yr) projected onto the global SSTs (colors, ∘C/std), 200 hPa geopotential height (contours, m2 s−2/std) and, tropical (30∘N–30∘S) winds (arrows, m s−1/std). Maps correspond to (a) DJFM (-2yr), (b) FMAM (-1yr), (c) AMJJ (-1yr), (d) JJAS (-1yr), (e) ASON (-1yr), and (f) ONDJ (-1yr). The black box in panel (c) denotes the equatorial Atlantic region used in the MCA. Only SST values significant at the 95% confidence interval based on a Monte Carlo test are shown. Statistically significant anomalies in geopotential height and winds are outlined with black contours and arrows, respectively.
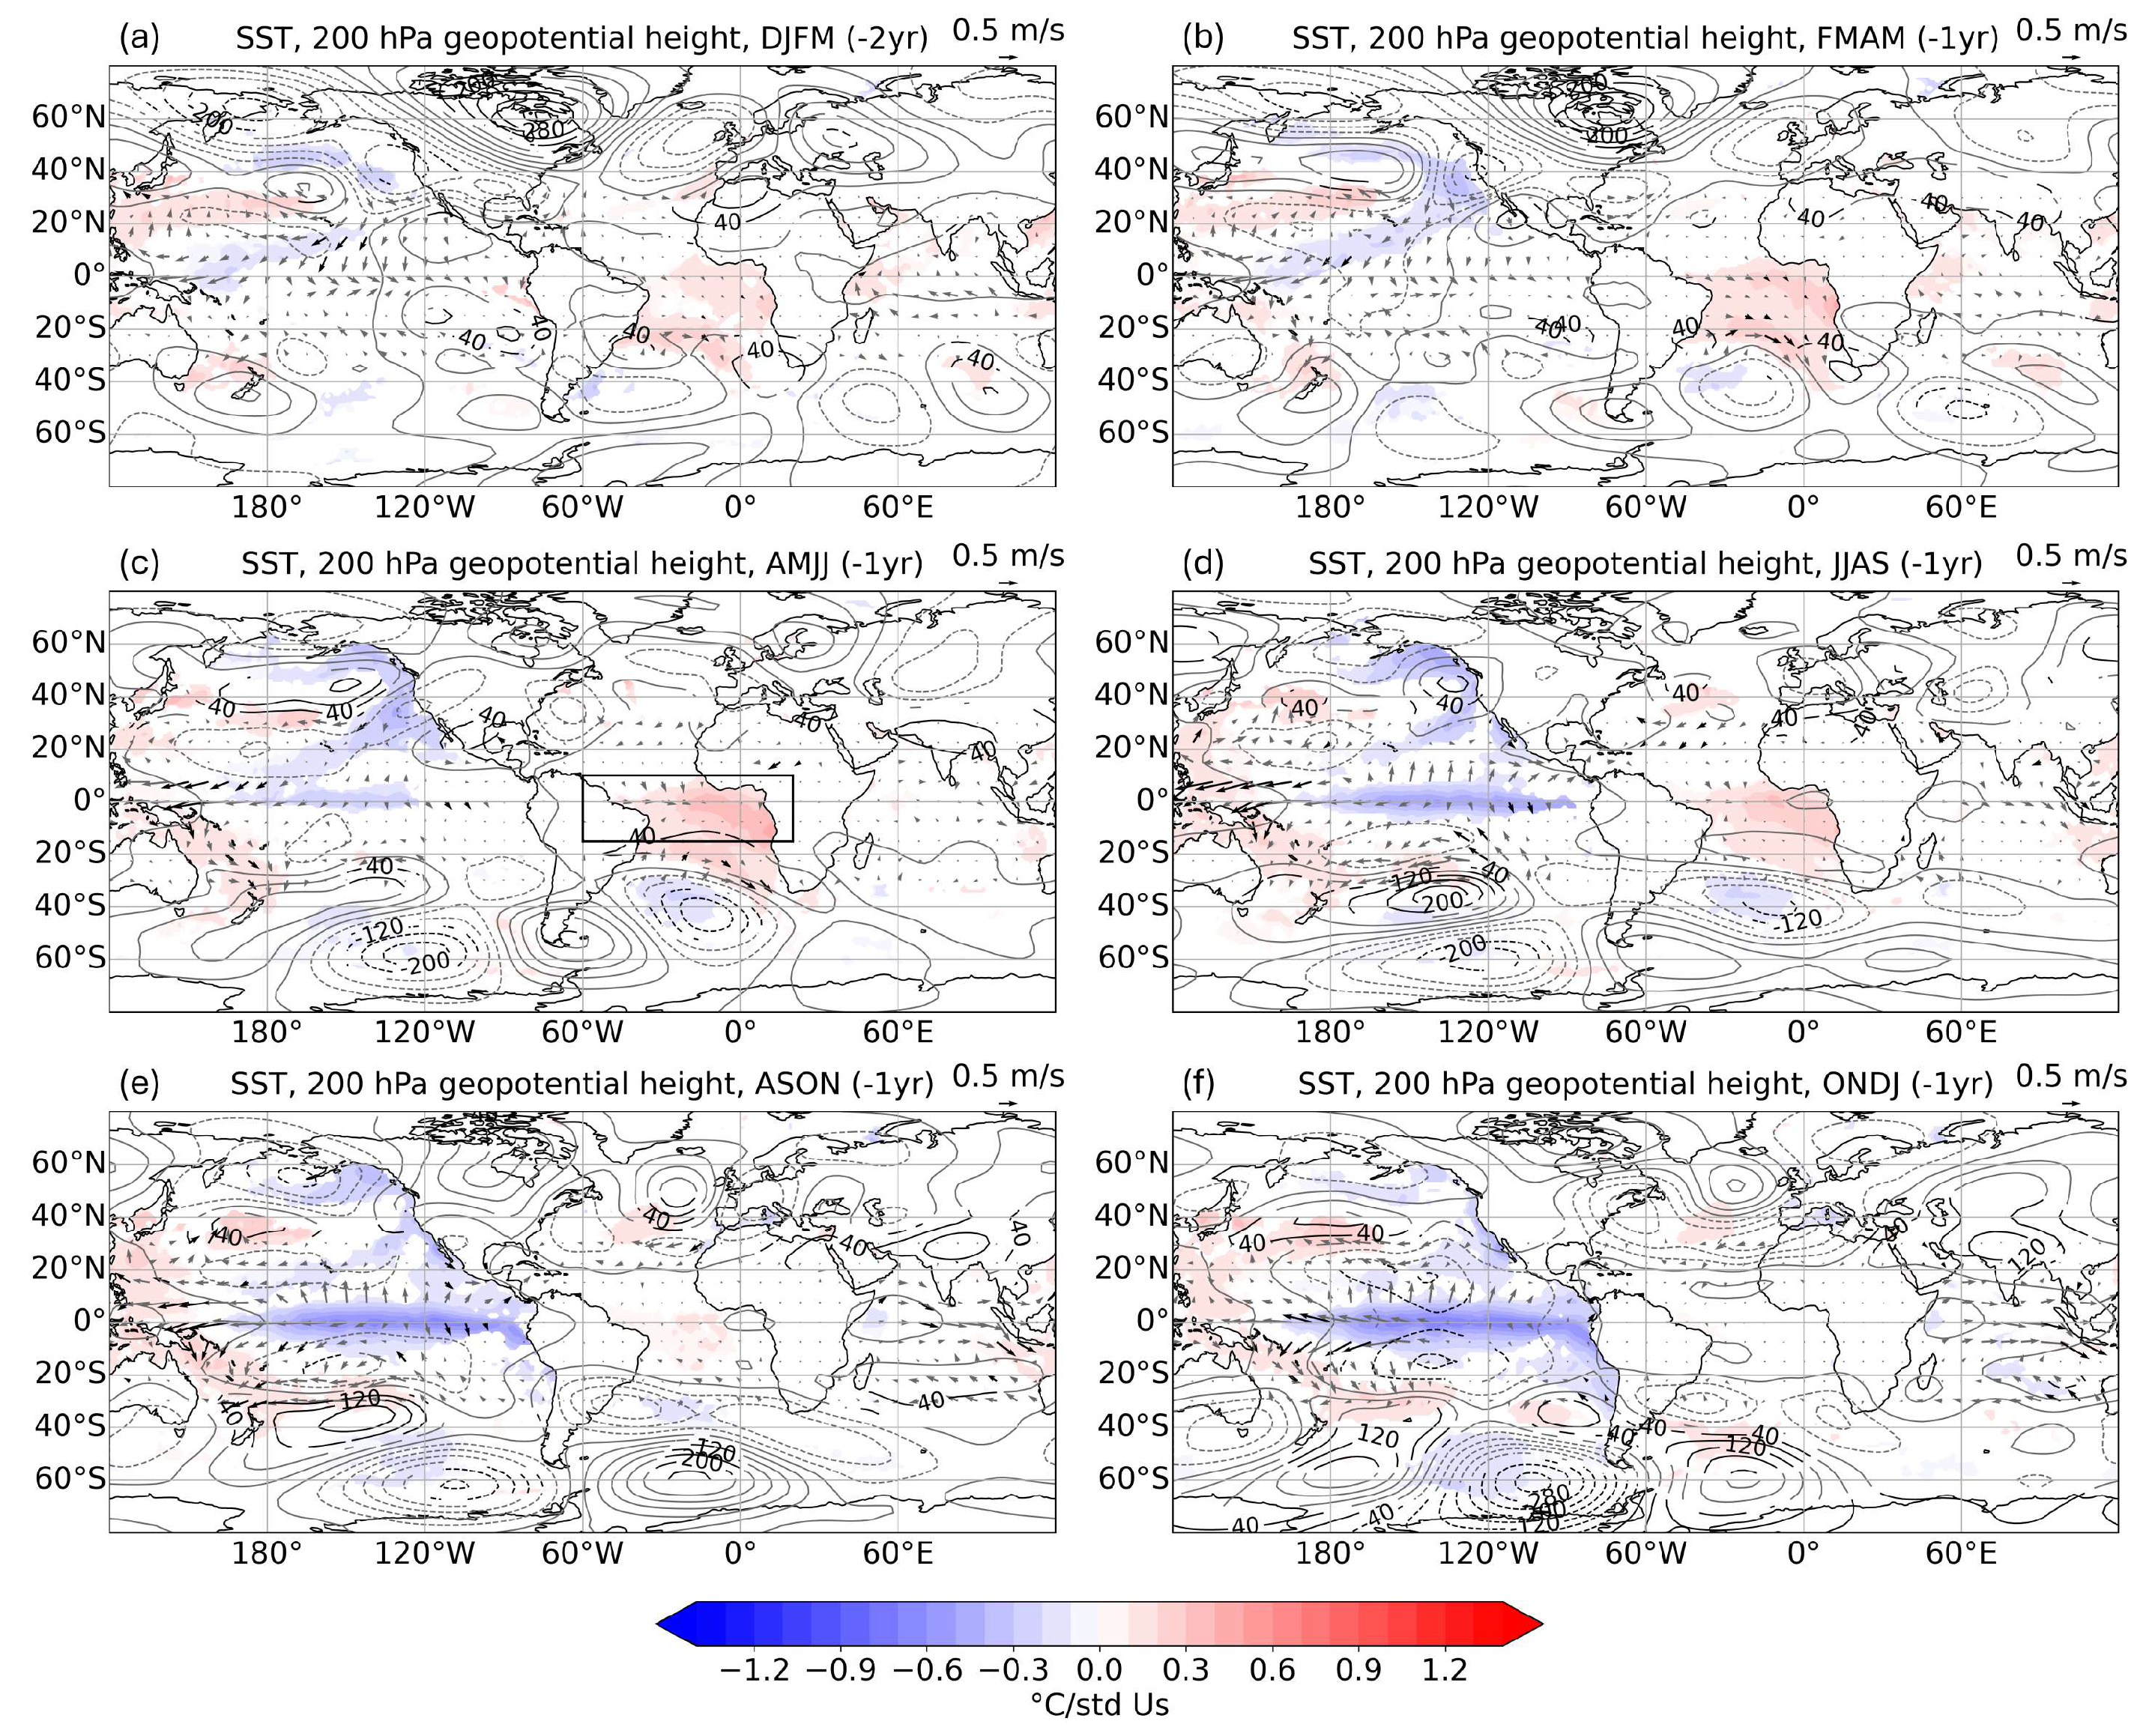
Figure 6.
Atmospheric impact of the co-variability modes and associated chlorophyll-a (chl-a) response. (a) Regression maps of the Us expansion coefficient resulting from the Maximum Covariance Analysis (MCA) between equatorial Atlantic SSTs in AMJJ (-1yr) and chlorophyll-a (chl-a) concentration in the Mauritanian-Senegalese Coastal Upwelling (MSCU) during FMAM (0yr) projected onto the 200 hPa geopotential height (contours, m2 s−2/std), Sea Level Pressure (SLP, colors, Pa/std) and winds (arrows, m s−1/std) in FMAM (0yr). The zero geopotential height contour is shown in white; positive (negative) contours are in red (blue), drawn every 40 m2 s−2. Thick contours, black dots in the SLP field, and black arrows indicate significance at the 95% confidence interval based on a Monte Carlo test (with significant meridional wind components only). (b) Heterogeneous regression map of chl-a anomalies (mg m−3/std) in FMAM (0yr) associated with the MCA mode using equatorial Atlantic SSTs in AMJJ (-1yr). The continental shelf break (100 m isobath) is shown in black. (c), (d) Same as (a), (b), but for the MCA mode between Pacific SSTs in AMJJ (-1yr) and MSCU chl-a in FMAM (0yr). (e), (f) Same as (a), (b), but using the expansion coefficient from the Extended Maximum Covariance Analysis (EMCA) described in Figure 2.
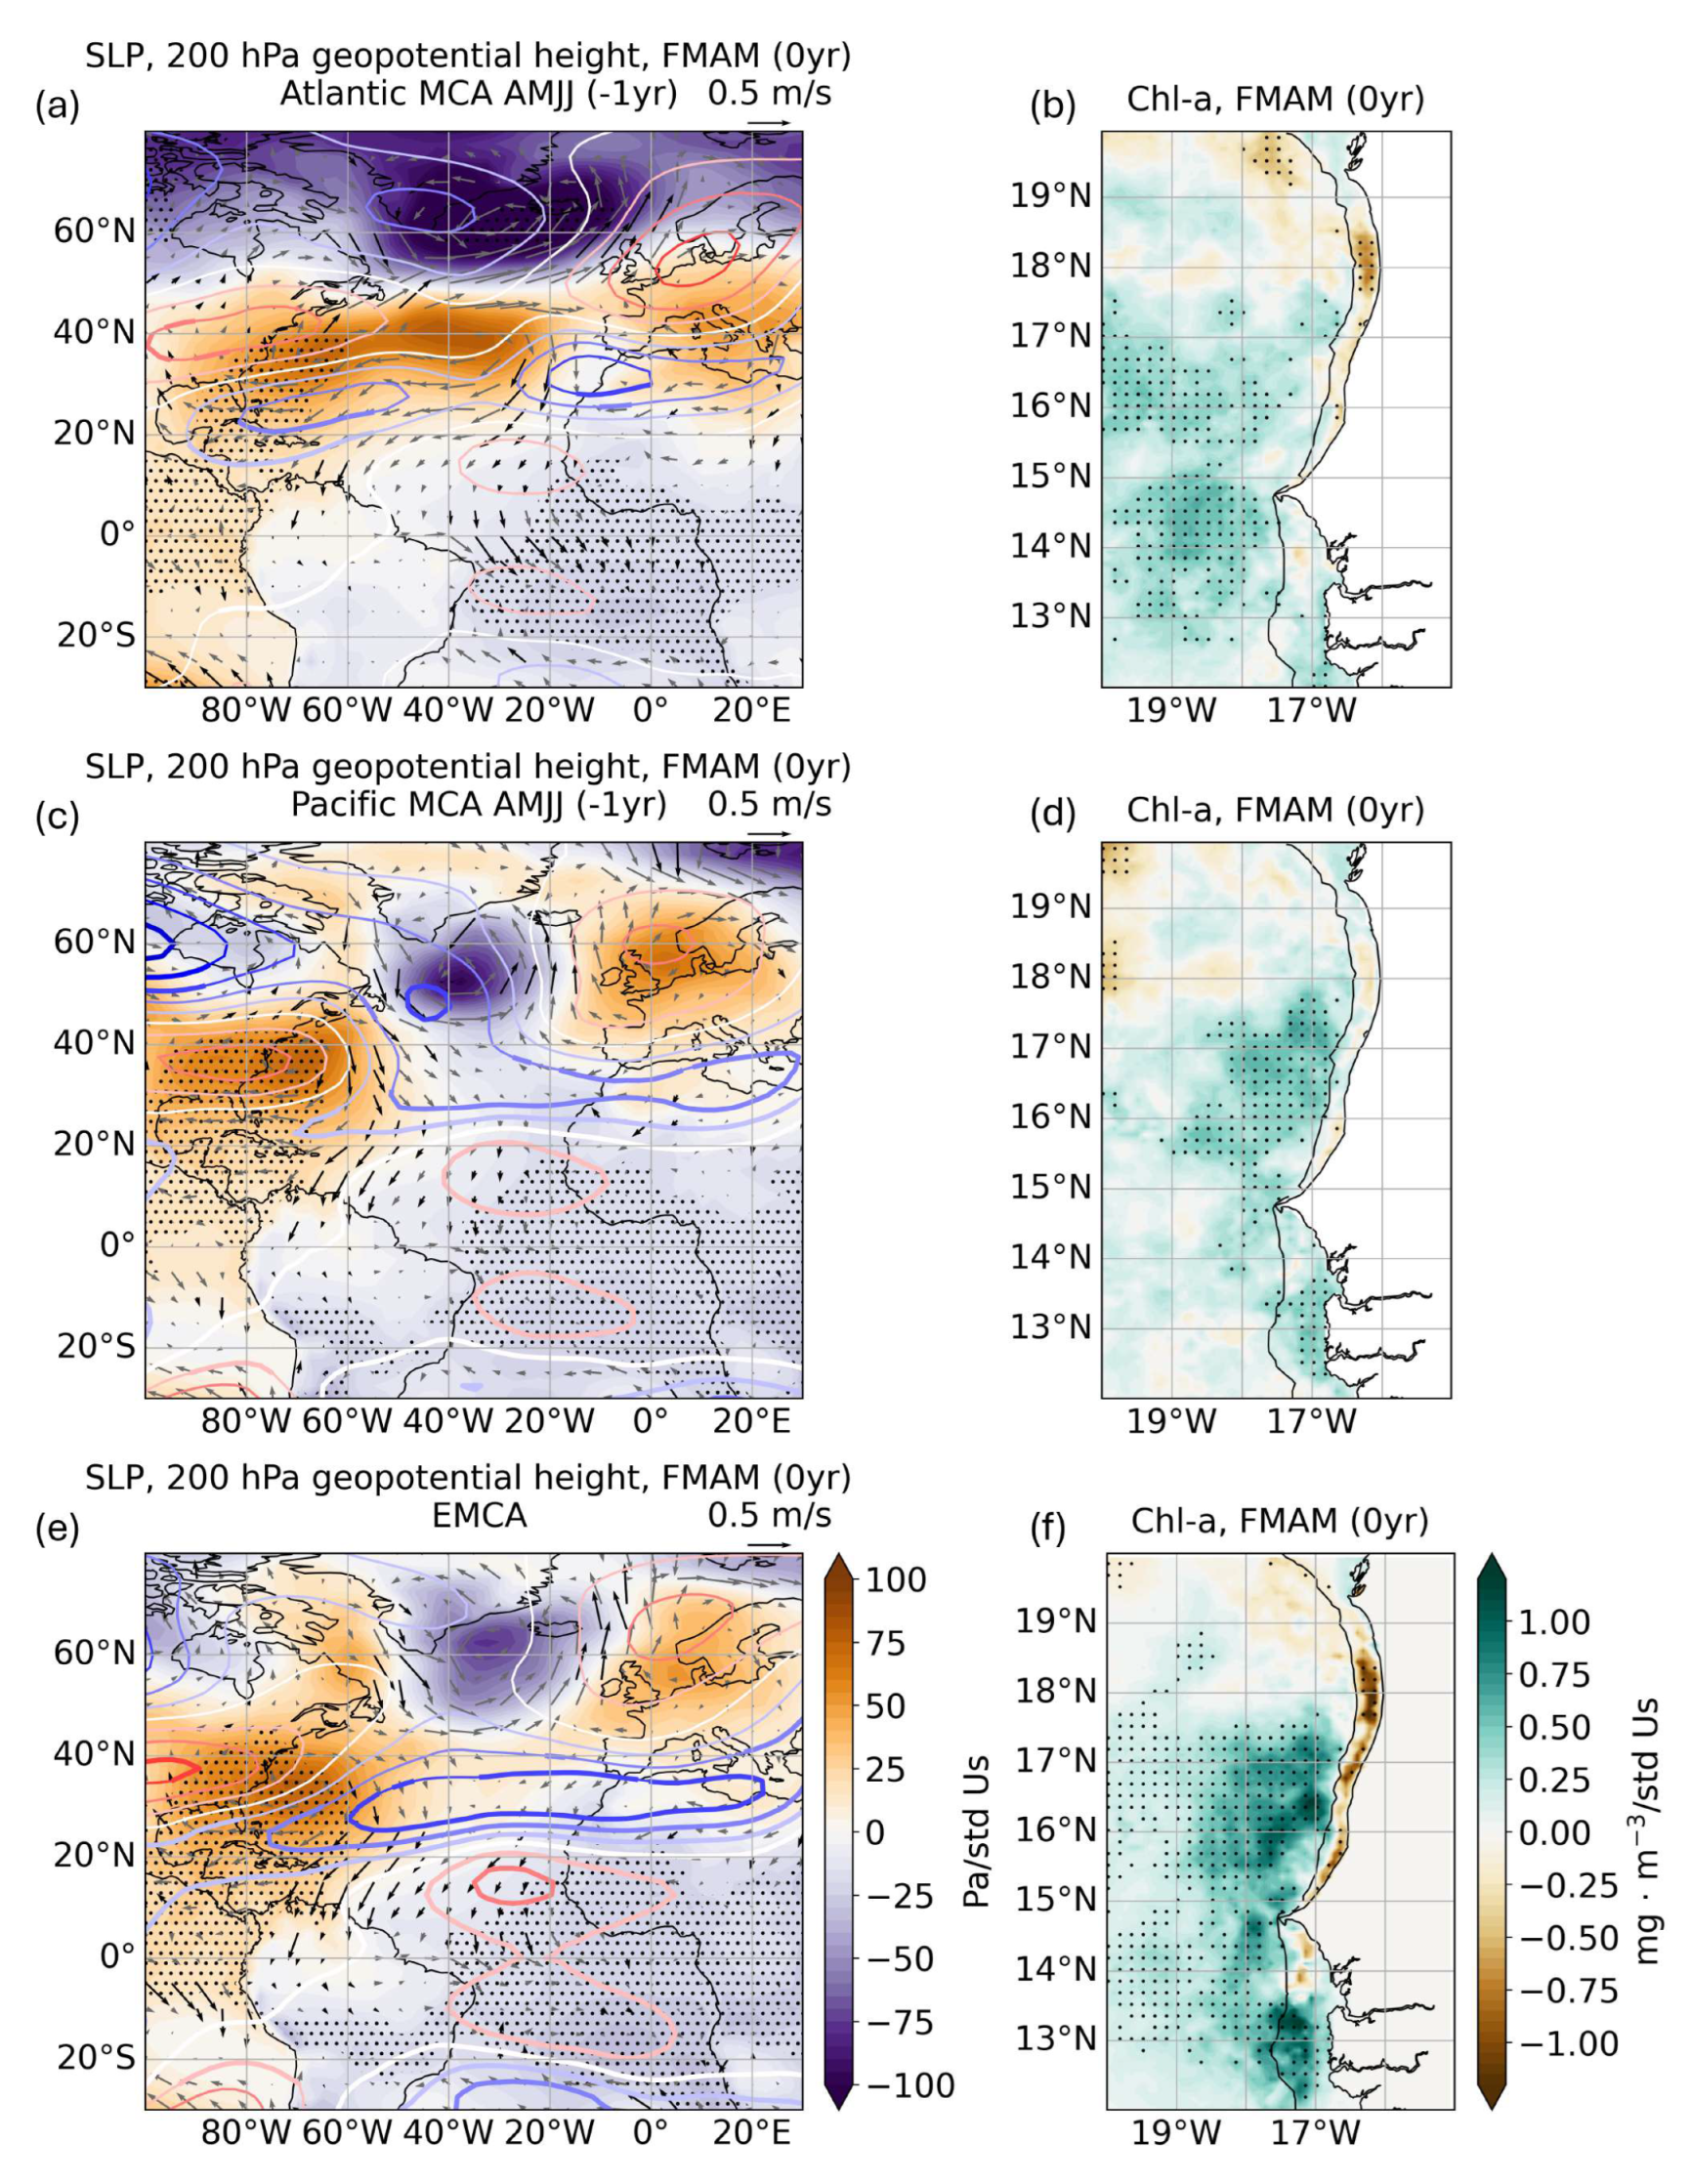
Figure 7.
Correlation coefficient between the observed chlorophyll-a (chl-a) anomalous index and the reconstructed chl-a anomalous index in FMAM (0yr), calculated only over areas with skill (Figure 4), for all Sea Surface Temperature (SST) predictors (tropics (green), Pacific (red), Indian (purple), equatorial Atlantic (blue) and Tropical North Atlantic (TNA, orange)) and all seasons/lead time of the SST relative to chl-a (AMJJ (-1yr)/10 months, JJAS (-1yr)/8 months, ASON (-1yr)/6 months and ONDJ (-1yr)/4 months). The percentage of grid points contributing to the anomalous index - i.e., where skill is positive - is indicated by a black cross. The percentage of grid points with both positive skill and statistical significance at the 95% confidence interval based on a t-test is indicated by a grey cross. (a) and (c) show reconstructions obtained with Spy4CAST, while (b) and (d) use NN4CAST. The chl-a anomalous index is computed over the northern domain (15-18∘N) in (a) and (b), and over the southern domain (12-15∘N) in (c) and (d).
Disclaimer/Publisher’s Note: The statements, opinions and data contained in all publications are solely those of the individual author(s) and contributor(s) and not of MDPI and/or the editor(s). MDPI and/or the editor(s) disclaim responsibility for any injury to people or property resulting from any ideas, methods, instructions or products referred to in the content. |
© 2025 by the authors. Licensee MDPI, Basel, Switzerland. This article is an open access article distributed under the terms and conditions of the Creative Commons Attribution (CC BY) license (http://creativecommons.org/licenses/by/4.0/).
Copyright: This open access article is published under a Creative Commons CC BY 4.0 license, which permit the free download, distribution, and reuse, provided that the author and preprint are cited in any reuse.


