Submitted:
03 June 2025
Posted:
04 June 2025
You are already at the latest version
Abstract
It is imperative to investigate the behaviour of droplet superimposed condensation of deltamethrin reagent on the strawberry leaf surface, and the dynamic variation rule of its contact angle. The microinjector was utilised to conduct the experiment of droplet superposition and condensation. The surface tension of deltamethrin droplets was measured by means of an optical contact angle meter, and the wetting parameters such as contact angle, volume and spreading diameter were obtained by observing the leaf surfaces of various parts of strawberries during the dynamic process of superimposed condensation. A model was constructed by establishing the relationship between the contact angle and the coordinates of the observation point and time through the spatial fitting interpolation method. This model is a three-dimensional dynamic trend surface model of contact angle for droplet superposition and condensation. The findings indicated that the surface tension of the deltamethrin drop was 28.92 ± 0.2 mN·m-1. The interval between the superposition of two droplets and the subsequent condensation of a new droplet was found to be within 0.5 seconds. The time taken for a new droplet to form was found to be between 0.0356 and 0.0476 seconds.The change of contact angle during the processes of superposition and coalescence can be broadly categorised into three distinct stages: namely, sharp oscillation, slight decrease and gentle stabilisation. The volume of the new droplet formed by the superposition and condensation was found to be 1.05 to 1.93 times that of a lying droplet. 1.93 times that of a lying droplet. The maximum increase in the spreading diameter of the superimposed and condensed droplets was 40.29%.The three-dimensional dynamic trend surface model can reflect the overall spatial-temporal change trend of the contact angle in the process of superposition and coalescence. The model successfully passed the overall significance F test and each coefficient of statistical T test, and demonstrated a satisfactory time interpolation effect. The experimental verification demonstrates that the predicted contact angle value of the model is consistent with the measured value.
Keywords:
dynamic wetting process monitoring
; deltamethrin reagent
; strawberry leaf
; superposition and condensation
; dynamic contact angle
; 3D dynamic trend surface model
1. Introduction
Dynamic contact angle is a pivotal metric for evaluating the wetting performance of liquid droplets on crop surfaces. It is imperative to note that the process of spraying is inherently dynamic. The collision and condensation of liquid droplet particles on the target crop surface (boundary) is a constant process. The superposition and coagulation behaviour of these particles leads to significant alterations in the contact angle, which in turn has a direct impact on the spreading, deposition and retention of liquid droplets on the crop surface. This, in turn, affects the efficacy of drug application [1,2,3,4,5]. The present study aims to investigate and develop a model to predict the trend of contact angle change in the process of superposition and condensation of liquid droplets on crop surfaces. This study aims to optimise the pesticide spraying programme, enhance the precision application technology, and improve the wetting performance of the liquid on the target surface [6,7,8,9,10]. This is of great significance in reducing the loss of pesticide liquid and improving the utilization rate of pesticide.
In recent years, the study of collision behaviour at the interface between liquid droplets and crop targets has become a very active research direction in the field of pesticide application and plant protection engineering [11,12,13,14,15,16,17]. For instance, Taylor, Gatne, and Appah et al. (2009-2020) utilised a high-speed camera to document alterations in the dynamic contact angle of falling droplets. Their findings revealed that the dynamic contact angle of the crop foliar deposition exhibited a negative correlation. Furthermore, the impact of the forward angle on wetting behaviour was found to be more pronounced on hydrophobic crop surfaces than on contact angles after stabilisation [18,19,20]. Building on these findings, Ding Weilong et al. (2017) utilised a macro high-speed camera to make precise measurements of the static contact angle magnitude of droplets on leaves with varying inclination angles. They proposed a simulation method for the interaction behaviour of droplets with plant leaves with different inclination angles. This provides a technical reference for the calculation of deposition of plant canopies interacting with a large number of droplets [21]. The proposed method is designed to serve as a technical reference for the calculation of the deposition volume of plant canopies interacting with a substantial number of droplets. In their study, Zhao Junyi et al. (2021) investigated the effects of the physical properties of pesticides on the size distribution and collision behaviour of fog droplets. To this end, a discrete phase model was employed in conjunction with a stochastic collision model to simulate the motion of different pesticide droplets in space. The study's findings, which are based on the aggregation ratio during the collision process, have led to the proposal of a regulation strategy that can be used in agricultural spraying scenarios [22].
At present, the study of droplet collision behaviour is chiefly dependent on the fluid-orbit model framework. The equilibrium equations for the particle population in the Eulerian coordinate system are frequently employed in the simulation of droplet coalescence behaviour. However, constructing a particle turbulence model for droplet coalescence dynamics events is quite complex and requires coupling with time-driven and event-driven two-phase turbulence-based models. This coupling facilitates the efficient modelling of multidimensional particle swarm equilibrium simulations [23]. However, the practical engineering applications of this theory are hindered by several challenges. These include a lack of theoretical foundations and the complexity of the Eulerian algorithm. Additionally, the process of coupling with other modelling algorithms is difficult. This results in difficulties in reconciling computational cost and computational accuracy, which limits its application in practical engineering [24]. Trend surface fitting as a spatial fitting interpolation method has been widely used. The three-dimensional dynamic trend surface model is based on the spatial trend surface fitting model, which considers the time term [25].
In this paper, a methodology is proposed for the construction of a three-dimensional dynamic trend surface model of contact angle for droplet superposition and condensation. The model is then used to fit and analyse the contact angle observation data in the process of superposition and condensation. This provides a theoretical basis and technical support for precision application technology.
2. Experiments and Methods
2.1. Materials and Instruments
2.1.1. Experimental Material
The deltamethrin insecticide was used in the form of an emulsifiable concentrate with an active ingredient content of 25 g/L, produced by Bayer CropScience. The agricultural organosilicon spray additive was produced by Shijiazhuang Asia-Europe Chemical Preparation Factory. Deionized water was utilised on one occasion. The fresh strawberry leaves used were harvested within 2 hours of picking.
2.1.2. Measuring Instruments
The optical contact angle measuring instrument under discussion is produced by Biolin Company of Sweden. The model to which reference is being made is designated Theta Lite. The instrument's primary parameters and technical indicators are delineated in Table 1. The fully automatic fibre fineness analyser, meanwhile, is produced by Wenzhou Baien Instrument Co., Ltd, and its model is YG002-X. The microsyringe is produced by Hamilton Company of Switzerland.
2.2. Experimental Method
Fresh strawberry leaves were meticulously cut along the main leaf veins, ensuring a precise and symmetrical division into six sections, which were subsequently labelled with the numerical designations A1, A2, A3, B1, B2, B3, respectively (see Figure 1 for visual reference). Each part was then cut into leaves measuring 1.5 cm × 1 cm. These were then held in a flattened position by means of forceps on a slide that had been pre-soaked with water. A coverslip was then added, and the slide was made temporary by absorbing the excess water using blotting paper. Nine groups of leaves were selected for statistical analysis in this experiment. In order to observe the anatomical structure of the leaf blade, each segmented part of the leaf blade was sectioned by conventional paraffin sectioning method according to the method of literature [26]. The thickness of the section was 8 μm. Following the process of double staining with Senna red-solid green, the section was sealed with neutral adhesive. The next stage of the process was to observe and capture images of the section by means of a light microscope.
The test system for the droplet superposition and condensation test is illustrated in Figure 2. The temperature in the laboratory was recorded as 12.4 ± 1°C, and the humidity was measured at 58.2% ± 2%. The formulation of the spray reagent was conducted in strict accordance with the stipulated technical specifications and standard requirements for pesticide usage. In accordance with the stipulated requirements, 0.25 mL of deltamethrin insecticide, 0.05 mL of agricultural organosilicon spray additive and 250 mL of primary deionized water were meticulously mixed in proportion and thoroughly stirred. The resultant mixture was then subjected to a final concentration of 0.1% of the aforementioned reagents. It is imperative to note that the reagent must be utilised within a span of two hours following its preparation. The surface tension of the droplet reagent was determined using an optical contact angle meter.
The division of the strawberry leaf was extracted from the temporary slide, desiccated, and then distributed in a horizontal position on the observation slide. The height of the microsyringe's flat-bottomed tip was then adjusted to a perpendicular distance of 8 mm from the observation slide. The segmented portion of the strawberry leaf was then removed from the temporary slide and the water was drained from it. It was then spread out flat and affixed to the observation slide. The height of the flat-bottomed tip of the microinjector was then adjusted to a vertical distance of 8 mm from the observation slide to ensure a suitable operating distance. With this distance maintained, 8 to 9 μL of droplets were first swirled from the microinjector onto the surface of the strawberry split blade on the slide until the droplets were stably spread. Thereafter, an equal volume of droplet was ejected from the microinjector, and the trigger switch was depressed to cause the droplet to collide with the spread droplet on the surface of the strawberry split leaf, thereby effecting the superposition and merging of the two droplets. The superposition and merging process was dynamically captured by a CCD digital camera in the optical contact angle measuring instrument, and the image acquisition speed was set to 203 frames/second with a continuous acquisition time of 10 seconds. The captured images were stored in the PNG format to ensure the efficient handling of subsequent data analysis and processing. Finally, the experimental data were exported via Excel and organised for further analysis and research.
2.3. Measurement Methods
2.3.1. Microanalysis System Data Measurement
The measurement of each index of the leaves was conducted using the microanalysis software Motic, with the collected images from optical microscopic observation being utilised for this purpose. In order to achieve the desired results of this scientific experiment, it was necessary to prepare each segmented leaf a total of three times for each treatment, with each treatment being repeated three times. This process was repeated until a total of nine preparations had been completed. The measurement of each preparation sample was conducted on 30–60 cells, with this procedure being repeated three times. Subsequent to measurement, the corresponding data were statistically recorded, and the parameters and indexes related to leaf anatomical structure were calculated according to the following formula [26]: Leaf structural tightness (CTR) % = (thickness of fenestrated tissue/thickness of leaf) × 100%; Leaf structure sparseness (SR) % = (thickness of spongy tissue/thickness of leaf blade) × 100%; Stomatal density (pcs/mm2) = number of stomata in fixed area/fixed area.
2.3.2. Surface Tension Measurement by the Suspended Drop Method
A volume of 8-9 μL of reagent was dispensed from a micro-syringe into a suspension. Following a period of two minutes during which the suspension was left to stabilise, an image was captured by a CCD digital camera in static mode. Subsequent to this, the surface tension was measured from the results of the droplet image contour fitting.
2.3.3. Spreading Diameter Measurement by the Laying Drop Method
A volume of 8 to 9 microlitres of the reagent solution was deposited onto the surface of the strawberry split leaves using a microsyringe. The spread of the drop on the leaf surface was then observed. Subsequently, an equal volume of the droplet was expelled from the microsyringe, resulting in the formation of a suspended droplet. Activation of a trigger switch initiated the collision of the two droplets, which, prior to this, had been spread and suspended respectively. The collision of these two droplets instigated a process of superimposed condensation behaviour. The process was recorded by a CCD digital camera that captured images at a rate of 203 frames per second in continuous recording mode for a continuous acquisition time of 10 seconds. The spreading diameter and the dynamic contact angle were measured based on the results of continuous per-frame image contour fitting 2.4 Modelling methodology.
2.4. Modeling Method
2.4.1. 3D Dynamic Trend Surface Modeling Methodology
In accordance with the time series analysis and trend surface fitting method outlined in the relevant references [6], the introduction of time vectors facilitates the construction of a three-dimensional dynamic contact angle trend surface. This approach has the capacity to reflect more comprehensively the change of contact angle with time and space during the superposition and condensation process. The polynomial expression of this dynamic trend surface is shown as follows [25]:
In this equation, (x, y, z) represent the three-dimensional spatial coordinates of the contact angle observation points, while aijk (i, j = 0, 1,…, m; k = 0, 1,…, p) denote the polynomial coefficients. t signifies the observation time, and ε represents the residual term. Normalizing the terms in Eq. (1) yields [25]:
Where Zs is the vector of the dependent variable post-standardization, Xs(i) is the vector of each item in Eq. (1) post-standardization, and bs is the coefficient of the corresponding multiple linear regression post-standardization. Utilising the principle of least squares, the coefficients of the standardized terms of Eq. (2) are solved so that → min, and the coefficients of the multiple regression can be obtained [25]:
where is the least squares solution of the coefficients of Eq. (2), which is transformed to find the coefficients of the original model Eq. (1).
2.4.2. Significance Tests for Three-Dimensional Trend Surface Modeling
Subsequent to the acquisition of model parameters by the aforementioned methodologies, statistical assessments of the model are requisite to evaluate the significance of both the model and its parameters. In the context of multiple regression analysis, the overall significance of the model is typically determined through the construction of the F-statistic [25]:
In the context of regression analysis, SSR (regression sum of squares) and SSE (residual sum of squares) represent two crucial components of the model. The number of sampled data, N, and the number of polynomials, n, must be taken into consideration. If F > Fα (n, N-n-1), the model is deemed to be significant. Conversely, if F < Fα (n, N-n-1), the model is considered non-significant, necessitating the re-selection of the model order for effective solution. Furthermore, in the event that the model as a whole is significant, it is not guaranteed that each parameter in the model is significant. Consequently, it is also necessary to perform statistical tests on the model parameters. The construction of the T-statistic is outlined as follows [25]:
Where cii is the diagonal element in the covariance matrix corresponding to ; is the estimated value of the error in unit weight; if |T|>ta/2 (N-n-1), then has a significant effect on Z; otherwise, it is considered that = 0, i.e., Xi should be excluded from the regression equation and the model should be solved again. The final 3D dynamic trend surface model is obtained by testing the significance of the model as a whole and each coefficient.
3. Results and Discussion
3.1. Characteristic Parameters of Leaf Blade Anatomical Structure
The following figure illustrates the microscopic observation of the main vein cross-section. The epidermis constitutes the foundation of leaf structure, and the thickness of the epidermis in the anatomical structure of the plant directly correlates with the strength of its drought resistance, heat insulation, and water-holding capacity. The composition of the strawberry leaf pulp is characterised by the presence of fenestrated and spongy tissues. The fenestrated tissues are noted for their dense, vertical arrangement, with a regularity that is perpendicular to the upper epidermis. It is observed that the number of fenestrated tissues may vary between different species. The thickness of fenestrated tissue was found to be positively correlated with drought resistance, and the greater the thickness of spongy tissue and the looseness of leaf tissue structure, the weaker the drought resistance [27]. As demonstrated in Figure 3, the adaptation of leaf anatomical structure to the shaded environment is characterised by epidermal morphology and structure, manifesting as the following: cell convexity, reduction in the number of layers, increase in volume, thin cell wall, often containing chlorophyll, and epidermal cuticle thin or absence of cuticle membrane. This change has the potential to enhance the ability of the leaf cells to capture light. This, in turn, can facilitate the penetration of light radiation through the epidermis of the leaf to reach the leaf pulp tissue, or directly in the epidermis of the leaf to carry out the photochemical reaction. Consequently, this can improve the photosynthetic capacity.
In this paper, we presented a comprehensive evaluation method for the affiliation function [28], and selected the following indexes for the calculation of the comprehensive affiliation function of strawberry in each segmented part: cuticular membrane thickness, upper epidermis thickness, lower epidermis thickness, stomatal size, fenestrated tissue thickness, spongy tissue thickness, leaf structural tightness and stomatal density[29]. The results of the calculations are shown in Table 2. As demonstrated in Table 2, the primary parameters of fenestrated tissue thickness, spongy tissue thickness, leaf structural tightness, leaf structural laxity, stomatal size and stomatal density in the upper A1 and B1 parts of strawberry leaves were reduced relative to those in the mid-end (A2 and B2 parts) and lower end (A3 and B3 parts). The adaptation of leaf anatomical structures to the shaded environment was primarily reflected in the configuration of epidermal and fenestrated tissue cells, as well as their arrangement [30]. The leaf pulp constitutes the primary component of leaf photosynthesis, and disparities in the configurations of thickness of fenestrated and spongy tissues, the quantity of cell layers, and the morphological alterations of fenestrated cells invariably influence the distribution of chloroplasts and the efficiency of photosynthesis.
3.2. Surface Tension of Deltamethrin Reagent
The surface tension value of 28.92 ± 0.2 mN·m-1 was measured based on the previously formulated concentration of deltamethrin spray reagent.
3.3. Observation of Droplet Superposition and Condensation Behavior
On the leaf surface of each division of strawberry, when the droplets collided in the vertical direction, the two droplets immediately adsorbed and superimposed at the moment of contact to complete the condensation process. As demonstrated in Figure 4, the droplets descended and came into contact with the flat droplets, and were instantaneously drawn in from the upper periphery of the flat droplets. Following this, a new droplet was formed through a process of condensation, subsequent to a brief oscillatory period. The superposition and coagulation process was observed to take a mere 0.0476 seconds, after which the droplet was absorbed from the upper circumference of the lying droplet.
3.4. Contact Angle Analysis of Stacked Condensation Processes
The results of the dynamic contact angle measurements before and after the superposition of the droplets on the leaf surface of each segment of strawberry are shown in Figure 4. The overall change in contact angle during the superposition and condensation process can be broadly categorised into three phases: a sharp oscillation phase, a small decline phase, and a smooth stabilisation phase. In comparison with the flat-lying droplets prior to superposition, the contact angles of the new droplets formed after condensation exhibited varying degrees of increase and decrease.
As demonstrated in Figure 5a, the contact angle of the flat-lying droplets on the leaf surface of strawberry A1 was measured at 41.73°prior to superposition, and the contact angle exhibited a pronounced increase at the moment of droplet superposition, reaching a peak value of 50°.The contact angle then decreased slightly, stabilising after condensation and merging into a new droplet, and the contact angle value decreased to 41.20° at 10 s. The contact angle before and after superposition did not vary greatly, with a 0.53° difference between the two phases.
As demonstrated in Figure 5b-5f, following the superimposed condensation of droplets, the contact angles of the strawberry B1 and B2 leaf surfaces diminished by 9.21% and 33.29%, respectively. Concurrently, the contact angles of the A2, A3 and B3 leaf surfaces exhibited an increase, with the most substantial increase being observed in the A3 leaf surface, reaching 21.73%. The differences in contact angle changes before and after superimposed condensation were found to be primarily associated with the degree of wetting on the surface of each segmented leaf and the texture structure of the leaf veins. For instance, it was observed that the A3 leaf surface at the distal end of the strawberry leaf blade exhibited the most significant increase in contact angle, attributable to the dense veins, low surface flatness, and high roughness, which impeded the wetting of newly formed droplets following condensation. Conversely, the contact angle of the B2 leaf surface, situated at the midpoint of the strawberry leaf blade, exhibited the most significant increase, attributable to the dissolution of leaf veins, the presence of more intervein gaps, and its comparatively flat surface. Following a brief period of oscillation, the contact angle underwent a pronounced decrease, marking the most substantial decline.
3.5. Volume Changes During Superimposed Condensation
The observation results of volume dynamics before and after the superposition of droplets on the leaf surface of each segment of strawberry are shown in Figure 5. From the observation results, the volume change is consistent with the trend of contact angle change, and it also experiences three stages of sharp oscillation, small drop, and gentle stabilization. The new droplet formed by the superposition of two droplets of equal volume does not undergo a twofold increase in volume after complete spreading, and its volume is only 1.05-1.93 times the volume of a single, flat-lying droplet before condensation.
As demonstrated in Figure 6a, the volume of a solitary, flat droplet on the A1 leaf surface was 7.79 μL prior to superposition. The volume of the new droplet increased to a maximum value of 15.52 μL during the condensation phase, subsequently decreasing marginally before attaining a state of gradual stabilisation at 10.67 μL. As demonstrated in Figure 6b-5f, in comparison with the sharp oscillation time of 0.0428 s for the droplets on the leaf surface of A1, the sharp oscillation time of the droplet volume on the other leaf surfaces exhibited an increase. The fluctuation of the droplet volume on the leaf surfaces of B1, B2, B3, and A3 was smaller than that of A1 and A2. The A3 leaf surface, located at the distal end of the leaf blade, exhibited the highest frequency and longest duration of droplet volume oscillations. This phenomenon can be attributed to the thicker veins of the leaf blade, which impede the spreading of coagulated droplets on the surface and generate reflux phenomena between the vein gaps. Consequently, the droplet volume oscillations of the A3 leaf surface were the most prevalent and protracted. The volume change of the superposition coagulation process is still closely related to the surface structure and wetting state of the divided leaf surface.
3.6. Variation of Spreading Diameter During Superposition Condensation
The dynamic spreading diameter measurements of strawberry leaf surface droplets prior to and following the superposition of each segment are illustrated in Figure 7a-7f. As demonstrated in Figure 6a, the spreading diameter of strawberry A1 leaf surface was 4.0224 mm prior to superposition, and the spreading diameter of the new droplets exhibited a marked increase to 5.31194 mm following condensation, subsequently decreasing slightly before stabilising at 4.8589 mm.
As demonstrated in Figure 7, the spreading diameters of the leaf surfaces of B1, A3, and B3 increased to different extents after the superposition of the droplets. The largest increase was recorded in B1, with a 40.29% increase. Figure 7b-7f, the spreading diameters of the leaf surfaces of B1, A3, and B3 increased to different extents after the superposition of the droplets, with the largest increase of 40.29% in B1. The spreading diameter of A2 and B2 exhibited a negligible increase, with only a slight contraction and expansion evident during the superposition phase. However, in the late stage of weak vibration, B2 underwent a slight contraction, which may be associated with the surface wetting and expansion phenomenon of reflux oscillations generated by the obstruction.
The spreading of material caused by non-equilibrium surface tension along the liquid, solid, and gas phase lines is consistent with Tanner's law [1]. The basis for this assertion is found in the works of Tanner [1] and references [24]. The spreading diameter of condensed new droplets with time is fitted according to Tanner's law and references [24], which is in accordance with the power function relationship (power value α < 0.1). This case indicates that the new droplets formed by superposition and condensation continuously generate new surface (boundary) planes during the spreading process on the strawberry leaf surface. The new droplets need to continuously diffuse from the bulk phase and adsorb to the new surface (boundary) planes. As a result, the surface tension during the spreading process is dynamic and larger than the equilibrium surface tension.
According to the references cited in [24], it is hypothesised that the dynamic surface tension change of condensed new droplets on the solid-liquid-gas surface (boundary) of the strawberry leaf surface is the dominant factor leading to the spreading behaviour.
3.7. Stacked Condensation and Contact Angle Trend Surface Modeling
Nine groups of strawberry leaves were selected for their respective segmented parts (A1, A2, A3, B1, B2, B3). The data of the observation points of the superimposed coagulation process spreading diameter, volume, and contact angle from 1.0048 s to 1.9994 s were collected, and the data of the above mentioned 54 phases were analysed. All the data of each observation point were solved by taking the A1 of the 1st group as a benchmark. For the B3 model, which contains incomplete data, it is employed as a test point with the objective of evaluating its performance in the absence of complete data. The remaining eight groups of observation samples, each comprising 124–161 data observation points, were selected to participate in the 3D dynamic trend surface fitting. Initially, the observed data were processed in Excel, and then the data were preprocessed by eliminating the outlying differences with the interquartile distance method and subsequently interpolating the missing values with the linear interpolation method. The surface trend surface model of each segmented part of the strawberry is shown in Figure8 and Table 3. (Where, Z represents the dynamic contact angle; X represents the droplet volume; Y represents the droplet spreading diameter.)
The trial calculation of the spatial and temporal order model, coupled with a comparative analysis of the residual medium error of the fitting, has yielded the conclusion that the fitting effect is optimal when the spatial order of the model is 3, the number of trend surfaces is 2, and the temporal order is 1. The model was subjected to an F-test and a T-test, and the final dynamic trend surface model was obtained by applying MATLAB software, as illustrated in Figure 8a-8f.
The mean value of the fitting error of the contact angle data of the A1 model in Figure 7a is 0.1615°. The analysis of the observation points demonstrates that the model's fitted surface is positioned at the midpoint of the data points, indicating an enhanced fitting effect. However, the presence of substantial noise in the image acquisition data results in larger error values for the individual fitting points, with a mean of 4.0623°.
In the time prediction of the model in Figure 8b-8f, the average prediction error of each observation point is in the range of 0.3875° to 0.9723°. The prediction surface and the actual observed values demonstrate that the predicted values of the model are predominantly situated in the middle of the observed data series. This finding suggests that the model aligns with the trend of the contact angle. Nevertheless, the statistical accuracy of the prediction is not sufficiently high, a circumstance that is related to the quality of the observed data collection.
3.8. Superimposed Condensation and Contact Angle Trend Surface Modeling Test
The findings of the investigation into the trend surface model of superimposed condensation and contact angle of each segmented foliage surface of strawberry in eight groups of observation samples are presented in Table 2. As can be seen from Table 4, the three-dimensional trend surface model of the contact angle of each segmented leaf surface of strawberry passed the overall significance F-test and the statistical T-test of each coefficient. Furthermore, the aforementioned models demonstrated adequate trend surface fitting suitability and trend surface suitability, respectively, with relative errors Er ranging from 3.89% to 9.02%. With the exception of the B3 foliage, the fit of the other segmented foliage is high, with the fit suitability R2 of the A3 foliage reaching 0.7884.
As demonstrated in Figure 8a-8e, the observed data at each observation point demonstrate a closer proximity to the fitted trend surface. However, outside the sampling region of the observation point, the trend surface exhibits increased variability. This finding suggests that the dynamic contact angle trend surface model is more capable of accurately representing the superimposed condensation droplet change trend within the sampled observation points. However, its capacity for time extrapolation appears to be limited. The presence of substantial random noise in the observation data exerts an influence on the constructed model B3. The significant discrepancy between the observed values of leaf surface and the fitted values of the trend surface may be attributable to the noise in the observation data collected in the study area, particularly the influence of local leaf surface morphology features on wetting and spreading behaviours, which cannot be captured by overall trend fitting. Further analysis of these local features is necessary to gain a more comprehensive understanding.
4. Conclusions
A simulation of superimposed coagulation was conducted, utilising an equal volume of 8-9 μL droplets of deltamethrin reagent on six segmented portions of the strawberry leaf surface. The maximum increase in contact angle and volume of the new droplets was recorded as 21.73% and 93.21%, respectively, after coagulation. Consequently, when considering the actual spraying conditions, it is imperative to fully take into account the superposition time and coagulation effect of the droplets on the leaf surface of the crop target.
In the simulation tests, the new droplets formed by superimposed condensation exhibited different degrees of increase in spreading diameter, with the maximum increase reaching 40.29%. In order to realise precise spray application, it is necessary to take into consideration the surface tension of the liquid, the position and morphological characteristics of the crop target leaf surface. The judicious selection of the most appropriate application method is instrumental in promoting the wetting and spreading of superimposed condensed droplets on the leaf surface, thereby minimising liquid loss.
The dynamic trend surface model is predicated on the spreading diameter, volume and contact angle versus time, and provides a fit for the overall trend of the droplet superposition and consolidation process during the sharp oscillation and small fallback phases. The model is predicated on the representation of the state change of droplets through the coordinates of observation points (x, y, z) and the reflection of temporal and spatial trends of contact angle. However, further in-depth study is needed to characterize the pattern of the gentle stabilization phase.
This three-dimensional contact angle dynamic trend surface is a continuous, smooth surface; however, the model only captures a portion of the overall regional trend. Beyond the confines of the designated control region, the trend surface is unable to accurately mirror the alterations in contact angle. The application of this method for the prediction of contact angle dynamics of superimposed condensation droplets is only a preliminary attempt, which is not yet mature and requires further study and improvement.
Author Contributions
Conceptualization, J.L.; methodology, J.L.; software, Z.W.; validation, X.W.; formal analysis, J.L.; investigation, X.D.; resources, J.L.; writing—original draft, X.W.; writing—review and editing, J.L.; visualisation, Z.W.; funding acquisition, J.L. All authors have read and agreed to the published version of the manuscript.
Funding
This work was supported by the China Postdoctoral Science Foundation (grant no. 2012M521176), and Zhejiang Provincial Natural Science Foundation (grant no. LY16C 130008).
Data Availability Statement
Dataset available on request from the authors.
Conflicts of Interest
The authors declare no conflict of interest.
References
- Zhang, H.; Lu, J.; Wei, D.; Hu, Y. Wetting state and dynamic spreading behavior of alkyl polyglycoside drop on cucumber leaf surface. Transactions of the Chinese Society of Agricultural Engineering, 2002, 18, 203–206. [Google Scholar]
- Yang, X.; Dai, M.; Song, J.; Zhao, J.; He, X. Effect of droplet size, leaf characteristics and angle on pesticide deposition. Transactions of the Chinese Society of Agricultural Engineering, 2012, 28, 70–73. [Google Scholar]
- Xu, G.; Gu, Z.; Xu, D.; Xu, X. Characteristics of rice leaf surface and droplets deposition behavior on rice leaf surface with different inclination angles. Scientia Agricultura Sinica, 2014, 47, 4280–4290. [Google Scholar]
- Nairn, J.J.; Forster, W.A. Due diligence required to quantify and visualize agrichemical spray deposits using dye tracers. Crop Protection, 2019, 115, 92–98. [Google Scholar] [CrossRef]
- Wang, S.; Zhang, W.; He, H.; Wang, W.; Hu, X. Effection of typical plants leaves on pesticide wetting speciality and retentivity. Journal of Jilin University(Engineering and Technology Edition), 2013, 43, 564–568. [Google Scholar]
- Lu, J.; Zhang, H.; Wei, D.; Hu, Y. Dynamic contact angle forecasting and modeling method for drop-leaf interface base on time series analysis. Transactions of the Chinese Society for Agricultural Machinery, 2013, 44, 80–86. [Google Scholar]
- Jensen, P.K.; Lund, I.; Nuyttens, D. Spray liquid distribution and biological efficacy of commercially available nozzles used for precision weed control. Biosystems Engineering, 2013, 116, 316–325. [Google Scholar] [CrossRef]
- Martin, D.E.; Latheef, M.A. Aerial electrostatic spray deposition and canopy penetration in cotton. Journal of Electrostatics, 2017, 90, 38–44. [Google Scholar] [CrossRef]
- Ferguson, C.J.; Chechetto, R.G.; Adkins, S.W.; Hewitt, A.J.; Chauhan, B.S. Effect of spray droplet size on herbicide efficacy on four winter annual grasses. Crop Protection 2018, 112, 118–124. [Google Scholar] [CrossRef]
- Kovalchuk, N.M.; Trybala, A.; Arjmandi-Tash, O.; Starov, V. Surfactant-enhanced spreading: Experimental achievements and possible mechanisms. Advances in Colloid and Interface Science 2016, 233, 155–160. [Google Scholar] [CrossRef]
- Kumar, K.; Nikolov, A.D.; Wasan, D.T. Effect of Film Curvature on Drainage of Thin Liquid Films. Journal of Colloid & Interface Science 2002, 256, 194–200. [Google Scholar]
- Zhang, S.; Wu, X.; You, Z.; Zhang, L. Leaf image based cucumber disease recognition using sparse representation classification. Computers and Electronics in Agriculture 2017, 134, 135–141. [Google Scholar] [CrossRef]
- Kira, O.; Dubowski, Y.; Linker, R. In-situ open path FTIR measurements of the vertical profile of spray drift from air-assisted sprayers. Biosystems Engineering 2018, 139, 32–41. [Google Scholar] [CrossRef]
- Bueno, M.R.; Cunha, J.P.A.R.D.; Santana, D.G.D. Assessment of spray drift from pesticide applications in soybean crops. Biosystems Engineering 2017, 154, 35–45. [Google Scholar] [CrossRef]
- Jia, W.; Zhu, H.; Dong, X.; Xue, F. Impact of spray droplet on soybean leaf surface. Transactions of the Chinese Society for Agricultural Machinery 2013, 44, 87–93. [Google Scholar]
- Kovalchuk, N.M.; Trybala, A.; Arjmandi-Tash, O.; Starov, V. Surfactant-enhanced spreading: Experimental achievements and possible mechanisms. Advances in colloid and interface science 2016, 233, 155–160. [Google Scholar] [CrossRef]
- Yu, S.; Cui, L.; Cui, H.; Liu, X.; Liu, J.; Xin, Z.; Yuan, J.; Wang, D. Spray performance of flexible shield canopy opener and rotor wind integrated boom-sprayer application in soybean: Effects on droplet deposition distribution. Pest Management Science 2024, 80, 3334–3348. [Google Scholar] [CrossRef]
- Zhang, J.T.; Huang, L.S.; Liu, G.B.; Lan, Y.B.; Wen, S. The dynamic wetting and spreading behavior of pesticide droplet on rice leaf surface. Scientia Agricultura Sinica 2024, 57, 2583–2598. [Google Scholar]
- Gatne, K.P.; Jog, M.A.; Manglik, R.M. Surfactant-induced modification of low weber number droplet impact dynamics. Langmuir the Acs Journal of Surfaces & Colloids 2009, 25, 8122–8130. [Google Scholar]
- Vittal, L.V.M.; Rookes, J.; Boyd, B.; Cahill, D. Analysis of plant cuticles and their interactions with agrochemical surfactants using a 3d printed diffusion chamber. Plant Methods 2023, 19, 37–50. [Google Scholar] [CrossRef]
- Ding, W.; Jin, M.; Luo, L.; Wu, F.; Xu, L.; Ji, G.; Zhu, D. Behavior analysis of spray droplet interacting with plant leaves based on virtual model. Transactions of the Chinese Society of Agricultural Engineering 2017, 33, 40–48. [Google Scholar]
- Li, L.; Zhang, S.; Wang, B. Plant disease detection and classification by deep learning—A review. IEEE Access 2021, 9, 56683–56698. [Google Scholar] [CrossRef]
- Zhang, Y.; Zhang, N.; Zhu, J.; Sun, T.; Chai, X.; Dong, W. Efficient triple attention and attentionMix: A novel network for fine-grained crop disease classification. Agriculture 2024, 15, 313–329. [Google Scholar] [CrossRef]
- Lu, J.; Jin, T.; Zhang, H. Deltamethrin emulsifiable concentrates droplets superposition and coagulation behavior on water spinach leaf surface. Chinese Journal of Pesticide Science 2019, 21, 514–522. [Google Scholar]
- Li, G.; Dai, W.; Zeng, F.; Liu, B. Application of three -dimensional dynamic trend surface fitting model on land subsidence. Journal of Geodesy and Geodynamics 2016, 36, 508–512. [Google Scholar]
- Jiang, S.; Hu, Y.; Zheng, S.; Li, J.; Zhao, N.; Gao, Y.; Gu, S. Morphologic effects of different light intensities and light qualities on the leaf of ‘Darselect’strawberry(Fragaria ananassa Duch). Journal of Chinese Electron Microscopy Society 2009, 28, 453–461. [Google Scholar]
- Liu, Q.; Qiu, A.; Xie, X.; Liu, R.; Wang, W.; Wu, C. Relationships between blade anatomical structure and drought resistances of five strawberry varieties. Tianjin Agricultural Sciences 2019, 25, 18–22. [Google Scholar]
- Lu, J. , Sheng, K., Chen, J., Ding, X., Wen, Z., Li, S. Influence of particle size and hot-pressing parameters on mechanical properties of bamboo-based composite materials. Biomimetics 2025, 10, 156. [Google Scholar] [CrossRef] [PubMed]
- Vezakis, A.; Vezakis, I.; Petropoulou, O.; Miloulis, S.T.; Anastasiou, A.; Kakkos, I.; Matsopoulos, G.K. Comparative analysis of deep neural networks for automated ulcerative colitis severity assessment. Bioengineering 2025, 12, 413. [Google Scholar] [CrossRef]
- McCarthy, M.E.; Filz von Reiterdank, I.; Parfitt van Pallandt, O.H.; Taggart, M.S.; Charlès, L.; Uygun, K.; Lellouch, A.G.; Cetrulo, C.L., Jr.; Uygun, B.E. Decellularization of human digits: A step towards off-the-shelf composite allograft transplantation. Bioengineering 2025, 12, 383. [Google Scholar] [CrossRef]
Figure 1.
Strawberry leaf and its segmentation part.
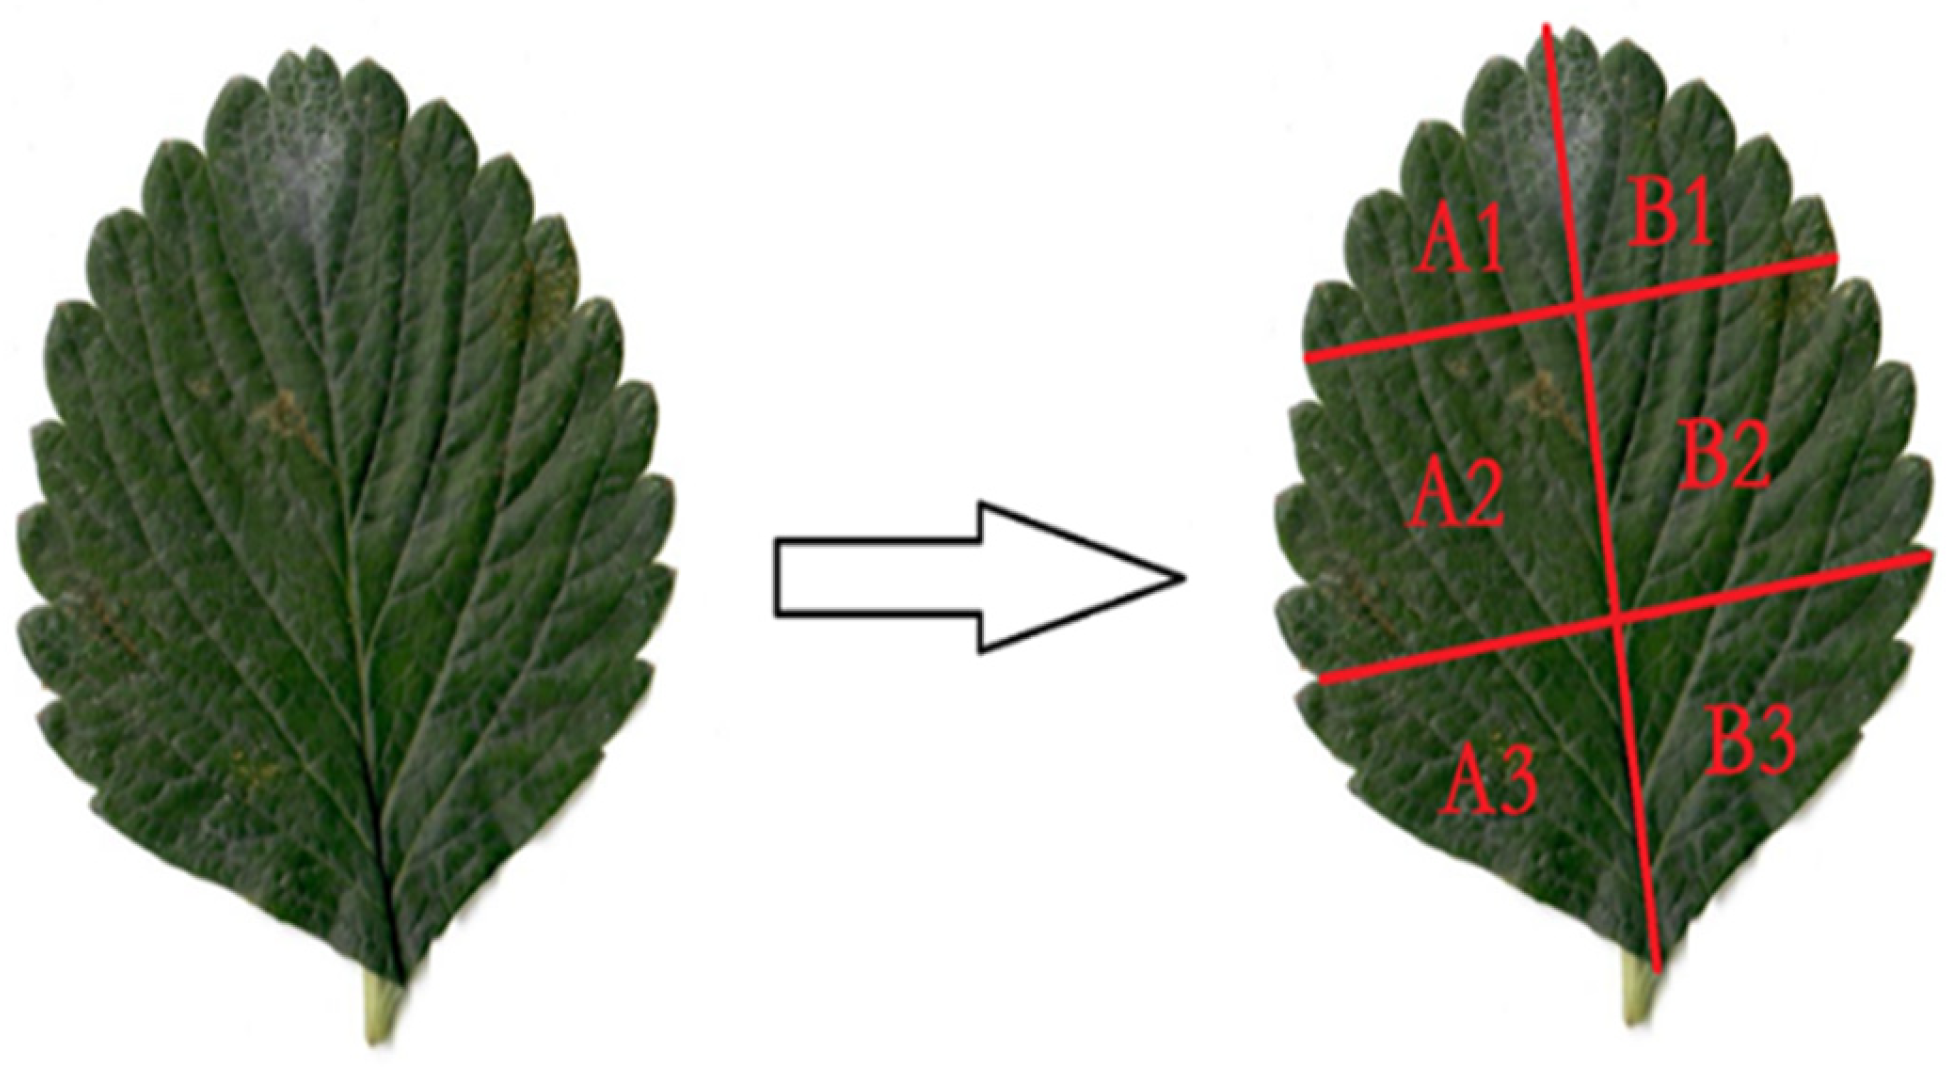
Figure 2.
Testing system of droplets superposition and coalescence.
Figure 3.
Microscopic observation on cross section of main vein of strawberry leaves (Transverse section of vein, showing vascular bundle (Bar=20 μm)).
Figure 3.
Microscopic observation on cross section of main vein of strawberry leaves (Transverse section of vein, showing vascular bundle (Bar=20 μm)).
Figure 4.
Dynamic observation of droplets superposition and coalescence behavior.
Figure 5.
Dynamic contact angle trend of droplets superposition and coalescence process. Figs. 5a, Strawberry part A1; Figs. 5b, Strawberry part B1; Figs. 5c, Strawberry part A2; Figs. 5d, Strawberry part B2; Figs. 5e, Strawberry part A3; Figs. 5f, Strawberry part B3.
Figure 5.
Dynamic contact angle trend of droplets superposition and coalescence process. Figs. 5a, Strawberry part A1; Figs. 5b, Strawberry part B1; Figs. 5c, Strawberry part A2; Figs. 5d, Strawberry part B2; Figs. 5e, Strawberry part A3; Figs. 5f, Strawberry part B3.
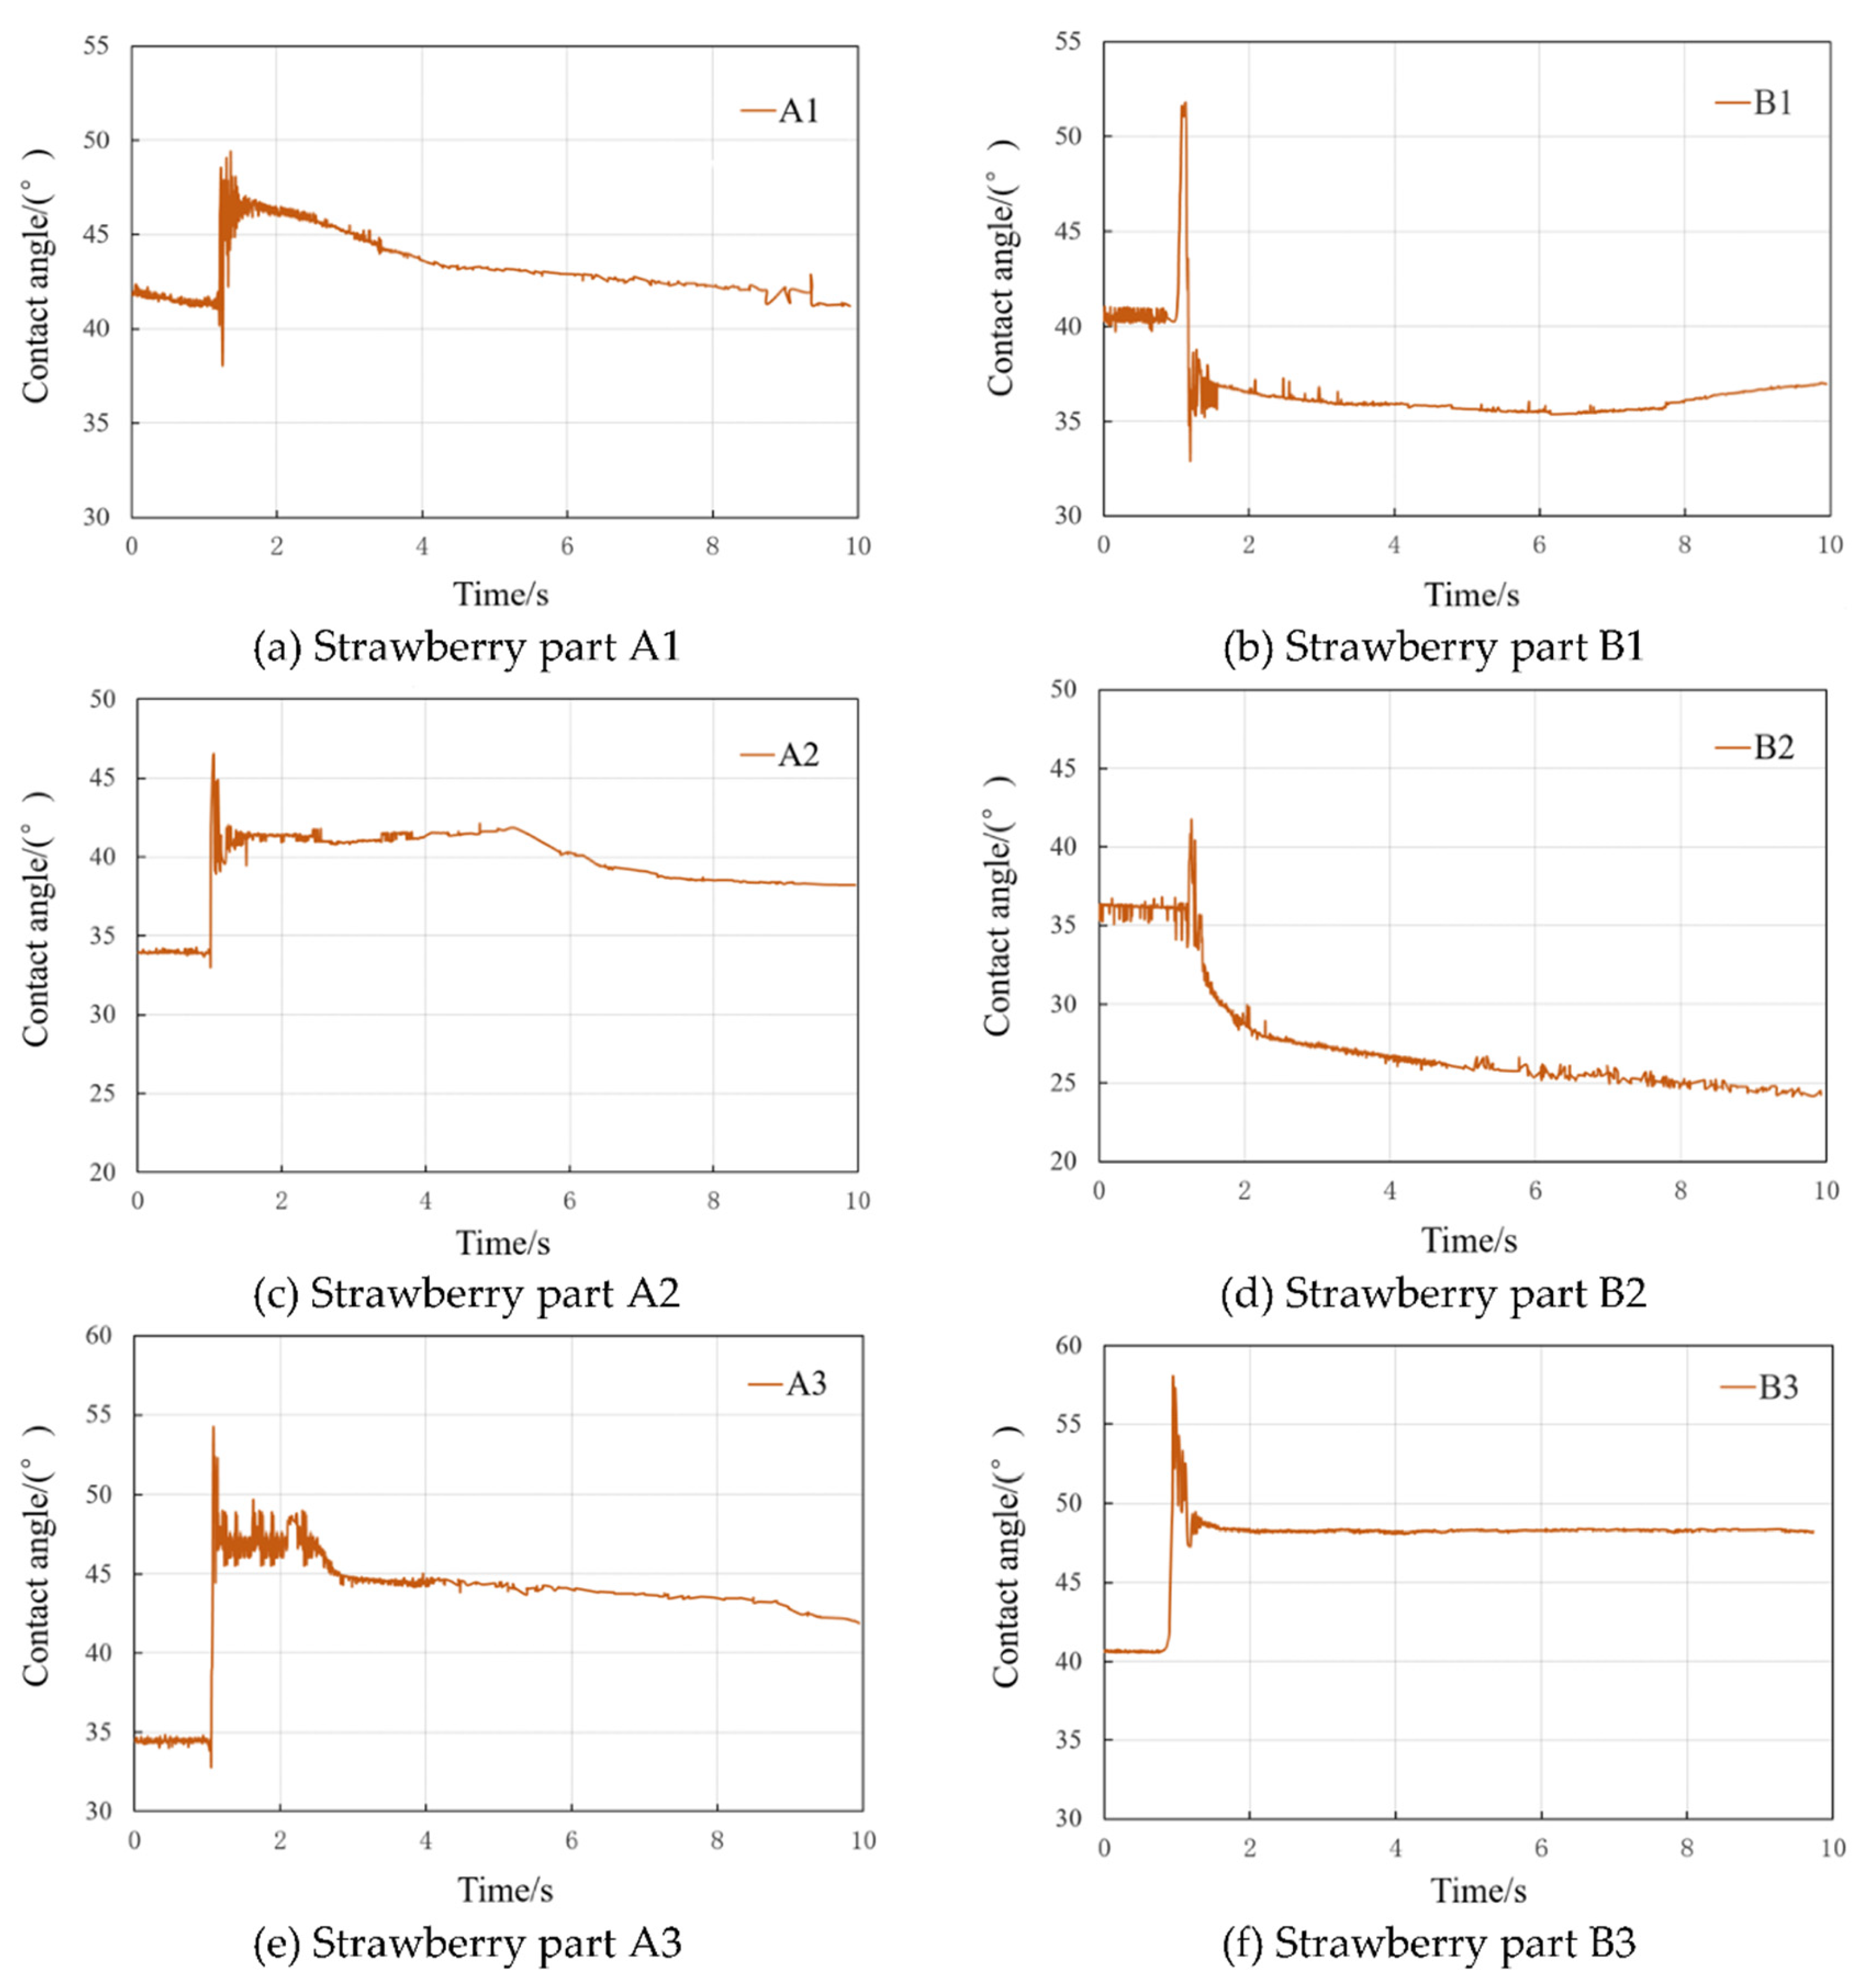
Figure 6.
Dynamic volume trend of droplets superposition and coalescence process. Figs. 6a, Strawberry part A1; Figs. 6b, Strawberry part B1; Figs. 6c, Strawberry part A2; Figs. 6d, Strawberry part B2; Figs. 6e, Strawberry part A3; Figs. 6f, Strawberry part B3.
Figure 6.
Dynamic volume trend of droplets superposition and coalescence process. Figs. 6a, Strawberry part A1; Figs. 6b, Strawberry part B1; Figs. 6c, Strawberry part A2; Figs. 6d, Strawberry part B2; Figs. 6e, Strawberry part A3; Figs. 6f, Strawberry part B3.
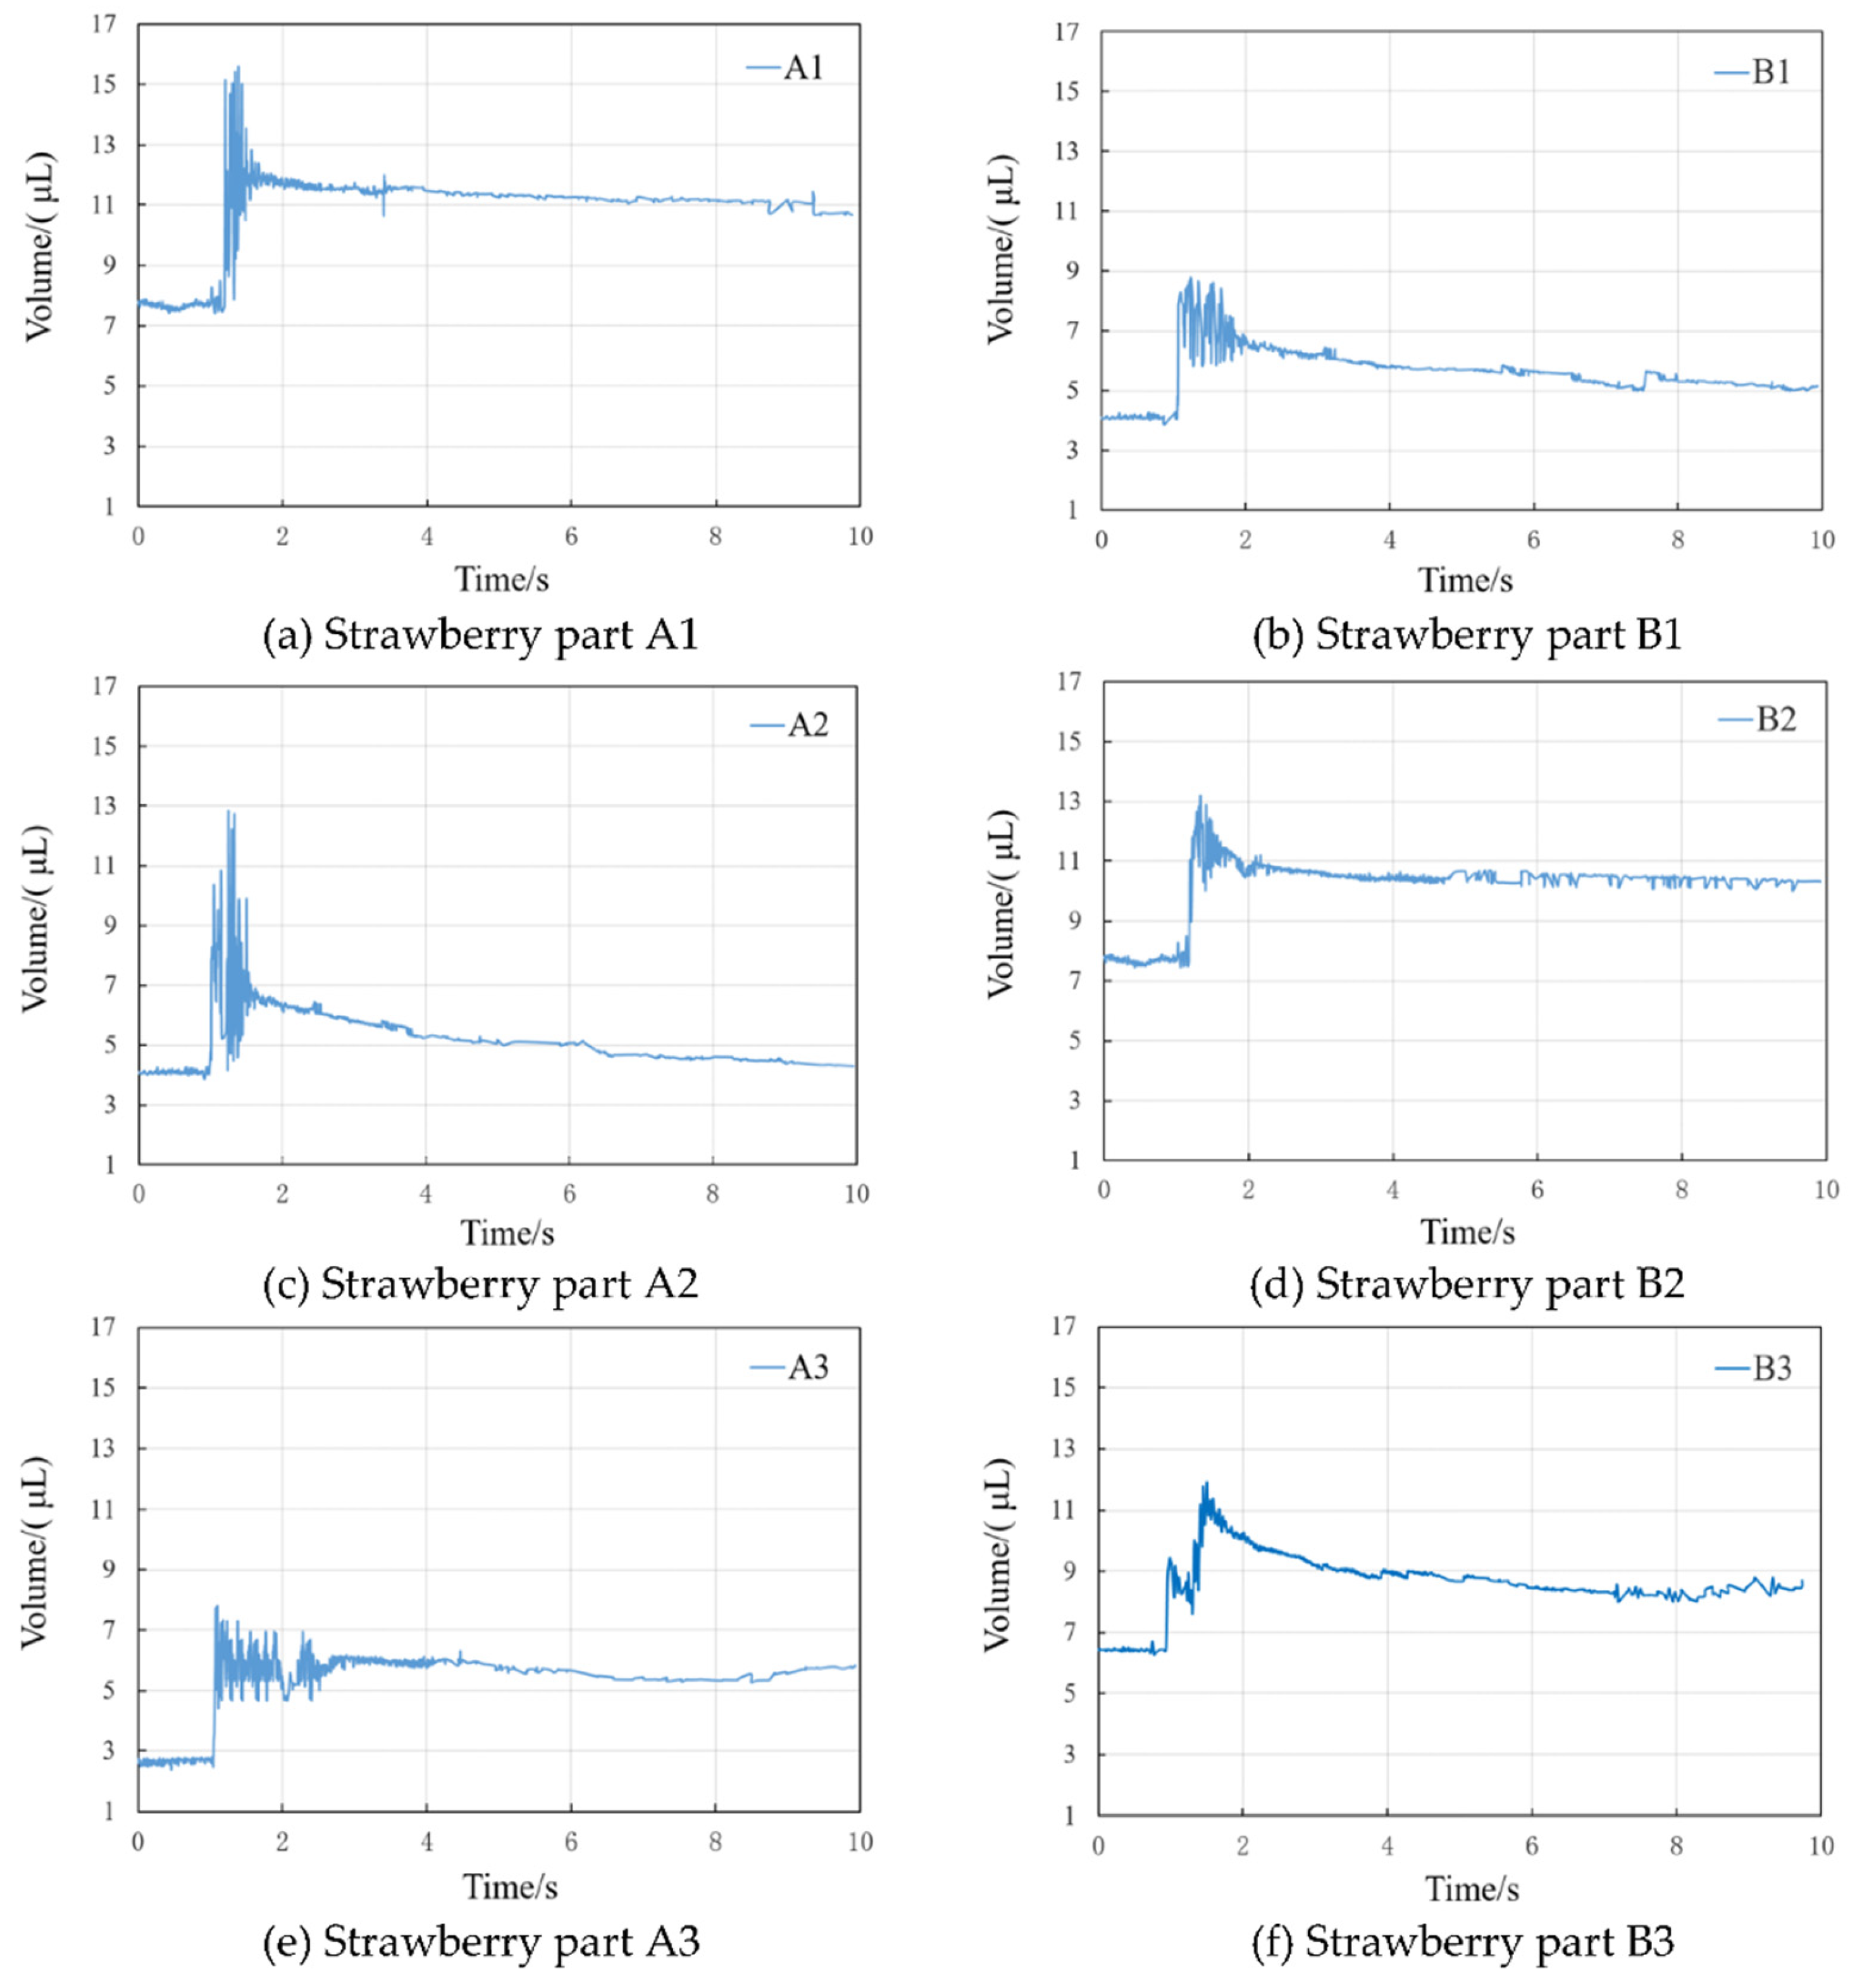
Figure 7.
Dynamic spreading diameter trend of droplets superposition and coalescence process. Figs. 7a, Strawberry part A1; Figs. 7b, Strawberry part B1; Figs. 7c, Strawberry part A2; Figs. 7d, Strawberry part B2; Figs. 7e, Strawberry part A3; Figs. 7f, Strawberry part B3.
Figure 7.
Dynamic spreading diameter trend of droplets superposition and coalescence process. Figs. 7a, Strawberry part A1; Figs. 7b, Strawberry part B1; Figs. 7c, Strawberry part A2; Figs. 7d, Strawberry part B2; Figs. 7e, Strawberry part A3; Figs. 7f, Strawberry part B3.
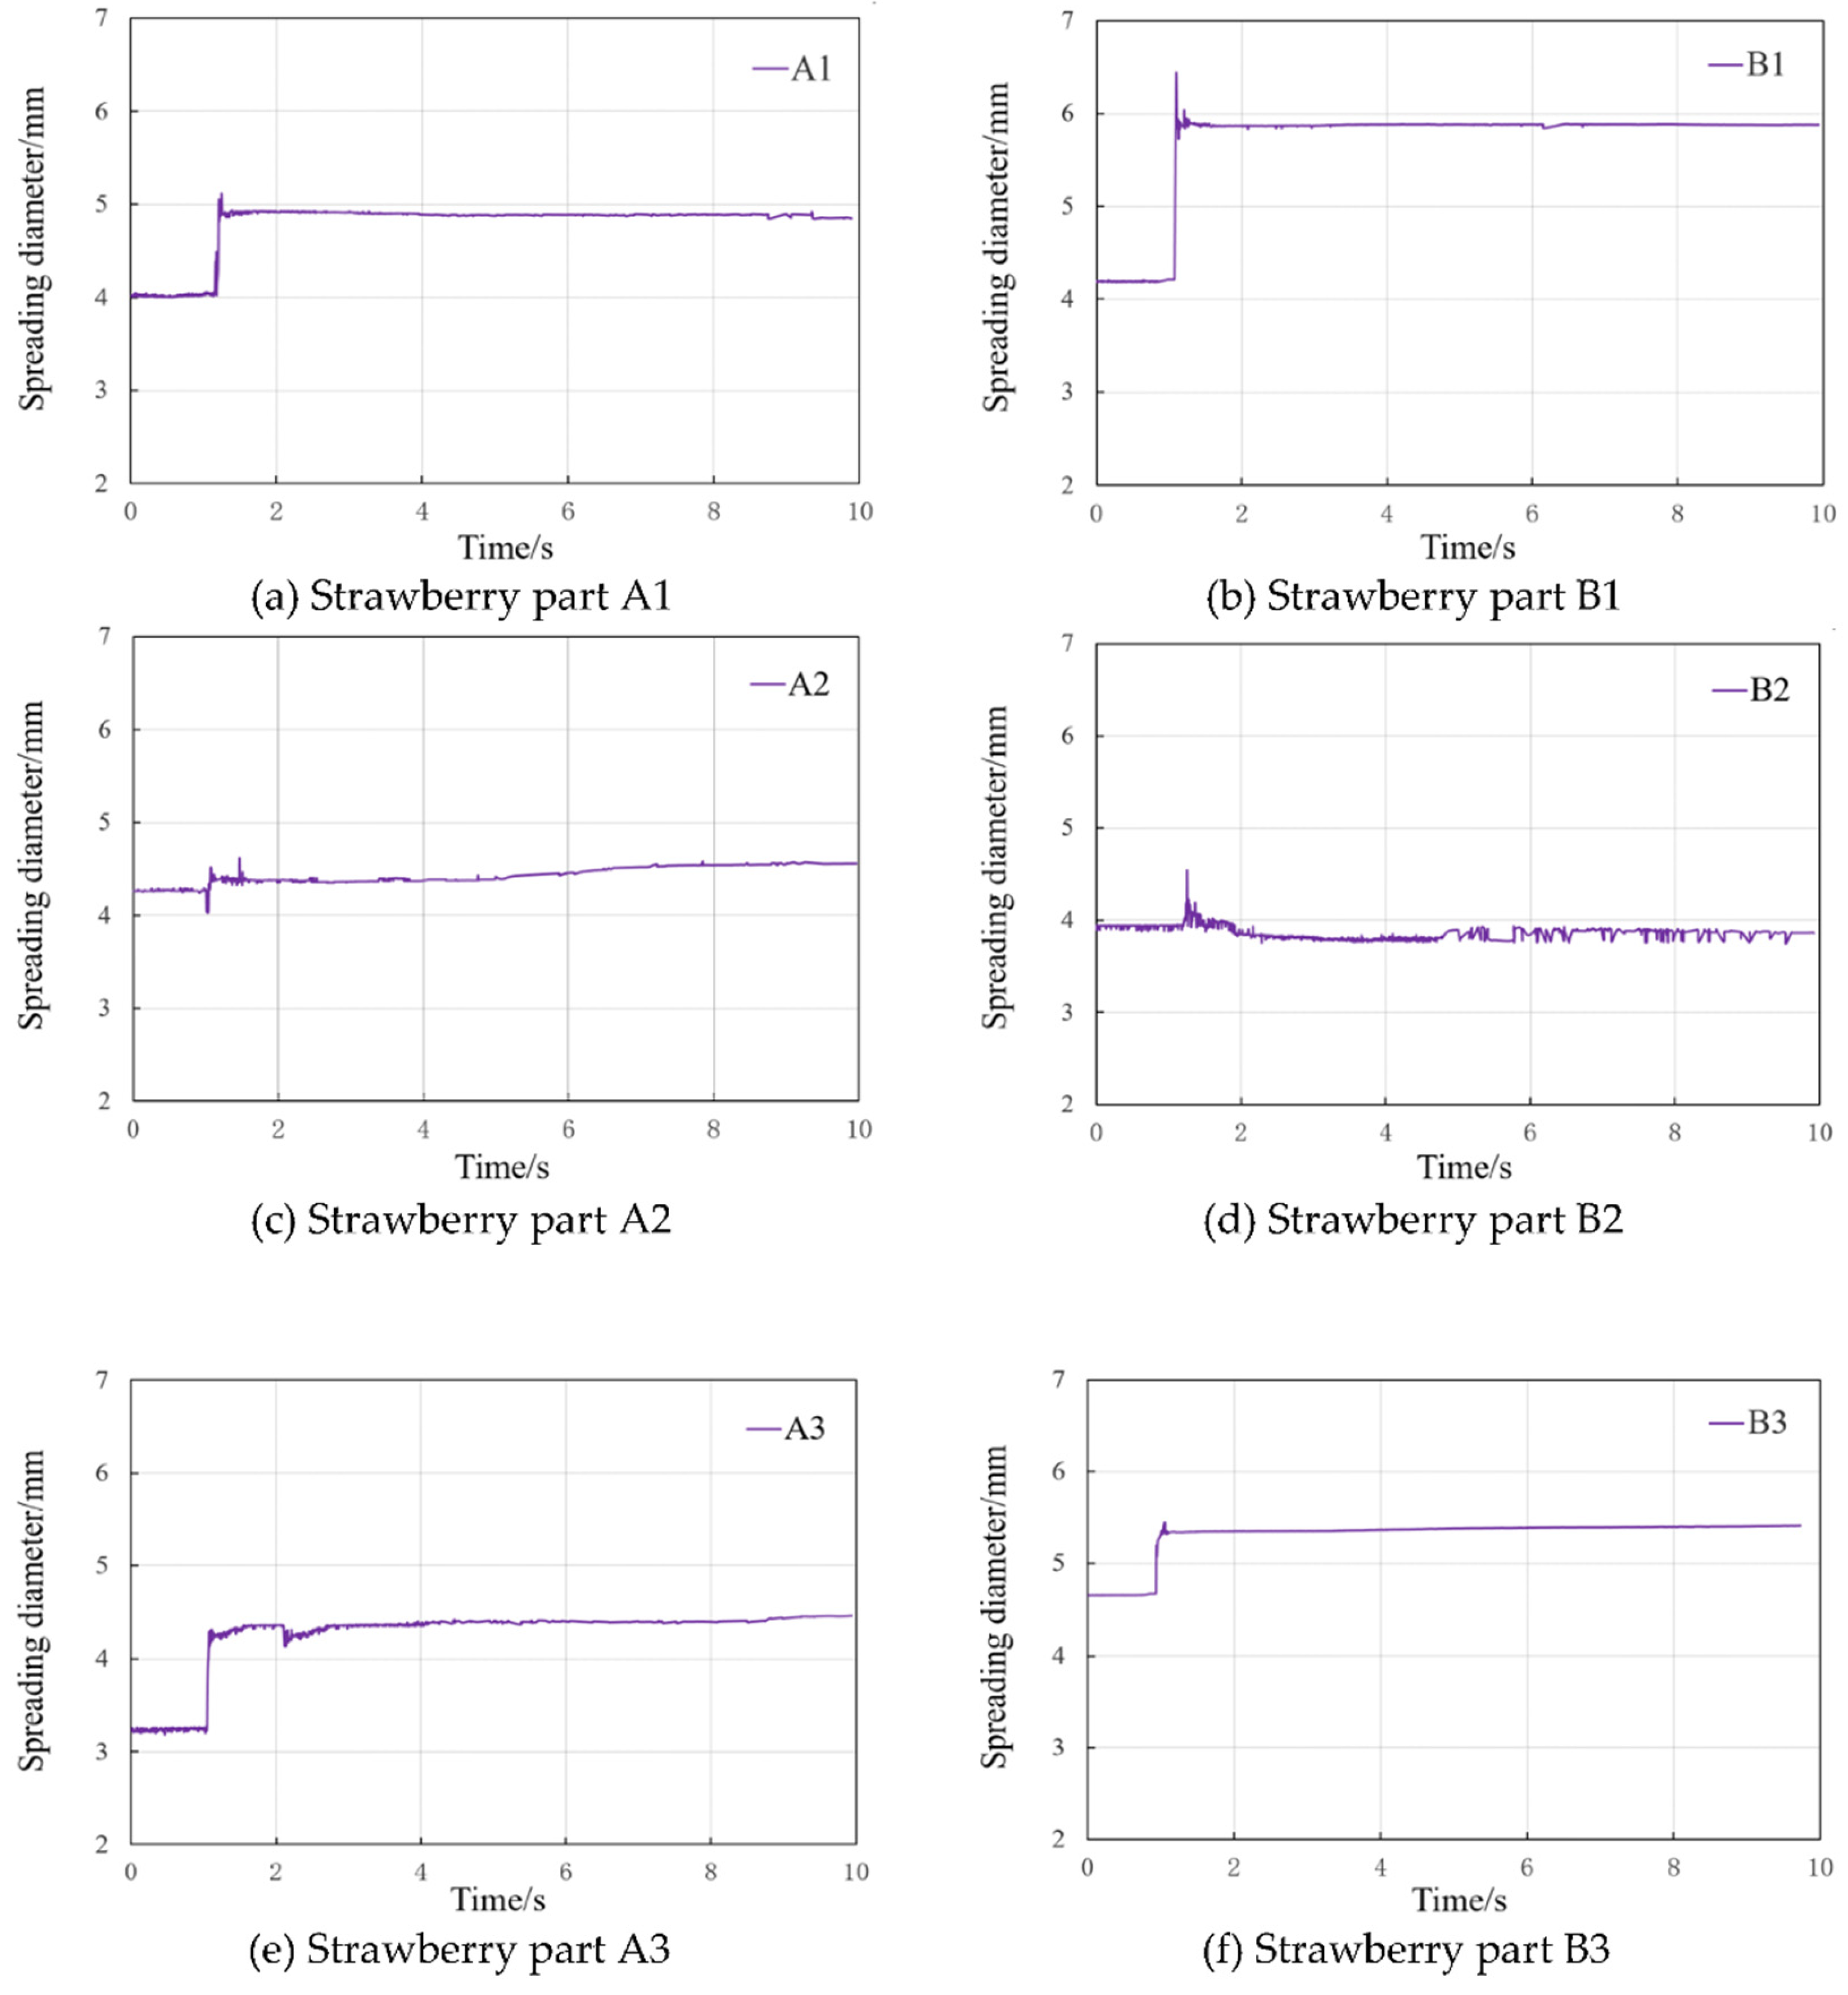
Figure 8.
Dynamic contact angle 3D trend surface model of droplets superposition and coalescence process. Figs. 8a, Strawberry part A1; Figs. 8b, Strawberry part B1; Figs. 8c, Strawberry part A2; Figs. 8d, Strawberry part B2; Figs. 8e, Strawberry part A3; Figs. 8f, Strawberry part B3.
Figure 8.
Dynamic contact angle 3D trend surface model of droplets superposition and coalescence process. Figs. 8a, Strawberry part A1; Figs. 8b, Strawberry part B1; Figs. 8c, Strawberry part A2; Figs. 8d, Strawberry part B2; Figs. 8e, Strawberry part A3; Figs. 8f, Strawberry part B3.

Table 1.
Technical specifications of Theta Lite type optical contact angle measuring instruments.
| Main Parameters | Technical Specifications | |
|---|---|---|
| Image resolution/pixel | 1280×1024 | |
| Maximum image acquisition speed/(ms·frame-1 ) | 203 | |
| diagonal/(mm) | 3.5 to 7.5 | |
| Light source | LED background | |
| LED light source voltage/V | 12 | |
| Contact angle measurement range/(°) | 0 to 180 | |
| Contact angle measurement accuracy/(°) | ±0.1 | |
| Surface tension measurement range /(mN·m-1 ) | 0.01 to 1000 | |
| Surface tension measurement accuracy/(mN·m-1 ) | ±0.01 | |
Table 2.
Main parameters of anatomical structure of strawberry leaf segments.
| Blade Structure Parameters | A1 | B1 | A2 | B2 | A3 | B3 |
|---|---|---|---|---|---|---|
| Blade thickness/μm | 118.43 | 119.27 | 131.49 | 127.31 | 135.46 | 136.35 |
| Upper epidermal thickness/μm | 18.25 | 19.01 | 21.18 | 20.54 | 24.42 | 23.18 |
| Lower epidermal thickness/μm | 6.96 | 7.15 | 8.37 | 8.10 | 9.13 | 8.98 |
| Thickness of cuticular membrane/μm | 5.87 | 6.04 | 6.23 | 6.05 | 7.25 | 6.87 |
| Vein thickness/μm | 265.44 | 263.19 | 289.52 | 293.83 | 301.74 | 299.96 |
| Fenestrated tissue thickness/μm | 55.36 | 54.67 | 63.65 | 61.72 | 70.04 | 69.81 |
| Spongy tissue thickness/μm | 41.50 | 43.48 | 48.74 | 47.43 | 51.20 | 50.13 |
| Leaf structure compactness/% | 46.74 | 45.84 | 48.41 | 48.48 | 51.71 | 51.20 |
| Leaf structure laxity/% | 35.04 | 36.46 | 37.07 | 37.26 | 37.80 | 36.77 |
| Stomatal size/μm2 | 37.56 | 36.98 | 40.43 | 39.44 | 44.51 | 45.80 |
| Stomatal density/(pcs/mm2) | 579.84 | 583.22 | 598.26 | 592.46 | 610.25 | 608.43 |
Table 3.
Trend surface modeling of the surface of each segmented part of the strawberry.
| Strawberry Leaf Segmented Parts |
Trend Surface Modeling | Correspondence Figure |
|---|---|---|
| A1 | Figure 7a | |
| B1 | Figure 7b | |
| A2 | Figure 7c | |
| B2 | Figure 7d | |
| A3 | Figure 7e | |
| B3 | Figure 7f |
Table 4.
Test of fitting results of 3D trend surface model at observational data.
| Trend Surface |
Sample Size |
Mean Value of Residuals | Standard Deviation of Residuals |
F | P | T | R2 | Er |
|---|---|---|---|---|---|---|---|---|
| A1 | 157 | -0.0017 | 1.7894 | 36.4556 | 0.0001 | 8.4231 | 0.5621 | 5.54% |
| A2 | 161 | -0.0023 | 2.5498 | 6.3072 | 0.0001 | 12.5213 | 0.1817 | 8.47% |
| A3 | 152 | -0.0088 | 1.7401 | 105.8041 | 0.0001 | 3.7642 | 0.7884 | 3.89% |
| B1 | 124 | -0.0072 | 3.3734 | 14.3248 | 0.0001 | 9.8604 | 0.4010 | 6.18% |
| B2 | 156 | -0.0029 | 2.8848 | 12.3740 | 0.0001 | 12.8649 | 0.3035 | 7.95% |
| B3 | 157 | -0.0013 | 1.5165 | 1.2746 | 0.2828 | 17.9727 | 0.0430 | 9.02% |
Disclaimer/Publisher’s Note: The statements, opinions and data contained in all publications are solely those of the individual author(s) and contributor(s) and not of MDPI and/or the editor(s). MDPI and/or the editor(s) disclaim responsibility for any injury to people or property resulting from any ideas, methods, instructions or products referred to in the content. |
© 2025 by the authors. Licensee MDPI, Basel, Switzerland. This article is an open access article distributed under the terms and conditions of the Creative Commons Attribution (CC BY) license (http://creativecommons.org/licenses/by/4.0/).
Copyright: This open access article is published under a Creative Commons CC BY 4.0 license, which permit the free download, distribution, and reuse, provided that the author and preprint are cited in any reuse.


