Submitted:
02 June 2025
Posted:
03 June 2025
You are already at the latest version
Abstract
Concussions are a prevalent form of mild traumatic brain injury caused by impacts, whichsubsequently interferes with normal brain function and may result in long-term neurological impairmentif not treated. In this report, we introduce a novel helmet designed for concussion protection, featuringa honeycomb-inspired structure and an embedded electroencephalogram (EEG) feedback system. Tocombat the rising number of sports concussions in Canada, the helmet is designed with a honeycombstructure that distributes and absorbs impact energies to minimize concussion incidence. It is alsoequipped with built-in EEG sensors that enable real-time brainwave analysis, thereby offering instantfeedback on the likelihood of concussion from impact. The system also includes artificial intelligencesoftware to compare brainwave data with cognitive performance metrics from tests such as verbalfluency, breath-holding, and finger tapping, thereby providing computerized analysis of health andrecommendations. Suitable for high-impact sports, everyday use, and at-risk populations, the helmetintegrates effective shock absorption with cutting-edge health monitoring, providing an end-to-endsolution for concussion prevention and early detection.
Keywords:
electroencephalogram
; deep learning
; artificial intelligence
1. Introduction
A concussion is a form of mild traumatic brain injury (TBI) that is caused by either a blow to the head or by the rapid movement of the brain within the skull, thus disrupting normal brain function. Common causes of the condition include sporting injuries, motor vehicle accidents, and other types of impact [1]. Concussions can produce a variety of symptoms, such as headaches, dizziness, and memory loss (e.g., amnesia), as well as long-term cognitive impairments [2]. In some cases, individuals may experience sudden loss of consciousness. A subsequent concussion occurring in close temporal proximity to the initial concussion can result in irreversible brain damage or death. Although most concussions are transient and fully recoverable, recurrent or severe impacts may result in chronic traumatic encephalopathy (CTE) or other permanent neurological issues [1].
Concussions and TBIs are an emerging public health concern in Canada, particularly for young athletes and contact sport participants. Public Health Agency of Canada [3] indicates that recreation and sport are leading causes of head injury, and the age group 10–19 has the highest rate of emergency department visits for concussions (Figure 1). Ontario and Alberta statistics reveal a considerable increase in concussions and TBIs over the past two decades, with an annual percentage increase (APC) of 13.0% for concussions and 9.2% for TBIs from 2010 to 2017 (Figure 2). These statistics highlight the need for improved protective gear and real-time brain injury monitoring to prevent further such injuries in youth.
To address the growing public health concern, we propose an innovative helmet for brain concussion protection. The helmet features a honeycomb structure that is designed to disperse and absorb impact forces, thus reducing the risk of concussions. Embedded electroencephalogram (EEG) sensors are used to monitor brain activity continuously and provide real-time feedback on potential concussion hazards when an impact is detected. A deep learning algorithm using a transformer framework analyzes the EEG data in conjunction with cognitive performance metrics derived from tests for attention, emotional processing, verbal fluency, breath holding, and finger tapping. Based on this analysis, the system evaluates the severity of the concussion and recommends appropriate interventions to minimize the risk of further injury. By combining enhanced shock absorption with cutting-edge health monitoring, this helmet offers a comprehensive solution for the early detection of concussion, ultimately improving athlete safety and preventing injuries.
2. Related Work
2.1. Helmet Structure
Kholoosi and Galehdar [4] proposed a graded honeycomb structure as an innovative alternative to traditional expanded polystyrene (EPS) foam, demonstrating that such a design remarkably improves energy dissipation over a longer time span. However, while these changes would seem to improve energy absorption, they concomitantly increase the amount of force transmitted and head acceleration, thereby raising considerable questions about the real-world safety implications of performance in helmets. Mills and Gilchrist [5] employed Finite Element Analysis (FEA) on bicycle helmet designs and concluded that while thicker EPS foam liners are effective in reducing linear acceleration, they are far less effective at controlling rotational acceleration, which plays a crucial role in the development of brain injury. Rowson et al. [6] conducted an empirical comparison between football helmets - the Riddell VSR4 and Revolution - based on data from 1,833 collegiate athletes. The results indicate that the Revolution helmet provided a 46.1% reduced risk of concussions, due to its additional foam thickness and better impact absorption properties. However, apart from this reduction, the study highlighted significant challenges in energy absorption for varying impact sites and the simultaneous requirement to maintain structural integrity for oblique impacts. These studies together accentuate both the promise and inherent limitations of modern helmet design, where challenges persist in mitigating rotational acceleration, ensuring uniform energy distribution, and optimizing helmet fit for real-world applications.
2.2. Electroencephalogram (EEG)
Recent advances in EEG technology have expanded its use from the traditional clinical setting to wearable, real-time cognitive monitoring. The integration of EEG into portable devices has opened up new possibilities for the assessment of cognitive function, the development of brain-computer interfaces (BCIs), and the use of neural monitoring solutions in dynamic environments. The key technical challenges in helmet-based applications—like motion resistance, electrode stability, and smooth integration with other systems—require close scrutiny in order to ensure high fidelity of signals. For instance, Sun and Xu [7] used wavelet decomposition combined with autoregressive models to examine EEG signals induced by alpha wave music, showing improvements in the working memory performance. Their approach, achieving an 83.3% classification accuracy using a k-nearest neighbor (KNN) classifier, indicates the considerable requirement for efficient EEG feature extraction techniques that are equally effective for helmet-based systems.
Designing an EEG cap to be embedded in a helmet introduces further complexities. Uktveris and Jusas [8] presented the design of a modular EEG acquisition board based on the ADS1298 analog front-end sampling chip, having a common-mode rejection ratio (CMRR) of –97 dB within the frequency range 0–70 Hz , thereby making it suitable for EEG recording. In another effort to enhance portability and usability, Zhang et al. [9] implemented a dry-electrode, wireless BCI headset based on the ADS1298, but the issue of signal degradation due to motion artifacts persisted. To mitigate such disadvantages, Mahmood et al. [10] introduced a soft, stretchable BCI device equipped with four dry, needle-like electrodes that conform to the skin, significantly reducing motion artifacts and enhancing signal stability over conventional rigid systems. In spite of these successes, additional effort is required to provide scalability and robustness over a variety of real-world scenarios.
2.3. Deep Learning in EEG
Deep learning for EEG signal processing has achieved remarkable performance improvement over traditional methods. Algarni et al. [11] used a Bi-Directional Long Short-Term Memory (Bi-LSTM) network for emotion recognition and Binary Grey Wolf Optimization (BGWO) algorithm for feature selection. This method yielded classification accuracies of 99.45% for valence, 96.87% for arousal, and 99.68% for liking, demonstrating the higher ability of Bi-LSTM networks in modeling the temporal dynamics of EEG signals. Seraphim et al. [12] introduced SPDTransNet, a Transformer-based model for automatic sleep stage classification. With covariance matrices to encode spatial inter relationships and a Transformer network to model temporal dependence, SPDTransNet achieved state-of-the-art on multiple datasets primarily due to the use of Riemannian-geometry-based feature extraction. Similarly, Wan et al. [13] proposed EEGformer, which combined the use of a one-dimensional Convolutional Neural Network (1D-CNN) as a feature extractor and a multi-layer Transformer encoder. This model effectively identifies regional, synchronous, and temporal dependencies of EEG signals, and thus establishes new standards in classification performance on several EEG datasets such as SSVEP, emotion recognition, and depression detection datasets. Collectively, these studies highlight the breakthrough capability of deep learning models—particularly Transformer-based models—in elevating the representation and classification capacity of EEG signals.
2.4. Summary
Our design and development of brain concussion protection helmets are founded on significant advancements in three areas: structural design of helmets, wearable EEG systems, and EEG analysis using deep learning. Honeycomb-like helmet structures have been demonstrated to provide better energy dissipation but are found to be accompanied by larger force transfer and head acceleration. Our approach aims to optimize the honeycomb structure configuration to realize a balanced reduction of impact forces, thereby improving overall safety. Concurrently, the integration of EEG sensors in the context of a helmet necessitates careful consideration of motion artifacts and electrode stability—problems that have been methodically resolved in recent research on wearable EEG devices. With a 16-channel wet electrode EEG cap, our system is designed with signal accuracy and stability in mind, making it ideal for high-motion applications such as sports. Further, the application of Transformer-based deep learning models allows the effective analysis of complex EEG data, facilitating real-time concussion risk evaluation based on subtle brainwave activity and cognitive performance metrics. In combining these technological advancements, our helmet is an end-to-end AI-driven solution that bridges the gap between structural impact reduction and sophisticated physiological monitoring for early concussion detection and prevention.
3. Methodology
3.1. Helmet Structure
The CAD model of the helmet was designed in Fusion 360 to establish accurate dimensions and structural strength. A prototype was 3D-printed using TPU (Thermoplastic Polyurethane), which is both durable and flexible. This section explains the approach followed to determine the size, shape, and thickness of the helmet to ensure an optimum fit and enhanced protective function.
The design process started with the choosing of suitable dimensions in accordance with the EN960 standard for headforms to be utilized in helmet testing (Figure 3). This standard defines significant reference planes, points of measurement, and head size distributions that are commonly utilized in the design of protective equipment.
Head circumference is usually measured with a flexible measuring tape around the widest portion of the head—about 2.5 cm above the eyebrows. In our measurements, the subject’s head diameter was measured at 560 mm. To fit the EEG cap which was integrated, an extra 75 mm was included to compensate for its thickness, up to an inner oval diameter of around 635.77 mm. In the Fusion 360 software, the inner oval was defined by a 228 mm major axis and a 175 mm minor axis (Figure 4a). The outer shell was crafted to achieve a uniform thickness of 36.75 mm, consistent, within the accepted standards for helmets (30–40 mm). The inner oval dimensions were proportionally adjusted to create the outer shell, where the major axis was 310 mm, the minor axis 240 mm, and the overall outer diameter of 867.44 mm. Additionally, the outer oval was also rotated 15° clockwise to better track to the natural tilt of the human head, thereby enhancing ergonomic fit (Figure 4b).
3.1.1. Design Steps
Figure 5a shows the initial helmet shape, which was designed as an egg-like structure using the Revolve tool in Fusion 360. A side-view sketch that determined the overall shape was then constructed and developed using the Extrude tool. This sketch incorporated ear protection openings, which were designed to achieve a compromise between protection, ventilation, and comfort. The front of the helmet was designed to be flat, and the rear was designed to be sloped for improved protection. Additionally, rectangular openings were subsequently cut from the regions marked for ear protection and the lateral posterior part to allow the passage of straps for fastening securely. The inner oval, crafted to accommodate the size of both the EEG cap and the user’s head, was then cut out using the Revolve tool, thereby generating an inner shell mirroring the outer shape.
Following the determination of the overall helmet geometry, attention was turned to the development of a honeycomb structure that would serve to increase impact distribution while reducing mass simultaneously. Hexagonal arrangements were strategically distributed, with more sophisticated configurations used in regions exposed to high impact, including the crown and lateral regions, to maximize energy dissipation. Concurrently, open-cell honeycomb voids also serve as a means for ventilation, thus enabling better airflow and reducing weight further. As shown in Figure 5b, the honeycomb pattern was instantiated by first drawing an individual hexagon with a 12.5 mm side length. Using the Rectangular Pattern tool, this hexagon was copied into a 6 × 10 array with 8 mm vertical and 25 mm horizontal inter-hexagon spacing, thus achieving a uniform distribution that maintains structural integrity while maximizing both weight reduction and impact absorption.
The honeycomb design was thereafter mapped onto the curved surface of the helmet through the use of the Emboss tool to enable accurate extrusion cuts resulting in the final honeycomb structure (Figure 5c). Hexagonal junctions at areas where hexagons overlapped significant structural points or points of attachment were carefully avoided to maintain overall strength.
In order to enhance the integration of the EEG cap, a protective compartment was particularly modeled to securely contain the EEG circuit boards, while being easily removable and serviceable (Figure 5d). The integration started with the modeling of a rectangular opening at the rear part of the helmet using the Extrude tool, hence providing an opening for housing the circuit.
Figure 6 shows the optimized design as the final step, where a box-like structure was modeled and extruded to create the protective enclosure for the EEG components. In order to enhance the weight and space efficiency of the compartment, the Shell tool was utilized to hollow the interior of the enclosure. Two apertures were introduced at the bottom to provide wire routing, thereby holding the circuit boards firmly in place while also making it convenient to make changes or replacements.
3.2. Electroencephalogram (EGG)
3.2.1. Hardware Design Overview
Figure 7 illustrates the general design flowchart of the system hardware. It begins with hardware conceptualization and the selection of hardware that complies with the given equipment requirements. Following the initial phase, schematic and PCB designs are made in detail. Once the hardware is assembled, soldering and methodical debugging are performed on it. Finally, rigorous performance testing is conducted and a series of experiments is performed to validate the effectiveness and reliability of the device.
Since EEG signals inherently possess low amplitude and high rates of noise. In order to process and record them effectively, BCI devices must meet several significant requirements:
- High Signal Resolution: Can sample, store, quantify, and encode EEG signals at the microvolt level.
- Rapid Sampling and Processing: Guaranteeing real-time sampling, decoding, and processing of EEG signals.
- Medical Safety Compliance: Ensuring adherence to safety regulations by implementing suitable power isolation for the device’s electrical supply and maintaining signal isolation for communication purposes.
- Reliable Data Transmission: Enabling stable data transfer to a host computer through wireless and wired communication channels.
EEG signal acquisition systems consist of several interconnected subsystems. The subsystems are electrode lead interface circuits, a preprocessing circuit with functions such as filtering, amplification, and baseline adjustment, an Analog-to-Digital Converter (ADC) circuit, and a central processing unit incorporating control, communication, and storage capabilities. As illustrated in Figure 8, the electrode lead interface circuit is responsible for initially accepting raw EEG signals and sending them to the preprocessing circuit. During this phase, a filter circuit eliminates undesirable high-frequency components, thereby restricting the dynamic range of the signal and improving its temporal and spectral qualities. Following this process, an amplification circuit amplifies the feeble EEG signals, while a zero-adjustment circuit eliminates interference, such as DC drift and common-mode signals, thereby improving the overall quality of the signal. The ADC circuit is then used to convert the conditioned analog signals to digital form, with best performance achieved using an ADC of resolution of at least 16 bits. The core processing circuit handles acquiring and decoding EEG signals, which are stored locally before the communication module sends them to the host computer where further processing and feature extraction occur.
Due to the intrinsic challenges of low amplitude and high noise of EEG signals, along with the challenges of implementing efficient preprocessing circuits, achieving high ADC resolution and samplings rates, our system employs a bespoke hardware solution. LegendSemi LH001-99 analog front-end sampling chip is utilized in the acquisition, amplification, and conversion of EEG signals, whereas Espressif’s ESP32S3 microcontroller unit (MCU) chip serves as the core processing unit. The microcontroller unit decodes EEG signals, enables local data storage, and oversees communication, thus guaranteeing the BCI system’s effective and reliable functionality.
3.2.2. Electrostatic Discharge (ESD) Isolation and Pre-filtering Circuit Design
This section explains the design considerations and implementation of the ESD isolation and pre-filtering circuits. High-precision electronic devices are vulnerable to ESD and voltage surges in practical applications. Moreover, electromagnetic interference (EMI) and voltage fluctuations not only threaten the safety of users of brain-computer interface (BCI) equipment but also deteriorate the precision of EEG signal acquisition and data transmission. Hence, electromagnetic compatibility and adherence to medical equipment safety standards are very important, for which proper ESD isolation practices are essential.
For this purpose, the TPESD5431N chip from TI is employed as the ESD protector. This is a low-capacitance, four-channel voltage suppressor that effectively absorbs and dissipates energy from ESD, EMI, and high-speed over-voltage pulses, thus safeguarding sensitive electronic components and circuitry. The ESD protection is presently applied over ten lines for signal transmission: eight for the sole purpose of acquiring the EEG signals, one for the reference signal, and one for the right-leg drive signal, as shown in Figure 9a.
In addition to ESD isolation, the inherent nature of EEG signals—i.e., low amplitudes and dominance of energy in the 0.1 Hz to 30 Hz frequency range—requires the inclusion of a pre-filtering stage. In order to filter out high-frequency noise prior to the chip obtaining EEG signals, a first-order passive low-pass filter circuit is employed. As the LH001-99 chip can collect eight channels of EEG signals, an equivalent first-order passive low-pass filter for each channel is utilized. The circuit schematic diagram of this filter is presented in Figure 9b. The cut-off frequency of the theoretical design is determined by Equation (1), and is positioned above the principal energy concentration of the EEG signals. Not only does this design parameter meet the particular requirements for EEG recording, but it also makes the recording of other common physiological signals, like ECG and EMG, possible since they normally have higher effective frequency ranges.
3.2.3. Analog Front-End Signal Acquisition Circuit Design
In this section, we elaborate on the analog front-end signal acquisition circuit design that takes charge of amplifying and digitizing the faint analog EEG signals for further processing. The circuit executes programmable gain amplification (PGA) along with analog-to-digital conversion (ADC), transforming the bioelectric signals being picked up into high-fidelity digital format.
For this purpose, we have selected the LH00199 analog front-end sampling chip from LegendSemi. The chip is a state-of-the-art, low-noise, low-power, multi-channel bioelectric signal acquisition solution with 24-bit high-resolution ADC capability and programmable gain support. It is widely used in biomedical and neuroscience research for applications such as EEG, ECG, and EMG signal acquisition applications.
The LH00199 also features 8-channel ADC simultaneous sampling at 24-bit resolution with a sampling rate of up to 16 kHz. Its –110 dB minimum common-mode rejection ratio (CMRR) also meets the high requirements of modern brain-computer interface (BCI) devices. Moreover, the chip’s internal registers are configurable, allowing for the adjustment of channel operating modes, PGA gain multipliers, ADC sampling rates, and acquisition types to meet given application demands.
Figure 8 illustrates the LH00199 functional block diagram, where the differential input pins are represented in pairs IN1P to IN8P and IN1N to IN8N. The input signals are first amplified through the programmable gain amplifiers (PGA channels A1 to A8) prior to being converted to digital data by the respective 24-bit ADC channels (ADC1 to ADC8). The digital data thus acquired are stored in an internal buffer before being transmitted serially through the SPI interface. Each falling edge of the DRDY pin marks the completion of an analog-to-digital conversion, aligning the data transfer with the SCLK, which is the SPI communications clock.
The reference voltage is provided via the VREFP and VREFN pins. When the internal reference buffer is enabled, the device generally functions with a reference voltage of around 4.5 V, as specified by Equation (2). With a 24-bit analog-to-digital converter (ADC), the minimum resolution of bioelectric signals calculated from Equation (3) is adequate for measuring non-invasive EEG signals that typically exhibit amplitude variations in the range of approximately 0.5 V to 200 V. This resolution is satisfactory for the LH00199 to fulfill the stringent requirements of accurately capturing high-fidelity EEG signals.
3.2.4. Main Control Chip Core Circuit and Peripheral Circuit Design
This section outlines the design considerations for the reset and download circuits, along with associated components such as buttons, which are vital to guarantee strong system performance and improve user interaction.
Reset Circuit
A reliable reset circuit is essential for initializing the microcontroller to a known and stable state. In our design, a dedicated reset button is interfaced directly with the microcontroller’s reset pin. When this button is pressed momentarily, it takes the reset pin to its low state, thereby triggering a hardware reset and ensuring that the device restarts its operations in an expected way. To minimize the chances of false resets caused by electrical noise, a pull-up resistor is utilized which keeps the reset pin in a high logic state during normal operation.
Download Circuit
The download circuit enables firmware programming by creating an interface for communication between the microcontroller and the host computer. In our design, we utilize a USB-to-serial converter in the form of the CH343P (Figure 10), which effectively interfaces the USB port and the microcontroller’s serial port. This circuit typically includes a USB plug, a voltage level converter where required to scale the logic levels between the USB interface and the microcontroller, and isolation capacitors that maintain the integrity of the signals. Collectively, these elements provide stable data transfer and effective programming of the microcontroller.
3.2.5. Power Circuit Design
This section presents a comprehensive overview of the power circuit design. The system is supplied by a 600 mAh lithium-ion battery with a nominal voltage of 3.7 V. To minimize power ripple and reduce overall power consumption, a low-dropout (LDO) regulator is employed to provide the necessary operating voltages to the different chips in the system in an effort to minimize power ripple and improve overall energy efficiency. The chip operating voltages are mainly divided into two groups: +3.3V supply for the LH001-99 chip analog operating voltage, +4.2V/+5V to 3.3V digital supply, +4.2V/+5V to 3.3V analog supply, and +3.3V digital supply for the LH001-99 chip, with +3.3V supply for the MCU chip’s core operating voltage. To meet the safety standards in medical devices, further electrostatic protection circuits are used on the battery output.
In the selection of digital LDOs, there were two separate devices that were utilized to serve the requirements of both digital and analog circuits. The ME6211 (Figure 11) was used for the digital supply since it features a high maximum output current of 500 mA that is needed for powering several digital devices simultaneously. Conversely, the LP5907 (Figure 12), having a 250 mA maximum output current, is considered adequate for supplying a stable reference voltage to the analog supply of the two LH001-99 chips, which both have comparatively lower current requirements.
Several important parameters influenced our decision:
- Quiescent Current: LP5907’s typical quiescent current is only 12 A, much lower than the 30 A for ME6211, which is crucial in order to extend the battery life of handheld devices.
- Dropout Voltage: The LP5907 is more effective with dropout voltages of 50 mV at 100 mA and 120 mV at 250 mA, while the ME6211 has 120 mV and 260 mV, respectively.
- Power Supply Rejection Ratio (PSRR): The LP5907 with an 82 dB PSRR at 1 kHz far exceeds the ME6211’s 70 dB PSRR, thereby rejecting power supply noise much more effectively—of vital importance in noise-sensitive circuits such as RF circuits and EEG acquisition.
- Output Noise: The LP5907 also shines in its low output noise, at 6.5 V RMS (tested between 10 Hz and 100 kHz) versus 50 V RMS for the ME6211 (tested between 300 Hz and 50 kHz). This low noise is essential for high-accuracy sensor uses, like EEG equipment.
Overall, the ME6211C33M5G with high current handling capacity (500 mA) is best suited to supply parts that need more power, like portables and communication wireless modules, although it has a comparatively higher quiescent current. The LP5907MFX-3.3/NOPB with low quiescent current and low noise output is best suited to analog circuits and applications where noise reduction is significant. Together, these LDOs fulfill our design specifications by delivering efficient power conversion and stable operation in both analog and digital applications.
3.3. Deep Learning in EEG
To effectively classify and analyze EEG signals, we present a hybrid deep learning framework that merges a one-dimensional Convolutional Neural Network (1D-CNN) for capturing local features with a Transformer-based encoder for capturing long-range temporal dependencies. The merged framework takes advantage of the complementary properties of the two components, leading to state-of-the-art results on EEG signal classification tasks even with limited training data.
3.3.1. Data Collection
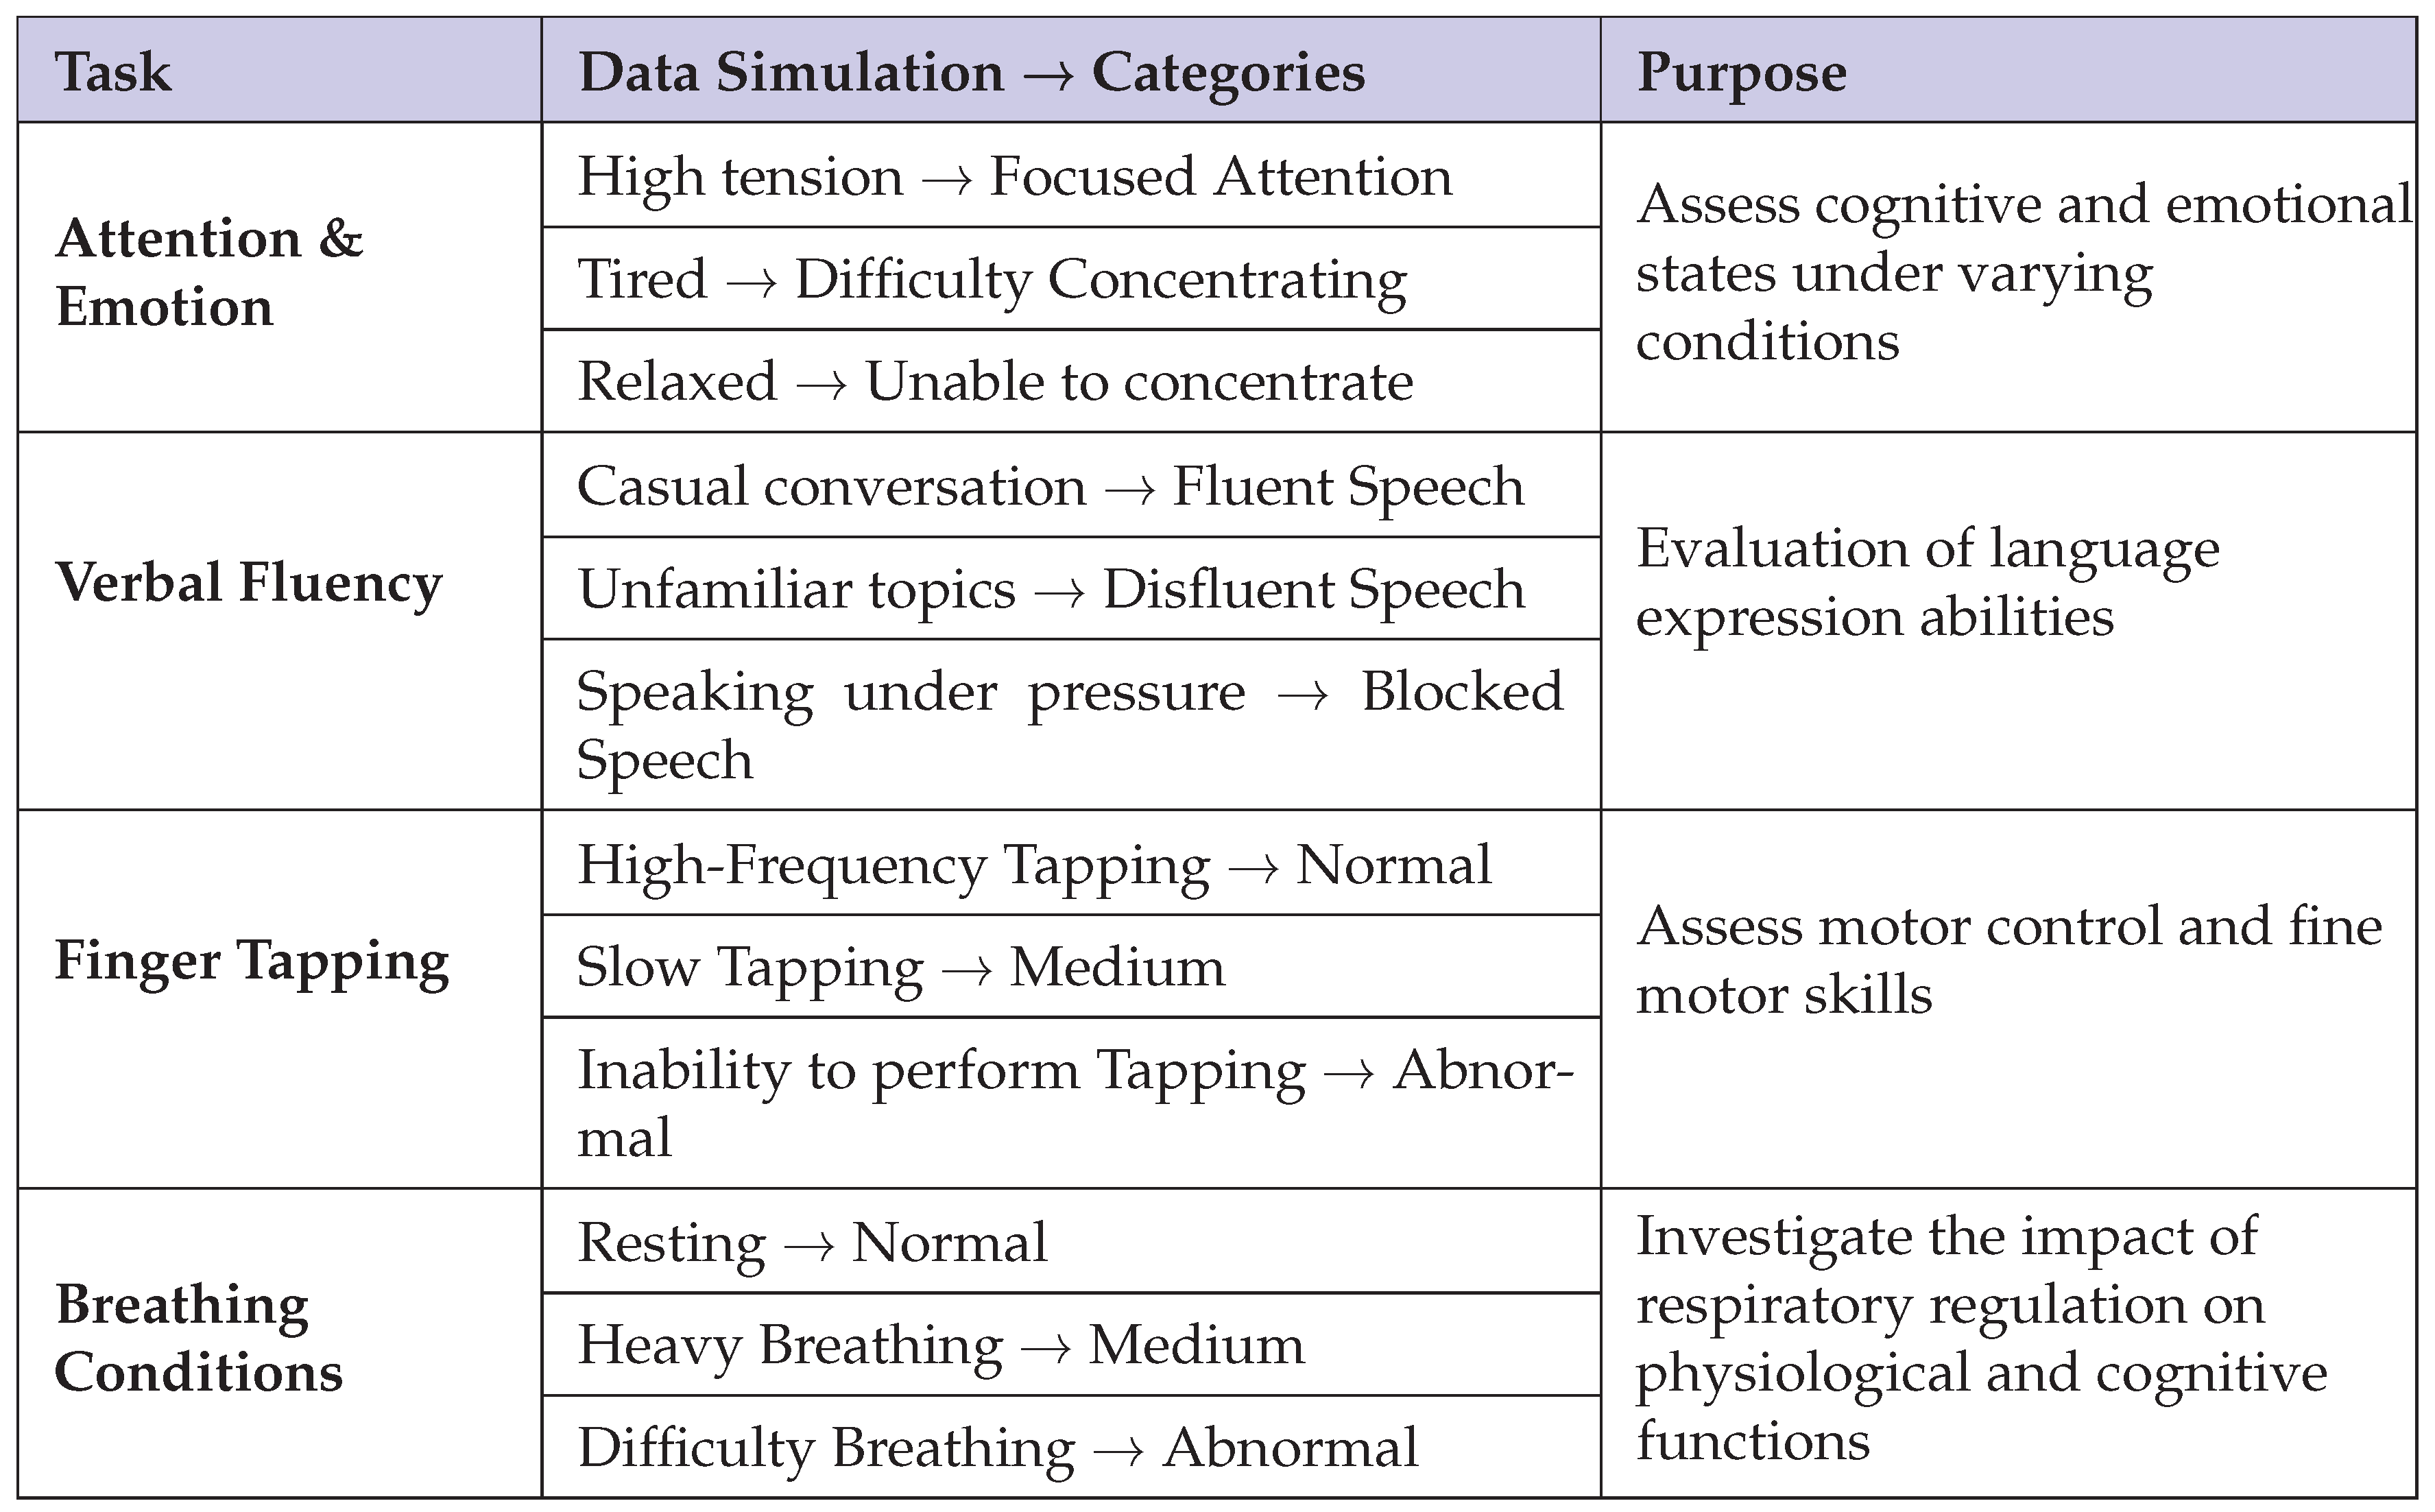
To assess the level of concussive incidents, participants were required to complete a battery of four tasks that were specifically tailored to examine several cognitive and behavioral domains: attention and emotion, verbal fluency, finger tapping, and respiratory conditions. Each task was specifically developed to provide multidimensional data that reflects both behavioral and cognitive status, and this was subsequently divided into subcategories to reveal subtle changes in performance. Specifically:
- Attention and Emotion: The data were collapsed into three states—focused attention, difficulty concentrating, and inability to concentrate—to reflect varying degrees of attentional engagement and emotional arousal.
- Verbal Fluency: Classification of speech into fluent, disfluent, and blocked categories gives an overall evaluation of language production abilities.
- Finger Tapping: Performance was divided into high-frequency tapping, slow tapping, and inability to tap, which was used as an index of motor control and fine motor function.
- Breathing Conditions: Categorization of breathing states into normal, heavy, and labored patterns provided the opportunity to conduct an extensive examination of the interaction between respiratory control and cognitive activity.
Direct collection of EEG data from subjects who currently have active concussive symptoms is highly challenging; therefore, our dataset was generated through the utilization of simulated environments that mimic the different levels of concussion severity. Each of the simulated environments was meticulously paired with the respective subcategories within the four domains of tasks. Table 1 provides a detailed breakdown of these scenarios and their respective categories.
The output EEG data as time-stamped CSV files contain channels of single electrode measurements and corresponding voltage values. The dataset, comprising 12 distinct labels and a total size of 93.7 MB and approximately 500,000 records, makes a solid foundation for subsequent deep learning analysis.
3.3.2. Data Processing
A rigorous data processing pipeline was created for maintaining the quality and consistency of the EEG dataset that would be utilized in training deep learning models. The pipeline has a number of phases—data loading, filtering, truncation, normalization, and padding—that convert raw EEG signals into a ready-to-analyze form.
Raw EEG signals may be adulterated with noise sources such as electromyographic artifacts and power line interference. In order to isolate the frequency components related to cognitive and behavioral states, we apply a fourth-order Butterworth band-pass filter, where the cutoff frequencies are 7.3 Hz and 15.5 Hz. Although these thresholds are primarily within the (8–12 Hz) and (13–30 Hz) bands, they clearly emphasize the signal components pertinent to attention, affective states, and motor control. Filtering is executed separately for each channel to maintain the spatial resolution characteristic of the EEG data.
To standardize the temporal dimension across samples, each EEG sequence is zero-padded or truncated to a fixed length of 5000 time points. Sequences with a longer length are truncated to the first 5000 points, and shorter sequences are zero-padded as required. Each recording contains 16 channels, and we normalize each channel independently by computing its mean and standard deviation and transforming the data to a zero-mean, unit-variance distribution using the formula:
where x represents the values of each channel, and denote the mean and standard deviation respectively, and represents the normalized value.
After running these processing operations, the data is organized in the form of an tensor, where N is the number of valid samples, is the sequence length set by us, and denotes the number of EEG channels. A following analysis of the label distributions confirmed that the data still has a relatively balanced representation for all the categories.
3.3.3. Model Structure
To efficiently process EEG signals and achieve high-accuracy multi-class classification of cognitive tasks, we proposed EEGConvTrans, a hybrid model that integrates the localized feature extraction strengths of CNNs with the global contextual modeling advantages possessed by a Transformer encoder. As shown in Figure 13, EEGConvTrans consists of four primary modules: input normalization, feature extractor, Transformer encoder, and classification head.
Input Normalization
To decrease the large amplitude variability present within raw EEG signals, a first batch normalization layer is utilized. By doing this, the input data are normalized, decreasing scale variability and improving the consistency of the following training phases.
Feature Extractor
The input raw 16-channel EEG time series is initially fed through a 1D-CNN for the purpose of extracting meaningful local temporal features. The feature extractor consists of three stacked convolutional layers in a sequence of convolution, ReLU activation, and batch normalization. The convolutional layers employ a kernel size of 5 with appropriate padding to preserve temporal resolution. As shown in Figure 14, the first layer increases the channel dimension from 16 to 64, the second layer increases it further to 128, and the final output is determined with a dimension = 128, which will serve as the input for the subsequent Transformer encoder.
Transformer Encoder
To capture the global contextual relationships along the EEG sequence, a four-layer Transformer encoder is employed (Figure 15). Every Transformer layer consists of a multi-head self-attention mechanism (MHSA) and a feed-forward network (FFN). The encoder is configured with an input dimension of = 128 and eight attention heads to extract diverse features from different segments of the sequence. Dropout is used in the Transformer layers to prevent overfitting, thus taking advantage of the encoder’s ability to model long-range dependencies that are critical in EEG signal analysis.
Classification Head
After feature extraction and contextual modeling, a global average pooling (GAP) operation aggregates the features along the temporal dimension, thereby lowering computational cost and improving robustness to variability in sequence length.
The resulting feature vector is input through a classification head (Figure 16), which comprises two fully connected layers interspersed with a ReLU activation function and a dropout layer (with a specified dropout probability of 0.5). The first fully connected layer transforms the feature vector to a 128-dimensional representation to achieve maximum non-linearity, whereas the last fully connected layer projects the features onto K output classes, yielding the final classification results.
4. Experimental Results
4.1. Helmet Testing
In order to comprehensively examine the impact absorption and durability characteristics of our helmet model, we conducted a series of controlled experiments.
4.1.1. Internal Structure Test
To compare the performance subjected to impact w.r.t. different internal structures, we produced three samples (As shown in Figure 17a, from top to bottom, they are: circular, honeycomb, and solid) using 3D printing technology with the dimensions 58 mm × 58 mm × 15 mm and an average weight of around 16 g. A steel ball of 303 grams was dropped from a 90-meter height and released on top of each sample, which was positioned over a thin-film pressure sensor attached to an Arduino Uno board (Figure 17b). The data obtained from the sensor were normalized to be calibrated to force units in Newtons (N) so that the impact response could be assessed for horizontal (flat) and vertical (standing) modes.
Figure 18a and Figure 18b show the horizontal and vertical impact absorption comparison among different internal structures, respectively. When the samples were positioned horizontally, the solid sample absorbed the highest amount of energy, with the pressure recorded at approximately 225 N. This is due to the fact that it has a consistent density and grid-like distribution of materials, compared to the honeycomb and circular samples which contain voids to accommodate an equal mass. In contrast, in vertical orientation, the honeycomb structure exhibited superior performance to other structures by efficiently absorbing the impact energy through recorded pressures of about 150 N. The ability of the honeycomb structure to deform upon impact allows for more energy dissipation, whereas the circular shape resulted in modest performance at about 170 N. In contrast, the solid sample, which did not have any deformation capacity in this orientation, showed elevated pressures above 200 N.
Since forces encountered in real-world scenarios—particularly as they pertain to sporting injuries—are typically applied in a manner more similar to vertical alignment, the findings validate the effectiveness of the honeycomb structure for minimizing the potential for head injury.
4.1.2. Stress Distribution Test
To further supplement our experimental findings, we performed a Finite Element Analysis (FEA) of the helmet under two different loading conditions: top-down (vertical) and front-to-back (horizontal). In each of these analyses, a 500 N load was applied to the helmet, and the ensuing von Mises stress distribution was examined. The stress distribution was visualized using a color gradient, with red and yellow indicating where the highest levels of stress were located (regions of possible failure) and green and blue denoting regions of lower stress (indicative of better energy absorption).
For top-down loading (Figure 19a), the FEA showed that the stress was localized primarily at the impact point, with a relatively uniform distribution across the helmet and without any localized areas of high stress, demonstrating appropriate dissipation of impact forces. However, under force from front to back (Figure 19b), there were high stress concentrations, especially along the edges of the honeycomb cells and the frontal region of the helmet. Such localized concentrations of stress represent regions where additional reinforcement of the material can be useful.
In general, both empirical and simulated data indicate that the honeycomb structure significantly improves the impact energy dissipation capability of the helmet. The stress concentrations that have been identified at the cell peripheries do, however, indicate directions for future optimization with the goal of making these areas stronger and further enhancing the overall structural capacity.
4.2. EEG Testing - Comparison of Multi-level EEG Signal Denoising
4.2.1. EEG Signal Acquisition and Wireless Output Program
The main goal of this program is to read EEG signals using an ESP32 device and send them wirelessly via BLE.
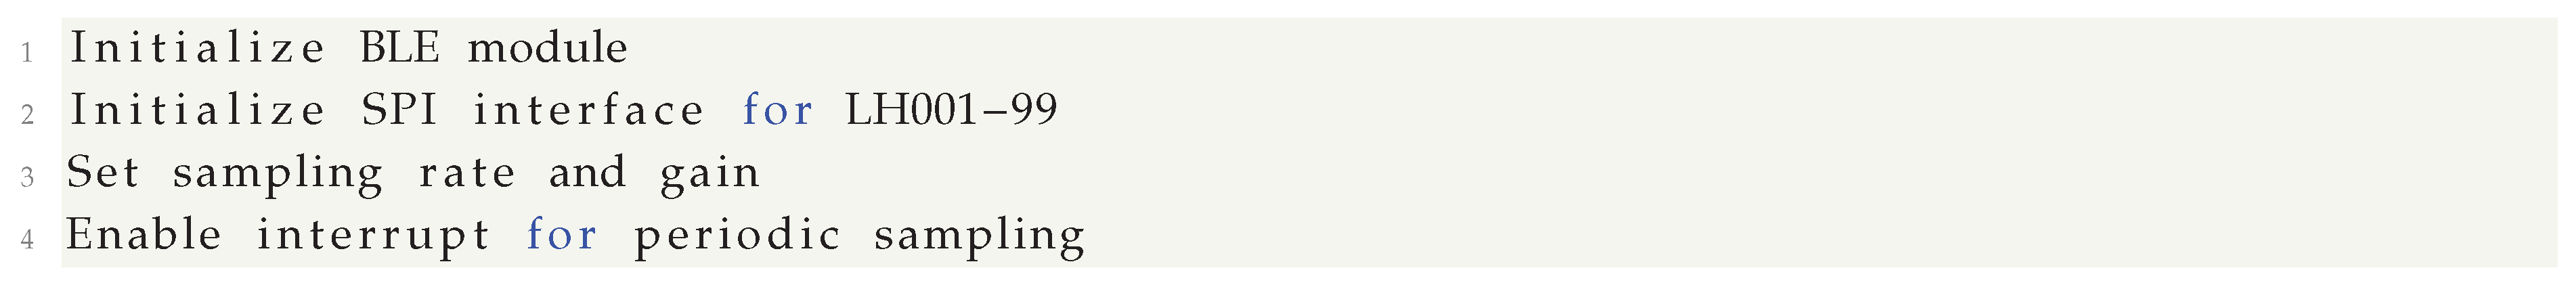
Device Initialization
Initialize the BLE device and LH001-99 chip in ESP32 at the start of the program. This includes setting the sampling rate and initializing the relevant hardware parameters such as gain. Pseudocode example is as follows:
Device Acquisition
Periodic interrupts trigger the ADC for sampling of EEG data. Save the data in a circular buffer after each sample. This improves the efficiency of the data processing and provides buffering space for subsequent BLE data packaging. Pseudocode example is as follows:

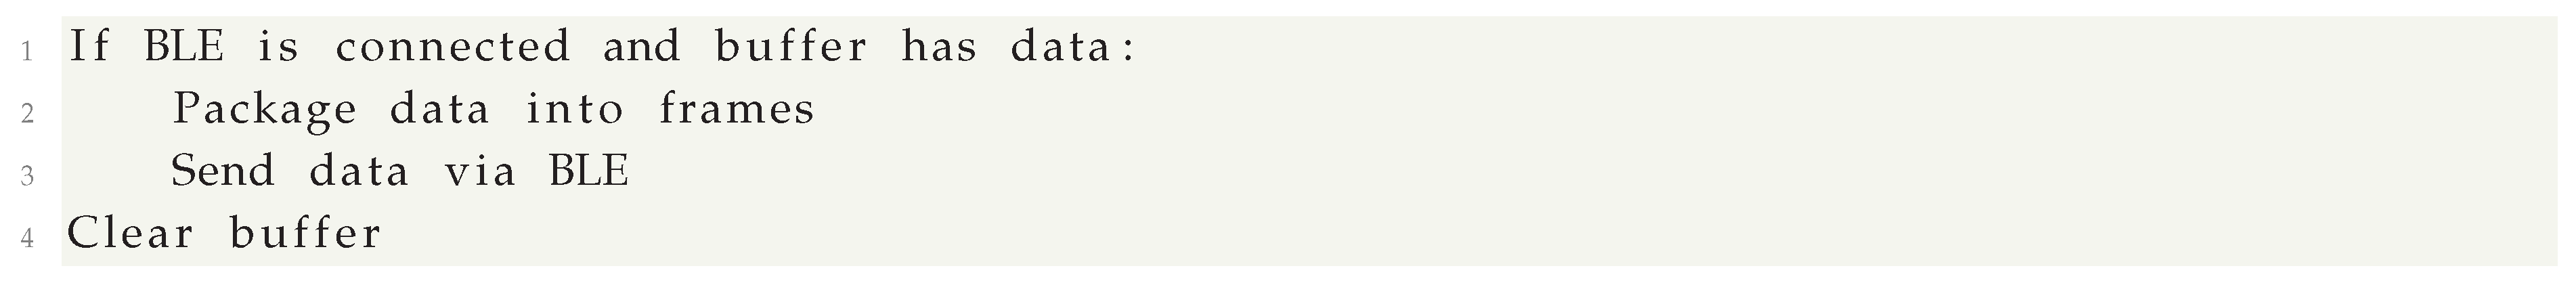
Data Packaging and BLE Transmission
Package and send the recorded EEG data to the BLE client based on the BLE connection status and buffer state. This ensures that the data transmission is triggered by the BLE buffer when full, and there is continuity of data transmission flow. Pseudocode example is as follows, and the primary task of this program is to receive EEG data from the ESP32 board via BLE and process it.
BLE Scanning and Connection
The program searches for nearby available BLE devices and connects based on the given device name or address. This establishes the fact that the PC is successfully connected to the ESP32 device to transfer data. Pseudocode example is as follows:

Data Reception
After establishing the connection, receive EEG data from the device by listening to standard notifications. This part also encompasses processing the received data and transmitting it to a serial port or other display mechanism to view data and analyze further. Pseudocode example is as follows:

Connection State Management
Depending on the BLE connection status, decide whether to rescan and reconnect the device. This ensures stability of the Bluetooth connection and continuous reception of EEG data. Pseudocode example is as follows:

This design architecture facilitates efficient acquisition and transmission of EEG signals through a minimized hardware environment and respective software logic. In addition to supporting efficient transmission, it also allows for further processing and analysis of the EEG signals.
4.2.2. Analyzing EEG Signal Spectrum
In this section, we will demonstrate how to process EEG data with filters and use Fourier Transform to examine the spectrum of the signal. This includes data loading, filtering of the signal, and spectral analysis.
Data Loading and Initial Processing
We first load the EEG data from a CSV file, extract a few channels of interest to analyze, and set up the sampling rate for processing signals:

Bandpass Filtering
For the preprocessing of EEG signals, we apply a bandpass filter (Butterworth filter) to retain signals within a specific frequency band (e.g., between 6Hz and 45Hz), removing noise outside of it:

Bandstop Filtering
Then, a bandstop filter is used on the signal particularly to combat power line interference, which is widespread in the utility frequency range (e.g., between 20Hz and 51Hz), thereby eliminating these undesired frequency components.

Averaging and Trimming Signals
After filtering, we average over signals from multiple channels to minimize the impact of random noise. We also trim the data at both ends to eliminate edge effects:

Fourier Transform and Spectrum Analysis
Take a Fast Fourier Transform (FFT) of the processed data to examine the frequency components of the signal. Plot a frequency spectrum and identify the component with the highest frequency, giving a foundation for signal analysis.

With these methods, the unwanted frequency interference can be effectively removed, the crucial frequency components in the EEG signals can be easily identified, and a reliable foundation for further analysis of bioelectrical signals is created.
4.3. Deep Learning in EEG
In this section, we present the results achieved by four separate classification tasks: attention and emotion, speech fluency, finger tapping, and breathing state. In each task, a separate classification model was trained and its performance evaluated based on loss and accuracy metrics.
4.3.1. Attention and Emotion Task
The attention and emotion task was designed to evaluate cognitive and emotional states under different conditions. The data were categorized into three groups: focused attention, difficulty in focusing, and inability to focus. As illustrated in Figure 20, the training loss decreases sharply from its initially high position and reaches a point of stabilization at around the 20th epoch, which is a sign of successful model convergence in relation to the training data. Meanwhile, the validation loss also takes a declining trend, but with slight fluctuations in the later epochs. The training accuracy rises very rapidly to almost 100%, whereas validation accuracy rises considerably and remains high after some fluctuations. These trends confirm the effectiveness of the model in classifying the three cognitive and affective states.
4.3.2. Speech Fluency Task
The speech fluency task evaluates the language expression skills through classifying speech into three categories: fluent speech, non-fluent speech, and speech impairment. As shown in Figure 21, the training loss for this task demonstrates a sharp decline in the early epochs prior to the gradual stabilization. While the validation loss presents an early increase—depicting an initial limitation in generalization—the later decrease and stabilization demonstrate enhanced performance with continued training. Training accuracy increases steadily to exceed 90% in later epochs, while validation accuracy, despite there being extremely high variations in early stages, finishes at 100%. The result confirms that the model generalizes well across the full extent of speech fluency levels.
4.3.3. Finger Tapping Task
The finger tapping task evaluates motor control and precision of fine motor skills by classifying performance into three categories: normal tapping, moderate tapping, and abnormal tapping. As shown in Figure 22, the model’s training loss illustrates a consistent decline to a stabilization point at epochs 40 and 50, with a constantly low value. The validation loss, however, indicates an increasing trend in the later periods of the training process. Notably, training accuracy achieves 100% by epoch 30, but validation accuracy features considerable fluctuations. Despite these variations, the overall performance indicates that the model features a reasonable degree of generalization in motor control evaluation via finger tapping. Further optimization may be required to minimize the fluctuations observed in the validation metrics.
4.3.4. Breathing State Task
The breathing state task investigates the relationship between respiratory control and other cognitive and physiological processes, categorizing data as normal, moderate, and abnormal breathing states. As shown in Figure 23, the training loss for this task converges rapidly and remains at a low level. Meanwhile, validation loss is consistently high and shows large variability during the training. Both training and validation accuracies exhibit considerable variability, and overall, ; moreover, the model’s performance on this particular task is comparatively lower than that observed for the other tasks, with a final accuracy of approximately 80%. These results suggest that additional improvement, such as more sophisticated feature engineering or model optimization, might be necessary in order to increase classification performance on breathing state data.
5. Discussion
5.1. Conclusion
Concussions and traumatic brain injuries (TBIs) have emerged as critical public health concerns in Canada, especially for young athletes participating in high-impact sports. The steady increase in the number of head injuries over the past two decades signals the pressing need for novel approaches that reduce risks associated with concussions and promote early identification and intervention.
As a response, our designed brain concussion protection helmet combines sophisticated structure design with real-time health monitoring technologies. The honeycomb structure of the helmet enhances the absorption of impact by effectively distributing the forces, thereby reducing the chances of concussions in case of collision or falls. Further, the use of embedded EEG sensors enables constant monitoring of brain activity, providing real-time feedback on the possibility of injury following an impact. Employing a deep learning transformer algorithm, the system evaluates EEG data alongside cognitive performance metrics derived from standardized tests to provide a comprehensive evaluation of concussion severity and actionable recommendations for intervention.
This dual-faceted approach—merging superior shock absorption with state-of-the-art EEG-based feedback—is a significant advance in protective gear technology. Aside from reducing the mechanical forces accompanying head impacts, it also allows for instant, objective feedback on brain health to be provided to athletes and clinicians. Detection of concussive events at an early stage is key in avoiding secondary injury and long-term neurological issues and thus improving safety outcomes. In summary, the innovative design of our helmet holds the potential to revolutionize concussion prevention and management in sports and recreation by targeting the mechanical and physiological states of head injury.
5.2. Future Work
While this study presents an innovative brain concussion protection helmet that integrates honeycomb impact dissipation with EEG-based health monitoring, there are several aspects remaining for optimization and improvement to ensure its efficacy, usability, and practicality.
One of the core challenges lies in optimizing the honeycomb structure to achieve the optimal balance between impact absorption and force reduction of transmission. Though foam-filled honeycomb configurations have shown great energy dissipation, they could end up inadvertently increasing head acceleration. To address this issue, it will require more material engineering and extensive testing to optimize the protection mechanism.
One other critical limitation is the variability in the accuracy of EEG signals, primarily due to motion artifacts and external noise, that could blemish the reliability of concussion detection. Future research should be directed at the application of advanced noise-reduction algorithms and motion artifact correction techniques with the aim of improving the accuracy of brain activity measurement in varying conditions. Additionally, while wet electrodes are high in signal fidelity, their use in long athletic settings is limited. Hence, it is of paramount importance to investigate dry electrode options that preserve signal quality and enhance user comfort.
The helmet should be tested under real conditions to determine its performance in medical and sports use. We suggest conducting thorough testing with both medical practitioners and athletes to assess the performance of the device in realistic high-impact conditions. Partnerships with medical organizations and sports associations will yield useful feedback on the functional performance of the helmet and inform subsequent design iteration.
Apart from concussion detection, there are also the possible applications in other traumatic brain injuries. Future development in EEG and deep learning-based analysis would enable the system to be incorporated in stroke recovery, seizure detection, and overall neurological health monitoring. Further integration with a mobile app with real-time concussion data monitoring and AI-powered health advisory could also enhance its effectiveness through proactive brain health management of athletes, coaches, and health professionals.
By solving these problems and expanding the range of applications, our helmet can become a comprehensive, artificial intelligence-powered concussion prevention, monitoring, and management, and overall neurological health solution for individuals at risk of head injury, enhancing safety outcomes for this population.
References
- National Institute of Neurological Disorders and Stroke. Traumatic Brain Injury (TBI). https://www.ninds.nih.gov/health-information/disorders/traumatic-brain-injury-tbi, 2024.
- Mayo Clinic. Concussion. https://www.mayoclinic.org/diseases-conditions/concussion/symptoms-causes/syc-20355594, 2024.
- Public Health Agency of Canada. Injury in review, 2020 edition: Spotlight on traumatic brain injuries across the life course. https://www.canada.ca/en/public-health/services/injury-prevention/canadian-hospitals-injury-reporting-prevention-program/injury-reports/2020-spotlight-traumatic-brain-injuries-life-course.html, 2020.
- Kholoosi, F.; Galehdari, S.A. Design, optimisation and analysis of a helmet made with graded honeycomb structure under impact load. International Journal of Crashworthiness 2019, 24, 645–655. [Google Scholar] [CrossRef]
- NJ, M.; A, G. Bicycle helmet design. Proceedings of the Institution of Mechanical Engineers 2006, 220, 167–180. [Google Scholar]
- S, R.; SM, D.; RM, G.; JG, B.; JJ, C.; KM, G.; JP, M.; JJ, C.; BJ, W.; TW, M.; et al. Can helmet design reduce the risk of concussion in football? Journal of Neurosurgery 2014, 120, 919–922. [CrossRef] [PubMed]
- Sun, J.; Xu, X. Research on the effect of Alpha wave music on working memory based on EEG (In Chinese). Nanjing University of Posts and Telecommunications Master’s Thesis 2022.
- Uktveris, T.; Jusas, V. Development of a Modular Board for EEG Signal Acquisition. Sensors 2018, 18. [Google Scholar] [CrossRef] [PubMed]
- Zhang, Y.; Zhang, X.; Sun, H.; Fan, Z.; Zhong, X. Portable brain-computer interface based on novel convolutional neural network. Computers in Biology and Medicine 2019, 107, 248–256. [Google Scholar] [CrossRef] [PubMed]
- Mahmood, M.; Kim, N.; Mahmood, M.; Kim, H.; Kim, H.; Rodeheaver, N.; Sang, M.; Yu, K.J.; Yeo, W.H. VR-enabled portable brain-computer interfaces via wireless soft bioelectronics. Biosens Bioelectron 2022, 210. [Google Scholar] [CrossRef] [PubMed]
- Algarni, M.; Saeed, F.; Al-Hadhrami, T.; Ghabban, F.; Al-Sarem, M. Deep Learning-Based Approach for Emotion Recognition Using Electroencephalography (EEG) Signals Using Bi-Directional Long Short-Term Memory (Bi-LSTM). Sensors 2022, 22. [Google Scholar] [CrossRef] [PubMed]
- Seraphim, M.; Lechervy, A.; Yger, F.; Brun, L.; Etard, O. Structure-Preserving Transformers for Sequences of SPD Matrices. In Proceedings of the 2024 32nd European Signal Processing Conference (EUSIPCO), 2024, pp. 1451–1455.
- Z, W.; M, L.; S, L.; J, H.; H, T.; W, D. EEGformer: A transformer–based brain activity classification method using EEG signal. Front. Neurosci. 2023, 17.
Figure 1.
Sports and recreation-related brain and head injury emergency department visits, Ontario and Alberta, 2002/03 to 2017/18, by sex, age-specific rates/100,000 persons.
Figure 1.
Sports and recreation-related brain and head injury emergency department visits, Ontario and Alberta, 2002/03 to 2017/18, by sex, age-specific rates/100,000 persons.
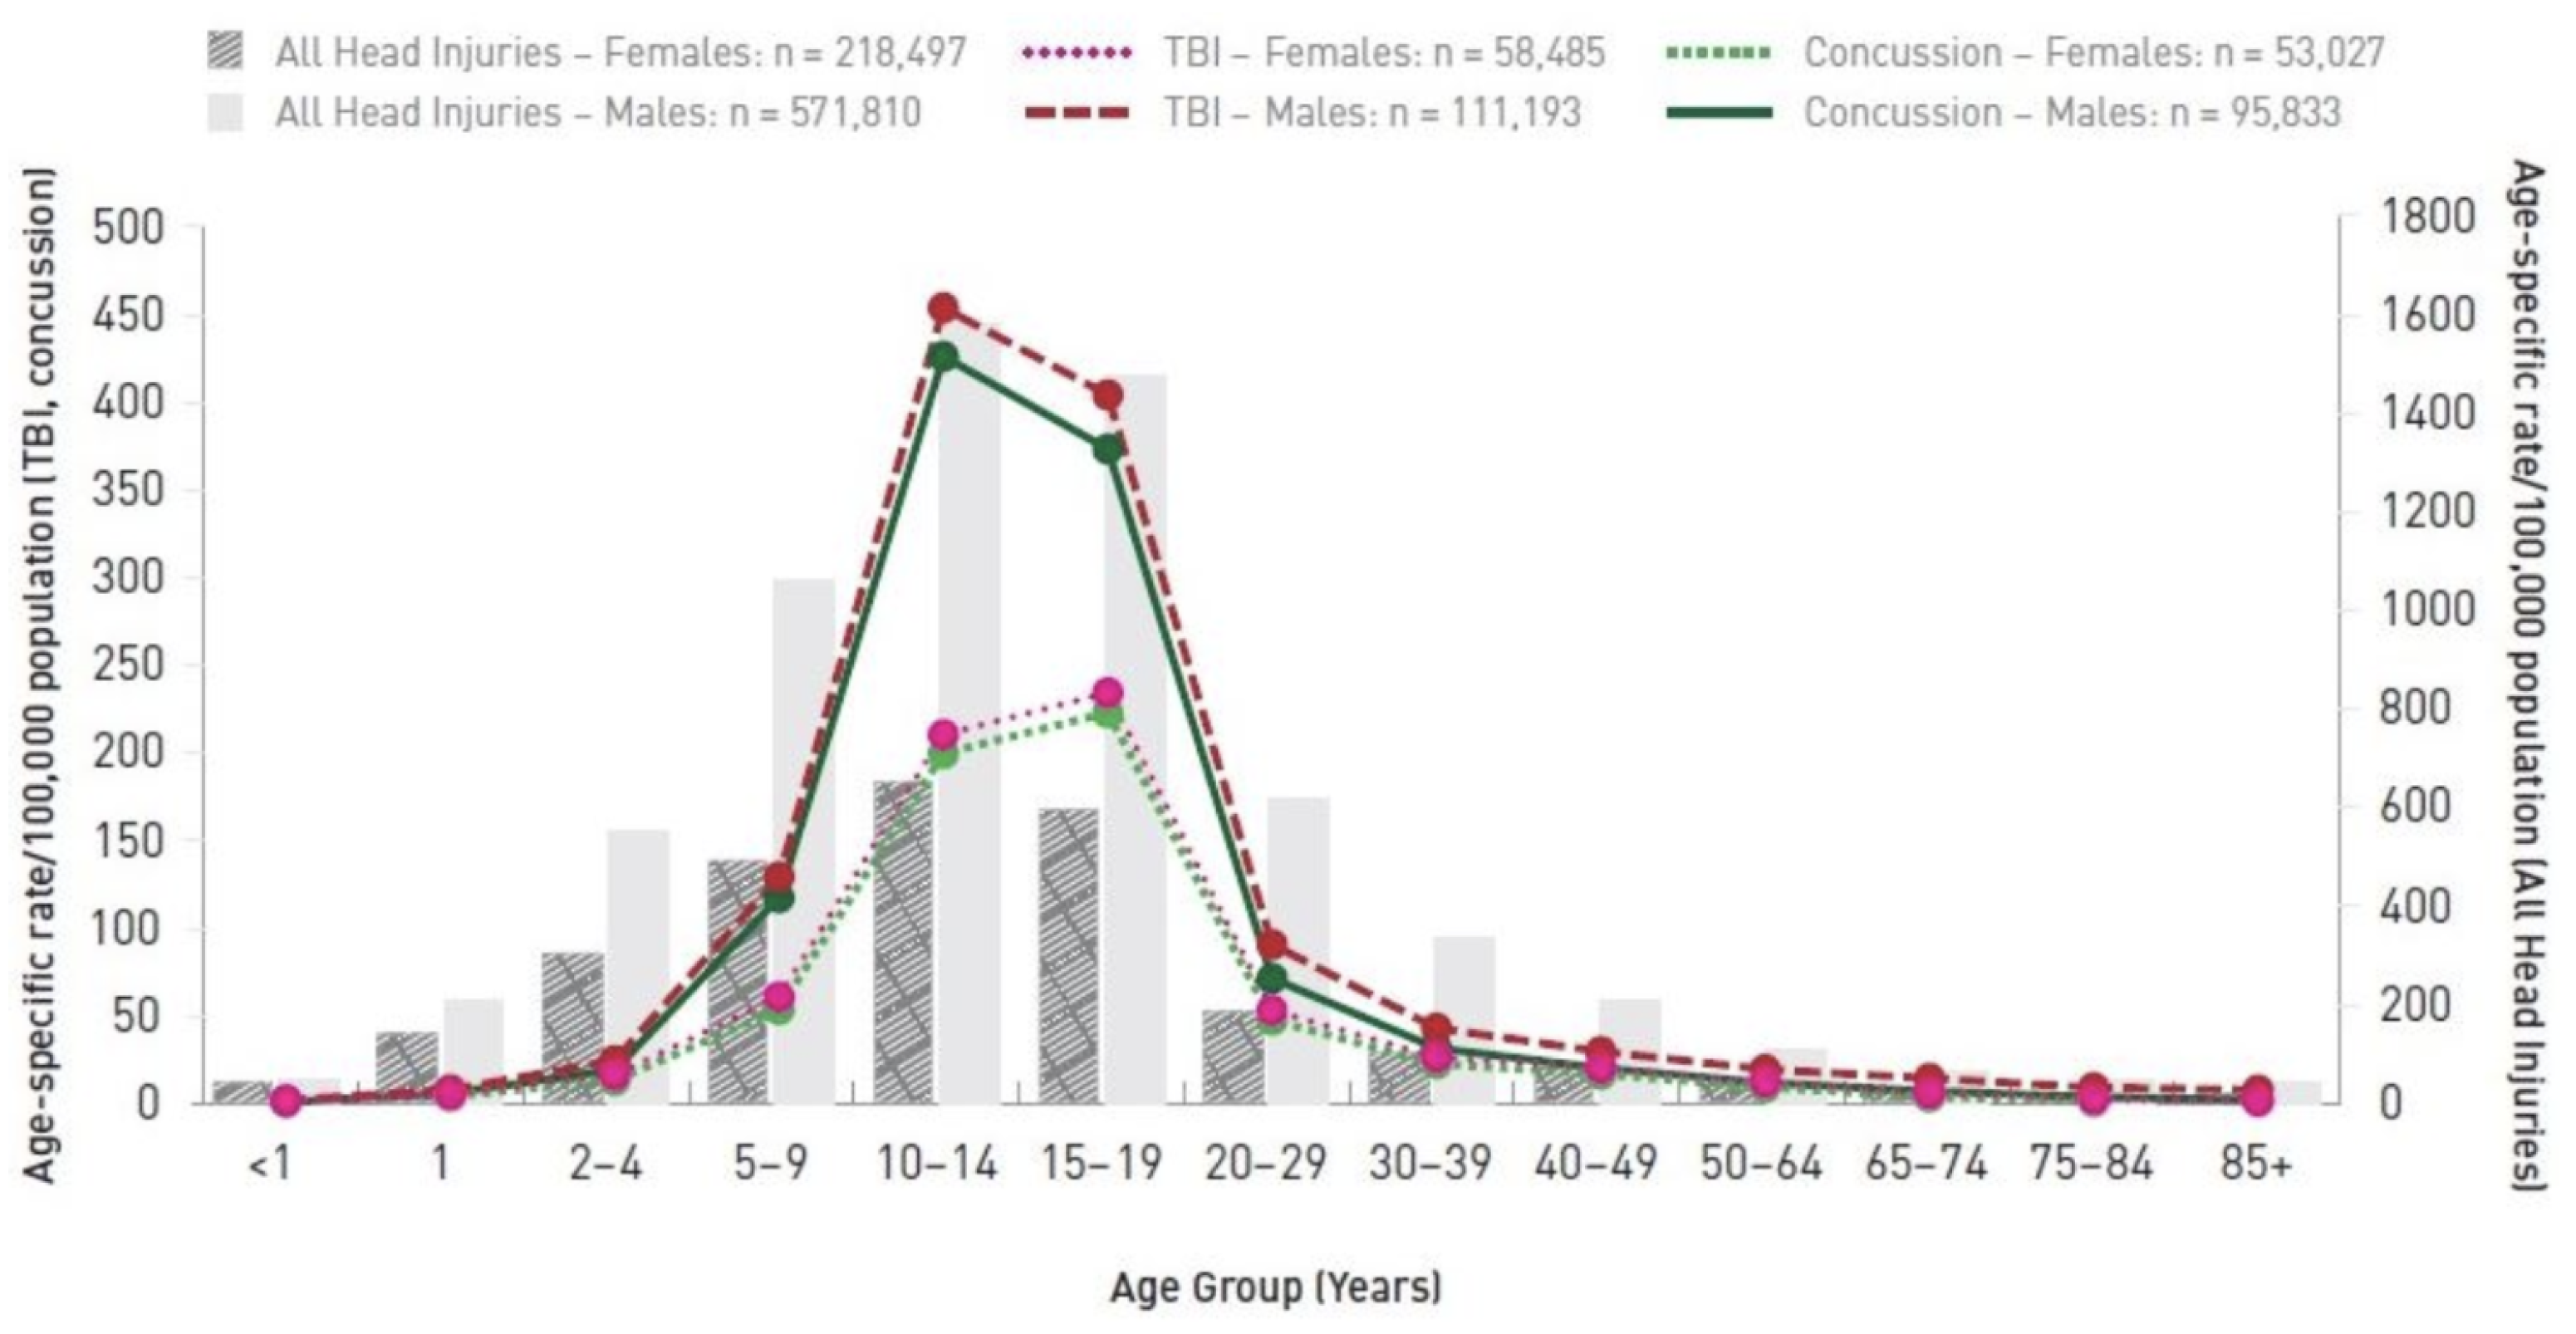
Figure 2.
Head and brain injury-related emergency department visits, 2002/03 to 2017/18, females, all ages, age-standardized rates/100,000 persons.
Figure 2.
Head and brain injury-related emergency department visits, 2002/03 to 2017/18, females, all ages, age-standardized rates/100,000 persons.
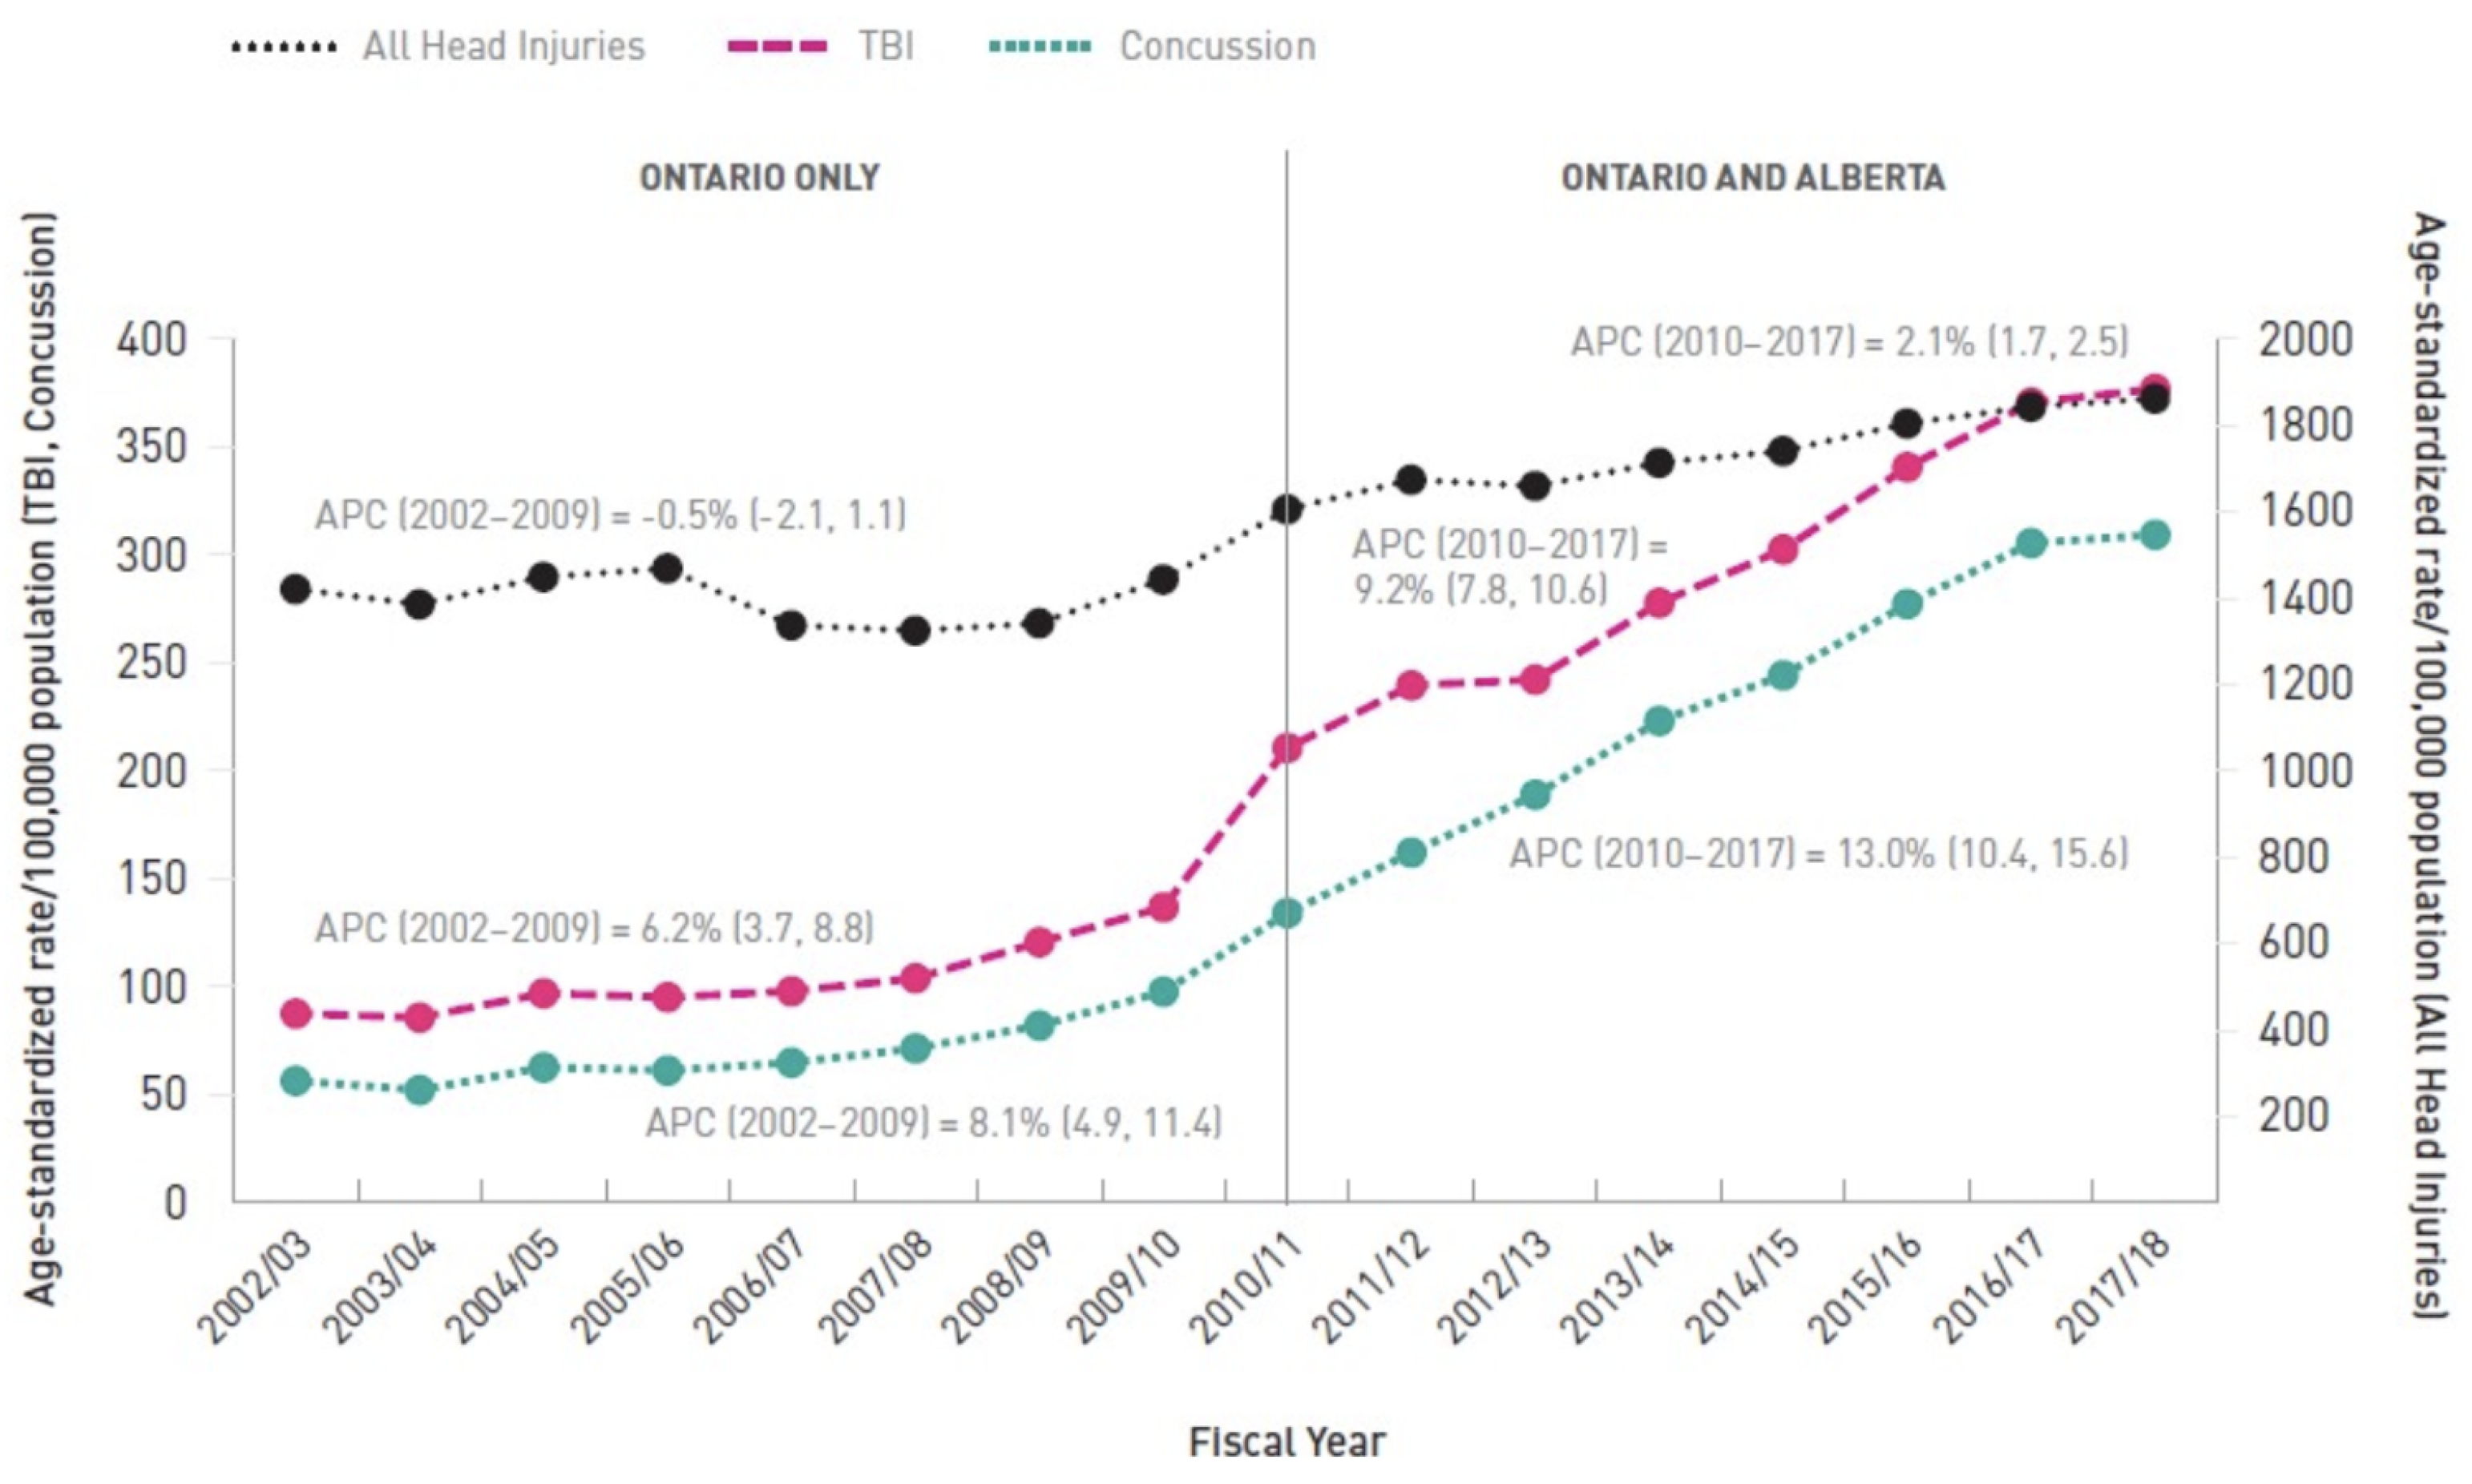
Figure 3.
Headforms for testing (EN960).
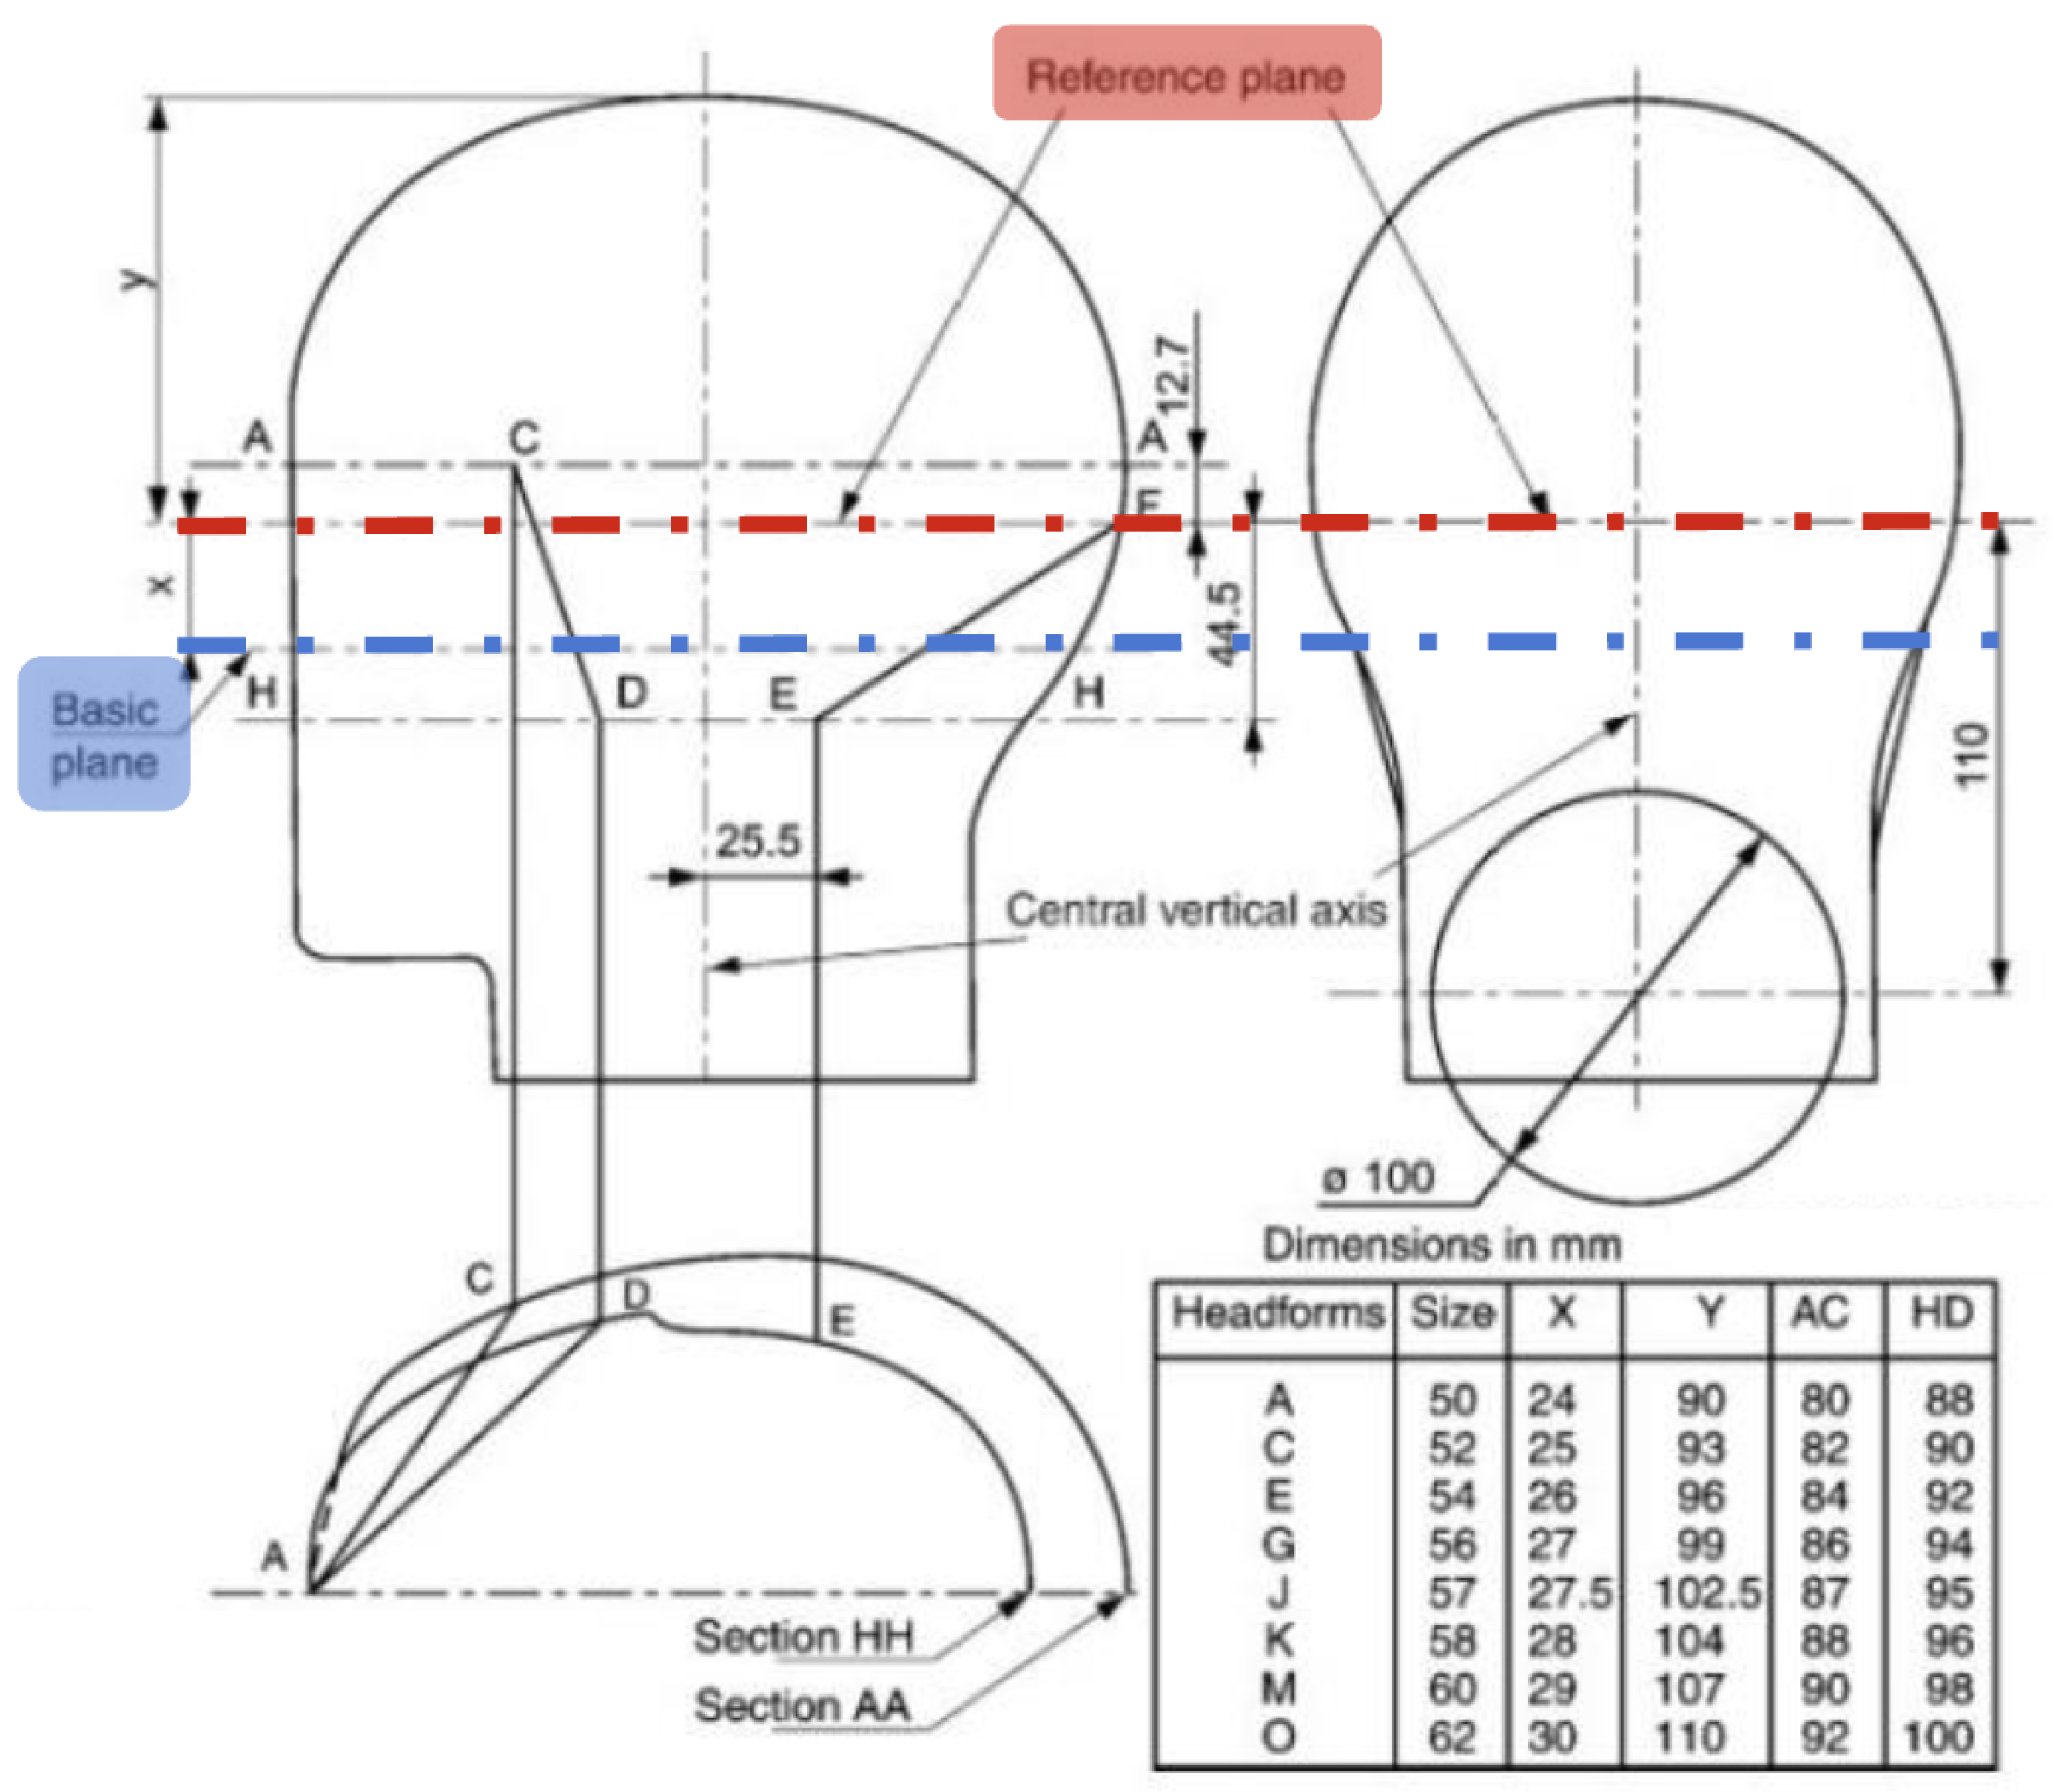
Figure 4.
The helmet’s dimensional design.
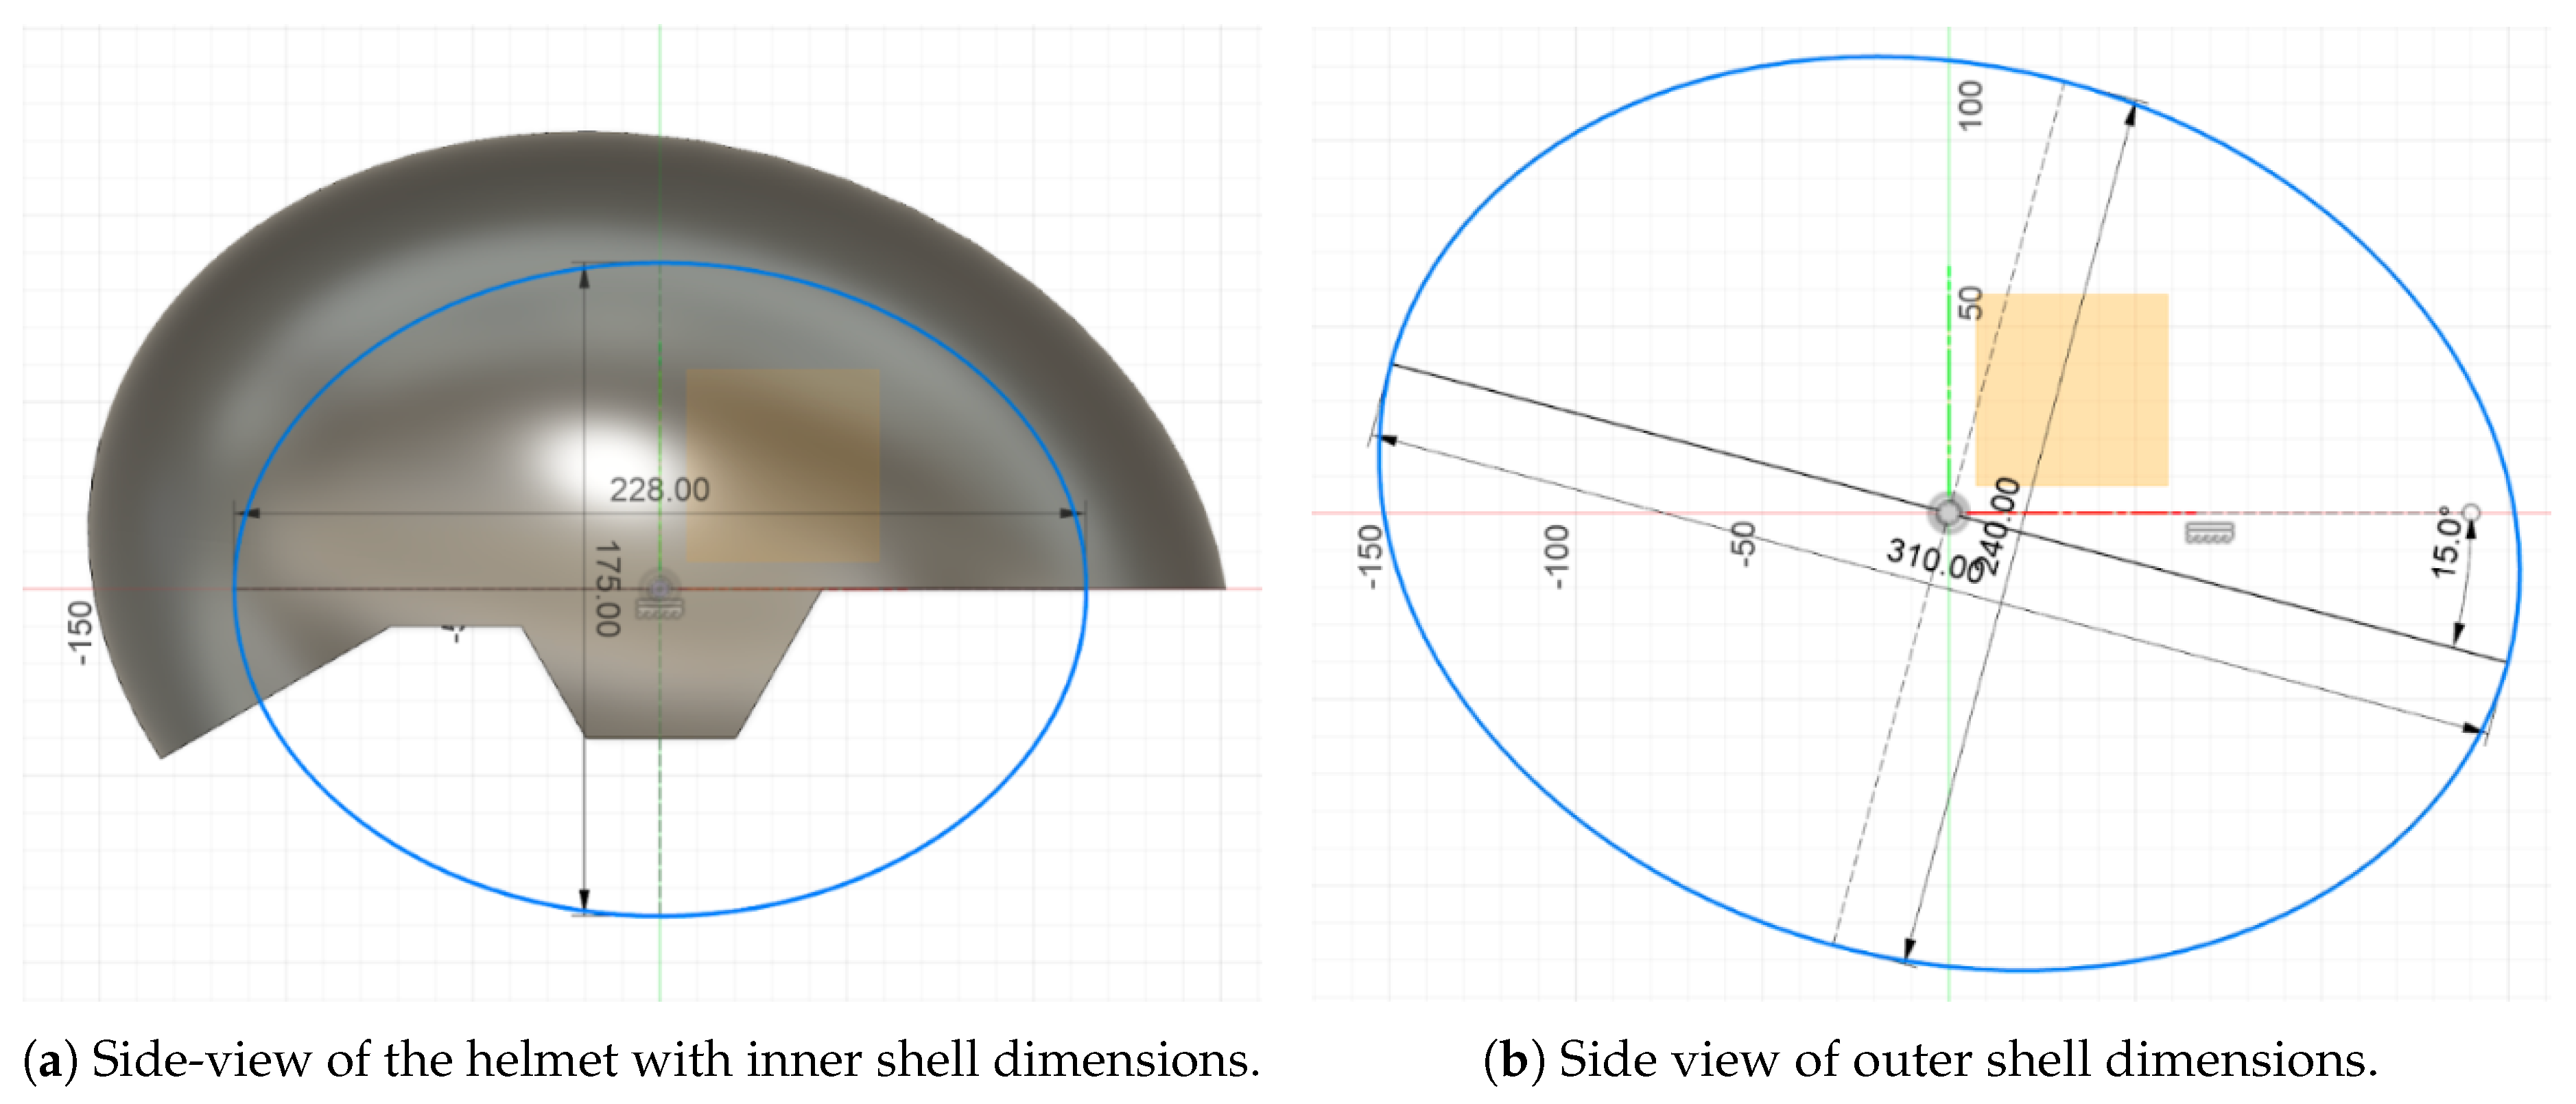
Figure 5.
Honeycomb structured helmet design steps.
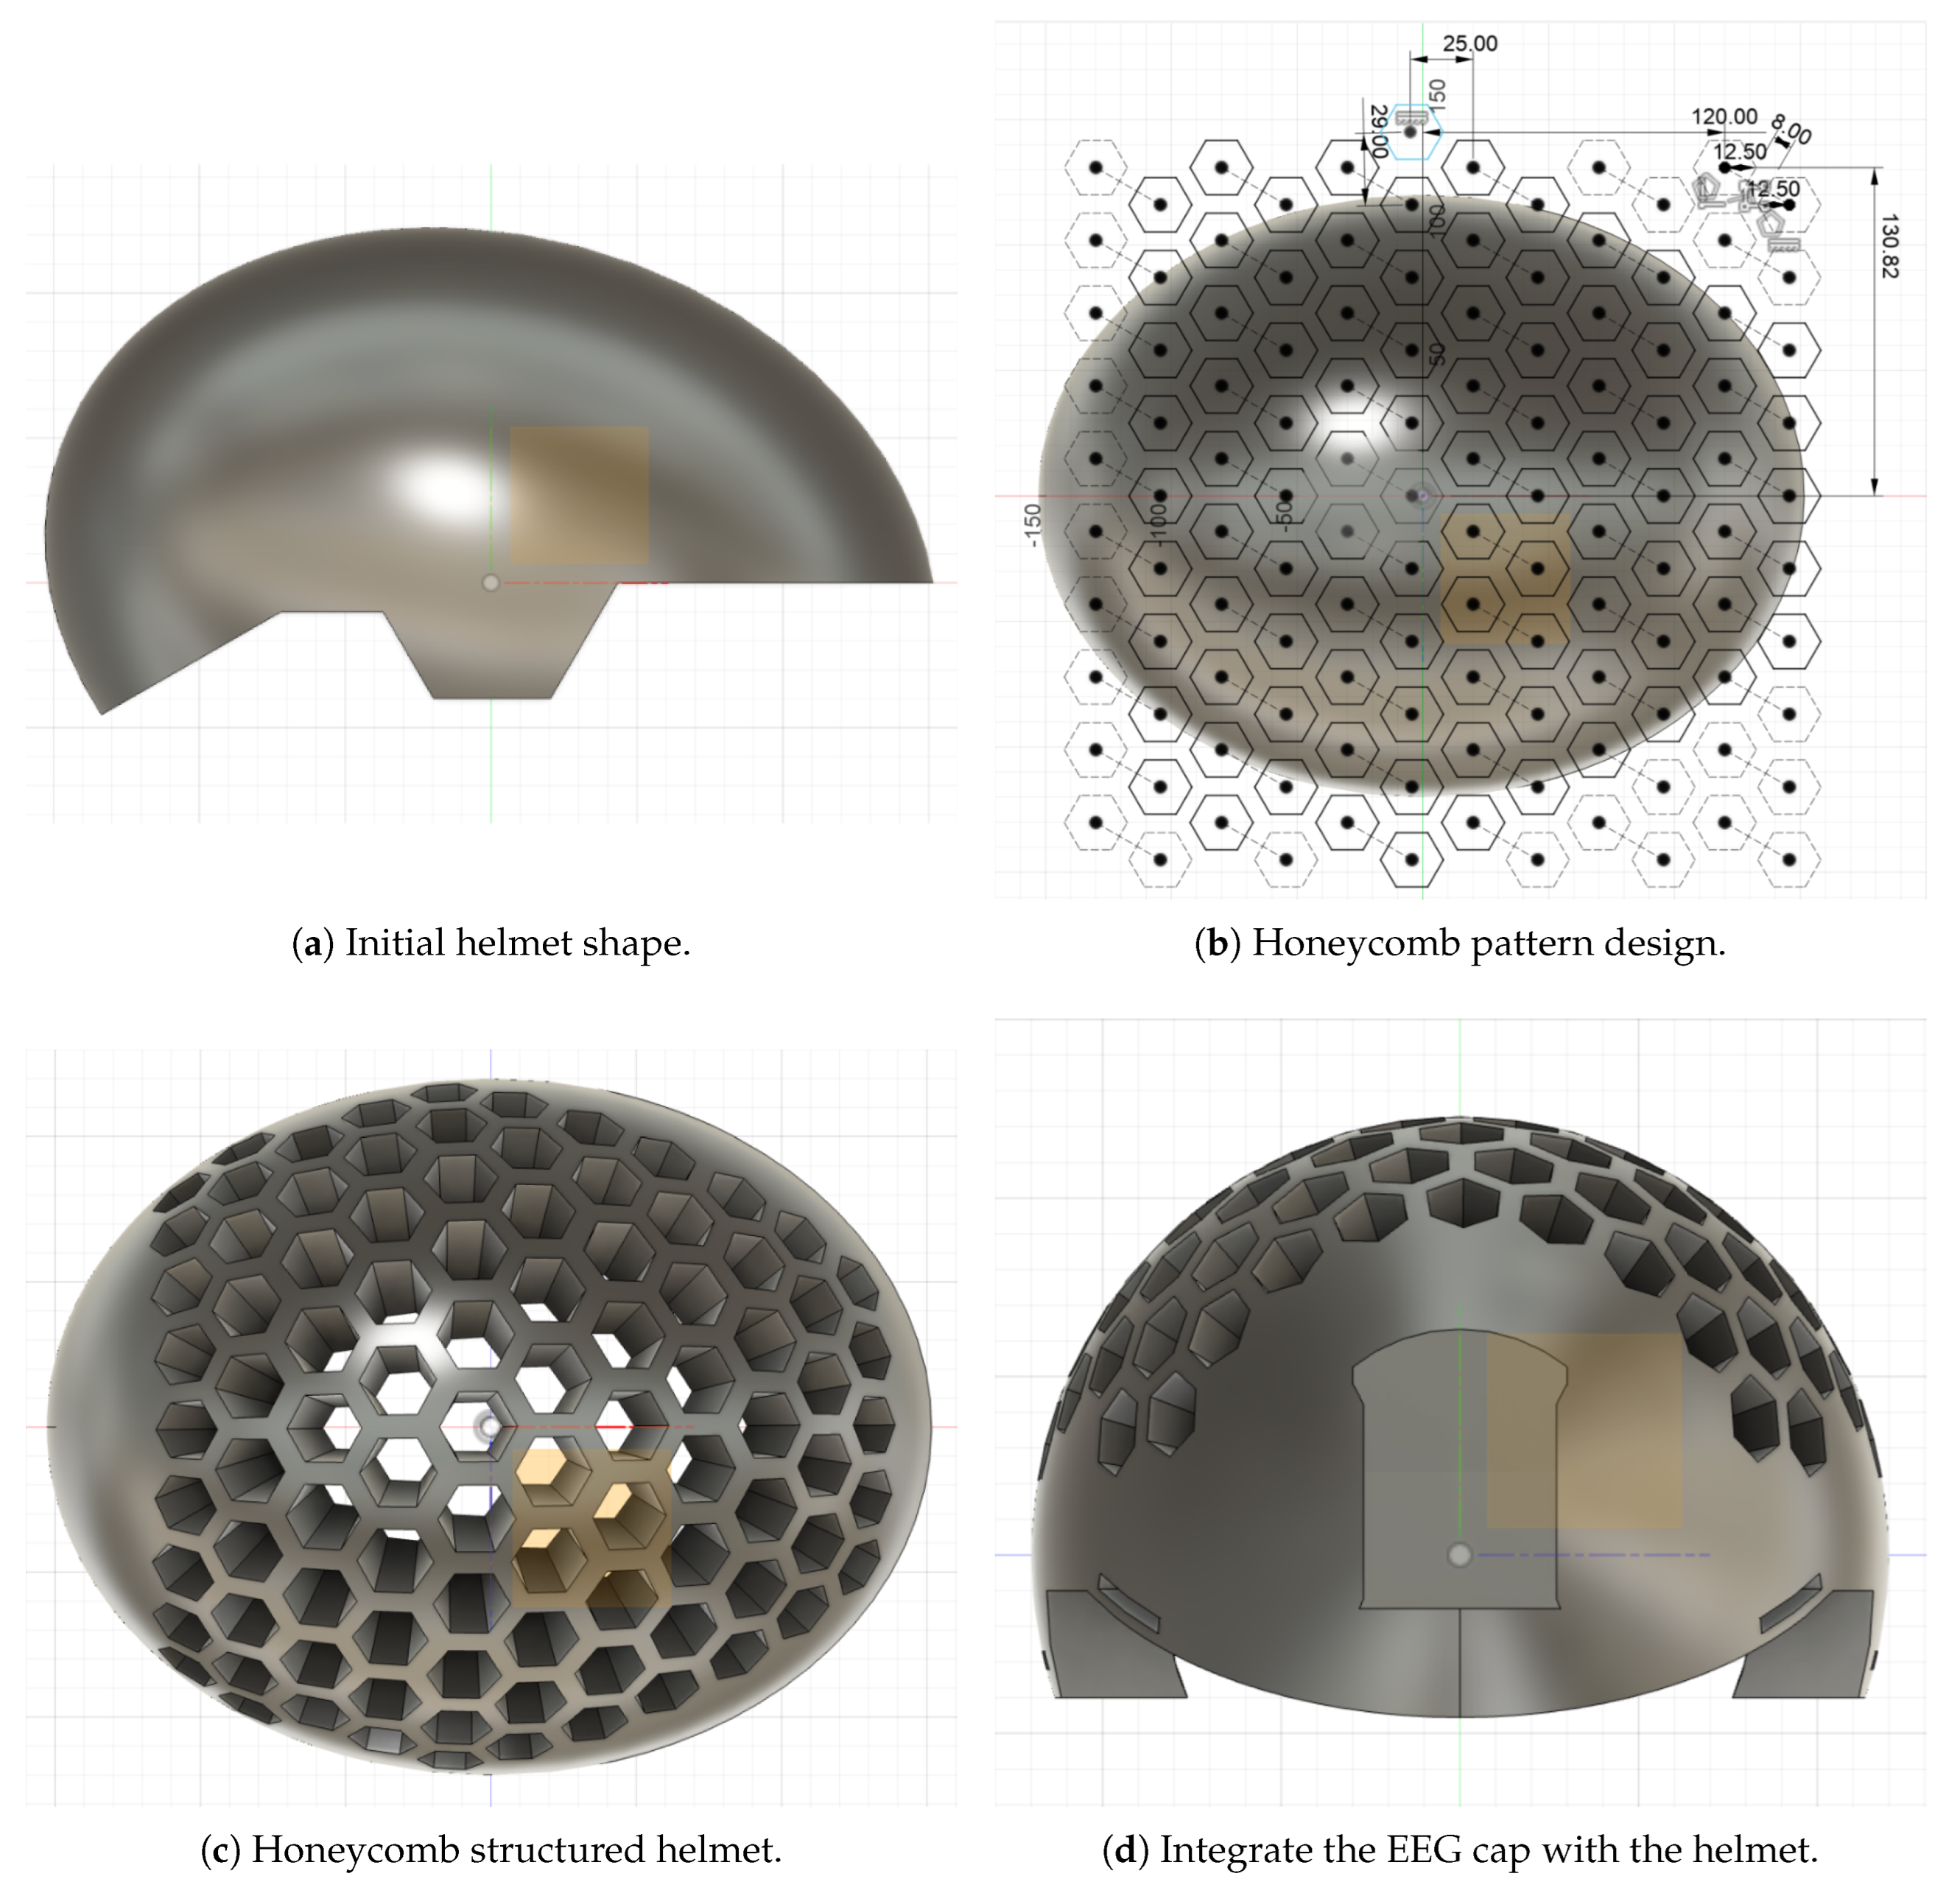
Figure 6.
Optimized design.
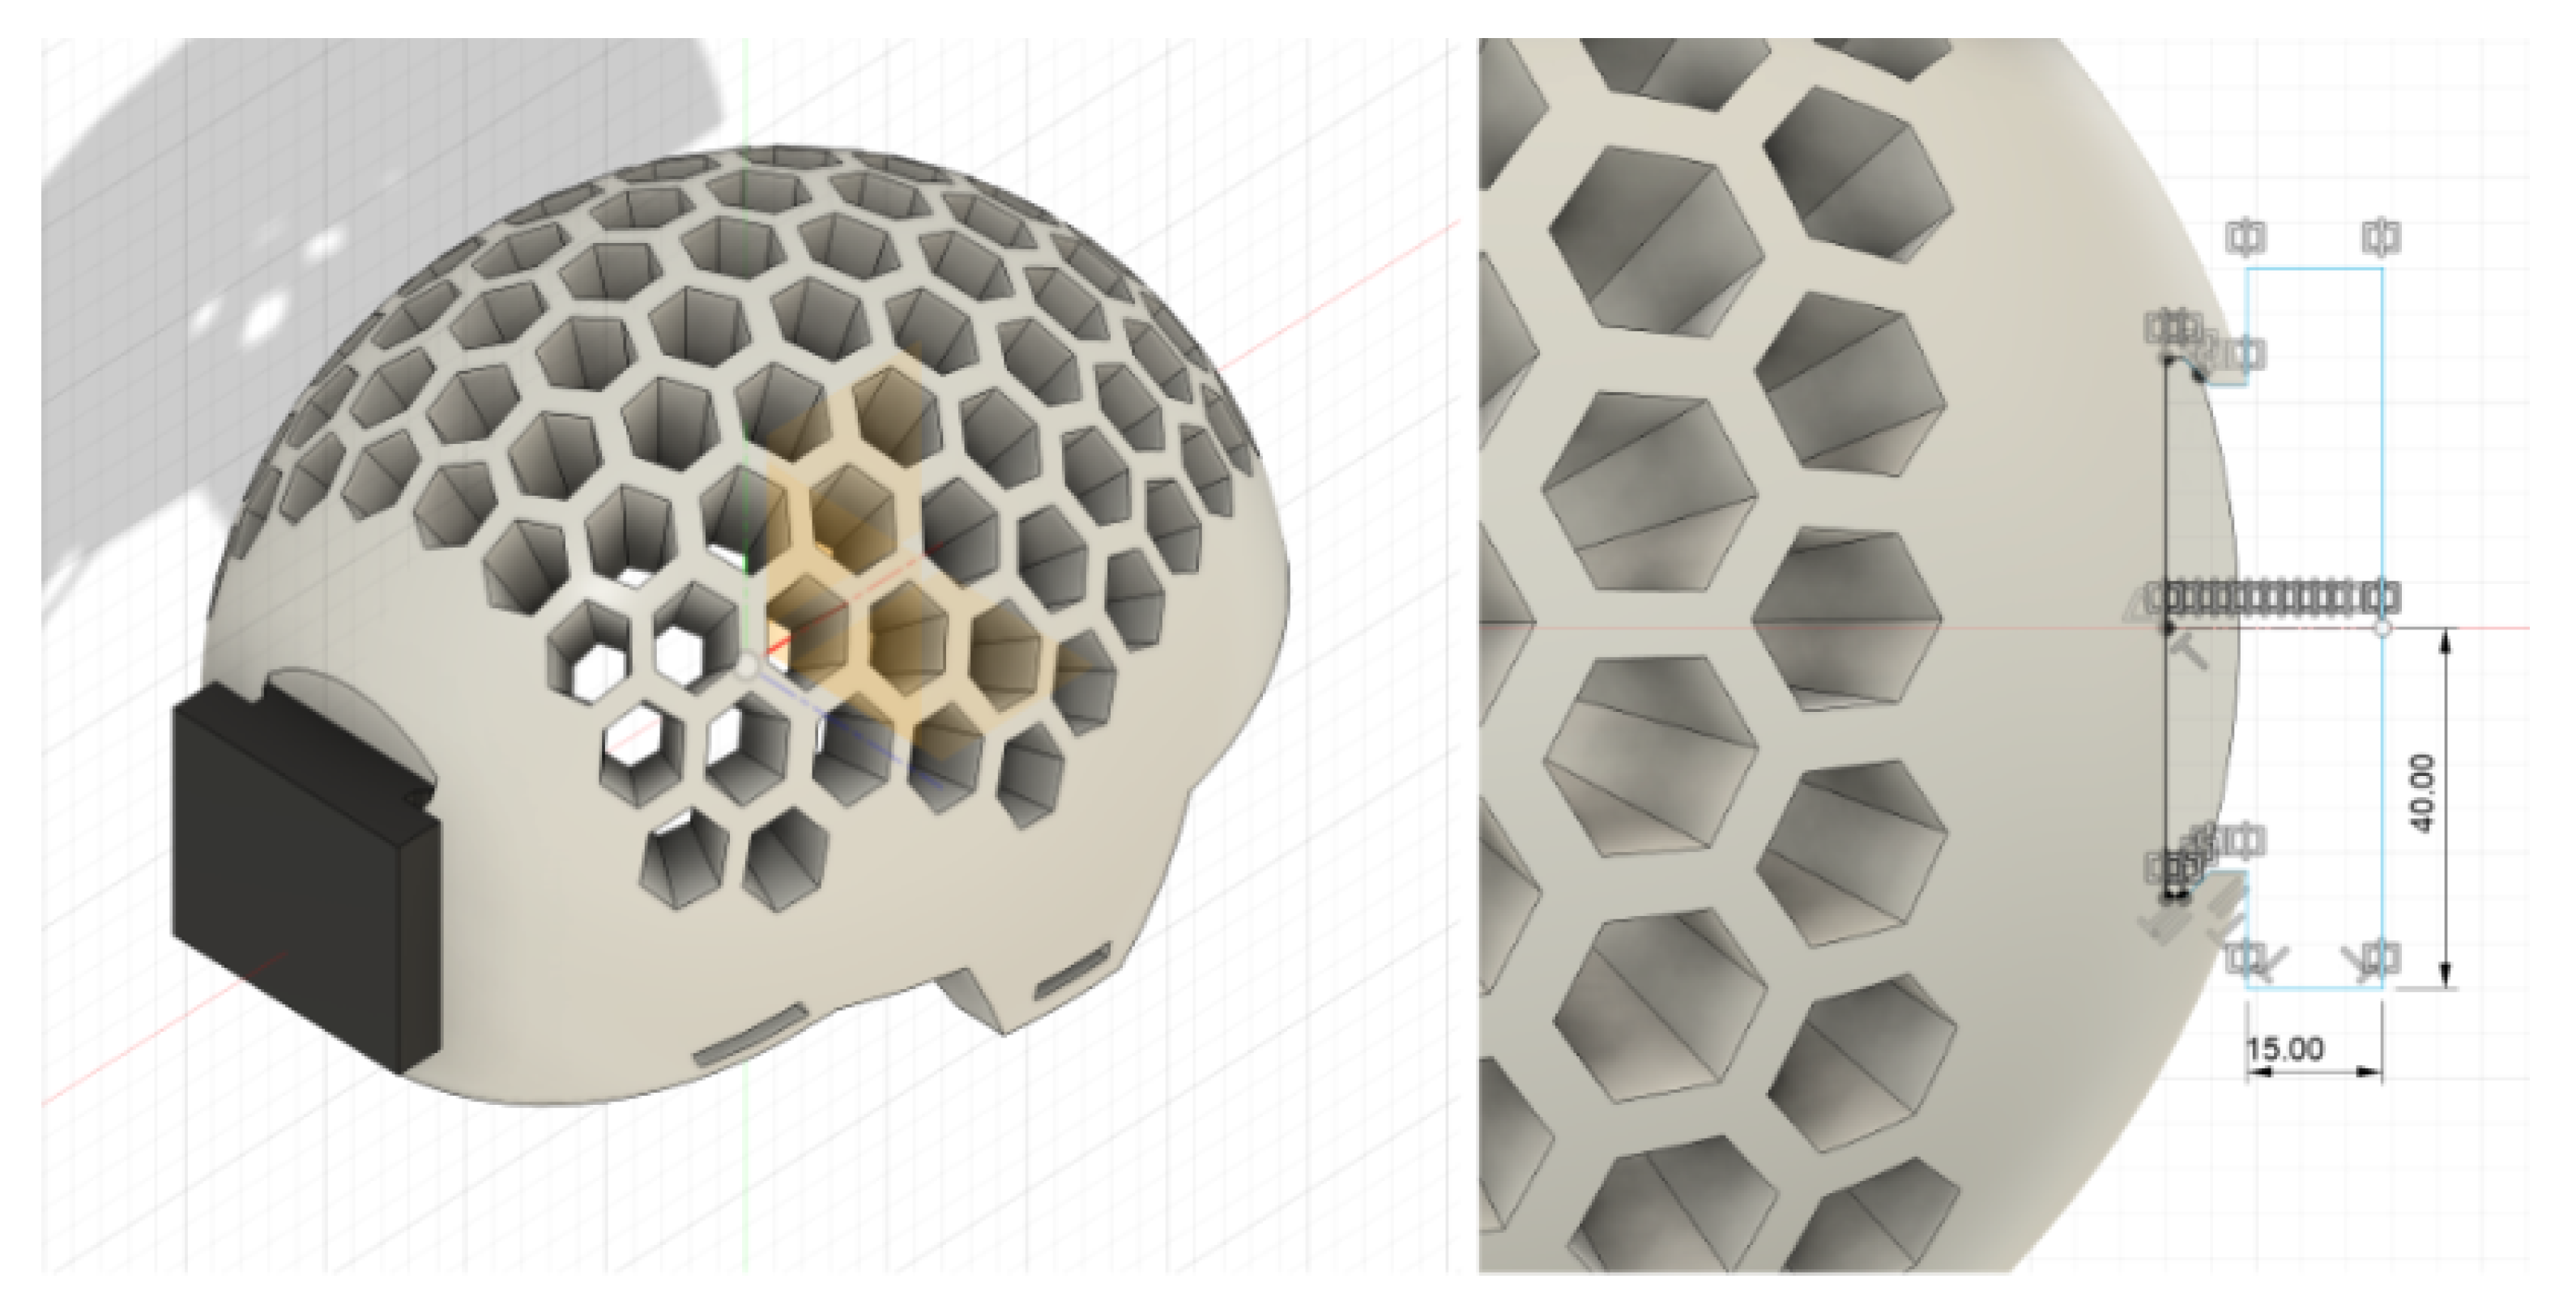
Figure 7.
EEG Hardware design flowchart.
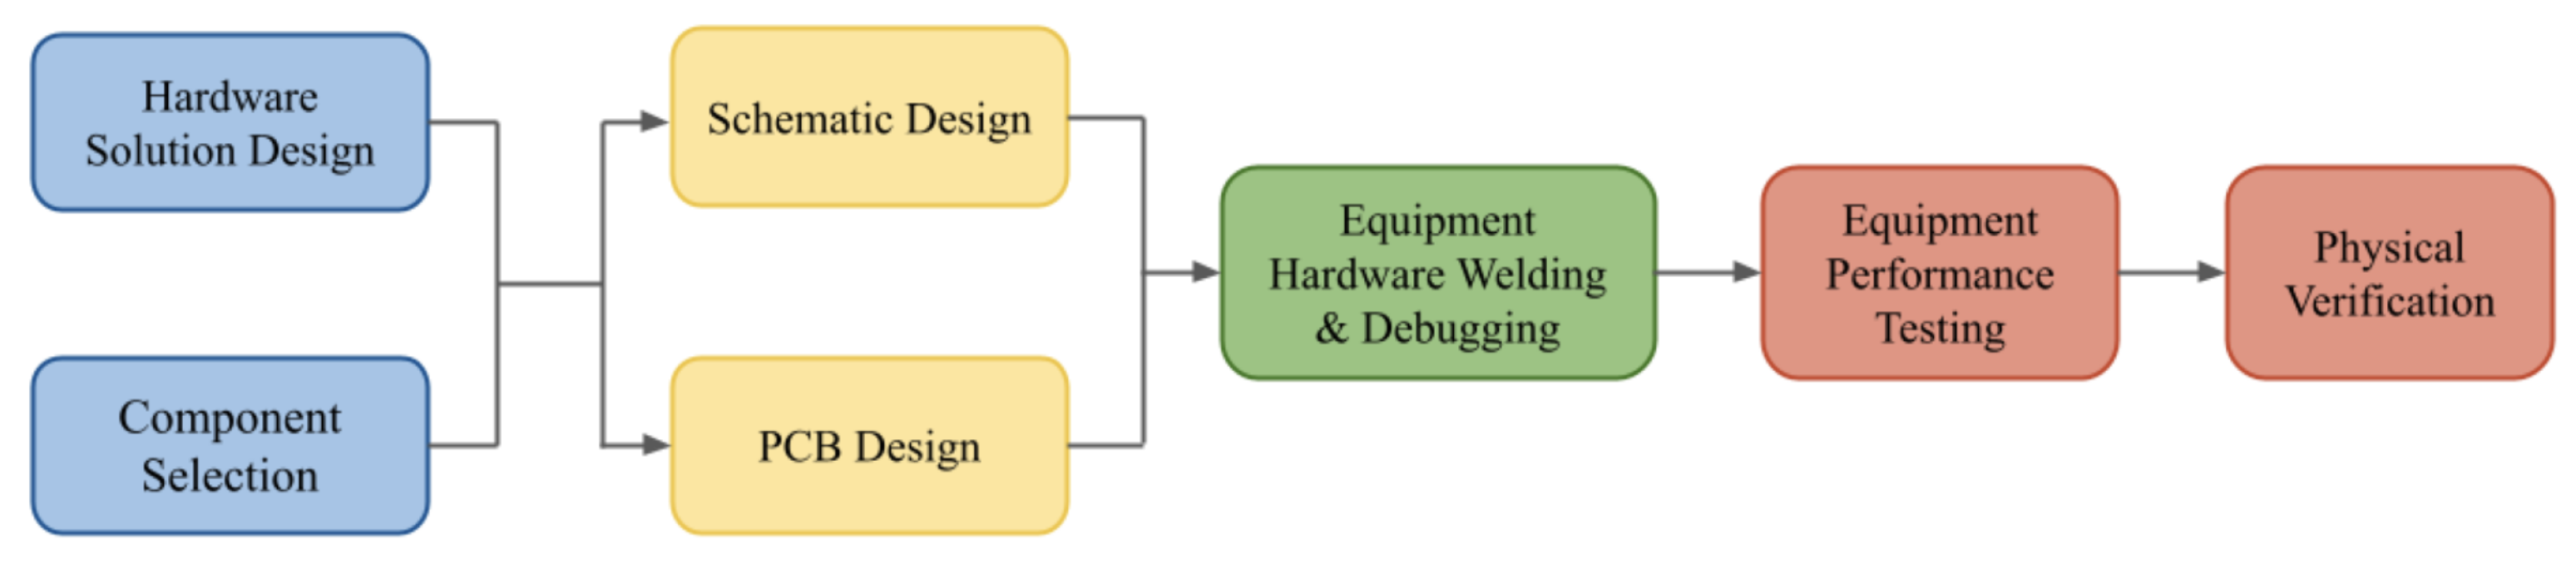
Figure 8.
The LH00199 functional block diagram.
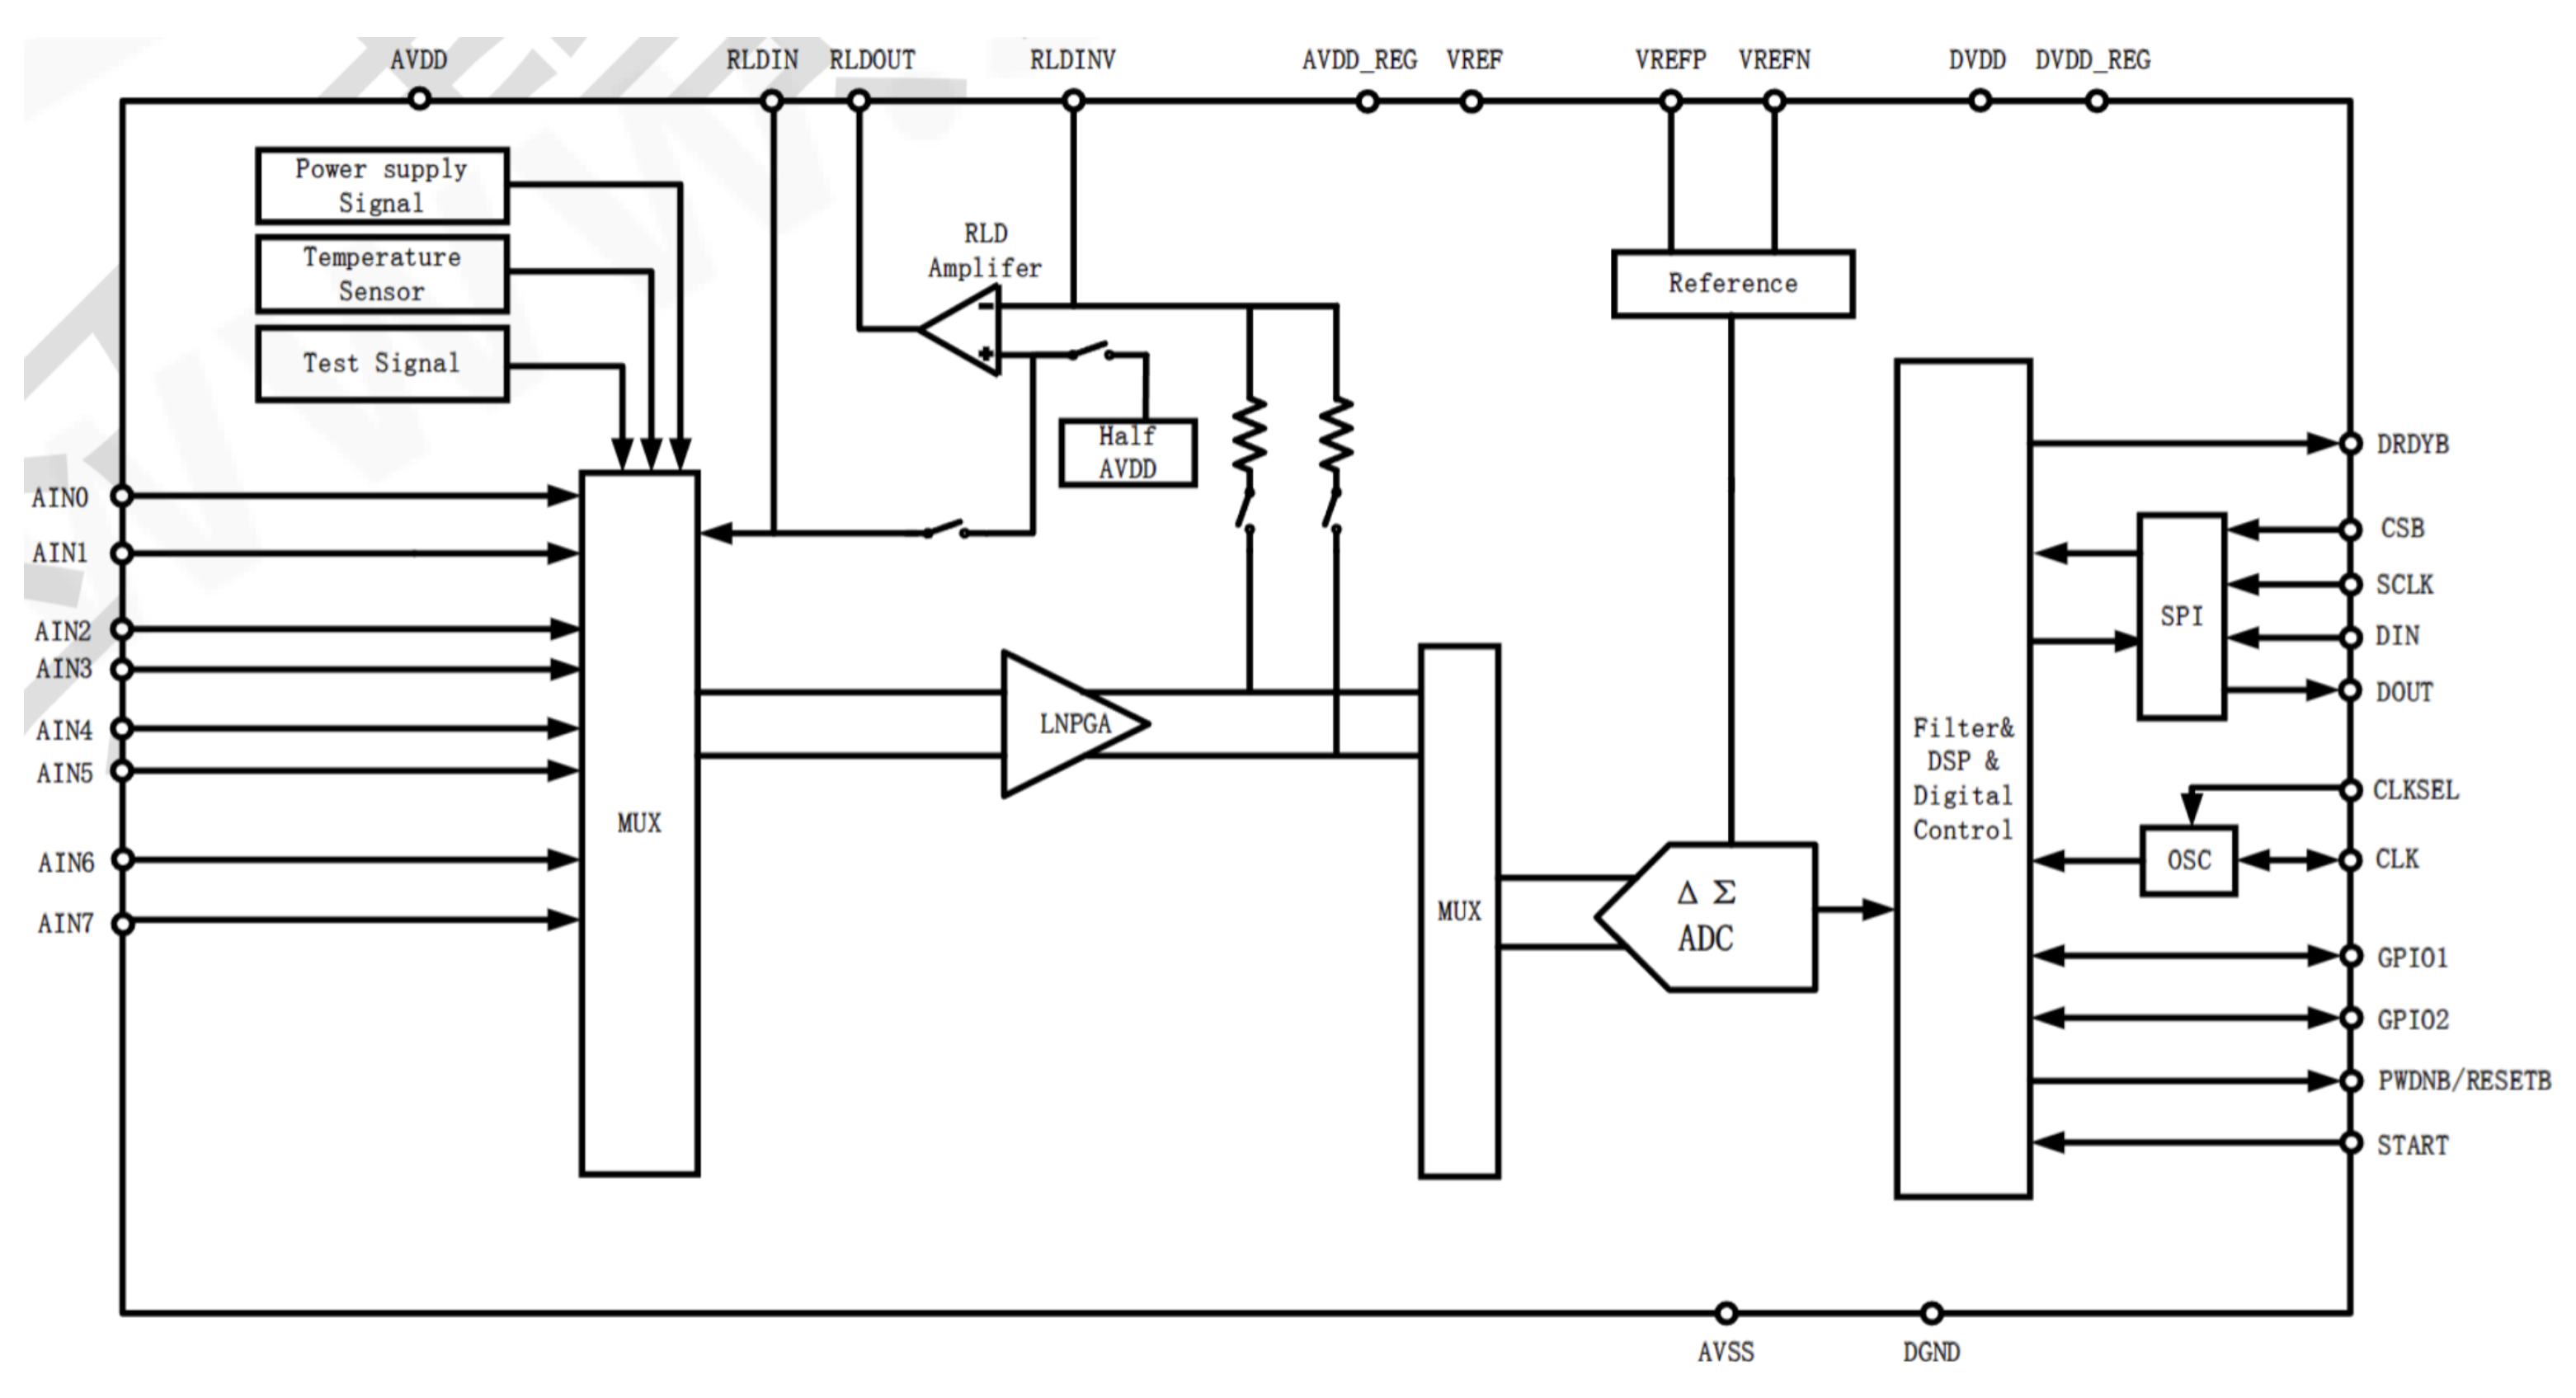
Figure 9.
ESD Isolation and Pre-filtering Circuit Design.
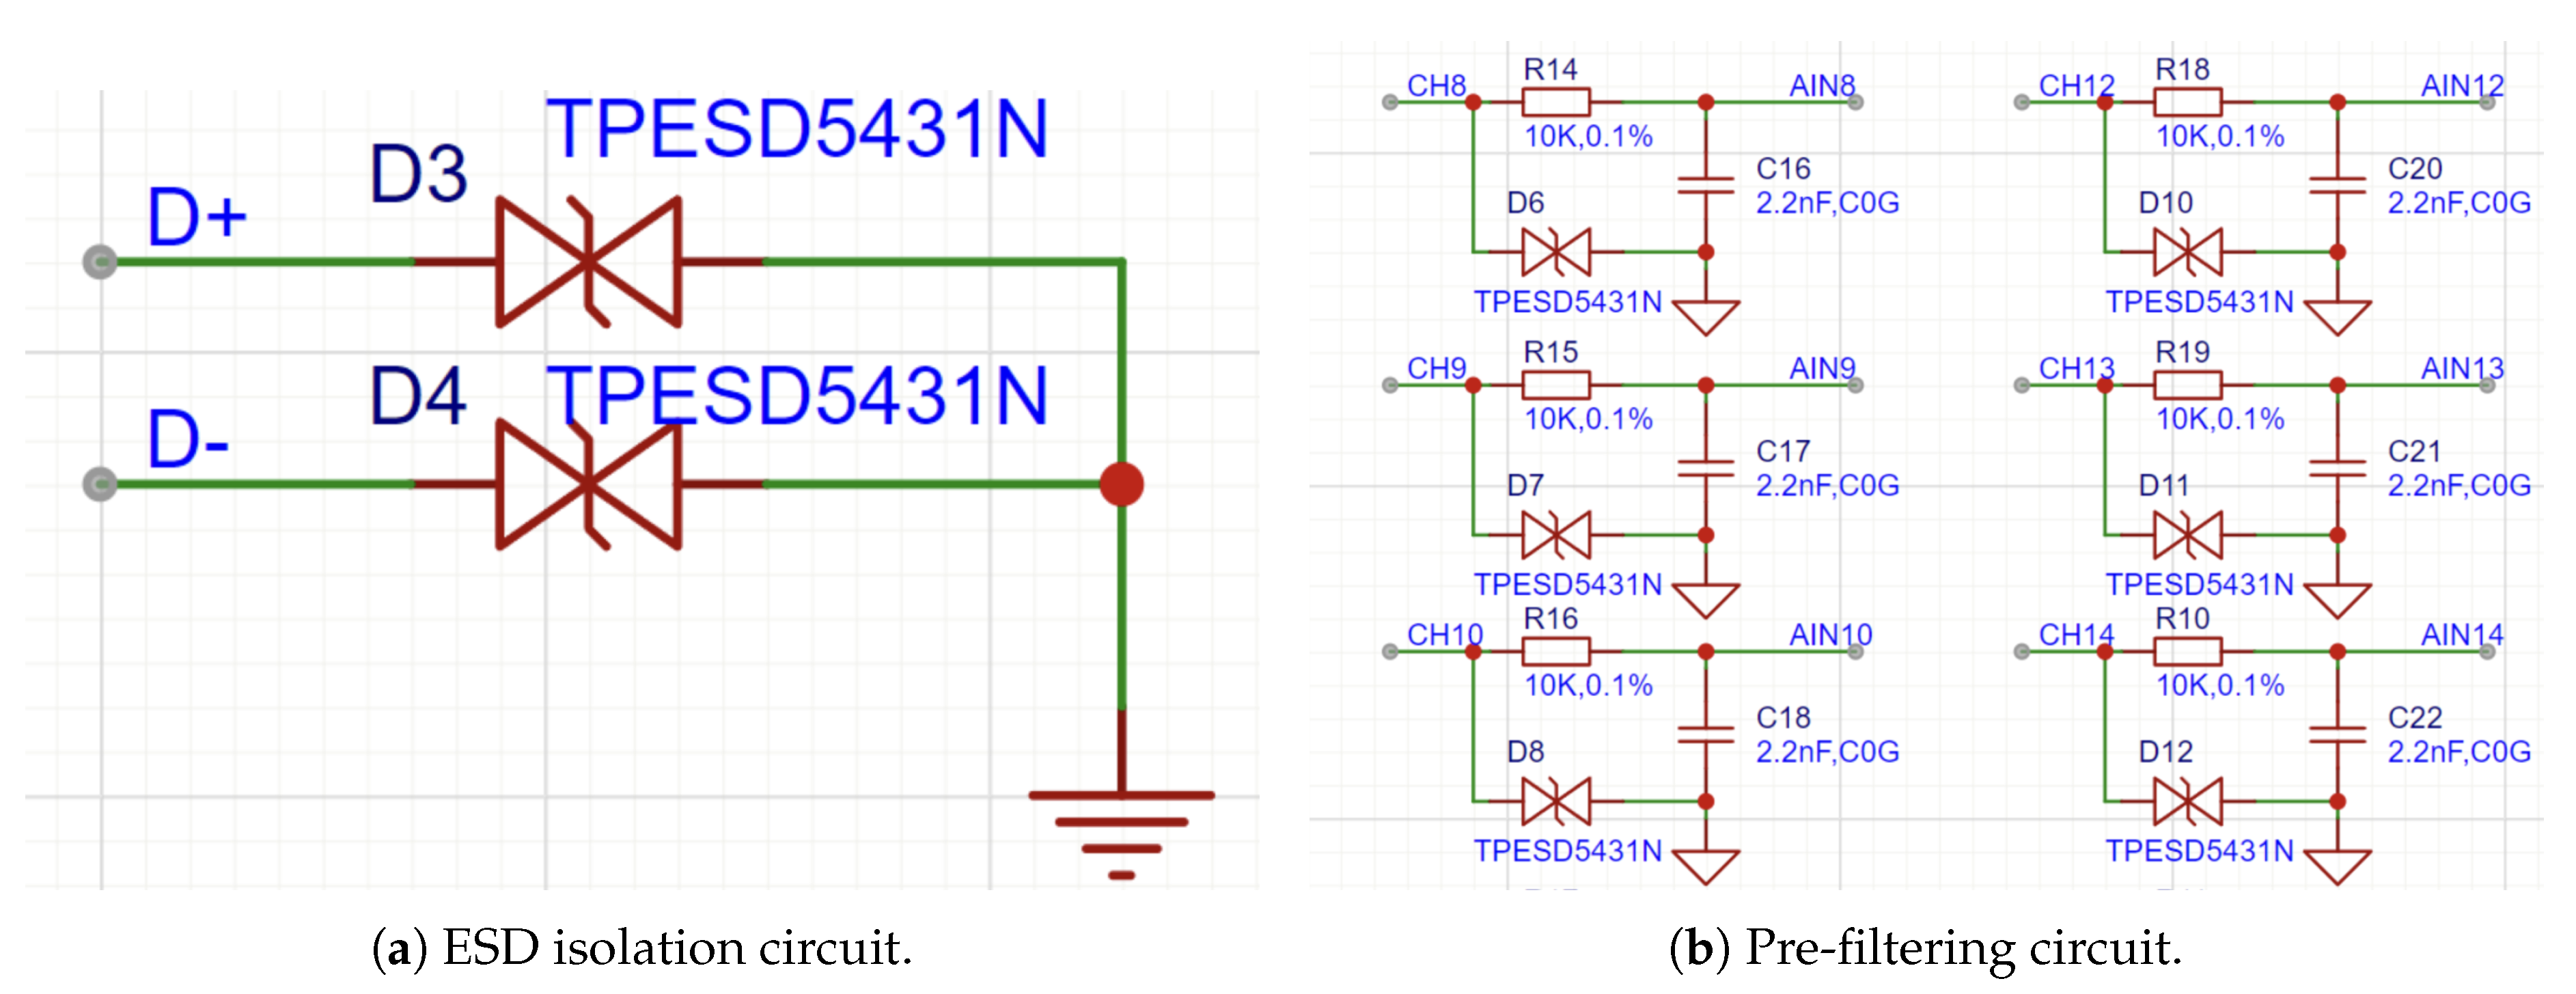
Figure 10.
Main Control Chip Core Circuit and Peripheral Circuit.
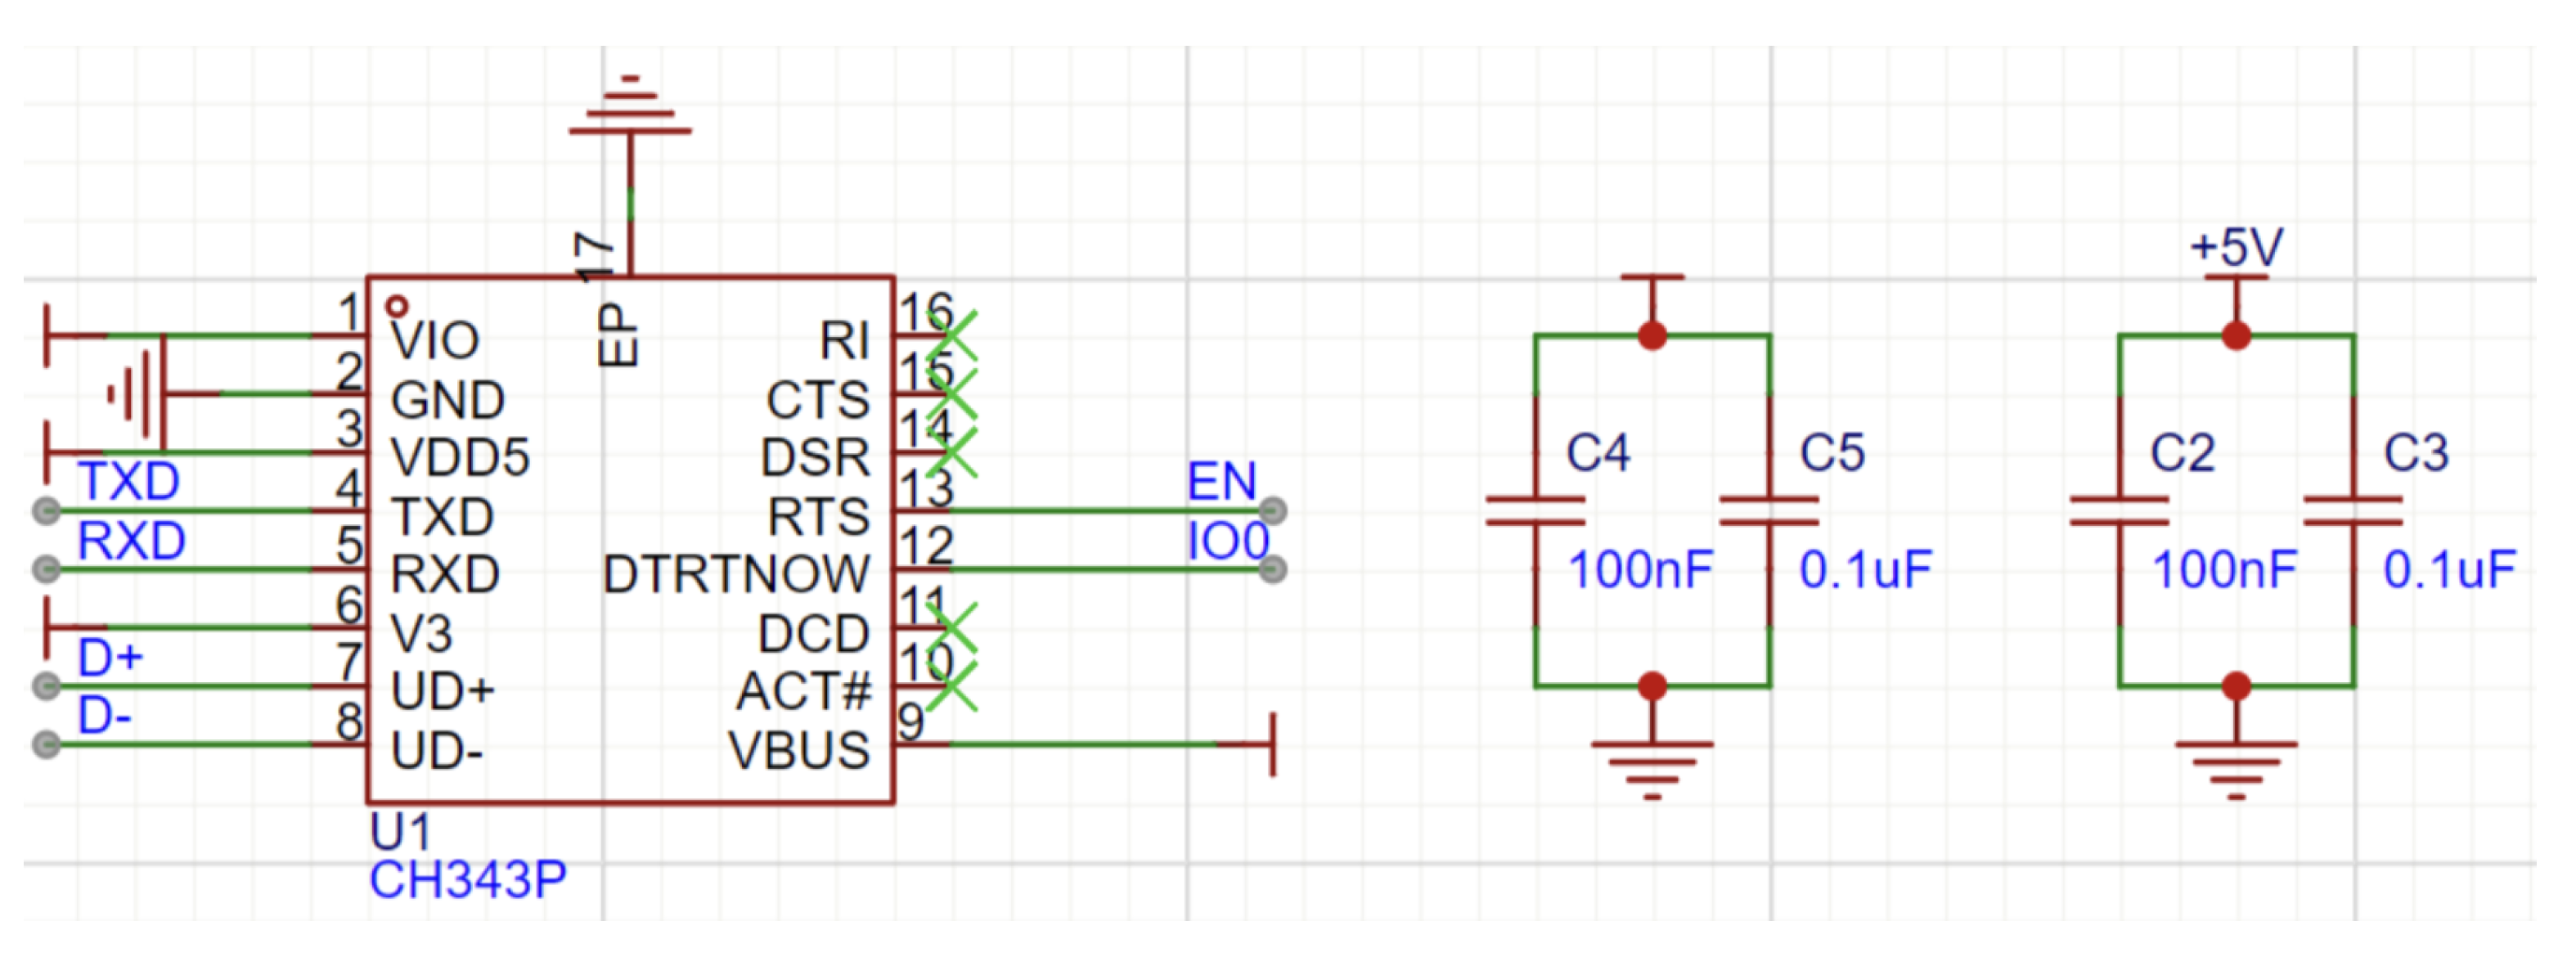
Figure 11.
Power Circuit Design with ME6211.
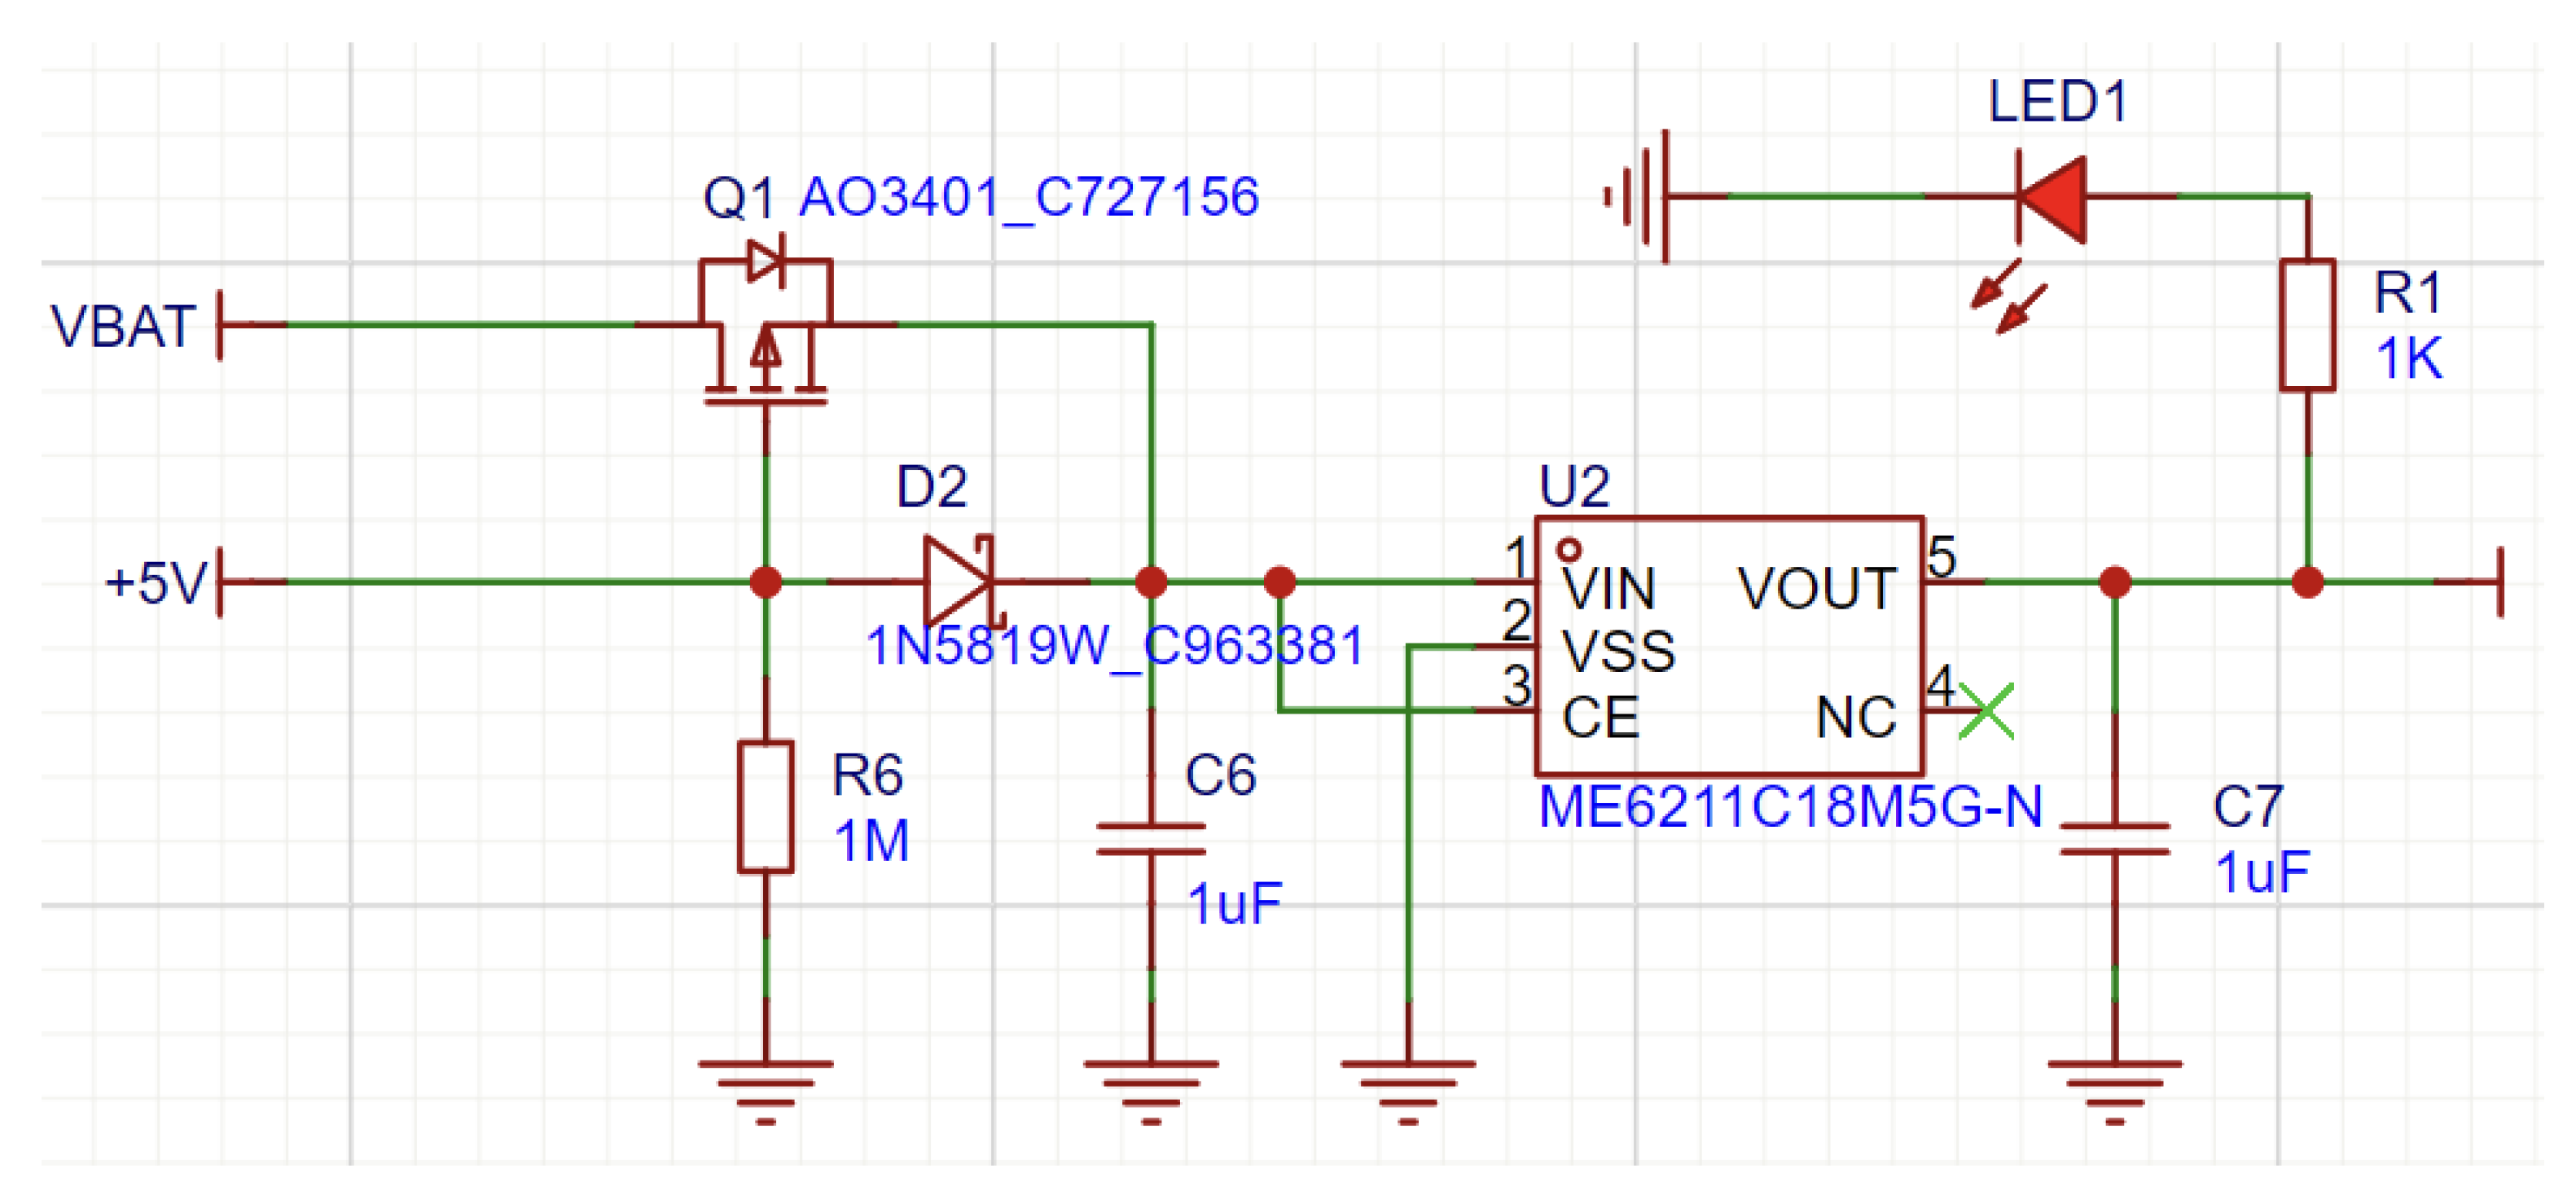
Figure 12.
Power Circuit Design with LP5907.
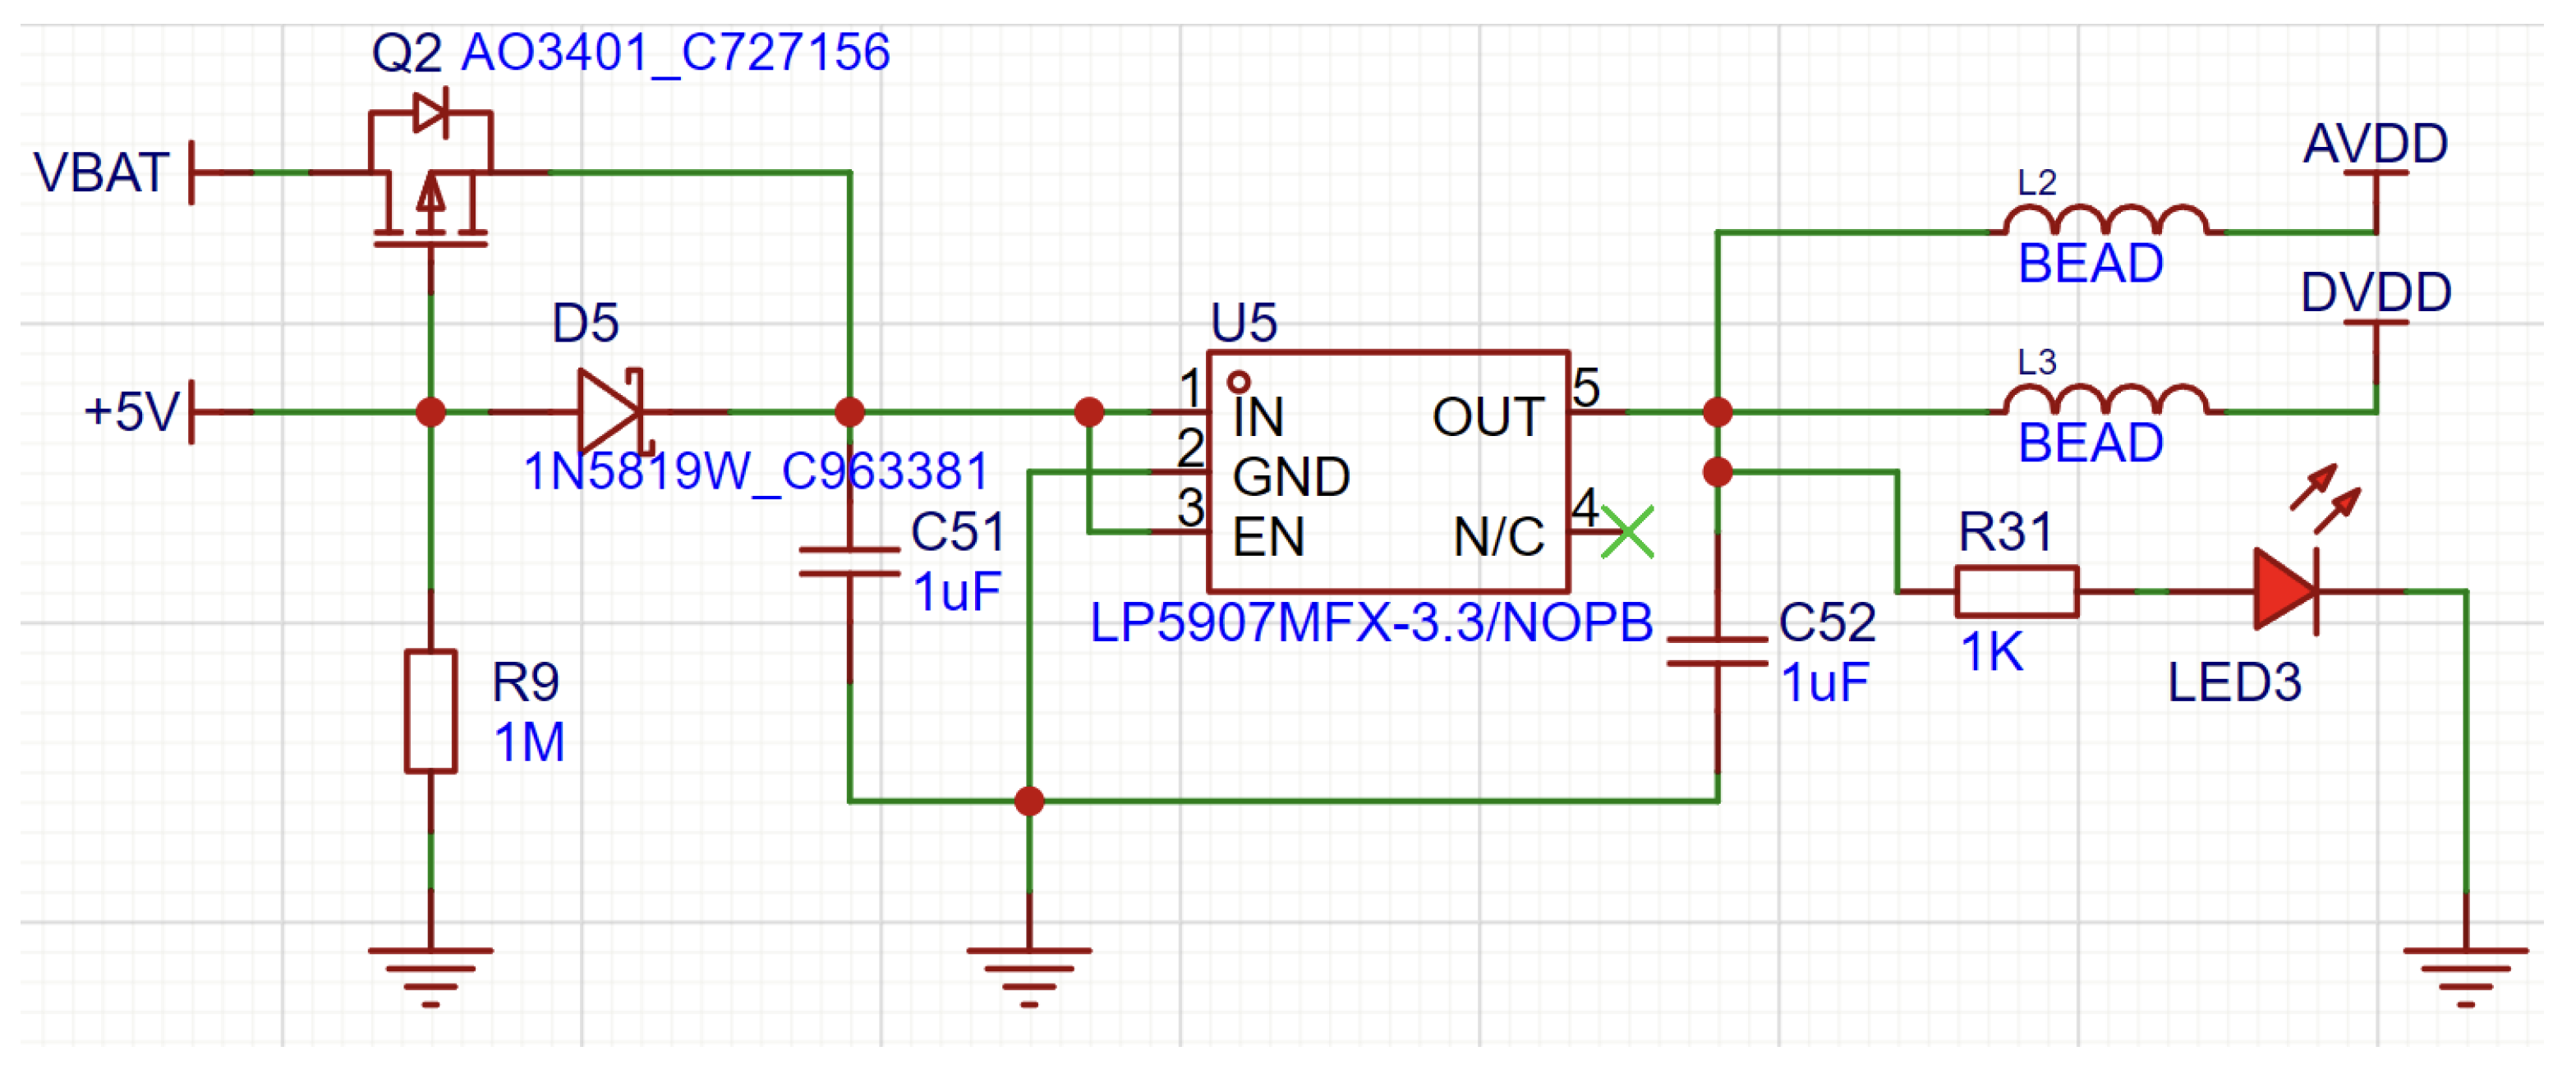
Figure 13.
EEGConvTrans Architecture Overview.

Figure 14.
Feature Extractor.
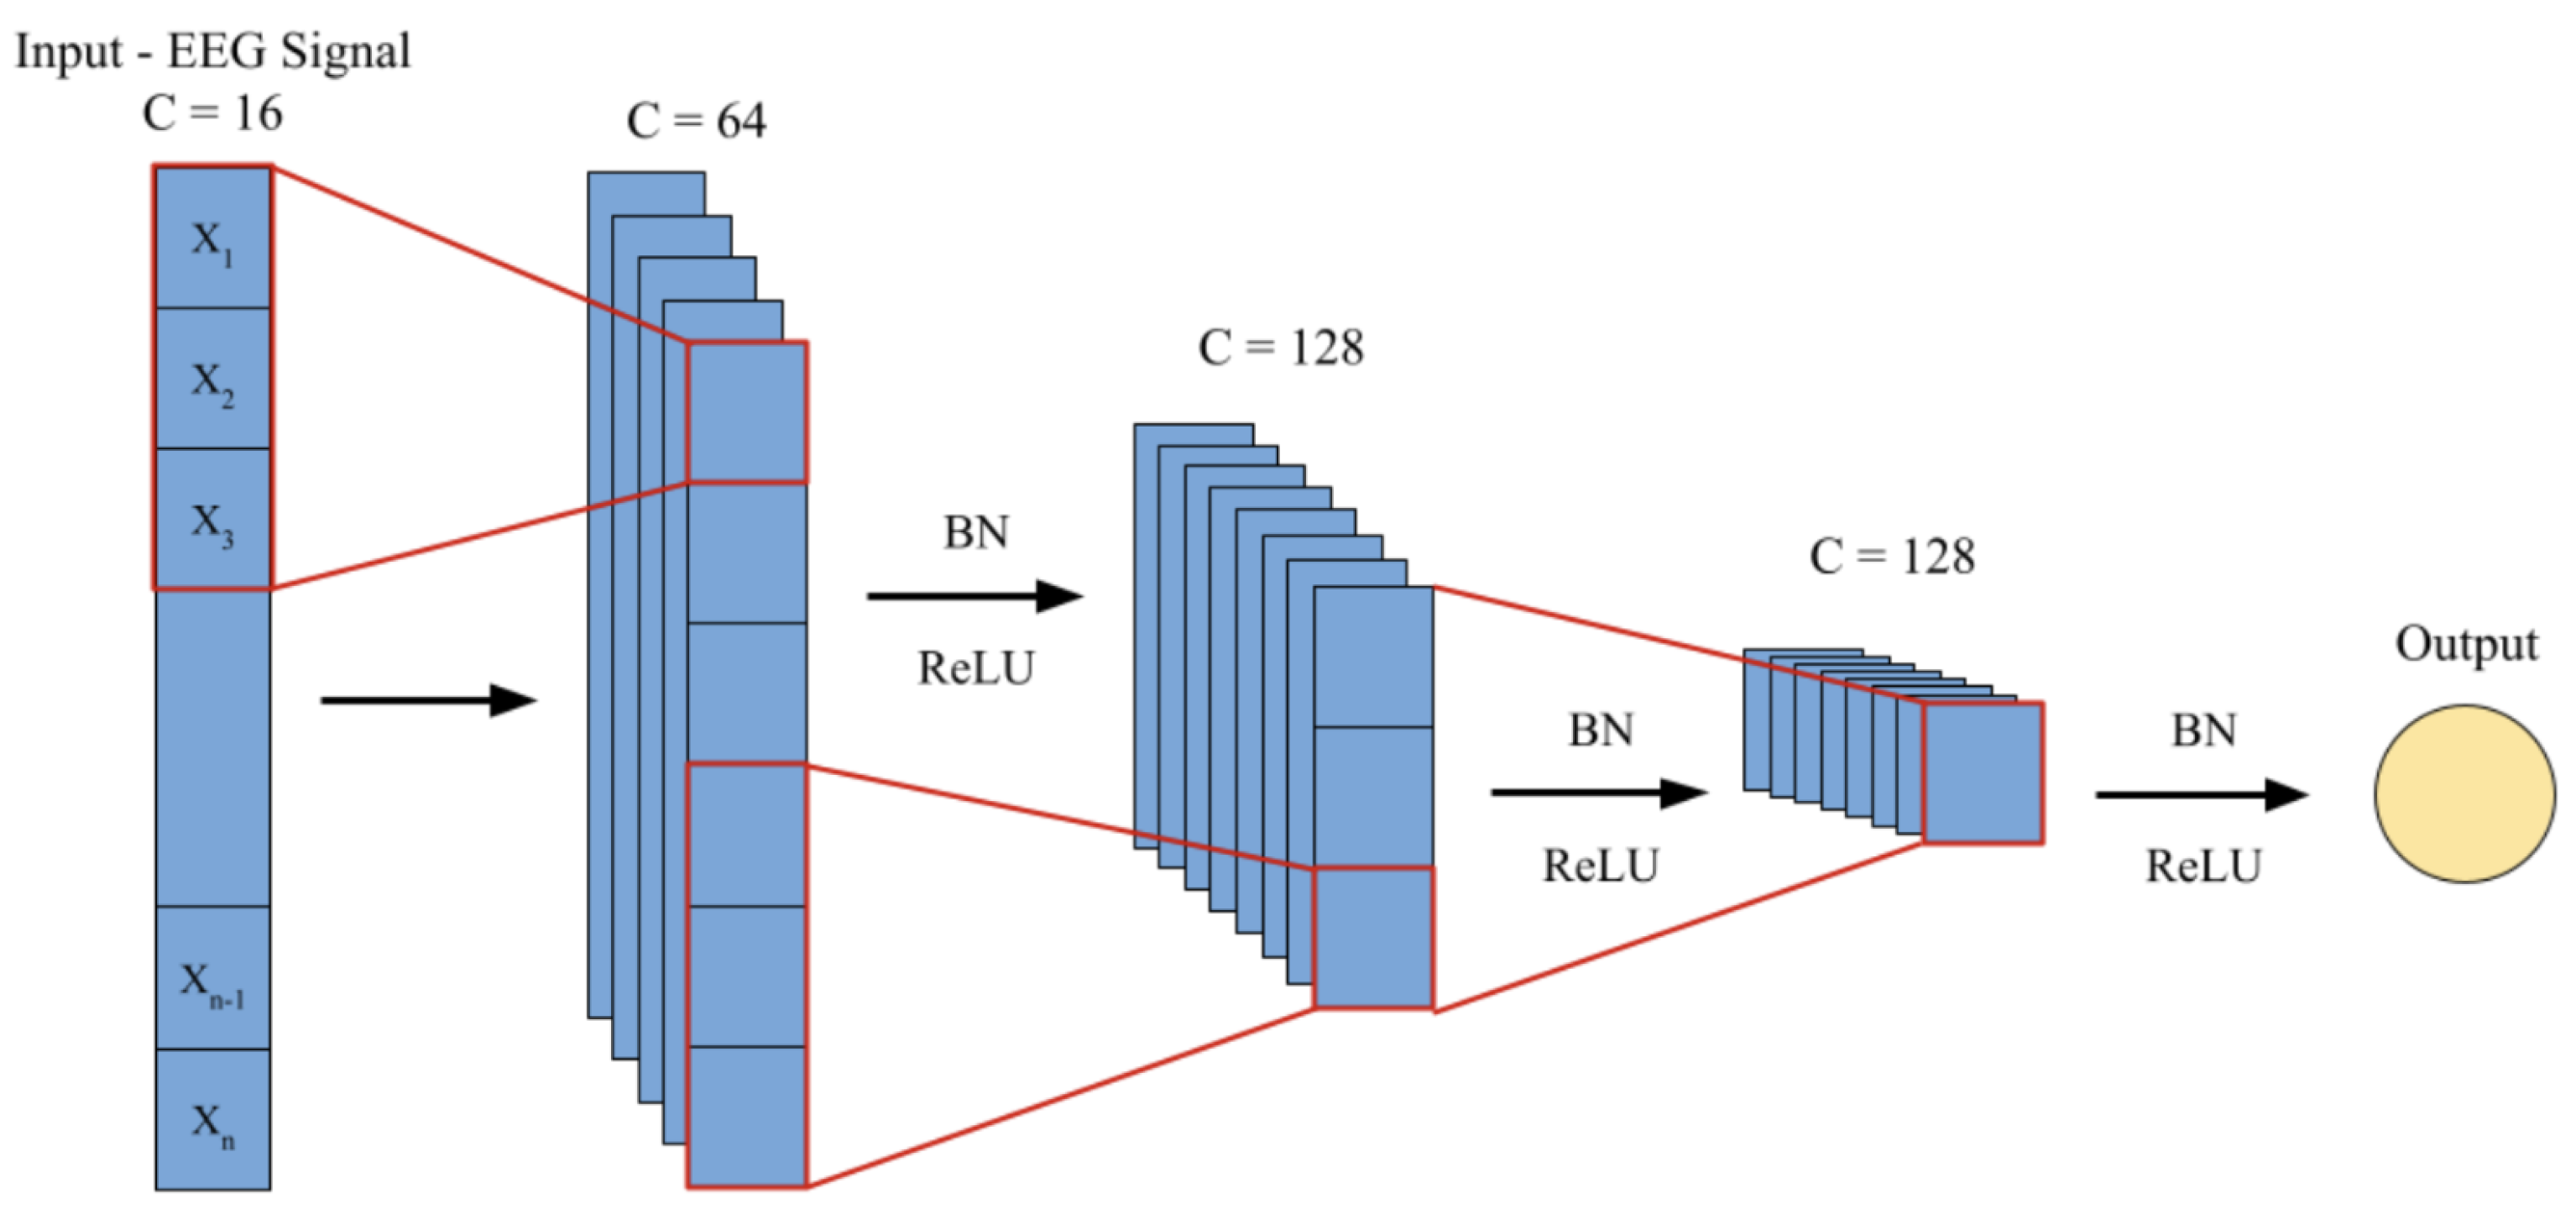
Figure 15.
Transformer Encoder.
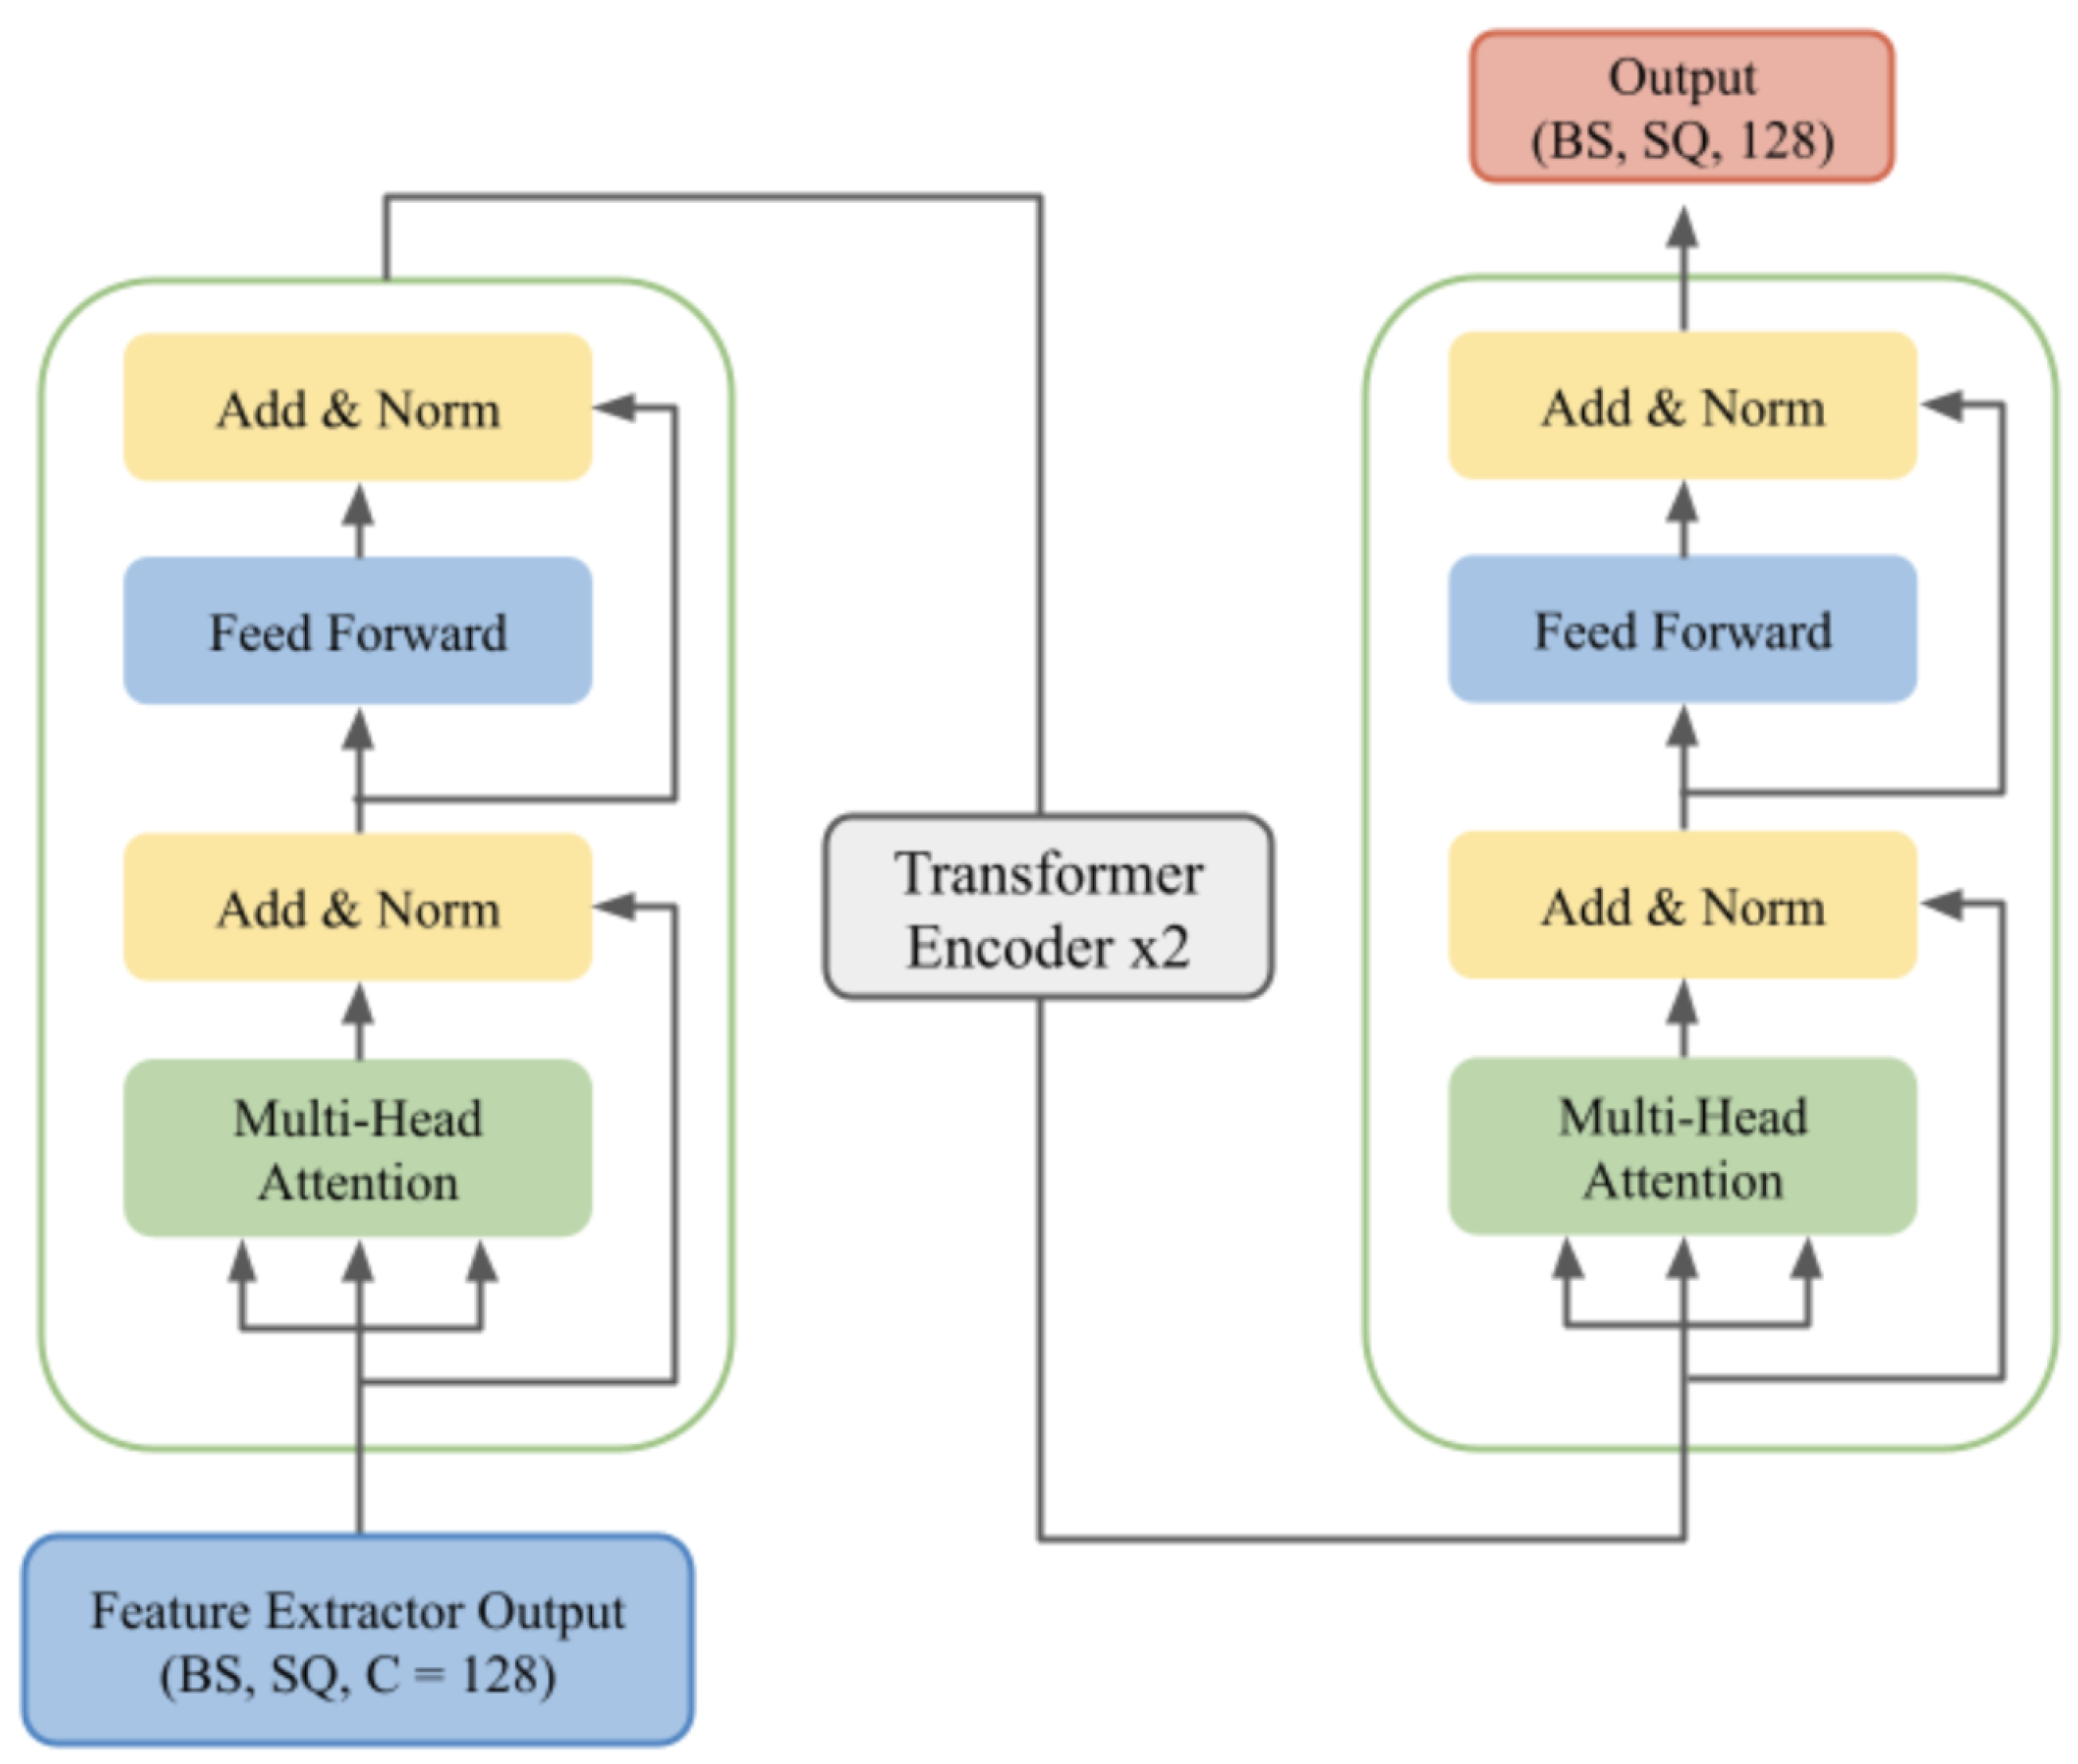
Figure 16.
Classification Head.

Figure 17.
Shock absorption test of samples with different internal structures.
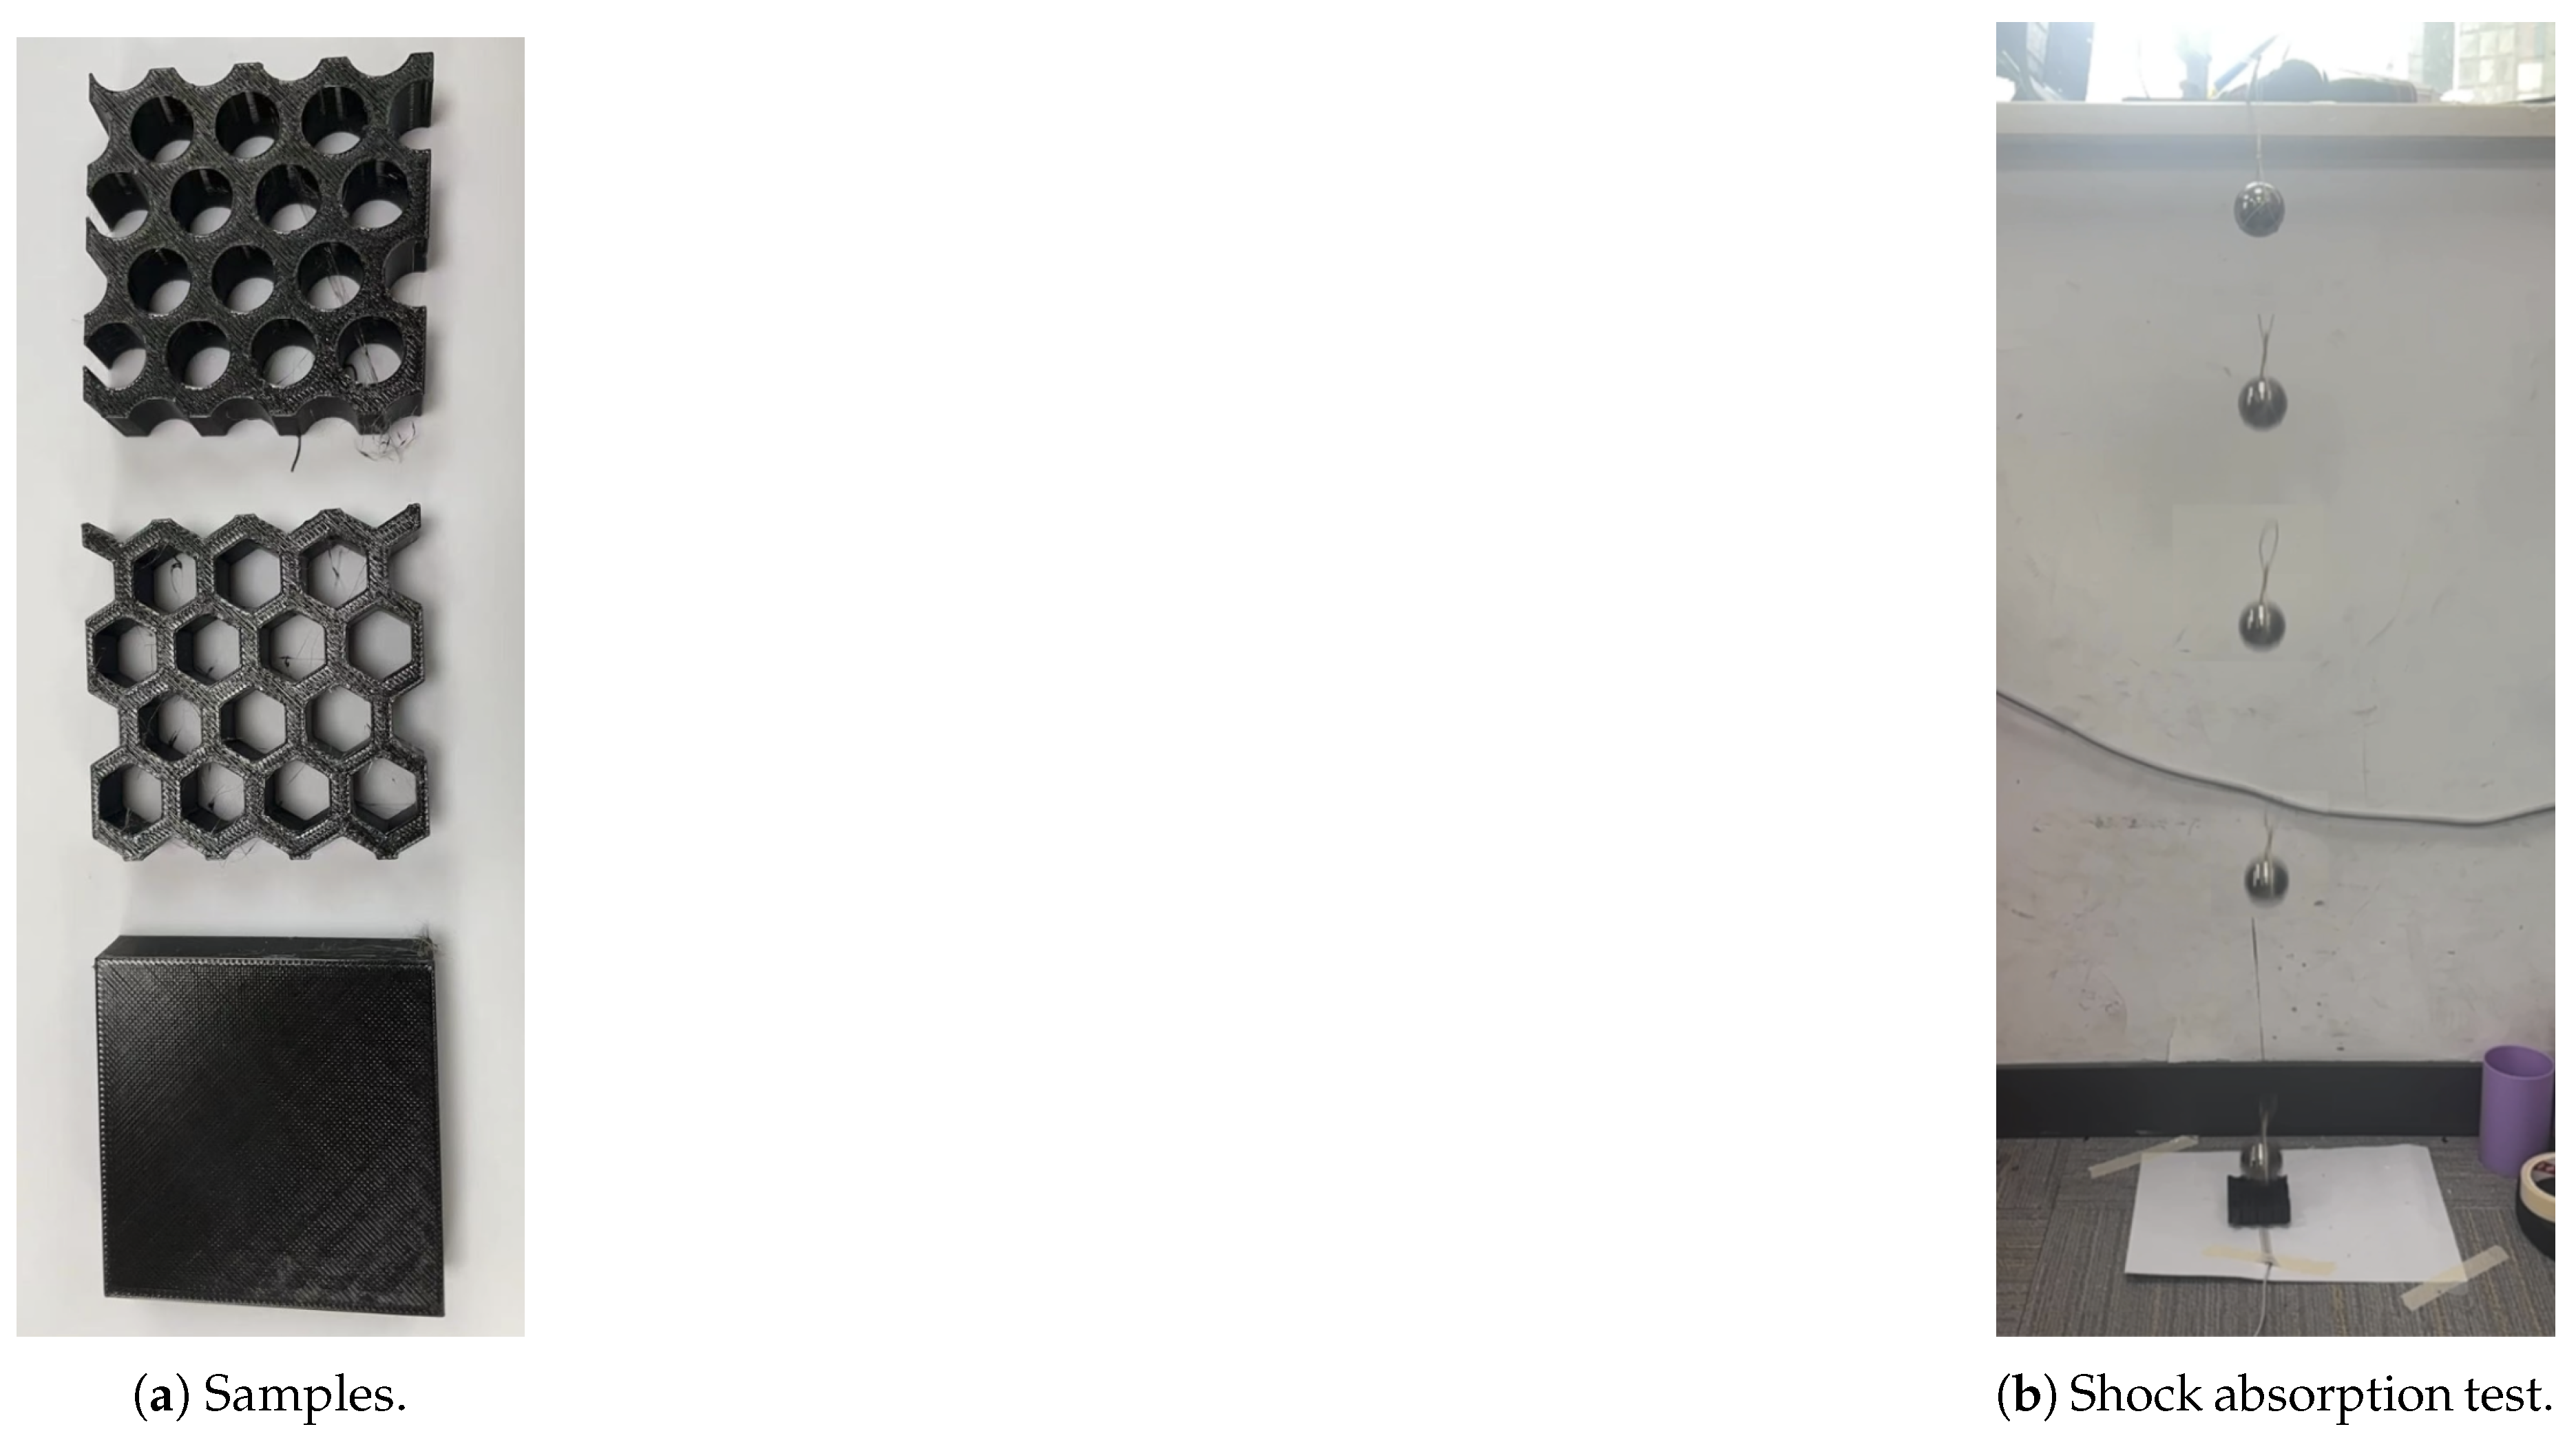
Figure 18.
Horizontal and vertical impact absorption comparison among different internal structures.
Figure 18.
Horizontal and vertical impact absorption comparison among different internal structures.
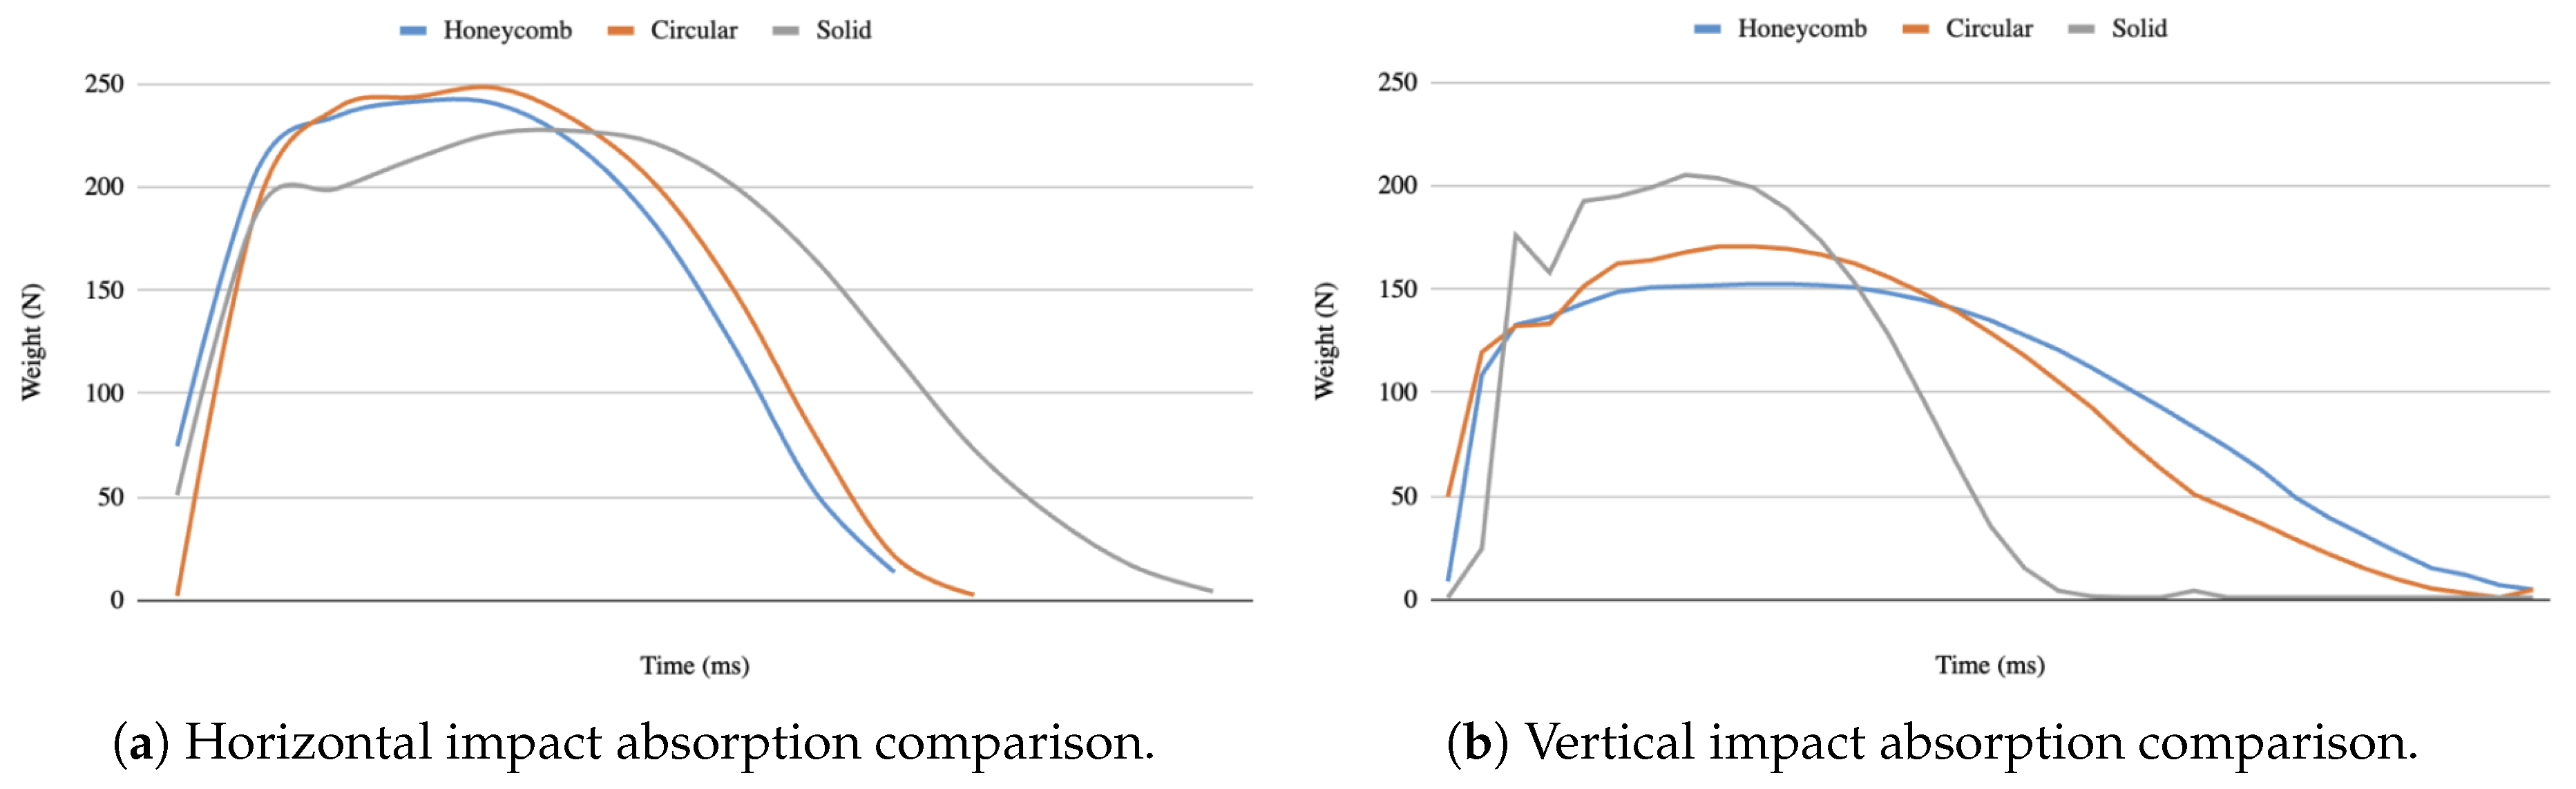
Figure 19.
Horizontal and vertical impact absorption comparison among different internal structures.
Figure 19.
Horizontal and vertical impact absorption comparison among different internal structures.
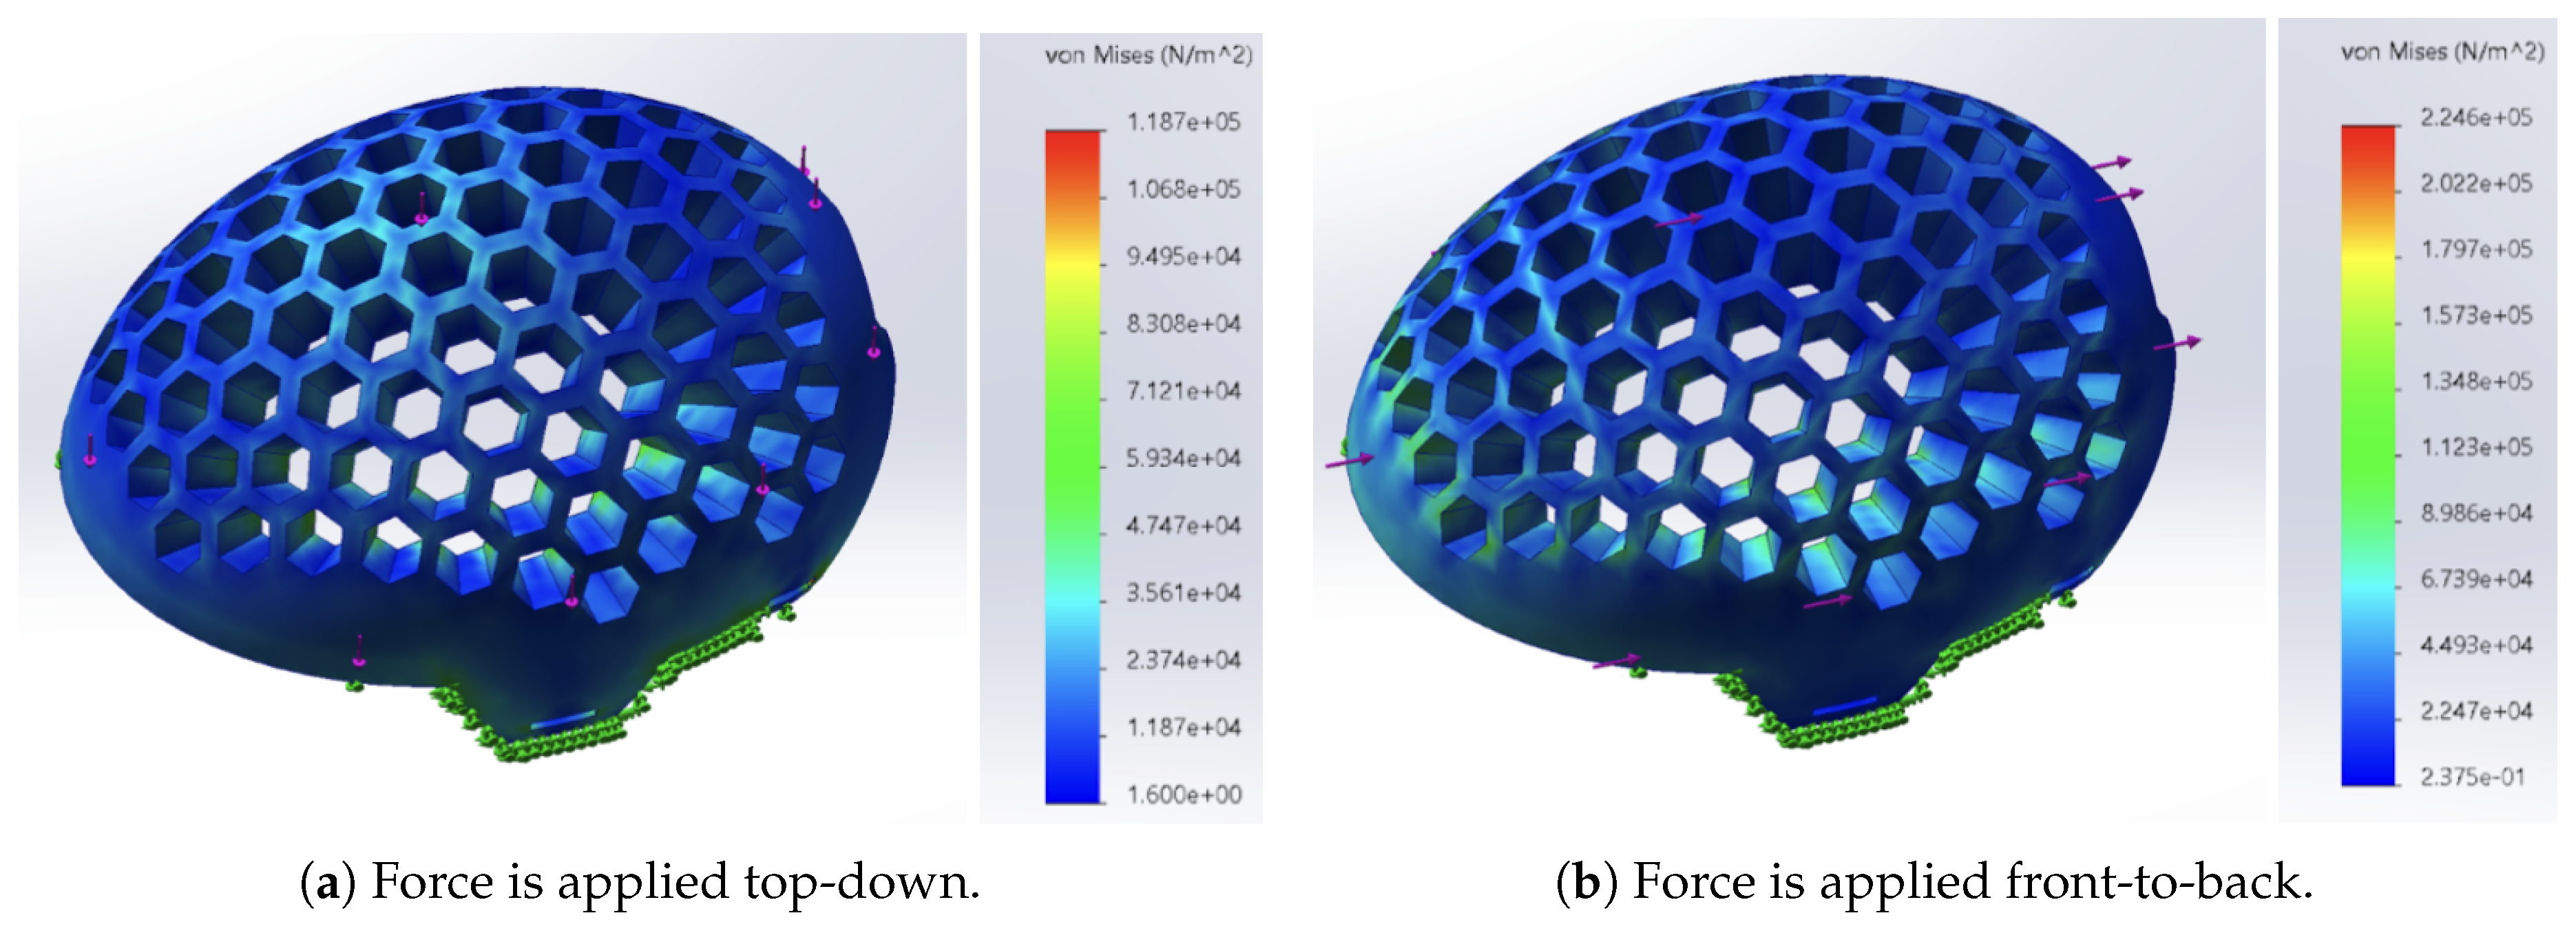
Figure 20.
Loss and accuracy measurements of attention and emotion task.
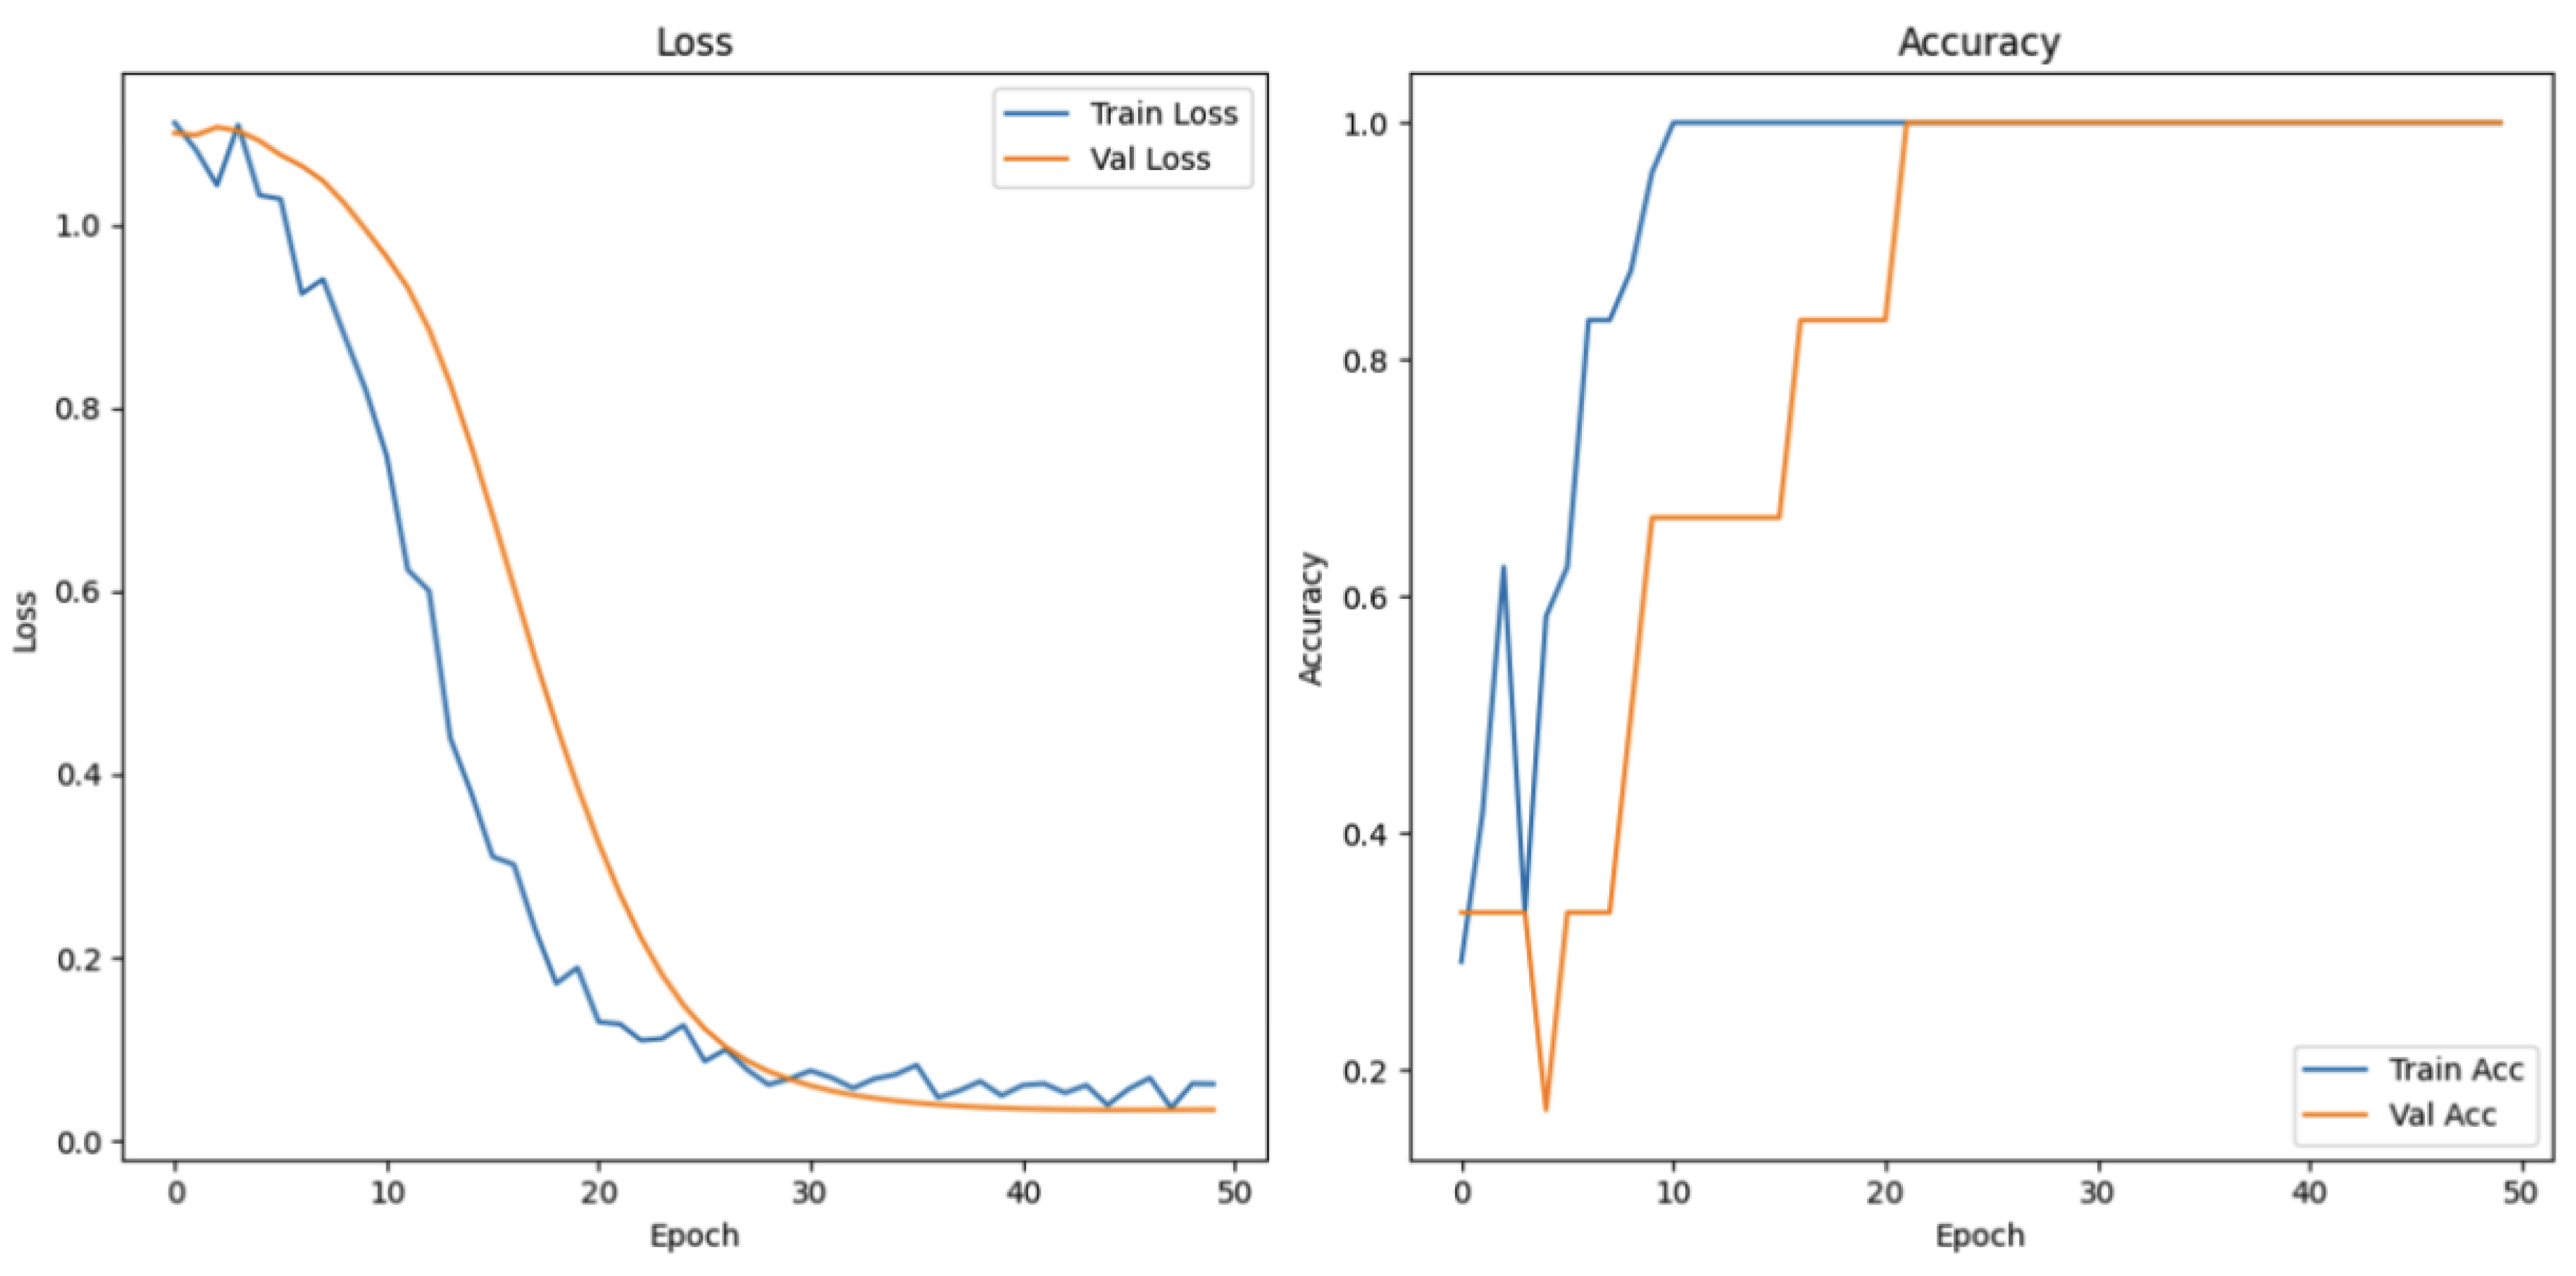
Figure 21.
Loss and accuracy measurements of speech and fluency task.
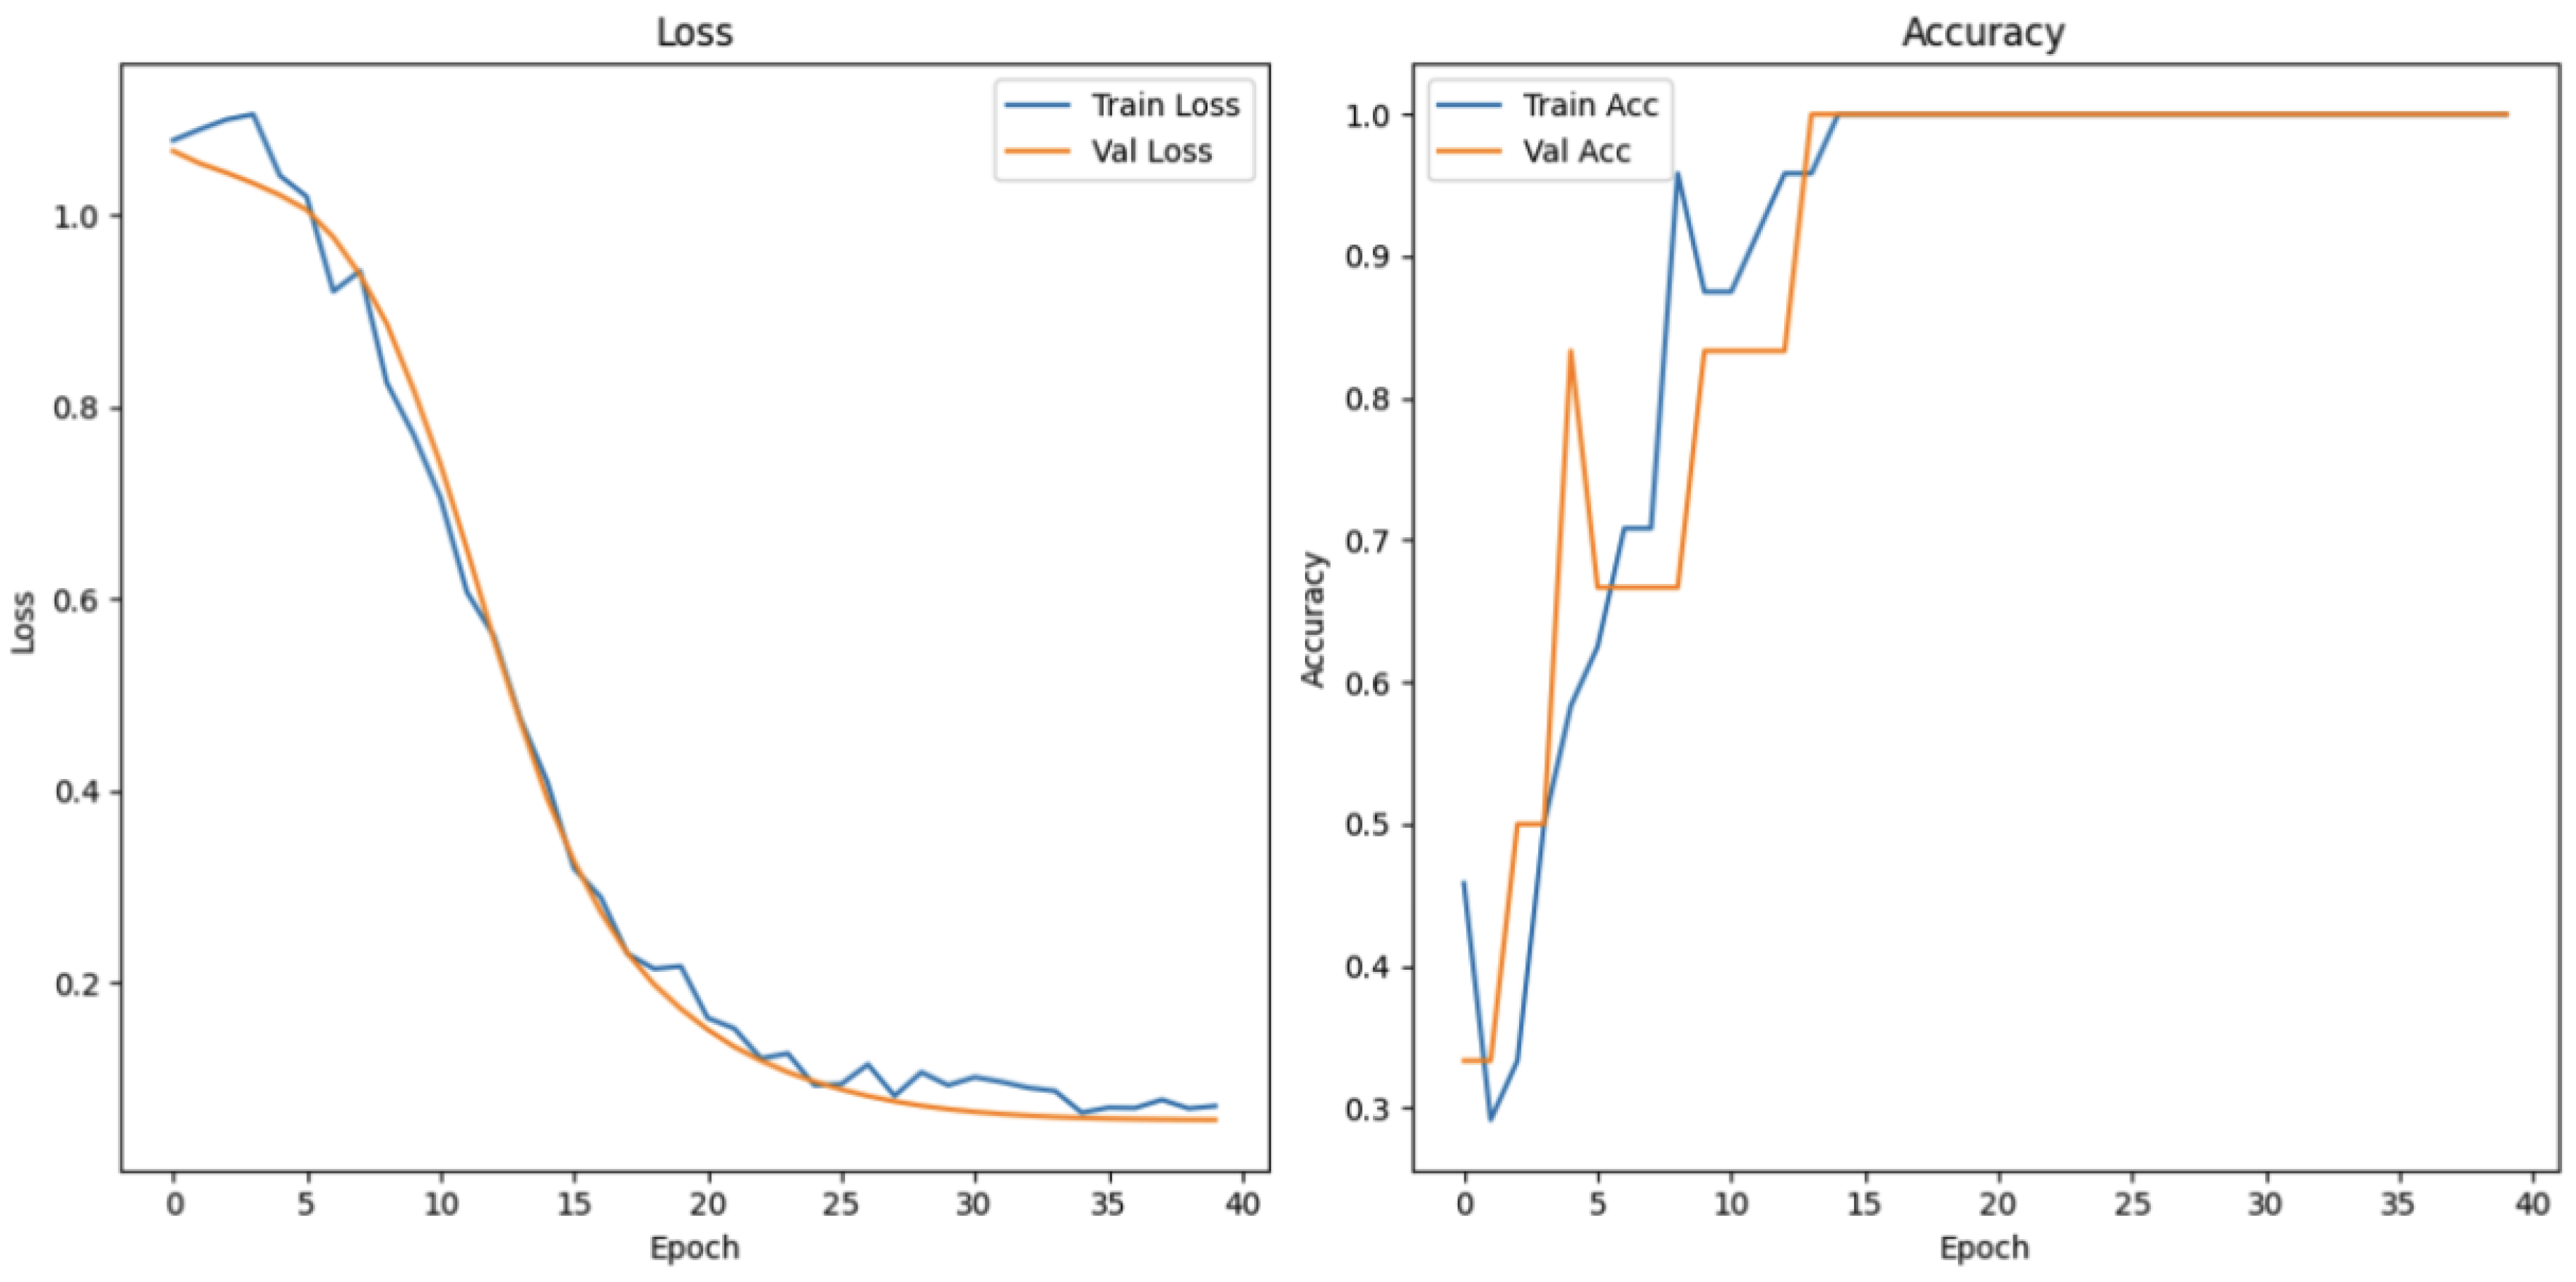
Figure 22.
Loss and accuracy measurements of finger tapping task.
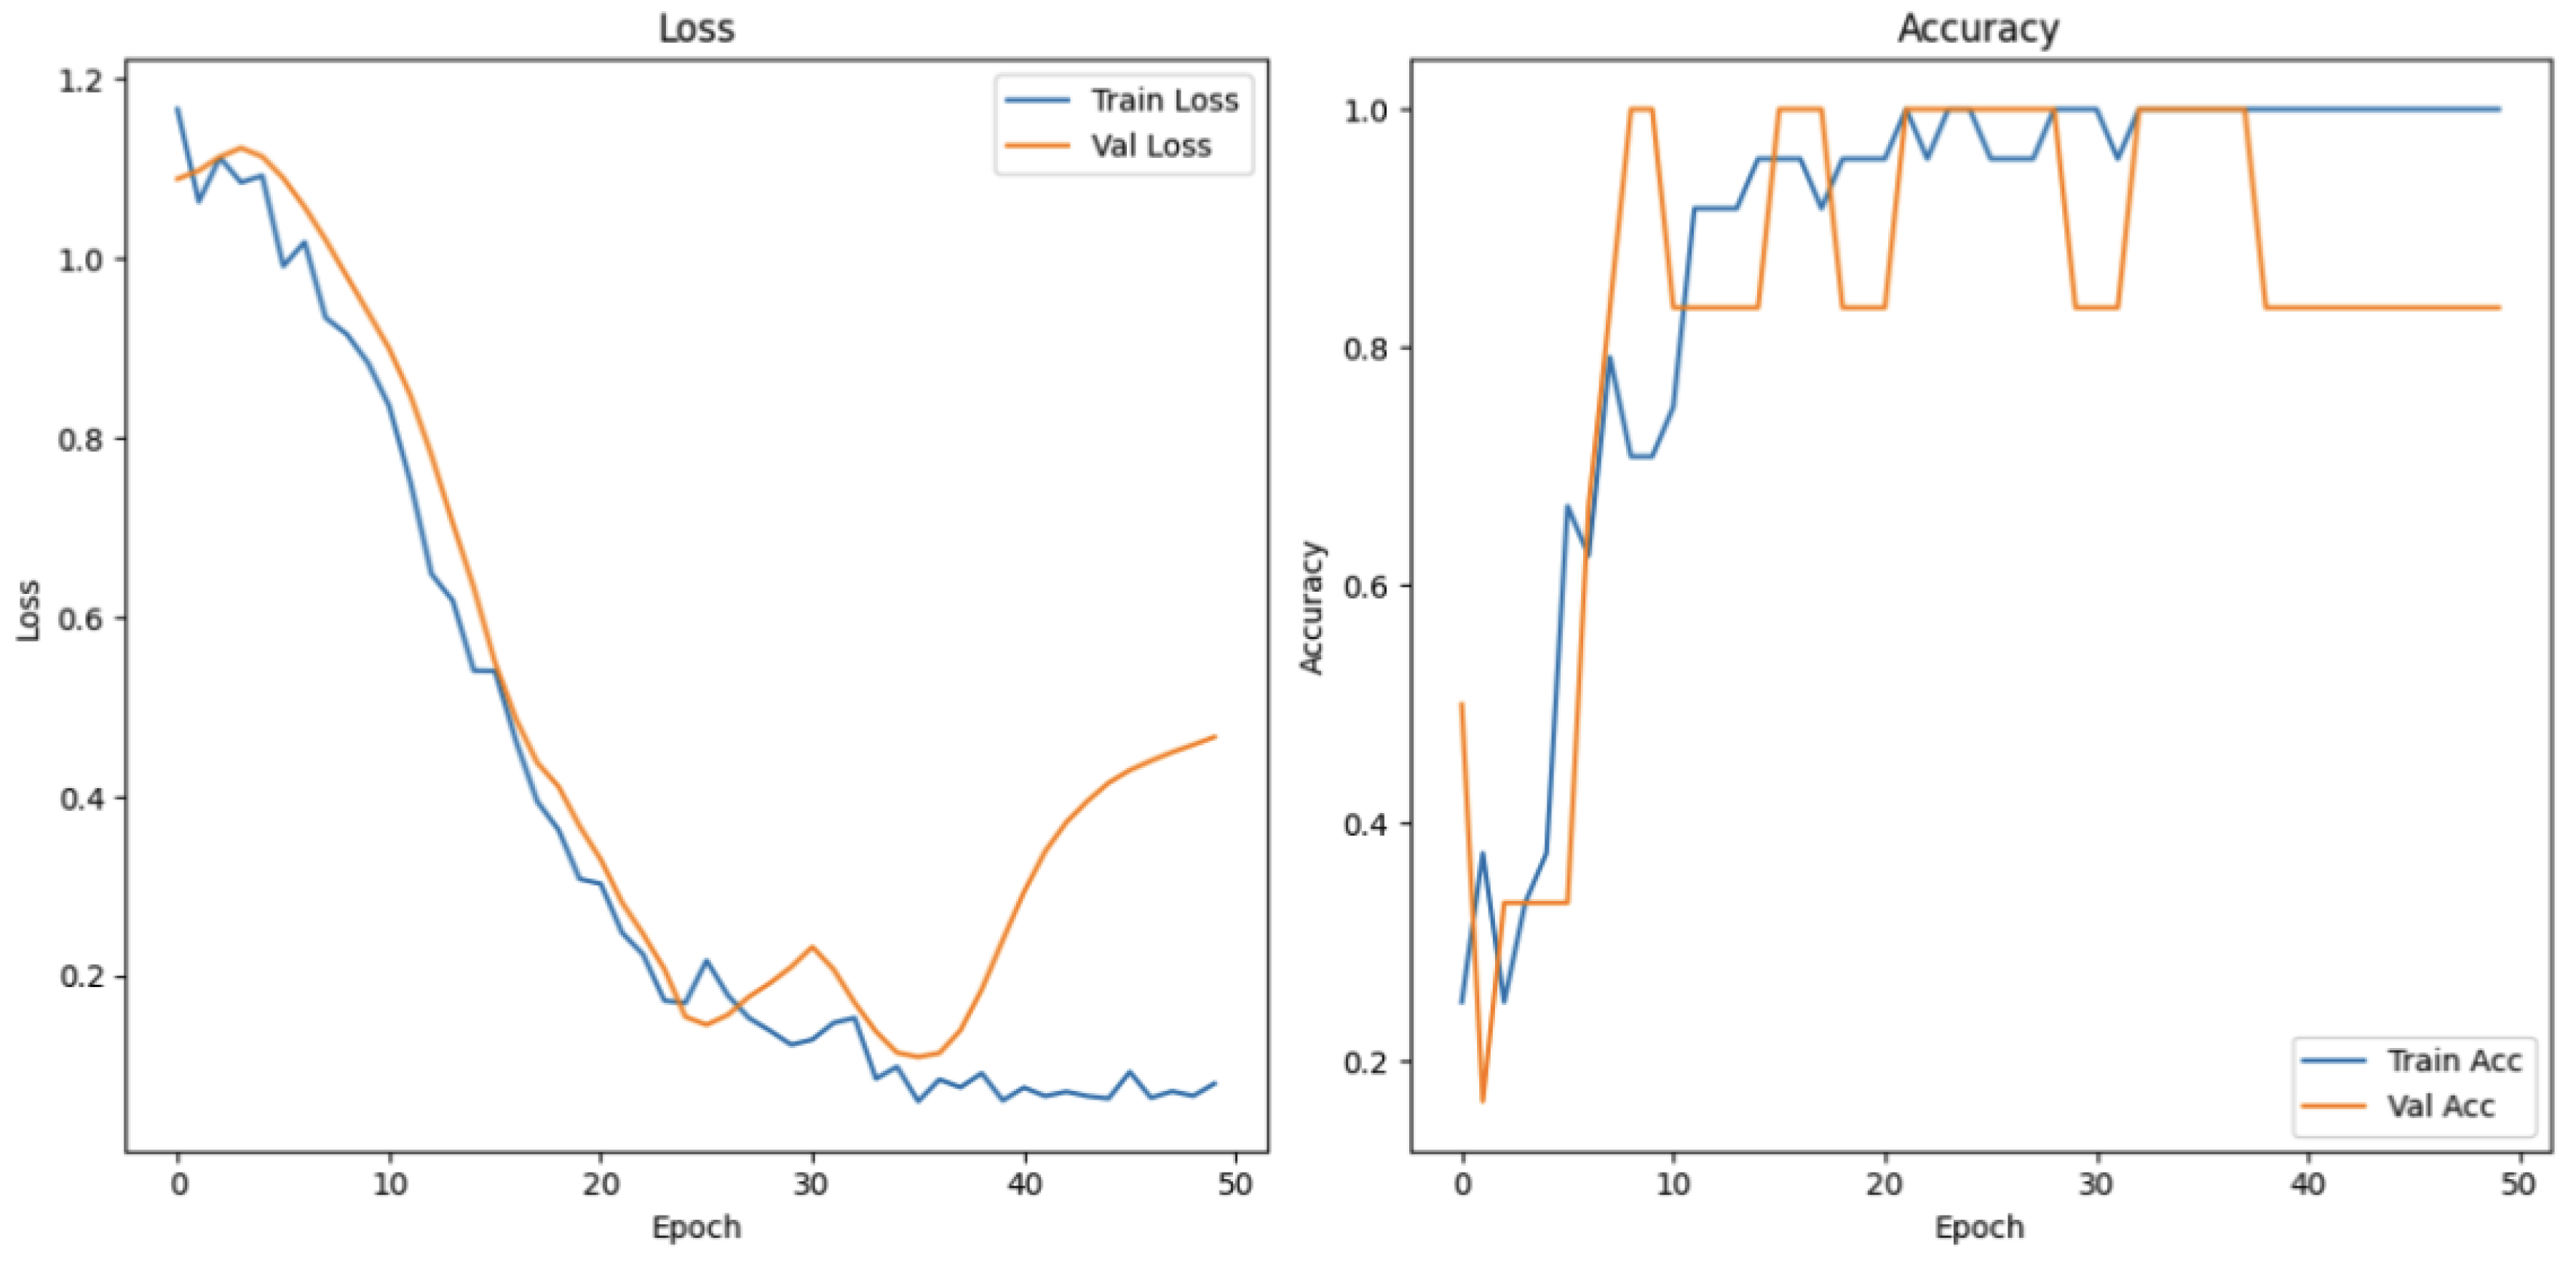
Figure 23.
Loss and accuracy measurements of breathing state task.
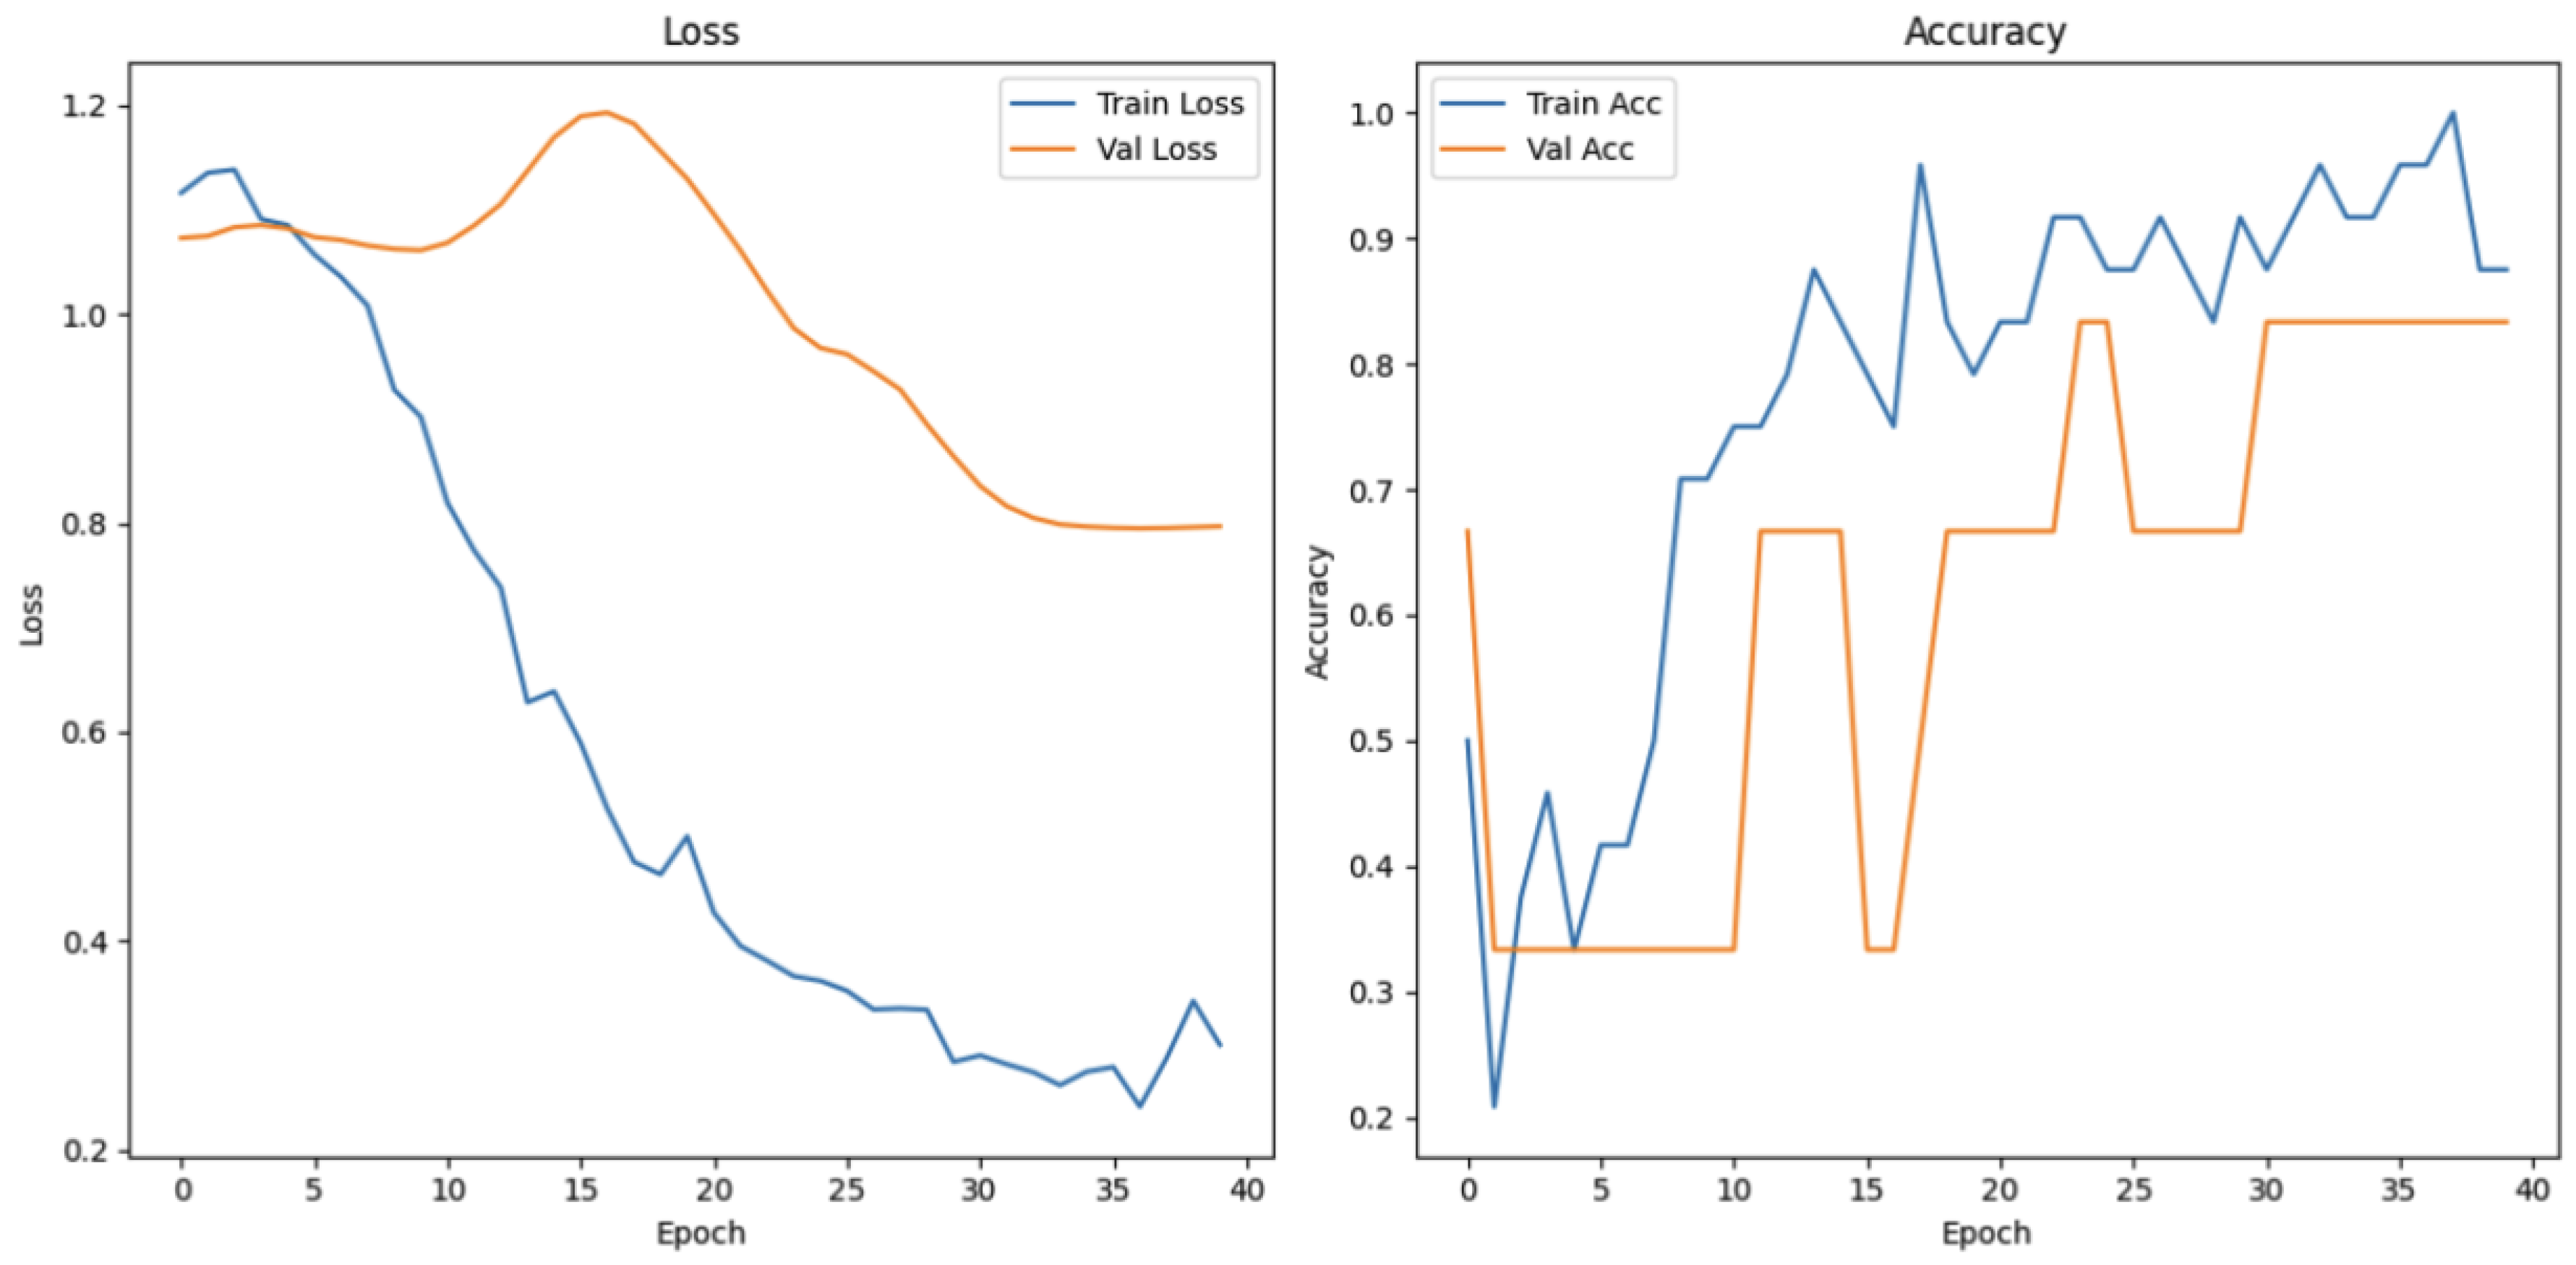

Table 1.
Categorization of Cognitive and Physiological States for Concussion Risk Assessment.
Disclaimer/Publisher’s Note: The statements, opinions and data contained in all publications are solely those of the individual author(s) and contributor(s) and not of MDPI and/or the editor(s). MDPI and/or the editor(s) disclaim responsibility for any injury to people or property resulting from any ideas, methods, instructions or products referred to in the content. |
© 2025 by the authors. Licensee MDPI, Basel, Switzerland. This article is an open access article distributed under the terms and conditions of the Creative Commons Attribution (CC BY) license (http://creativecommons.org/licenses/by/4.0/).
Copyright: This open access article is published under a Creative Commons CC BY 4.0 license, which permit the free download, distribution, and reuse, provided that the author and preprint are cited in any reuse.


