
Submitted:
03 June 2025
Posted:
03 June 2025
You are already at the latest version
Abstract
This study examines the relationship between land use and soil organic carbon (SOC) storage in tropical Andean ecosystems. Its novelty lies in applying a socio-ecological approach to show how community conservation perception influences SOC storage, contributing to climate change mitigation strategies. Background and Objectives: Land use change reduces carbon stocks in tropical ecosystems. This study focuses on the Las Piedras River basin (Popayan, Colombia), evaluating SOC storage under different plant covers: riparian forests (RF), ecological restoration (ER), natural regeneration (NR), and livestock pastures (LS), and its relationship with local conservation perception. Materials and Methods: SOC storage at 30 cm depth, carbon inputs and outputs, and soil physicochemical properties were measured across land uses. Sixty-five community surveys assessed conservation perceptions. Analyses included ANOVA, principal component analysis, and multinomial logistic regression. Results: SOC was significantly higher in RF (148.68 Mg ha⁻¹), followed by ER and LS, and lower in NR (97.30 Mg ha⁻¹). A positive relationship was found between high conservation perception and greater SOC content. Conclusions: SOC storage is strongly influenced by land use and community conservation values. Active restoration and environmental education strategies are crucial to strengthening the socio-ecological resilience of these ecosystems
Keywords:
carbon sequestration. ecosystem services
; socio-ecological systems
; soil propertie
1.Introduction
The transformation of natural areas into anthropized zones, driven by rapid economic growth, decreases biodiversity and ecosystem services (ES), and increases the concentration of greenhouse gases (GHG), often exceeding the regulatory capacity of different ecosystems [1]. Agricultural land used for food production covers approximately 38-55% of the planet's habitable land, while the global food system is responsible for around 37% of anthropogenic GHG emissions and could add almost 1 ° C to warming by 2100 [2], to maintain food production and environmental conditions at local, regional and global scales, soil is a vitally important resource, its role as a sink or source of carbon (C) is determined by its vegetation covers which modify its structure and increase the mineralization rates of organic matter, releasing CO2 into the atmosphere [3].
The quantification of carbon (C) storage in biomass and soil and GHG emissions such as CO2 are the most studied ES, because soil plays a fundamental role in stabilizing C levels, which will help meet the climate objectives of the 2015 Paris environmental summit, to limit global warming to less than 2 °C by 2100 and reduce CO2 levels through the ecosystem service of soil organic carbon (SOC) sequestration [4]. Some areas can be strategic to achieve this objective, such as the ecosystems of the tropical Andean slope of Colombia with soils that are mostly derived from volcanic ash and important carbon stocks and stabilizers, due to their high content of organic matter these ecosystems present high biological, cultural and agricultural diversity [5], but due to their conditions, they concentrate constantly growing human populations that demand a large amount of natural resources, which leads to the loss of natural vegetation cover [6].
The analysis of the deterioration of Andean ecosystems must be approached from the complexity of socio-ecological systems (SES), with an in-depth understanding of the components for the sustainability of this region [7]. Agricultural activities are the main drivers of the dynamics of changes in land use with intensive crops and extensive pastures, which impede forest regeneration (Muñoz Gómez et al., 2018). This problem affects the physical, chemical, and biological properties of the soil; this can reduce SOC by more than 50% at a depth of 20 cm and between 25-30% at 100 cm during agricultural periods of 30 to 50 years (Tan & Lal 2005; Krauss et al. 2022). Increases in SOC stocks have been shown to improve crop yields in high-input commercial agriculture, but especially on low-input degraded lands, making SOC a crucial nutrient source for agricultural production [10]; given its importance in soil health, a decrease in SOC content is a threat to food security and the agricultural socio-economics of the country [11].
With population growth and the expansion of the agricultural frontier, there is a growing demand for water and fertile soils [12]. An example of this is the Las Piedras River basin, which supplies water to the Popayan municipality (Colombia) and constitutes a buffer zone for the Purace National Natural Park, home to a variety of conserved natural ecosystems. However, agricultural expansion has led to landscape changes with the loss of native vegetation (Ordoñez et al. 2015). These anthropogenic processes, such as extensive livestock pastures (LS), increase GHG emissions, reduce biodiversity, and reduce the provision of ES such as water regulation and SOC storage due to reduced inputs of organic matter and physical soil protection [14]. Given this situation, initiatives have been generated for the protection and care of this watershed with different conservation uses such as: conserved riparian forests (RF), ecological restoration (ER) and natural regeneration (NR), as sustainable management measure and practices appropriate to land use change. To highlight the importance of these community conservation strategies in the territory, it is necessary to understand the functioning of these covers in terms of their ES such as SOC storage, which is an important indicator of soil quality in agricultural and environmental terms. This demands the development of a conceptual model from the socio-ecological approach that allows understanding the relationship between the different land uses conditioned by human activities of the communities that inhabit tropical Andean ecosystems with SOC storage, in the hope of finding significant differences in C contents between land uses in the territory and contributing to the conservation of Andean ecosystems.
2. Material and Methods
2.1. Site and Land Use Description
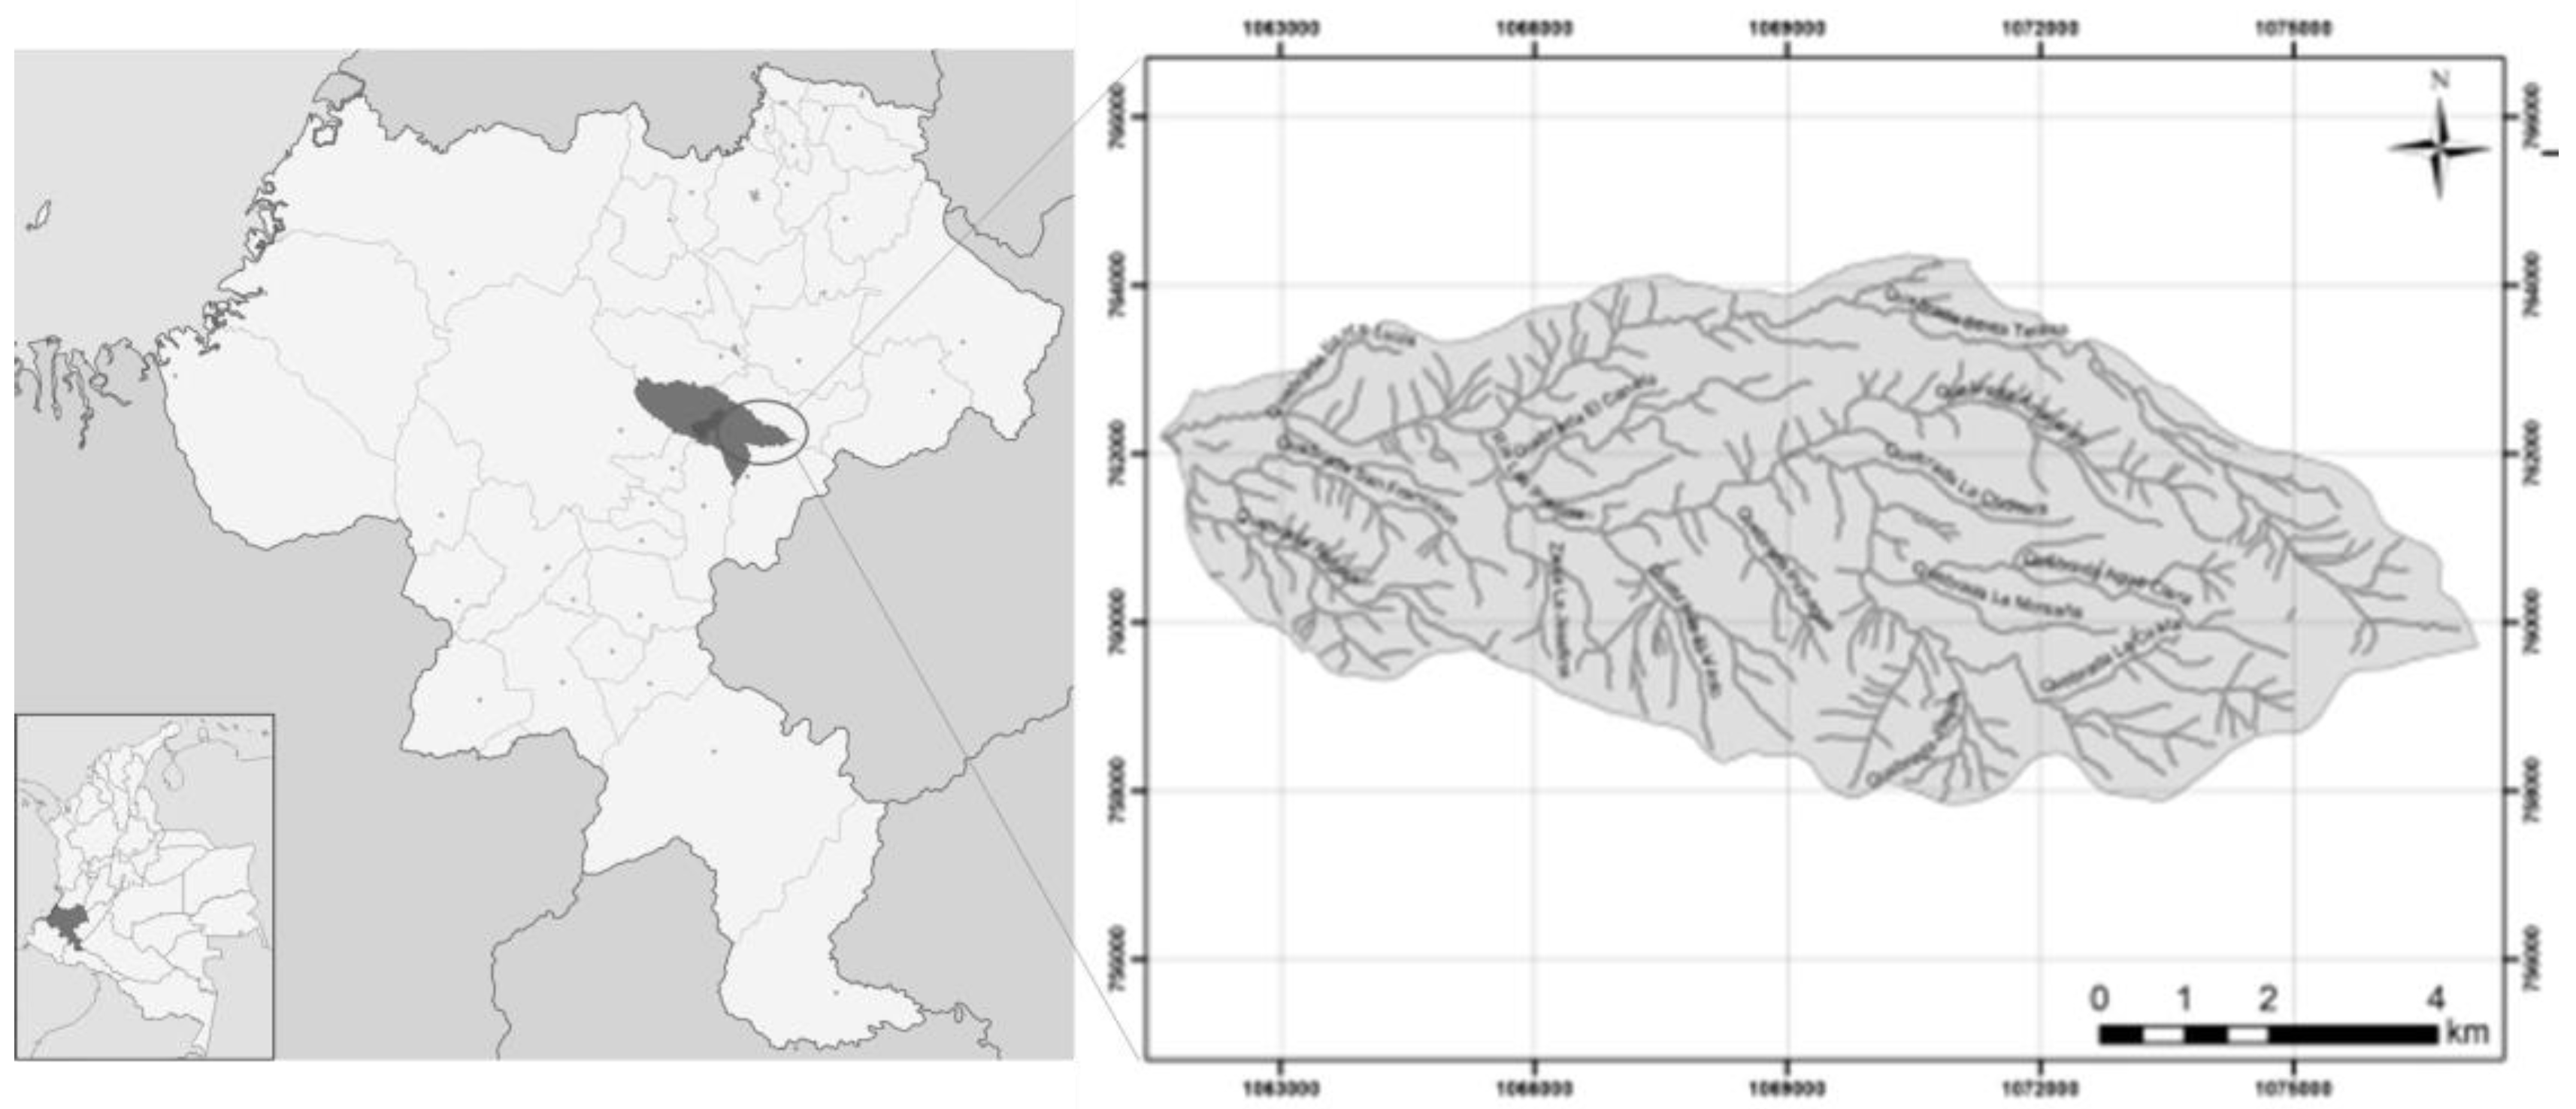
The Las Piedras River basin is located in the intertropical equatorial Andes at coordinates 2°1'35'' N and 76°33'10'' and has an area of 58 km2 (Figure 2). The average monthly temperature varies between 10.4 °C and 18.4 °C, with an altitudinal range between 1980 and 3820 masl that corresponds to the sub-Andean forest and Andean forest formations, made up of a mountainous relief, with steep, long and straight slopes that are between 35-98% in the high zone, 16-35% in the middle zone and 3-15% in the low zone. The soils are mainly formed from volcanic ash, with a medium texture of poorly structured and well-drained clayey loam; they have strong acidity [15].
Figure 1.
Localización del área de estudio.
In each land use of conservation (RF, ER, NR) or livestock (LS), 3 transects of 300 m2 were established where the diameter and height structure as well as the basal area were calculated for trees with dimeters at breast height (DBH) >0.1 m. The RF had a basal area of 15.75 m2 ha-1 and 1538 trees ha-1; ER had a basal area of 16,33 m2 ha-1 and 1485 trees ha-1; and NR had a basal area of 6.08 m2 ha-1 and about 873 trees ha-1 (Table 1). Three different species of the family Poaceae were found in PAS: Holcus lanatus, Pennisetum purpureum and Lolium multiflorum.

Table 1.
Forestal structure to the plant covers.
| Plant cover | |||
| Variables | RF | ER | NR |
| Basal area/ha (m2 ) | 15,75 ± 0,03 | 16,33 ± 0,02 | 6.08 ± 0,04 |
| No. trees/ha (DAP>0,1m) | 1538 ± 0,04 | 1485 ± 0,05 | 873 ± 0,08 |
The plant cover NR It had an area of 10 ha with a basal area of 6.08 m2/ha and approximately 873 trees per ha with DBH>0.1 cm distributed in 20 different species (Acnistus sp., Calliandra pittieri, Cariniana pyriformis, Caryodendron orinocense, Cavendishia nuda, Clusia alata, Cordia alliodora, Guazuma ulmifolia, Hymenaea courbaril, Inga edulis, Lafoensia speciosa, Leucaena leucocephala, Myrsine sp., Ochroma pyramidale, Percea caerulea, Pithecellobium dulce, Retrophyllum rospigliosii, Sena spectabilis, Zanthoxylum rhoifolium, Zygia longifolia). The coverage with ecological restoration (ER) presented an extension of 30 ha with a basal area of 15.75 m2/ha and approximately 1538 trees with DBH>0.1m per ha, the riparian forest (BR) has an extension of 45 ha with a basal area of 16.33 m2/ha and around 1485 trees with DBH>0.1m per ha; (Table 1).
2.2. Data Collection
2.2.1. Determination of Soil Carbon Inputs and Outputs
To determine C inputs in the studied vegetation covers, litter production was estimated in the forested plots. Twelve litter collection baskets, each 1 m2 in area, were established. The litter was collected every 30 days for a year and weighed fresh and dry (oven-dried at 65°C for 24-48 hours) [16], for this study, grass litter was considered to be all senescent material not attached to the plant (loose on the soil or tangled in stems) (Boddey et al., 2004). The weights obtained every three months were averaged to obtain four reference values for estimating carbon inputs from litter. Carbon dioxide emissions into the atmosphere were estimated to be from basal soil respiration. CO2 was measured by the respirometry method (C–CO2) in the field. The sodium hydroxide (NaOH) sample was placed on a tripod in a closed system for 24 hours, then precipitated with barium chloride, followed by the addition of two drops of phenolphthalein. Finally, the sample was titrated with 0.1 N hydrochloric acid to quantify the amount of hydroxide that does not react with CO2, and a control or blank was used. The metabolic quotient (qCO2) allowed the evaluation of emissions from the organic component of the soil; for this purpose, the values obtained every three months were averaged to obtain four reference values to estimate carbon inputs from leaf litter.
2.2.2. Soil Sampling
Four 20 m2 sampling plots were established for each land use, with soil and terrain conditions as similar as possible to allow valid comparisons between them. Five 60 g subsamples were taken from each plot to form the corresponding 300 g composite sample. The samples were taken at a depth of 30 cm in the A horizon.
2.3. Laboratory Analysis
2.3.1. Soil Chemical Properties
Carbono y nitrógeno orgánico: se usaron 2 gramos de muestras de los suelos maceradas, los contenidos de carbono y nitrógeno se determinaron en un analizador elemental NC 1500 Carlo Erb Analizador (Carlo Erba Instruments, Milán, Italia). El análisis elemental se utilizó para determinar de forma cuantitativa la composición elemental (C y N) de las muestras del suelo de las diferentes coberturas vegetales a estudiar [17].
Soil organic carbon: with the data obtained from the carbon content and apparent density at each sampling depth, the carbon content of SOC was estimated (EQUATION 1)
Equation 1
Where:
SOC: organic carbon stored in the soil (Mg ha-1)
A: area (1 ha = 10,000 m2)
Corg: grams of organic carbon in soil (Mg C/100 Mg)
Da: bulk density of the soil (Mg/cm3)
P: depth of the soil layer. Since the content was estimated for the first 30 cm of soil depth, P=0.1 m.
The pH was determined using a potentiometer in a 1:1 soil-water suspension. The suspension was stirred intermittently for one hour, and the reading was taken. The effective cation exchange capacity (CEEC) was determined as the sum of exchangeable bases (Ca, Mg, K) extracted with 1N ammonium acetate and neutral, plus the exchangeable Al content, extracted with 1N KCl [18].
2.3.2. Soil Physical Properties
Bulk density (BD) g/cm3 was determined by the soil core method [19], with a cylinder of 64.45 cm3 and five subsamples per plot. Soil texture was determined by the hydrometer method [19]. Hygroscopic moisture content (HSM)% equilibrates a previously oven-dried soil sample in a controlled relative humidity environment (usually 98-100%), this is done by placing the sample in a desiccator with a saturated salt or water solution at the bottom, allowing it to reach an equilibrium state. Moisture content was calculated by measuring the mass change between dry soil and equilibrated soil [20], field soil moisture (SM)% was determined gravimetrically by relating the mass of water and the mass of soil solids, necessary to express results on a dry basis and compare results as a function of time [21].
2.4. Socio-Ecological Information Recompilation
Sixty-five surveys were conducted using ARcGIS SURVEY 123 software across the study area to determine the importance of natural resource conservation in the study area in three categories: high, medium, and low. Responses were correlated with input, output, carbon storage, and soil bulk density data
2.5. Data Analysis
Data were analyzed using a block design. Results were subjected to analysis of variance to identify significant differences between the studied land uses for inputs, outputs, and SOC storage. A PCA was performed to identify patterns in the data and reduce dimensionality while preserving as much variability as possible. This analysis allowed for the exploration of relationships between the studied variables (SOC, SBR, C-LL) and different land uses (RF, ER, NR, LS); multinomial logistic regression was used to assess the relationship between SOC storage and land uses (RF, ER, NR, LS) and the importance the community places on natural resource conservation (high, medium, and low). The model provides coefficients for the probability of being in Medium and Low relative to the base category, High. Using Residual Deviance, which is a metric analogous to the sum of squared errors (SSE) in linear regression, adapted for maximum likelihood models such as logistic regression, the Akaike Information Criterion (AIC) is a metric used to evaluate and compare statistical models where one of the levels of the dependent variable (in this case, conservation importance) is used as the reference or base category. This means that the model calculates the probabilities of the other levels (in this case, low and medium) relative to this reference category. The data obtained was processed in the statistical package R 4.2.
3. Results
3.1. C Inputs and Outputs and SOC Storage in Different Land Uses
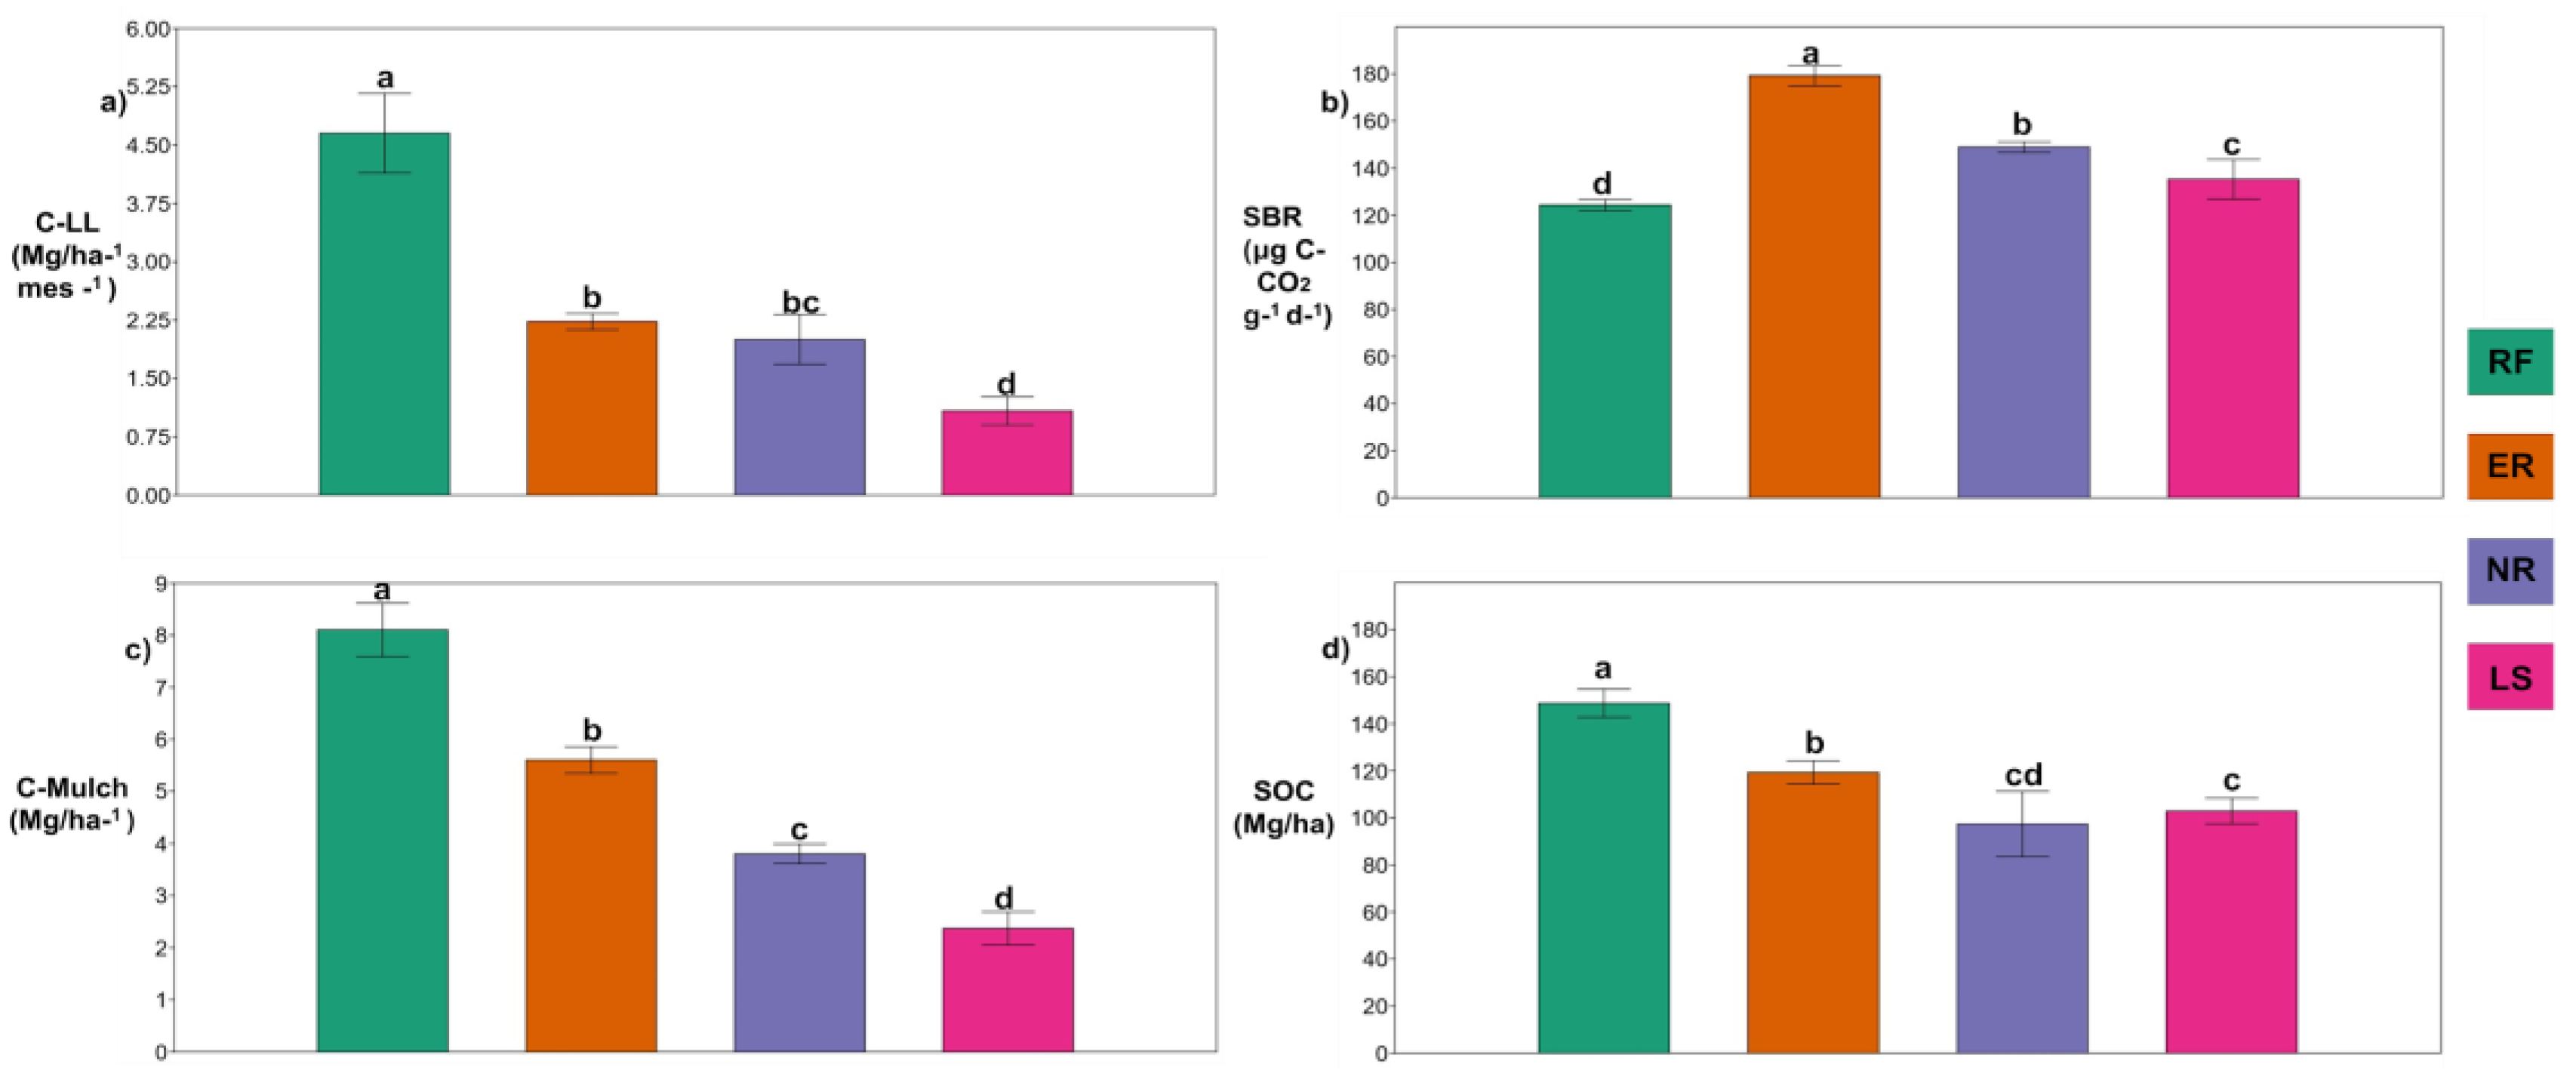
The average values of C contents in leaf litter (Mg ha−1month−1) were significantly higher in RF= 4.65Mg ha−1month−1 the lowest contents were found in (LS) (Figure 3a), the values obtained from soil basal respiration in the rate of release of carbon dioxide (CO₂) from the soil were significantly higher in ER 179.28 (μg C-CO2 g −1 d−1), followed by NR, LS and significantly lower in RF (Figure 3b), the amount of C-Mulch 8.11 (Mg/ha−1) had a similar behavior to that obtained in the average values of C contents in leaf litter and were significantly higher in (RF), while the lowest contents were found in LS (Figure 3c). SOC contents were different higher in RF 148.68 (Mg/ha−1), followed by ER, LS and in NR were significantly (Figure 3d).
Figure 3.
Comparison of the means for the three variables studied in the different land use. C: carbon, SOC: soil organic carbon. The bars represent the standard deviation in each wetland. Different letters indicate significant differences between wetlands (P<0.05).
Figure 3.
Comparison of the means for the three variables studied in the different land use. C: carbon, SOC: soil organic carbon. The bars represent the standard deviation in each wetland. Different letters indicate significant differences between wetlands (P<0.05).
3.2. Physicochemical Properties
The average values of the physicochemical properties of the studied soils (standard deviation) are presented in Table 2: BD (g/cm3) were significantly higher in RF and ER: 1.01 and 1.06 g/cm3, respectively, followed by NR. Significantly lower values were found in LS (p<0.05). MS (%) showed significantly higher values in RF and ER: 13.49 and 11.32%, respectively, followed by LS. Significantly lower values were found in NR (p<0.05). MS (%) values were significantly higher in ER: 65.97%, followed by RF. No differences were found between LS and NR, with significantly lower values. The values obtained in the particle size of the soil texture it was observed that all these soils have high content of Sand (%) and are significantly lower in ER: 72%, the rest do not differ from each other, the content of Silt (%) was significantly higher in ER: 23.39%, followed by NR, the significantly lower values were presented in LS and RF; the clay content (%) did not present significant differences between RF, ER and LS, the significantly lower values were presented in NR (4.05%) p <0.05). The contents of SOC (Mg ha−1) were significantly higher in RF: 148.68 Mg ha−1, followed by ER, LS and in NR were significantly lower. The values obtained from soil basal respiration (μg C-CO2 g−1 d−1) for the carbon dioxide (CO₂) release rate from the soil were significantly higher in ER: 179.28 μg C-CO2 g−1 d−1, followed by NR and LS, and significantly lower in RF. pH values denote acidic soils and did not differ between land uses. ECEC values meq100 g-1 s) were significantly higher in LS: 5.70 meq100 g-1 s, followed by NR and ER, the significantly lowest values were found in RF.
Table 1.
Physicochemical properties determined in different land uses.
| SOIL CHARACTERISTICS | LAND USE | ||||
| RF | ER | NR | LS | ||
| Physical | BD (g/cm3) | 1,01a ± 0,01 | 1,06a ± 0,01 | 0,95ab ± 0,08 | 0,90b ± 0,02 |
| HSM (%) | 13,49a ± 0,40 | 11,32a ± 0,56 | 10,52c ± 0,55 | 10,08b ± 0,49 | |
| SM (%) | 64,96b ±0,80 | 65,97a ± 0,61 | 62,83c ± 0,25 | 62,75c ±0,72 | |
| Sand (%) | 73,41a ± 2,52 | 72,00b ± 3,01 | 73,50a ± 2,52 | 73,46a ± 2,52 | |
| Silt (%) | 21,01c ± 1,51 | 23,39a ± 3,03 | 22,40b ± 2,52 | 21,04c ± 2,00 | |
| Clay (%) | 5,58a ± 1,15 | 4,61ba ± 0,50 | 4,10b ± 0,50 | 5,50a ± 1,01 | |
| Chemical | SOC(Mg ha−1) | 148,68a ±6,07 | 119,24b ±5,04 | 97,30cd±14,13 | 102,85c ±5,55 |
| SBR (μg C-CO2 g −1 d−1) | 124,31d ±2,41 | 179,28a ±4,34 | 148,91b ±2,31 | 135,25c ±8,58 | |
| pH | 4,93a ± 0,05 | 5,14a ± 0,05 | 4,98ª ± 0,21 | 5,13a ± 0,16 | |
| ECEC (meq100 g-1 s) | 3,73c ± 0,21 | 4,21b ± 0,21 | 4,38b ± 0,39 | 5,70a ± 0,50 | |
* BD: bulk density, HSM: hygroscopic soil moisture, SM: soil moisture, SOC: soil organic carbon, SBR: basal respiration soil, ECEC: effective cation exchange capacity. ** RF: riparian forest, ER: ecological restoration, NR: natural regeneration, LS livestock. Different letters between rows represent significant differences (p < 0.05) with the Tukey test for each variable.
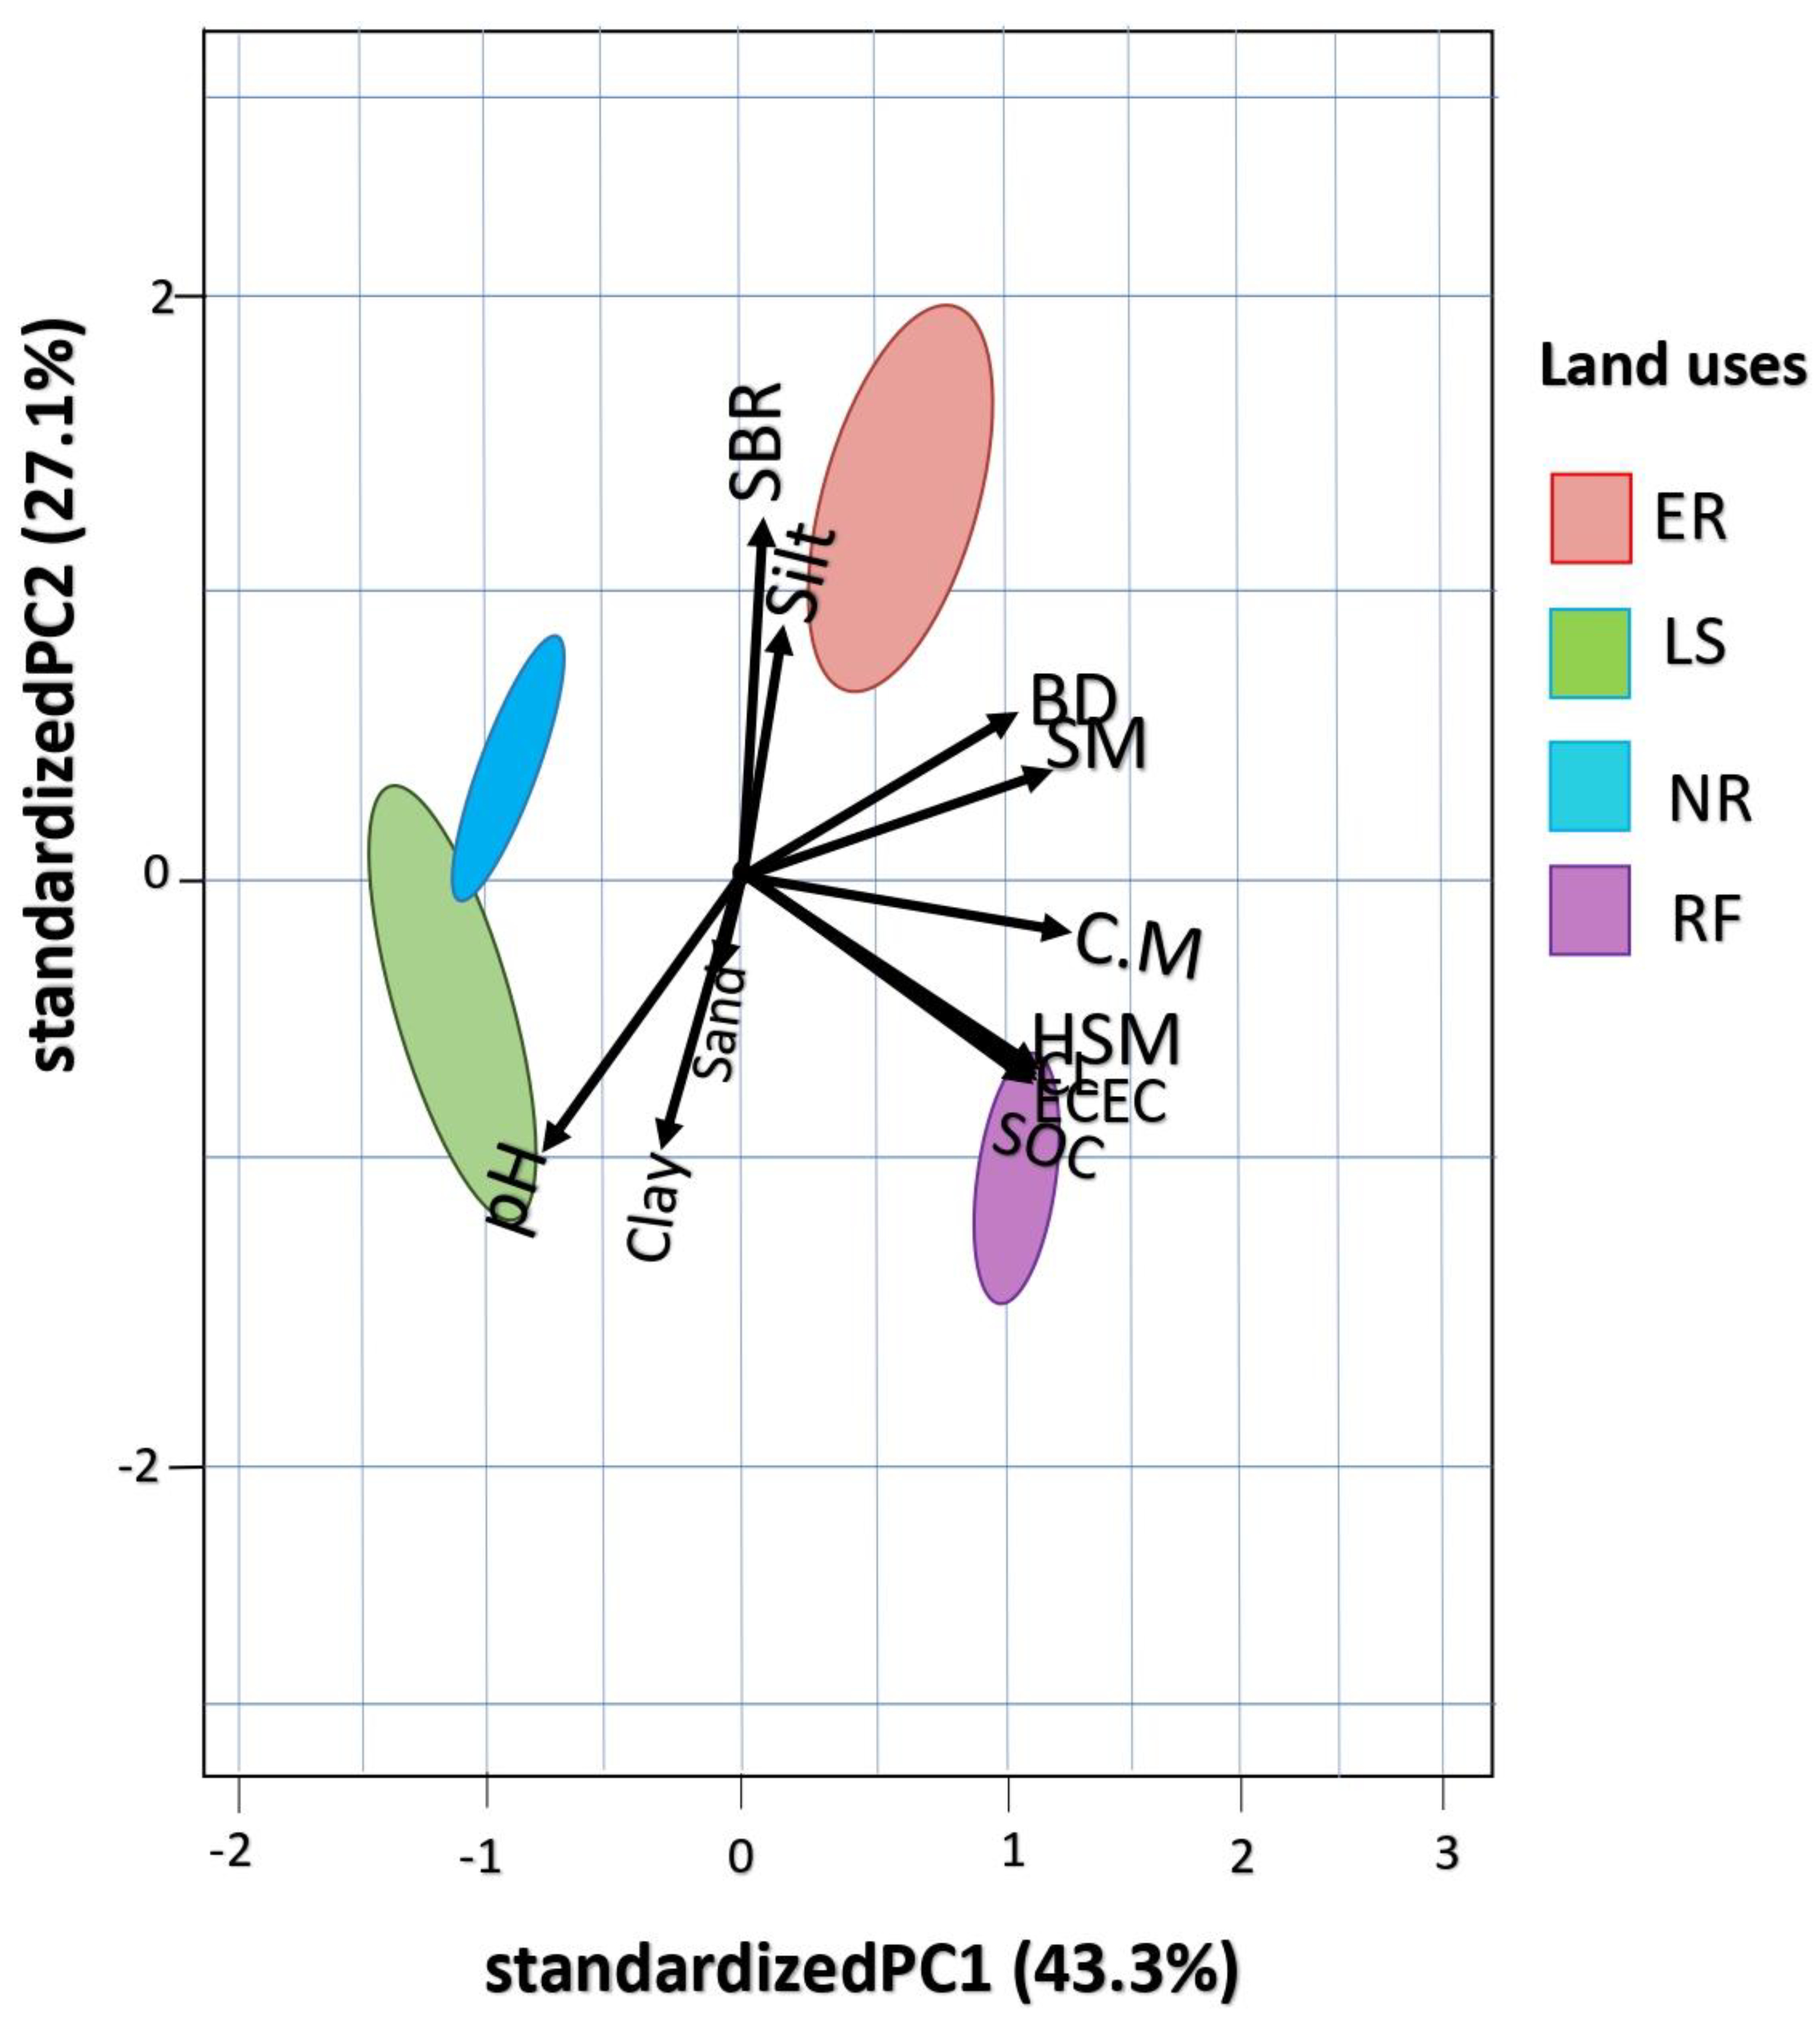
The PCA results showed that PC1 (43.3%): Mainly separates soils with higher SOC and BD content and lower proportion of sand (RF and LS) and PC2 (27.1%): Distinguishes more humid soils (SM, NR) from those with higher biological activity (SBR, ER); the particular associations with each type of land use are highlighted, highlighting the closer relationship of SOC with forest conservation uses such as RF. The ellipses suggest a clear differentiation between land uses, indicating that the systems have specific characteristics that group them according to their physical properties: particle sizes (sand, silt and clay) and apparent density, chemical properties: ECEC (meq100 g-1 s), pH and ecological properties: HSM: hygroscopic soil moisture, SM: soil moisture, SOC: soil organic carbon, SBR: (Figure 3).
Figure 3.
PCA: BD: bulk density, HSM: hygroscopic soil moisture, SM: soil moisture, SOC: soil organic carbon, SBR: basal respiration soil, ECEC: effective cation exchange capacity. ** RF: riparian forest, ER: ecological restoration, NR: natural regeneration, LS livestock. Different letters between rows represent significant differences (p < 0.05) with the Tukey test for each variable.
3.3. Multinomial Logistic Regression
The model obtained suggests that the soil types measured based on the variables evaluated are associated with the categories of importance for the conservation of the watershed's natural resources. The variables SOC, SBR, CL, and C_MU have a complex relationship with the conservation categories. SOC and C_MU have a negative relationship with the probability of being in the Low and Medium categories, while BD and SBR have clearer and more positive effects for Low and Medium. When Andean communities attach importance to natural resource conservation and reflect this in their land use, SOC storage increases. The low residual deviance (4.83e-06) and AIC (24) indicate a robust model fit (Table 3).
The relationship between SOC stocks and the perception of the importance of natural resource conservation, classified into three categories: Low, Medium, and High, varies depending on the soil organic carbon (SOC) content. It is observed that: The probability of belonging to the Low category is higher at intermediate SOC values, reaching a peak between 110 and 120 g/kg. The Medium category has a higher probability of lower SOC values, decreasing as SOC increases. In contrast, the probability of belonging to the High category increases considerably with higher SOC values, demonstrating its greater relevance in soils with higher levels of carbon storage (Figure 4).
4. Discussion
4.1. Carbon Stocks
Understanding the balance between carbon inputs and outputs in tropical Andean ecosystems and its storage in the soil is essential to mitigate the effects of global warming, food security, and other ecosystem services. Research such as that by[22] highlights that SOC reserves are potentially endangered by global warming and that land uses play a fundamental role in SOC content; however, there are limited data and studies available to be conclusive, and some contradictory results are reported. The results of this research show that the SOC stored in the soils of the study area is highest in RF 148.68 Mg/ha-1, followed by ER; while other uses such as NR and LS have lower values (Figure 2d), which may be related to the contributions of C inputs from litterfall, where the highest values are found in RF 4.65Mg ha−1month−1, followed by ER, NR and LS (Figure 2a). This pattern reinforces the idea that the most intervened ecosystems such as LS have lower accumulation of aboveground biomass compared to conserved or restored ecosystems. The C stored in the mulch had a similar behavior, which significantly decreases from RF to livestock use LS (Figure 2c), reflecting a reduction in the accumulation of organic material.
The functions of SOC are highlighted in several studies, which indicate that its concentration changes significantly between different land uses [23], specifically for tropical ecosystems they also show that riparian forests have a greater storage of SOC due to their constant inputs of organic matter and lower disturbances [24]. This balance in SOC stocks reflects a greater equilibrium of this type of use, which presented the significantly lower SBR values; while significantly higher values were presented in ER, followed by NR and LS (Figure 3), this may be related to greater microbial activity in these soils and a greater amount of easily degradable C, results that contradict those reported by [25] showing how ER can decrease SBR, however, these results can be partially explained by the high inputs of C from leaf litter and C from mulch in an ecosystem that is not yet in equilibrium and has greater inputs of light and humidity, which favors the decomposition of organic matter [26]. Considering that the system is not yet in equilibrium, these results show that conservation practices such as forest protection and active ER with community support are more effective in storing SOC, which may be related to a more developed forest structure in these land uses.
4.2. Soil Properties and SOC in Different Land Use
The PCA analysis highlights the importance of soil organic carbon (SOC) and soil basal respiration (SBR) as key indicators to differentiate land uses in tropical Andean ecosystems (Figure 4), the PCA shows a clear differentiation of soil properties based on different land uses RF, ER, NR and LS. The variance explained by the first two components was 70.4% of the total variability of the data, reflecting a consistent multivariate structure of the relationship between soil properties and their different uses, it is also evident that the variables BD and SOC are directly related, they tend to increase SOC contents when BD increases, which is consistent with what was reported by [27,28], who emphasize that making a good measurement of the apparent density and having knowledge of this variable helps to better understand the dynamics of SOC storage in different contexts. These results and those previously reported demonstrate how SOC storage regulates the physical properties of the soil, specifically BD. In addition, the separation of the groups in a two-dimensional space indicates that the evaluated land uses generate differentiated impacts on soil properties, which reinforces the importance of generating specific management strategies for each type of land use.
Regarding the physical properties studied BD, HSM, SM and the percentage of particle size (sand, silt and clay) (Table 2), land uses with significantly higher SOC content presented significantly higher HSM and SM percentages, which is related to better structural development of the soil because of stored organic matter. SOM, due to its amorphous characteristics, has, by itself, a high-water storage capacity [29], 1 g of SOC can retain up to 3.5 g of water at field capacity [30]. The percentages of sand, silt and clay are relatively consistent among land uses, although ER showed a higher silt content (23.39%), which could be related to the incorporation of fine sediments through agricultural practices [31]. Soils dedicated to RF conservation, despite having a high SOC, had a lower SBR (124.31 mg CO₂/h), likely due to soil acidity, which can limit microbial enzymatic activity [32]. These soils had a slightly acidic pH across all uses, ranging from 4.93 to 5.14. RF showed the most acidic pH (4.93), which is common in forest soils due to the accumulation of organic matter and natural leaching processes [33] LS presented the highest ECEC (5.70 meq/100 g), suggesting a greater capacity of the soil to retain nutrients, favoring plant growth during the restoration process [34], based on these results RF stands out as an important strategy for soil stability in Andean ecosystems in terms of food and water security and overall soil health, ER shows good potential to recover degraded soil properties, especially in terms of microbial activity (SBR), although it is crucial to monitor that it does not translate into excessive losses of organic carbon in the long term, NR regeneration represents an intermediate alternative with benefits for carbon sequestration, but less efficient than active restoration strategies and it is suggested that it is good to accompany the uses of LS with greater conservation of existing forest remnants in the territory for the health of its soils.
4.3. Regression Model
The regression model results suggest that community perception of conservation is closely related to soil biophysical variables. Higher BD appears to be associated with a lower perception of the importance of conservation. This could be related to these factors often indicating less productive or compacted soil conditions [35], which could negatively influence soil-dependent agricultural or economic activities. Conversely, an increase in soil basal respiration (SBR) is related to a higher average perception, possibly reflecting greater biological activity and healthier soil, which is valued by local communities, as active ER has benefits on soil microbiology [36,37]. This relates to the results of this study, which highlight ER as a positive strategy to improve soil microbiology and SOC storage, thereby contributing to the water security of the territory.
Conservation perceptions reveal how local communities interact with their environment and prioritize ecological sustainability. The inverse relationship between SOC content and low perceptions of the importance of resource conservation may reflect a connection between the ecological value of this land property and its appreciation by inhabitants, highlighting that conserving natural areas is important for various ecological functions, including improving SOC stocks. From the socio-ecological environment, spatially explicit relationships are identified between the supply and demand of regulating ecosystem services and carbon storage and sequestration [38]. Other research focuses on measuring the interactions between human interactions with their ecosystems, such as the establishment of home gardens, forest conservation, and the establishment of farms, and their effect on SOC sequestration [39]. However, the number of publications addressing SOC sequestration from a socio-ecological perspective is low [40]. The perception of the importance of conserving natural areas by communities and its relationship with SOC storage suggests a connection between the ecological value of this ecosystem service and its recognition by communities in the territories. However, research addressing SOC sequestration from a socio-ecological perspective is still scarce, which highlights the importance of continuing to address these issues from a complex perspective.
The results of the multinomial regression highlight the SBR and C_MU variables in the mean perception and underscore the need to implement practices that promote the well-being of soil biology and the maintenance of organic cover as central components of conservation policies in tropical Andean ecosystems. Therefore, awareness-raising and environmental education strategies need to be strengthened to emphasize the benefits of SOC in climate change mitigation and soil productivity. The results of this research highlight that the perception of natural resource conservation is associated with better soil mulch conservation practices, which influences soil properties: it regulates temperature, preserves its structure, reduces salinity problems, increases water content and reduces erosion [41,42], which in turn improves soil microbiology that is fundamental in nutrient cycling, greenhouse gas modulation and overall ecosystem health, offering new perspectives for the design of ecosystem restoration strategies that drive sustainable agriculture [43].
5. Conclusion
The connection between how communities perceive conservation and SOC storage highlights the need to incorporate socio-ecological approaches into land management. Communities with a higher value on conservation were found to have soils with higher carbon stocks, suggesting that environmental awareness and education may be critical to the sustainability of these ecosystems. Promoting sustainable management strategies, ecological restoration, and appropriate agroecological practices can not only benefit soil health and food security but also strengthen the region's climate resilience.
Acknowledgments
To the Trophic Ecology Laboratory of the Chetumal Technological Institute for their invaluable support during the doctoral internship carried out at their facilities, we thank their academic and technical team of the Doctorate in Environmental Sciences of the institution for granting us access to their spaces and for their willingness to share knowledge and experiences that contributed considerably to the development of this research, their collaboration was fundamental for the analysis of the data obtained and the strengthening of research capacities.
References
- E. H. Boakes, C. Dalin, A. Etard, and T. Newbold, “Impacts of the global food system on terrestrial biodiversity from land use and climate change,” Nat. Commun., vol. 15, no. 1, 2024. [CrossRef]
- C. C. Ivanovich, T. Sun, D. R. Gordon, and I. B. Ocko, “Future warming from global food consumption,” Nat. Clim. Chang., vol. 13, no. 3, pp. 297–302, 2023. [CrossRef]
- K. Aguilar, “Universidad de Murcia,” All rights Reserv. IJES, vol. 281, no. 4, pp. 1–30, 2020, [Online]. Available: https://digitum.um.es/digitum/bitstream/10201/93201/1/Karen Lissette Aguilar Duarte Tesis Doctoral.pdf.
- B. Harper et al., “Land-use emissions play a critical role in land-based mitigation for Paris climate targets,” Nat. Commun., vol. 9, no. 1, 2018. [CrossRef]
- E. P. Anderson et al., “Consecuencias del Cambio Climático en los Ecosistemas y Servicios Ecosistémicos de los Andes Tropicales,” 2012.
- J. Sylvester et al., “A rapid approach for informing the prioritization of degraded agricultural lands for ecological recovery: A case study for Colombia,” J. Nat. Conserv., vol. 58, no. November 2019, p. 125921, 2020. [CrossRef]
- L. Berrio-Giraldo, C. Villegas-Palacio, and S. Arango-Aramburo, “Understating complex interactions in socio-ecological systems using system dynamics: A case in the tropical Andes,” J. Environ. Manage., vol. 291, no. April, p. 112675, 2021. [CrossRef]
- Z. Tan and R. Lal, “Carbon sequestration potential estimates with changes in land use and tillage practice in Ohio, USA,” Agric. Ecosyst. Environ., vol. 111, no. 1–4, pp. 140–152, 2005. [CrossRef]
- M. Krauss et al., “Reduced tillage in organic farming affects soil organic carbon stocks in temperate Europe,” Soil Tillage Res., vol. 216, 2022. [CrossRef]
- R. Lal, “Soil carbon sequestration impacts on global climate change and food security,” Science (80-. )., vol. 304, no. 5677, pp. 1623–1627, 2004. [CrossRef]
- Lefévre, F. Rekik, A. V, and L. Wiese, Carbono Orgánico del Suelo. 2017. [Online]. Available: www.fao.org/publications.
- Barman, P. Saha, S. Patel, and A. Bera, “Crop Diversification an Effective Strategy for Sustainable Agriculture Development,” 2022, Accessed: May 15, 2023. [Online]. Available: https://books.google.com/books?hl=es&lr=&id=HV17EAAAQBAJ&oi=fnd&pg=PA89&dq=Crop+Diversification+an+Effective+Strategy+for+Sustainable+Agriculture+Development&ots=LUJOOM6X8M&sig=QDhC8DWiYjfRh5RpKFpuCEZerFQ.
- M. C. Ordoñez, L. Galicia, A. Figueroa, I. Bravo, and M. Peña, “Effects of peasant and indigenous soil management practices on the biogeochemical properties and carbon storage services of Andean soils of Colombia,” Eur. J. Soil Biol., vol. 71, pp. 28–36, 2015. [CrossRef]
- P. M. Kopittke et al., “Ensuring planetary survival: the centrality of organic carbon in balancing the multifunctional nature of soils,” Crit. Rev. Environ. Sci. Technol., vol. 52, no. 23, pp. 4308–4324, 2022. [CrossRef]
- M. C. Ordóñez Díaz, I. Bravo Realpe, and A. Figueroa Casas, “Flujo de Carbono Orgánico Total (COT) en una cuenca andina: caso subcuenca Río Las Piedras,” Rev. Ing. Univ. Medellín, vol. 13, no. 24, pp. 29–42, 2014. [CrossRef]
- Celentano et al., “Restauración ecológica de bosques tropicales en Costa Rica: Efecto de varios modelos en la producción, acumulación y descomposición de hojarasca,” Rev. Biol. Trop., vol. 59, no. 3, pp. 1323–1336, 2011. [CrossRef]
- F. Moreno, S. F. Oberbauer, and W. Lara, “Soil Organic Carbon Sequestration Under Different Tropical Cover Types in Colombia,” pp. 367–383, 2017. [CrossRef]
- J. C. Montoya Salazar, J. C. Menjivar Flores, and I. D. S. Bravo Realpe, “Fraccionamiento y cuantificación de la materia orgánica en andisoles bajo diferentes sistemas de producción,” Acta Agron., vol. 62, no. 4, pp. 333–343, 2013.
- G. R. Blake and K. H. Hartge, “Bulk Density,” Methods Soil Anal. Part 1 Phys. Mineral. Methods, pp. 363–375, Sep. 2018. [CrossRef]
- K. Prakash, A. Sridharan, and S. Sudheendra, “Hygroscopic moisture content: Determination and correlations,” Environ. Geotech., vol. 3, no. 5, pp. 293–301, 2016. [CrossRef]
- L. C. Caicedo-Rosero, F. de J. Méndez-Ávila, E. Gutiérrez-Zeferino, and J. de J. A. Flores-Cuautle, “Medición de humedad en suelos, revisión de métodos y características,” Pädi Boletín Científico Ciencias Básicas e Ing. del ICBI, vol. 9, no. 17, pp. 1–8, 2021. [CrossRef]
- G. Alavi-Murillo, J. Diels, J. Gilles, and P. Willems, “Soil organic carbon in Andean high-mountain ecosystems: importance, challenges, and opportunities for carbon sequestration,” Reg. Environ. Chang., vol. 22, no. 4, 2022. [CrossRef]
- Beillouin et al., “A global overview of studies about land management, land-use change, and climate change effects on soil organic carbon,” Glob. Chang. Biol., vol. 28, no. 4, pp. 1690–1702, 2022. [CrossRef]
- Don, J. Schumacher, and A. Freibauer, “Impact of tropical land-use change on soil organic carbon stocks - a meta-analysis,” Glob. Chang. Biol., vol. 17, no. 4, pp. 1658–1670, 2011. [CrossRef]
- Y. Wei, L. F. Yu, J. C. Zhang, Y. C. Yu, and D. L. Deangelis, “Relationship Between Vegetation Restoration and Soil Microbial Characteristics in Degraded Karst Regions: A Case Study,” Pedosphere, vol. 21, no. 1, pp. 132–138, 2011. [CrossRef]
- M. Giweta, “Role of litter production and its decomposition, and factors affecting the processes in a tropical forest ecosystem: A review,” J. Ecol. Environ., vol. 44, no. 1, pp. 1–9, 2020. [CrossRef]
- L. Xu, N. He, and G. Yu, “Methods of evaluating soil bulk density: Impact on estimating large scale soil organic carbon storage,” Catena, vol. 144, pp. 94–101, 2016. [CrossRef]
- K. Heckman et al., “Beyond bulk: Density fractions explain heterogeneity in global soil carbon abundance and persistence,” Glob. Chang. Biol., vol. 28, no. 3, pp. 1178–1196, 2022. [CrossRef]
- R. Lal, “Soil organic matter and water retention,” Agron. J., vol. 112, no. 5, pp. 3265–3277, Sep. 2020. [CrossRef]
- V. A. M. Valencia, F. M. Hurtado, and D. F. J. Jaramillo, “Impact of land use on organic carbon sequestration in a natural area of Medellín, Colombia,” Acta Agron., vol. 71, no. 1, pp. 39–46, 2022. [CrossRef]
- K. Fujisaki, L. Chapuis-Lardy, A. Albrecht, T. Razafimbelo, J. L. Chotte, and T. Chevallier, “Data synthesis of carbon distribution in particle size fractions of tropical soils: Implications for soil carbon storage potential in croplands,” Geoderma, vol. 313, no. November 2017, pp. 41–51, 2018. [CrossRef]
- K. Bogati and M. Walczak, “The Impact of Drought Stress on Soil Microbial Community, Enzyme Activities and Plants,” Agronomy, vol. 12, no. 1, pp. 1–26, 2022. [CrossRef]
- H. Quinto-Mosquer, G. Ayala-Viva, and H. Gutiérrez, “Nutrient content, acidity, and soil texture in areas degraded by mining in the biogeographic Chocó,” Rev. la Acad. Colomb. Ciencias Exactas, Fis. y Nat., vol. 46, no. 179, pp. 514–528, 2022. [CrossRef]
- S. S. Khalajabadi, R. Darío, and Z. Hernández, “Propiedades Relacionadas Con La Adsorción De Cationes Intercambiables En Algunos Suelos De La Zona Cafetera De Colombia 1,” Cenicafé, vol. 63, no. 2, pp. 79–89, 2012.
- Håkansson and J. Lipiec, “A review of the usefulness of relative bulk density values in studies of soil structure and compaction,” Soil Tillage Res., vol. 53, no. 2, pp. 71–85, 2000. [CrossRef]
- C. Wang et al., “Ecological restoration treatments enhanced plant and soil microbial diversity in the degraded alpine steppe in Northern Tibet,” L. Degrad. Dev., vol. 32, no. 2, pp. 723–737, 2021. [CrossRef]
- Z. X. Lu et al., “Effects of different vegetation restoration on soil nutrients, enzyme activities, and microbial communities in degraded karst landscapes in southwest China,” For. Ecol. Manage., vol. 508, no. January, p. 120002, 2022. [CrossRef]
- M. Sahle, O. Saito, C. Fürst, and K. Yeshitela, “Quantification and mapping of the supply of and demand for carbon storage and sequestration service in woody biomass and soil to mitigate climate change in the socio-ecological environment,” Sci. Total Environ., vol. 624, pp. 342–354, 2018. [CrossRef]
- G. Demie, M. Negash, Z. Asrat, and L. Bohdan, “Carbon stocks vary in reference to the models used, socioecological factors and agroforestry practices in Central Ethiopia,” Agrofor. Syst., vol. 98, no. 6, pp. 1905–1925, 2024. [CrossRef]
- M. N. Amin, M. S. Hossain, L. Lobry de Bruyn, and B. Wilson, “A systematic review of soil carbon management in Australia and the need for a social-ecological systems framework,” Sci. Total Environ., vol. 719, p. 135182, 2020. [CrossRef]
- H. S. El-Beltagi et al., “Mulching as a Sustainable Water and Soil Saving Practice in Agriculture: A Review,” Agronomy, vol. 12, no. 8, pp. 1–31, 2022. [CrossRef]
- S. S. Walia, K. Kaur, and T. Kaur, “Techniques and Practices of Soil Moisture Conservation (Use of Mulches, Kinds, Effectiveness, and Economics),” Rainfed Agric. Watershed Manag., pp. 49–56, 2024. [CrossRef]
- M. Jagadesh et al., “Revealing the hidden world of soil microbes: Metagenomic insights into plant, bacteria, and fungi interactions for sustainable agriculture and ecosystem restoration,” Microbiol. Res., vol. 285, no. May, p. 127764, 2024. [CrossRef]
Figure 4.
Perception of the importance of the conservation of natural resources vs SOC stocks.
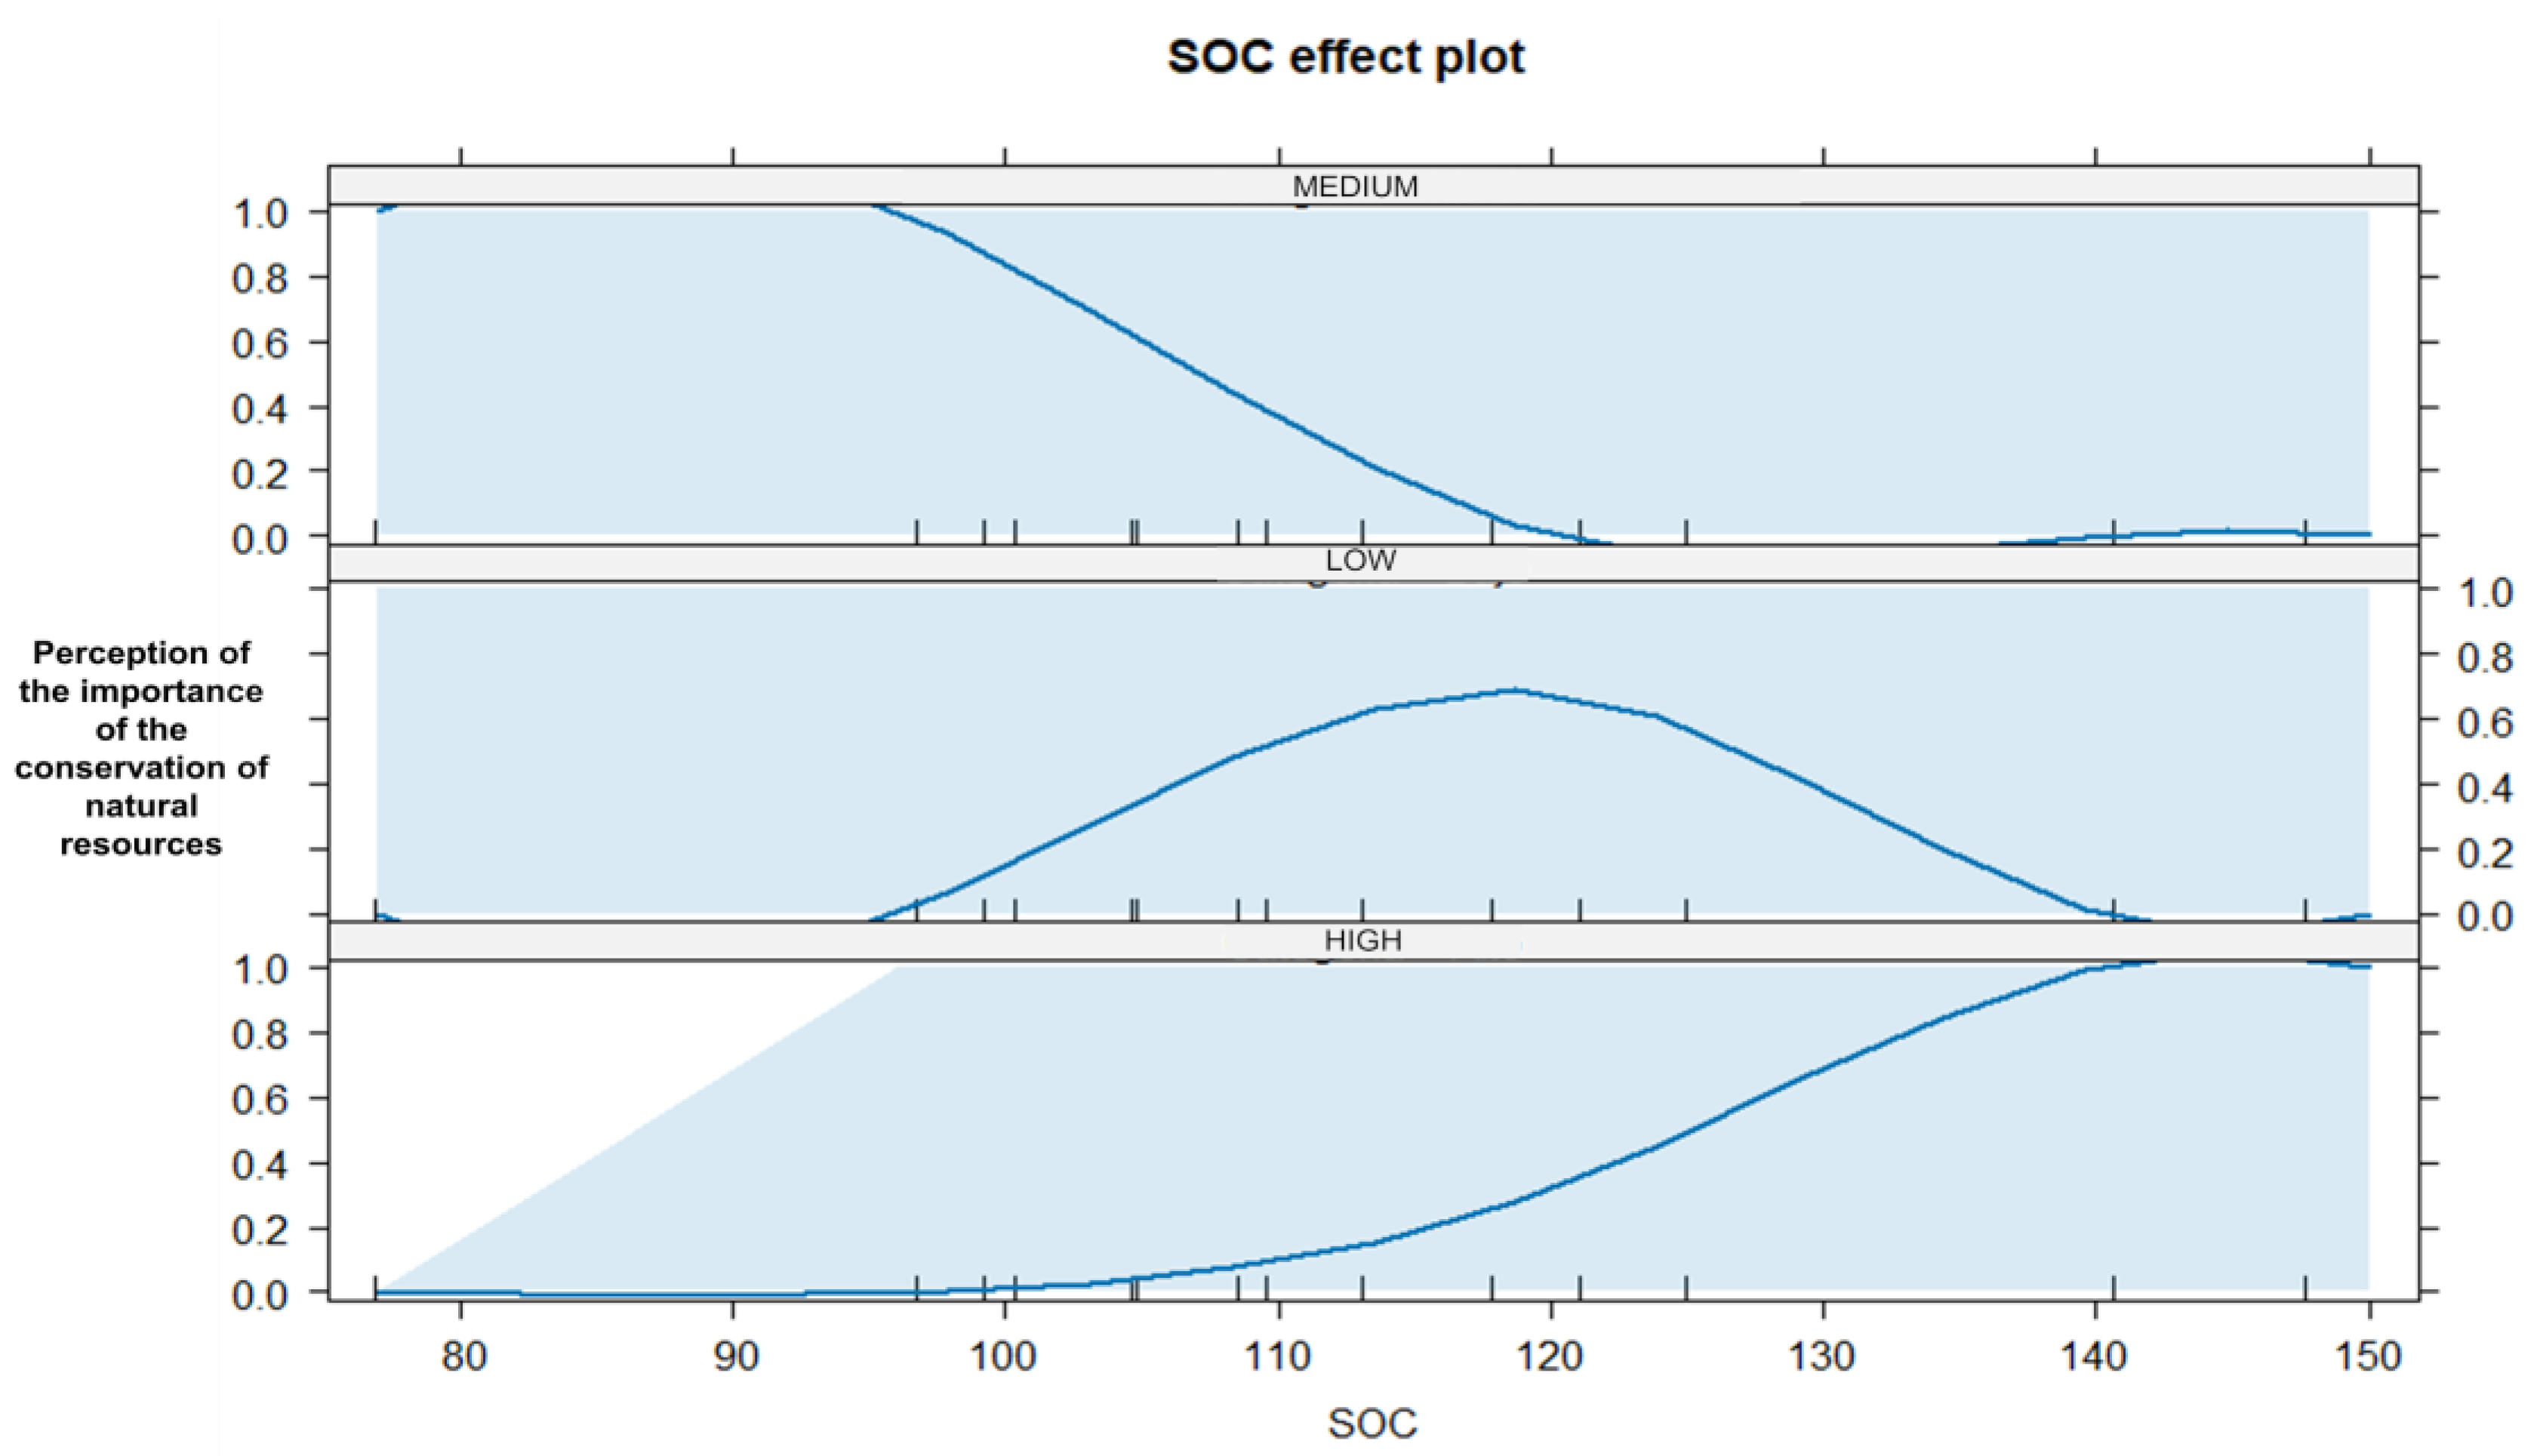
Table 3.
Multinomial logistic regression between the importance of community conservation (high, medium, low) and soil properties that regulate SOC storage.
Table 3.
Multinomial logistic regression between the importance of community conservation (high, medium, low) and soil properties that regulate SOC storage.
| Coefficients: | Intercept | BD | SOC | SBR | CL | C_MU |
| Bajo | 32.16 | 18.38 | -0.49 | 0.81 | 24.14 | -34.16 |
| Medio | -32.05 | -18.61 | -1.23 | 0.93 | -19.93 | 20.52 |
| Std. Errors: | Intercept | BD | SOC | SBR | CL | C_MU |
| Bajo | 331.36 | 311.13 | 6292.85 | 7496.41 | 1131.01 | 548.08 |
| Medio | 299.04 | 245.43 | 6265.70 | 7576.90 | 1017.60 | 1731.31 |
| Residual Deviance: 4.84e-06 | ||||||
| AIC: 24 |
Disclaimer/Publisher’s Note: The statements, opinions and data contained in all publications are solely those of the individual author(s) and contributor(s) and not of MDPI and/or the editor(s). MDPI and/or the editor(s) disclaim responsibility for any injury to people or property resulting from any ideas, methods, instructions or products referred to in the content. |
© 2025 by the authors. Licensee MDPI, Basel, Switzerland. This article is an open access article distributed under the terms and conditions of the Creative Commons Attribution (CC BY) license (http://creativecommons.org/licenses/by/4.0/).
Copyright: This open access article is published under a Creative Commons CC BY 4.0 license, which permit the free download, distribution, and reuse, provided that the author and preprint are cited in any reuse.


