
Submitted:
09 October 2025
Posted:
10 October 2025
You are already at the latest version
Abstract
Soil organic carbon (SOC) plays a crucial role in climate change mitigation by regulating atmospheric CO2 and maintaining ecosystem balance; however, its stability is influenced by land use in anthropized areas such as the tropical Andes. This study aimed to develop a dynamic compartmental model based on ordinary differential equations to simulate carbon fluxes among litter, humus, and microbial biomass under four different land uses in the Las Piedras River basin (Popayán, Colombia): riparian forest (RF), ecological restoration (ER), natural regeneration (NR), and livestock (LS). The model was calibrated using field data on soil physicochemical and biological properties, as well as carbon inputs and outputs. The results showed clear differences in SOC dynamics between land uses: RF exhibited the highest SOC stocks (148.7 Mg ha⁻¹) and microbial biomass, while LS showed the lowest values and the largest deviation from the model due to compaction and low residue input. The humus fraction remained the most stable pool (K₂ ≈ 10⁻⁴ month⁻¹), confirming its recalcitrant nature. Overall, the model accurately reproduced SOC behavior (MAE = 0.01–0.30 Mg ha⁻¹) and provides a useful framework for understanding carbon stabilization mechanisms and guiding adaptive soil management to enhance carbon sequestration in mountain ecosystems.
Keywords:
carbon fluxes
; compartmental dynamics
; microbial activity
; organic matter decomposition
; soil management
1. Introduction
Carbon sequestration refers to the capture of atmospheric C and its storage in the soil [1]. Soils have considerable potential to store C, but many are also undergoing continuous losses [2]. Soil organic carbon (SOC) is one of the largest terrestrial carbon reservoirs, resulting from organic matter inputs from plants and organisms as well as the decomposition of soil organic matter; therefore, SOC plays a crucial role in regulating the global climate, soil fertility, and ecosystem functioning [3]. However, in high-mountain tropical ecosystems such as those found in the Colombian Andes, the capacity to store SOC is strongly influenced by factors such as soil and climate conditions, vegetation type, and land use practices [4].
The conversion of natural forests to agricultural or grazing lands in tropical Andean ecosystems has resulted in a dramatic reduction in SOC, negatively affecting soil structure, fertility, and resilience [5]. The loss of natural cover due to land-use change has raised concerns about the depletion of SOC stocks through soil organic matter (SOM) mineralization and surface runoff caused by extensive grazing and intensive agriculture [6]. The removal of natural vegetation and the modification of organic inputs have a direct impact on soil structure, fertility, and biogeochemical dynamics. It has been estimated that such transformations can reduce SOC by more than 50% in the top 30 cm of the soil profile after decades of agricultural use [7]. Measuring SOC in the upper 30 cm is recommended for national inventories, given that SOC at greater depths tends to be stable or recalcitrant, with long residence times and low decomposition rates. By contrast, SOC storage in the topsoil is more dynamic due to microbial activity and continuous inputs and outputs of SOM [8].
In the context of climate change and agricultural frontier expansion, modeling SOC storage dynamics is necessary to understand processes and to project responses under different scenarios of climate change or anthropogenic disturbances [9]. Understanding decomposition, mineralization, and humification processes, as well as quantifying the magnitude and rate of carbon fluxes among soil compartments, is essential for explaining SOC storage dynamics [10]. In this sense, models have proven to be a valuable tool to assess the effects of physicochemical and biological factors on SOC under different land-use changes and management practices[11]. Some models manage to simulate key interactions and feedback mechanisms, providing insights into how soil carbon responds to both natural and anthropogenic disturbances [12].
This study aims to develop a compartmental model based on ordinary differential equations that describes the flow of carbon among litter, humus, and microbial biomass [13], under different land-use systems in tropical Andean ecosystems. Four representative land covers were evaluated: riparian forest (RF), ecological restoration (ER), natural regeneration (NR), and livestock systems (LS). Using key edaphic variables, input data (e.g., litter carbon and monthly litterfall incorporation), and output data (e.g., basal soil respiration), the proposed model provides a tool for advancing sustainable carbon management in mountain landscapes undergoing anthropogenic transformations.
2. Materials and Methods
2.1. Study Area
The research was carried out in the Las Piedras River watershed, Cauca, Colombia (2°21′35″ N, 76°33′10″ W), which covers 66.26 km² and is characterized by undulating terrain with slopes of 16–50%. Soils are Andisols derived from volcanic ash, with sandy loam texture (~10% clay), acidic pH (4.6–5.0), high Al saturation, and low Ca, Mg, and P contents. The climate corresponds to equatorial montane conditions, with sub-Andean and Andean bioclimatic zones, mean annual temperatures of 10.4–18.4 °C, and average precipitation of 136 mm/month. Rainfall is seasonal, with a wet period from October to May (183 mm/month) and a dry period from June to September (42 mm/month).
Four representative land covers were selected: riparian forest (RF), ecological restoration (ER), natural regeneration (NR), and livestock systems (LS), reflecting different levels of anthropogenic intervention and their relevance for soil organic carbon storage in mountain ecosystems. (Figure 1)
2.2. Soil Physical, Chemical, and Biological Properties
Bulk density (BD) was determined from undisturbed soil cores (64.45 cm³) collected at the target depth, oven-dried at 105 °C for 24 h, and expressed as the ratio of oven-dry mass to core volume (g cm⁻³) (Blake & Hartge, 1986). Soil texture was analyzed by the hydrometer method with readings at 40 s (sand) and 2 h (clay) (Gee & Bauder, 1986). Soil pH was measured potentiometrically in a 1:1 soil–water suspension after 1 h of intermittent stirring.
Effective cation exchange capacity (ECEC) was determined by extracting 2 g of soil (<2 mm) with 20 mL of 1 N ammonium acetate (overnight), and Ca, Mg, Al, and K concentrations were quantified by atomic absorption spectrophotometry (Montoya et al., 2013). Microbial biomass carbon (Cmic) was estimated by the fumigation–extraction method using chloroform (without ethanol) on fumigated and non-fumigated samples; microbial C was extracted after 3 days. Microbial activity was assessed by short-term respirometry (C–CO₂): soils were incubated for 5 days in closed systems, CO₂ was trapped in 1 N NaOH, precipitated with BaCl₂, and titrated with 0.5 N HCl. The metabolic quotient (qCO₂) was calculated as an indicator of substrate-use efficiency.
Soil organic carbon (SOC) inputs were estimated from (i) litterfall, collected biweekly for one year using 12 traps (0.25 m²), dried at 65 °C (24–48 h), and weighed (Celentano et al., 2011), and (ii) forest floor litter, sampled with 0.25 m² PVC frames, dried under the same conditions, and converted to carbon assuming 48% of dry mass. Total soil C and N contents were determined with an NC 1500 Carlo Erba elemental analyzer (Moreno et al., 2017).
SOC stocks (Mg ha⁻¹) were calculated (Eq. 1) from organic carbon content (C_org), bulk density (BD), and sampling depth (P = 0.30 m):
where: SOC: organic carbon stored in the soil (Mg ha-1), A: area (1 ha = 10,000 m2), Corg: grams of organic carbon in soil (Mg C/100 Mg), BD: bulk density of the soil (g/cm3), and D: depth of the soil layer. Since the content was estimated for the first 30 cm of soil depth, D=0.3 m.
2.3. Model Design
A dynamic compartmental model was developed to represent carbon fluxes among three main compartments: litter (L), humus (H), and microbial biomass (MB). The model describes carbon transfers between these compartments and carbon losses to the atmosphere as CO₂, using a system of ordinary differential equations (ODEs):
where:
Quant = external carbon inputs (litterfall Cᴸ and forest floor litter Cᴹᵁ);
Mineralization (K₁) = flux of litter to CO₂, conditioned by the C/N ratio and soil basal respiration (SBR);
Humification (Fₕ) = fraction of litter transformed into humus;
Assimilation (Fᵣ) = fraction of litter carbon assimilated by microbial biomass;
Assimilation₂ = fraction of humus assimilated by microbial biomass;
Decay (Kd) = microbial mortality returning to the litter pool;
Min₂ (K₂) = secondary mineralization of humus;
Runoff = surface carbon losses.
The transfer rates (K₁, K₂, Fₕ, Fᵣ, and Kd) were calibrated independently for each land cover—riparian forest (RF), ecological restoration (ER), natural regeneration (NR), and livestock systems (LS)—by minimizing the root mean square error (RMSE) between observed and simulated SOC values (L + H + MB), using the optim() function in R. Model validation was conducted by comparing observed and simulated values of SOC, MB, and respiration equivalent (eqC). Model performance was evaluated through mean absolute error (MAE), RMSE, and the coefficient of determination (R²).
The structure of the compartmental model, including the carbon pools and fluxes among litter, humus, microbial biomass, and losses to the atmosphere (Figure 2).
3. Results
3.1. Soil Properties
Soil properties varied notably across the four land-use types. ECEC values ranged from 3.73 meq 100 g⁻¹ in RF to 5.7 meq 100 g⁻¹ in LS, while pH was lowest in ER (4.6) and highest in LS (5.12). Carbon and nitrogen contents were greatest in RF (C = 4.97%, N = 1.18%) and lowest in NR (C = 3.41%, N = 0.87%), resulting in C/N ratios that peaked in ER (4.75) and declined in LS (3.70). SOC stocks showed a clear gradient, being highest in RF (148.68 Mg ha⁻¹) and lowest in NR (97.3 Mg ha⁻¹), with intermediate values in ER (119.24 Mg ha⁻¹) and LS (102.85 Mg ha⁻¹). Carbon inputs through litterfall (CL) and forest floor material (CMU) were substantially greater in RF (4.65 and 8.1 Mg ha⁻¹, respectively) compared with LS (1.08 and 2.37 Mg ha⁻¹). Bulk density was lowest in LS (0.90 g cm⁻³) and highest in ER (1.06 g cm⁻³). Soil texture was dominated by sand in all land uses (72–74%), with silt ranging from 21% in LS to 23.5% in ER, and clay remaining low (4–5.5%). Hydric soil moisture (HSM) reached its maximum in RF (13.49%) and its minimum in LS (10.08%), while gravimetric soil moisture (SM) was also highest in RF (64.96%) and lowest in LS (62.75%). Microbial biomass carbon (MicC) was markedly higher in ER and RF (199.19 and 198.18 μg C g⁻¹, respectively) than in LS (108.18 μg C g⁻¹). Finally, microbial respiration (SMicR CO₂) was greatest in ER (145.94 kg ha⁻¹ month⁻¹) and lowest in RF (108.01 kg ha⁻¹ month⁻¹), reflecting differences in microbial activity across land uses (Table 1).
3.2. Calibration of Model Parameters
The calibrated parameters of the SOC compartmental model varied across land-use types. The litter decomposition rate (K1) was highest in RF (0.308 month⁻¹), followed by ER (0.190 month⁻¹) and NR (0.154 month⁻¹), while LS exhibited the lowest value (0.001 month⁻¹), reflecting strongly reduced litter inputs and decomposition in pasture soils. The humus decomposition rate (K2) remained consistently low in all land uses (8 × 10⁻⁵–1 × 10⁻⁴ month⁻¹), in line with the high stability of this carbon pool. The fraction of carbon allocated to humification (Fh) stabilized at 0.20 in RF, ER, and NR, with slightly higher values in LS (0.249). In contrast, the fraction directed to microbial assimilation and mineralization (Fr) reached the upper boundary in ER (0.80), RF (0.80), and NR (0.787), but was lowest in LS (0.20), indicating that forest and regenerating systems favored mineralization, whereas pastures favored stabilization. The microbial biomass decay rate (Kd) showed substantial variation, with the highest values in ER (0.632 month⁻¹) and NR (0.555 month⁻¹), moderate in RF (0.139 month⁻¹), and the lowest in LS (0.010 month⁻¹), reflecting limited microbial dynamics in pasture soils (Table 2).
3.2. Calibration and Validation of the SOC Model Under Different Land Uses
The calibration and validation of the SOC model showed consistent performance across land uses. Observed and modeled SOC values were closely aligned, with mean absolute errors (MAE) ranging from 0.01 Mg ha⁻¹ in ER to 0.30 Mg ha⁻¹ in NR, indicating a strong predictive capacity of the model for SOC. For microbial biomass carbon (MB), greater variability was detected, with MAE values between 0.31 Mg ha⁻¹ in NR and LS and 1.34 Mg ha⁻¹ in ER, reflecting the high sensitivity of microbial biomass to organic matter inputs and environmental conditions. Respiration equivalent carbon (eqC) was well reproduced by the model, with deviations below 0.1 Mg ha⁻¹ in RF, ER, and NR, while LS showed a higher error (0.67 Mg ha⁻¹), likely associated with reduced litter inputs and soil disturbances. The simulated carbon pools followed expected patterns: RF showed the highest accumulation of stabilized carbon in the humus pool (107.01 Mg ha⁻¹) and the largest litter pool (30.94 Mg ha⁻¹), followed by ER and NR, whereas LS presented the lowest humus (66.99 Mg ha⁻¹) and litter (21.61 Mg ha⁻¹) values, consistent with lower organic matter inputs and higher mineralization. These results confirm the ability of the compartmental model to represent SOC dynamics and its distribution among active (MB), labile (litter), and stabilized (humus) fractions under different Andean land uses (Table 3).
3.3. Model Performance: Observed vs. Modeled SOC
The comparison between observed and modeled soil organic carbon (SOC) under different land uses (ER, LS, NR, and RF) (Figure 3). The 1:1 dashed line indicates the ideal fit, while the plotted points highlight deviations across systems. The largest discrepancy occurred in LS, with an AE of 14.3 Mg ha⁻¹ and an RE of 13.2%, indicating a tendency of the model to underestimate SOC in grazing systems. In contrast, RF showed the smallest deviation (AE = 6.3 Mg ha⁻¹; RE = 4.3%), suggesting a robust fit under forest conditions. Intermediate errors were observed in ER (AE = 11.2 Mg ha⁻¹; RE = 9.2%) and NR (AE = 5.3 Mg ha⁻¹; RE = 5.6%). Overall, these results demonstrate that the model reliably captured SOC dynamics across land uses, although performance varied depending on vegetation cover and management (Figure X).
4. Discussion
4.1. Dinámica del Carbono del Suelo Según el Uso del Suelo
The model showed that the main changes in soil C dynamics among the analyzed covers are reflected in litter stocks and microbial biomass. In riparian forests (RF), higher litter inputs and higher humidity favored high stocks of SOC (148.7 Mg ha⁻¹), MicC (198.2 μg C g⁻¹), and microbial respiration (108.0 kg ha⁻¹ month⁻¹), confirming that the continuous availability of organic matter stimulates both C accumulation and mineralization (Table 1). This can be explained because both the quantity and quality of organic waste influence the dynamics of SOC and microbial biomass, and moderate additions of good-quality waste promote carbon stabilization and prevent losses due to excessive respiration [14,15]. Conserved high-Andean ecosystems, such as native forests, contain the highest SOC levels, as acidity and humidity limit microbial mineralization. Furthermore, microbial biomass responds directly to residue quality and the C:N ratio, which explains the strong relationship between residue availability, SOC, and microbial activity in mountain Andisols [16]. Overall, these findings highlight that conserving vegetation cover and consistently supplying quality residues are essential for maintaining high levels of SOC and microbial biomass in mountain Andisols. In contrast, the livestock systems (LS) showed the lowest soil organic carbon reserves (102.9 Mg ha⁻¹), microbial carbon (108.2 μg C g⁻¹), and respiratory activity (112.7 kg ha⁻¹ month⁻¹). This is because ecosystems subjected to anthropogenic disturbances, such as LS, experience greater losses of organic carbon and lower carbon stability, highlighting the vulnerability of soils to intensive human use [17].
To understand these changes in soil organic carbon (SOC) stocks associated with different land uses, we must consider that microbial biomass is the driving force of the carbon cycle in soils, as it determines the fate of organic residues: whether they are lost as CO₂ or stabilized as SOC. Furthermore, research confirms that conservation practices and high inputs of organic matter promote both SOC and microbial biomass, while intensive agricultural practices reduce them [18], in line with this regulatory role of microbial biomass on carbon dynamics, parameter calibration confirms these trends, showing that the riparian forest (RF) site had the highest litter decomposition rate (K₁ = 0.308 month⁻¹) and a high mineralization fraction (Fr = 0.80), indicating a predominance of microbial activity and respiration (Table 2). Conversely, the lowland savanna (LS) site had the lowest decomposition rate (K₁ = 0.001 month⁻¹) and the lowest microbial decay rate (Kd = 0.01 month⁻¹), suggesting restricted biological activity and a tendency towards relative stabilization of carbon in humus. These results agree with [13], who reported low values of K₁ and Fr in cultivated pastures, attributable to the low quality of the organic matter and soil compaction.
The stability of the humus fraction, with very low decomposition rates (K₂ ≈ 10⁻⁴ month⁻¹), was common to all uses (Table 2), confirming that humus constitutes the most stable and recalcitrant compartment of soil carbon. Its slow decomposition implies long residence times, making it a key component for long-term carbon storage [19,10]. In contrast to this fraction, the more labile compartments showed greater sensitivity to changes in soil cover: litter decomposition (K₁) was highest in RF and ER, intermediate in NR, and almost zero in LS, while microbial biomass (Kd) recorded high turnover rates in ER and NR compared to minimum values in LS. These results show that, although land use practices —(LS), (ER), (NR) or (RF)— significantly modify the dynamics of active carbon flows, humus remains the least sensitive compartment, consolidating its role as a stable and long-permanent reservoir in tropical Andean ecosystems; This finding coincides with that reported by [20], who observed that in tropical Andean ecosystems carbon is more stable and is protected within organo-mineral aggregates and complexes such as the most stable humic fractions, which restricts its mineralization and explains its persistence in the face of changes in land use.
In contrast to humus stability, microbial biomass showed greater variability in both its magnitude and prediction. The greater deviation in MicC (MAE of up to 1.34 Mg ha⁻¹ in ER) contrasts with the greater stability observed in SOC and respiration (Table 3). This is consistent with [13] and[21], who highlight the high sensitivity of microbial biomass to environmental factors such as precipitation seasonality, residue quality, and land use intensity. According to [21], in tropical soils, these conditions, combined with anthropogenic pressures, generate accelerated SOM mineralization dynamics, which explains the greater instability of the microbial compartment in the face of the resilience of more recalcitrant carbon. This sensitivity justifies why ER, despite presenting high values of MicC (199.2 μg C g⁻¹) and respiration (145.9 kg ha⁻¹ month⁻¹), simultaneously exhibits a high rate of microbial decay (Kd = 0.63 month⁻¹), reflecting a dynamic state still in the process of stabilization.
Taken together, these results confirm that carbon dynamics in tropical Andean ecosystems are tightly regulated by the quantity, quality, and timing of organic inputs, as well as by the intensity of human management. In this sense, land uses such as RF and ER favor rapid microbial assimilation and mineralization, promoting SOC accumulation through a balance between litter inputs and active microbial activity. In contrast, land uses such as LS are characterized by restricted dynamics, lower residue inputs, and limited microbial activity, leading to significant reductions in SOC stocks and soil resilience to disturbances. These findings are consistent with those reported by [1,22,23], who point out that conservation practices and the maintenance of vegetation cover increase carbon sequestration capacity, while agricultural and livestock intensification weaken it. Furthermore, the persistence of stable carbon in humus, in contrast to the variability of labile compartments, underscores the need for management strategies that not only increase organic matter input but also protect recalcitrant soil fractions, thereby ensuring sustainable carbon sequestration in mountain landscapes that are highly vulnerable to land-use change and climate change.
4.2. Implications for Soil Carbon Management
The calibration and validation of the compartmental model confirmed its ability to robustly reproduce SOC dynamics in Andean ecosystems, with very low mean absolute errors (MAE) (0.01–0.30 Mg ha⁻¹) across all land uses (Table 3). This accuracy is consistent with that reported by similar models applied in Andisols, where stabilized carbon fractions tend to show better prediction than more dynamic microbial compartments [24,13]. However, microbial biomass (MB) showed greater variability, particularly in ER (MAE = 1.34 Mg ha⁻¹), reflecting its high sensitivity to environmental conditions and fresh organic matter pulses. In contrast, microbial respiration (eqC) was accurately represented in most land covers except for LS (MAE = 0.67 Mg ha⁻¹), where model underestimation highlights the combined effect of low residue inputs and physical soil disturbance on biological activity. Several studies have shown that tillage and land cover removal practices cause macroaggregate breakdown, soil compaction, and porosity loss, which reduces protected microbial habitats and exposes previously inaccessible organic matter to oxygen, temporarily increasing mineralization and altering microbial activity [25]. Notably, [25] found significant increases in respiration after tillage due to the sudden release of labile organic C; [26] showed that tillage-free systems maintain higher microbial biomass and controlled respiration by preserving structure and residues. These mechanisms allow us to understand why, in LS, with high physical disturbance, microbial activity is limited, even though model predictions reflect low values: the loss of structure, compaction, and residue reduction imposes stress on microorganisms, which can cause underestimations of actual activity in intermediate or deep sectors of the profile.
In line with the above, the results of this research show that the greatest deviations between observed and modeled SOC values occurred in LS, where the model underestimated reserves by 14.3 Mg ha⁻¹ (RE = 13.2%), in contrast to RF, which showed the best fit with a difference of only 6.3 Mg ha⁻¹ (RE = 4.3%) (Figure 2). This reinforces the idea that land uses such as LS require specific adjustments in the representation of carbon contributions via litter and in the effects of compaction on microbial respiration and infiltration. From a management perspective, these discrepancies underscore the need to increase the supply of fresh organic matter and minimize physical soil disturbance to ensure soil carbon sustainability in agricultural and livestock systems. Practices such as the systematic application of organic amendments (compost or manure), maintaining stubble, and integrating agroforestry systems have been shown to increase carbon inputs, stabilize microbial biomass, and reduce losses associated with accelerated mineralization [12]. Similarly, the adoption of minimum tillage practices can reduce CO₂ emissions and surface runoff losses, consistent with recent evidence from degraded tropical pastures [6,27].
In summary, the evaluated compartmental model not only provides robust quantitative evidence of SOC dynamics under contrasting land covers but also demonstrates its potential as a decision-support tool for adaptive soil management in Andean mountain landscapes. By identifying the compartments most sensitive to land-use change, the model highlights the importance of management strategies that optimize organic matter inputs while protecting the most resilient SOC fractions. These practices are essential not only for maintaining soil fertility and resilience in tropical upland systems but also for strengthening the role of these ecosystems as long-term carbon sinks, thus contributing to climate change mitigation.
5. Conclusions
The compartmental model developed in this research demonstrates that these types of tools are effective in understanding SOC dynamics across different land uses in tropical Andean ecosystems. The model accurately reproduced SOC storage and respiration, confirming that humus acts as the most stable carbon reservoir, while microbial biomass and litter are more sensitive to land-use changes. RF and RE soils maintain higher carbon stocks and greater microbial activity, whereas LS soils exhibit severe structural degradation and limited biological performance. These results emphasize that sustainable management practices—such as maintaining continuous organic inputs, minimizing soil disturbance, and integrating agroforestry systems—are essential for improving carbon sequestration and soil resilience in mountain landscapes. The proposed model offers a valuable tool for assessing carbon fluxes and supporting adaptive management strategies under future climate and land-use change scenarios.
Author Contributions
Conceptualization, VAMV and RRL; methodology, VAMV; software, VAMV and RRL; validation, AFC and DJMP; formal analysis, VAMV; investigation, VAMV and AFC; resources, VAMV, AFC and DJMP; data curation, VAMV; writing—original draft preparation, VAMV; writing—review and editing, VAMV.; visualization, RRL AND DJMP; supervision, DJMP; project administration, VAMV and DJMP.; funding acquisition, VAMV, DJMP and RRLY.Y. All authors have read and agreed to the published version of the manuscript.
Funding
This research was funded by the PhD in Environmental Sciences, University of Cauca. The APC was funded by the Doctorate in Environmental Sciences, Universidad del Cauca.
Data Availability Statement
The data that support the findings of this study are available from the corresponding author upon reasonable request. No publicly archived datasets were generated or analyzed during this study.
Acknowledgments
to the PhD in Environmental Sciences, University of Cauca, for the financial and in-kind resources for the development of this research.
Conflicts of Interest
The authors declare no conflicts of interest.Abbreviations The following abbreviations are used in this manuscript:
References
- Don, A.; Seidel, F.; Leifeld, J.; Kätterer, T.; Martin, M.; Pellerin, S.; Emde, D.; Seitz, D.; Chenu, C. Carbon Sequestration in Soils and Climate Change Mitigation—Definitions and Pitfalls. Glob. Chang. Biol. 2024, 30. [CrossRef]
- Lugato, E.; Leip, A.; Jones, A. Mitigation Potential of Soil Carbon Management Overestimated by Neglecting N2O Emissions. Nat. Clim. Chang. 2018, 8, 219–223. [CrossRef]
- Lal, R.; Monger, C.; Nave, L.; Smith, P. The Role of Soil in Regulation of Climate. Philos. Trans. R. Soc. B Biol. Sci. 2021, 376. [CrossRef]
- Pérez Fagua, C.; Landínez Torres, Á.Y.; Silva Parra, A. Carbono Orgánico y Su Dinámica En Suelos Tropicales: Una Revisión. Cult. Científica 2023, 1, 1–22.
- Lis-Gutiérrez, M.; Rubiano-Sanabria, Y.; Usuga, J.C.L. Soils and Land Use in the Study of Soil Organic Carbon in Colombian Highlands Catena. Acta Univ. Carolinae, Geogr. 2019, 54, 15–23. [CrossRef]
- Torres, B.; Bravo, C.; Torres, A.; Tipán-Torres, C.; Vargas, J.C.; Herrera-Feijoo, R.J.; Heredia-R, M.; Barba, C.; García, A. Carbon Stock Assessment in Silvopastoral Systems along an Elevational Gradient: A Study from Cattle Producers in the Sumaco Biosphere Reserve, Ecuadorian Amazon. Sustain. 2023, 15, 1–14. [CrossRef]
- Veldkamp, E.; Schmidt, M.; Markwitz, C.; Beule, L.; Beuschel, R.; Biertümpfel, A.; Bischel, X.; Duan, X.; Gerjets, R.; Göbel, L.; et al. Multifunctionality of Temperate Alley-Cropping Agroforestry Outperforms Open Cropland and Grassland. Commun. Earth Environ. 2023, 4, 1–10. [CrossRef]
- Acosta-Mireles, M.; Paz-Pellat, F.; Hidalgo-Moreno, C.; Etchevers-Barra, J.D. Soil Organic Carbon Depth Distribution Patterns in Different Land Uses and Management. Terra Latinoam. 2022, 40, 1–19. [CrossRef]
- Lal, R. Challenges and Opportunities in Soil Organic Matter Research. Eur. J. Soil Sci. 2009, 60, 158–169. [CrossRef]
- Campbell, E.E.; Paustian, K. Current Developments in Soil Organic Matter Modeling and the Expansion of Model Applications: A Review. Environ. Res. Lett. 2015, 10. [CrossRef]
- Wieder, W.R.; Grandy, A.S.; Kallenbach, C.M.; Bonan, G.B. Integrating Microbial Physiology and Physio-Chemical Principles in Soils with the MIcrobial-MIneral Carbon Stabilization (MIMICS) Model. Biogeosciences 2014, 11, 3899–3917. [CrossRef]
- Carbajal, M.; Ramírez, D.A.; Turin, C.; Schaeffer, S.M.; Konkel, J.; Ninanya, J.; Rinza, J.; De Mendiburu, F.; Zorogastua, P.; Villaorduña, L.; et al. From Rangelands to Cropland, Land-Use Change and Its Impact on Soil Organic Carbon Variables in a Peruvian Andean Highlands: A Machine Learning Modeling Approach. Ecosystems 2024, 27, 899–917. [CrossRef]
- Ordoñez, M.C.; Olaya, J.F.C.; Galicia, L.; Figueroa, A. Soil Carbon Dynamics under Pastures in Andean Socio-Ecosystems of Colombia. Agronomy 2020, 10. [CrossRef]
- Tao, F.; Huang, Y.; Hungate, B.A.; Manzoni, S.; Frey, S.D.; Schmidt, M.W.I.; Reichstein, M.; Carvalhais, N.; Ciais, P.; Jiang, L.; et al. Microbial Carbon Use Efficiency Promotes Global Soil Carbon Storage. Nature 2023, 618, 981–985. [CrossRef]
- Afzal, T.; Wakeel, A.; Cheema, S.A.; Iqbal, J.; Sanaullah, M. Influence of Quality and Quantity of Crop Residues on Organic Carbon Dynamics and Microbial Activity in Soil. Soil Environ. 2024, 43, 53–64. [CrossRef]
- Alavi-Murillo, G.; Diels, J.; Gilles, J.; Willems, P. Soil Organic Carbon in Andean High-Mountain Ecosystems: Importance, Challenges, and Opportunities for Carbon Sequestration. Reg. Environ. Chang. 2022, 22. [CrossRef]
- Gao, Y.; Tariq, A.; Zeng, F.; Sardans, J.; Al-Bakre, D.A.; Peñuelas, J. Long-Term Anthropogenic Disturbances Exacerbate Soil Organic Carbon Loss in Hyperarid Desert Ecosystems. Glob. Chang. Biol. 2025, 31. [CrossRef]
- Bhatia, R.K.; Walia, A. Advancements in Microbial Biotechnology for Soil Health; 2024; Vol. 50; ISBN 978-981-99-9481-6.
- Van Keulen, H. (Tropical) Soil Organic Matter Modelling: Problems and Prospects. Nutr. Cycl. Agroecosystems 2001, 61, 33–39. [CrossRef]
- Yang, S.; Jansen, B.; Absalah, S.; Kalbitz, K.; Chunga Castro, F.O.; Cammeraat, E.L.H. Soil Organic Carbon Content and Mineralization Controlled by the Composition, Origin and Molecular Diversity of Organic Matter: A Study in Tropical Alpine Grasslands. Soil Tillage Res. 2022, 215, 105203. [CrossRef]
- Pérez Fagua, C.; Landínez Torres, Á.Y.; Silva Parra, A. Carbono Orgánico y Su Dinámica En Suelos Tropicales: Una Revisión. Cult. Científica 2023, 1, 1–22.
- Koutika, L.-S.; Cerri, C.C.; Koutika, L.-S.; Bartoli, F.; Andreux, F.; Burtin, G.; Chon6, T.; Philippy, R. Organic Matter Dynamics and Aggregation in Soils under Rain Forest and Pastures of Increasing Age in the Eastern Amazon Basin. Geoderma 1997, 76, 87–112. [CrossRef]
- Visconti-Moreno, E.F.; Valenzuela-Balcázar, I.G. Impact of Soil Use on Aggregate Stability and Its Relationship with Soil Organic Carbon at Two Different Altitudes in the Colombian Andes. Agron. Colomb. 2019, 37, 263–273. [CrossRef]
- Yang, S.; Jansen, B.; Absalah, S.; Van Hall, R.L.; Kalbitz, K.; Cammeraat, E.H.E. Lithology-and Climate-Controlled Soil Aggregate-Size Distribution and Organic Carbon Stability in the Peruvian Andes. Soil 2020, 6, 1–15. [CrossRef]
- Fiedler, S.R.; Leinweber, P.; Jurasinski, G.; Eckhardt, K.U.; Glatzel, S. Tillage-Induced Short-Term Soil Organic Matter Turnover and Respiration. Soil 2016, 2, 475–486. [CrossRef]
- Gong, Y.; Li, P.; Guo, Y.; Aso, H.; Huang, Q.; Araki, H.; Nishizawa, T.; Komatsuzaki, M. Long-Term No-Tillage and Rye Cover Crops Affect Soil Biological Indicators on Andosols in a Humid, Subtropical Climate. Eur. J. Soil Sci. 2022, 73, e13306. [CrossRef]
- Conant, R.T.; Klopatek, J.M.; Malin, R.C.; Klopatek, C.C. Carbon Pools and Fluxes along an Environmental Gradient in Northern Arizona. Biogeochemistry 1998, 43, 43–61.
Figure 1.
Location of the study area and distribution of different land uses: riparian forest (RF), ecological restoration (ER), natural regeneration (NR), and livestock (LS).
Figure 1.
Location of the study area and distribution of different land uses: riparian forest (RF), ecological restoration (ER), natural regeneration (NR), and livestock (LS).
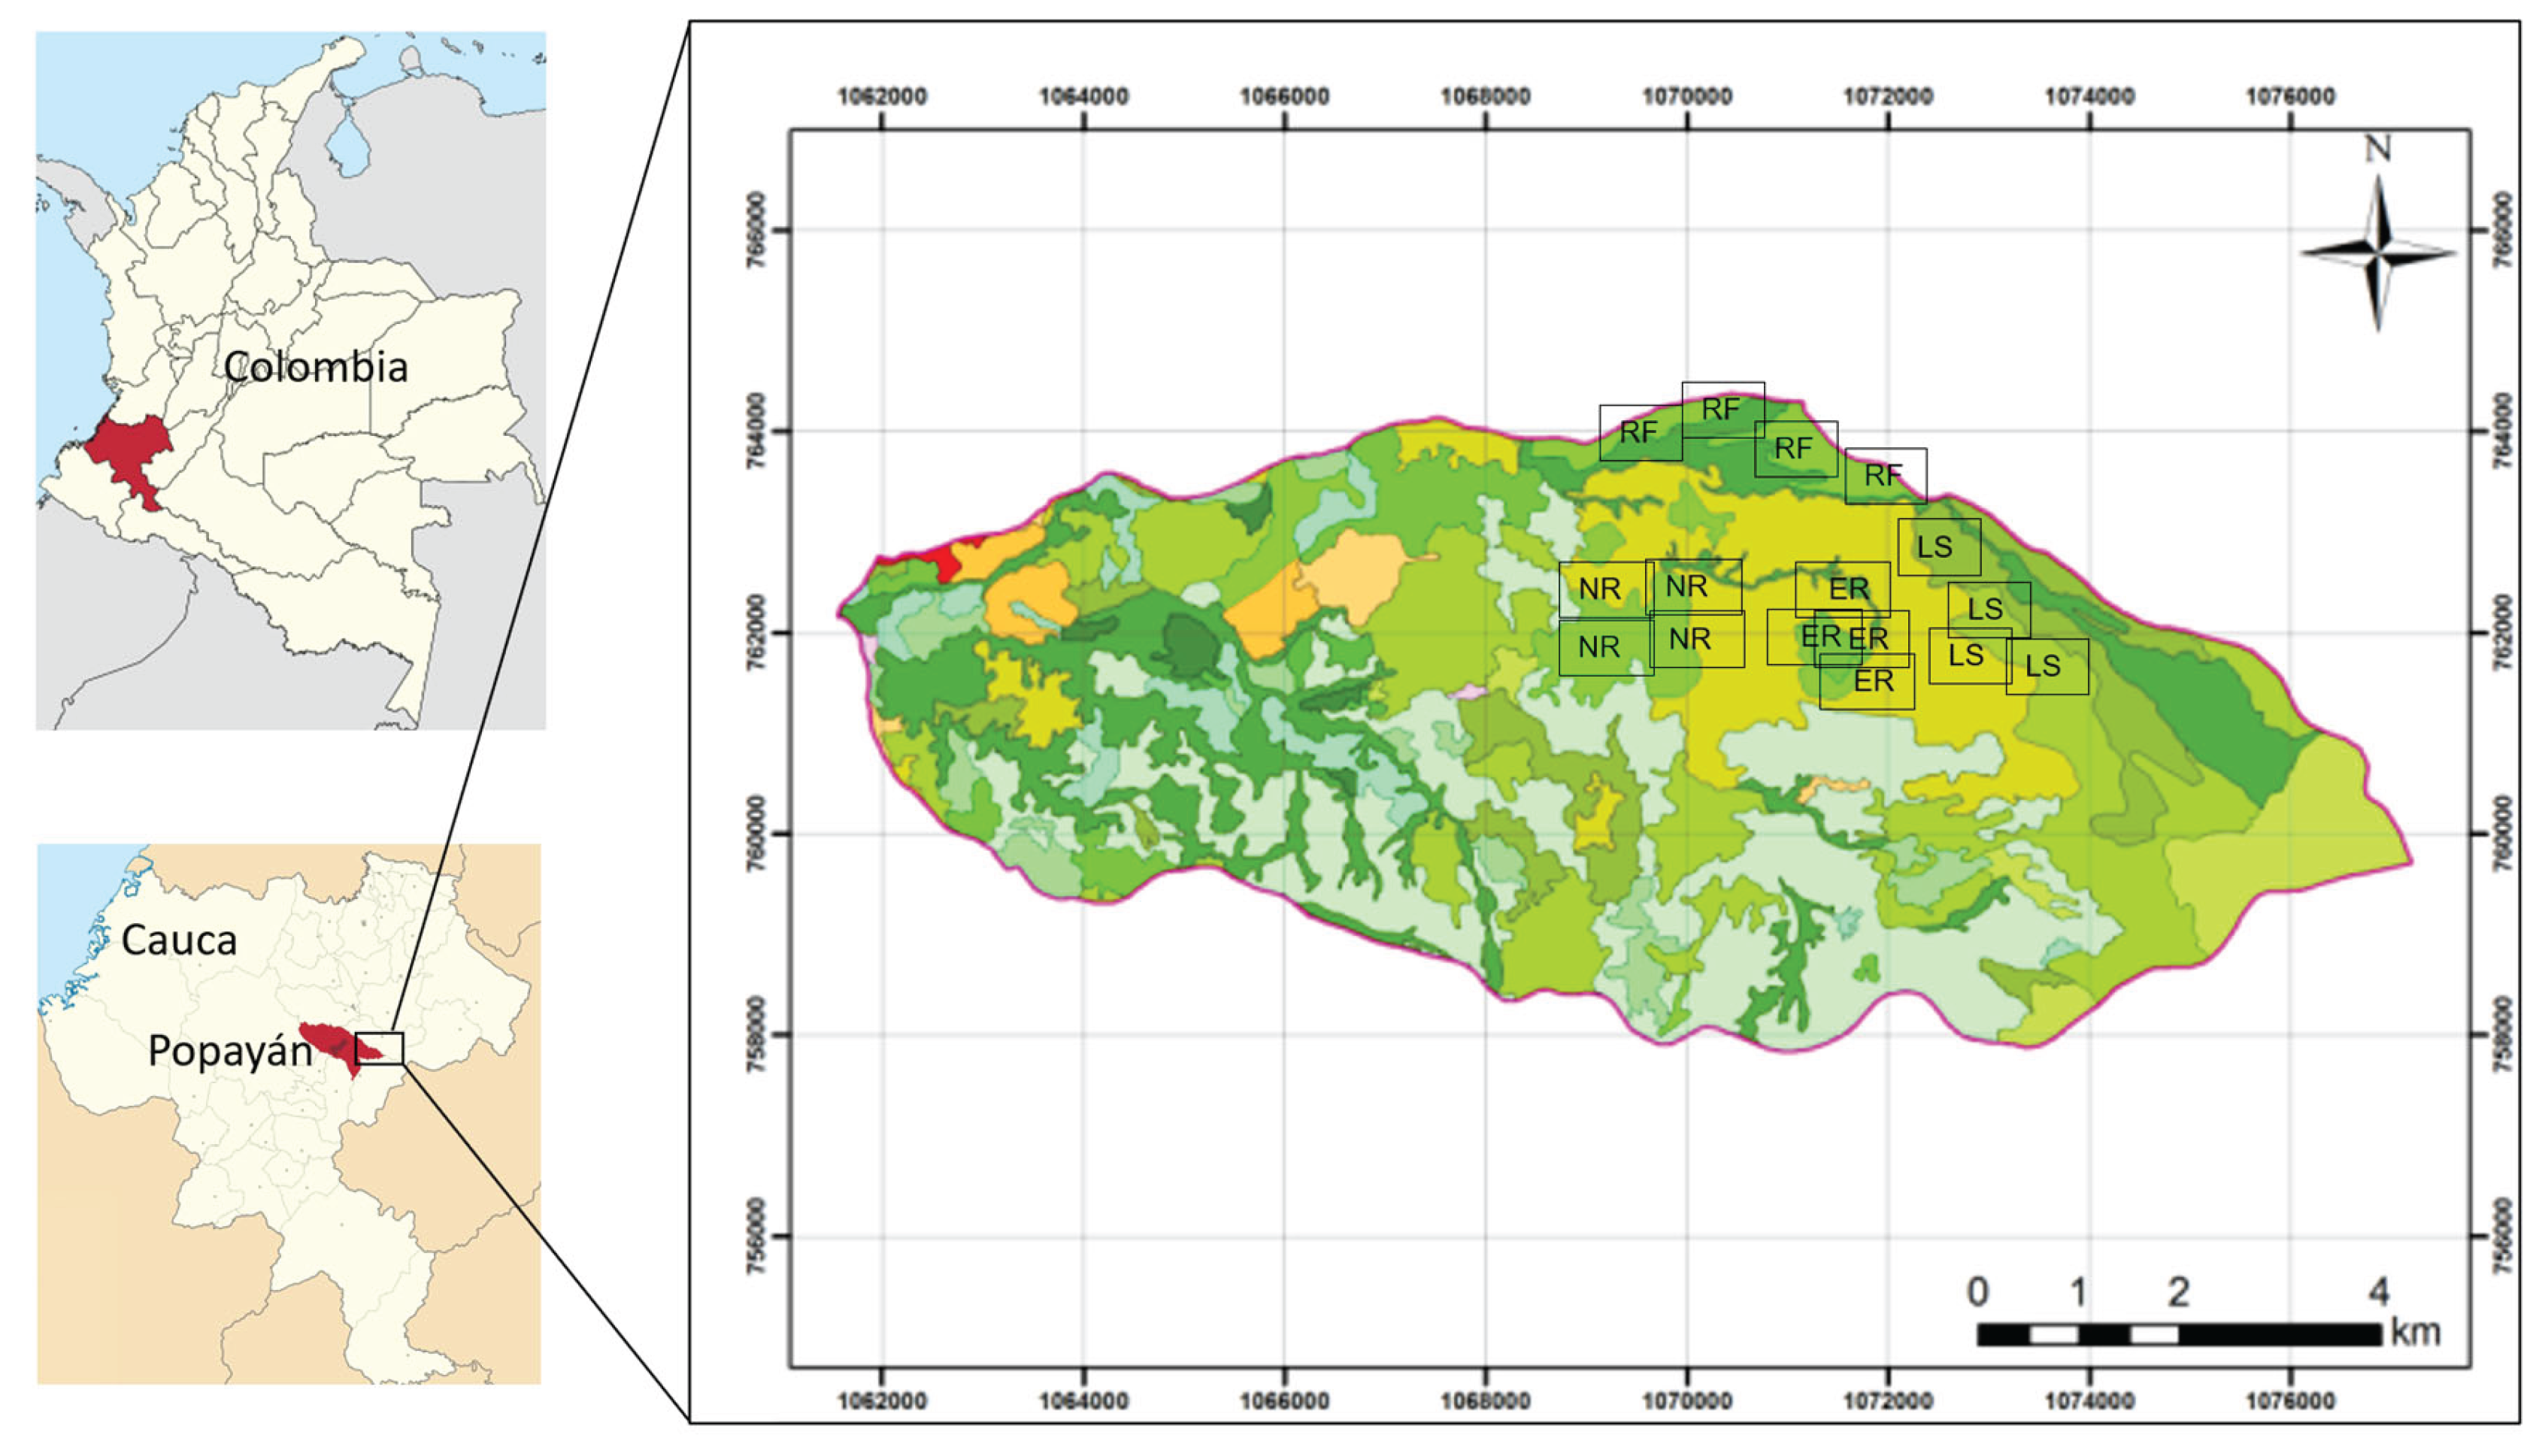
Figure 2.
Schematic representation of the compartmental soil organic carbon (SOC) model. Arrows indicate carbon fluxes among litter, humus, microbial biomass, and losses to the atmosphere. Parameters: K₁ = litter decomposition rate; K₂ = humus mineralization rate; Fh = humification fraction from litter to humus; Fr = assimilation fraction from humus to microbial biomass; Kd = microbial biomass decay rate. Quant = external carbon inputs (litterfall, CL, and coarse woody material, CMU); Runoff = surface carbon losses.
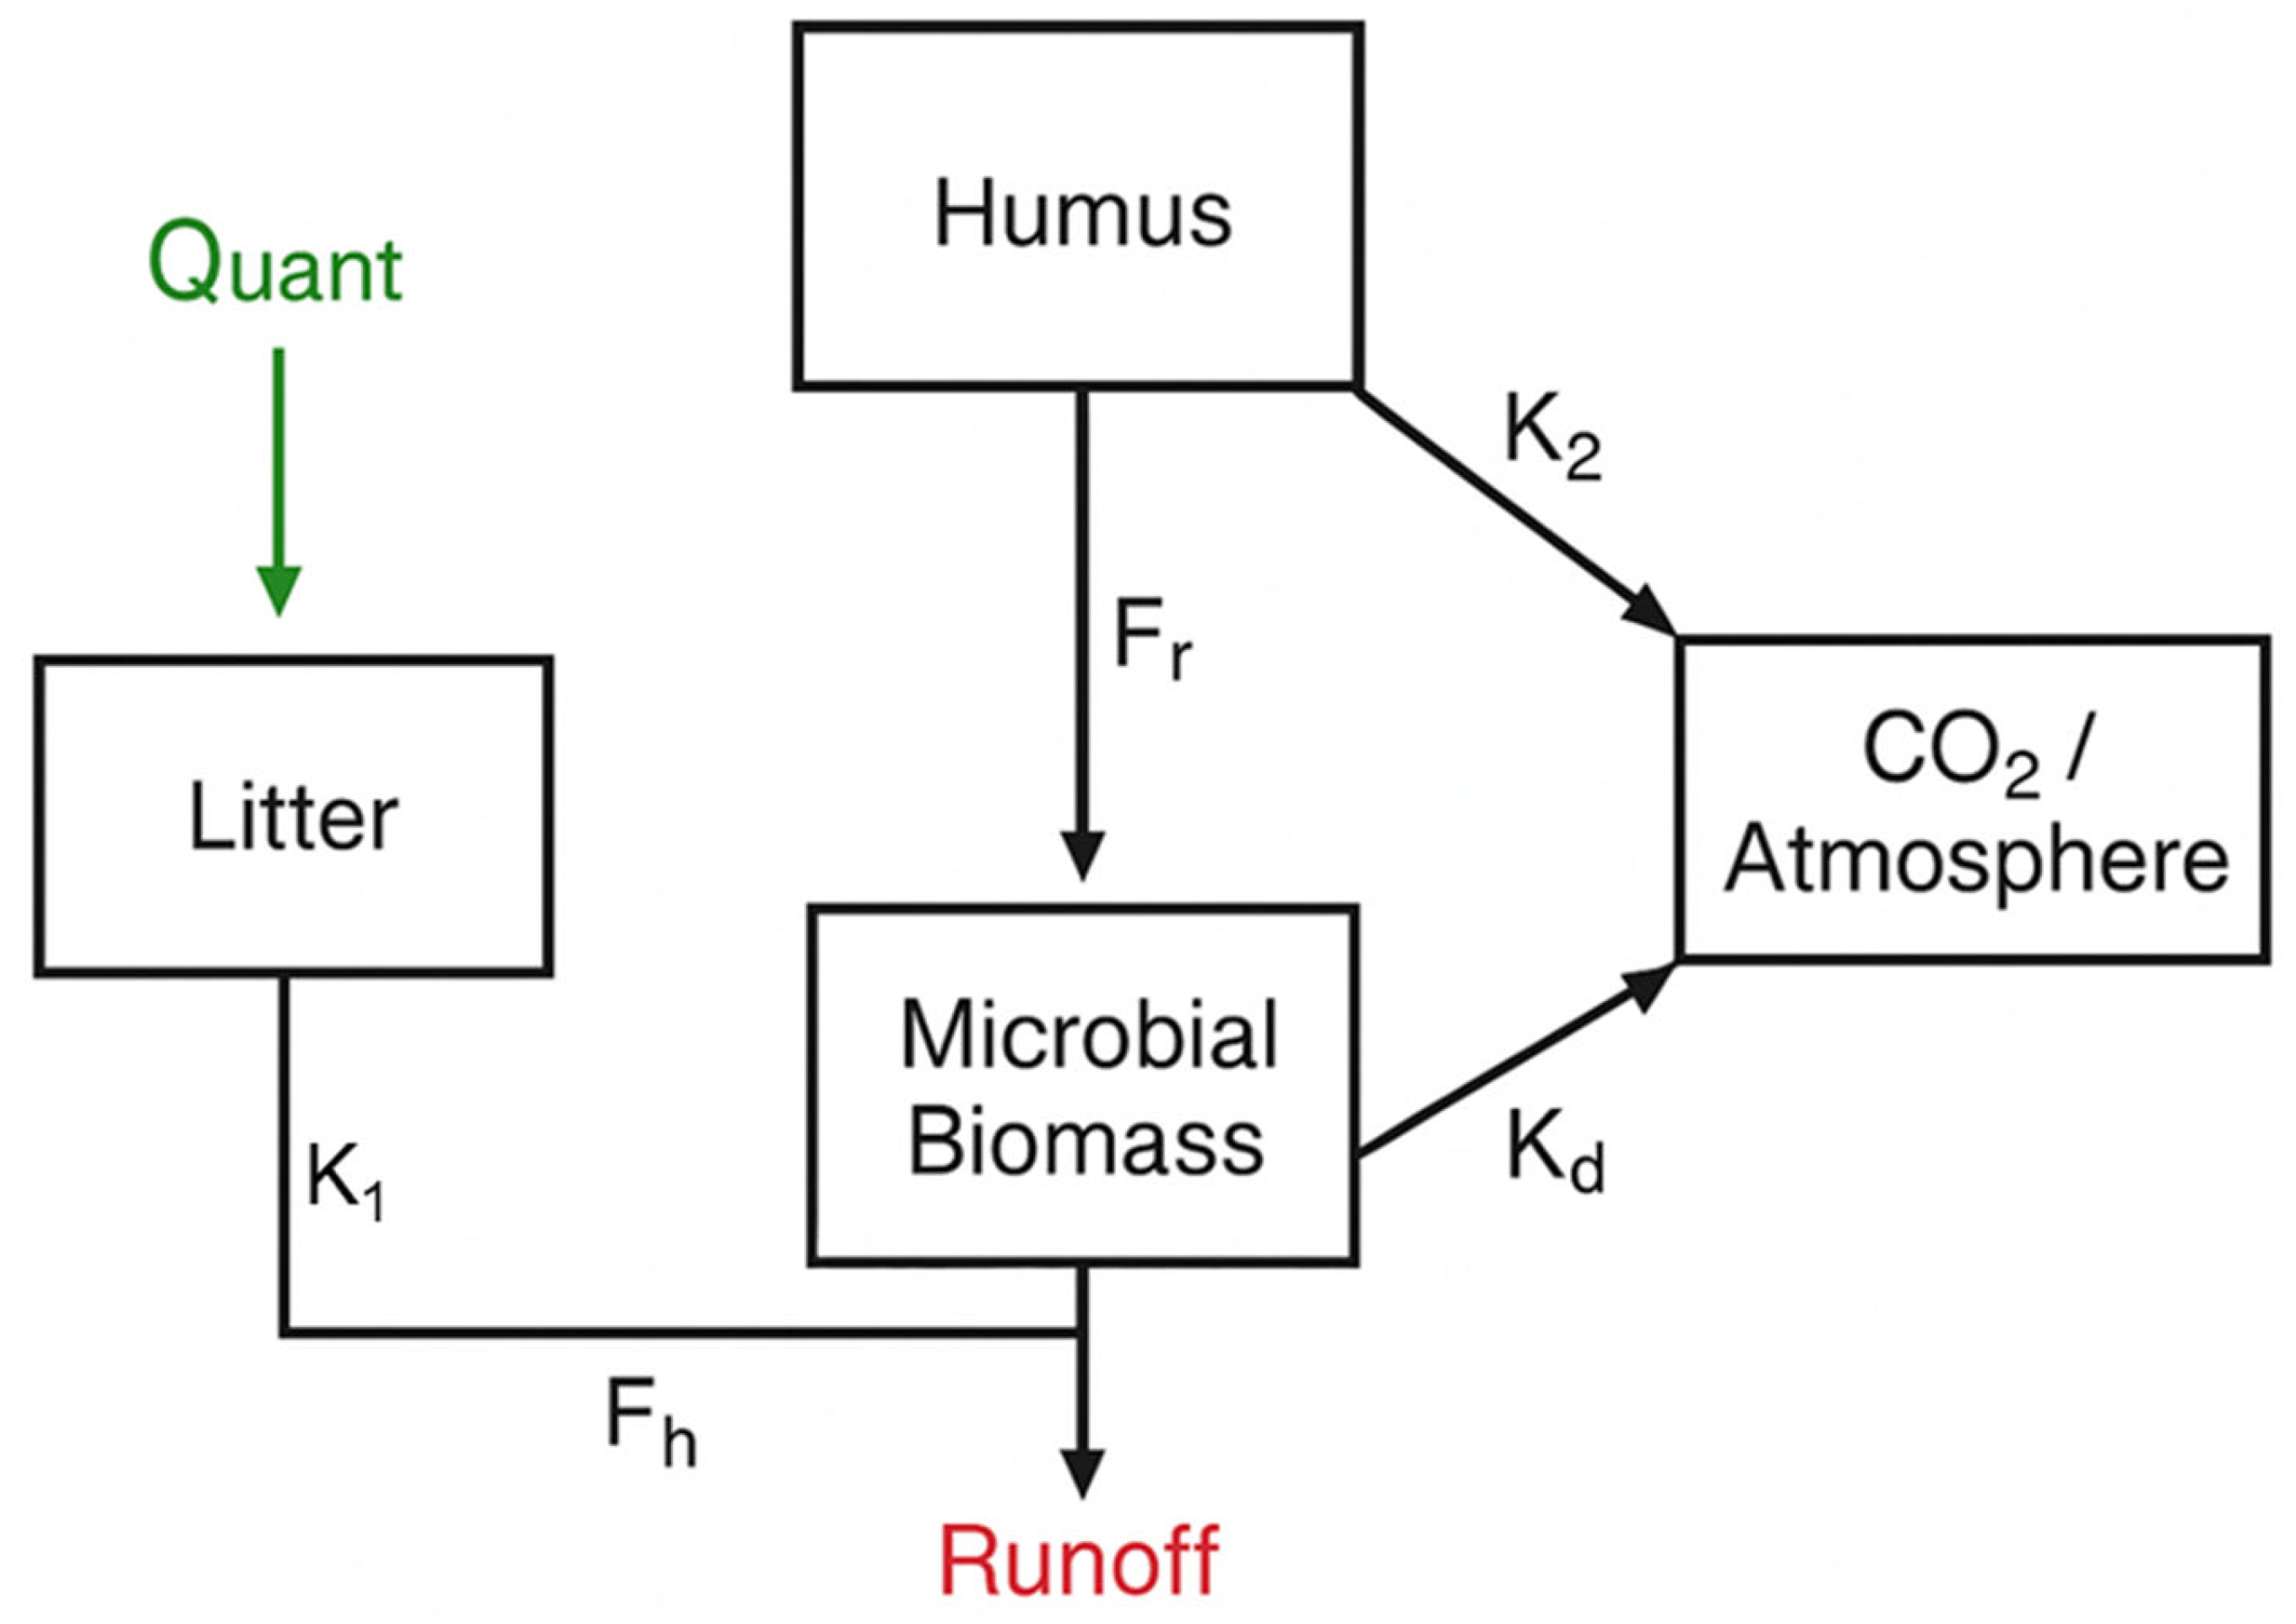
Figure 3.
Observed vs. modeled SOC = soil organic carbon across land uses, showing absolute error (AE, Mg ha⁻¹) and relative error (RE, %). Land uses: RF = Riparian Forest, ER = Ecological Restoration, NR = Natural Regeneration, LS = Livestock.
Figure 3.
Observed vs. modeled SOC = soil organic carbon across land uses, showing absolute error (AE, Mg ha⁻¹) and relative error (RE, %). Land uses: RF = Riparian Forest, ER = Ecological Restoration, NR = Natural Regeneration, LS = Livestock.
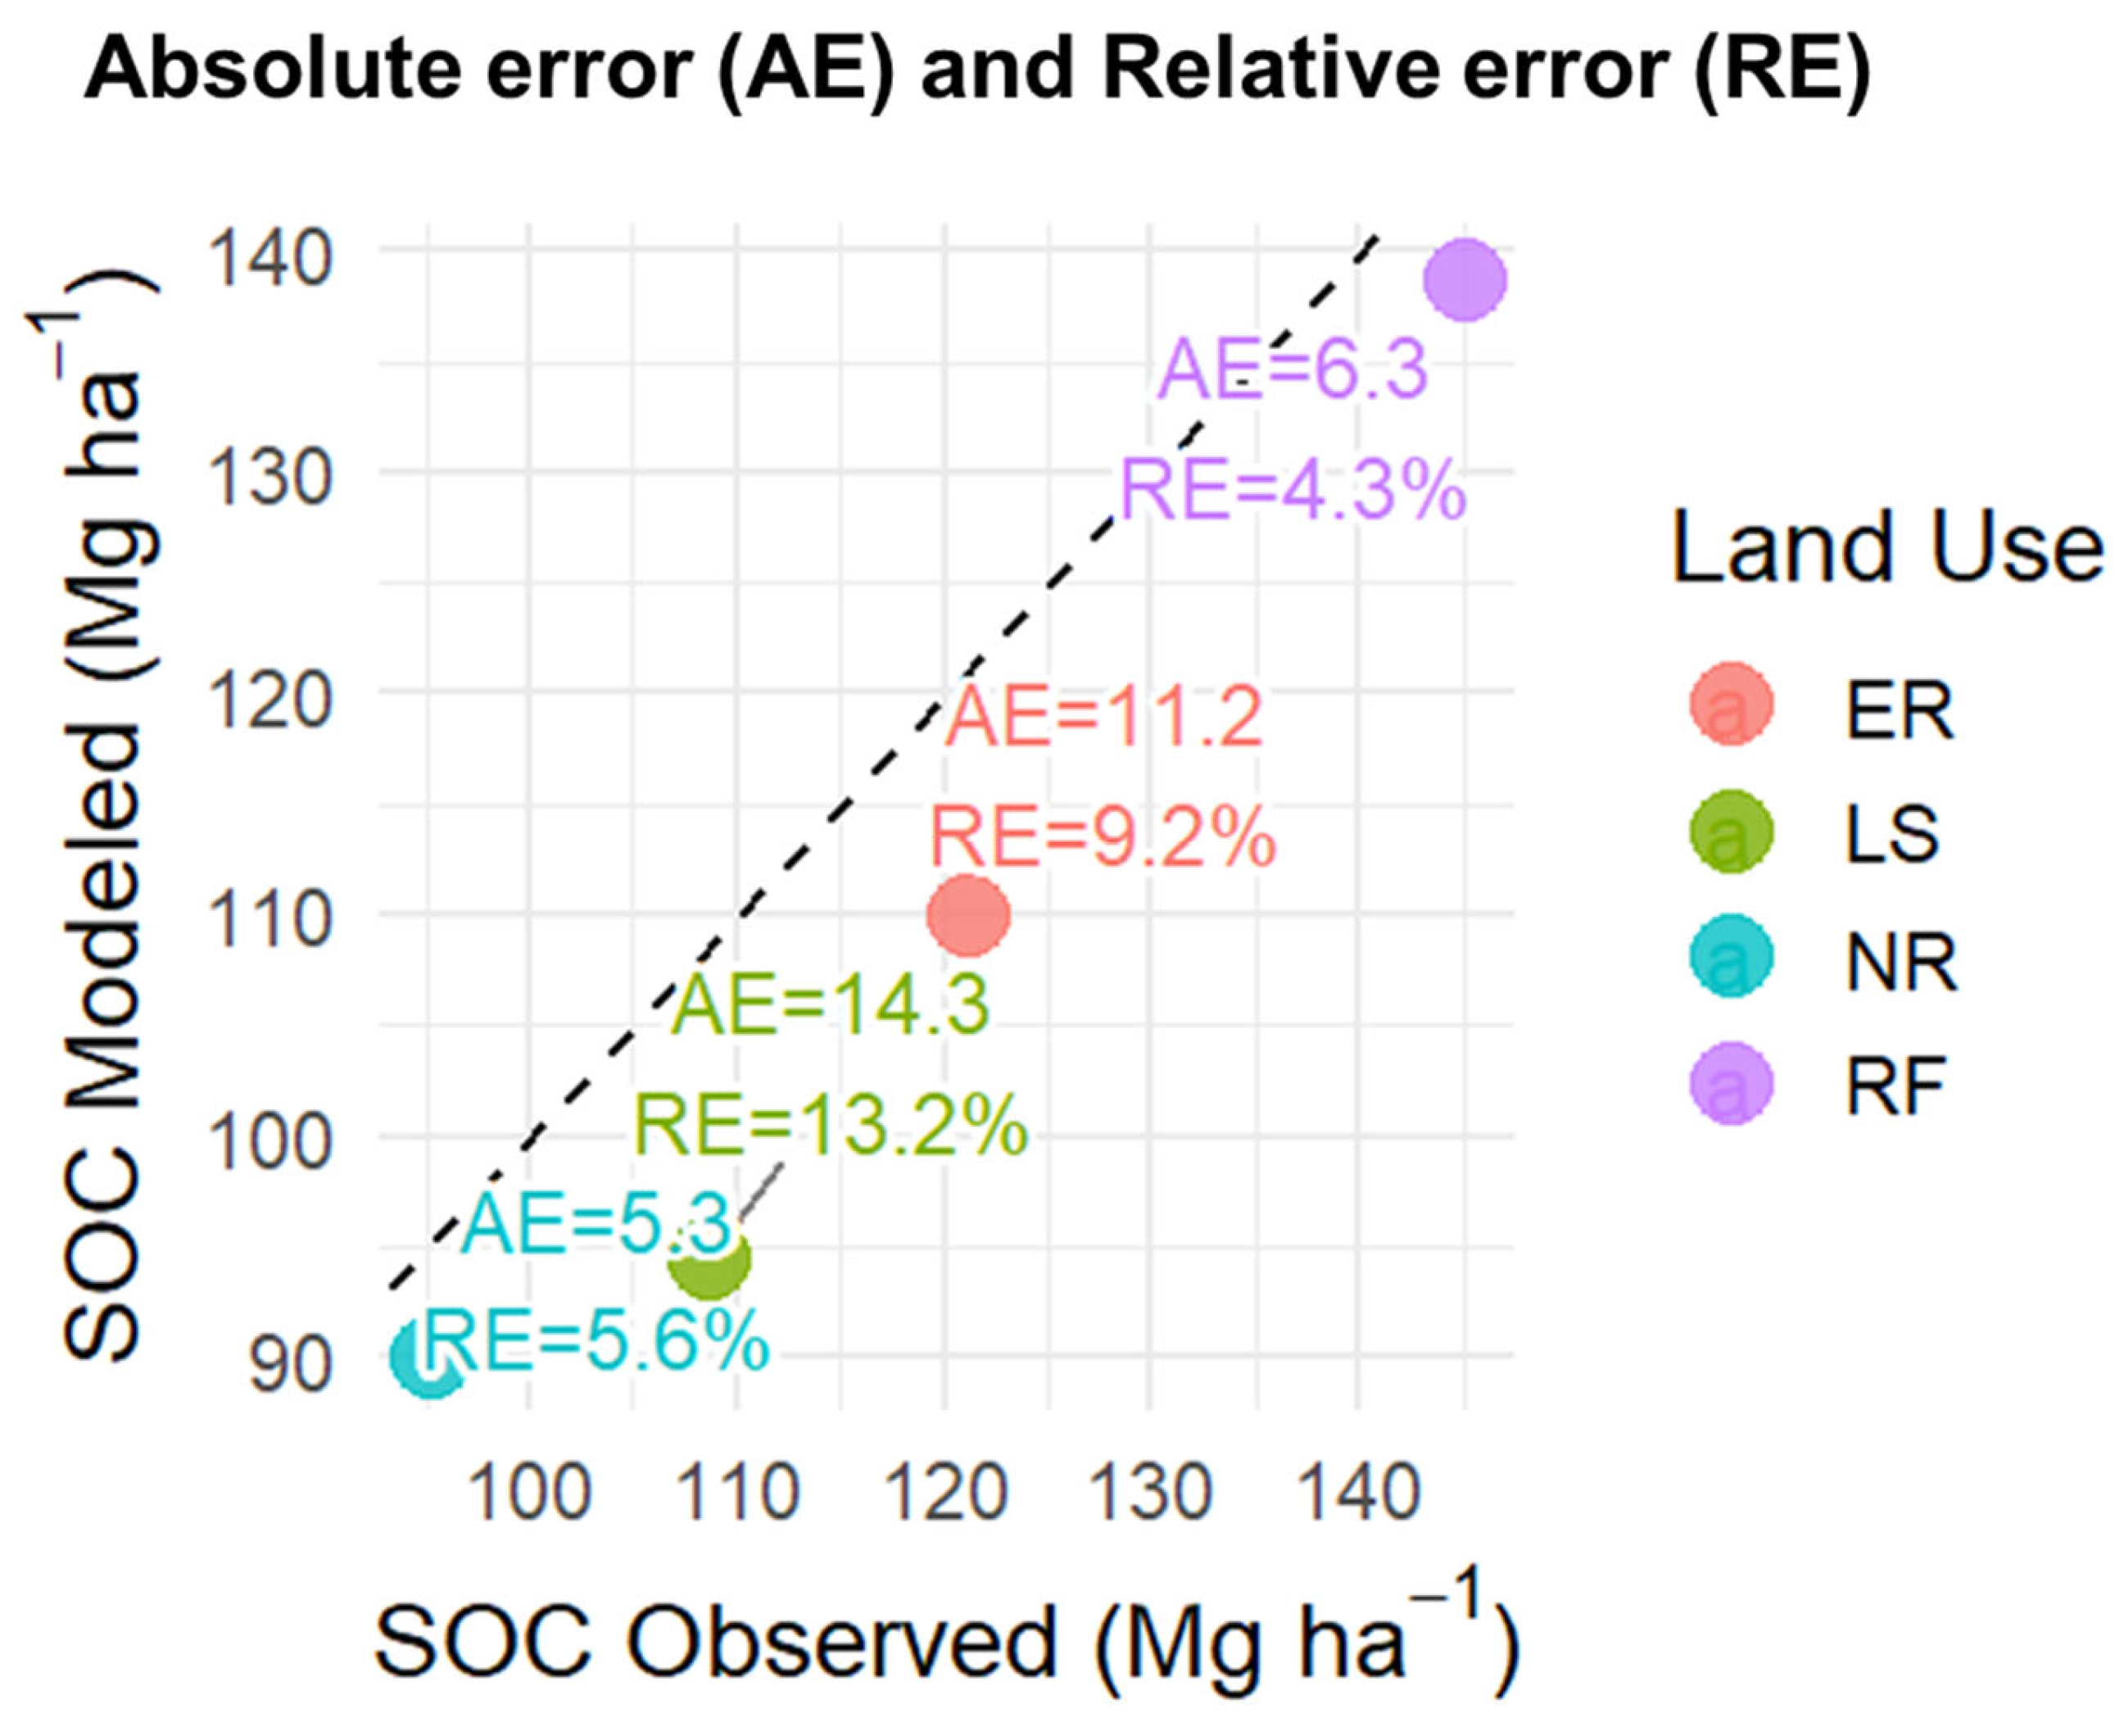

Table 1.
Soil physicochemical and biological properties under different land uses in tropical Andean ecosystems.
Table 1.
Soil physicochemical and biological properties under different land uses in tropical Andean ecosystems.
| Variable | Land use | |||
| ER | LS | NR | RF | |
| ECEC (meq100 g-1 soil) | 4.1 ±0.22 | 5.7±0.5 | 4.38±0.39 | 3.73±0.23 |
| pH | 4.6±0.1 | 5.12±0.15 | 4.93±0.21 | 4.93±0.05 |
| C% | 3.75±0.75 | 3.81±0.84 | 3.41±2.77 | 4.97+0.93 |
| N% | 0.79±0.06 | 1.03±0.08 | 0.87±0.19 | 1.18±0.1 |
| C/N% | 4.75±0.7 | 3.70±0.29 | 3.92±0.21 | 4.21±0.5 |
| SOC (Mg ha-1) | 119.24±5.05 | 102.85±5.55 | 97.3±14.13 | 148.68±6.07 |
| CL (Mg ha−1month−1) | 2.23±0.11 | 1.08±0.19 | 2±0.32 | 4.65±0.52 |
| CMU (Mg ha-1) | 5.6±0.51 | 2.37±0.63 | 3.8±0.38 | 8.1±1.02 |
| BD (g cm−3) | 1.06±0.01 | 0.9±0.02 | 0.95±0.08 | 1±0.01 |
| Sand (%) | 72.5±3 | 73.5±2.52 | 73.5±2.52 | 73.5±2.52 |
| Silt (%) | 23.5±3 | 21±2 | 22.5±2.52 | 21.5±1.91 |
| Clay (%) | 4± 0.01 | 5.5±0.99 | 4±0.01 | 5±1.13 |
| HSM (%) | 11.32±0.56 | 10.08±0.49 | 10.52±0.55 | 13.49±0.4 |
| SM (%) | 65.65±0.61 | 62.75±0.72 | 62.81±0.25 | 64.96±0.8 |
| MicC. (μg C g−1) | 199.19±1.17 | 108.18±2.47 | 191.51±0.68 | 198.18±0.87 |
| SMicR CO2 (eq C) (kg ha−1 month−1) | 145.94±4.38 | 112.65±8.58 | 121.11±2.31 | 108.01±2.41 |
RF = Riparian Forest; ER = Ecological Restoration; NR = Natural Regeneration; LS = Livestock System. ECEC = Effective Cation Exchange Capacity; SOC = Soil Organic Carbon; CL = Carbon inputs from litterfall; CMU = Carbon inputs from forest floor material; BD = Bulk Density; HSM = Hydric Soil Moisture; SM = Gravimetric Soil Moisture; MicC = Microbial Biomass Carbon; SMicR CO₂ = Soil Microbial Respiration. Values represent mean ± SE.
Table 2.
Calibrated parameters of the SOC compartmental model.
| Range Values | RF | ER | NR | LS | |
| K1 (month⁻¹) | 0.001–0.9 | 0.308 | 0.190 | 0.154 | 0.001 |
| K2 (month⁻¹) | 2.5e-6–0.001 | 1,00E-04 | 8,00E-05 | 1,00E-04 | 0.01 |
| Fh | 0.2–0.5 | 0.20 | 0.20 | 0.20 | 0.249 |
| Fr | 0.2–0.8 | 0.80 | 0.80 | 0.787 | 0.20 |
| Kd (month⁻¹) | 0.01–1.2 | 0.139 | 0.632 | 0.555 | 0.010 |
K1 = litter decomposition rate (month⁻¹); K2 = humus decomposition rate (month⁻¹); Fh = fraction of litter carbon allocated to humification; Fr = fraction of carbon allocated to microbial assimilation and mineralization; Kd = microbial biomass decay rate (month⁻¹). Values represent calibrated means for each land-use type: riparian forest (RF), ecological restoration (ER), natural regeneration (NR), and livestock systems (LS).
Table 3.
Observed and modeled values of SOC, microbial biomass (MB), respiration equivalent carbon (eqC), and simulated litter and humus pools across land-use types.
Table 3.
Observed and modeled values of SOC, microbial biomass (MB), respiration equivalent carbon (eqC), and simulated litter and humus pools across land-use types.
| Land use | ||||||||||||
| RF | MAE | ER | MAE | NR | MAE | LS | MAE | |||||
| Observed | Modeled | Observed | Modeled | Observed | Modeled | Observed | Modeled | |||||
| SOC (Mg ha-1) | 148.69 | 148.17 | 0.1 | 119.24 | 108.24 | 0.01 | 97.29 | 98.78 | 0.3 | 102.85 | 98.6 | 0.03 |
| MB (Mg ha-1) | 1.99 | 1.01 | 1.01 | 2.12 | 1.78 | 1.34 | 0.98 | 0.77 | 0.31 | 0.98 | 0.67 | 0.31 |
| eqC (Mg ha-1) | 1.42 | 1.39 | 0.03 | 1.11 | 1.09 | 0.02 | 0.41 | 1.08 | 0.1 | 0.41 | 1.08 | 0.67 |
| Humus pool (Mg ha-1) | 107.01 | 82.2 | 77.87 | 66.99 | ||||||||
| Litter pool (Mg ha-1) | 30.94 | 25.34 | 21.34 | 21.61 | ||||||||
MAE = mean absolute error between observed and modeled values; RF = riparian forest, ER = ecological restoration, NR = natural regeneration, LS = livestock system.
Disclaimer/Publisher’s Note: The statements, opinions and data contained in all publications are solely those of the individual author(s) and contributor(s) and not of MDPI and/or the editor(s). MDPI and/or the editor(s) disclaim responsibility for any injury to people or property resulting from any ideas, methods, instructions or products referred to in the content. |
© 2025 by the authors. Licensee MDPI, Basel, Switzerland. This article is an open access article distributed under the terms and conditions of the Creative Commons Attribution (CC BY) license (http://creativecommons.org/licenses/by/4.0/).
Copyright: This open access article is published under a Creative Commons CC BY 4.0 license, which permit the free download, distribution, and reuse, provided that the author and preprint are cited in any reuse.


