Submitted:
31 May 2025
Posted:
03 June 2025
You are already at the latest version
Abstract
One of the most serious skin conditions, skin cancer, is on the rise at an alarming rate. According to the most recent WHO statistics, 853 people died from skin cancer in Bangladesh in 2020. However, by detecting skin cancer early on, we may prevent this death; thus, I have gathered some data from the Kaggle Repository and applied a deep learning algorithm. A dataset of 2357 photos of nine distinct types of lesions is used to test the suggested technique.
Keywords:
skin cancer
; deep learning
; data augmentation
; melanoma classification
1. Introduction
Data scientists are turning to the idea of using Deep Convolutional Neural Networks (D-CNNs) for skin cancer detection, classification, and segmentation due to the observable advantages of D-CNNs in Medical Image Analysis. Skin malignancies are becoming more common and provide a serious threat to public health because of their rising incidence, morbidity, and death rates. The primary causative agent in the development of skin malignancies is ultraviolet radiation (UVR). Skin cancer is caused by UVR-induced genetic alterations and DNA damage. For the purpose of preventing skin cancer, a better knowledge of UVR is essential. Diepgen & Associates (2002). An automated classification approach for the diagnosis of melanoma is presented in this research. Its foundation is a convolutional neural network that receives preprocessed photos of skin lesions as input. In order to minimize the number of artifacts in the pictures and increase classification accuracy, the preprocessing phase is required. The suggested method is based on using a number of clinical photos that have been previously processed to train a neural network and categorize them as either benign or malignant. Jianu,et al.(March 2019). The World Cancer Research Fund International claims that. Cutaneous melanoma ranks seventeenth in the world's most common cancer. Melanoma and non-melanoma are the two main classifications for skin cancer. The most common non-melanoma malignancies are basal cell carcinoma and squamous cell carcinoma. Quantifying the incidence of skin cancer is a special challenge for a number of reasons. Skin cancer has a lot of subcategories, which may make data collecting problematic. Non-melanoma skin cancer, for example, is often not registered in cancer registries or is registered incompletely since most instances are successfully treated with surgery or ablation. These factors likely lead to an underestimation of the reported worldwide incidence of skin cancer.
In the white population, skin cancer, comprising melanoma and non-melanoma skin cancer (NMSC), is the most prevalent form of cancer. Globally, the incidence rate of melanoma is rising, although the corresponding mortality is either unchanged or marginally declining. However, the incidence of NMSC varies greatly; Australia has been found to have the highest rates, according to Apalla et al. (2017).
Among all malignancies, skin cancer is one of the deadliest. In the unlikely event that it is not diagnosed and treated right away, it will undoubtedly spread to other bodily areas. The primary cause of it is the skin cells' aberrant proliferation, which often occurs when the body is exposed to sunlight. Additionally, the early diagnosis of skin cancerous growths is an expensive and difficult process. It is categorized based on the kind of cell and where it grows. The categorization of lesions requires high recall and precision. Garg et al. (2021). After breast and cervical cancer, skin cancer accounts for the third highest number of cancer cases in Indonesia. Skin cancer's detrimental consequences may be minimized and controlled with early detection and appropriate treatment. Because benign tumor lesions and skin cancer lesions have similar shapes, identifying these lesions takes a lot longer for doctors. Fu'adah, Et al. (December 2020). One of the main types of cancer that has been rising quickly in recent decades is skin cancer. Smoking, DNA mutations, ultraviolet radiation, and unhealthy lifestyle choices are the main causes of skin cancer. Clinical screening, dermoscopic analysis, histological investigation, and biopsy are the methods used to diagnose skin cancer. Early detection of skin cancer may greatly aid in its treatment, however even dermatologists with advanced training find it challenging to identify and categorize the disease in its early stages. According to recent research, deep learning and transfer learning are very helpful in the detection and categorization of skin cancer. Younis et al. (December 2019). A review of the literature, an experimental setup, the results of the experiment, a discussion, and a conclusion make up the study's framework. Since this research conducted three experiments (detection utilizing six solo CNN networks, VGG19, Resnet152V2, Renext101, Seresnet152, Seresnext101, DenseNet201, a transfer learning, ensemble model), the results are presented together with the experimental description. The limitations of the research are also given.
2. Literature Review
[1] Diepgen and others. Al (2002). This page discusses UVR, its harmful effects on skin, and how it relates to skin cancer and UV immunosuppression. The quantity of UVR that reaches the earth's surface depends on a number of variables, such as weather, latitude, altitude, UV light elevation, and ozone depletion. Skin cancer risk factors include phototherapy, one of the current UVR-based treatment methods. Two significant personal attributable dangers are artificial UVR (tanning lights) and excessive sun exposure. With a focus on carefully considered statistics, the epidemiology of UVR-induced skin cancers, incidence rates, risk factors, and preventative behaviors & strategies, such as individual behavioral modifications and public education campaigns, this article seeks to give a thorough overview of skin cancer. [2] Jianu, Et al. (March, 2019). Automatic detection of skin cancer using neural networks .The research provides an automated classification method for melanoma diagnosis. Its foundation is a convolutional neural network that receives preprocessed photos of skin lesions as input. In order to minimize the amount of artifacts in the pictures and increase classification accuracy, the preprocessing phase is required. In the present research, we highlight recent worldwide trends in skin cancer epidemiology. The suggested method is based on training a neural network using a set of preprocessed clinical pictures, categorizing them in two categories: benign or malignant. [3] Apalla Et al. (2017). We study the most significant risk factors linked to the development of melanoma and NMSC, we address contentious topics brought up by recent epidemiological data, and we assess the effect of skin cancer on health care services. In addition, we emphasize the urgent need for better registration policies, particularly for non-malignant squamous cell carcinoma (NMSC), and finally we mention the current primary and secondary prevention strategies and their results. [4] Leffell, Et al. (1996) We talk about the typical presentations, clinical characteristics, referral protocols, management, and prognosis of melanoma and non-melanoma skin cancer (basal cell carcinoma, squamous cell carcinoma). [5] Simões, Et al. (2015) The first section of this paper reviews the state of the art in terms of skin cancer disease and epidemiology data. The gold standards of the currently advised treatments across the globe are then discussed, together with the patients' real demands. This is the first publication that discusses innovative therapeutic techniques, potential technical advancements ranging from immunotherapy to nanotechnology, and current and future therapeutic prospects for the treatment of skin cancers.
[6] Garg, et al. (2021) make use of the MNIST HAM-10,000 collection, which includes pictures from dermoscopy. The goal is to suggest a convolution neural network-based system that can identify skin cancer and categorize it into distinct groups. Deep learning models and image processing are used in the diagnosis process. Several strategies were used to the dermoscopy image of skin cancer in order to reduce noise and improve picture quality. By using several picture augmentation methods, the image count is also boosted. Ultimately, the process of transfer learning is used to further improve the pictures' categorization accuracy. The weighted average accuracy, recall, and F1 score of our CNN model were 0.88, 0.74, and 0.77, respectively. With the use of the ResNet model, the transfer learning strategy produced an accuracy of 90.51%.
[7] Rezaoana, et al. (2020, December): The article proposes an automated technique for the categorization of skin cancer. In this research, nine different forms of skin cancer have been classified. Furthermore, the capabilities and efficacy of deep convolutional neural networks (CNNs) are noted. Nine clinical forms of skin cancer are included in the dataset: nevus, squamous cell carcinoma, actinic keratosis, benign keratosis, basal cell carcinoma, dermatofibroma, melanoma, and vascular lesions. The goal is to create a model using a convolution neural network that can both diagnose and categorize skin cancer into different classifications. Deep learning and image processing concepts are used in the diagnosis process. The quantity of photos has also increased by using various image enhancement techniques. Lastly, the accuracy of the classification tasks is increased even more by using the transfer learning technique. The suggested CNN approach yields around 0.76 weighted average precision, 0.78 weighted average recall, 0.76 weighted average f1-score, and 79.45 percent accuracy.
In December 2020, Sedigh et al. published a study introducing a Convolutional Neural Network (CNN) for the detection of skin cancer. The International Skin Imaging Collaboration (ISIC) provided the 97 members of the primary database, which is utilized to train the CNN algorithm. Of them, 50 are benign and the remaining 47 are malignant. To make up for the paucity of data needed to train the proposed CNN algorithm, a Generative Adversarial Network (GAN) is made to create artificial pictures of skin cancer. Without the generated synthetic pictures, the planned trained CNN's classification performance is close to 53%; however, the model's performance rises to 71% when the synthetic photos are added to the main database.
[9] Hartanto et al. (September, 2020). This study presents the implementation of the Faster R-CNN and MobileNet v2 algorithms on an Android-based skin cancer detection application. Both of the suggested designs underwent image recognition training to identify targets for melanoma and actinic keratosis. The 600 photos in the dataset were separated into two groups based only on the kind of cancer: melanoma and actinic keratosis. Gender, age, or other variables were not taken into consideration. An Android app was created for this research in order to identify skin cancer using the camera on a smartphone. MobileNet v2 and Faster R-CNN models were used to create an intelligent screening system. This research used the Android camera and the Jupyter notebook as two testing approaches. According to the experiment's findings, MobileNet v2 and Faster R-CNN both achieved excellent accuracy when tested using Jupyter and on smartphones.
[10] Fu'adah, et al. ((2020, December).) The system designed in this work used a convolutional neural network (CNN) to automatically detect lesions from benign tumors and skin cancer. The three hidden layers in the suggested model have respective output channels of 16, 32, and 64. With a learning rate of 0.001, the suggested model makes use of many optimizers, including SGD, RMSprop, Adam, and Nadam. When it comes to classifying the skin lesions from the ISIC dataset into four categories—dermatofibroma, nevus pigmentosus, squamous cell carcinoma, and melanoma—the Adam optimizer performs the best, with an accuracy score of 99%. The results surpass the efficacy of the current approach for classifying skin cancer.
[11] Hasan, et al. (2019, April): This work presented a machine learning and image processing-based artificial skin cancer diagnosis system. Using a feature extraction approach, the characteristics of the damaged skin cells are retrieved after the segmentation of the dermoscopic pictures. The retrieved characteristics are stratified using a convolutional neural network classifier, which is a deep learning-based technique. Using the publicly accessible data set, an accuracy of 89.5% and a training accuracy of 93.7% were attained.
[12] In 2020, Nahata. The goal of this study is to create a CNN model for skin cancer detection that can categorize different forms of the disease and aid in early detection [5]. TensorFlow and Keras will be used in the backend as Python is used to create the CNN classification model. Convolutional, dropout, pooling, and dense layers are just a few of the layers that are used to train the network in order to test and refine the model across a variety of network designs. In order to achieve early convergence, the model will also include Transfer Learning approaches. The dataset gathered from the International Skin Imaging Collaboration (ISIC) challenge archives will be used to test and train the model.
[13] M. A. Ottom. (2019). In this study, a computer model for forecasting new instances of skin cancer is constructed using deep learning (convolutional neural networks). The initial stage of this job involves preparing the picture data, which includes segmenting the photos to identify areas that are easier to analyze and identify regions of interest in digital images, as well as lowering the noise and light levels and making it simpler to identify crisp edges (boundaries) of objects. After that, a convolutional neural network model with three convolution layers, three max pooling layers, and four fully connected layers was constructed using the suggested method. Test results for the model showed promise, with an accuracy of 0.74. The outcome inspires and drives further development and investigation into the early detection of melanoma online. Consequently, a web application was created to make use of the model and provide melanoma detection online.
[14] Kassem (2020). The model for a very precise categorization of skin lesions is presented in this work. The suggested approach made use of GoogleNet pre-training and transfer learning. The model's parameters are set as starting points, and training will change them over time. The suggested model's capacity to categorize various types of skin lesions is tested using the most recent issue of the popular public challenge dataset, ISIC 2019. The eight distinct groups of skin lesions—melanoma, melanocytic nevus, basal cell carcinoma, actinic keratosis, benign keratosis, dermatofibroma, vascular lesion, and squamous cell carcinoma—were correctly categorized using the suggested model. There has been a 94.92% classification accuracy, 79.8% sensitivity, 97% specificity, and 80.36% precision, respectively. pictures that are categorized as unknown pictures because they do not fit into any of the eight classifications may be detected using the suggested model.
[15] Pham et al. (March 2018). The two main contributions of this work are as follows: first, we suggest a classification model that uses Deep CNN and data augmentation to enhance the performance of skin lesion classification. Second, we show how to employ augmented picture data to get over the data restriction issue and investigate how the performance of various classifiers is affected by varying numbers of enhanced samples. With 600 testing photos and 6,162 training images, the biggest public skin lesion testing dataset is used to assess the suggested classification method. AUC (89.2% vs. 87.4%), AP (73.9% vs. 71.5%), and ACC (89.0% vs. 87.2%) are stored with the new state-of-the-art performance result. Furthermore, we investigate the impact of every image augmentation on the three classifiers and find that the performance of each classifier is affected differently by each augmentation, yielding superior outcomes when compared to conventional techniques. Therefore, it is proposed that data augmentation might further enhance the performance of medial image classification and skin cancer classification.
[16] Younis et al. (December 2019). In this study, we offer an effective deep learning method for skin cancer classification. Using the HAM1000 skin lesion dataset, we fine-tuned the pre-trained MobileNet convolution neural network. Excellent category accuracy has been shown by this transfer learning technique; the weighted average of precision and recall is 0.97, 0.90, and 0.91, respectively. This type is dependable, quick, and lightweight. Dermatologists will find it beneficial to diagnose skin cancer early on. [17] Daghrir, J. et al (2020, September). In this article, we provide a hybrid approach that may be used to any suspicious lesion in order to diagnose melanoma skin cancer. Our suggested approach is based on the prediction of three distinct techniques: two traditional machine learning classifiers and a convolutional neural network, which were trained using a collection of characteristics that describe the boundaries, texture, and color of a skin lesion. Then, by means of majority vote, these techniques are blended to enhance their performances. According to the tests, the maximum accuracy level may be achieved by combining the three methods. [18] Khan, et al (2019). In this study, we offer an intelligent system that uses cutting-edge image processing methods to identify and differentiate nevus from melanoma. The obtained photos' skin lesion is first cleaned up of noise using a Gaussian filter, and then the lesion is segmented out using enhanced K-mean clustering. Textural and color characteristics are extracted from the lesion to produce a unique hybrid superfeature vector. Skin cancer is classified as either nevus or melanoma using support vector machines (SVMs). Our objectives are to evaluate the suggested segmentation technique's efficacy, identify the best characteristics, and contrast the classification outcomes with those of other methods found in the literature. The DERMIS dataset, which contains 397 skin cancer pictures total—146 of which are melanoma and 251 of which are nevus skin lesions—is used to evaluate the suggested technique. With a 96% accuracy rate, our suggested technique yields promising results. [19] Chaturvedi, Et al (2020). In this study, we offer an incredibly accurate automated computer-aided diagnostic approach for multi-class skin (MCS) cancer categorization. For MCS cancer classification, the suggested approach fared better than both modern deep learning techniques and skilled dermatologists. We fine-tuned the HAM10000 dataset across seven classes and carried out a comparison analysis to evaluate the effectiveness of four ensemble models and five pre-trained convolutional neural networks (CNNs). This research reports the greatest accuracy of 92.83% for the ensemble model and 93.20% for the individual model among the collection of models. Because of ResNeXt101's improved design and potential for increased accuracy, we suggest using it for MCS cancer categorization.
[20] Pacheco et al. (2020) In this study, we provide a method to close this gap. Firstly, we provide a novel dataset consisting of patient-related clinical data and clinical photos that were taken using cellphones. Next, we provide a simple approach to fuse features from clinical data and photos using an aggregation process in popular deep learning models. Finally, we conduct tests to compare the performance of the models with and without this process. Applying the aggregation approach improves balancing accuracy by around 7%, according to the data. Overall, clinical data have a major influence on model performance, demonstrating the significance of including these variables for automated skin cancer identification.
CNN networks
In order to create a deep learning network model that may increase the accuracy of leukemia blood cancer detection, this part reviews pertinent studies. Both the basic CNN networks and their many architectural configurations are covered. CNNs are among the best learning algorithms for comprehending visual material, showing impressive results in image segmentation, classification, detection, and retrieval. Outside of academics, people are curious about CNNs because of their success. Numerous companies, including Google, Microsoft, AT&T, NEC, and Facebook, have established active research groups to examine innovative CNN architectures. Nowadays, most of the top competitors in image processing and computer vision (CV) events use deep CNN-primarily based models. CNN's ability to apply spatial or temporal correlation in data is one of its most alluring features. CNN is divided into many learning stages, each including subsampling layers, convolutional layers, and nonlinear processing units. CNN is a feedforward multilayered hierarchical network in which each layer performs many transformations using a financial institution of convolutional kernels. Convolutional mapping facilitates the extraction of advantageous homes from spatially co-located record points. Following the assignment of the convolutional kernels' output to the non-linear processing unit (activation function), non-linearity is embedded into the function space and helps with take-a-take abstractions. Semantic changes in pictures are easier to assess because of this nonlinearity, which influences different activation patterns for different responses. The output of a non-linear activation characteristic is usually shown by subsampling, which also renders the input geometrically invariant and helps to summarize the effects. The need for a separate characteristic extractor is eliminated by CNN's ability to automatically extract functions. Consequently, CNN is also capable of appropriately expanding inner representations from raw pixels even in the absence of extensive processing. CNN is capable of multitasking, automated characteristic extraction, weight sharing, and hierarchical learning.
Figure 1.
The basic CNN architecture. (source-google).
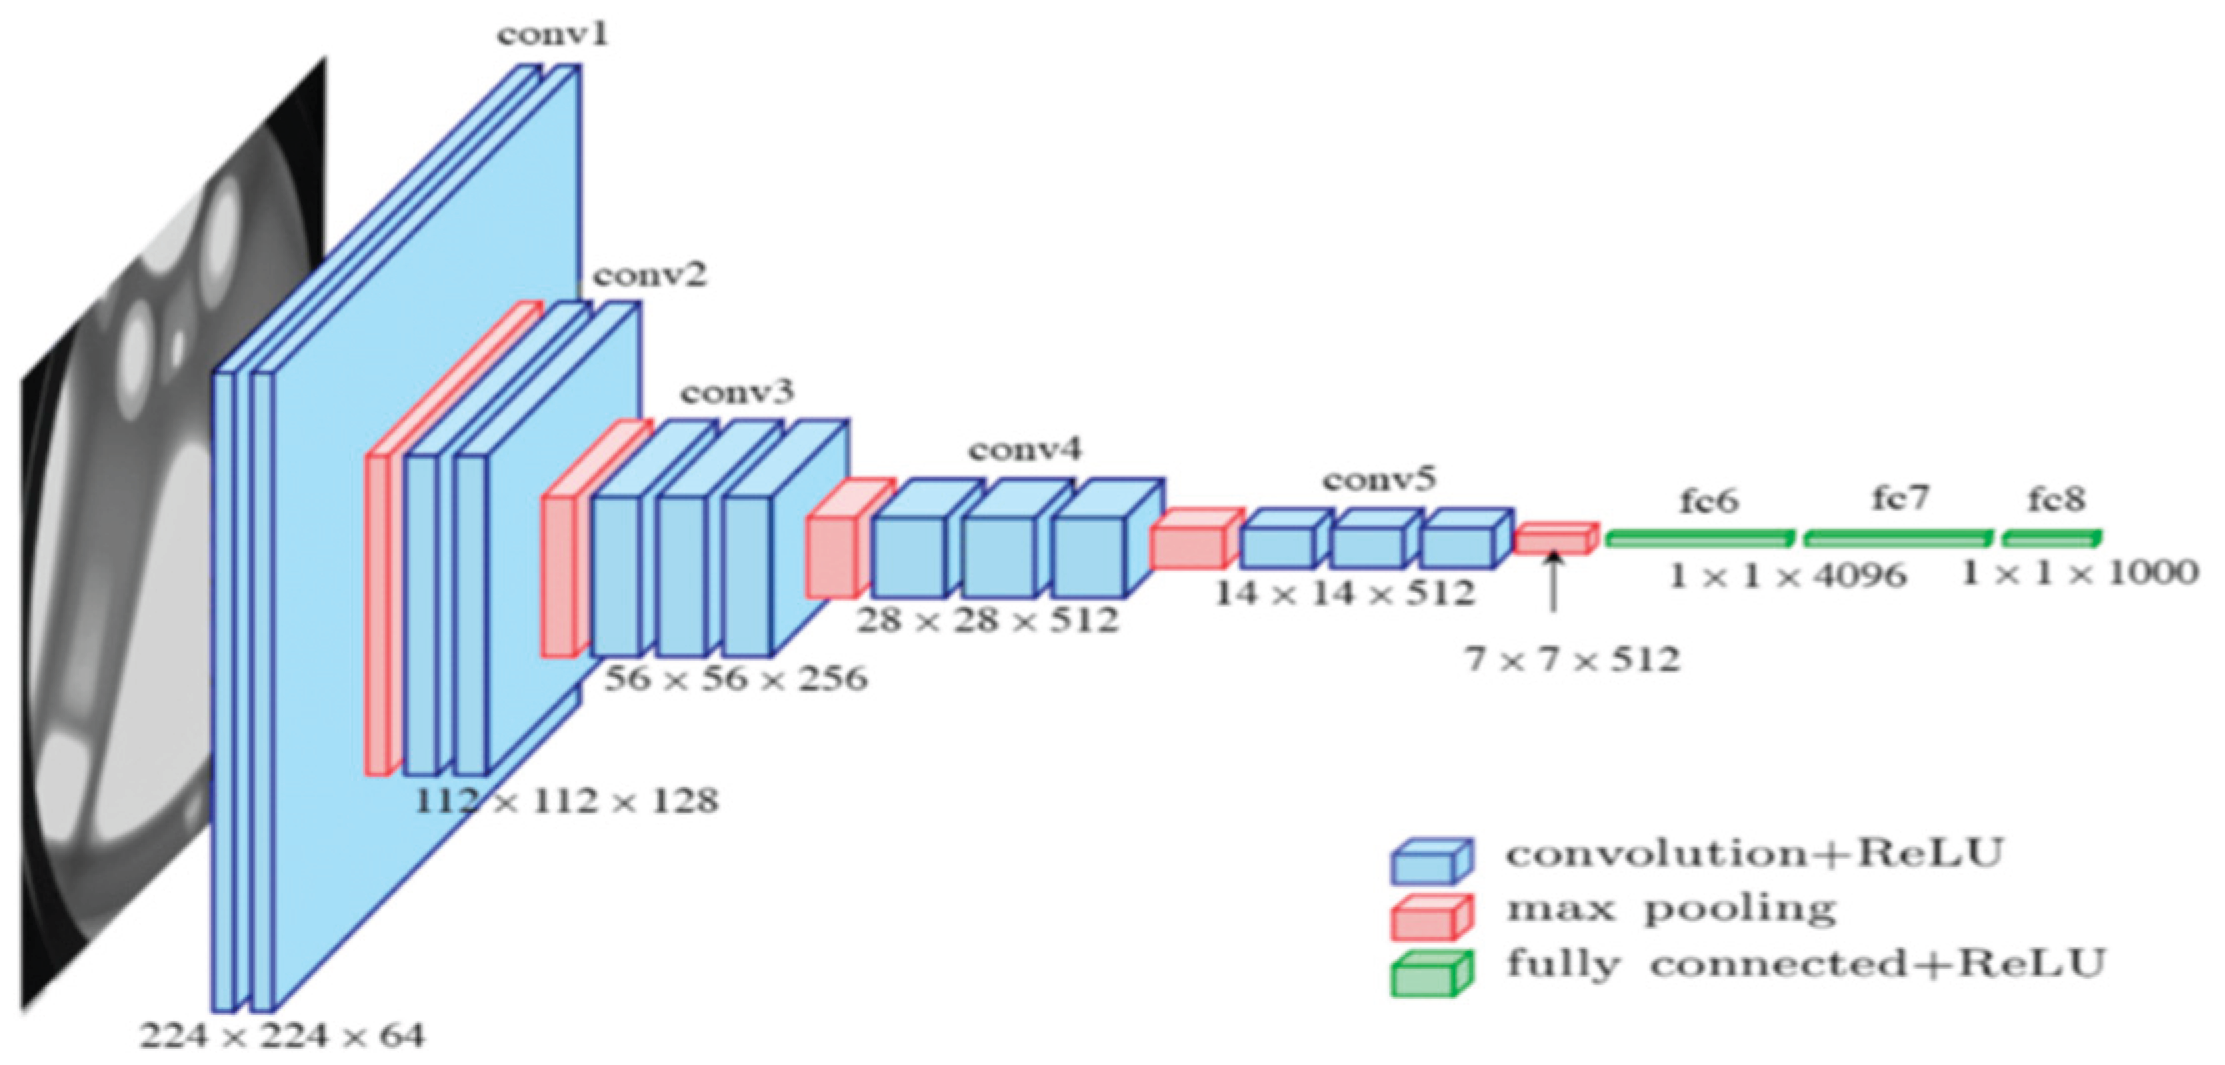
Table 1 provides an evaluation of the most common CNN designs, but it also lists the maximum popular CNN architectures.
Inception V3
Inception V3 is the third iteration of Google's Deep Learning Evolutionary Architectures series. Images having a resolution of 299 by 299 pixels are accepted by the input layer of the 42-layer Inception V3 architecture, which incorporates the Softmax function in the last layer. [17] DenseNet was first proposed as an extension of ResNet by Facebook's Huang et al. in 2016 [18]. A 201-layer convolutional neural network makes up the structure. Deep architecture, which continually concatenates feature maps from one layer to another across the network, has been demonstrated to be advantageous for classification tasks. The network allowed a pretrained version to be used, which was trained on more than a million images from the ImageNet database. The pretrained network can classify images of 1000 distinct object categories, such as a keyboard, mouse, pencil, and various animals [19].
Figure 2.
Inception V3 Schematic Representation. (Source-Google).

DenseNet-201
A 201-layer convolutional neural network is called the DenseNet-201. A pre-trained version of the network, trained on more than a million photographs, may be loaded using the ImageNet database. Consequently, for a wide range of images, the network has learned multiple rich feature representations. The size of the photo input on the network is 224 × 224 pixels. Since DenseNet concatenates all feature maps from prior layers, all feature maps propagate to subsequent layers and are related to newly produced feature maps. Benefits of the recently developed DenseNet include feature reuse and a decreased chance of gradient vanishing or bursting. However, the following adjustments need to be made in order for DenseNet's structure to function, namely downsampling the feature maps in order to enable concatenation. If the feature maps' sizes alter, it will be unable to apply the concatenation process. It is claimed that the MobileNetV2, ResNet50, and NASNet architectures are inferior than the DenseNet-121 architecture [28].
ResNet
The primary novelty of ResNet topologies is the use of lingering layers and skip impacts to get over the issue of vanishing inclination, which can cause the weights in the network to stop updating or changing. Deep networks face a problem when multiple chain rules are executed one after the other because the gradient's value may disappear, or drop to zero. When connections are skipped, Gradians flow retrogrades instantly from end layers to start layer filters, enabling CNN models to stretch up to 152 layers.
MobileNetV2
A CNN design called MobileNetV2 aims to maximize the efficiency of mobile devices. Its foundation is an inverted residual structure, whose bottleneck levels are connected by residual connections. Lightweight depth-wise (Dwise) convolutions are employed by the intermediate expansion layer to filter features as a source of non-linearity. It has a fully convolutional layer with 32 filters at the beginning, and then 19 residual bottleneck layers.
Transfer learning
In transfer learning, a weighted pre-trained CNN version that has been learned on a large dataset is used. The difficulty of training a CNN from scratch, which requires a sizable classified dataset and significant processing capacity, is lessened by using a pre-trained CNN version. Using CNN as a function extractor and fine-tuning are two methods to implement switch learning. The pre-trained CNN version's weights are changed on some layers while remaining unchanged on others during fine-tuning. Because the skills obtained from the early layers are well-established and useful for a wide range of activities, those layers often retain their weights [25]. Conversely, because the subsequent layers are tailored to each dataset, they offer additional specific capabilities that could benefit from a fine-tuning approach. Conversely, CNN no longer has to be altered in order to be utilized as a function extractor. The idea behind using CNN as a function extractor is to gain access to any function within a layer, then use the functions that are encoded to train a classifier of one's choosing.
Ensemble technique
In terms of accuracy, ensemble approaches perform better than single classifier methods since they use several classifiers. Some popular ensemble techniques are stacking, bagging, and boosting. By stacking, a meta-learner algorithm can combine the outputs of a group of basic learners to provide final predictions [26]. A super learner is a technique for determining the appropriate weights of the base learners by decreasing a loss function based on the learners' cross-validated production. An ensemble's main objective is to combine several models in order to compensate for the shortcomings of a single model, producing an ensemble result (prediction and classification) that is better than anyone participating model.
Skin Cancer Detection Using CNN Based Deep Learning:
In many regions of the globe, the most frequent kind of cancer among people with light skin is skin cancer. Skin cancer is a serious public health problem due to its rising incidence, morbidity, and fatality rates. The primary causative factor for skin cancer growth is ultraviolet radiation, or UVR. Diepgen & associates [1]. A kind of cancer known as skin cancer develops in the skin tissue and may harm nearby tissue, result in disability, or possibly be fatal. Following breast and cervical cancer in Indonesia, skin cancer ranks third in terms of the most common cancer cases. The detrimental consequences of skin cancer may be reduced and controlled with an accurate diagnosis and prompt, appropriate treatment. Jianu and others [2]. Without a doubt, the most prevalent disease in humans is skin cancer, especially in the white population. The necessity for diverse treatment options has been signaled by the rising frequency of cutaneous cancers. Simões et al. [5]. Of all malignancies, skin cancer has one of the highest mortality rates. If it is not diagnosed and treated from the start, it will undoubtedly spread to other areas of the body. Most typically, it results from the skin cells' aberrant proliferation, which happens when the body is exposed to sunlight. Garg and others [6]. Among all malignancies, skin cancer is among the worst. If not identified and treated in its early stages, it is expected to spread to other body parts.Due mostly to the skin cells' quick growth, it also happens when the tissue is exposed to sunlight. Rezaoana and associates [7]. As a point of care for early cancer diagnosis, smartphone cameras may one day be developed. Giving a smartphone the capacity to identify things with signs of skin cancer is one way to use cellphones for early detection. In order to identify and categorize diseases, convolution neural networks, or CNNs, are often used. Nevertheless, the CNN approach is challenging to use on smartphones as it needs a lot of processing power and memory. The Hartanto group [9]. Skin cancer that has a high death rate is called melanoma. Because of their great degree of resemblance, the many forms of skin lesions lead to incorrect diagnoses. When skin lesions are accurately classified in their early stages, dermatologists can treat patients and perhaps save their lives. Kassam [14]. Melanoma is regarded as one of the most deadly cancers worldwide; if discovered too late, this kind of skin cancer has the potential to spread to other body areas. As a result, the adoption of automated diagnostic tools, which assist medical professionals and even laypeople in identifying a certain kind of illness, has greatly advanced the medical industry. J. Daghrir et al. [17].
Knowledge gap in skin cancer detection using CNN:
Because benign tumor lesions and skin cancer lesions have similar shapes, identifying these lesions takes a lot longer for doctors. The framework was created. Jianu and associates [2]. Even if surgical methods are still the cornerstone of care, morbidity and mortality may still be decreased with new research and creative thinking. Instead of using novel chemicals, approaches to treating skin cancer may use new technology techniques. Simões and associates [5]. Additionally, the early diagnosis of skin cancerous growths is an expensive and difficult process. It is categorized based on the kind of cell and where it grows. The categorization of lesions requires high recall and precision. Garg and associates [6]. It is feasible to develop smartphone cameras as a point of care for cancer early detection. By enabling the smartphone to identify things that exhibit indications of skin cancer, early diagnosis utilizing cellphones is accomplished. Convolution neural networks (CNNs) are often used in the identification and categorization of diseases. However, it is challenging to use the CNN technique on smartphones since it needs a huge memory and powerful processing power. et al., Hartanto [9]. The high expense of therapy, fast development rate, and high fatality rate of melanoma skin cancer have made early identification of the disease more important. The majority of the time, the cancer cells must be manually found and treated. Hasan and associates [11]. Melanoma diagnosis, or skin cancer diagnosis, is a difficult undertaking in the medical science sector because of the volume and kind of data involved. Skin cancer datasets often arrive in a variety of formats and forms, including medical photographs. As a result, preparing the data is very important before beginning the auto-diagnostic work. M. A. Ottom [13]. Occasionally, it might be challenging to differentiate it from nevus because of their similar symptoms and outward look. This illness has a greater death rate than any other consolidated malignancy associated to the skin. The number of young individuals who have instances is rising, although the survival chances increase dramatically if the disease is discovered early. It takes a great deal of money and effort for the physicians to diagnose every patient with melanoma. Khan and associates [18].
Materials and methods:
The testing for this research used Google CoLab and the Keras library. TensorFlow was utilized, since it is one of the finest Python deep learning libraries for dealing with machine learning algorithms. Every model was developed on a cloud-based Tesla GPU via training utilizing Google's Collaboratory platform. For research purposes, the Collaboratory framework provides up to 12 GB of RAM and a 360 GB GPU in the cloud.
Datasets-EN. The International Skin Imaging Collaboration (ISIC) provided 2357 pictures in this collection, which show both benign and malignant oncological disorders. Except for melanomas and moles, whose photos are somewhat predominate, all photographs were classified in accordance with the ISIC categorization, and each subgroup was split into the equal amount of images.
The data set contains the following diseases:
- o
- actinic keratosis
- o
- basal cell carcinoma
- o
- dermatofibroma
- o
- melanoma
- o
- nevus
- o
- pigmented benign keratosis
- o
- seborrheic keratosis
- o
- squamous cell carcinoma
- o
- vascular lesion
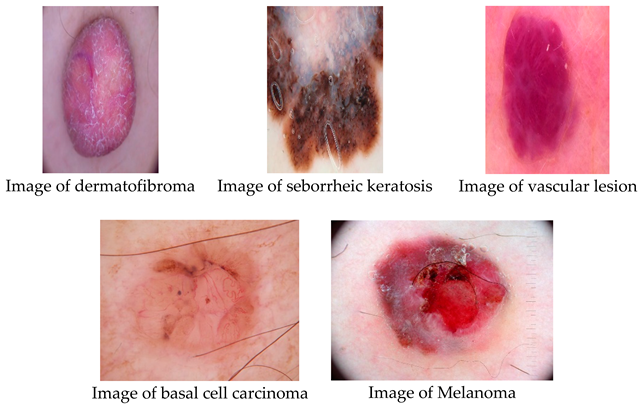
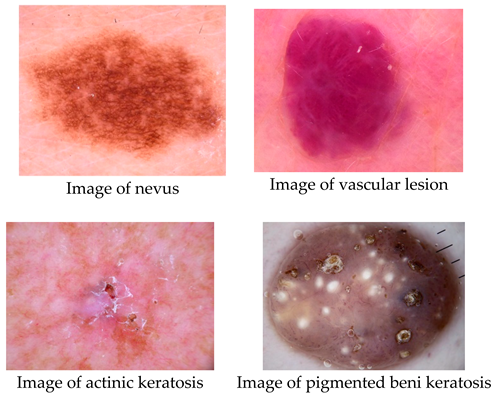
There are four distinct forms of skin cancer in the final collection, with around 2357 photos for each. The colorful pictures in the collection have a blank backdrop and come in different sizes. Table 2 shows that 70% of the original photos were divided into training sets and 30% into test sets.
Process of experiments
The suggested arrangement begins with the Because skin cancer is so common, screening may help find it while it's still curable. Because deep neural networks need more data for training and better performance, data augmentation techniques are sometimes used to address the issue of limited data. The experiment's operation is explained as follows:
1) Image Acquisition:
The skin cancer that is acute The information used to evaluate the performance of the model was supplied by Image Database. For usage in this stage, we were able to effectively get photos from the specified websites. The dataset's images were examined by hand to make sure their backgrounds were white. White backgrounds are used for images with colorful backgrounds.
2) Image Augmentation:
To enhance the picture, we are use image augmentation algorithms in this stage. Image augmentation is a method that makes it possible to add new data to an already-existing dataset while maintaining the label information of the original dataset. The objective is to provide more variety to the data collection while making sure that any added information adds value rather than just bulking it up. A model's ability to generalize and become more robust in the face of unknown data may be enhanced by using a bigger dataset. Accuracy may also be improved by applying a machine learning model to this data.
For the training data, we used data augmentation techniques to accomplish our objectives. On the other hand, position enhancement by scaling, cropping, flipping, and rotating was used, along with color enhancement through brightness, contrast, and saturation. The data augmentation approach included several other operations such as random rotations between -15 and 15 degrees, unintentional rotations of 90 degrees, bending, vertical and horizontal reversals, skateboarding, and luminous intensity conversion. With this method, each original picture was converted into ten improved images. Choosing a portion of the adjustments to apply improves a heterogeneous picture.
Each pixel value in the original and enhanced images was first normalized for this research by dividing by 255. The pictures were then resized to a common size so that any model may use them. Due to hardware limitations, we had to scale the input picture resolutions for all versions of the Xception architecture in our experiment. After some trial and error, we determined that the maximum allowable input size of 132 for training the Xception model—which has the most parameters—could be handled by our hardware resources. Consequently, the input sizes of all Xception architectural models were set to 132 132 in order to guarantee that all models were assessed under the same circumstances.
3) Training:
This phase involves creating a CNN learner model. After training a model on the provided dataset, SecrensNet152, MobileNet, VGG19, Xception, InceptionV3, and DenseNet-201 architectures were used to evaluate the model's classification accuracy. For 25 epochs (iterations) (patience = 10 iterations), Early Stopping callbacks were used to train each representation. The number of epochs in which there is no development before training is stopped is referred to as patience. The AdaGrad version of gradient descent, which uses a decaying average of partial gradients in the adaptation of the step extent for each parameter were used for faster convergence with the parameters like learning rate was set at αα = 0.0001, β1β1 = 0.9, β2β2 = 0.999 and ϵ=1×10⁻⁷ϵ=1×10⁻⁷. Stochastic Gradient Descent (SGD) with momentum and RMSProp are combined in an Adam optimizer. An analogous optimizer was applied to each of the three representations, and the models were retained as.h5 files. For MobileNet, model training takes -20 seconds (s) each epoch (iterations), whereas DenseNet-201 requires 14 seconds (s) every epoch.
The standard deviation was utilized in this research as a model performance metric since the dataset used in the experiment did not include any major imbalances. For all CNN designs, categorical cross-entropy was used as a loss task as this study involves multi-class sorting. The CNN architectures used in this work have relu as the activation function in all of the transitional levels and softmax in the final layer. The hyperparameters that were used are as follows: There were 25 epochs, a batch size of 17, a learning rate of 0.0001, and a dropout rate of 0.3. Utilizing an adaptive moment estimation (Adam) optimizer, the model weights were modified. All of the photos have already been reduced to each architecture's default picture size.
4) Classification:
In this stage, neural networks (resnet152v2, resnext101, densenet201, seresnet152, seresnext101) were employed to automatically identify cell diseases. The neural network is a well-known classifier with several practical uses, which is why it was selected as a classification tool. After the training model, a skin cancer cell detection model was developed based on the greatest probability of rate, and a SoftMax output layer was used to categorize pictures of skin cancer cells into different illness classifications.

Results
This section begins with a description of the results and ends with comparisons and debates. The results of the studies are categorized into three areas: group methods, transfer learning, and initial individual network designs. Using a trial-and-error methodology, all of the limitations are stated, and the optimal parameter values are presented.
Accuracy
Out of all lessons that are practicable, this matrix considers the total number of lessons that are accurately predicted by the competent version. Accuracy is defined as the ratio of successfully classified pictures to the total number of samples.
The number of genuine positives among all positive instances is determined by this statistic. Regarding leukemia, the model is capable to accurately identifying leukemia patients. Precision is a relevant statistic when FP prevails over FN. It is defined theoretically by the following equation:
Based on all pertinent variables, the recall metric assesses how successfully the model emphasizes patients with leukemia. Recall becomes a meaningful measure when FN defeats FP. It's computed using the equation below:
An alternative metric for classification accuracy that takes precision and recall into consideration is the F1 score. The F1-score is a synthesis of Precision and Recall as it is a harmonic mean of these two metrics. Precision reaches its maximum when it matches Recall. This statistic evaluates the overall effectiveness of the model by summing the recall and accuracy values.
One kind of table format that makes it possible to assess an algorithm's performance is a confusion matrix (CM). CM is used to illustrate significant predictive statistics, including recall, specificity, accuracy, and precision. Because they enable direct comparisons of variables like TP, FP, TN, and FN, confusion matrices are useful. Lastly, a support is the quantity of the desired class that appears in the detailed dataset. An imbalance of support in the educational data may also point to structural flaws in the classifier's stated scores, necessitating rebalancing or stratified sampling. The parts that follow provide answers to the research questions pertaining to this study.
Result of experiment 1: Original CNN performance
in Detecting Skin Cancer
This section presents the performances of the six original CNN networks: vgg19, resnet152v2, resnext101, densenet201, seresnet152, and seresnext101. First, the models' performance in terms of classification are shown. The general metrics for such models are then spoken about. collecting information on possible causes, descriptors, and places where outcomes might be improved.

Table 3.
Accuracy for Classification of Individual CNN Networks in Detecting Skin Cancer (Original CNN Networks).
Table 3.
Accuracy for Classification of Individual CNN Networks in Detecting Skin Cancer (Original CNN Networks).
| Architecture | Training Accuracy | Model Accuracy |
|---|---|---|
| VGG19 | 47% | 52% |
| resnet152v2 | 45% | 50% |
| resnext101 | 35% | 46% |
| densenet201 | 55% | 53% |
| seresnet152 | 42% | 44% |
| seresnext101 | 42% | 44% |
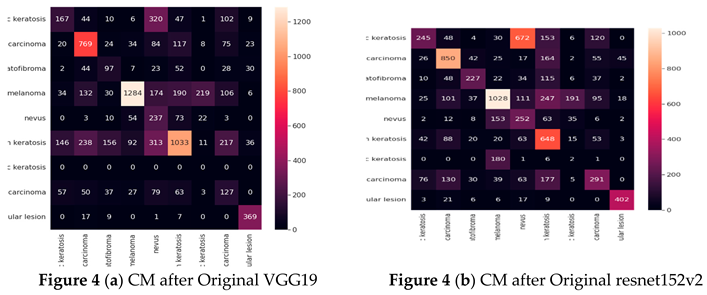
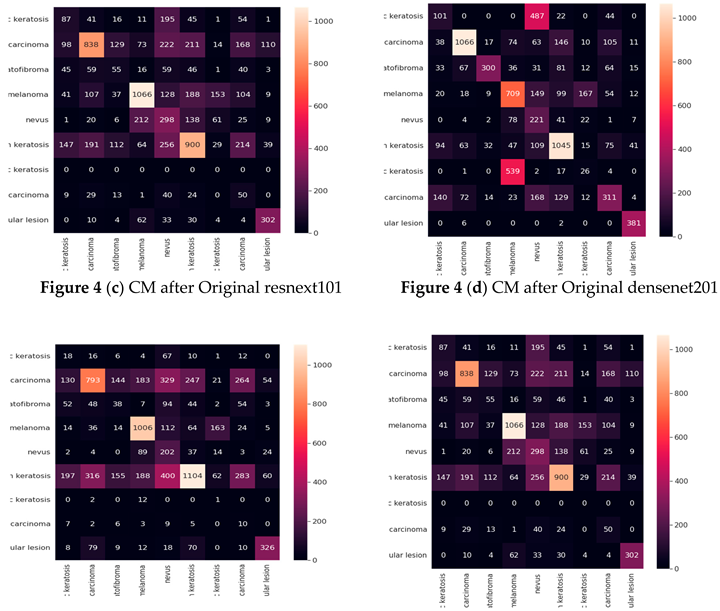
The densenet201 model had the lowest accuracy of 44%, while the vgg19, resnet152v2, resnext101, densenet201, seresnet152, and seresnext101 models had the greatest accuracy of 53%.
Table 4 presents the results of the vgg19, resnet152v2, resnext101, densenet201, seresnet152, and seresnext101 models for each class in terms of Precision, Recall, F1-score, and Specificity. The designs with the greatest performance are VGG19, DenseNet-201, and resnet152v2, when the precision settings for each on the test dataset are taken into account. The aforementioned table shows that the models VGG19, DenseNet-201, SecrensNet152, and resnet152v2 successfully categorized skin detection.
Cancer The resnext101 had the lowest identification and performed badly.
Confusion matrix (Based on the number of images)
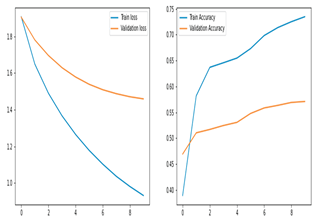
Training and Validation Accuracy and loss of Original CNN Networks
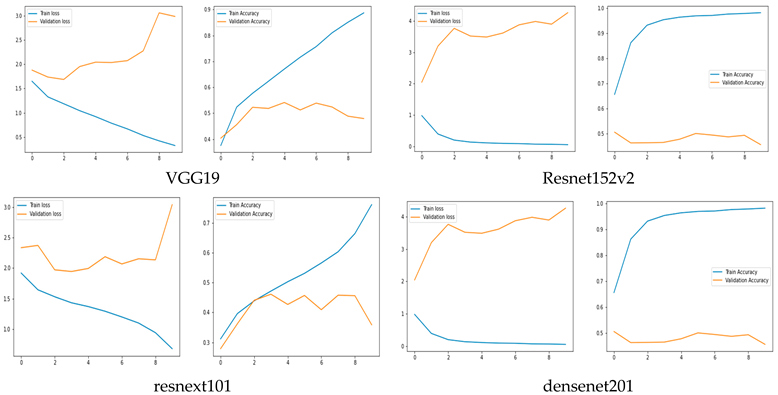
The training and validation accuracy of the original model are shown in Figure 5, where the y-axis shows the accuracy and loss percentages and the x-axis shows the number of epochs. The graphic shows a suitable separation of the training and validation data with no over-fitting.
Result of experiment 2: Transfer learning performance in Detecting skin Cancer.
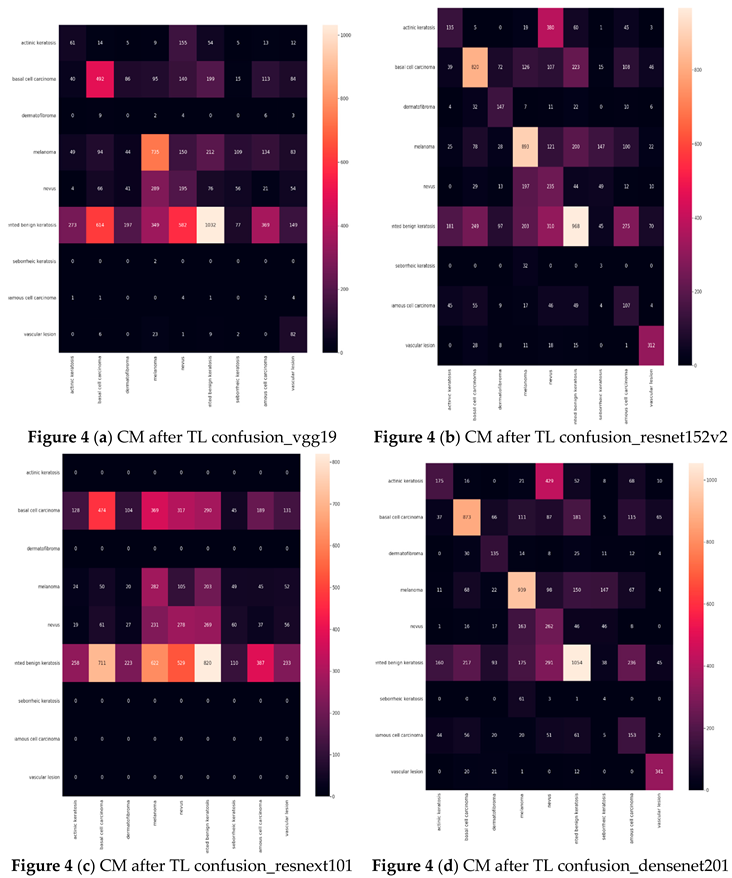
Six examples of transfer learning The performance of CNN architectures is shown in this section. Table 5 illustrates that the models with good accuracies in the test sets were vgg19, resnet152v2, resnext101, densenet201, seresnet152, and seresnext101. To calculate the test accuracies shown in Table 5, the ratio of correctly recognized samples to total samples was employed. The most accurate model was seresnet152 and densenet201, with a precision of 51%. Notable is the accuracy gain of the seresnext101 network from the original network to transfer learning.
| VGG19 | ||||
| Precision | Recall | F1-score | Support (N) | |
| actinic keratosis | 18% | 14% | 16% | 428 |
| basal cell carcinoma | 38% | 37% | 38% | 1296 |
| dermatofibroma | 00% | 00% | 00% | 373 |
| melanoma | 45% | 48% | 47% | 1504 |
| nevus | 24% | 15% | 19% | 1231 |
| pigmented benign keratosis | 28% | 65% | 39% | 1583 |
| seborrheic keratosis | 00% | 00% | 00% | 264 |
| squamous cell carcinoma | 15% | 00% | 00% | 658 |
| vascular lesion | 66% | 17% | 27% | 471 |
| resnet152v2 | ||||
| Precision | Recall | F1-score | Support (N) | |
| actinic keratosis | 20% | 31% | 25% | 429 |
| basal cell carcinoma | 52% | 63% | 57% | 1296 |
| dermatofibroma | 61% | 39% | 47% | 374 |
| melanoma | 55% | 59% | 57% | 1505 |
| nevus | 39% | 19% | 25% | 1228 |
| pigmented benign keratosis | 40% | 61% | 48% | 1581 |
| seborrheic keratosis | 08% | 01% | 02% | 264 |
| squamous cell carcinoma | 31% | 16% | 21% | 658 |
| vascular lesion | 89% | 65% | 72% | 473 |
| resnext101 | ||||
| Precision | Recall | F1-score | Support (N) | |
| actinic keratosis | 01% | 00% | 00% | 429 |
| basal cell carcinoma | 23% | 36% | 28% | 1296 |
| dermatofibroma | 00% | 00% | 00% | 374 |
| melanoma | 33% | 18% | 24% | 1504 |
| nevus | 26% | 22% | 24% | 1229 |
| pigmented benign keratosis | 21% | 51% | 29% | 1582 |
| seborrheic keratosis | 00% | 00% | 00% | 264 |
| squamous cell carcinoma | 00% | 00% | 00% | 658 |
| vascular lesion | 00% | 00% | 00% | 472 |
| Densenet201 | ||||
| Precision | Recall | F1-score | Support (N) | |
| actinic keratosis | 22% | 40% | 28% | 428 |
| basal cell carcinoma | 96% | 67% | 61% | 1296 |
| dermatofibroma | 56% | 36% | 44% | 374 |
| melanoma | 62% | 62% | 62% | 1505 |
| nevus | 46% | 21% | 29% | 1229 |
| pigmented benign keratosis | 45% | 66% | 54% | 1582 |
| seborrheic keratosis | 05% | 01% | 02% | 264 |
| squamous cell carcinoma | 37% | 23% | 28% | 669 |
| vascular lesion | 86% | 72% | 78% | 471 |
| seresnet152 | ||||
| Precision | Recall | F1-score | Support (N) | |
| actinic keratosis | 22% | 41% | 29% | 428 |
| basal cell carcinoma | 60% | 61% | 60% | 1298 |
| dermatofibroma | 54% | 31% | 39% | 370 |
| melanoma | 62% | 66% | 64% | 1505 |
| nevus | 46% | 20% | 28% | 1231 |
| pigmented benign keratosis | 46% | 70% | 56% | 1581 |
| seborrheic keratosis | 01% | 00% | 00% | 264 |
| squamous cell carcinoma | 36% | 28% | 31% | 659 |
| vascular lesion | 90% | 72% | 80% | 472 |
| seresnext101 | ||||
| Precision | Recall | F1-score | Support (N) | |
| actinic keratosis | 20% | 38% | 26% | 428 |
| basal cell carcinoma | 55% | 63% | 69% | 1295 |
| dermatofibroma | 48% | 29% | 37% | 374 |
| melanoma | 61% | 58% | 60% | 1505 |
| nevus | 39% | 02% | 26% | 1230 |
| pigmented benign keratosis | 46% | 65% | 54% | 1561 |
| seborrheic keratosis | 05% | 01% | 01% | 264 |
| squamous cell carcinoma | 32% | 29% | 31% | 659 |
| vascular lesion | 91% | 67% | 77% | 472 |
Table 6 displays the results for Precision, Recall, F1-score, and Specificity from CNN networks that used transfer learning. A model is generally better if it has strong support, recall, and precision. The study data indicate that seresnet152 has a poor precision in skin cancer, scoring 90%.
Confusion matrix (CM) after Transfer Learning (TL) (Based on the number of images)
Training and Validation Accuracy and loss of TL
Result of experiment 3: Ensemble model performance in Skin Cancer
The accuracy of ensemble model called MXD (vgg19and resnet152v2) shows in Table 7.
Table 8 displays the results for Precision, Recall, F1-score, and Specificity from CNN networks using Ensemble Techniques. A model is generally better if it has strong support, recall, and precision. The study data indicate skin cancer with a 57%.
Confusion matrix (CM) after Ensemble Technique (Based on the number of images)
Training and Validation Accuracy and loss of
Ensemble Technique
3. Discussions
This study produced several significant contributions. First, four distinct types of skin cells were employed in this investigation. Second, six original CNN architectures—vgg19, resnet152v2, resnext101, densenet201, seresnet152, and seresnext101—were compared in this study. Using vgg19, resnet152v2, resnext101, densenet201, seresnet152, and seresnext101 along with an ensembled model called MXD (vgg19, resnet152v2), we compared the original CNN networks, transfer learning, and ensemble technique on vgg19, resnet152v2, resnext101, densenet201, seresnet152, and seresnext101. According to the study, the assembling framework has the best accuracy (57%), for diagnosing skin cancer.
Does the Ensemble Technique Improve Accuracy?
This study's ensemble stack is built on the unique original CNN models, resnet152v2 and vgg19. We used a transfer learning mechanism to improve the training method. Furthermore, the output of those models was sent to a post-processing block that included a final logits layer for picture classification and a fully related layer that was monitored by a dropout layer. We employed an early-preventing strategy that stops the training process after the learning rate is decayed five times, as well as a learning rate decaying approach that divided the learning rate through 10 only while the loss stopped lowering for three continuous epochs to improve the convergence of our models.
With Early Stopping callbacks, all of the models have been trained for 250 epochs (patience = 10 epochs). For faster convergence, the Adam optimizer—a combination of SGD with momentum and RMSProp—was used, with the following parameters: learning rate αα = 0.0001, β1β1 = 0.9, β2β2 = 0.999, and ϵ=1×10⁻⁷ϵ=1×10⁻⁷. All three models use the same optimizer, and then they are saved as.h5 files. The training time of the models is 31 s/epoch for vgg19 and 17 s/epoch for each resnet152v2 model. The progressive increase in the loss function (for each training and validation epoch) for the two models, vgg19 and resnet152v2, was shown in Figure 10. The ensemble model fared better than the original CNN architecture (vgg19 and resnet152v2), with an accuracy of 57%.
As can be shown in Table 6, the algorithm's accuracy on enfeebling reveals that it scored 57% on Benign, compared to 60% for transfer learning and 47% for the original CNN model. The F1 score had the lowest accuracy out of all of them. The accuracy, recall, f1, and support of CNN networks while using the ensemble are shown in Table 7.
contributions of This Research
This study produced several significant contributions. Initially, nine distinct types of skin cells were employed in this investigation. Second, six original CNN architectures—VGG19, resnet152v2, resnext101, densenet201, seresnet152, and seresnext101—were compared in this study. Finally, we used vgg19, resnet152v2, resnext101, densenet201, seresnet152, and seresnext101, as well as an ensembled model called MXD (vgg19, resnet152v2) to compare the original CNN networks, transfer learning, and ensemble technique on SecrensNet152, MobileNet, VGG19, Xception, Inceptionv3, and Dense-net201. According to the data, the assembling framework has the best accuracy (57%), when it comes to skin cancer.
The ResNet50 architecture (Kaldera et al. 2019) was developed to address the degradation problem and the issue of numerous nonlinear layers learning identity maps. It was the winner of the ILSVRC-2015 competition in 2015. A network in network design called ResNet50 is built using several stacked residual units. The network is constructed using residual units as building pieces. The ResNet50 block diagram is shown below.
Conclusion and Future Research
Skin cancer arises from the unchecked growth of abnormal cells in the epidermis, the outermost layer of skin, caused by mutations resulting from unrepaired DNA damage. Due to these alterations, skin cells proliferate uncontrollably and develop into malignant tumors. The four main types of skin cancer are basal cell carcinoma, squamous cell carcinoma, melanoma, and nicoell cell carcinoma (MCC).In terms of average accuracy and average precision measurements, the MXD model outperformed rival CNN architectures on both the original and supplemented datasets. There are some limitations that need to be addressed in future research at this stage of the investigation. The study's trials are limited by the usage of free resources (Google Colab). Because Google Colab only provides the server for a short time, hyperparameter tuning, basis model training on databases other than Imagenet (this study used Imagenet as the base database), and the use of Adadelta, FTRL, NAdam, Adadelta, and other optimizers were not included in this research. Another issue is that rather than using primary data that was gathered straight from the fields, the research made use of publicly available secondary data. When creating models with little datasets, the testing and observations discussed here are crucial. This research shown that the most accurate model for identifying skin cancer was the ensemble MXD model, which was derived from vgg19, resnet152v2, and changed into. The efficacy of the proposed architecture was compared with six state-of-the-art individual CNN implementations and switch learning. Both the original and enhanced versions of the image dataset were used in the research. On all of the original and more useful datasets, the MXD model was shown to have better average accuracy and average precision than any current CNN designs. With the use of massive amounts of data and powerful computing power, we hope to be able to predict the future and provide exact outcomes. Performance as a whole and the number of frames per second will rise with more processing power.
References
- Diepgen, T. L., & Mahler, V. (2002). The epidemiology of skin cancer. British Journal of Dermatology, 146, 1-6.
- Jianu, S. R. S., Ichim, L., & Popescu, D. (2019, March). Automatic diagnosis of skin cancer using neural networks. In 2019 11th International Symposium on Advanced Topics in Electrical Engineering (ATEE) (pp. 1-4). IEEE.
- Apalla, Z., Lallas, A., Sotiriou, E., Lazaridou, E., & Ioannides, D. (2017). Epidemiological trends in skin cancer. Dermatology practical & conceptual, 7(2), 1. [CrossRef]
- Leffell, D. J., & Brash, D. E. (1996). Sunlight and skin cancer. Scientific American, 275(1), 52-59. [CrossRef]
- Simões, M. F., Sousa, J. S., & Pais, A. C. (2015). Skin cancer and new treatment perspectives: A review. Cancer letters, 357(1), 8-42. [CrossRef]
- Garg, R., Maheshwari, S., & Shukla, A. (2021). Decision support system for detection and classification of skin cancer using CNN. In Innovations in Computational Intelligence and Computer Vision (pp. 578-586). Springer, Singapore.
- Rezaoana, N., Hossain, M. S., & Andersson, K. (2020, December). Detection and classification of skin cancer by using a parallel CNN model. In 2020 IEEE International Women in Engineering (WIE) Conference on Electrical and Computer Engineering (WIECON-ECE) (pp. 380-386). IEEE.
- Sedigh, P., Sadeghian, R., & Masouleh, M. T. (2019, November). Generating synthetic medical images by using GAN to improve CNN performance in skin cancer classification. In 2019 7th International Conference on Robotics and Mechatronics (ICRoM) (pp. 497-502). IEEE.
- Hartanto, C. A., & Wibowo, A. (2020, September). Development of mobile skin cancer detection using faster R-CNN and MobileNet v2 model. In 2020 7th International Conference on Information Technology, Computer, and Electrical Engineering (ICITACEE) (pp. 58-63). IEEE.
- Fu’adah, Y. N., Pratiwi, N. C., Pramudito, M. A., & Ibrahim, N. (2020, December). Convolutional neural network (cnn) for automatic skin cancer classification system. In IOP Conference Series: Materials Science and Engineering (Vol. 982, No. 1, p. 012005). IOP Publishing.
- Hasan, M., Barman, S. D., Islam, S., & Reza, A. W. (2019, April). Skin cancer detection using convolutional neural network. In Proceedings of the 2019 5th international conference on computing and artificial intelligence (pp. 254-258).
- Nahata, H., & Singh, S. P. (2020). Deep learning solutions for skin cancer detection and diagnosis. In Machine Learning with Health Care Perspective (pp. 159-182). Springer, Cham.
- Ottom, M. A. (2019). Convolutional neural network for diagnosing skin cancer. International Journal of Advanced Computer Science and Applications, 10(7).
- Kassem, M. A., Hosny, K. M., & Fouad, M. M. (2020). Skin lesions classification into eight classes for ISIC 2019 using deep convolutional neural network and transfer learning. IEEE Access, 8, 114822-114832. [CrossRef]
- Pham, T. C., Luong, C. M., Visani, M., & Hoang, V. D. (2018, March). Deep CNN and data augmentation for skin lesion classification. In Asian Conference on Intelligent Information and Database Systems (pp. 573-582). Springer, Cham.
- Younis, H., Bhatti, M. H., & Azeem, M. (2019, December). Classification of skin cancer dermoscopy images using transfer learning. In 2019 15th International Conference on Emerging Technologies (ICET) (pp. 1-4). IEEE.
- Daghrir, J., Tlig, L., Bouchouicha, M., & Sayadi, M. (2020, September). Melanoma skin cancer detection using deep learning and classical machine learning techniques: A hybrid approach. In 2020 5th international conference on advanced technologies for signal and image processing (ATSIP) (pp. 1-5). IEEE.
- Khan, M. Q., Hussain, A., Rehman, S. U., Khan, U., Maqsood, M., Mehmood, K., & Khan, M. A. (2019). Classification of melanoma and nevus in digital images for diagnosis of skin cancer. IEEE Access, 7, 90132-90144. [CrossRef]
- Chaturvedi, S. S., Tembhurne, J. V., & Diwan, T. (2020). A multi-class skin Cancer classification using deep convolutional neural networks. Multimedia Tools and Applications, 79(39), 28477-28498. [CrossRef]
- Pacheco, A. G., & Krohling, R. A. (2020). The impact of patient clinical information on automated skin cancer detection. Computers in biology and medicine, 116, 103545. [CrossRef]
Table 1.
A comparison of popular CNN architectures (M= Million).
| Architecture Name | Year | Main contribution | Number of Parameters | Error Rate (%) | No of layer |
|---|---|---|---|---|---|
| VGG | 2014 | -Identical topology -Usages small size kernels |
138 M | Image-Net: 7.3 | 19 |
| InceptionV3 | 2015 | To resolve the hassle of a representational bottleneck, update large-length filters with small-length filters. | 23.6 M | Multi Crop: 3.58% Single Crop: 5.6% ImageNet: 3.5% |
159 |
| Xception | 2017 | -Convolution in terms of complexity is followed by convolution in terms of points. | 22.8 M | Image Net: 0.055% | 126 |
| Res NeXt | 2017 | -Cardinality -Similar topology -Assembled convolution |
68.1 M | CIFAR10: 3.58% CIFAR100: 17.31% Image Net: 4.4% |
29 -101 |
| Dense Net | 2017 | Cross-layer information flow | 25.6 M 25.6 M 15.3 M 15.3 M |
CIFAR-0+: 3.46% CIFAR100+: 17.8% CIFAR10: 5.19% CIFAR100: 19.64% |
190 190 250 250 |
Table 2.
Images Used in the Train, Test and Validation Sets.
| Total Images | Training Images | Validation Images | |
|---|---|---|---|
| Original Dataset | 2357 | 1650 | 707 |
Table 4.
Precision, recall, f1, and support (n) result of original cnn networks (based on the number of images, n= numbers).
Table 4.
Precision, recall, f1, and support (n) result of original cnn networks (based on the number of images, n= numbers).
| VGG19 | ||||
|---|---|---|---|---|
| Precision | Recall | F1-score | Support (N) | |
| actinic keratosis | 24% | 39% | 30% | 426 |
| basal cell carcinoma | 67% | 59% | 63% | 1297 |
| dermatofibroma | 34% | 26% | 30% | 373 |
| melanoma | 59% | 85% | 70% | 1504 |
| nevus | 59% | 19% | 29% | 1231 |
| pigmented benign keratosis | 46% | 65% | 54% | 1582 |
| seborrheic keratosis | 00% | 00% | 00% | 264 |
| squamous cell carcinoma | 29% | 19% | 23% | 658 |
| vascular lesion | 92% | 78% | 84% | 473 |
| resnet152v2 | ||||
| Precision | Recall | F1-score | Support (N) | |
| actinic keratosis | 19% | 57% | 29% | 429 |
| basal cell carcinoma | 69% | 65% | 67% | 1298 |
| dermatofibroma | 45% | 61% | 52% | 374 |
| melanoma | 55% | 68% | 61% | 1503 |
| nevus | 47% | 20% | 29% | 1230 |
| pigmented benign keratosis | 68% | 41% | 51% | 1582 |
| seborrheic keratosis | 01% | 01% | 01% | 262 |
| squamous cell carcinoma | 36% | 44% | 40% | 658 |
| vascular lesion | 87% | 85% | 86% | 472 |
| resnext101 | ||||
| Precision | Recall | F1-score | Support (N) | |
| actinic keratosis | 19% | 20% | 20% | 428 |
| basal cell carcinoma | 45% | 65% | 53% | 1295 |
| dermatofibroma | 17% | 15% | 16% | 372 |
| melanoma | 58% | 71% | 64% | 1505 |
| nevus | 39% | 24% | 30% | 1231 |
| pigmented benign keratosis | 46% | 57% | 51% | 1582 |
| seborrheic keratosis | 00% | 00% | 00% | 263 |
| squamous cell carcinoma | 30% | 08% | 12% | 659 |
| vascular lesion | 67% | 64% | 66% | 473 |
| Densenet201 | ||||
| Precision | Recall | F1-score | Support (N) | |
| actinic keratosis | 15% | 24% | 19% | 426 |
| basal cell carcinoma | 70% | 82% | 75% | 1297 |
| dermatofibroma | 47% | 80% | 59% | 374 |
| melanoma | 57% | 47% | 52% | 1506 |
| nevus | 59% | 18% | 28% | 1230 |
| pigmented benign keratosis | 69% | 66% | 67% | 1582 |
| seborrheic keratosis | 04% | 10% | 06% | 264 |
| squamous cell carcinoma | 36% | 47% | 41% | 658 |
| vascular lesion | 98% | 81% | 89% | 471 |
| seresnet152 | ||||
| Precision | Recall | F1-score | Support (N) | |
| actinic keratosis | 13% | 04% | 06% | 428 |
| basal cell carcinoma | 37% | 61% | 46% | 1296 |
| dermatofibroma | 11% | 10% | 11% | 372 |
| melanoma | 70% | 67% | 68% | 1504 |
| nevus | 54% | 16% | 25% | 1231 |
| pigmented benign keratosis | 40% | 70% | 51% | 1581 |
| seborrheic keratosis | 07% | 00% | 01% | 264 |
| squamous cell carcinoma | 24% | 02% | 03% | 660 |
| vascular lesion | 61% | 69% | 65% | 472 |
| seresnext101 | ||||
| Precision | Recall | F1-score | Support (N) | |
| actinic keratosis | 14% | 30% | 19% | 427 |
| basal cell carcinoma | 52% | 44% | 48% | 1296 |
| dermatofibroma | 30% | 18% | 23% | 373 |
| melanoma | 61% | 66% | 63% | 1505 |
| nevus | 32% | 25% | 28% | 1229 |
| pigmented benign keratosis | 43% | 63% | 51% | 1581 |
| seborrheic keratosis | 00% | 00% | 01% | 264 |
| squamous cell carcinoma | 22% | 01% | 02% | 660 |
| vascular lesion | 69% | 85% | 76% | 473 |
Table 5.
Transfer Learning CNN Network Accuracy in Detecting skin Cancer.
| Architecture | Training Accuracy | Model Accuracy |
|---|---|---|
| VGG19 | 33% | 36% |
| resnet152v2 | 47% | 47% |
| resnext101 | 23% | 24% |
| densenet201 | 51% | 52% |
| seresnet152 | 51% | 53% |
| seresnext101 | 48% | 48% |
Table 7.
Ensemble Technique (MXD) CNN Network Accuracy in Detecting Skin Cancer.
| Architecture | Training Accuracy | Model Accuracy |
|---|---|---|
| MXD Model (vgg19, resnet152v2) | 57% | 60% |
Table 8.
Precision, Recall, F1, and Specificity Result of CNN Networks with Ensemble Techniques (N = Numbers).
Table 8.
Precision, Recall, F1, and Specificity Result of CNN Networks with Ensemble Techniques (N = Numbers).
| Precision | Recall | F1-score | Support (N) | |
|---|---|---|---|---|
| actinic keratosis | 00% | 00% | 00% | 428 |
| basal cell carcinoma | 56% | 81% | 66% | 1294 |
| dermatofibroma | 71% | 63% | 67% | 373 |
| melanoma | 68% | 85% | 76% | 1507 |
| nevus | 67% | 20% | 31% | 1230 |
| pigmented benign keratosis | 44% | 75% | 55% | 1582 |
| seborrheic keratosis | 00% | 00% | 00% | 263 |
| squamous cell carcinoma | 25% | 08% | 12% | 659 |
| vascular lesion | 83% | 82% | 82% | 472 |
Disclaimer/Publisher’s Note: The statements, opinions and data contained in all publications are solely those of the individual author(s) and contributor(s) and not of MDPI and/or the editor(s). MDPI and/or the editor(s) disclaim responsibility for any injury to people or property resulting from any ideas, methods, instructions or products referred to in the content. |
© 2025 by the authors. Licensee MDPI, Basel, Switzerland. This article is an open access article distributed under the terms and conditions of the Creative Commons Attribution (CC BY) license (http://creativecommons.org/licenses/by/4.0/).
Copyright: This open access article is published under a Creative Commons CC BY 4.0 license, which permit the free download, distribution, and reuse, provided that the author and preprint are cited in any reuse.


