
Submitted:
30 May 2025
Posted:
03 June 2025
You are already at the latest version
Abstract
Obstructive sleep apnea (OSA) is a prevalent disorder linked to metabolic complications such as diabetes and cardiovascular disease. By fragmenting normal sleep architecture, OSA perturbs the growth hormone/insulin-like growth factor (GH/IGF) axis and alters circulating levels of IGF-binding proteins (IGFBPs). A prior clinical observation of elevated IGFBP4 in OSA patients motivated the present investigation in a controlled animal model. Building on the approach of Lebek et al., OSA was induced in male C57BL/6 mice (9–12 weeks old) through intralingual injection of polytetrafluoroethylene (PTFE), producing tongue hypertrophy, intermittent airway obstruction, and hypoxaemia. After 8–10 weeks, the study assessed (1) hypoxia biomarkers—including HIF-1α and VEGF expression—and (2) neurobehavioral outcomes in anxiety and cognition using the open-field and novel object recognition tests. PTFE-treated mice exhibited a significant rise in circulating IGFBP4 (23.65 ± 0.67 ng/ml) versus both baseline (20.2 ± 0.98 ng/ml) and control (19.55 ± 1.3 ng/ml) groups. Hepatic Igfbp4 mRNA was also upregulated (PTFE: 1.51 ± 0.15 vs. control: 0.92 ± 0.09; p = 0.048). Behaviorally, PTFE mice displayed heightened anxiety-like behavior and impaired object recognition, paralleling cognitive deficits reported in human OSA. These findings validate the PTFE-induced model as a tool for studying OSA-related hypoxia and neurocognitive dysfunction, and they underscore IGFBP4 as a promising biomarker and potential mediator of OSA’s systemic effects.
Keywords:
obstructive sleep apnea
; hypoxia
; OSA animal model
; IGFBP4
; biomarker
; open field test
; novel object recognition
1. Introduction
Obstructive sleep apnea (OSA) is a widespread sleep-related condition characterised by recurrent upper airway obstructions during sleep, leading to intermittent hypoxia (IH), hypercapnia, hypoxaemia, and fragmented sleep 1. Epidemiological studies reported that 24% of men and 9% of women in the adult population (30 - 60 years) are diagnosed with OSA 2. People with obesity and advancing age are at a higher risk of developing OSA, while the prevalence rises with additional risk factors like ethnicity and harmful lifestyle habits 3. One of the main OSA risk factors is obesity, whereby a higher body mass index (BMI) shows a linear positive correlation with OSA 4. This link suggests that nations with elevated obesity rates would have higher prevalence and incidence rates of OSA.
Additionally, an independent risk factor for OSA is male sex, which increases the estimated male-to-female prevalence ratio to 1.5:1; nonetheless, the underlying reasons remain elusive 5. Epidemiological reports have shown that OSA is positively linked to an increased risk of cardiovascular disease 6, metabolic dysfunction 7, and neurocognitive impairment 8-10. OSA has also been found to contribute to the development of nonalcoholic fatty liver disease 11. Recent reports provide evidence for the involvement of OSA in a range of diseases, including hypertension 12, glucose metabolism 13 , and insulin resistance 14. However, a comprehensive understanding of the pathogenic mechanisms has yet to be formulated. Although progress has been made in investigating pathophysiological mechanisms and therapeutic interventions for OSA, the pace has been relatively slow due to various challenges and limitations of disease models. Thus, OSA animal models have opened the door for replicating human-like conditions 15.
Animal models, especially rodents, have provided valuable insights into the systemic impact of OSA. The chronic intermittent hypoxia (CIH) model is widely used to mimic the hypoxic-reoxygenation cycles in OSA. Studies employing CIH in rodent models have demonstrated its association with adverse outcomes such as hypertension 16, insulin resistance 17, and endothelial dysfunction 18. This model, with others like the upper airway collapse model 19 , the New Zealand Obese (NZO) mouse model 20, and the Brachycephalic obstruction airway syndrome (BOAS) model 21, has been critical in understanding the systemic effects of intermittent hypoxia. However, they often fail to replicate the mechanical airway obstructions intrinsic to OSA 15. Other researchers utilised OSA modelling by introducing techniques such as nerve stimulation-induced airway collapse 10,22,23, pharyngeal narrowing/occlusion during central sleep apnea, and genetic modification models to study susceptibility to hypoxia 24. These approaches provide deeper insight into the complex interactions between airway mechanics and hypoxic stress.
To overcome such limitations, newer animal models have been developed to simulate spontaneous airway obstruction during sleep. Using the polytetrafluoroethylene (PTFE) injection method in C57BL/6 mice led to tongue enlargement, which mimicked human-like airway obstruction 25. Lebek et al. demonstrated that this approach replicates spontaneous apneas and highlights the associated cardiovascular implications, such as left ventricular contractile dysfunction 25. To investigate potential biomarkers for hypoxia and OSA, we utilised the spontaneous upper airway narrowing model in our study. We validated our model by examining the impact on anxiety and cognitive function and evaluated changes in specific hypoxia biomarkers. Identifying novel biomarkers linked to OSA would support early diagnosis, which would help avoid and prevent the harmful complications associated with OSA.
2. Materials and Methods
All experimental procedures conform to the guidelines and approval of the animal care committee at Dasman Diabetes Institute. The protocol was approved by the committee and the office of regulatory affairs in Dasman, Kuwait (Protocol Number: RA AM-2023-010).
2.1. Tongue Enlargement by Polytetrafluoroethylene Injection
The study included fifty-five male C57BL/6 mice aged 8 to 12 weeks (Charles River Laboratories). Due to tongue volume's significance in pharyngeal airway space 26, polytetrafluoroethylene (PTFE) was injected at the mouse tongue’s base to induce a significant tongue enlargement. Our approach was based on the protocol reported by Lebek et al. with some modifications as recommended by our veterinarian. The density of PTFE, a solid substance, is 2.1 g/ml. To make 100 μl (50% w/v), 50 mg of PTFE was reconstituted in glycerol (Sigma Aldrich). The prepared combination has 24 μl of pure PTFE in 100 μl, and it is designed to increase the volume of the tongue. Only in certain mice greater injection amounts of PTFE were used to achieve the desired bulking. Animals were randomly assigned to either the test group, which received PTFE injection into the tongue (n = 40 mice) (PTFE; 35 μm particle size; Sigma Aldrich), or the control group, comprising n = 15 mice receiving glycerol as the vehicle control injection. Animals were maintained for a total of 8-weeks. To facilitate the long follow-up observation period, we used younger animals with a mean body weight 24 g.
Before PTFE injection, animals were intraperitoneally injected with Meloxicam (5 mg/kg) combined with saline for optimal analgesia. Before the injection, the cages were placed on a heating pad with a cold spot (1/3 cold). Induction of anaesthesia was achieved with 5% isoflurane infusion into the anaesthesia chamber. Following the induction of anaesthesia, the mice were positioned supinely on a surgical plate while maintaining 1-2% isoflurane infusion to keep the animal anaesthetized. The injection procedure was performed under the microscope, where the mouse tongue was manually pulled as far as possible out of the oral cavity to allow access to the base of the tongue. About 100 μl of PTFE was injected in the tongue base at different spots of the dorsal and ventral side of the tongue using a 27-gauge cannula. Post intervention, animals were kept in a clean chamber to recover with a heat lamp (250 W) to maintain body temperature until animals regained consciousness. Injected mice were monitored for any post-intervention complications (e.g. bleeding into the tongue, infection or excessive tongue enlargement). Animals were also monitored daily for any changes in skin, food intake, movements and interaction with other littermates. Animals that showed abnormal behaviour reflecting suffering were immediately sacrificed.
Control group animals (n = 15) underwent the same procedure using glycerol (i.e. vehicle control). Upon observing anomalous behaviour in a mouse, we promptly euthanised the animal (i.e. 4 mice were sacrificed from the PTFE group). All remaining mice (36/15) had no signs of stress or pain and were tracked throughout the entire observation period of 8 weeks.
2.2. Monitoring of Daily Activity
We used PROMETHION Core metabolic cage systems (SABLE Systems International, USA) to assess the overall activity of the animals and reflect alterations in their physiological and behavioural patterns, and metabolic data analysis was conducted with Promethion Live software (version 23.0.7). Two weeks post-PTFE injection, animals’ general activity was monitored using metabolic cages, comparing PTFE-injected mice to control animals. The system was calibrated in accordance with the manufacturer's guidelines. A 24-hour experiment begins with calibrating gas analyzers (O₂ and CO₂) and flow regulators to ensure sub-0.1% measurement accuracy for respiratory quotient calculations. To mitigate acclimatisation stress, baseline gas concentrations are monitored, and animals are introduced to the metabolic cages 24 hours in advance. To monitor the XYZ-axis movement, mice were individually kept in cages equipped with standardised food hoppers, water bottles with load cells (±0.01 g resolution), and 3D infrared laser matrices (1 cm spatial resolution). To replicate the circadian rhythms of the human body, environmental compartments are pre-programmed to maintain a temperature of 22°C and 12:12 light-dark cycles. Pull-mode ventilation is employed to sustain a 2000 mL/min airflow per cage during the experiment. This airflow is synchronised with 3-minute sampling intervals via the CGF module (i.e. control-gas-flow) to capture energy expenditure, carbon dioxide production (VCO₂), and oxygen consumption (VO₂). Food access control modules and crumb-catching containers minimise caching artefacts while ensuring precise intake measurements. The system is also equipped with integrated weighing platforms to facilitate continuous body mass monitoring (±0.01 g). The Promethion Live software unifies data streams from all sensors, and raw data is automatically corrected for chamber-specific drift using baseline values. This configuration permits the simultaneous monitoring of 8 mice while ensuring 97% measurement consistency across enclosures, thereby reducing inter-individual variability in OSA hypoxia-response studies 27.
2.3. Open Field Test
In animal studies, the open-field test serves to evaluate anxiety-like behaviors and locomotor impairments potentially linked to certain chronic conditions. Anxiety levels were indicated by the time spent near walls versus the centre. The test is performed in a sound-insulated open-field box (W×L×D = 50cm×50cm×50cm) equipped with a digital camera connected to a computer and runs ANY-Maze, a video-tracking system (ANY-Maze, Stoelting Co, IL, USA). The movement of animals is captured, quantified, and analysed by ANY-Maze software. Before testing, animals were allowed to acclimate for an hour, and each animal was tested for 30 minutes. The chamber was cleaned thoroughly using 70% ethanol between sessions. The collected data include total distance travelled, number of entries to the central/open zone and duration of time spent at each zone. The same experimenter performed recordings, and animals were tested randomly.
2.4. Novel Object Recognition Test
The novel object recognition (NOR) test is employed in OSA model studies to assess cognitive deficits, particularly hippocampal-dependent recognition memory 28. The test is performed in a chamber equipped with an overhead movement-tracking digital camera, as described above. ANY-Maze software is used to set up parameters for NOR that involve defining a familiar object zone and a novel object zone in the chamber. Animals are subjected to an initial 10-minute training stage followed by a testing phase that first involves introducing a novel object with a similar texture and size to the familiar object to the chamber. The animal is allowed enough time to explore the objects, at least 20 seconds within 10 minutes. Animals not exceeding 20 seconds of exploration time are excluded from the test. The chamber was cleaned thoroughly using 70% ethanol between recordings. The software analysed the time spent exploring the objects according to the following equation:
Recognition index (RI) = time novel (TN)/(TN + time familiar (TF)), and
Discrimination index (DI) = (TN – TF)/(TN +TF)
2.5. Measurement of the Tongue Diameter
Tongue size was measured following sacrifice. This involved extracting the entire tongue without disrupting its structure, as performed for both PTFE and CTRL animals. Extracted tongues were arranged on a scaled sheet and photographed for documentation and further analysis. The following protocol was employed to analyse the size and determine the area of mouse tongue tissue using ImageJ2 (version 2.16, USA). Images were imported into Fiji/ImageJ2 and converted to 8-bit grayscale, whilst using the threshold tool and applying noise reduction enabled the differentiation of the tongue tissue from the background. The total tissue area was quantified with the analyser particles tool, and the results were converted to metric units using the scale bar reference. The same investigator took all measurements.
2.6. Isolation of RNA and Transcription into cDNA
Total RNA was extracted from tissues using TRIzol®. After tissue homogenisation, RNA was extracted and quantified, and 2 μg RNA was reverse transcribed to cDNA using a cDNA kit following manufacturer’s guidelines and stored at 4°C.
2.7. Quantification of Hypoxia Markers
The hypoxia markers HIF1α and VEGF mRNA expression levels were evaluated in tissue samples obtained from PTFE and control animals using qPCR with cDNA on the QuantStudio™ 5 (Applied Biosystems). Experiments were conducted with the following parameters: initial incubation at 50°C for 2 minutes, polymerase activation at 95°C for 10 minutes, followed by 40 cycles at 95°C for 15 seconds and 60°C for 1 minute, adhering to the manufacturer's guidelines. Pre-designed probes from Applied Biosystems were utilised to quantify HIF1α (2405063466) (Forward primer 5’ ACCCATTCCTCATCCGTCAA 3’, reverse primer 5’ AATTGAGCGGCCCAAAGTT 3’), KDM6A (2405063466) (Forward primer 5’ GTCTTGTGCGGAGATTGGAG 3’, Reverse primer 5’ CGCCGCCATTTTCTTTTCCT 3’), and GAPDH (2405063466) (Forward 5’ CCCACTCTTCCACCTTCGAT 3’, Reverse 5’ CTTGCTCAGTGTCCTTGCTG 3’).
All samples were tested in duplicates, and the mean threshold cycle (Ct) was used for the comparative Ct relative quantification analysis. The average Ct of each target was normalised to the average delta Ct (∆Ct) of the housekeeping gene GAPDH. The calculated ∆Ct was subtracted from the average ∆Ct of the control samples, yielding the delta-delta Ct value (∆∆Ct). The relative expression of each target gene was determined using the 2-∆∆Ct fold change for each target 29.
2.8. In Vitro Chemical Induction of Hypoxia
Human hepatoma cells (HepG2) were cultured, expanded and maintained in T75-cm2 polystyrene flasks with Dulbecco’s modified Eagle’s medium (DMEM) supplemented with 10% fetal calf serum, 1 mM sodium pyruvate, 10 mM HEPES, 50 μg /ml penicillin, 100 μg /ml streptomycin and incubated under 5% CO2. Cells were grown to 70% confluence, and on the day of the experiment, cells were treated with CoCl2 (150 μM)-media or a vehicle-containing media for 24 hours.
2.9. Data Analysis
Statistical analyses were determined according to the number of animals, and data are presented as mean ± standard error of the mean (SEM). To evaluate the statistical significance between the PTFE and CTRL groups, we employed an unpaired student’s t-test. GraphPad Prism 10 was employed to conduct all statistical tests to determine significance. Statistical significance was determined by two-sided P-values that were less than 0.05.
3. Results
3.1. The Effect of Hypoxia on IGFBP4 Expression In Vitro
In a previous study, we reported a significant rise in IGFBP4 levels under conditions of hypoxia in a cohort diagnosed with obesity and OSA 30. To explore IGFBP4 regulation by hypoxia in an in vitro setup, we employed HepG2 cells that were incubated under hypoxic conditions. Hypoxia was induced chemically by treating HepG2 cells with a hypoxia mimetic agent, CoCl2 (150 μM) for 6 to 48 hrs. This treatment showed a significant 4-fold increase in IGFBP4 gene expression that concurred with a 3-fold elevation in HIF1α and VEGF gene expression, confirming the induction of hypoxia (Figure 1).
3.2. In Vivo Study - Tongue Enlargement Using a Bulking Agent
Injecting the tongue of Lean male C57BL/6 mice with polytetrafluoroethylene (PTFE) caused a significant 1.6-fold increase in the tongue diameter relative to CTRL animals (Figure 2B,C). PTFE injected animals showed an increase in the total tongue area (mean = 78.41 ± 1.6 mm2, p-value <0.0001) compared to the CTRL (mean = 33.4 ± 4.7 mm2, Figure 2B). Tongue enlargement was evident after 2 weeks of PTFE injection, and PTFE polymer depots remained in the tongue for the whole follow-up period, causing a permanent tongue expansion (Figure 2A). After sacrificing the animals, we measured tongue diameter and thickness, which showed a significant and apparent difference in the tongue size and shape, comparing PTFE injected to CTRL (Figure 2B,C).
3.3. Daily Activity and Behaviour
The animals were housed in metabolic cages two weeks after the PTFE intervention to monitor their daily metabolic activity, general behaviour, and breathing/gas exchange patterns. Our data reflected comparable activity from both groups, PTFE and CTRL; however, it showed some differences in their respiratory functions reflected by the gas exchange data (Figure 3A,B). Additionally, this intervention is expected to disturb the ability of animals to consume food normally; therefore, we monitored changes in the animals’ total body weight of animals throughout the experimental period. Although tongue intervention has caused initial discomfort for the animals, our data showed insignificant differences in the gradual changes in weight gain throughout the follow-up 8-week period (Figure 3C,D).
3.4. PTFE-Treated Animals Display Anxiety-like Behaviour and Memory Impairment
To understand the impact of PTFE-treatment on animals, we explored specific cognition domains that reflect anxiety and depression, as well as learning and memory functions. We evaluated the anxiety level by performing the open field test (OFT) to analyse the animal activity level in the central zone 31,32. Our data showed that animals from the PTFE group made significantly fewer entries to the central zone (entry attempt mean = 18.68 ± 2.5, n=21) compared to the CTRL group (entry attempt mean = 56.7 ± 8.34, n = 10, Figure 4A). Additionally, they spent less time (PTFE = 4.2 ± 0.64 seconds, n= 21) in the central zone compared to the CTRL (mean = 14.4 ± 1.7 seconds, n= 10) Figure 4B. This reflected an apparent anxious-like behaviour as depicted from the representative activity trace plots for Ctrl and PTFE animals (Figure 4C). Interestingly, our data showed that the percentage of the total distance travelled by animals in both groups was comparable with no significant difference (PTFE = 60.88 ± 5.9 cm and CTRL = 59.71 ± 10.05 cm, Figure 4D). Another aspect of cognitive functions is testing the animal’s learning ability and memory, which we explored using the novel object recognition test (NOR) 33,34. Our data showed that animals from the PTFE group had impaired memory and learning ability compared to the CTRL (Figure 5). This was reflected by the fewer exploration attempts of the novel object by PTFE animals (mean = 8.6 ± 1.5 times) compared to the CTRL (mean = 15.69 ± 3.7 times, p-value = 0.042, Figure 5D). NOR results presented PTFE-treated animals with a significantly lower discrimination index value (mean = -0.043 ± 0.083, p-value = 0.016, n= 21), compared to animals from the CTRL group, mean = 0.24, ± 0.046, n= 13 (Figure 5A). Moreover, the recognition index showed significantly lower value in the PTFE group (mean = 0.478 ± 0.041, p-value = 0.0161, n= 21) than the CTRL = 0.62 ± 0.023, n = 13, Figure 5B. This suggests an impaired cognitive ability after 8 weeks of PTFE treatment that was absent from the CTRL group. We found no significant difference in the total distance travelled by animals from both groups (CTRL = 11.6 ± 1.4 cm, PTFE = 9.2 ± 0.82 cm, p-value = 0.12, Figure 5C). This indicates that animals’ mobility and locomotion were not compromised.
3.5. PTFE-Injected Animals Show a Significant Increase in the Expression of Hypoxia Marker
Hypoxia-inducible factor 1α (HIF1α) and vascular endothelial growth factor (VEGF) are important biomarkers indicating the presence of hypoxia 35,36. We assessed HIF1α and VEGF mRNA expression in the liver tissue using qPCR. Our data revealed a significant increase in HIF1α expression in the PTFE group = 1.72 ± 0.28, p = 0.044 compared to CTRL = 1.08 ± 0.08 (Figure 6A). Another marker is VEGF, which is a well-recognized hypoxia biomarker that is induced by exposure to systemic hypoxia. Pathological conditions involving hypoxia were identified to stimulate VEGF induction 37. Our data showed a significant rise in VEGF expression (mean = 1.24 ± 0.09, p = 0.042) compared to the CTRL (mean = 0.903 ± 0.08, Figure 6B). In addition to the classic hypoxia biomarkers, we examined the effect of PTFE injection on IGFBP4 as a novel biomarker previously reported for hypoxia/OSA 30.
Consistent with Alterki et al.'s 30 observation, we found a significant increase in IGFBP4 mRNA expression (PTFE = 1.51 ± 0.15, p = 0.048, Figure 6D) compared to the CTRL (mean = 0.92 ± 0.09). This indicates the effectiveness of PTFE intervention in mimicking OSA and inducing hypoxic events that elevated the expression of IGFBP4. Interestingly, IGFBP3 gene expression was significantly reduced (PTFE = 0.287 ± 0.102, p = 0.025) compared to the CTRL (mean = 0.98 ± 0.29).
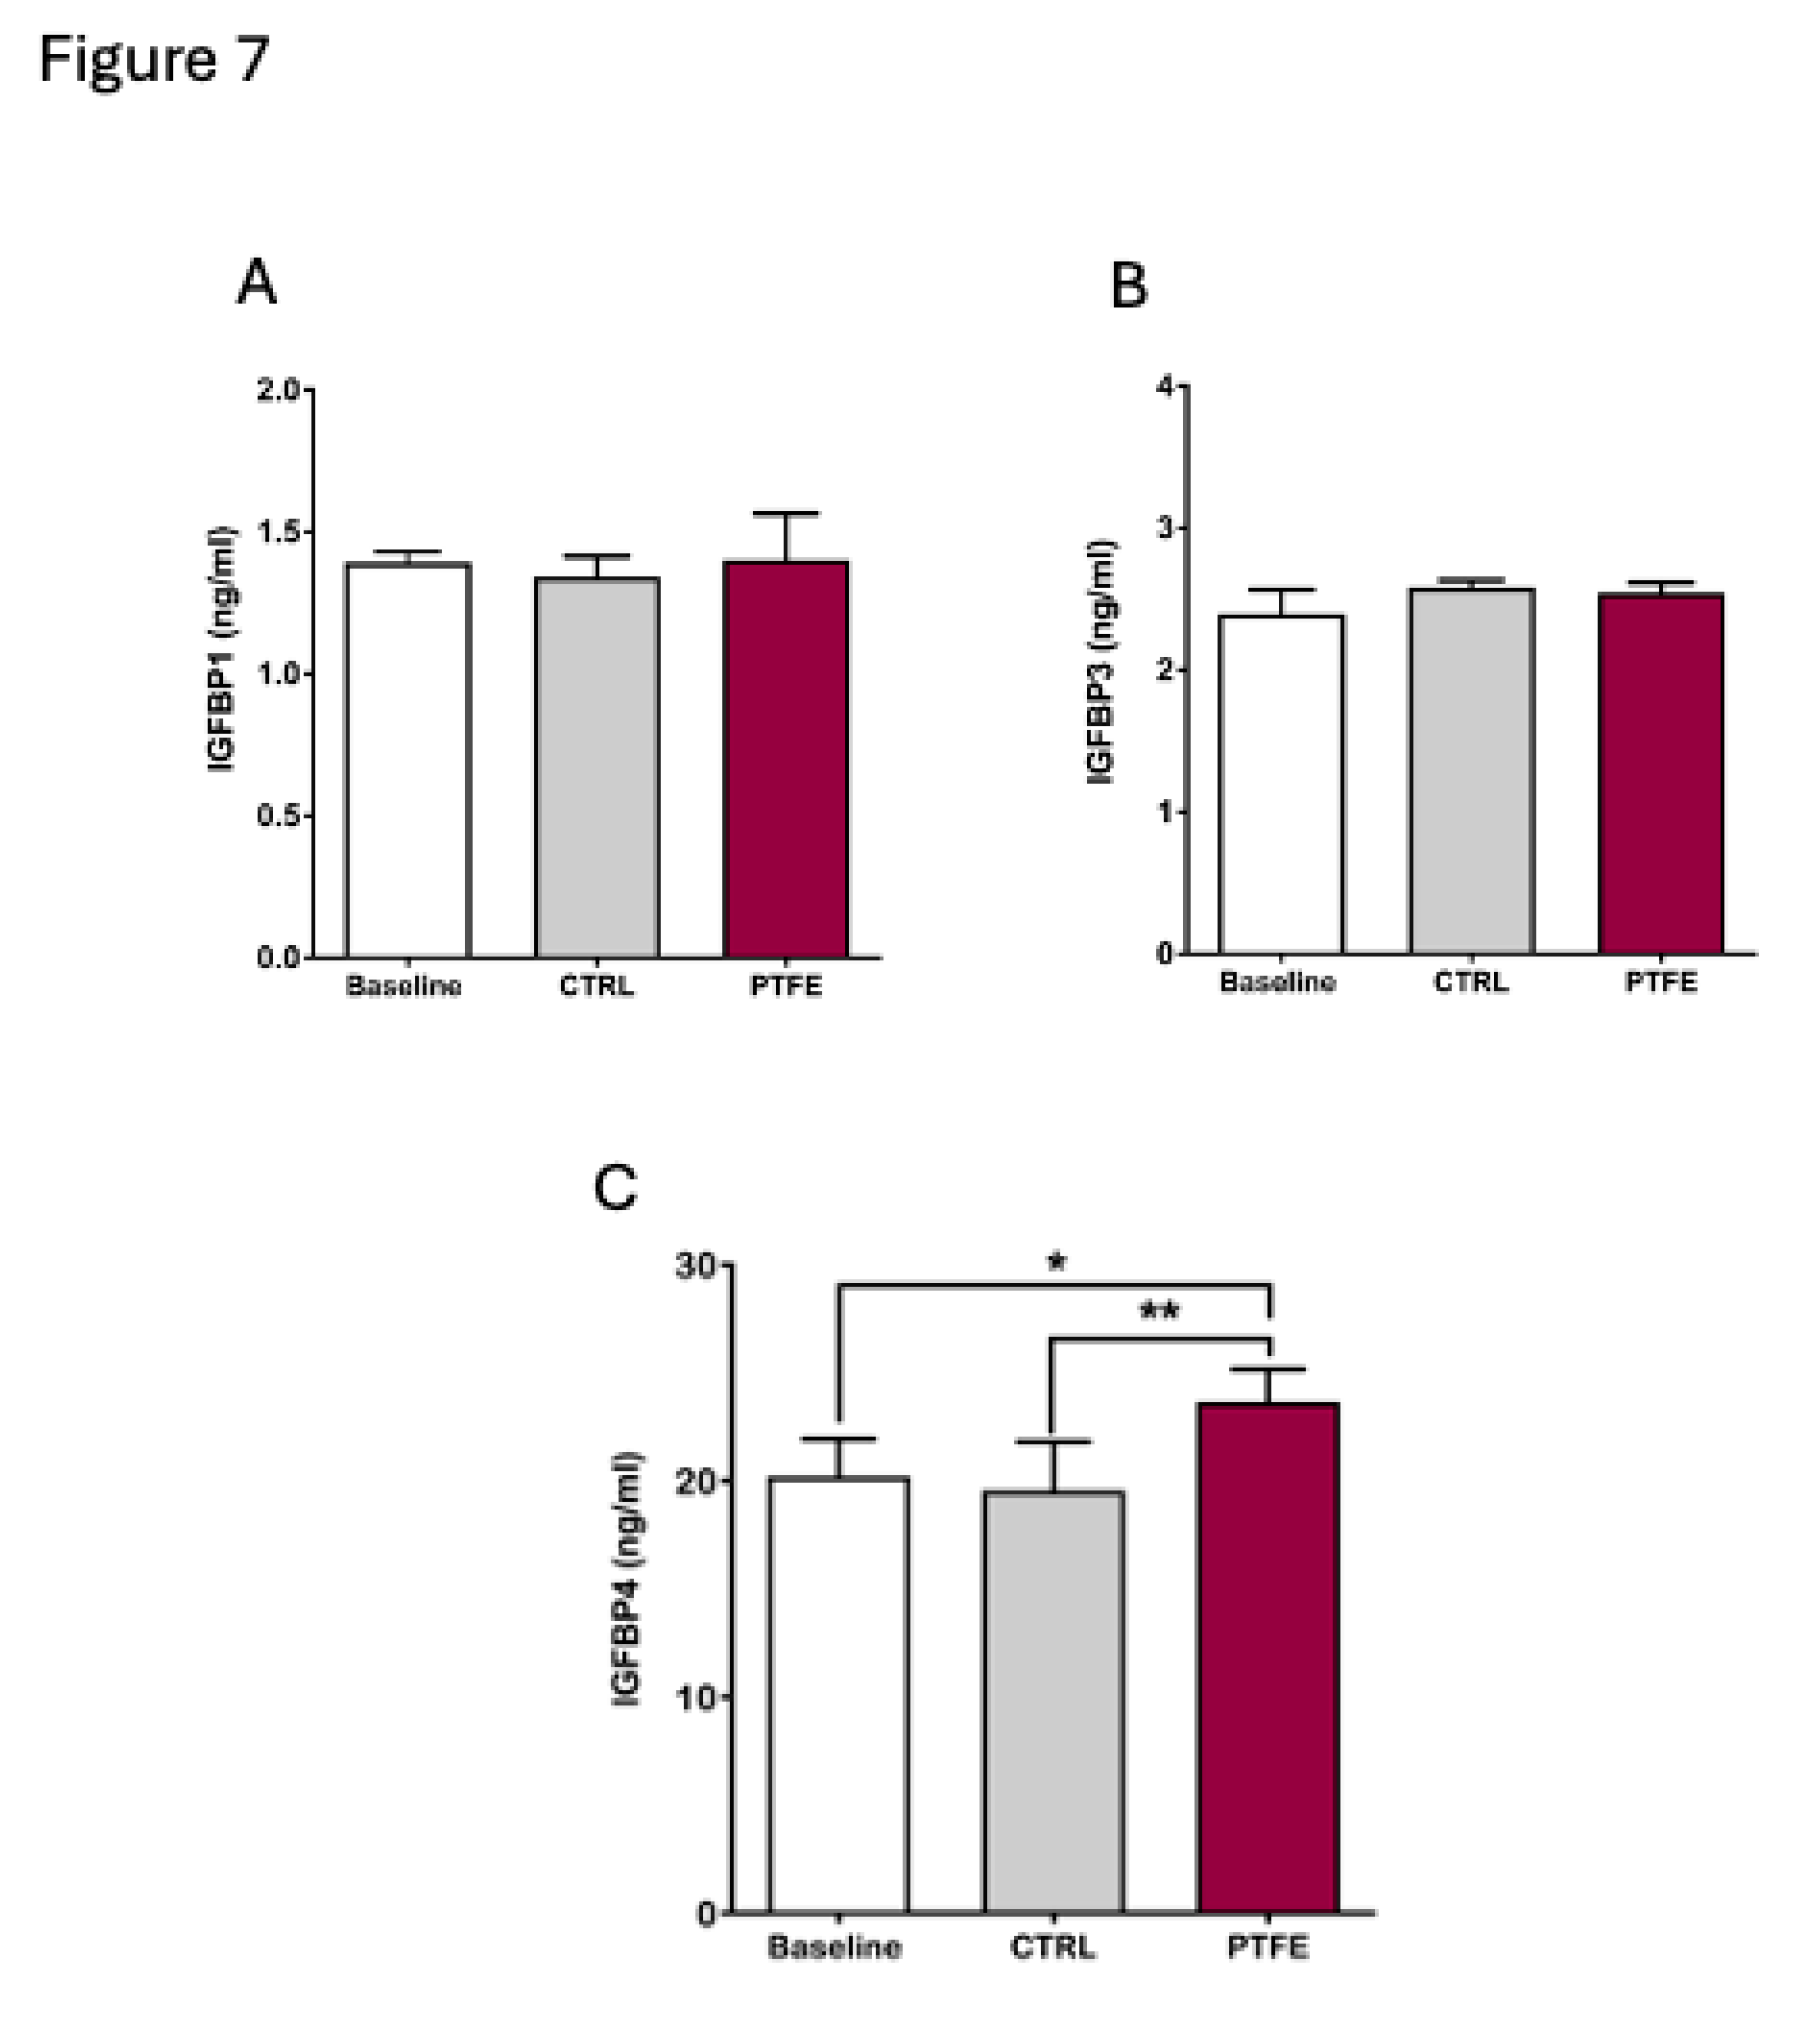
Furthermore, we analysed circulating biomarkers focusing on the IGFBP family. Blood samples were collected from animals 8 weeks post-PTFE injection. Our data showed that changes in circulating lGFBPs were specific and only affected certain proteins (Figure 7). We found no changes in circulating IGFBP1 (mean = 1.4 ± 0.07 ng/ml) and IGFPB3 (mean = 2.54 ± 0.03 ng/ml) compared to baseline (IGFBP1 =1.39 ± 0.02 ng/ml and IGFBP3 =2.4 ± 0.09 ng/ml) pre-PTFE treatment and compared to the control group, IGFBP1 = 1.34 ± 0.04 ng/ml and IGFBP3 = 2.58 ± 0.02 ng/ml (Figure 7A,B). Although circulating levels of IGFBP1 and IGFBP3 did not show a change, we found a significant increase in IGFBP4 levels after 8 weeks of PTFE treatment (mean = 23.65 ± 0.67 ng/ml) compared to both, the baseline (mean = 20.2 ± 0.98 ng/ml) and CTRL group (mean = 19.55 ± 1.3 ng/ml) (Figure 7C).
4. Discussion
In this report, we examined the efficacy of IGFBP4 as a prospective biomarker for obstructive sleep apnea utilising the PTFE OSA mouse model, as outlined by Lebek et al 25. Our results indicate a substantial elevation in circulating IGFBP4 levels and hepatic IGFBP4 gene expression in mice exposed to PTFE-induced chronic intermittent hypoxia, simulating OSA conditions. These findings collectively support our previously reported finding of IGFBP4 as a biomarker for OSA and underscore its potential role in the pathophysiological pathways contributing to OSA. The significant increase in the expression of two recognised indicators of hypoxic stress, HIF1α and VEGF, supports the strength of the hypoxia-induced physiological alterations in our current model. Moreover, employing tests like the open field and novel object recognition tests to evaluate behavioural changes indicates that exposure to chronic intermittent hypoxia detrimentally affected cognitive performance and elicited anxiety-like behaviours.
To properly utilise the OSA model, we applied several indirect yet sensitive methods to confirm hypoxia in the PTFE OSA mouse. Chronic intermittent hypoxia, a hallmark of OSA, is known to damage brain function through oxidative stress, neuroinflammation 38,39, and neuronal malfunction, leading to cognitive deficiencies and behavioural difficulties 40-42. The NOR test evaluates hippocampal-dependent memory, while the OFT assesses anxiety-like behaviours 43. Previous studies have reported that exposure to hypoxia affects crucial processes and leads to diminished performance due to disturbances in synaptic plasticity and neurotransmitter equilibrium 38,42,43. Our data showed a diminished exploration of the novel object after training in the NOR test, which signifies an impaired recognition memory. This was complemented with an elevated anxiety level that was reflected by the reduced entrance and locomotion into the central zone in the open field test, which collectively aligns with a hypoxia-induced neurocognitive impairment 38. These behavioural anomalies reflect the cognitive impairments normally seen in OSA patients, like executive dysfunction and memory deficiencies 44. Alongside evaluating changes to behavioural activity, validating molecular markers of hypoxia such as HIF1α and VEGF provides solid support for the hypoxia-induced effect in our animal model 45, thus enhancing the credibility of the used OSA animal model and its applicability as a model mimicking human OSA.
Among the IGFBP family, IGFBP4 protein is the smallest protein primarily secreted by the liver to regulate the biological effects of IGF-I and IGF-II 46. Various growth factors, hormones, and IGFBP proteinases regulate IGFBP4 expression levels across different tissues 47. Due to its regulatory role in the IGF signalling system, IGFBP4 has emerged as a potential biomarker in various pathological conditions, such as cancer 48, cardiovascular diseases 49, and metabolic disorders 50. Nonetheless, its significance in the context of OSA is still relatively unexplored. Our data demonstrate a significant increase in circulating IGFBP4 and hepatic IGFBP4 gene expression levels, indicating that IGFBP4 is potentially susceptible to hypoxic stress. This in vivo data is corroborated by our in vitro studies, whereby CoCl2-induced hypoxia in HepG2 cells caused a significant upregulation of IGFBP4 gene expression (Figure 1C) and protein expression (data not shown). This agrees with a previous study that has reported IGFBP4 upregulation under hypoxic conditions 51. This finding is consistent with our earlier report, where people with OSA had a significant increase in circulating IGFBP4 30.
In the context of angiogenesis and tumor growth, Igfbp4 gene expression was upregulated in response to hypoxia, which substantiates the role of Igfbp4 as a hypoxia-regulated gene with a potential role in controlling tumor growth 52. Recently, Sun et al. found that IGFBP4 is significantly downregulated in metastatic hepatocellular carcinoma, implicating a protective role for IGFBP4 overexpression to restrain cancer metastasis and cell migration 53. In a different context, Torres et al. demonstrated a substantial increase in serum IGFBP4 levels in people suffering from pulmonary arterial hypertension (PAH), whereby IGFBP4 was presented as a circulating prognostic biomarker and was linked to disease severity 54. Additionally, elevated expression level of IGFBP4 was detected in the atherosclerotic plaque and blood samples from people with atherosclerosis, suggesting a unique regulatory role for IGFBP4 in the plaque dynamics through KLF15/IGFBP4 axis 55. Thus, IGFBP4 appears to be involved in various processes; nevertheless, its underlying regulatory mechanisms are still elusive.
Our results present novel findings with significance in OSA research, demonstrating a connection between preclinical observations and clinical implications. The literature presents numerous biomarkers linked to OSA, including inflammatory cytokines (e.g., IL-6, TNF-α) 56, oxidative stress markers 57, and metabolic regulators (e.g., leptin); 58 however, these markers generally lack specificity to be uniquely associated with OSA. Given the established role of IGF pathways in modulating tissue repair, metabolism, and brain function 59, the relationship between IGFBP4 and IGF signalling 55 makes it an appealing candidate to elucidate the systemic effects of OSA. The findings of this study complement our earlier study on OSA patients, which presented increased serum IGFBP4 levels as a biomarker associated with disease severity 30 .
Although the simultaneous increase of HIF1α and VEGF as hypoxia biomarkers serves to validate the occurrence of CIH episodes in our PTFE-animals and CoCl2-treated HepG2 cells, it also offers mechanistic insights into the hypoxia-induced regulation of IGFBP4. HIF1α is a major transcription factor active in hypoxic settings that regulates adaptive responses like VEGF expression 35,60. Previous work suggested the possible involvement of HIF1α in regulating IGFBP4 production through direct or indirect binding to hypoxia-response element (HRE) 61,62. This idea is corroborated by in vitro research demonstrating increased IGFBP1 promoter activity under hypoxic conditions 61,63. In relation to OSA, the interaction among HIF1α and IGFBP4 may constitute a pivotal axis connecting hypoxic stress to systemic processes involving IGFBP4.
As a hepatic protein, circulating IGFBP4 is primarily produced and regulated by the liver 50. Under stressful conditions like hypoxia or inflammation, the liver as the principal source of plasma IGFBP4, responds adaptively to these systemic stimuli. We report a novel observation of an elevated expression of hepatic IGFBP4 mRNA under hypoxia. This finding highlights the liver's role in the systemic elevation of IGFBP4 during CIH. Moreover, our finding aligns with earlier studies that reported a potential role for the liver in mediating OSA-related comorbidities, including non-alcoholic fatty liver disease (NAFLD) and insulin resistance 64-66. Future work should elucidate the importance of IGFBP4 in this hypoxia-induced pathway and investigate if modulating hepatic IGFBP4 synthesis could relieve some of the negative consequences associated with OSA.
Although this OSA model confirms the value of IGFBP4 as a biomarker for OSA and offers an opportunity to replicate several characteristics of OSA, it lacks several confounding variables, such as obesity, ageing, and genetic predispositions that contribute to OSA variability in humans, which is a recognised limitation of our study. The molecular processes regulating IGFBP4 upon exposure to CIH are not elucidated and require further research. Future studies should consider pathway analyses to explore the nature of HIF1α to IGFBP4 binding and reveal the downstream signalling pathway targeted by CIH-induced IGFBP4 overexpression. In addition to the animal model-based research, longitudinal studies involving a larger cohort of OSA patients are needed to assess the specificity and accuracy of IGFBP4 as a diagnostic and prognostic biomarker for OSA. Validation of a novel biomarker like IGFBP4 may facilitate the creation of customised treatment plans to normalise IGFBP4 levels, consequently leading to an improvement reflected by OSA remission.
5. Conclusions
In conclusion, our study utilised the PTFE OSA mouse model to validate IGFBP4 as a novel and specific biomarker for OSA, connecting it to our previous clinical findings. The substantial increase in circulating IGFBP4 and hepatic IGFBP4 expression (i.e. in vivo and in vitro) highlights the biological significance of IGFBP4 in CIH-induced disease. This report presents novel findings underscoring the necessity to explore the physiological roles of IGFBP4 to enhance comprehension of its therapeutic potential, hence mitigating the detrimental effects of OSA.
Author Contributions
EA, and JA, conceptualization and study design; EA, original manuscript drafting; NA, IA and YA methodology and critical revision; YA, AS formal analysis and data curation; JA, MA, AA, MAF and FA writing—review and editing. All authors contributed to the article and approved the submitted version. All authors have read and agreed to the published version of the manuscript.
Funding
This research was funded by Kuwait Foundation for the Advancement of Sciences (KFAS), for research project (RA AM-2023-010).
Institutional Review Board Statement
The animal study protocol was approved by the animal care committee at Dasman Diabetes Institute and the committee and the office of regulatory affairs in Dasman, Kuwait (Protocol Number: RA AM-2023-010).
Informed Consent Statement
Not applicable.
Data Availability Statement
Data are available on request.
Acknowledgments
We are grateful to the Animal and Imaging facility at DDI for their invaluable contribution and continuous support in animal work. The authors would like to thank the staff at the Animal Facility for their assistance throughout this study. The corresponding author had full access to all the data in the study and had final responsibility for the decision to submit for publication.
Conflicts of Interest
The authors declare no conflicts of interest.
References
- Lévy P, Kohler M, McNicholas WT, et al. Obstructive sleep apnoea syndrome. Nature reviews Disease primers. Jun 25 2015;1:15015. [CrossRef]
- Senaratna CV, Perret JL, Lodge CJ, et al. Prevalence of obstructive sleep apnea in the general population: A systematic review. Sleep medicine reviews. Aug 2017;34:70-81. [CrossRef]
- Chen X, Wang R, Zee P, et al. Racial/Ethnic Differences in Sleep Disturbances: The Multi-Ethnic Study of Atherosclerosis (MESA). Sleep. Jun 1 2015;38(6):877-88. [CrossRef]
- Jehan S, Zizi F, Pandi-Perumal SR, et al. Obstructive Sleep Apnea and Obesity: Implications for Public Health. Sleep medicine and disorders : international journal. 2017;1(4).
- Theorell-Haglöw J, Miller CB, Bartlett DJ, Yee BJ, Openshaw HD, Grunstein RR. Gender differences in obstructive sleep apnoea, insomnia and restless legs syndrome in adults - What do we know? A clinical update. Sleep medicine reviews. Apr 2018;38:28-38. [CrossRef]
- Yeghiazarians Y, Jneid H, Tietjens JR, et al. Obstructive Sleep Apnea and Cardiovascular Disease: A Scientific Statement From the American Heart Association. Circulation. Jul 20 2021;144(3):e56-e67. [CrossRef]
- Kim DH, Kim B, Han K, Kim SW. The relationship between metabolic syndrome and obstructive sleep apnea syndrome: a nationwide population-based study. Scientific reports. Apr 22 2021;11(1):8751. [CrossRef]
- Punjabi NM. The epidemiology of adult obstructive sleep apnea. Proceedings of the American Thoracic Society. Feb 15 2008;5(2):136-43. [CrossRef]
- Dunietz GL, Chervin RD, Burke JF, Conceicao AS, Braley TJ. Obstructive sleep apnea treatment and dementia risk in older adults. Sleep. Sep 13 2021;44(9). [CrossRef]
- Lv R, Nie S, Liu Z, et al. Dysfunction in Automatic Processing of Emotional Facial Expressions in Patients with Obstructive Sleep Apnea Syndrome: An Event-Related Potential Study. Nature and science of sleep. 2020;12:637-647. [CrossRef]
- Krolow GK, Garcia E, Schoor F, Araujo FBS, Coral GP. Obstructive sleep apnea and severity of nonalcoholic fatty liver disease. European journal of gastroenterology & hepatology. Aug 1 2021;33(8):1104-1109. [CrossRef]
- Yuan F, Zhang S, Liu X, Liu Y. Correlation between obstructive sleep apnea hypopnea syndrome and hypertension: a systematic review and meta-analysis. Annals of palliative medicine. Dec 2021;10(12):12251-12261. [CrossRef]
- Wang X, Yu Q, Yue H, Zeng S, Cui F. Effect of Intermittent Hypoxia and Rimonabant on Glucose Metabolism in Rats: Involvement of Expression of GLUT4 in Skeletal Muscle. Medical science monitor : international medical journal of experimental and clinical research. Oct 27 2015;21:3252-60. [CrossRef]
- Wang X, Yu Q, Yue H, Zhang J, Zeng S, Cui F. Circulating Endocannabinoids and Insulin Resistance in Patients with Obstructive Sleep Apnea. BioMed research international. 2016;2016:9782031. [CrossRef]
- Zong S, Du P, Li H, Wang M, Xiao H. Advances in animal models of obstructive sleep apnea. Review. Frontiers in Medicine. 2023-February-07 2023;10. [CrossRef]
- Fletcher EC, Bao G, Li R. Renin Activity and Blood Pressure in Response to Chronic Episodic Hypoxia. Hypertension. 1999;34(2):309-314. [CrossRef]
- Polotsky VY, Li J, Punjabi NM, et al. Intermittent hypoxia increases insulin resistance in genetically obese mice. The Journal of physiology. Oct 1 2003;552(Pt 1):253-64. [CrossRef]
- Savransky V, Nanayakkara A, Li J, et al. Chronic intermittent hypoxia induces atherosclerosis. American journal of respiratory and critical care medicine. Jun 15 2007;175(12):1290-7. [CrossRef]
- King ED, O'Donnell CP, Smith PL, Schwartz AR. A model of obstructive sleep apnea in normal humans. Role of the upper airway. American journal of respiratory and critical care medicine. Jun 2000;161(6):1979-84. [CrossRef]
- Brennick MJ, Kuna ST, Pickup S, Cater J, Schwab RJ. Respiratory modulation of the pharyngeal airway in lean and obese mice. Respiratory physiology & neurobiology. Feb 15 2011;175(2):296-302. [CrossRef]
- Krainer D, Dupré G. Brachycephalic Obstructive Airway Syndrome. The Veterinary clinics of North America Small animal practice. May 2022;52(3):749-780. [CrossRef]
- Xu C, Brennick MJ, Dougherty L, Wootton DM. Modeling upper airway collapse by a finite element model with regional tissue properties. Med Eng Phys. Dec 2009;31(10):1343-8. [CrossRef]
- Sériès F, Ethier G. Site of phrenic nerve stimulation-induced upper airway collapse: influence of expiratory time. Journal of applied physiology (Bethesda, Md : 1985). Feb 2002;92(2):665-71. [CrossRef]
- Zhang M, Lu Y, Sheng L, et al. Advances in Molecular Pathology of Obstructive Sleep Apnea. Molecules (Basel, Switzerland). Dec 1 2022;27(23). [CrossRef]
- Lebek S, Hegner P, Schach C, et al. A novel mouse model of obstructive sleep apnea by bulking agent-induced tongue enlargement results in left ventricular contractile dysfunction. PLOS ONE. 2020;15(12):e0243844. [CrossRef]
- Schwab RJ, Pasirstein M, Pierson R, et al. Identification of Upper Airway Anatomic Risk Factors for Obstructive Sleep Apnea with Volumetric Magnetic Resonance Imaging. American journal of respiratory and critical care medicine. 2003;168(5):522-530. [CrossRef]
- SABLE. Promethion Core Metabolic System, Mouse. SABLE SYSTEMS International. https://www.sablesys.com/products/promethion-core-line/promethion-core-metabolic-system-mouse/.
- Sierra C, De Toma I, Cascio LL, Vegas E, Dierssen M. Social Factors Influence Behavior in the Novel Object Recognition Task in a Mouse Model of Down Syndrome. Original Research. Frontiers in Behavioral Neuroscience. 2021-November-05 2021;15. [CrossRef]
- Livak KJ, Schmittgen TD. Analysis of Relative Gene Expression Data Using Real-Time Quantitative PCR and the 2−ΔΔCT Method. Methods. 2001/12/01/ 2001;25(4):402-408. [CrossRef]
- Alterki A, Al Shawaf E, Al-Khairi I, et al. The Rise of IGFBP4 in People with Obstructive Sleep Apnea and Multilevel Sleep Surgery Recovers Its Basal Levels. Disease markers. 2021;2021:1219593. [CrossRef]
- Stewart A, Gaikwad S, Kyzar E, Green J, Roth A, Kalueff AV. Modeling anxiety using adult zebrafish: a conceptual review. Neuropharmacology. Jan 2012;62(1):135-43. [CrossRef]
- Kraeuter AK, Guest PC, Sarnyai Z. The Open Field Test for Measuring Locomotor Activity and Anxiety-Like Behavior. Methods in molecular biology (Clifton, NJ). 2019;1916:99-103. [CrossRef]
- Lueptow LM. Novel Object Recognition Test for the Investigation of Learning and Memory in Mice. Journal of visualized experiments : JoVE. Aug 30 2017;(126). [CrossRef]
- Antunes M, Biala G. The novel object recognition memory: neurobiology, test procedure, and its modifications. Cognitive processing. May 2012;13(2):93-110. [CrossRef]
- Ramakrishnan S, Anand V, Roy S. Vascular endothelial growth factor signaling in hypoxia and inflammation. J Neuroimmune Pharmacol. Mar 2014;9(2):142-60. [CrossRef]
- Basheeruddin M, Qausain S. Hypoxia-Inducible Factor 1-Alpha (HIF-1α): An Essential Regulator in Cellular Metabolic Control. Cureus. Jul 2024;16(7):e63852. [CrossRef]
- Marti HH, Risau W. Systemic hypoxia changes the organ-specific distribution of vascular endothelial growth factor and its receptors. Proc Natl Acad Sci U S A. Dec 22 1998;95(26):15809-14. [CrossRef]
- Row BW. Intermittent hypoxia and cognitive function: implications from chronic animal models. Advances in experimental medicine and biology. 2007;618:51-67. [CrossRef]
- Zhou L, Chen P, Peng Y, Ouyang R. Role of Oxidative Stress in the Neurocognitive Dysfunction of Obstructive Sleep Apnea Syndrome. Oxidative medicine and cellular longevity. 2016;2016(1):9626831. [CrossRef]
- Cheung E, Escobar J, Schunke K, Kay M, Mendelowitz D. Effects of Chronic Intermittent Hypoxia on Cognitive Function in Rats. Physiology. 2023;38(S1):5734793. [CrossRef]
- Fan Y, Chou MC, Liu YC, Liu CK, Chen CH, Chen SL. Intermittent Hypoxia Activates N-Methyl-D-Aspartate Receptors to Induce Anxiety Behaviors in a Mouse Model of Sleep-Associated Apnea. Mol Neurobiol. Jul 2021;58(7):3238-3251. [CrossRef]
- Zhang K, Ma D, Wu Y, Xu Z. Impact of Chronic Intermittent Hypoxia on Cognitive Function and Hippocampal Neurons in Mice: A Study of Inflammatory and Oxidative Stress Pathways. Nature and science of sleep. 2024;16:2029-2043. [CrossRef]
- Xie H, Yung W-h. Chronic intermittent hypoxia-induced deficits in synaptic plasticity and neurocognitive functions: a role for brain-derived neurotrophic factor. Acta Pharmacologica Sinica. 2012/01/01 2012;33(1):5-10. [CrossRef]
- Huff AD, Karlen-Amarante M, Oliveira LM, Ramirez JM. Chronic intermittent hypoxia reveals role of the Postinspiratory Complex in the mediation of normal swallow production. eLife. Apr 24 2024;12. [CrossRef]
- Prabhakar NR, Peng YJ, Nanduri J. Hypoxia-inducible factors and obstructive sleep apnea. The Journal of clinical investigation. Oct 1 2020;130(10):5042-5051. [CrossRef]
- Mazerbourg S, Callebaut I, Zapf J, Mohan S, Overgaard M, Monget P. Up date on IGFBP-4: regulation of IGFBP-4 levels and functions, in vitro and in vivo. Growth hormone & IGF research : official journal of the Growth Hormone Research Society and the International IGF Research Society. Apr 2004;14(2):71-84. [CrossRef]
- Olesen JL, M. HK, Henning L, Peter MS, Michael K, and Flyvbjerg A. Expression, Content, and Localization of Insulin-Like Growth Factor I in Human Achilles Tendon. Connective Tissue Research. 2006/01/01 2006;47(4):200-206. [CrossRef]
- Nur SI, Ozturk A, Kavas M, et al. IGFBP-4: A promising biomarker for lung cancer. Journal of medical biochemistry. Jun 5 2021;40(3):237-244. [CrossRef]
- Ho FK, Mark PB, Lees JS, et al. A Proteomics-Based Approach for Prediction of Different Cardiovascular Diseases and Dementia. Circulation. Feb 4 2025;151(5):277-287. [CrossRef]
- Hjortebjerg R. IGFBP-4 and PAPP-A in normal physiology and disease. Growth hormone & IGF research : official journal of the Growth Hormone Research Society and the International IGF Research Society. Aug 2018;41:7-22. [CrossRef]
- Minchenko DO, Kharkova AP, Halkin OV, Karbovskyi LL, Minchenko OH. Effect of hypoxia on the expression of genes encoding insulin-like growth factors and some related proteins in U87 glioma cells without IRE1 function. Endocrine Regulations. 2016;50(2):43-54. [CrossRef]
- Ueda J, Ho JC, Lee KL, et al. The hypoxia-inducible epigenetic regulators Jmjd1a and G9a provide a mechanistic link between angiogenesis and tumor growth. Molecular and cellular biology. Oct 1 2014;34(19):3702-20. [CrossRef]
- Sun Y, Weng X, Chen W, et al. MYBBP1A-mediated IGFBP4 promoter methylation promotes epithelial-mesenchymal transition and metastasis through activation of NOTCH pathway in liver cancer. International journal of oncology. Jan 2025;66(1). [CrossRef]
- Torres G, Yang J, Griffiths M, et al. Insulin-like growth factor binding Protein-4: A novel indicator of pulmonary arterial hypertension severity and survival. Pulmonary circulation. Apr 2023;13(2):e12235. [CrossRef]
- Peng Z, Kan Q, Wang K, et al. Deciphering smooth muscle cell heterogeneity in atherosclerotic plaques and constructing model: a multi-omics approach with focus on KLF15/IGFBP4 axis. BMC Genomics. 2024/05/17 2024;25(1):490. [CrossRef]
- Zhang Z, Wang Q, Chen B, Wang Y, Miao Y, Han L. Association study of genetic variations of inflammatory biomarkers with susceptibility and severity of obstructive sleep apnea. Molecular genetics & genomic medicine. Aug 2019;7(8):e801. [CrossRef]
- Fiedorczuk P, Stróżyński A, Olszewska E. Is the Oxidative Stress in Obstructive Sleep Apnea Associated With Cardiovascular Complications?-Systematic Review. Journal of clinical medicine. Nov 20 2020;9(11). [CrossRef]
- Pan W, Kastin AJ. Leptin: a biomarker for sleep disorders? Sleep medicine reviews. Jun 2014;18(3):283-90. [CrossRef]
- Baxter RC. Signaling Pathways of the Insulin-like Growth Factor Binding Proteins. Endocrine reviews. Sep 15 2023;44(5):753-778. [CrossRef]
- Ahluwalia A, Tarnawski AS. Critical role of hypoxia sensor--HIF-1alpha in VEGF gene activation. Implications for angiogenesis and tissue injury healing. Curr Med Chem. 2012;19(1):90-7. [CrossRef]
- Scharf J-G, Unterman TG, Kietzmann T. Oxygen-Dependent Modulation of Insulin-Like Growth Factor Binding Protein Biosynthesis in Primary Cultures of Rat Hepatocytes. Endocrinology. 2005;146(12):5433-5443. [CrossRef]
- Tang X, Jiang H, Lin P, et al. Insulin-like growth factor binding protein-1 regulates HIF-1α degradation to inhibit apoptosis in hypoxic cardiomyocytes. Cell Death Discovery. 2021/09/16 2021;7(1):242. [CrossRef]
- Kajimura S, Aida K, Duan C. Insulin-like growth factor-binding protein-1 (IGFBP-1) mediates hypoxia-induced embryonic growth and developmental retardation. Proc Natl Acad Sci U S A. Jan 25 2005;102(4):1240-5. [CrossRef]
- Wang L, Liu H, Zhou L, et al. Association of Obstructive Sleep Apnea with Nonalcoholic Fatty Liver Disease: Evidence, Mechanism, and Treatment. Nature and science of sleep. 2024;16:917-933. [CrossRef]
- Tang H, Lv F, Zhang P, Liu J, Mao J. The impact of obstructive sleep apnea on nonalcoholic fatty liver disease. Front Endocrinol (Lausanne). 2023;14:1254459. [CrossRef]
- Ahmed MH, Byrne CD. Obstructive sleep apnea syndrome and fatty liver: association or causal link? World J Gastroenterol. Sep 14 2010;16(34):4243-52. [CrossRef]
Figure 1.
Hypoxia induction by CoCl2, a hypoxia mimetic agent, indicated by hypoxia markers in HepG2 and the concurrent increase in IGFBP4 expression. (A) HepG2 cells showing an increase in HIF1α expression after 6-hr CoCl2 treatment (mean = 1.89 ± 0.033, p = 0.015) that peaked after 48-hr treatment (mean = 2.92 ± 0.33, p < 0.0001) compared to the CTRL. (B) HepG2 cells showed a significant increase in VEGF expression due to CoCl2 treatment after 24-hr (mean = 3.04 ± 0.39, p = 0.022) compared to the CTRL. (C) CoCl2-induced hypoxia in HepG2 increased the expression of IGFBP4 gene (mean = 2.95 ± 0.76, p = 0.003).
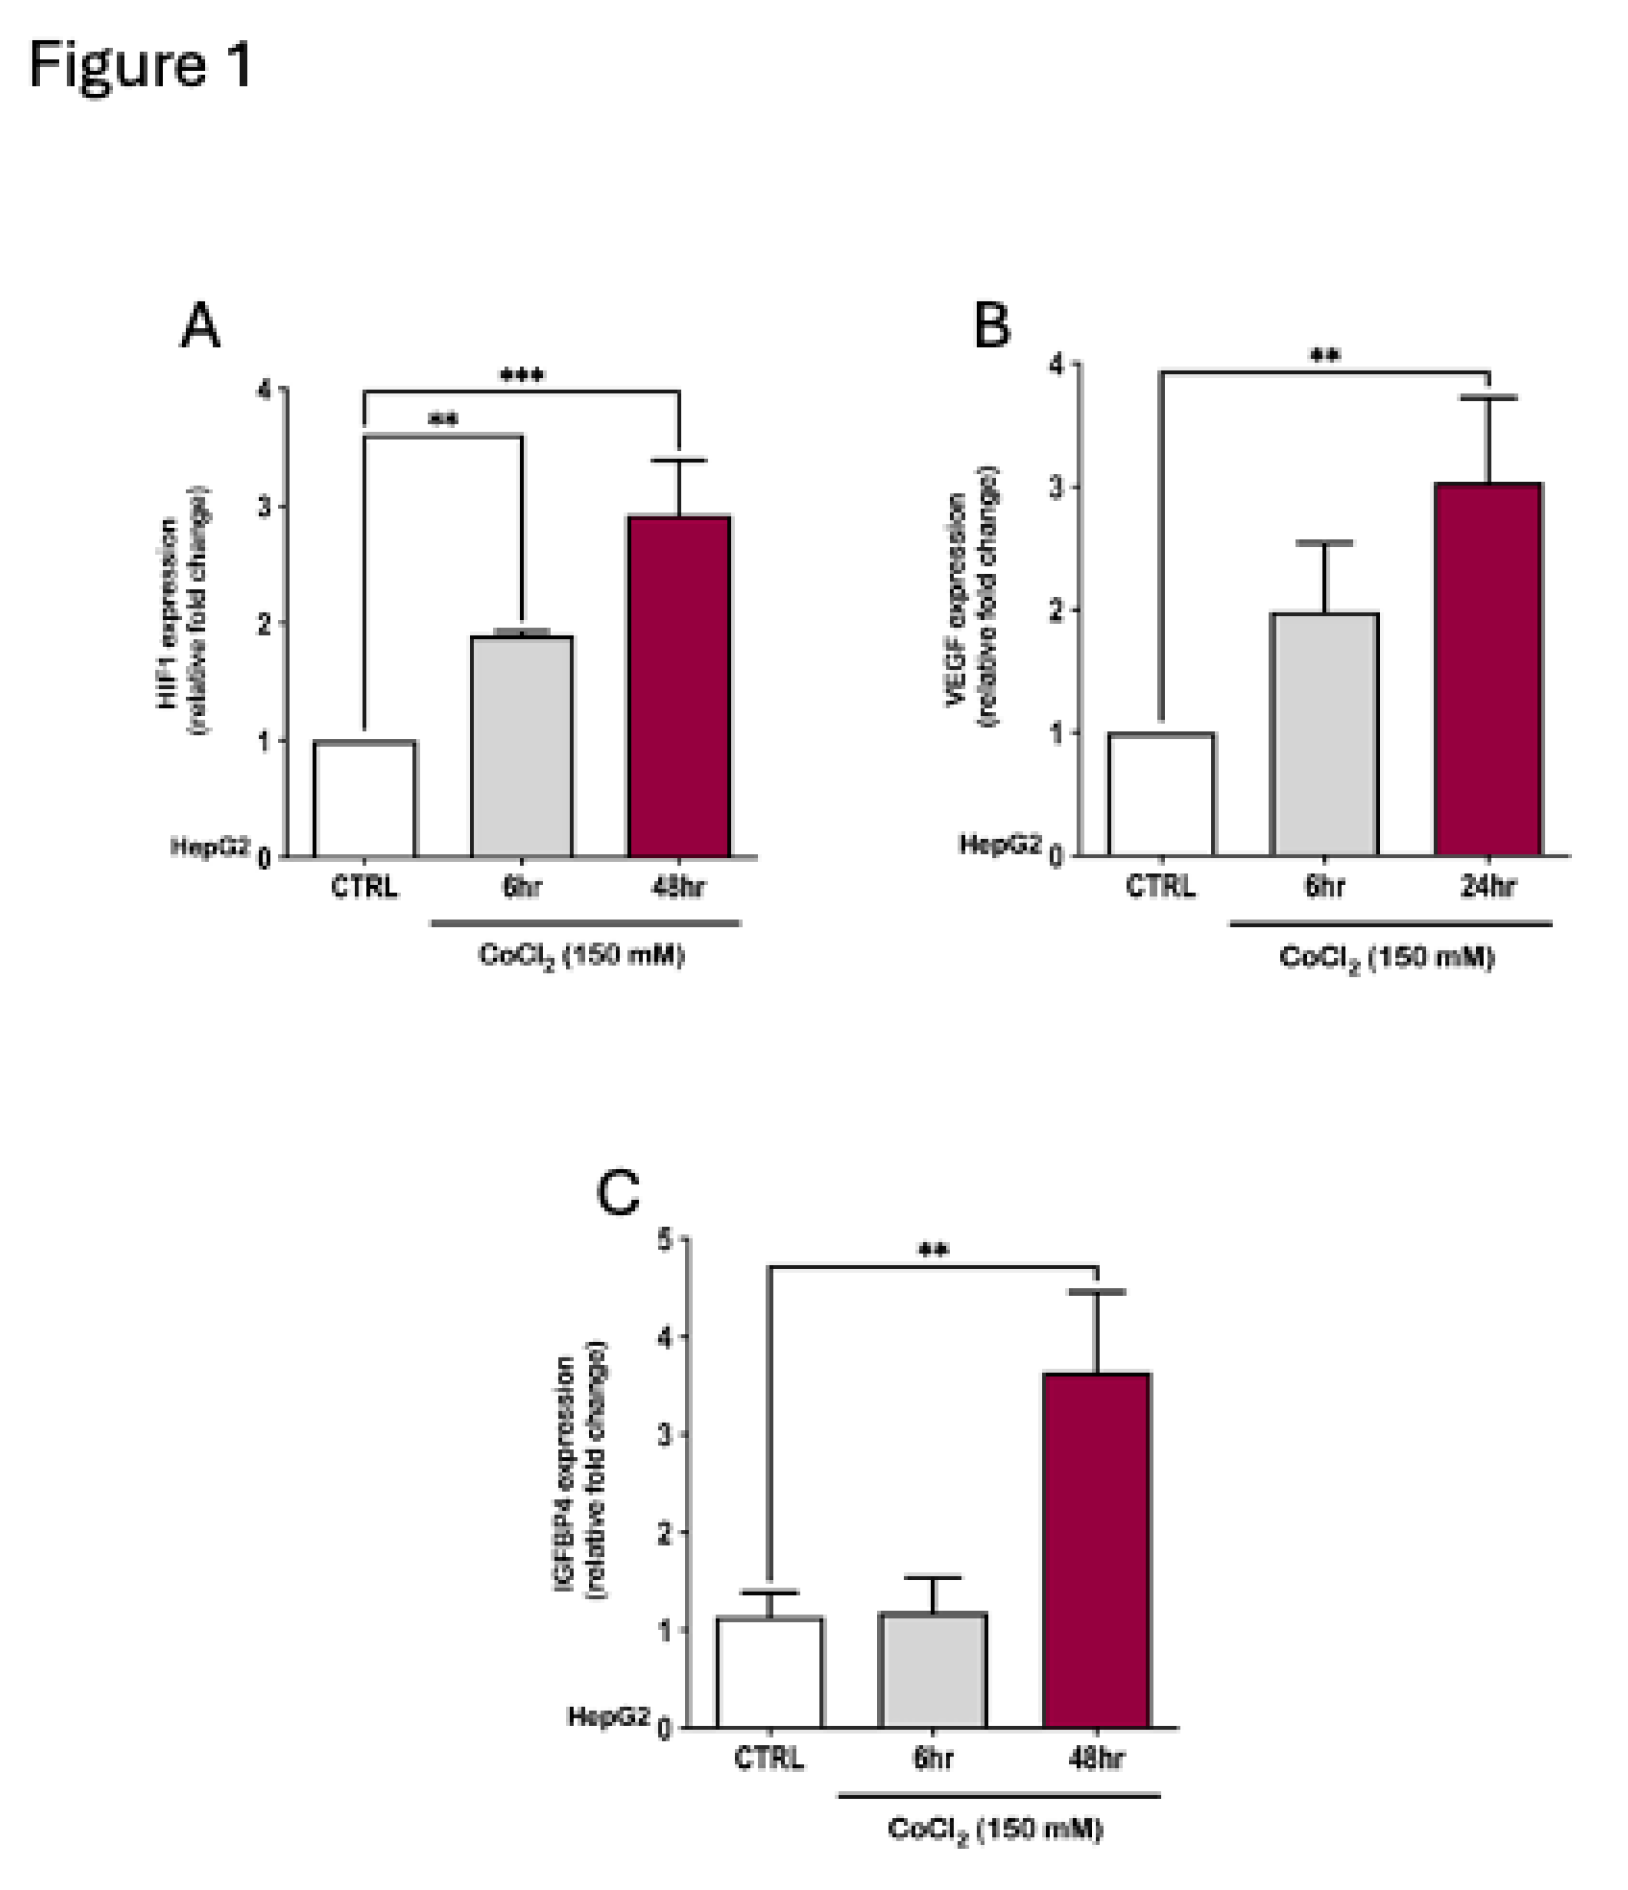
Figure 2.
PTFE-injected tongue(s) expand significantly compared to CTRL animals. (A) Sample of extracted tongues from sacrificed animals after an 8-week follow-up period, comparing PTFE-injected to CTRL (glycerol-injected). (B) Quantification of the total tongue area shows a significant increase in the total tongue area p-value <0.0001 of the PTFE-injected group (mean = 78.41 ± 1.6 mm2) compared to the CTRL (mean = 33.4 ± 4.7 mm2). (C) Tongue perimeter measurement shows a significant increase in the PTFE group (mean = 28.64 ± 0.81 mm2) compared to the CTRL (mean = 48.34 ± 2.1 mm2).

Figure 3.
PTFE-induced tongue expansion affects the exchange of gases. (A) A 24-hour representative plot of oxygen consumption (VO2) shows a difference between the PTFE group (red) and the CTRL (black) in the amount of oxygen consumed, particularly during the dark cycle. (B) A representative plot showing real-time recording of carbon dioxide production, with data compiled from PTFE (red) and CTRL (black). (C) Weight change and normal growth progression throughout the experiment period in all groups, with no significant difference between the groups. (D) Calculated percentage of weight gain, showing the mean percentage of weight gain throughout the study period. Weight gain percentage across groups was comparable, showing no significant difference between PTFE and CTRL.
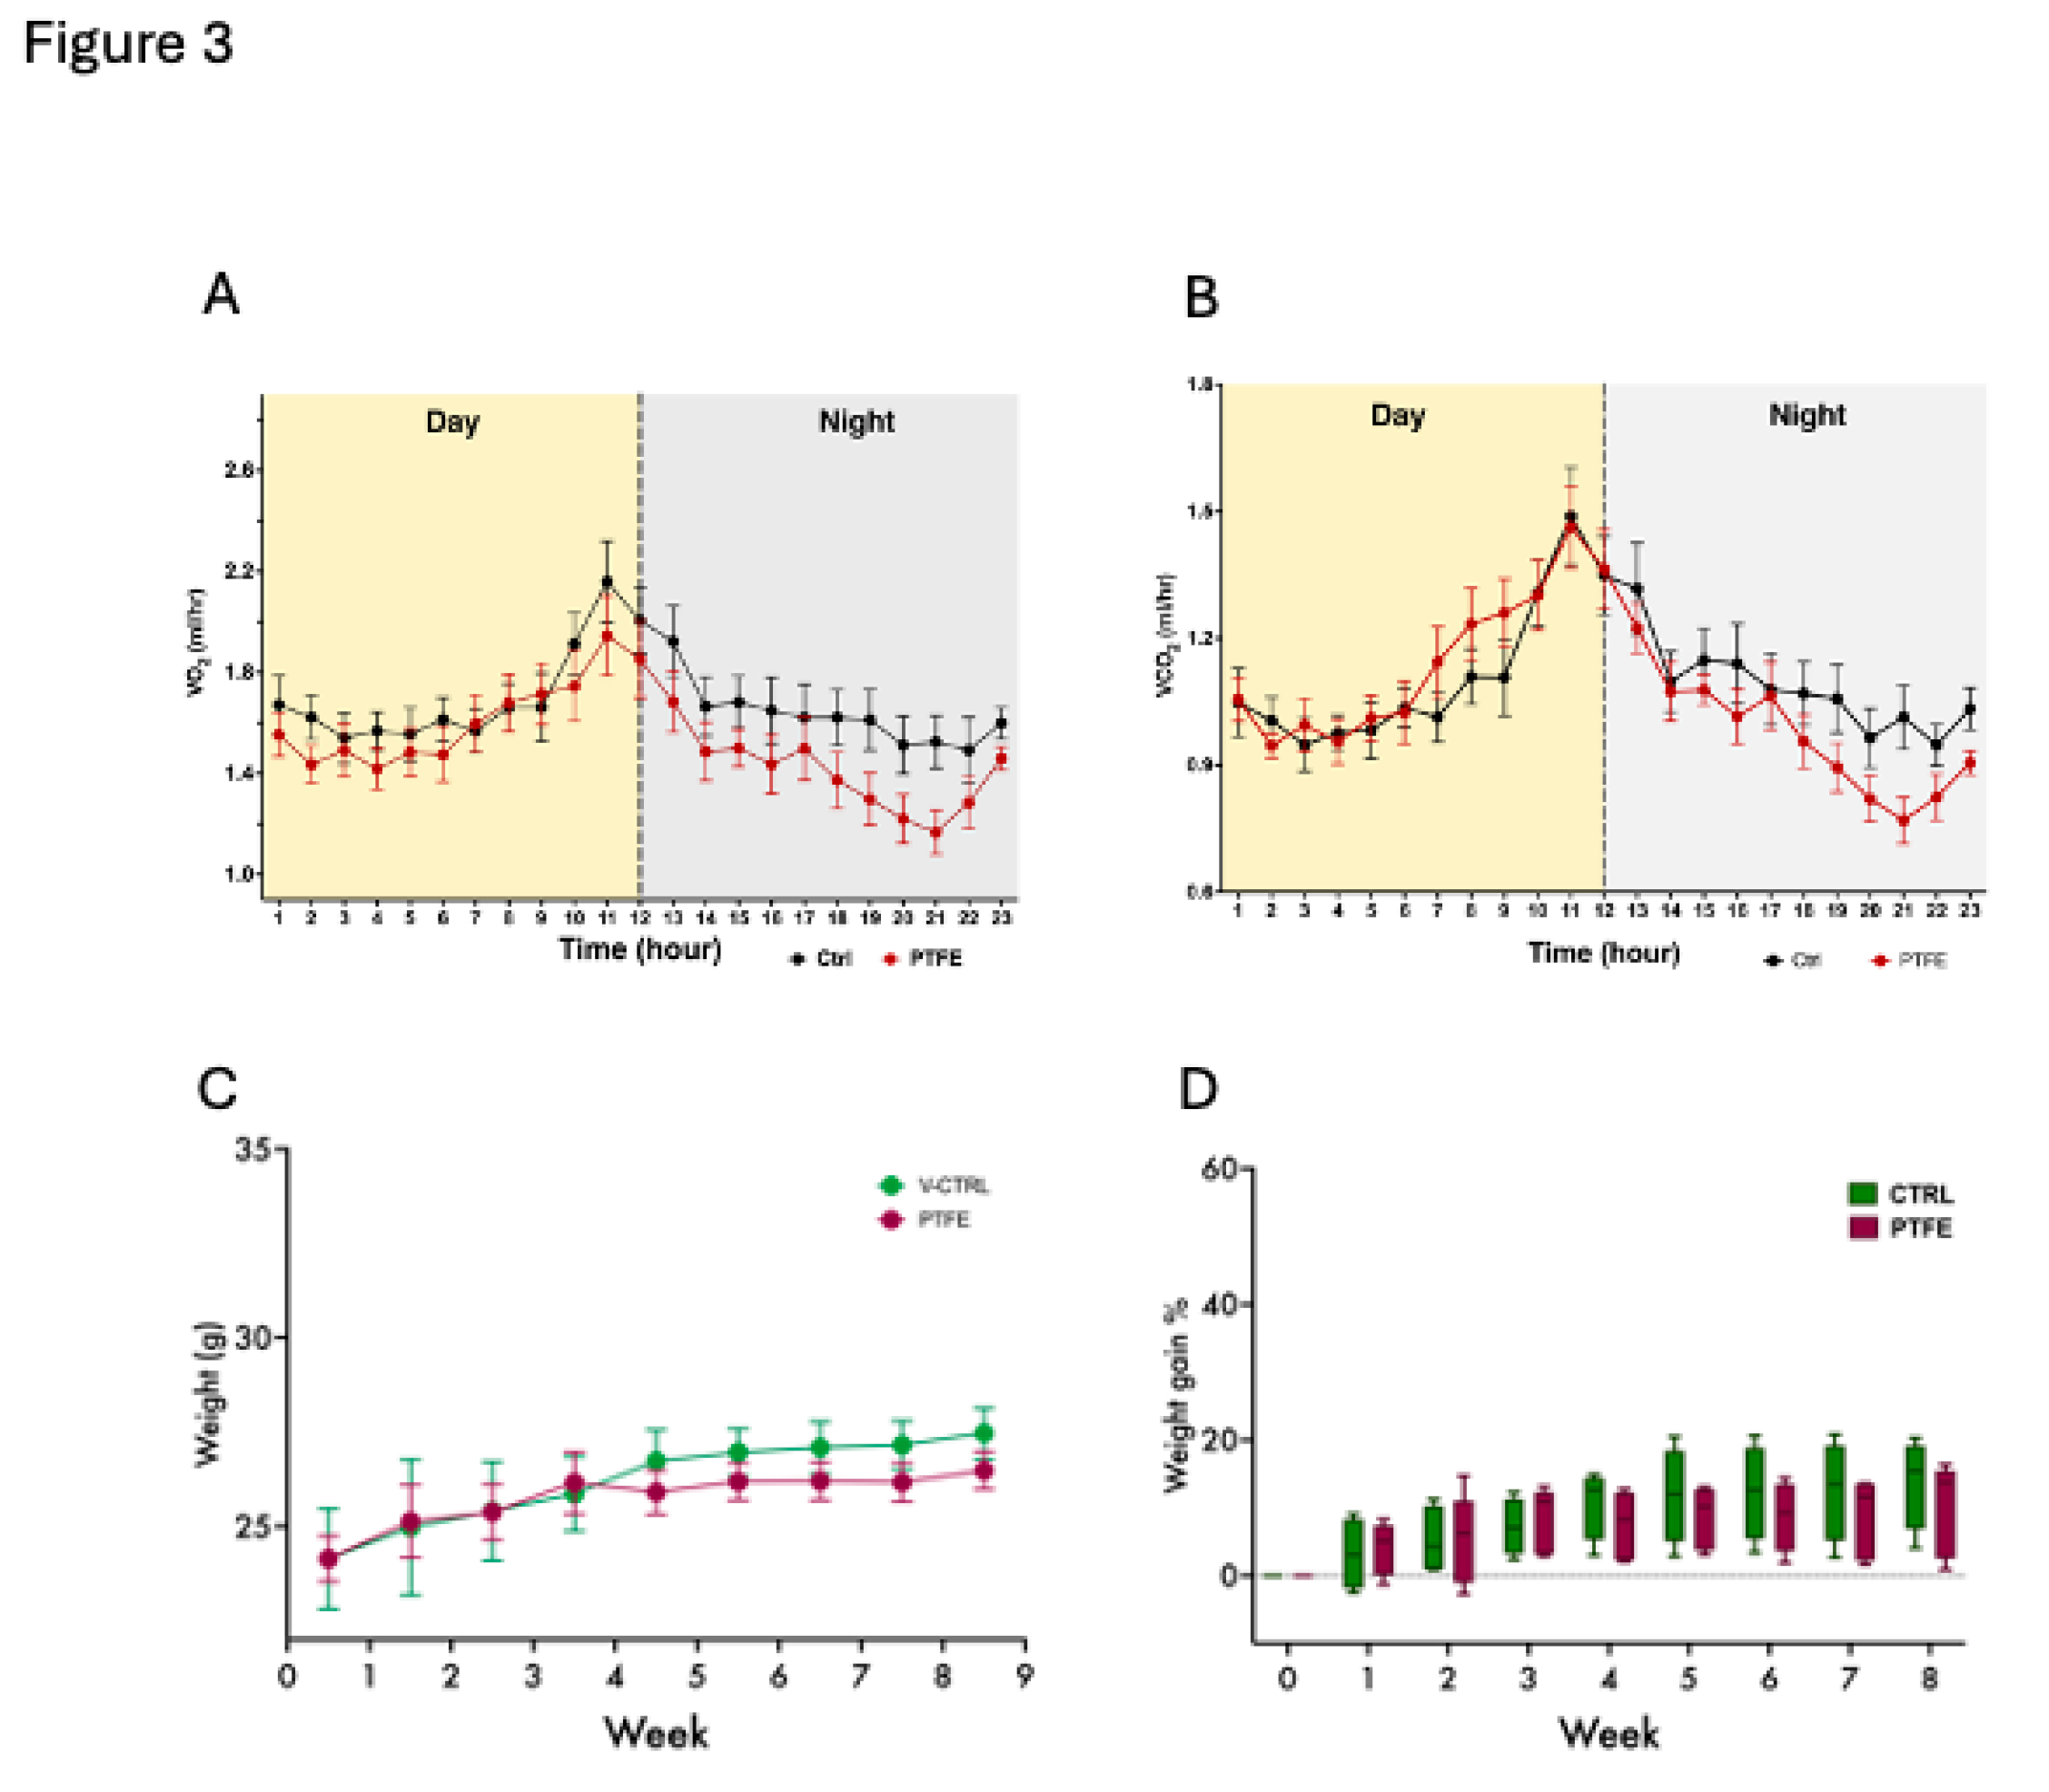
Figure 4.
PTFE treatment induces anxiety-like behavior in animals after 8-weeks of intervention, shown by the open field test. (A) PTFE mice made significantly fewer entries to the central zone (18.68 ± 2.5 entry, p <0.0001, n=21) than the CTRL (entry attempt = 56.7 ± 8.34, n=10). (B) The PTFE group spent significantly less time (mean = 4.2 ± 0.64, p <0.0001, n= 21) in the central zone than the CTRL (mean = 56.7 ± 8.34, n=10). (C) Representative activity trace plots of CTRL animals compared to PTFE. (D) The total distance travelled shows no difference between CTRL and PTFE.
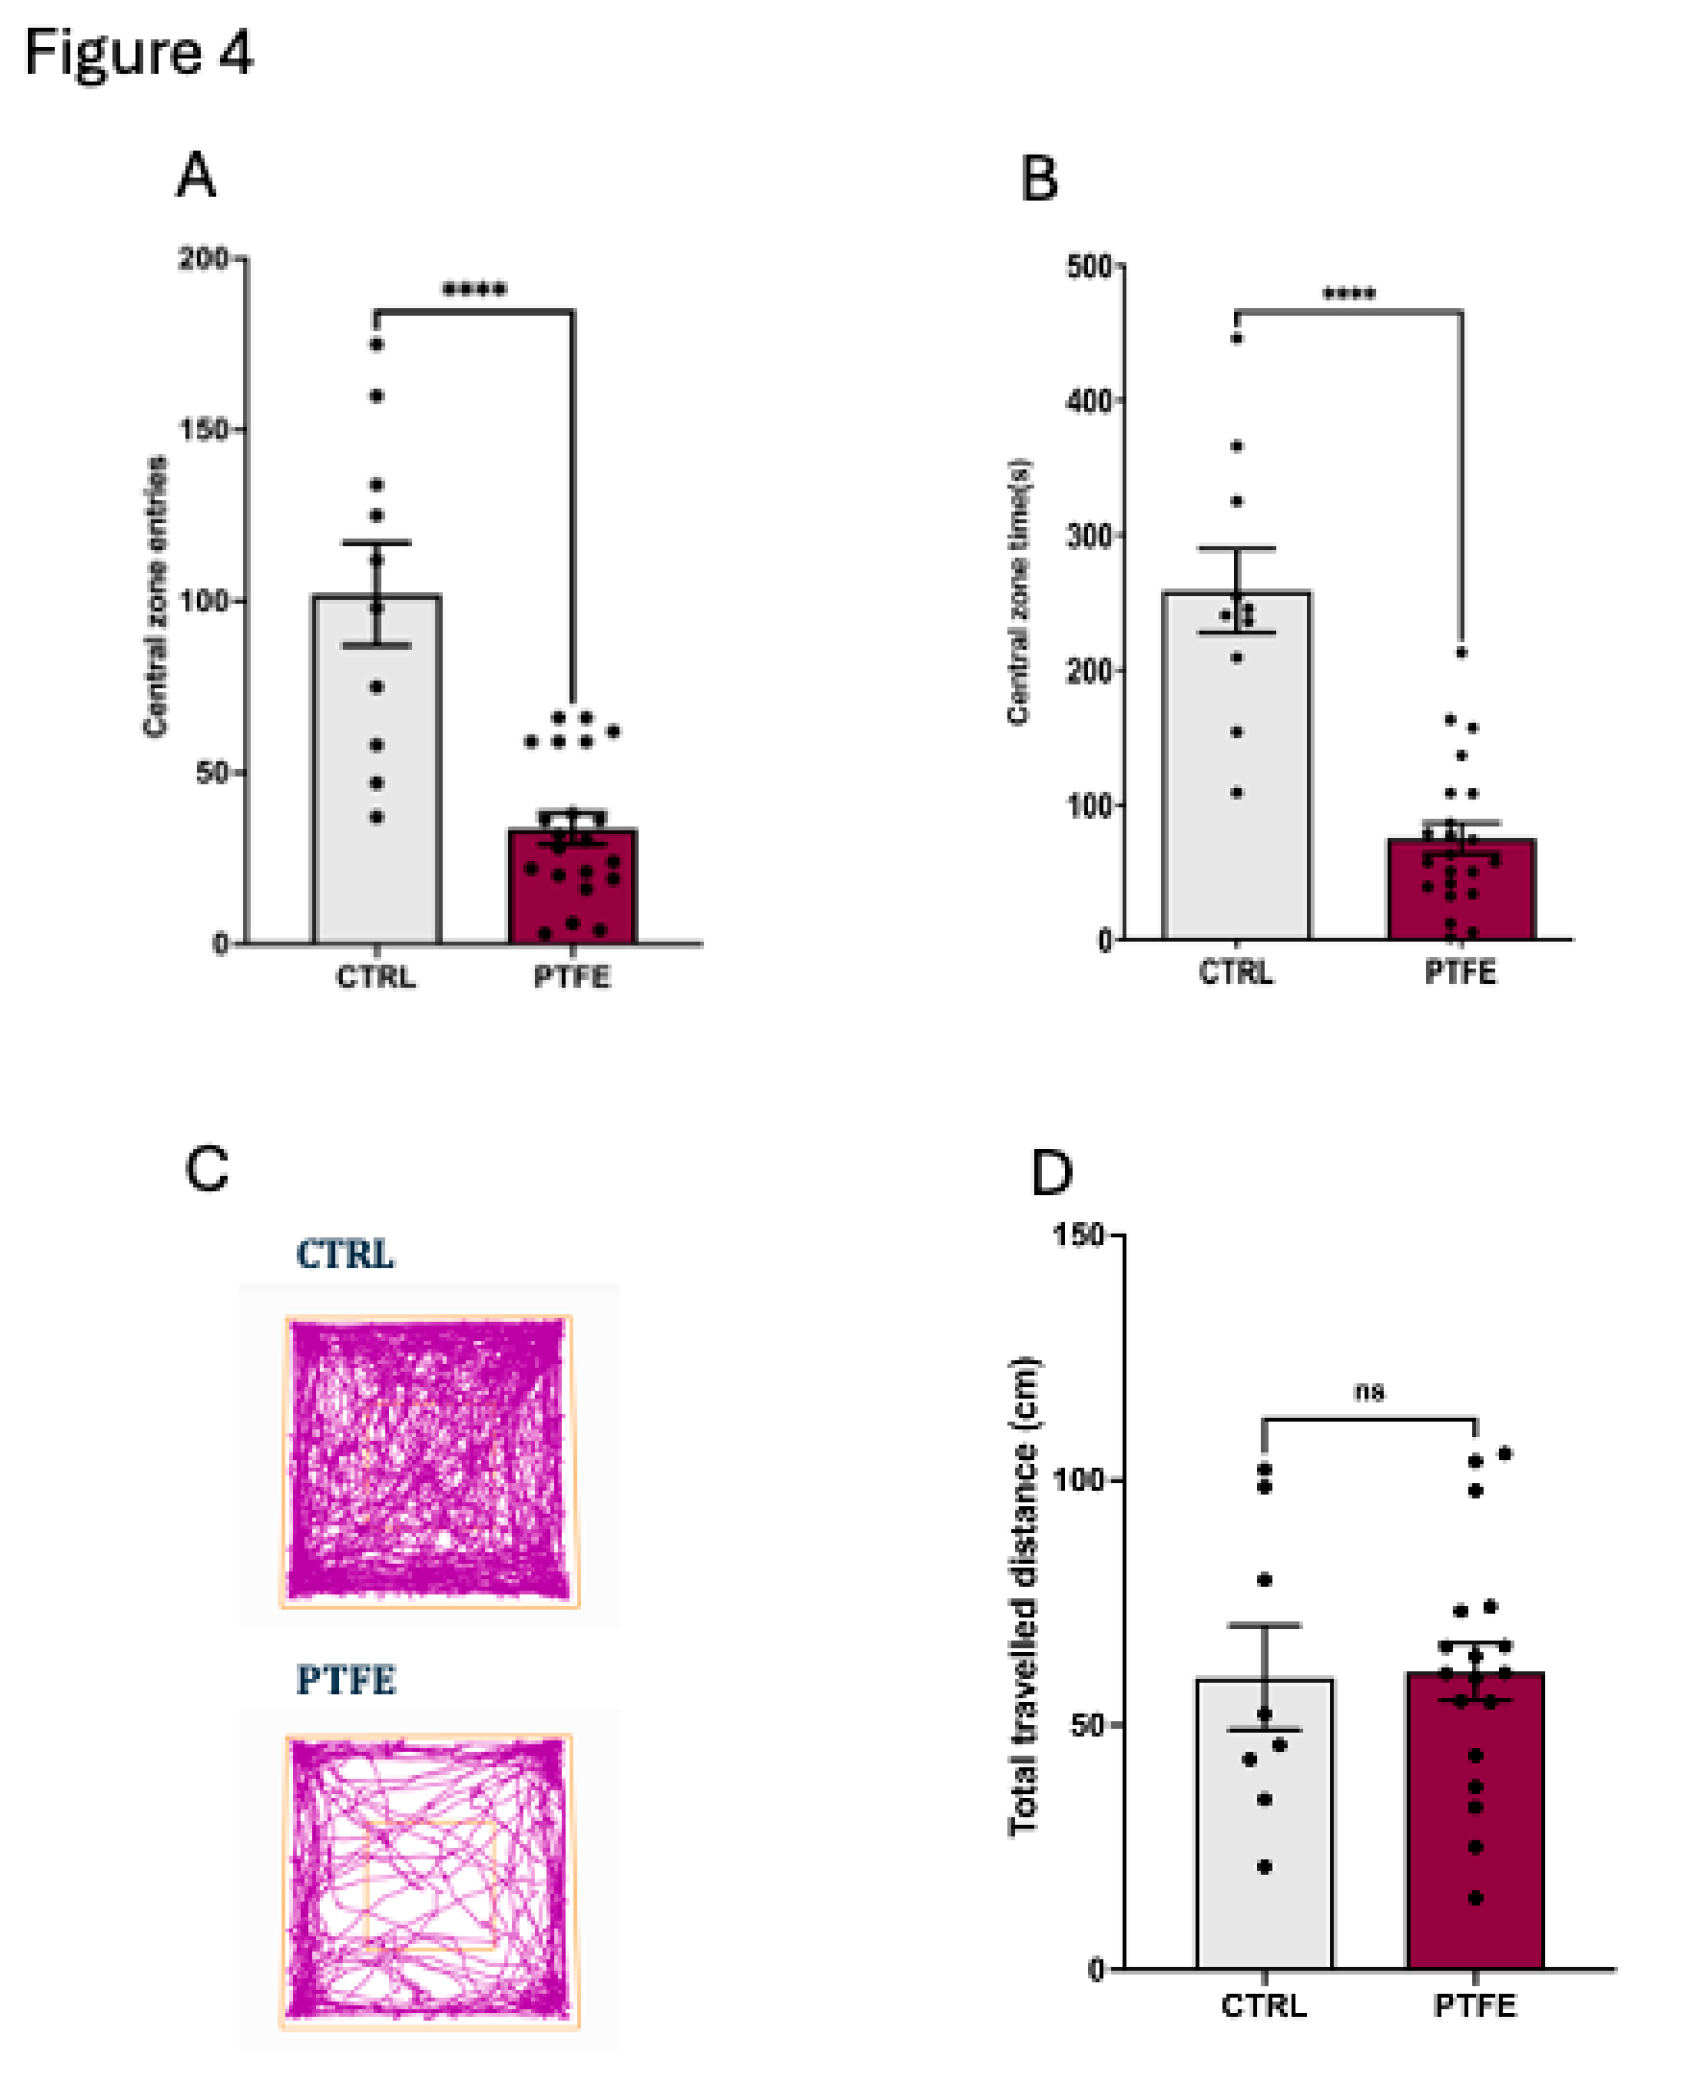
Figure 5.
Exploring the effect of PTFE treatment on memory & learning through the novel object recognition test. (A) Discrimination index of PTFE and CTRL mice in the testing phase, showing a significantly reduced cognitive ability in the PTFE group (mean = -0.043 ± 0.083, p = 0.016, n= 21) compared to the CTRL(mean = 0.24 ± 0.046, n= 13). (B) Recognition index in the testing phase showing a significantly lower value in the PTFE group (mean = 0.478 ± 0.041, p = 0.0161, n= 21) compared to the CTRL (mean = 0.62 ± 0.023, n = 13). (C) Total distance travelled by animals from both groups is comparable with no significant difference (CTRL = 11.6 ± 1.4, PTFE = 9.2 ± 0.82, p = 0.12). (D) Novel object investigation attempts by the PTFE group (mean = 8.6 ± 1.5 times) were significantly less than attempts by the CTRL (mean =15.69 ± 3.7, p = 0.042).
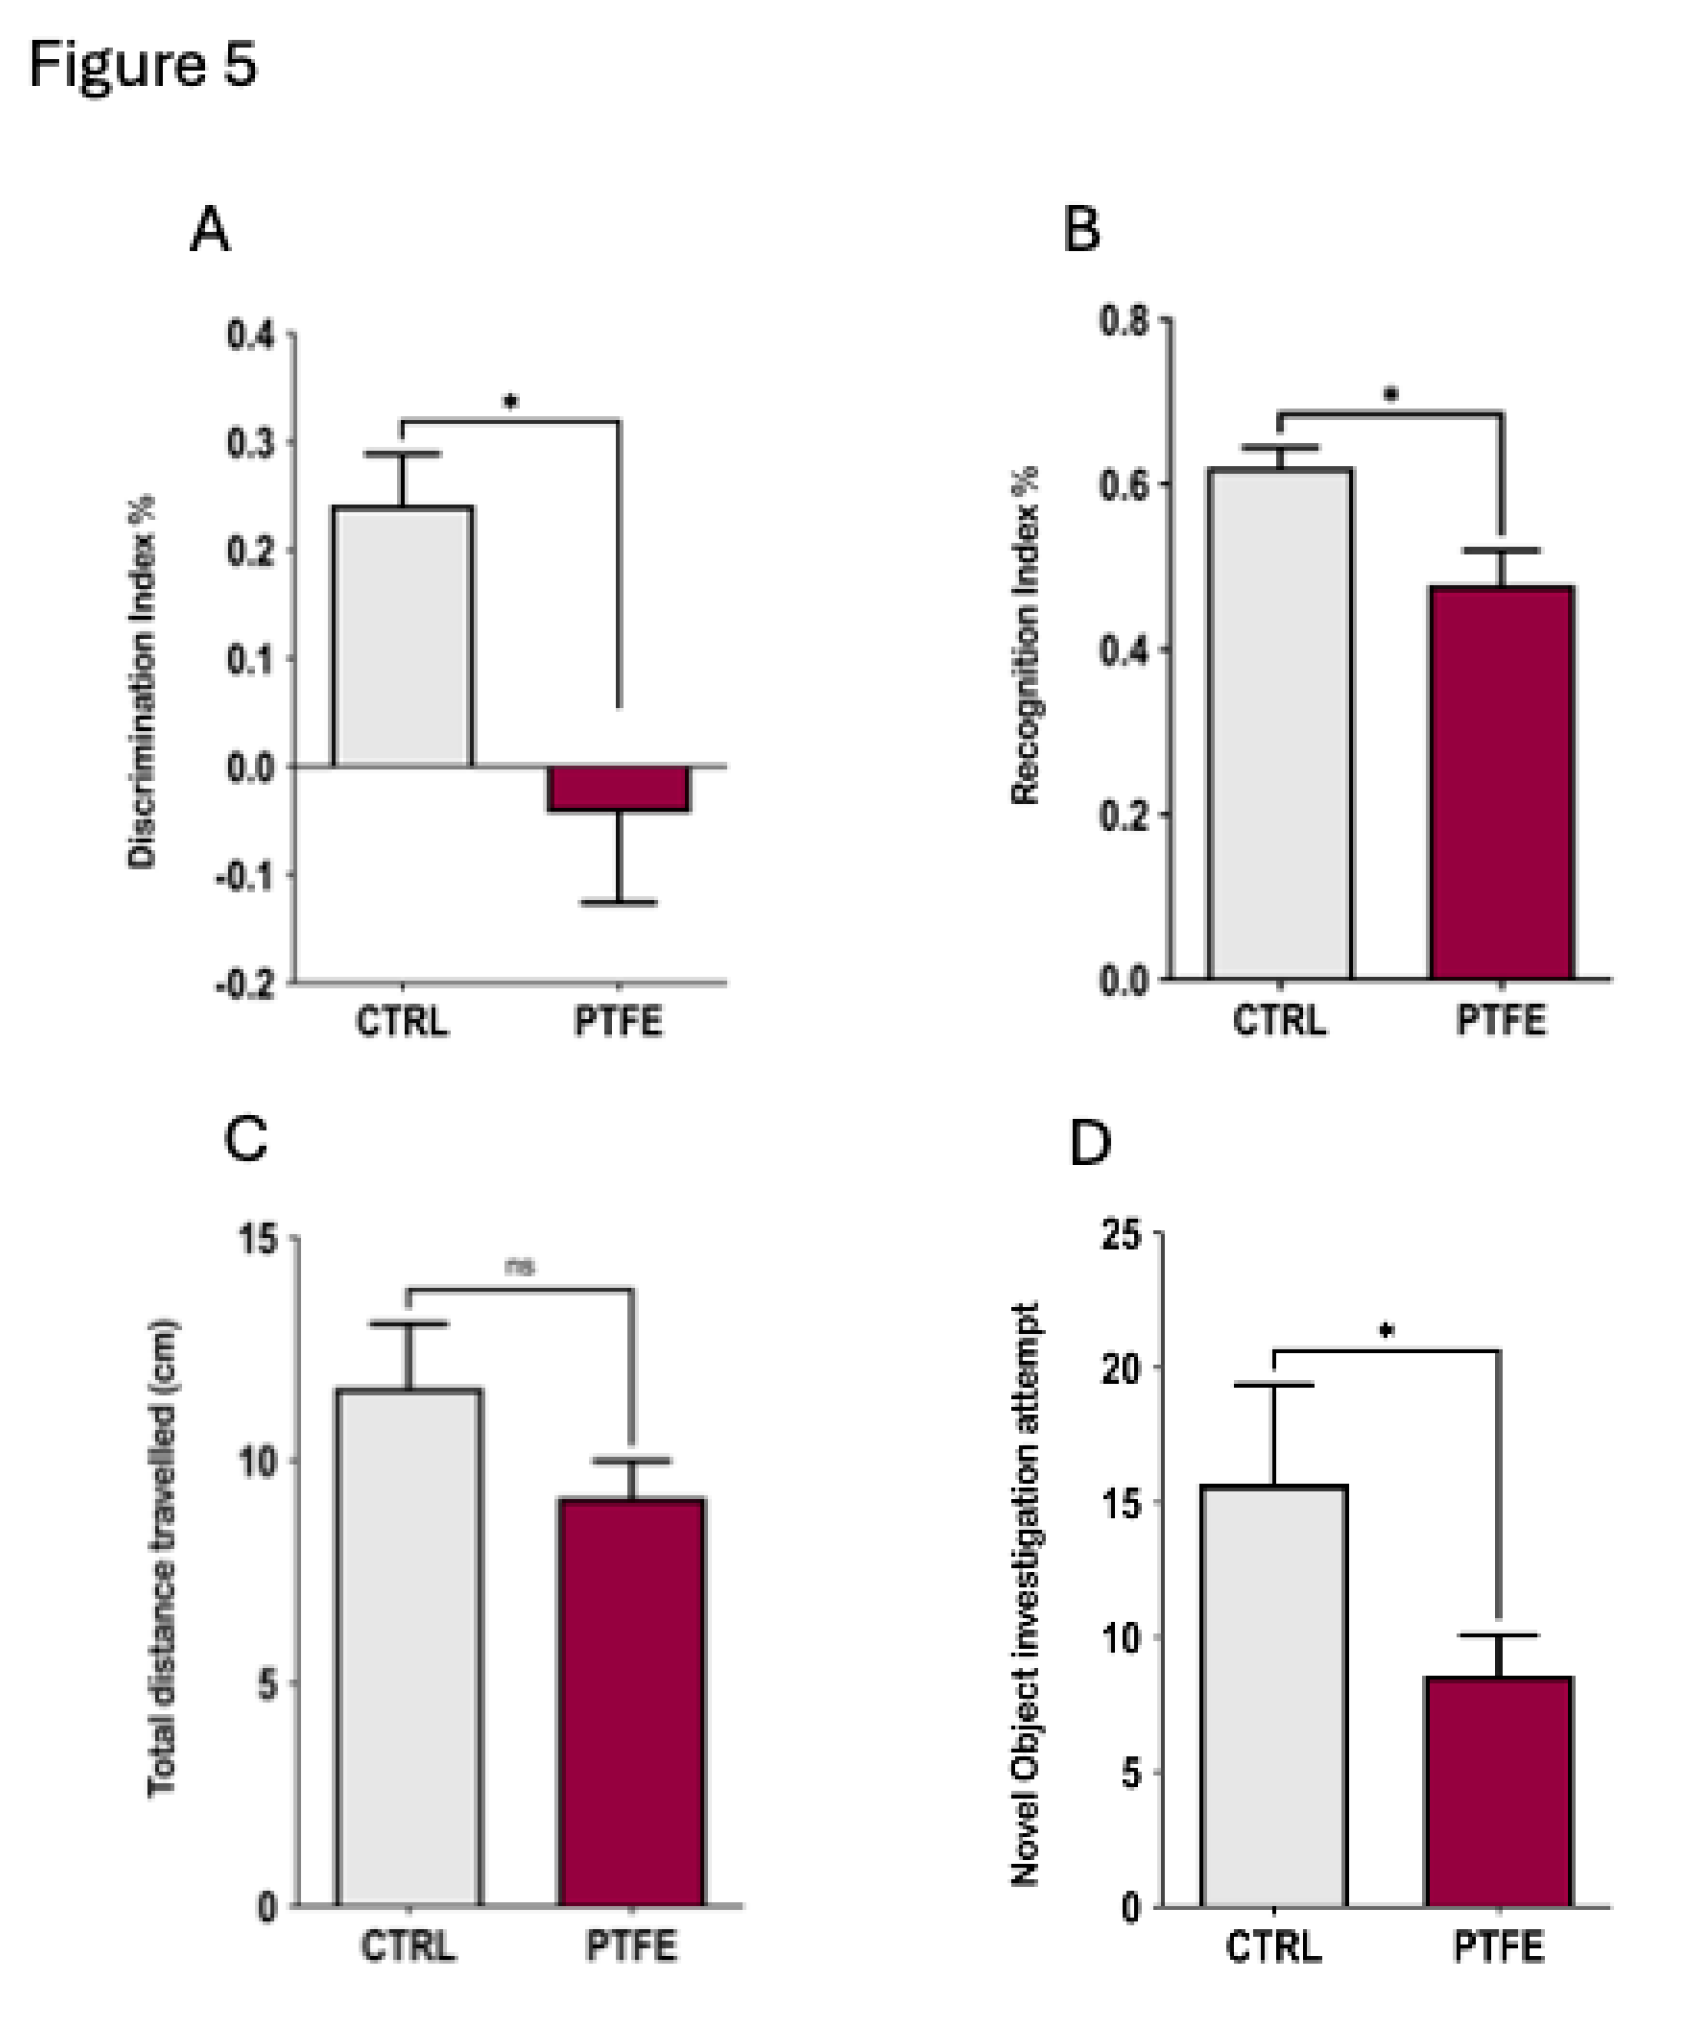
Figure 6.
Intermittent hypoxia induces the expression of IGFBP4 at the gene level in the liver. Tongue-induced expansion increased the gene expression of hypoxia markers; (A) HIF1α in PTFE = 1.72 ± 0.28, p = 0.044 compared to CTRL = 1.08 ± 0.08. (B) VEGF expression level in PTFE = 1.24 ± 0.09, p = 0.042 compared to CTRL = 0.903 ± 0.08. (C) IGFBP3 gene expression significantly declined in PTFE = 0.29 ± 0.1, p = 0.025 compared to the CTRL = 0.98 ± 0.29. (D) IGFBP4 gene expression increased significantly in PTFE = 1.51 ± 0.15, p = 0.048 compared to CTRL = 0.93 ± 0.09.
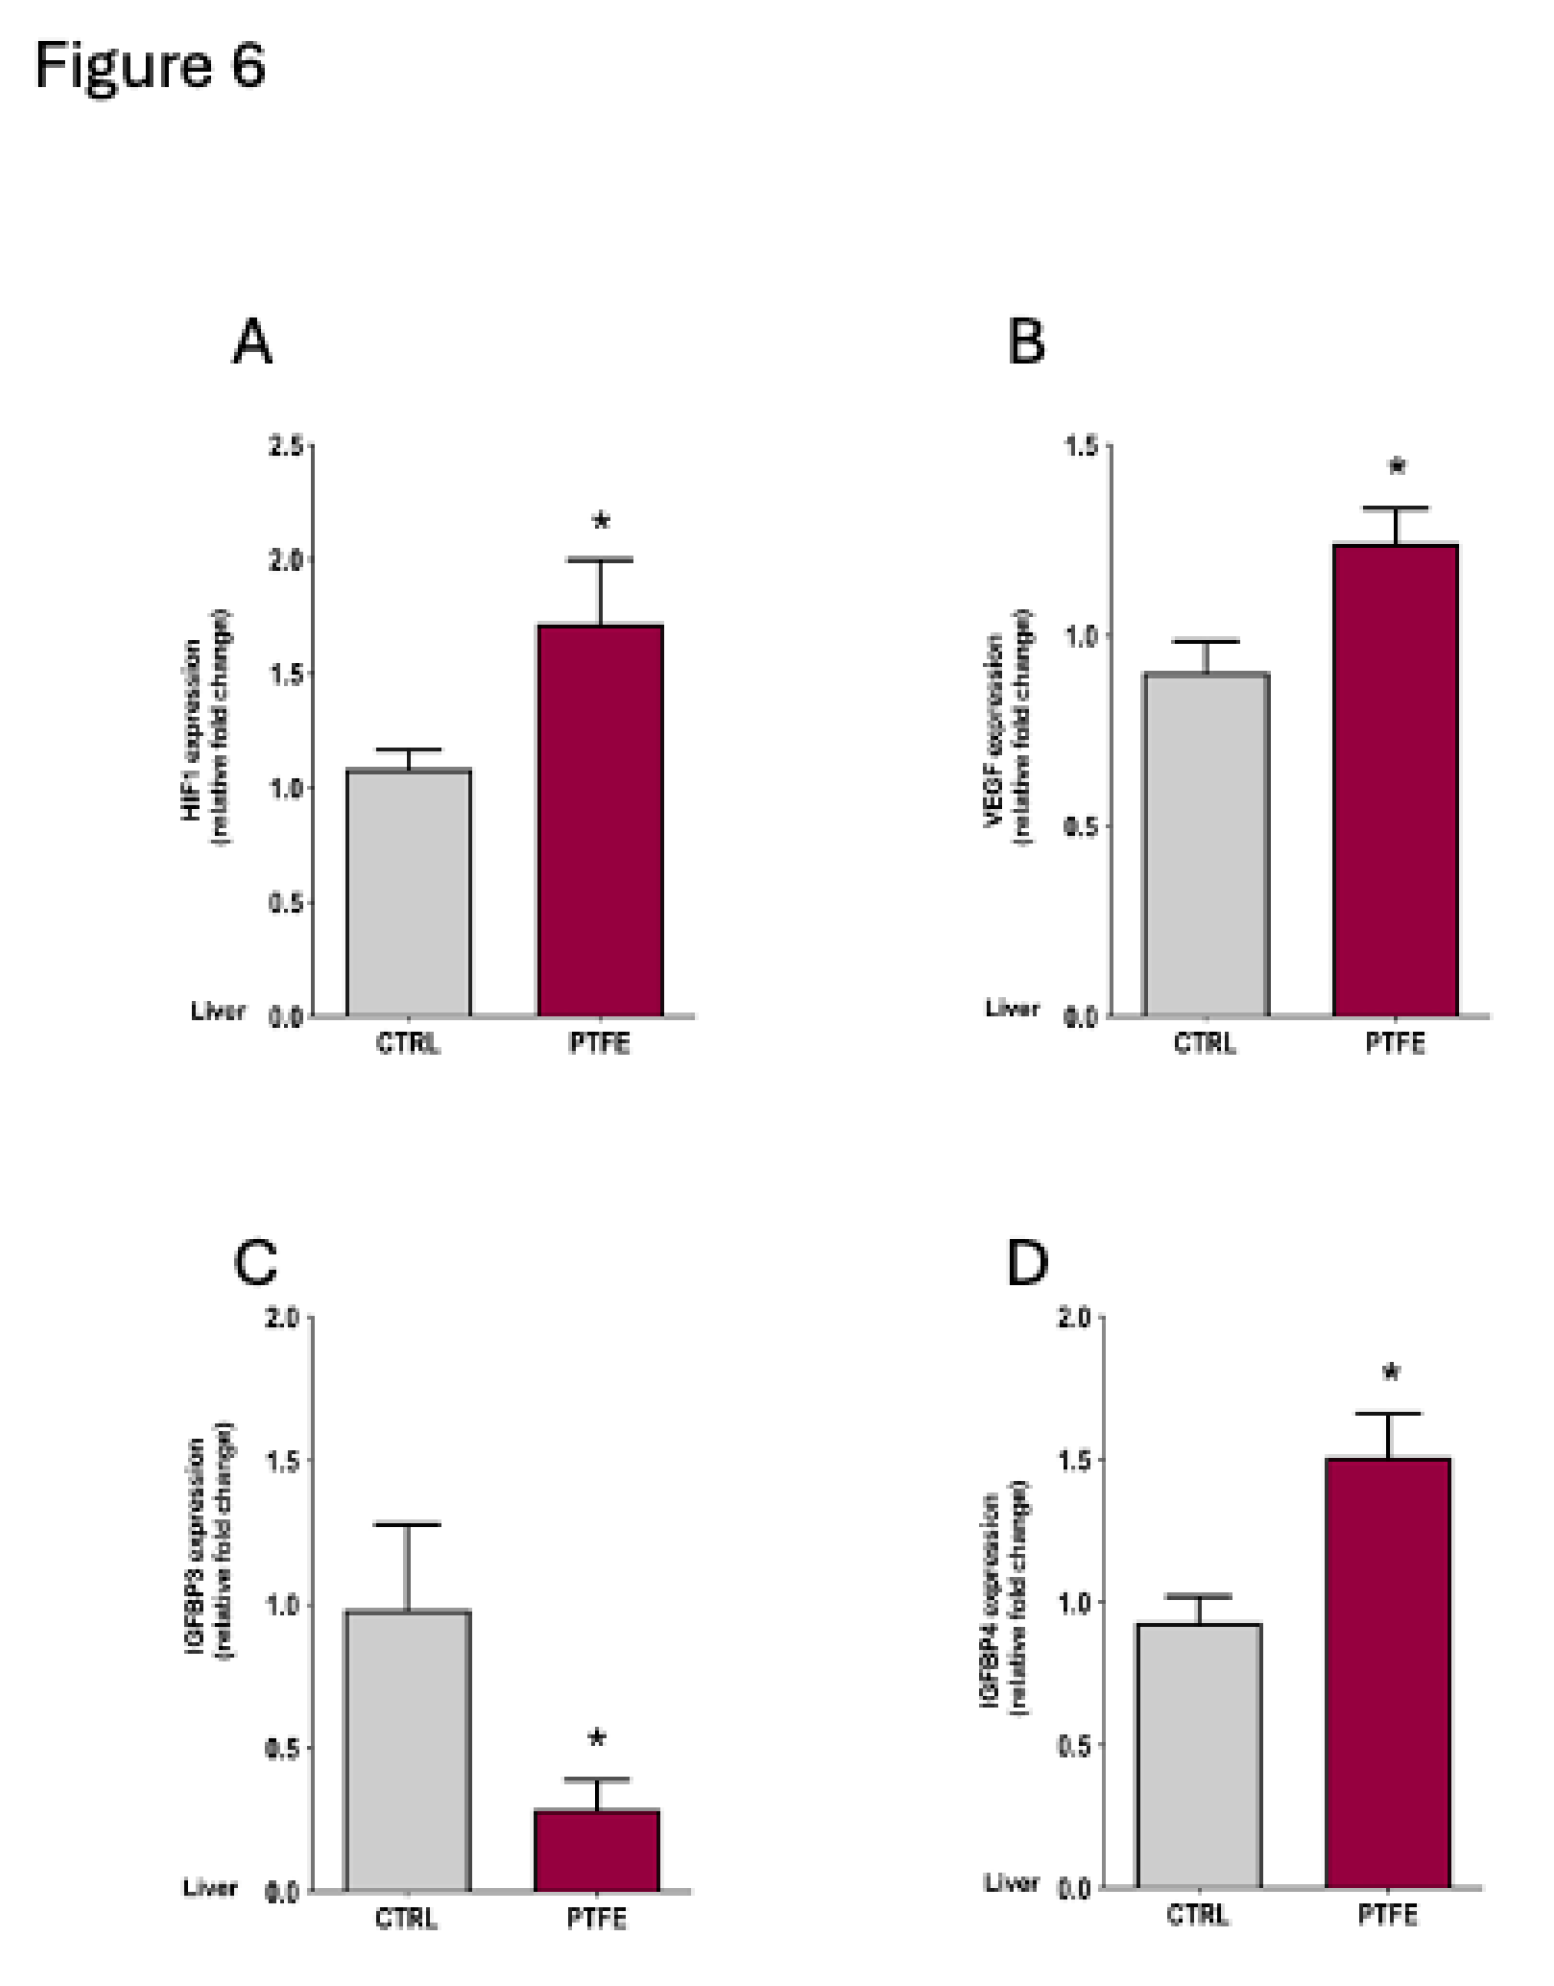
Figure 7.
Significant increase in circulating IGFBP4 with Intermittent hypoxia. To evaluate the effect of hypoxia on IGFBPs, we quantified circulating; (A) IGFPB1 showing no difference in plasma IGFBP1 levels between baseline (mean = 1.39 ± 0.02 ng/ml) and post-intervention (PTFE = 1.4 ± 0.07 ng/ml, CTRL = 1.34 ± 0.04 ng/ml). (B) No significant change in IGFBP3 levels before (mean = 2.4 ± 0.09 ng/ml) and after intervention (PTFE = 2.54 ± 0.03 ng/ml, CTRL = 2.58 ± 0.02 ng/ml). (C) circulating IGFBP4 levels showed a significant increase in PTFE group (mean = 23.65 ± 0.67 ng/ml) compared to CTRL (mean = 19.55 ± 1.3 ng/ml) and baseline (mean = 20.2 ± 0.98 ng/ml).
Disclaimer/Publisher’s Note: The statements, opinions and data contained in all publications are solely those of the individual author(s) and contributor(s) and not of MDPI and/or the editor(s). MDPI and/or the editor(s) disclaim responsibility for any injury to people or property resulting from any ideas, methods, instructions or products referred to in the content. |
© 2025 by the authors. Licensee MDPI, Basel, Switzerland. This article is an open access article distributed under the terms and conditions of the Creative Commons Attribution (CC BY) license (http://creativecommons.org/licenses/by/4.0/).
Copyright: This open access article is published under a Creative Commons CC BY 4.0 license, which permit the free download, distribution, and reuse, provided that the author and preprint are cited in any reuse.


