
Submitted:
02 June 2025
Posted:
03 June 2025
You are already at the latest version
Preprints on COVID-19 and SARS-CoV-2
Abstract
The human coronaviruses (hCoVs) SARS-CoV-1, -2, and MERS-CoV are more virulent as they have previously caused severe outbreaks associated with high mortality and morbidity, whereas HCoV-229E, HCoV-NL63, HCoV-OC43, and HCoV-HKU1 are associated with milder, seasonal infections, and therefore less virulent. The envelope (E) protein is present in all hCoVs and harbors a PDZ-binding motif (PBM) that contributes to viral pathogenesis and disease severity by binding to host cell proteins. Each of the seven E proteins are predicted to have a PBM, but it is not known whether the PBM of the less virulent hCoVs can bind stably to host proteins in the same way that the more virulent hCoVs do. This study aimed to investigate this by performing molecular dynamics (MD) simulations of the different E peptides docked to the PALS1 protein, and to assess the stability of these interactions over time. Analysis of the MD simulations showed that the E peptides of the more virulent hCoVs remained attached to PALS1, whereas the E peptides of the less virulent hCoVs detached from PALS1. This was further corroborated by binding free energy calculations, secondary structure analysis, and peptide protein interaction analysis. The results collectively demonstrated that the binding and stability of the E-PALS1 complex is influenced by both the residues that make up the PBM as well as the immediately preceding residues. This is the first study to investigate the binding capability of the less virulent hCoV E peptides to a host protein and compare it to that of the more virulent hCoV E peptides and offers insight into the varied virulence between the hCoVs.
Keywords:
Human coronavirus
; Envelope protein
; PDZ-binding motif
; virulence
; pathogenesis
1. Introduction
Coronaviruses (CoVs) are a family of viruses with notably large positive-sense, single-stranded RNA genomes, which typically range from 26 to 32 kilobases (kb) in size [1,2]. Among them, seven human coronaviruses (hCoVs) are known to cause respiratory tract infections (RTIs) of varying severity: SARS-CoV-1, MERS-CoV, SARS-CoV-2, HCoV-229E, HCoV-NL63, HCoV-
OC43, and HCoV-HKU1 [2]. The former three have caused significant outbreaks of severe RTIs associated with high morbidity and mortality over the past two decades, while the latter four are generally linked to milder, seasonal RTIs with higher prevalence within the human population [2,3]. Like other viruses within a family, group, or subtype can cause diseases of varying severity, hCoVs also exhibit a varied virulence. However, the reasons for this disparity or the mechanisms behind it are unclear. This property of viral virulence can be influenced by a complex interplay of factors, including intrinsic viral properties, such as how efficiently the virus replicates, its ability to evade host immune defenses, and its capacity to induce host cell damage [4,5,6].
Like many viruses, hCoVs employ short-linear motifs (SLiMs) that mimic motifs of host proteins involved in cell-directed pathways, thereby facilitating viral replication and contributing to their pathogenicity [7,8,9,10]. The CoV envelope (E) protein, while primarily responsible for the assembly and release of new viral particles, also contains a SLiM that significantly contributes to the pathogenesis of SARS-CoV-1 and SARS-CoV-2 [6,11,12,13,14,15,16,17]. This SLiM, known as a PDZ- binding motif (PBM), facilitates the binding of E to host cells that have PSD95/DlgA/ZO-1 (PDZ) domains. The human proteome contains an estimated 266 protein with PDZ domains, some of which have only a single PDZ domain while others have multiple, and these proteins are typically involved in signal transduction, maintaining cell polarity, and serve as scaffolds in protein-protein interactions (PPIs) [18,19,20]. Most PBMs are located at the C-terminus and classified as either type I (-X-S/T-X-COOH), type II (-X--X-COOH), or type III (-X-D/E-X- COOH) based on the types of residues that make up the motif, where X is any amino acid and is any hydrophobic amino acid [21,22]. Each of the hCoV E proteins is predicted to have a PBM but have only been shown to be functional for the more virulent SARS-CoV-1, -2, and MERS- CoV E proteins [6,16,23,24].
Prior to the coronavirus disease 2019 (COVID-19) outbreak, only five host proteins were identified that could interact with the SARS-CoV-1 E protein PBM [25]. Subsequent studies have expanded this list, identifying various host proteins that bind to the E proteins of SARS- CoV-1, SARS-CoV-2, and MERS-CoV, underscoring the importance of these interactions in the viral life cycle and pathogenesis [16,26,27,28,29,30,31,32]. These studies, however, have focused exclusively on the more virulent hCoVs and the roles of many of these host proteins are not well characterized. The interaction between the hCoV E protein and PALS1 is probably the most well-characterized to date; PALS1 is a cellular protein that forms part of the Crumbs (Crb) complex, which is essential for establishing and maintaining apico-basal polarity alongside other tight junction (TJ) and adherens junction (AJ) protein complexes [23,33,34,35]. The Crb protein, the endogenous ligand of PALS1, contains a PBM (E-R-L-I) that binds to the peptide binding groove of the PALS1 PDZ domain, and the PBMs of the SARS-CoV-1 and -2 E proteins (D-L-L-V) mimic the Crb PBM, binding to many of the same PDZ domain residues on PALS1 [24,34,36,37]. This interaction between the SARS-CoV-1 E protein and the PALS1 PDZ domain redistributes PALS1 away from the TJs to the ER-golgi intermediate compartment (ERGIC) where the E protein accumulates [23]. This delays the formation of TJs and disrupts the development of a uniformly polarized cell monolayer, which reportedly contributes to the desquamation of the alveolar wall seen in post-mortem SARS-CoV-1-infected lung tissue and could facilitate extrapulmonary viral dissemination [23,38,39]. It is currently unclear whether the PBMs of the E proteins of the less virulent HCoV-229E, HCoV-NL63, HCoV-OC43, and HCoV-HKU1 are functional and capable of also binding to PALS1. Therefore, this paper aims to use simulated interactions to determine whether the PBMs of the less virulent hCoV E proteins can also bind to the PALS1 PDZ domain, thereby serving as a determinant of virulence and differentiating more virulent from their less virulent counterparts.
We previously demonstrated the binding of 8-mer peptides from the E proteins of 5 hCoVs to the human PALS1 PDZ domain in accordance with experimentally resolved complexes. This study builds on our previous work by examining whether the E peptides of the less virulent HCoVs 229E and NL63 remain consistently bound to the PALS1 PDZ domain in a manner similar to their more virulent counterparts. To test this hypothesis, we conducted 500-nanosecond (ns) molecular dynamics (MD) simulations using 8-mer peptides of the E proteins of SARS-CoV-1, - 2, MERS-CoV, HCoVs 229E and NL63 in complex with the PALS1 PDZ domain. The simulations were designed to assess the stability of these peptide-PDZ interactions over time. We also included experimentally resolved complexes to provide a comprehensive comparison.
Binding free energy calculations and structural dynamics analysis were employed to evaluate the binding affinities and conformational changes of each complex. We hypothesize that differences in the stability and structural dynamics of these PBM-PDZ complexes may contribute to the variations in virulence observed among hCoVs. Our findings aim to provide insights into the molecular determinants of hCoV virulence and potentially explain the role of the E protein PBM in viral-host interactions. Exploring the molecular determinants of such interactions between viral proteins and host cell PDZ domains can enhance our understanding of their roles in viral replication, transmission, and the severity of diseases they cause.
2. Materials and Methods
2.1. Molecular Dynamics (MD) Simulations: CHARMM-GUI and GROMACS
We previously generated full-length, 3D models of the SARS-CoV-1, -2, MERS-CoV, HCoV- 229E, and HCoV-NL63 E proteins and docked the 8-mer C-terminal peptides derived from these models to the experimentally resolved structure of the PALS1 PDZ domain (PDB ID: 7NTK) [24]. To determine the dynamics of these docked peptide-protein complexes, 500 ns classical MD simulations were performed at full atomistic level using the Groningen Machine for Chemical Simulations (GROMACS) 2023.2 package [40]. Simulations were also performed on the following experimentally resolved complexes which served as controls: the SARS-CoV-1 and -2 E peptides complexed to the PALS1 PDZ domain (PDB IDs 7NTJ and 7NTK), the Crb peptide complexed to the PALS1 PDZ domain (PDB ID: 4UU5), and the PALS1 PDZ domain without any ligand (PDB ID: 4UU6). Our docked peptide-protein complexes were compared to these controls and contained 8-mer peptides of the respective E proteins for a more accurate and reliable comparison. All MD simulations were performed based on the parameters used by previous studies [41,42].
All systems were prepared for MD simulations via the Chemistry at Harvard Macromolecular Mechanics graphical user web interface (CHARMM-GUI) solution builder (https://www.charmm-gui.org/) [43]. Systems were prepared in a 7.1 nm cubic box, solvated with TIP3P water as the solvent, and the total charge of each system was neutralized with 0.15 M NaCl. To neutralize the positive and negative charges of the systems of SARS-CoV-1, -2,
MERS-CoV, HCoV-229E, HCoV-NL63, 7NTJ, 7NTK, 4UU5, and 4UU6, 36, 34, 36, 33, 35, 34, 35, 35, 35 sodium (Na+) ions and 30 chloride (Cl–) ions were added to each system, respectively, using the Monte Carlo method [44]. The modified CHARMM36 (CHARMM36m) all-atom force field was implemented to simulate the physical forces of all systems and the WYF parameter included to accommodate for potential cation-pi interactions [45]. Each system underwent 50 000 steps of the steepest descent during energy minimization, followed by a two-step equilibration with a constant number of particles, volume, and temperature (NVT) and a constant number of particles, pressure, and temperature (NPT), each for 125 ps. The Nose-Hoover thermostat was applied during the NVT equilibration, and position restraints were applied to the peptide-protein complexes; subsequently, for the NPT equilibration, the Parrinello–Rahman barostat was employed at 1 atm, and all restraints were removed. Thereafter, all systems were subjected to a full 500 ns MD run under NPT conditions at 303.15 K, using the Nose-Hoover thermostat with a T-coupling constant of 1 ps, and the Parrinello–Rahman barostat at 1 atm. The Lennard-Jones potential was used to model the van der Waals interactions with a cut-off value of 1.2 nm, long-range electrostatic interactions were calculated with a cut-off for the real space term of 1.2 nm, and all covalent bonds were constrained using the Linear Constraint Solver (LINCS) algorithm.
A time step of 2 fs was employed, and coordinates were saved every 5 ps for all trajectories to be analyzed using standard GROMACS 2023.2 tools. The gmx rmsd command was used to calculate the root mean square deviation (RMSD) of the protein backbone atoms, and gmx rms to calculate the root mean square fluctuation (RMSF) of the protein atoms. The radius of gyration (Rg) for the backbone atoms was calculated using the gmx gyrate tool, while the total solvent accessible surface area (SASA) for the protein atoms was calculated using gmx sasa. Each system was replicated five times for statistical purposes and to determine whether the peptide detached from the PALS1 PDZ domain during the simulation. Only the last 200 ns of all simulations were used for analysis as systems reached equilibrium after 300 ns. Visual Molecular Dynamics (VMD) software (version 1.9.3) was used to visually assess the stability of the different complexes across their trajectories.
2.2. Binding Free Energy Calculations (MM/GBSA): gmx_MMPBSA
The Molecular Mechanics Generalized Born Surface Area (MM/GBSA) is a popular computational method that estimates the binding free energy of biomolecular complexes by calculating the potential energy of the system in a vacuum, the polar solvation energy using the Generalized Born model, and the non-polar solvation energy based on the solvent-accessible surface area. It uses the following expression to describe the binding free energy (ΔGbind):
where ΔEMM is the molecular mechanics energy, which includes contributions from bonded (bond, angle, dihedral) and non-bonded (van der Waals, electrostatic) interactions; ΔGsolvation is the solvation free energy, composed of polar solvation energy (calculated using the Generalized Born model) and non-polar solvation energy (estimated from the solvent-accessible surface area); and TΔS is the entropy contribution.
∆𝐺𝑏𝑖𝑛𝑑 = ∆𝐸𝑀𝑀 + ∆𝐺𝑠𝑜𝑙𝑣𝑎𝑡𝑖𝑜𝑛 − 𝑇∆𝑆
The gmx_MMPBSA package utilizes AMBER's MMPBSA.py algorithm to perform end-state free energy calculations specifically for GROMACS files. The gmx_MMPBSA tool (v1.6.3) was used to calculate the relative binding free energy (MMGBSA) for all complexes, using an input file containing MMGBSA parameters, and computed at a temperature of 298.15 K and a salt concentration of 0.15 M [46,47]. Periodic boundary conditions (PBCs) were removed from all the GROMACS output trajectories prior to running the calculations with gmx_MMPBSA and frames corresponding to the last 200 ns of each trajectory were selected for the calculations. The AMBER force field ff14SB, suitable for protein-only systems, was used to calculate the internal term (ΔEint), van der Waals (ΔEvdW), and electrostatic (ΔEele) energies [48]. The GB-OBC1 model was used to estimate the polar component of the solvation energy (ΔGGB) [49]. The non- polar solvation free energy (ΔGSA) was obtained using the equation:
where SASA represents the solvent-accessible surface area variation of the solute molecule upon complex formation, and γ and β are empirical constants with values of 0.0072 kcal·Å−2·mol−1 and 0, respectively [50,51]. The entropic term was calculated using the Interaction Entropy method [52].
∆𝐺𝑆𝐴 = 𝛾 ∙ 𝑆𝐴𝑆𝐴 + 𝛽
2.3. Secondary Structure Analysis of the E Peptides: gmx dssp
A secondary structural analysis of the E peptides was performed to understand the structural dynamics of the peptides and to determine if the peptides underwent any conformational changes during the simulations that could affect their binding to the PALS1 PDZ domain. The gmx dssp tool was used to analyze the secondary structure of the different E peptides during the last 200 ns of each trajectory. This GROMACS tool interfaces with the Define Secondary Structure of Proteins (DSSP) program to analyze the hydrogen-bonding patterns and geometric features of the peptide backbone. Based on the dihedral angles and hydrogen bonds, each residue is classified into the following secondary structure elements: α-helix, β-sheet, 310-helix, π-helix, κ-helix, polyproline II helix (PPII), turns, loops, and coils [53,54]. Secondary structure analysis was performed on all systems and reported as the frequency with which each residue adopted specific secondary structure elements over the course of the simulation.
2.4. Interaction Analysis Between the hCoV E Peptide and PALS1 Residues: MDAnalysis
The types of interactions that occurred between the peptides and the peptide-binding groove of the PDZ domain during the simulations were calculated using the MDAnalysis python library in conjunction with previously described custom procedures [55,56]. The following continuous, differentiable switching function was used to model the polar and hydrophobic interactions between the peptides and PDZ domain as average coordination numbers:
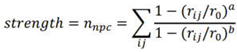
The last four residues of each peptide, which correspond to the PBM, were specified as the residues of interest, and the function used to determine which of the PDZ domain residues interacted with the specified PBM residues. The i and j indices ran over the specified interacting atoms of the peptide and those of the PDZ domain peptide binding groove, with 0 strength ni nj (where ni and nj are the total number of atoms selected for the E peptide and the PALS1 PDZ domain, respectively, able to make the chosen type of interaction). Only carbon atoms were considered for calculating hydrophobic interactions, whereas only oxygen and nitrogen atoms interactions. In the case of salt bridges, π-cation, and π-π interactions, the same function was used, but because virtual atoms are placed at the center of mass of aromatic rings or charged groups, ni and nj were adjusted to ni = nj = 1, resulting in 0 strength 1. The parameters a, b, and r0 were adjusted to a = 6, b = 12, and r0 = 6 Å, 5 Å, 4 Å, 5.5 Å for hydrophobic interactions, salt bridges, π-cation, and π-π interactions, respectively. For polar interactions, these parameters were set to a = 8, b = 12, and r0 = 2.5 Å. The values of r0 were chosen to reflect the typical interaction distance plus the amplitude of thermal motion (e.g., ~4.5 Å + ~1.5 Å for hydrophobic interactions).
3. Results and Discussion
3.1. Trajectory Analysis: RMSD, RMSF, Rg, SASA
The experimental complexes 7NTJ, 7NTK, 4UU5, and 4UU6 exhibited relatively comparable behaviours during the MD simulations but the peptides in the former three nevertheless remained in complex with the PDZ domain for the entire 500 ns simulation (Figure 1A–C, Figure 2A–C, Figure 4A–C and Figure 5A–C). Both the 7NTJ and 7NTK complexes maintained similar low average RMSD values indicative of consistent, stable conformations throughout the simulation (Figure 1A,B, and Table S1). Across each complex, the same residues consistently exhibited notable flexibility: the first five residues, residues 33-45, and the last seven residues, the latter corresponding to the SARS- CoV-1 and -2 E peptides (Figure 2A,B, and Table S2). However, the higher flexibility in these regions is not unexpected since they correspond to flexible loop regions [57,58] (Figure S1). Both E peptides were intrinsically flexible but stable as evident by the low RMSF values of the peptides alone (Figure 3A,B, and Table S3). Both complexes exhibited very similar Rg and SASA data, suggesting that a stable, compact tertiary structure was maintained and that neither experienced significant conformational changes during the simulation (Figure 4A,B, Figure 5A,B, and Tables S4 and S5).
Conversely, the 4UU5 complex was more dynamic with moderate RMSD deviations (Figure 1C and Table S1). The complex nevertheless remained stable and the higher RMSD deviations might merely reflect the particularly dynamic nature of this complex under simulated conditions. The residues across the complex were more flexible than those in the previous two complexes but the most flexible residues were still located in the first five residues, residues 33-45, and the last eight residues, similar to those described in the 7NTJ and 7NTK complexes (Figure 2C and Table S2). The Crb peptide was more flexible than the E peptides of the 7NTJ and 7NTK complexes as reflected by its higher average RMSF values (Figure 3C and Table S3). Despite having experienced larger conformational changes, the Rg and SASA values indicate that the 4UU5 complex had similar Rg and SASA values as the 7NTJ and 7NTK complexes (Figure 4C, Figure 5C, and Tables S4 and S5).
The RMSD values of the 4UU6 structure were consistently lower compared to the peptide-bound complexes of 7NTJ, 7NTK, and particularly 4UU5. This suggests that the absence of a bound peptide and shorter terminal sequences of 4UU6 both contributed to its stable conformation throughout the simulation (Figure 1D and Table S1). The increased structural deviations observed in the peptide-bound complexes are likely driven by conformational adaptations required for peptide binding, as well as the influence of flexible terminal residues absent in 4UU6. While the low RMSD values in 4UU6 suggest structural stability, they more likely reflect the lack of peptide-induced conformational changes and reduced terminal flexibility, rather than intrinsic stability alone. The residues along the protein remained relatively stable, and the peaks in the RMSF data again aligned with the first five residues and residues 33-45, similar to those observed in previous peptide-bound complexes, even in the absence of a bound peptide (Figure 2D and Table S2). This suggests that while the observed flexibility in these regions under simulated conditions may be a characteristic of the PDZ domain itself, it is also likely modulated by peptide binding and terminal flexibility [59,60]. The narrow range of Rg and SASA values reflected a compact tertiary structure with distinct secondary structure elements that underwent minimal solvent exposure, further affirming the stability of the PDZ domain in the absence of peptide interactions (Figure 4D and Figure 5D, and Tables S4 and S5).
Significantly larger fluctuations based on the mean and standard deviation (SD) RMSD values of the SARS-CoV-1 modelled E peptide-protein complex suggests that the complex was unstable and experienced notable conformational changes during the simulation (Figure 1E and Table S1).
While the core protein residues seemed to be more stable, the C-terminal residues, which correspond to the E peptide, exhibited much higher levels of flexibility (Figure 2E, Figure 3E, and Table S2). Considerable fluctuations in the Rg and SASA data is also evident that notable exposure occurred between this complex and the solvent, suggesting that the complex did not maintain a compact structure throughout the simulation (Figure 4E, Figure 5E, and Tables S4 and S5). Visualization of all replicates of this complex in VMD revealed that the SARS-CoV-1 modelled E peptide detached from the PDZ domain during the simulation as validated by the simulation data (Figure S2).
The SARS-CoV-2 modelled E peptide-protein complex, conversely, showed considerably less RMSD fluctuations (Figure 1F and Table S1). Across the complex, most residues were stable with consistent RMSF values, while the first five residues, residues 33-45, and the last eight residues, as in the previous complexes exhibited higher flexibility than the rest of the complex (Figure 2F and Table S2). However, the flexibility of the E peptide was similar to the SARS-CoV-1 modelled E peptide. The Rg and SASA mean and SD values of the SARS-CoV-2 modelled E peptide were similar to that of the 7NTJ and 7NTK experimental complexes (Figure 4F and Figure 5F, and Tables S4 and S5). The MERS-CoV modelled E peptide-protein complex exhibited the most stable structure of the modelled peptide-protein complexes with very low mean and SD RMSD values (Figure 1G and Table S1). Most of the residues across the MERS-CoV modelled E peptide- protein complex were stable with consistent mean and SD RMSF values, while the first five residues, residues 33-45, and the last eight residues, similar to the previous peptide-protein complexes exhibited higher flexibility (Figure 2G and Table S2). The E peptide of the MERS-CoV modelled E peptide-protein complex also demonstrated a particularly low flexibility compared to the SARS-CoV-1, -2, HCoV-229E and HCoV-NL63 modelled E peptide-protein complexes (Figure 4G and Table S4). The Rg and SASA mean and SD values of the MERS-CoV modelled E peptide-protein complex reflect a modelled complex that maintained a consistently stable structure with minimal solvent exposure (Figure 4G, and Tables S4 and S5).
The HCoV-229E modelled E peptide-protein complex exhibited variable results under the same simulated conditions. Replicates 1, 4, and 5 displayed low mean and SD RMSD values comparable to the SARS-CoV-2 and MERS-CoV modelled complexes, whereas replicates 2 and 3 showed higher mean and SD RMSD values (Figure 1H and Table S1). Similarly, across the complexes of replicates 2 and 3, the peptide residues exhibited a much higher flexibility than the other three replicates (Figure 3H and Figure 4H, and Tables S2 and S3). The Rg and SASA mean and SD values of replicates 1, 4, and 5 of the HCoV-229E modelled E peptide-protein complex reflect a compact tertiary structure with minimal solvent exposure, whereas replicates 2 and 3 displayed higher mean and SD Rg and SASA values indicative of solvent exposure consistent with conformational changes experienced during the simulation (Figure 4H, and Tables S4 and S5). Visualization of replicate complexes 2 and 3 in VMD revealed that the HCoV-229E modelled E peptide detached from the PDZ domain during those simulations as shown by the simulation data (Figure S3). The HCoV-NL63 modelled E peptide-protein complex was the most unstable of the modelled complexes, having consistently exhibited the highest mean and SD RMSD values compared to the other four modelled E peptide-protein complexes (Figure 1I and Table S1). Across the complex, the HCoV-NL63 modelled E peptide exhibited the highest mean and SD RMSF values of the modelled peptides (Figure 2I and Figure 3I, and Table S2 and S3). Similarly, the high mean Rg and SASA values of the HCoV-NL63 modelled E peptide-protein complex suggest that the complex unfolded with notably high exposure to the solvent and did not remain compact throughout the simulation (Figure 4I and Figure 5I, and Table S4 and S5). In fact, visualization of simulations in VMD showed that the HCoV-NL63 modelled E peptide detached from the PDZ domain in all replicates (Figure S4).
3.2. Binding Free Energy Calculations (MM/GBSA)
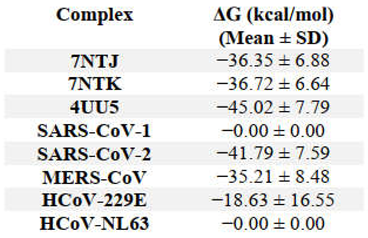
The Crb peptide of 4UU5 exhibited the highest predicted binding affinity (ΔG in kcal/mol) for the PDZ domain, followed by the 7NTK and 7NTJ E peptides. Although previous studies measured the binding affinities of the peptides experimentally as Kd in µM, when these were converted to ΔG for comparison, their data supports the trend observed in our MM/GBSA analysis for these peptides [36,37,41,42,61]. Li et al. [62] and Teoh et al. [23] showed that although the PDZ domain alone is sufficient to study these interactions, Chai et al. [37] and Li et al. [62] demonstrated that the SARS-CoV-2 E and Crb peptides, respectively, exhibit a higher binding affinity for the full-length PALS1 protein. Thus, even though the PDZ domain alone is sufficient to study the binding affinity in this interaction, using the full-length PALS1 protein provides a more holistic, accurate representation. Furthermore, Ivanova et al. [34] found that a longer Crb peptide exhibited a higher binding affinity for the PALS1 PDZ domain, motivating for the use of longer peptides, or even the full-length E protein, to attain better insight into what drives this interaction.
Our SARS-CoV-2 modelled E peptide showed the highest average binding affinity of all modelled E peptides and was comparable to that of the experimental 7NTK complex. Our MERS-CoV E peptide exhibited the second lowest binding affinity and, similar to the 14-mer peptide studied by Lo Cascio et al. [41], remained complexed to the PDZ domain throughout the simulation. However, Javorsky et al. [36] experimentally demonstrated that this E peptide does not bind to the PALS1 PDZ domain, and while this discrepancy does not necessarily invalidate our MM/GBSA data, it does underpin the need to validate computational predictions experimentally. Both our SARS-CoV-1 and HCoV-NL63 modelled E peptides exhibited no measurable binding affinity for the PDZ domain, which supports the earlier simulation data that these modelled peptides detached during the simulation. The average binding affinity HCoV- 229E E peptide should be interpreted with caution since the peptide detached in only two out of the five simulation runs. This was surprising because the 14-mer HCoV-OC43 modelled E peptide of Ivanova et al. [34] detached from the PALS1 PDZ domain consistently during their four 500-ns simulations. This suggests that, under these simulated conditions, some less virulent hCoV E proteins may, in fact, be capable of binding to the PALS1 PDZ domain whereas others might not, further demonstrating the complexity of this interaction.
3.3. Secondary Structure Analysis of the E Peptides: gmx dssp
The 7NTJ and 7NTK E peptides both adopted a predominant loop conformation, with only residues 88-90 having adopted a slightly more rigid κ-helix conformation (Figure 6A,B). More importantly, the PBM residues (90-93) emulated this loop conformation, demonstrating both the flexibility of the SARS-CoV-1 and -2 E peptide C-terminus and the PBM. Both E peptides exhibited this behaviour across the 500 ns simulation, underscoring the stability of the peptide in complex with the PALS1 PDZ domain (Figure S1A,B). This is not unusual since peptides are generally flexible by nature and our previously generated full-length 3D models showed that the C-termini and PBMs of these peptides adopt a flexible loop conformation [24,63,64,65]. The Crb peptide (4UU5) also consistently adopted loop conformations across its residues (Figure 6C). Interestingly, minor bend secondary structures at residues 89-90 immediately upstream of the PBM did not seem to affect the overall flexibility of the Crb peptide, likely because bends are typically less flexible than loop structures, but more flexible than κ-helix structures [66,67]. The Crb peptide maintained this flexible conformation throughout the simulation, and along with the earlier trajectory data from the MD simulations, validates the stability of the 4UU5 complex across all five replicates (Figure S1C).
The SARS-CoV-1 modelled E peptide largely adopted a loop conformation similar to the 7NTJ E peptide, except for PBM residues 91-92 and those just upstream (89-90), which adopted more bend and κ-helical conformations (Figure 6D). The peptide maintained this conformation throughout the simulation (Figure S1D), which, most likely explains why it detached from the PDZ domain. Conversely, the SARS-CoV-2 modelled E peptide adopted a predominant loop conformation comparable to the experimental 7NTK E peptide and this trend was consistent throughout all five simulation replicates (Figure 6E and Figure S1E). Thus, the SARS-CoV-2 modelled E peptide seemed to be more flexible than the modelled SARS-CoV-1 E peptide, but less so than the 7NTK E peptide.
The modelled MERS-CoV E peptide essentially adopted an almost entirely flexible loop conformation, with only residue 89 maintaining a bend conformation (Figure 6F). However, since it falls outside the PBM and bends are more flexible than κ-helices, it likely affects neither the overall flexibility of the PBM nor its binding capacity to the PDZ domain. This demonstrates the flexibility of the peptide and corroborates the stability observed in the simulation parameters.
While there is no experimentally resolved complex of the MERS-CoV E peptide and PALS1 PDZ domain for comparison, Gogl et al. [68] resolved the crystal structure of the MERS-CoV E peptide complexed to sorting nexin-27 (SNX27). The authors noted that despite SNX27 exhibiting a preference for class I PBMs, the class III PBM of MERS-CoV E could still bind to the SNX27 binding pocket—an interaction they attributed to the Trp residue of the E peptide.
Interestingly, previous studies reported that the MERS-CoV E peptide binds to host proteins with higher affinities than the SARS-CoV-1 and -2 E peptides or binds to a comparatively larger number of host proteins [16,28,69]. Therefore, even though Javorsky et al. [36] found no binding affinity between the MERS-CoV E peptide and PALS1 PDZ domain, our secondary structure analysis showed that the peptide and PBM both remain highly flexible, which could facilitate its promiscuity when binding to the PDZ domain of host cell proteins.
Overall, the HCoV-229E and HCoV-NL63 modelled E peptides exhibited a higher frequency of rigid secondary structural elements than the other peptides (Figure 6G–I). These elements, however, were less rigid in the HCoV-229E E peptide as it only detached from the PDZ domain in two of the five runs, whereas the HCoV-NL63 E peptide detached from the PDZ domain in all five runs. In the runs where the HCoV-229E E peptide remained complexed to the PDZ domain, the peptide adopted an overall more flexible loop conformation similar to the previous E peptides, whereas rigid elements were more prevalent in the runs where this E peptide detached from the PDZ domain (Figure 6G,H). Analysis of the HCoV-NL63 E peptide indicates that the higher frequency of bends and κ-helices, along with the lower frequency of loops at residues 89-91, led to its detachment from the PDZ domain (Figure 6I). The persistent helical conformation of these residues throughout all five runs strongly suggests that this rigidity prevented the peptide from stably binding to the PDZ binding groove, despite the flexible loop conformation adopted by PBM residues 92-94 (Figure S5I). Secondary structural analysis of all the E peptides suggests that while the specificity for the PDZ domain may primarily be driven by the PBM residues, the secondary structure of the immediately preceding residues can significantly influence the ability of the PBM to maintain a stable interaction with the PDZ domain [70,71,72].
3.4. Interaction Analysis Between the hCoV E Peptide and PALS1 Residues: MDAnalysis
Our interaction analysis showed that the 7NTJ and 7NTK E peptides formed interactions with PALS1 residues consistent with what was reported by Javorsky et al. [36] who resolved these experimental complexes (Figure 7A,B). Lo Cascio et al. [41] also reported interactions with both R272 and R282, whereas Javorsky et al. [36] and De Maio et al. [42] reported E peptide interactions with either R272 or R282. Interestingly, these peptides also formed interactions with PALS1 residues P266, V284, F318, and L321 which were reported by Chai et al. [37] who resolved the cryo-EM structure of a SARS-CoV-2 18-mer E peptide complexed to the full-length PALS1 protein (PDB ID: 7M4R). The Crb peptide of the 4UU5 complex formed the same types of interactions with the same PALS1 residues as the 7NTJ and 7NTK E peptides did, and these interactions correspond to experimentally resolved structures of Crb in complex with either full- length PALS1 or the PDZ domain alone (Figure 7C).
The detachment of the SARS-CoV-1 modelled E peptide from the PDZ domain is further evident by the low number of interactions with PALS1 residues, none which correspond to previously reported interactions (Figure 7D) [36,37,41,42]. This clearly demonstrates that the peptide does not fully resemble its experimental counterpart and, in conjunction with the secondary structure data, this model could be further refined. Conversely, the SARS-CoV-2 modelled E peptide PBM formed interactions consistent with its experimental counterpart, thereby affirming the validity of this model (Figure 7E). The MERS-CoV modelled E peptide also bound to many similar PALS1 residues observed for the 7NTJ and 7NTK complexes, in agreement with what Lo Cascio et al. [41] reported (Figure 7F). In the runs where the HCoV-229E peptide remained complexed to the PDZ domain, the peptide formed many of the same interactions observed in the experimental structures, albeit to a lesser extent (Figure 7G). However, in runs where the peptide detached from the PDZ domain, it only formed interactions with two of the PALS1 residues that correspond to the peptide binding groove (Figure 7H). Similar to the SARS-CoV-1 modelled E peptide, the limited number of residues with which the HCoV-NL63 E peptide interacted confirms that it detached from the peptide binding groove (Figure 7H).
The E proteins of SARS-CoV-1 and -2 are highly conserved and their PBMs are identical, which explains the markedly similar behaviour that the 7NTJ and 7NTK complexes exhibited [36,73,74,75,76,77]. In fact, even among the SARS-CoV-2 structural proteins, the E protein is highly conserved, reflecting the crucial nature of its role in both the viral lifecycle and pathogenicity [75,76,77,78,79].
However, the sequence similarity of the E proteins between the seven hCoVs is very low [73,74]. This formed the basis for this study: can the diversity of the hCoV E proteins, with specific reference to the PBM, explain the observed difference in their virulence? To a large extent, with the clear exception of our SARS-CoV-1 modelled E peptide, our data shows that the E peptides of the more virulent hCoVs form stable interactions with the peptide binding groove of the PALS1 PDZ domain by consistently remaining in complex for the entire simulation.
As Javorsky et al. [36] proposed, the interaction between the E peptide and PALS1 PDZ domain is defined by the residues that make up the PBMs of the respective E proteins. Data from our study, supported by others, demonstrate that the PBMs of the SARS-CoV-1 and -2 E proteins are indeed functional and facilitate binding to PALS1, thereby emulating the Crb PBM effectively [34,36,37,41,42,62]. Accordingly, stable binding to the PALS1 PDZ domain seems to be based on the following criteria: a negatively charged residue at the start of the PBM, followed by another residue, thereafter a hydrophobic, potentially small residue, and another hydrophobic residue at the end. The PBMs of Crb (E-R-L-I) and the SARS-CoV-1 and -2 E proteins (D-L-L- V) fulfill these criteria well and the overall flexible loop conformations of the peptides validate their stable binding to the PALS1 PDZ domain. However, the PBM of the MERS-CoV E protein (D-E-W-V) does not fully meet these criteria. Javorsky et al. [36] proposed that the Trp residue, despite being hydrophobic, is too large and bulky, thereby prohibiting binding to the PALS1 PDZ binding groove, unlike the smaller Leu residue found in the Crb and SARS-CoV-1 and -2 PBMs at the same position. This, however, merely suggests that the MERS-CoV E protein PBM might not bind to PALS1, but it is still functional as it has been shown to bind to other several host cell proteins [16,68,80]. Neither of the PBMs of the less virulent HCoV-229E E protein (V-I-D-F) and HCoV-NL63 (V-L-N-V), however, satisfy the binding criteria: both PBMs start with two hydrophobic residues, followed by a charged residue, and end in a hydrophobic residue. This would explain, in part, why the majority of our MD simulations with these two peptides did not remain stable. Our data further demonstrates the influence of the residues immediately preceding the PBM on the binding capacity of the peptide.
Our SARS-CoV-1 modelled E peptide consistently detached from the peptide binding groove during our simulations, similar to what Lo Cascio et al. [41] reported for their SARS-CoV-1 modelled E peptide. Our SARS-CoV-1 E peptide was an 8-mer and derived from a model originally generated in Modeller, whereas Lo Cascio et al. [41] used a 14-mer peptide derived from their model generated with Prime, which suggests that neither the modelling software nor the peptide length likely contributed to the peptide detaching from the PDZ domain. However, Lo Cascio et al. [41] did not report changes in the secondary structure of their peptides during their simulations but our data suggests that our SARS-CoV-1 modelled E peptide likely detached due to the sustained rigid secondary structural element that hampered its flexibility, which in turn affected its stability. We also compared the energy-minimised starting structure of our modelled E peptide to that of the experimental E peptide to determine if this may also have contributed to the observed instability of the modelled SARS-CoV-1 E peptide during simulation. Structural alignment revealed a backbone RMSD of 4.162 Å across the full peptide, and 2.278 Å across the PBM, which indicates that the modelled peptides, although identical in amino acid sequence, adopted a different initial conformation, including the PBM region. This may have influenced its interaction with key PALS1 residues, thereby contributing to its eventual detachment from the PDZ domain. The experimental templates used to generate our full-length models lacked a portion of the C-terminus corresponding to a flexible loop region, and the inherent difficulty in modelling such regions may also be a factor. Moreover, these templates are incomplete, as they also lack some N-terminal residues, which further justified the need to generate full-length models of the SARS-CoV-1 and -2 E proteins for our analyses. There are currently no full-length experimentally resolved models of the hCoV E protein. We also validated the full-length E protein models in our previous study by superimposing them onto their respective experimental templates and the RMSD analysis showed low structural deviation, supporting the overall reliability of the models. While we believe the model remains suitable for exploratory analyses, it likely represents only one of several possible conformational states of the SARS-CoV-1 E protein. We therefore advise caution in using this model for tasks that require high-confidence atomic detail in flexible regions.
From our previous study, we anticipated also that the helical element located immediately upstream of the PBM of the HCoV-229E and HCoV-NL63 E proteins would, in part, impede binding to the PALS1 PDZ domain, and data from this study supports this [24]. If this property was also a feature of the HCoV-OC43 E protein, it might explain why the 14-mer HCoV-OC43 E peptide of Lo Cascio et al. [41] detached from the PALS1 PDZ domain in four different MD runs. In support of this, Zhu et al. [81] investigated the impact of the P71L mutation in the SARS-CoV-2 beta variant E protein on its binding affinity with various host proteins, including zonula occludens-1 (ZO-1), membrane protein palmitoylated 5 (MPP5/PALS1), ligand of numb protein X 2 (LNX2), partitioning-defective protein 3 (PARD3), and afadin (AF6/MLLT4).
Located immediately upstream of the E protein's PBM, this mutation exhibited varied effects: it reduced the E protein’s binding affinity for ZO-1, enhanced it for LNX2, eliminated binding to PARD3 and MLLT4, and did not affect the affinity for MPP5. Although the study did not assess the impact of the mutation on the E protein secondary structure, it underscored the influence of residues immediately upstream of the E PBM in modulating host protein interactions.
Although the PBM of the HCoV-229E E protein does not fit the binding criteria, the preceding residues allowed it to adopt a flexible enough conformation that resulted in a stable interaction with the PALS1 PDZ domain as three of our five runs demonstrated. Furthermore, within the context of the model presented by Teoh et al. [23], this data suggests that HCoV-229E could potentially redistribute PALS1 away from TJs and contribute to the desquamation of the alveolar wall similar to what SARS-CoV-1 was reported to do. This could facilitate the spread of HCoV- 229E from the lungs to neural tissue, allowing it to become neuroinvasive as previous studies have shown to be plausible [82,83,84,85,86]. Conversely, neither the composition of the HCoV-NL63 E protein PBM, nor the conformation of the preceding residues permit it to adopt a flexible enough conformation that would form a stable interaction with the PALS1 PDZ domain. This merely demonstrates the inability of the HCoV-NL63 E protein to create a stable interaction with PALS1 and does not mean that it is incapable of interacting with the PDZ domains of other host cell proteins. Moreover, there is currently no clinical evidence to suggest that HCoV-NL63 can spread to other tissues, aligning to the extra-pulmonary dissemination model proposed by Teoh et al. [23]. It is important to note that the data from our simulations merely suggest that the E proteins of HCoV-NL63, and HCoV-229E to some extent, are unable to form stable interactions with the PALS1 PDZ domain under simulated conditions.
Indeed, the genetic variability in the hCoV E proteins clearly plays a significant role in their virulence and previous studies have already demonstrated the importance of the PBM in viral pathogenesis. Studies that used a recombinant SARS-CoV-1 (rSARS-CoV-1) virus from which the E gene (∆E) or its PBM (∆PBM) was deleted or the E PBM mutated (mutPBM) reported a significant reduction in the associated pathology [6,87]. Mice infected with these rSARS-CoV-1 variants experienced less inflammation, decreased levels of pulmonary edema, and had a higher survival rate. More importantly, viruses lacking only the E PBM, either through deletion or mutation, reverted by restoring the original PBM sequence at the E protein C-terminus, whereas viruses lacking the entire E gene partially duplicated the M gene to produce a chimeric protein that restored the E protein function [87]. No revertant mutants were reported yet for SARS-CoV- 2 E. We also only found one study that investigated the importance of the E protein PBM in one of the less virulent hCoVs [88]. While not as detailed as the previous SARS-CoV-1 studies, the study reported that mice infected with a recombinant HCoV-OC43 E mutPBM neither gained weight, nor showed signs of neurological disease compared to the reference virus. These findings are limited but they clearly highlight the critical nature of the E protein and its PBM in viral pathogenesis.
4. Conclusions
To the best of our knowledge, our paper is the first to perform MD simulations on the experimental structures 7NTJ, 7NTK, and 4UU6, and compare them to modelled E peptide- protein complexes to study the difference in virulence between the different hCoVs. Our study demonstrated that the E-PALS1 interaction is complex by highlighting the influence of the PBM residue composition as well as the residues immediately upstream of the PBM which may adopt a flexible loop secondary structure that can contribute to the stability of this interaction. The interactions simulated in this study will need to be validated both in vitro and in vivo, but it does form the basis for further exploration of the extent to the E-PALS1 interaction can contribute to the potential spread of hCoVs from the lungs to other organs during an infection. This, in turn, can provide a platform for a potential pan-coronavirus treatment which can target several hCoVs and, based on the functions of the E protein, not only limit the associated pathology, but also reduce viral transmission by impeding viral assembly and release.
Supplementary Materials
The following supporting information can be downloaded at the website of this paper posted on Preprints.org.
Author Contributions
Dewald Schoeman: Conceptualization, Investigation, Formal analysis, Validation, Visualization, and Writing – Original Draft. Burtram C. Fielding: Conceptualization and Supervision. Ruben Cloete: Conceptualization, Methodology, Visualization, Writing – Review & Editing, and Supervision. All authors have read and agreed to the published version of the manuscript.
Funding
Dewald Schoeman was funded by the National Research Foundation (NRF) of South Africa and the Poliomyelitis Research Foundation (PRF) of South Africa [17/53]. Burtram C. Fielding received funding from the University of the Western Cape (UWC) Senate Research Fund and the NRF of South Africa. Ruben Cloete was funded by the PRF of South Africa [19/06] and the Department of Higher Education next Generation of Academic Programme (nGAP) in the form of full-time academic positions and salaries. Any opinions, findings, and conclusions or recommendations expressed in this material are those of the authors, and therefore, the indicated funding bodies do not accept any liability in regard thereto.
Consent for Publication
Not applicable.
Ethics Approval and Consent to Participate
Ethics approval is not applicable since the publication is based on data that was previously published and not on its own investigations. This study also did not require any participants.
Acknowledgements
The authors would like to acknowledge the use of the Ilifu cloud computing facility – www.ilifu.ac.za, a partnership between the University of Cape Town, the University of the Western Cape, Stellenbosch University, Sol Plaatje University, the Cape Peninsula University of Technology and the South African Radio Astronomy Observatory. The Ilifu facility is supported by contributions from the Inter-University Institute for Data Intensive Astronomy (IDIA – a partnership between the University of Cape Town, the University of Pretoria and the University of the Western Cape), the Computational Biology division at UCT and the Data Intensive Research Initiative of South Africa (DIRISA). The authors express their gratitude to Kelly Fick for assisting with the design of the graphical abstract. The authors also acknowledge the use of BioRender for the creation of the graphical abstract in this study and apologize to any author whose work was inadvertently omitted from this paper.
Conflicts of Interest
The authors declare that they have no competing interests.
References
- Masters, P.S. The molecular biology of coronaviruses. Adv Virus Res. 2006, 66: 193-292. [CrossRef]
- Schoeman, D.; Gordon, B.; Fielding, B.C. Coronaviruses. In: Rezaei N, editor. Encyclopedia of Infection and Immunity. Oxford: Elsevier; 2022. p. 241-58. [CrossRef]
- Su, S.; Wong, G.; Shi, W.; Liu, J.; Lai, A.C.K.; et al. Epidemiology, Genetic Recombination, and Pathogenesis of Coronaviruses. Trends Microbiol. 2016, 24 (6): 490-502. [CrossRef]
- Casadevall, A.; Pirofski, L. Host-pathogen interactions: the attributes of virulence. J Infect Dis. 2001, 184 (3): 337-44. [CrossRef]
- Triggle, C.R.; Bansal, D.; Ding, H.; Islam, M.M.; Farag, E.; et al. A Comprehensive Review of Viral Characteristics, Transmission, Pathophysiology, Immune Response, and Management of SARS-CoV-2 and COVID-19 as a Basis for Controlling the Pandemic. Front Immunol. 2021, 12: 631139. [CrossRef]
- Jimenez-Guardeño, J.M.; Nieto-Torres, J.L.; DeDiego, M.L.; Regla-Nava, J.A.; Fernandez-Delgado, R.; et al. The PDZ-Binding Motif of Severe Acute Respiratory Syndrome Coronavirus Envelope Protein Is a Determinant of Viral Pathogenesis. Plos Pathog. 2014, 10 (8). [CrossRef]
- Gupta, S.; Yla-Anttila, P.; Sandalova, T.; Sun, R.; Achour, A.; Masucci, M.G. 14-3-3 scaffold proteins mediate the inactivation of trim25 and inhibition of the type I interferon response by herpesvirus deconjugases. Plos Pathog. 2019, 15 (11): e1008146. [CrossRef]
- Liu, X.; Matrenec, R.; Gack, M.U.; He, B. Disassembly of the TRIM23-TBK1 Complex by theUs11 Protein of Herpes Simplex Virus 1 Impairs Autophagy. J Virol. 2019, 93 (17). [CrossRef]
- Willey, R.L.; Maldarelli, F.; Martin, M.A.; Strebel, K. Human immunodeficiency virus type 1 Vpu protein induces rapid degradation of CD4. J Virol. 1992, 66 (12): 7193-200. [CrossRef]
- Barro, M.; Patton, J.T. Rotavirus nonstructural protein 1 subverts innate immune response by inducing degradation of IFN regulatory factor 3. Proc Natl Acad Sci USA. 2005, 102 (11): 4114-9. [CrossRef]
- Almazán, F.; DeDiego, M.L.; Sola, I.; Zuñiga, S.; Nieto-Torres, J.L.; et al. Engineering a -Competent, Propagation-Defective Middle East Respiratory Syndrome Coronavirus as a Vaccine Candidate. Mbio. 2013, 4 (5): e00650-13. [CrossRef]
- Boson, B.; Legros, V.; Zhou, B.J.; Siret, E.; Mathieu, C.; et al. The SARS-CoV-2 envelope and membrane proteins modulate maturation and retention of the spike protein, allowing assembly of virus-like particles. J Biol Chem. 2021, 296 (100111). [CrossRef]
- Kuo, L.; Masters, P.S. The Small Envelope Protein E Is Not Essential for Murine Coronavirus Replication. Journal of Virology. 2003, 77 (8): 4597-608. [CrossRef]
- Tseng, Y.T.; Wang, S.M.; Huang, K.J.; Wang, C.T. SARS-CoV envelope protein palmitoylation or nucleocapid association is not required for promoting virus-like particle production. J Biomed Sci. 2014, 21 (34). [CrossRef]
- Westerbeck, J.W.; Machamer, C.E. The Infectious Bronchitis Coronavirus Envelope Protein Alters Golgi pH To Protect the Spike Protein and Promote the Release of Infectious Virus. J Virol. 2019, 93 (11). [CrossRef]
- Caillet-Saguy, C.; Durbesson, F.; Rezelj, V.V.; Gogl, G.; Tran, Q.D.; et al. Host PDZ-containing proteins targeted by SARS-CoV-2. Febs J. 2021, 288 (17): 5148-62. [CrossRef]
- Honrubia, J.M.; Gutierrez-Alvarez, J.; Sanz-Bravo, A.; González-Miranda, E.; Muñoz-Santos, D.; et al. SARS-CoV-2-Mediated Lung Edema and Replication Are Diminished by Cystic Fibrosis Transmembrane Conductance Regulator Modulators. Mbio. 2023, 14 (1). [CrossRef]
- Luck, K.; Charbonnier, S.; Travé, G. The emerging contribution of sequence context to the specificity of protein interactions mediated by PDZ domains. Febs Lett. 2012, 586 (17): 2648-61. [CrossRef]
- Nourry, C.; Grant, S.G.; Borg, J.P. PDZ domain proteins: plug and play! Sci STKE. 2003, 2003 (179): RE7. [CrossRef]
- Luck, K.; Charbonnier, S.; Trave, G. The emerging contribution of sequence context to the specificity of protein interactions mediated by PDZ domains. Febs Lett. 2012, 586 (17): 2648-61. [CrossRef]
- Harris, B.Z.; Lim, W.A. Mechanism and role of PDZ domains in signaling complex assembly. JCell Sci. 2001, 114 (Pt 18): 3219-31. [CrossRef]
- Songyang, Z.; Fanning, A.S.; Fu, C.; Xu, J.; Marfatia, S.M.; et al. Recognition of unique carboxyl- terminal motifs by distinct PDZ domains. Science. 1997, 275 (5296): 73-7. [CrossRef]
- Teoh, K.T.; Siu, Y.L.; Chan, W.L.; Schlüter, M.A.; Liu, C.J.; et al. The SARS Coronavirus E Protein Interacts with PALS1 and Alters Tight Junction Formation and Epithelial Morphogenesis. Mol Biol Cell. 2010, 21 (22): 3838-52. [CrossRef]
- Schoeman, D.; Cloete, R.; Fielding, B.C. The Flexible, Extended Coil of the PDZ-Binding Motif of the Three Deadly Human Coronavirus E Proteins Plays a Role in Pathogenicity. Viruses- Basel. 2022, 14 (8). [CrossRef]
- Schoeman, D.; Fielding, B.C. Coronavirus envelope protein: current knowledge. Virol J. 2019, 16 (1): 69. [CrossRef]
- Gordon, D.E.; Jang, G.M.; Bouhaddou, M.; Xu, J.W.; Obernier, K.; et al. A SARS-CoV-2 protein interaction map reveals targets for drug repurposing. Nature. 2020, 583 (7816): 459. [CrossRef]
- Kruse, T.; Benz, C.; Garvanska, D.H.; Lindqvist, R.; Mihalic, F.; et al. Large scale discovery of coronavirus-host factor protein interaction motifs reveals SARS-CoV-2 specific mechanisms and vulnerabilities. Nat Commun. 2021, 12 (1). [CrossRef]
- Baliova, M.; Jahodova, I.; Jursky, F. A Significant Difference in Core PDZ Interactivity of SARS-CoV, SARS-CoV2 and MERS-CoV Protein E Peptide PDZ Motifs In Vitro. Protein J. 2023, 42 (4): 253-62. [CrossRef]
- Gordon, D.E.; Hiatt, J.; Bouhaddou, M.; Rezelj, V.V.; Ulferts, S.; et al. Comparative host- coronavirus protein interaction networks reveal pan-viral disease mechanisms. Science. 2020, 370 (6521). [CrossRef]
- May, D.G.; Martin-Sancho, L.; Anschau, V.; Liu, S.; Chrisopulos, R.J.; et al. A BioID-Derived Proximity Interactome for SARS-CoV-2 Proteins. Viruses. 2022, 14 (3). [CrossRef]
- Stukalov, A.; Girault, V.; Grass, V.; Karayel, O.; Bergant, V.; et al. Multilevel proteomics reveals host perturbations by SARS-CoV-2 and SARS-CoV. Nature. 2021, 594 (7862): 246-52. [CrossRef]
- Zhou, Y.; Liu, Y.; Gupta, S.; Paramo, M.I.; Hou, Y.; et al. A comprehensive SARS-CoV-2-human protein-protein interactome reveals COVID-19 pathobiology and potential host therapeutic targets. Nat Biotechnol. 2023, 41 (1): 128-39. [CrossRef]
- Shin, K.; Fogg, V.C.; Margolis, B. Tight junctions and cell polarity. Annu Rev Cell Dev Biol. 2006, 22: 207-35. [CrossRef]
- Ivanova, M.E.; Fletcher, G.C.; O'Reilly, N.; Purkiss, A.G.; Thompson, B.J.; McDonald, N.Q. Structures of the human Pals1 PDZ domain with and without ligand suggest gated access of Crb to the PDZ peptide-binding groove. Acta Crystallogr D. 2015, 71: 555-64. [CrossRef]
- Tepass, U. The Apical Polarity Protein Network in Epithelial Cells: Regulation of Polarity, Junctions, Morphogenesis, Cell Growth, and Survival. Annual Review of Cell and Developmental Biology. 2012, 28: 655-85. [CrossRef]
- Javorsky, A.; Humbert, P.O.; Kvansakul, M. Structural basis of coronavirus E protein interactions with human PALS1 PDZ domain. Commun Biol. 2021, 4 (1): 724. [CrossRef]
- Chai, J.; Cai, Y.; Pang, C.; Wang, L.; McSweeney, S.; et al. Structural basis for SARS-CoV-2 envelope protein recognition of human cell junction protein PALS1. Nat Commun. 2021, 12(1): 3433. [CrossRef]
- Kuiken, T.; Fouchier, R.A.M.; Schutten, M.; Rimmelzwaan, G.F.; van Amerongen, G.; et al. Newly discovered coronavirus as the primary cause of severe acute respiratory syndrome. Lancet. 2003, 362 (9380): 263-70. [CrossRef]
- Nicholls, J.M.; Poon, L.L.M.; Lee, K.C.; Ng, W.F.; Lai, S.T.; et al. Lung pathology of fatal severe acute respiratory syndrome. Lancet. 2003, 361 (9371): 1773-8. [CrossRef]
- Abraham, M.J.; Murtola, T.; Schulz, R.; Páll, S.; Smith, J.C.; et al. GROMACS: High performance molecular simulations through multi-level parallelism from laptops to supercomputers. SoftwareX. 2015, 1-2: 19-25. [CrossRef]
- Lo Cascio, E.; Toto, A.; Babini, G.; De Maio, F.; Sanguinetti, M.; et al. Structural determinants driving the binding process between PDZ domain of wild type human PALS1 protein and SLiM sequences of SARS-CoV E proteins. Comput Struct Biotec. 2021, 19: 1838-47. [CrossRef]
- De Maio, F.; Lo Cascio, E.; Babini, G.; Sali, M.; Della Longa, S.; et al.
- COVID-19 pathogenesis. Microbes Infect. 2020, 22 (10): 592-7. [CrossRef]
- Jo, S.; Kim, T.; Iyer, V.G.; Im, W. CHARMM-GUI: a web-based graphical user interface for CHARMM. J Comput Chem. 2008, 29 (11): 1859-65. [CrossRef]
- Hu, J.; Ma, A.; Dinner, A.R. Monte Carlo simulations of biomolecules: The MC module in CHARMM. J Comput Chem. 2006, 27 (2): 203-16. [CrossRef]
- Huang, J.; Rauscher, S.; Nawrocki, G.; Ran, T.; Feig, M.; et al. CHARMM36m: an improved force field for folded and intrinsically disordered proteins. Nat Methods. 2017, 14 (1): 71-3. [CrossRef]
- Miller, B.R.; 3rd McGee, T.D.; Jr Swails, J.M.; Homeyer, N.; Gohlke, H.; Roitberg, A.E. MMPBSA.py: An Efficient Program for End-State Free Energy Calculations. J Chem Theory Comput. 2012, 8 (9): 3314-21. [CrossRef]
- Valdes-Tresanco, M.S.; Valdes-Tresanco, M.E.; Valiente, P.A.; Moreno, E. gmx_MMPBSA: A New Tool to Perform End-State Free Energy Calculations with GROMACS. J Chem Theory Comput. 2021, 17 (10): 6281-91. [CrossRef]
- Maier, J.A.; Martinez, C.; Kasavajhala, K.; Wickstrom, L.; Hauser, K.E.; Simmerling, C. ff14SB: Improving the Accuracy of Protein Side Chain and Backbone Parameters from ff99SB. J Chem Theory Comput. 2015, 11 (8): 3696-713. [CrossRef]
- Onufriev, A.; Bashford, D.; Case, D.A. Exploring protein native states and large-scale conformational changes with a modified generalized born model. Proteins. 2004, 55 (2): 383-94. [CrossRef]
- Sitkoff, D.; Sharp, K.A.; Honig, B. Accurate Calculation of Hydration Free Energies Using Macroscopic Solvent Models. The Journal of Physical Chemistry. 1994, 98 (7): 1978-88. [CrossRef]
- Tan, C.; Tan, Y.H.; Luo, R. Implicit nonpolar solvent models. J Phys Chem B. 2007, 111 (42): 12263-74. [CrossRef]
- Duan, L.; Liu, X.; Zhang, J.Z. Interaction Entropy: A New Paradigm for Highly Efficient and Reliable Computation of Protein-Ligand Binding Free Energy. J Am Chem Soc. 2016, 138(17): 5722-8. [CrossRef]
- Gorelov, S.; Titov, A.; Tolicheva, O.; Konevega, A.; Shvetsov, A. DSSP in GROMACS: Tool for Defining Secondary Structures of Proteins in Trajectories. J Chem Inf Model. 2024, 64 (9): 3593-8. [CrossRef]
- Kabsch, W.; Sander, C. Dictionary of protein secondary structure: pattern recognition of hydrogen-bonded and geometrical features. Biopolymers. 1983, 22 (12): 2577-637. [CrossRef]
- Giacon, N.; Lo Cascio, E.; Davidson, D.S.; Poleto, M.D.; Lemkul, J.A.; et al. Monomeric and dimeric states of human ZO1-PDZ2 are functional partners of the SARS-CoV-2 E protein. Comput Struct Biotechnol J. 2023, 21: 3259-71. [CrossRef]
- Michaud-Agrawal, N.; Denning, E.J.; Woolf, T.B.; Beckstein, O. MDAnalysis: a toolkit for the analysis of molecular dynamics simulations. J Comput Chem. 2011, 32 (10): 2319-27. [CrossRef]
- Mitusińska, K.; Skalski, T.; Góra, A. Simple Selection Procedure to Distinguish between Static and Flexible Loops. International Journal of Molecular Sciences. 2020, 21 (7): 2293. [CrossRef]
- Barozet, A.; Chacon, P.; Cortes, J. Current approaches to flexible loop modeling. Curr Res Struct Biol. 2021, 3: 187-91. [CrossRef]
- Clark, J.J.; Benson, M.L.; Smith, R.D.; Carlson, H.A. Inherent versus induced protein flexibility: Comparisons within and between apo and holo structures. PLoS Comput Biol. 2019, 15 (1): e1006705. [CrossRef]
- Franzoni, L.; Cavazzini, D.; Rossi, G.L.; Lucke, C. New insights on the protein-ligand interaction differences between the two primary cellular retinol carriers. J Lipid Res. 2010, 51 (6): 1332-43. [CrossRef]
- Toto, A.; Ma, S.; Malagrino, F.; Visconti, L.; Pagano, L.; et al. Comparing the binding properties of peptides mimicking the Envelope protein of SARS-CoV and SARS-CoV-2 to the PDZ domain of the tight junction-associated PALS1 protein. Protein Sci. 2020, 29 (10): 2038-42. [CrossRef]
- Li, Y.; Wei, Z.; Yan, Y.; Wan, Q.; Du, Q.; Zhang, M. Structure of Crumbs tail in complex with the PALS1 PDZ-SH3-GK tandem reveals a highly specific assembly mechanism for the apical Crumbs complex. Proc Natl Acad Sci USA. 2014, 111 (49): 17444-9. [CrossRef]
- Ho, B.K.; Dill, K.A. Folding Very Short Peptides Using Molecular Dynamics. PLOS Computational Biology. 2006, 2 (4): e27. [CrossRef]
- Argudo, P.G.; Giner-Casares, J.J. Folding and self-assembly of short intrinsically disordered peptides and protein regions. Nanoscale Adv. 2021, 3 (7): 1789-812. [CrossRef]
- Chandrappa, S.; Madhusudana Reddy, M.B.; Sonti, R.; Basuroy, K.; Raghothama, S.; Balaram, P. Directing peptide conformation with centrally positioned pre-organized dipeptide segments: studies of a 12-residue helix and beta-hairpin. Amino Acids. 2015, 47 (2): 291-301. [CrossRef]
- Mitusinska, K.; Skalski, T.; Gora, A. Simple Selection Procedure to Distinguish between Static and Flexible Loops. Int J Mol Sci. 2020, 21 (7). [CrossRef]
- Zacharias, M.; Hagerman, P.J. The influence of symmetric internal loops on the flexibility of RNA. J Mol Biol. 1996, 257 (2): 276-89. [CrossRef]
- Gogl, G.; Zambo, B.; Kostmann, C.; Cousido-Siah, A.; Morlet, B.; et al. Quantitative fragmentomics allow affinity mapping of interactomes. Nat Commun. 2022, 13 (1): 5472. [CrossRef]
- Pennacchietti, V.; Toto, A. Different electrostatic forces drive the binding kinetics of SARS- CoV, SARS-CoV-2 and MERS-CoV Envelope proteins with the PDZ2 domain of ZO1. Sci Rep. 2023, 13 (1): 7906. [CrossRef]
- Arold, S.; O'Brien, R.; Franken, P.; Strub, M.P.; Hoh, F.; et al. RT loop flexibility enhances the specificity of Src family SH3 domains for HIV-1 Nef. Biochemistry. 1998, 37 (42): 14683-91. [CrossRef]
- de Vega, M.J.; Martin-Martinez, M.; Gonzalez-Muniz, R. Modulation of protein-protein interactions by stabilizing/mimicking protein secondary structure elements. Curr Top Med Chem. 2007, 7 (1): 33-62. [CrossRef]
- Jorgensen, K.W.; Buus, S.; Nielsen, M. Structural properties of MHC class II ligands, implications for the prediction of MHC class II epitopes. PLoS One. 2010, 5 (12): e15877. [CrossRef]
- Duart, G.; Garcia-Murria, M.J.; Grau, B.; AcostA–Caceres, J.M.; Martinez-Gil, L.; Mingarro, I. SARS-CoV-2 envelope protein topology in eukaryotic membranes. Open Biol. 2020, 10 (9): 200209. [CrossRef]
- Schoeman, D.; Fielding, B.C. Is There a Link Between the Pathogenic Human Coronavirus Envelope Protein and Immunopathology? A Review of the Literature. Front Microbiol. 2020, 11: 2086. [CrossRef]
- Abbasian, M.H.; Mahmanzar, M.; Rahimian, K.; Mahdavi, B.; Tokhanbigli, S.; et al. Global landscape of SARS-CoV-2 mutations and conserved regions. J Transl Med. 2023, 21 (1):152. [CrossRef]
- Rahman, M.S.; Hoque, M.N.; Islam, M.R.; Islam, I.; Mishu, I.D.; et al. Mutational insights into the envelope protein of SARS-CoV-2. Gene Rep. 2021, 22: 100997. [CrossRef]
- Wang, Y.; Pan, X.; Ji, H.; Zuo, X.; Xiao, G.F.; et al. Impact of SARS-CoV-2 envelope protein mutations on the pathogenicity of Omicron XBB. Cell Discov. 2023, 9 (1): 80. [CrossRef]
- Li, K.; Melnychuk, S.; Sandstrom, P.; Ji, H. Tracking the evolution of the SARS-CoV-2 Delta variant of concern: analysis of genetic diversity and selection across the whole viral genome. Front Microbiol. 2023, 14: 1222301. [CrossRef]
- Akkiz, H. The Biological Functions and Clinical Significance of SARS-CoV-2 Variants of Corcern. Front Med (Lausanne). 2022, 9: 849217. [CrossRef]
- Gordon, D.E.; Hiatt, J.; Bouhaddou, M.; Rezelj, V.V.; Ulferts, S.; et al. Comparative host- coronavirus protein interaction networks reveal pan-viral disease mechanisms. Science. 2020, 370 (6521). [CrossRef]
- Zhu, Y.; Alvarez, F.; Wolff, N.; Mechaly, A.; Brule, S.; et al. Interactions of Severe Acute Respiratory Syndrome Coronavirus 2 Protein E With Cell Junctions and Polarity PSD- 95/Dlg/ZO-1-Containing Proteins. Front Microbiol. 2022, 13: 829094. [CrossRef]
- Arbour, N.; Day, R.; Newcombe, J.; Talbot, P.J. Neuroinvasion by human respiratory coronaviruses. J Virol. 2000, 74 (19): 8913-21. [CrossRef]
- Arbour, N.; Ekande, S.; Cote, G.; Lachance, C.; Chagnon, F.; et al. Persistent infection of human oligodendrocytic and neuroglial cell lines by human coronavirus 229E. J Virol. 1999, 73 (4): 3326-37. [CrossRef]
- Bonavia, A.; Arbour, N.; Yong, V.W.; Talbot, P.J. Infection of primary cultures of human neural cells by human coronaviruses 229E and OC43. J Virol. 1997, 71 (1): 800-6. [CrossRef]
- Stewart, J.N.; Mounir, S.; Talbot, P.J. Human coronavirus gene expression in the brains of multiple sclerosis patients. Virology. 1992, 191 (1): 502-5. [CrossRef]
- Cristallo, A.; Gambaro, F.; Biamonti, G.; Ferrante, P.; Battaglia, M.; Cereda, P.M. Human coronavirus polyadenylated RNA sequences in cerebrospinal fluid from multiple sclerosis patients. New Microbiol. 1997, 20 (2): 105-14.
- Jimenez-Guardeno, J.M.; Regla-Nava, J.A.; Nieto-Torres, J.L.; DeDiego, M.L.; Castano-Rodriguez, C.; et al. Identification of the Mechanisms Causing Reversion to Virulence in an Attenuated SARS-CoV for the Design of a Genetically Stable Vaccine. Plos Pathog. 2015, 11 (10): e1005215. [CrossRef]
- Stodola, J.K.; Dubois, G.; Le Coupanec, A.; Desforges, M.; Talbot, P.J. The OC43 human coronavirus envelope protein is critical for infectious virus production and propagation in neuronal cells and is a determinant of neurovirulence and CNS pathology. Virology. 2018, 515: 134-49. [CrossRef]
Figure 1.
Root mean square deviation (RMSD) of the backbone atoms of the peptide-PDZ protein complexes. Molecular dynamics (MD) simulations of 500 ns were performed to assess the stability of each of the peptide-PDZ protein complexes. Each simulation was replicated five times. Panels (A-I) depict the backbone RMSD (nm) of the different peptide-PDZ protein complexes across the 500 ns trajectories for each of the five replicates. (A) Experimentally resolved structure of the SARS-CoV-1 E peptide in complex with the PALS1 PDZ domain (PDB ID: 7NTJ), (B) Experimentally resolved structure of the SARS-CoV-2 E peptide in complex with the PALS1 PDZ domain (PDB ID: 7NTK), (C) Experimentally resolved structure of the Crumbs (Crb) peptide in complex with the PALS1 PDZ domain (PDB ID: 4UU5), (D) Experimentally resolved structure of the PALS1 PDZ domain (PDB ID: 4UU6), (E) SARS-CoV-1 modelled E peptide docked to the PALS1 PDZ domain, (F) SARS-CoV-2 modelled E peptide docked to the PALS1 PDZ domain, (G) MERS-CoV modelled E peptide docked to the PALS1 PDZ domain, (H) HCoV-229E modelled E peptide docked to the PALS1 PDZ domain, and (I) HCoV-NL63 modelled E peptide docked to the PALS1 PDZ domain. Different colours represent individual replicates (Replicate 1-5).
Figure 2.
Root mean square fluctuation (RMSF) of the protein residues that comprise the peptide-PDZ protein complexes. Molecular dynamics (MD) simulations of 500 ns were performed to assess the flexibility of the residues of each peptide-PDZ protein complex. Each simulation was replicated five times. Panels (A-I) depict the RMSF fluctuations (nm) in the protein residues of the different peptide-PDZ protein complexes across the 500 ns trajectories for each of the five replicates. Regions corresponding to the first five residues, residues 33-45, and the last eight residues exhibited the highest flexibility. (A) Experimentally resolved structure of the SARS-CoV-1 E peptide in complex with the PALS1 PDZ domain (PDB ID: 7NTJ), (B) Experimentally resolved structure of the SARS-CoV-2 E peptide in complex with the PALS1 PDZ domain (PDB ID: 7NTK), (C) Experimentally resolved structure of the Crumbs (Crb) peptide in complex with the PALS1 PDZ domain (PDB ID: 4UU5), (D) Experimentally resolved structure of the PALS1 PDZ domain (PDB ID: 4UU6), (E) SARS-CoV-1 modelled E peptide docked to the PALS1 PDZ domain, (F) SARS-CoV-2 modelled E peptide docked to the PALS1 PDZ domain, (G) MERS-CoV modelled E peptide docked to the PALS1 PDZ domain, (H) HCoV-229E modelled E peptide docked to the PALS1 PDZ domain, and (I) HCoV-NL63 modelled E peptide docked to the PALS1 PDZ domain. Different colours represent individual replicates (Replicate 1-5).
Figure 3.
Root mean square fluctuation (RMSF) of residues of the different 8-mer peptides. Molecular dynamics (MD) simulations of 500 ns were performed to assess the flexibility of each of the peptides complexed to the PALS1 PDZ protein. Each simulation was replicated five times. Panels (A-I) depict the RMSF fluctuations (nm) in the residues of the different peptides complexed to the PALS1 PDZ domain across the 500 ns trajectories for each of the five replicates. (A) Experimentally resolved structure of the SARS-CoV-1 E peptide in complex with the PALS1 PDZ domain (PDB ID: 7NTJ), (B) Experimentally resolved structure of the SARS- CoV-2 E peptide in complex with the PALS1 PDZ domain (PDB ID: 7NTK), (C) Experimentally resolved structure of the Crumbs (Crb) peptide in complex with the PALS1 PDZ domain (PDB ID: 4UU5), (D) SARS-CoV-1 modelled E peptide docked to the PALS1 PDZ domain, (E) SARS-CoV-2 modelled E peptide docked to the PALS1 PDZ domain, (F) MERS- CoV modelled E peptide docked to the PALS1 PDZ domain, (G) HCoV-229E modelled E peptide docked to the PALS1 PDZ domain, and (H) HCoV-NL63 modelled E peptide docked to the PALS1 PDZ domain. Different colours represent individual replicates (Replicate 1-5).
Figure 4.
Radius of gyration (Rg) of the backbone atoms of the peptide-PDZ protein complexes. Molecular dynamics (MD) simulations were performed to assess conformational changes in each of the peptide-PDZ protein complexes over 500 ns. Each simulation was replicated five times. Panels (A-I) depict the Rg (nm) of the backbone atoms of the different peptide-PDZ protein complexes across the 500 ns trajectories for each of the five replicates. (A) Experimentally resolved structure of the SARS-CoV-1 E peptide in complex with the PALS1 PDZ domain (PDB ID: 7NTJ), (B) Experimentally resolved structure of the SARS-CoV-2 E peptide in complex with the PALS1 PDZ domain (PDB ID: 7NTK), (C) Experimentally resolved structure of the Crumbs (Crb) peptide in complex with the PALS1 PDZ domain (PDB ID: 4UU5), (D) Experimentally resolved structure of the PALS1 PDZ domain (PDB ID: 4UU6), (E) SARS-CoV-1 modelled E peptide docked to the PALS1 PDZ domain, (F) SARS-CoV-2 modelled E peptide docked to the PALS1 PDZ domain, (G) MERS-CoV modelled E peptide docked to the PALS1 PDZ domain, (H) HCoV-229E modelled E peptide docked to the PALS1 PDZ domain, and (I) HCoV-NL63 modelled E peptide docked to the PALS1 PDZ domain. Different colours represent individual replicates (Replicate 1-5).
Figure 5.
Total solvent accessible surface area (SASA) of the protein atoms for the peptide- PDZ protein complexes. Molecular dynamics (MD) simulations were performed to assess solvent exposure of each of the peptide-PDZ protein complexes over 500 ns. Each simulation was replicated five times. Panels (A-H) depict the surface area (nm2) for the different peptide- PDZ protein complexes across the 500 ns trajectories for each of the five replicates. (A) Experimentally resolved structure of the SARS-CoV-1 E peptide in complex with the PALS1 PDZ domain (PDB ID: 7NTJ), (B) Experimentally resolved structure of the SARS-CoV-2 E peptide in complex with the PALS1 PDZ domain (PDB ID: 7NTK), (C) Experimentally resolved structure of the Crumbs (Crb) peptide in complex with the PALS1 PDZ domain (PDB ID: 4UU5), (D) Experimentally resolved structure of the PALS1 PDZ domain (PDB ID: 4UU6), (E) SARS-CoV-1 modelled E peptide docked to the PALS1 PDZ domain, (F) SARS-CoV-2 modelled E peptide docked to the PALS1 PDZ domain, (G) MERS-CoV modelled E peptide docked to the PALS1 PDZ domain, (H) HCoV-229E modelled E peptide docked to the PALS1 PDZ domain, and (I) HCoV-NL63 modelled E peptide docked to the PALS1 PDZ domain. Different colours represent individual replicates (Replicate 1-5).
Figure 6.
Frequency of secondary structural elements adopted by the peptide residues in the different peptide-PDZ protein complexes during the last 200 ns of the molecular dynamics (MD) simulations. The secondary structural elements adopted by each of the different E peptides were determined using the gmx dssp function in GROMACS. Panels (A-I) illustrate the frequency of secondary structural elements—loop, bend, or helix—that each residue of the peptide adopted during the last 200 ns of the molecular dynamics (MD) simulations. (A) Experimentally resolved structure of the SARS-CoV-1 E peptide in complex with the PALS1 PDZ domain (PDB ID: 7NTJ), (B) Experimentally resolved structure of the SARS-CoV-2 E peptide in complex with the PALS1 PDZ domain (PDB ID: 7NTK), (C) Experimentally resolved structure of the Crumbs (Crb) peptide in complex with the PALS1 PDZ domain (PDB ID: 4UU5), (D) SARS-CoV-1 modelled E peptide docked to the PALS1 PDZ domain, (E) SARS- CoV-2 modelled E peptide docked to the PALS1 PDZ domain, (F) MERS-CoV modelled E peptide docked to the PALS1 PDZ domain, (G) HCoV-229E modelled E peptide docked to the PALS1 PDZ domain (runs in which the E peptide remained complexed to the PDZ domain), (H) HCoV-229E modelled E peptide docked to the PALS1 PDZ domain (runs in which the E peptide detached from the PDZ domain), and (I) HCoV-NL63 modelled E peptide docked to the PALS1 PDZ domain.
Figure 7.
Residue-Specific Interactions Between Peptide Residues and the PALS1 PDZ Domain. Specific interactions between the residues of the different peptide’s PDZ-binding motif (PBM) and the corresponding residues within the PALS1 PDZ domain were analyzed during the last 200 ns of the trajectories using MDAnalysis. The residues shown are those found on the PDZ domain, and the type of interaction formed is indicated: hydrophobic (purple), salt bridge (navy), polar (green), and hydrogen bond (cyan). (A) Experimentally resolved structure of the SARS-CoV-1 E peptide in complex with the PALS1 PDZ domain (PDB ID: 7NTJ), (B) Experimentally resolved structure of the SARS-CoV-2 E peptide in complex with the PALS1 PDZ domain (PDB ID: 7NTK), (C) Experimentally resolved structure of the Crumbs (Crb) peptide in complex with the PALS1 PDZ domain (PDB ID: 4UU5), (D) SARS-CoV-1 modelled E peptide docked to the PALS1 PDZ domain, (E) SARS-CoV-2 modelled E peptide docked to the PALS1 PDZ domain, (F) MERS-CoV modelled E peptide docked to the PALS1 PDZ domain, (G) HCoV-229E modelled E peptide docked to the PALS1 PDZ domain (runs in which E peptide remained complexed to the PDZ domain), (H) HCoV-229E modelled E peptide docked to the PALS1 PDZ domain (runs in which E peptide detached from the PDZ domain), and (I) HCoV-NL63 modelled E peptide docked to the PALS1 PDZ domain.

Table 1.
Molecular Mechanics Generalized Born Surface Area (MM/GBSA) Free Energy Calculations for Peptide-PDZ Domain Complexes. Binding free energy calculations using Molecular Mechanics Generalized Born Surface Area (MM/GBSA) was performed to assess the total free energy change (ΔG) for each peptide-PDZ protein complex. The table shows the total ΔG for each peptide-PDZ protein complex, where ΔG was calculated based on the formula: ΔG = Complex – Receptor – Ligand. The data for each peptide-PDZ protein complex is expressed as the mean ΔG value ± standard deviation (SD) of the five replicates and calculated during the last 200 ns of the trajectories. 7NTJ: Experimentally resolved structure of the SARS-CoV-1 E peptide in complex with the PALS1 PDZ domain, 7NTK: Experimentally resolved structure of the SARS-CoV-2 E peptide in complex with the PALS1 PDZ domain, 4UU5: Experimentally resolved structure of the Crumbs (Crb) peptide in complex with the PALS1 PDZ domain, SARS- CoV-1: SARS-CoV-1 modelled E peptide docked to the PALS1 PDZ domain, SARS-CoV-2: SARS-CoV-2 modelled E peptide docked to the PALS1 PDZ domain, MERS-CoV: MERS-CoV modelled E peptide docked to the PALS1 PDZ domain, HCoV-229E: HCoV-229E modelled E peptide docked to the PALS1 PDZ domain, and HCoV-NL63: HCoV-NL63 modelled E peptide docked to the PALS1 PDZ domain
 |
Disclaimer/Publisher’s Note: The statements, opinions and data contained in all publications are solely those of the individual author(s) and contributor(s) and not of MDPI and/or the editor(s). MDPI and/or the editor(s) disclaim responsibility for any injury to people or property resulting from any ideas, methods, instructions or products referred to in the content. |
© 2025 by the authors. Licensee MDPI, Basel, Switzerland. This article is an open access article distributed under the terms and conditions of the Creative Commons Attribution (CC BY) license (http://creativecommons.org/licenses/by/4.0/).
Copyright: This open access article is published under a Creative Commons CC BY 4.0 license, which permit the free download, distribution, and reuse, provided that the author and preprint are cited in any reuse.


