Submitted:
31 May 2025
Posted:
02 June 2025
You are already at the latest version
Abstract
Background/Objectives: T2 mapping is a quantitative magnetic resonance im-aging (MRI) technique that provides information about tissue water content and molecu-lar mobility. This study aimed to evaluate the diagnostic utility of T2 mapping in as-sessing sacroiliitis associated with spondyloarthropathy (SpA). Methods: A prospective study examined 31 SpA patients and 25 healthy controls who underwent sacroiliac joint MRI between August 2018 and August 2020. T2 mapping images were generated using multi-echo turbo spin echo (TSE) sequences, and quantitative T2 relaxation times were measured from bone and cartilage regions. Statistical analysis employed appropriate parametric and non-parametric tests with significance set at p< 0.05. Results: The mean T2 relaxation time measured from the areas with osteitis of SpA patients (100.23 ± 7.41 ms) was significantly higher than that of the control group in normal bone (69.44 ± 4.37 ms), and this difference was found to be statistically significant (p< 0.001). No significant dif-ference was observed between cartilage T2 relaxation times in SpA patients and controls (p>0.05). Conclusions: T2 mapping serves as a valuable quantitative imaging biomarker for diagnosing sacroiliitis associated with SpA, particularly through detecting inflamma-tory bone changes. The technique shows promise for objective disease assessment, though larger studies are needed to establish standardized reference values for T2 relaxation times in osteitis to enhance diagnostic accuracy and facilitate treatment monitoring.
Keywords:
T2 mapping
; T2 relaxation time
; sacroiliac joint
; sacroiliitis
; osteitis
1. Introduction
The sacroiliac joint is the widest axial joint in the body, located between the sacrum and ilium bones, with an average surface area of 17.5 cm², and it is defined as a diarthrodial synovial joint [1]. Sacroiliac joint consists of two parts with different joint characteristics. The first part is located along the anterior and inferior aspects of the joint, covered with cartilage, and has a synovial joint characteristic. The second part is located on the posterior and superior aspect, joined with the interosseous ligaments, and has a syndesmotic joint characteristic [2]. The sacroiliac joint is a complex structure that can develop a variety of degenerative changes during one's life, including subchondral sclerosis, vacuum phenomenon, subchondral cyst, joint space narrowing and ankylosis [3,4]. These age-related changes, combined with inflammatory conditions, can significantly affect joint function and cause chronic pain. Among the inflammatory conditions that commonly affect the sacroiliac joint, spondyloarthropathies represent the most clinically significant group.
Spondyloarthropathies (SpAs) represent a group of chronic rheumatic disorders with similar epidemiological, pathological, genetic, clinical, and radiological features [5]. This group consists of ankylosing spondylitis, arthritis associated with inflammatory bowel disease (IBD), reactive arthritis (previously Reiter syndrome), undifferentiated SpA, and psoriatic arthritis [6]. In 2009, the Assessment of Spondyloarthritis İnternational Society (ASAS) guidelines were published to provide standardization in the clinical and diagnostic approach to SpAs [7]. Magnetic resonance imaging (MRI) is a very crucial component of the ASAS criteria for evaluating sacroiliitis. MRI can evaluate not only the active findings of sacroiliitis such as osteitis, enthesitis, capsulitis, and synovitis, but also chronic findings such as subchondral sclerosis, periarticular fat deposition, periarticular erosions, and ankylosis [8]. The main sequences used in sacroiliac joint MRI are coronal and axial oblique fat-suppressed fast spin echo T2, short tau inversion recovery (STIR), spectral attenuated inversion recovery (SPAIR) sequences, and axial and coronal oblique plane fast spin echo T1-weighted sequences [8].
The earliest finding in sacroiliitis is osteitis [8]. Osteitis is the only criterion accepted by ASAS for the diagnosis of sacroiliitis, and the presence of other active inflammation findings (enthesitis, capsulitis, and synovitis) alone or together is not significant for sacroiliitis if there is no osteitis [8,9]. Osteitis is seen in almost 90% of SpA patients, but it can also be seen in other inflammatory (such as rheumatoid arthritis, Behçet's disease, etc.) and infectious pathologies affecting the sacroiliac joint [10]. According to the ASAS criteria, in order to diagnose sacroiliitis, osteitis should be present in at least two different areas in a single slice or in at least two consecutive slices in the same area [7].
In recent years, several advanced imaging methods have been developed to provide quantitative information about SpA, including dynamic contrast-enhanced MRI (DCE-MRI), T2 mapping, diffusion-weighted imaging (DWI), and the dual-energy computed tomography (DECT) virtual non-calcium technique [11]. Among these quantitative techniques, T2 mapping is a promising MRI method that calculates the T2 relaxation times of various tissues and displays them on a parametric color map, offering objective tissue characterization beyond conventional morphological assessment.
T2 mapping images are generated by acquiring multiple echo time images from the same anatomical slice, then pixel-wise matching these images to calculate the T2 relaxation times for each corresponding location, ultimately creating a quantitative parametric map [12]. The T2 relaxation time is calculated using a weighted least squares fit with the natural logarithm of the region of interests (ROIs) mean signal [13]. Using the multi-echo spin echo (MESE), T2 prepared steady-state free precession (T2p-SSFP), and T2 gradient spin echo (T2-GraSE) sequences, a T2 mapping image can be created [14,15,16]. Independent of the imaging technique, a series of images are obtained from the same slice using multiple echo times. After processing these images with specialized software, a signal decay curve is generated for each pixel that eventually reflects the T2 relaxation times [17].
T2 relaxation times vary depending on the amount of water protons in the tissue and the anisotropy of the tissue matrix [18,19,20]. It is stated that the increase in the T2 relaxation time of a tissue is primarily related to an increased water content in that tissue, which reflects edema [14]. Given this sensitivity to tissue water content and structural changes, T2 mapping has found applications in various clinical scenarios. Research has shown that T2 mapping can be utilized to assess radiation-induced damage to the parotid gland [21], supraspinatus tendon pathologies [22], myocardial edema [23], and liver ischemia and reperfusion injury [24]. In addition to these various clinical applications, T2 mapping has gained significant attention in the field of joint and cartilage evaluation, being successfully applied to numerous joint cartilages, including those of the knee, interphalangeal, and glenohumeral joints [25,26,27]. T2 relaxation times are increased in damaged cartilage due to structural damage in the collagen tissue, decreased glycosaminoglycan content, increased water content, and increased water molecule motility [28,29,30]. T2 mapping serves as a non-invasive imaging method capable of detecting early-stage cartilage damage and monitoring treatment response in patients undergoing cartilage repair [31]. While T2 mapping has been extensively validated in other joints, research on the sacroiliac joint remains limited due to its complex anatomical structure, with only a few studies investigating this application [13,14,32]. Therefore, this study aims to evaluate the diagnostic potential of T2 mapping in detecting sacroiliitis associated with spondyloarthropathies.
2. Materials and Methods
2.1. Study Population
This study was approved by the institutional research ethics committee of Gülhane Training and Research Hospital (Decision No.: 18/146, Date: May 22, 2018). A prospective evaluation was performed on 56 adult participants referred from various clinics to our radiology unit. All participants were informed about the study procedures, and written informed consent was obtained. Prior to MRI, demographic data (e.g., age, sex), clinical data, laboratory findings, and any relevant pathological diagnoses were recorded and securely stored.
The SpA group included patients whose symptoms (inflammatory back pain, arthritis, enthesitis) and laboratory findings (C-reactive protein [CRP], human leukocyte antigen-B27 [HLA-B27]) satisfied the ASAS criteria, along with evidence of osteitis on conventional MRI. The healthy control group comprised individuals over 18 years of age who did not meet any ASAS criteria, had no evidence of infective-rheumatologic sacroiliitis, had no history of sacroiliac joint trauma, presented with normal laboratory results, and exhibited no radiological signs of sacroiliitis on MRI.
Exclusion criteria consisted of claustrophobia, the presence of medical devices incompatible with MRI, and images deemed uninterpretable due to artifacts.
2.2. MRI Protocol
All MRI examinations were conducted on a 3 Tesla MRI scanner (Achieva; Philips Medical Systems, Best, Netherlands) equipped with a 32-channel torso coil. In addition to the routine MRI sequences employed for sacroiliac joint imaging (Table 1), an axial oblique multi-echo turbo spin echo (TSE) sequence was used to generate T2 mapping images (Table 2).
2.3. Image Processing and T2 Relaxation Time Measurement
Due to the lack of dedicated T2 mapping software on our MRI workstation, the open-source software MRmap version 1.4 was used to generate T2 mapping images [33,34]. T2 mapping images were generated from source images acquired with a multi-echo TSE pulse sequence, with specific TE values used for each image (Figure 1). T2 calculations were performed using a 2-parameter Levenberg-Marquardt curve fitting procedure for the formula y = A exp(-TE / T2) [33].
T2 mapping images were created from selected slices from the upper, middle, and lower portions of the joint in both SpA and control groups. In this context, a total of 168 T2 mapping images (56 cases × 3 slices) were included in the evaluation. Since the software allowed pixel-level sampling, multiple measurements (five measurements per region) were performed from the relevant regions to enhance measurement accuracy, and their median values were calculated.
In the SpA group, T2 relaxation times were measured from areas with osteitis and their adjacent cartilage (Figure 2). Measurements from areas with osteitis were performed from regions where edema was most prominent. In the control group, T2 relaxation times were measured from normal bone (sacral and iliac parts) and cartilage from both anterior and posterior portions of the joint in each slice (Figure 3). Since the syndesmotic regions of the sacroiliac joint do not contain cartilage, no measurements were performed from these areas. To avoid affecting the measurements, no measurements were taken from severely damaged cartilage that could not be evaluated near areas with osteitis, or from areas suspected of vacuum phenomena/joint fluid. In total, T2 relaxation times were measured from 268 areas with osteitis in the SpA group and from 600 different normal bone regions (25 cases × 2 sacroiliac joints × 12 bone regions) in the control group. T2 relaxation times were measured from 70 cartilage regions adjacent to areas with osteitis in the SpA group and from 200 cartilage regions in the control group.
2.4. Statistical Analysis
All statistical analyses were performed using IBM SPSS 25 software (IBM Corp., Armonk, NY, USA). Normality was tested using the Kolmogorov-Smirnov test. For groups with normally distributed data, the independent samples t-test was applied, whereas the Mann-Whitney U test was used for groups not meeting the normality assumption. A Chi-square test was conducted to compare gender distribution. All continuous data were reported as mean ± standard deviation (Mean ± SD) regardless of distribution, whereas categorical data were described using frequencies (n) and percentages (%). P-value <0.05 was considered statistically significant.
3. Results
A total of 56 participants were included in this study, comprising 31 SpA patients (15 men and 16 women) and 25 healthy controls (11 men and 14 women). The mean age of the control group was 37.2 ± 9.6 years, while the mean age of the SpA group was 35.4 ± 13.0 years (Table 3). No statistically significant difference was observed between the SpA and control groups with respect to sex or age (p>0.05).
The frequencies of ASAS criteria observed among SpA patients are presented in Table 4. All SpA patients demonstrated active sacroiliitis on conventional MRI. Moreover, elevated CRP levels (77.4%) and inflammatory back pain (61.2%) were more prevalent than the other criteria in these patients. Crohn’s disease or ulcerative colitis was not identified in any patient.
Table 5 shows the mean T2 relaxation times, measured through T2 mapping, of bone and cartilage tissues in both the SpA and control groups. The mean T2 relaxation time for areas with osteitis in SpA patients (100.23 ± 7.41 ms) was significantly higher than that of the control group (69.44 ± 4.37 ms) (p<0.001) (Table 5). No significant difference was detected between the mean T2 relaxation time of cartilage adjacent to areas with osteitis in SpA patients (44.0 ± 3.19 ms) and that of cartilage in the control group (43.2 ± 3.41 ms) (p=0.249) (Table 5).
4. Discussion
In this study, we investigated the diagnostic potential of T2 mapping imaging in patients with SpA sacroiliitis. In our literature review, we have found that there are limited number of T2 mapping studies conducted for the sacroiliac joint [13,14,32,35].
Findings of this study were comparable to previous reports investigating the effect of SpA on T2 relaxation time. Specifically, we determined that the mean T2 relaxation times of the areas with osteitis (100.23 ± 7.41 ms) were higher compared to the healthy control group (69.44 ± 4.37 ms), a behavior also observed by Dongdong et al. This group also found the mean T2 relaxation times of the areas with osteitis in ankylosing spondylitis patients (123.77 ± 15.85 ms) to be higher compared to the healthy control group (89.34 ± 10.65 ms) [32]. In another study, Zhang et al. found that the mean T2 relaxation time in osteitis areas (104.7 ms) was higher than normal bone tissue (91.8 ± 14.3 ms) [11]. The inflammatory process in osteitis areas is characterized by a rich presence of fibroblasts, lymphocytes, and macrophages [36]. In our study, we postulated the prolongation of T2 relaxation time in areas with osteitis to be related to increased water content due to inflammation.
Previous studies by Lefebvre et al. and Albano et al. have established the feasibility and reliability of T2 mapping imaging methodology in healthy populations [13,14]. In the study by Lefebvre et al., the mean T2 values measured by two independent observers were 41.9 ms and 40.8 ms, with an overall mean of 41.6 ms. Similarly, Albano et al. reported T2 values of 42 ms and 40.7 ms from two observers, with a combined mean of 41.1 ms [13,14]. The mean cartilage T2 relaxation time observed in our healthy control group (43.2 ± 3.41 ms) was in accordance with previously established values in the literature. Albano et al. reported in another study that SpA patients exhibited higher mean T2 relaxation times in sacroiliac cartilage (58.5 ± 4.4 ms) relative to healthy individuals (44.1 ± 6.6 ms) [35]. Our study revealed no statistically significant difference in mean cartilage T2 relaxation times between the healthy control and SpA groups. This result can be explained by our methodology of excluding severely damaged cartilage tissue in the vicinity of areas with osteitis that precluded accurate assessment.
Radiography, CT, and MRI are commonly used in the assessment of the sacroiliac joint in current clinical practice. With radiography and CT imaging techniques, structural changes that appear later, such as subchondral sclerosis, periarticular erosions, joint space narrowing and ankylosis can be reliably demonstrated in the sacroiliac joint [2,37]. Although radiography and CT imaging methods can reliably reveal late-stage structural changes, they are not successful in detecting active lesions of sacroiliitis in the early stages. Therefore, delays can occur in the treatment of sacroiliitis. On the other hand, MRI can not only reveal late-stage structural changes but also successfully demonstrate active lesions in the early stages of sacroiliitis [8]. Today, the success of MRI in diagnosing sacroiliitis is indisputable. According to the ASAS criteria, presence of bone marrow edema, or osteitis in other words, is diagnostic parameter for sacroiliitis [10]. In the demonstration of the osteitis, fat-suppressed T2-weighted images such as STIR, SPAIR, and fat-suppressed contrast-enhanced T1-weighted images are used. However, both radiography/CT and conventional MRI provide us with the opportunity for qualitative evaluation of the sacroiliac joint. T2 mapping, on the other hand, provides quantitative data in osteitis assessment. The clinical potential of T2 mapping extends beyond simple detection of osteitis. This quantitative approach offers several advantages over conventional imaging methods: First, T2 mapping can provide objective, numerical values that may enhance diagnostic accuracy and reduce inter-observer variability commonly encountered in qualitative MRI assessment. Second, the quantitative nature of T2 mapping makes it particularly valuable for monitoring disease progression and treatment response, as subtle changes in tissue composition can be detected through T2 relaxation time measurements even before they become visually apparent on conventional sequences. Third, T2 mapping may serve as a biomarker for early inflammatory changes, potentially identifying subclinical osteitis before it reaches the threshold for visual detection on standard MRI sequences. Additionally, T2 mapping is a non-invasive imaging technique, which does not require any contrast agent injection [38,39]. In clinical practice, T2 mapping could be integrated into routine MRI protocols to provide quantitative assessment, potentially improving diagnostic confidence, especially in borderline cases where conventional MRI findings may be ambiguous.
Despite its usefulness in quantification, obtaining multi-echo sequence and processing the images are rather time consuming. In our study, it took 6 minutes and 53 seconds to obtain multi-echo images for each patient. Lefebvre and colleagues collected data in 12 minutes and 49 seconds for each patient, while Albano and colleagues performed the task in 5 minutes and 42 seconds [13,14]. We predict that with the new technological developments in the future, T2 mapping imaging can be done in a shorter time. Also, the multi-echo sequence required for generating T2 mapping images is very sensitive to motion artifacts, which can negatively affect image processing [40]. In addition, interpretation of T2 mapping images is operator dependent, which can also affect, the measured T2 relaxation times [41].
There are some limitations with this study. Firstly, the morphologic characteristics of the sacroiliac joint posed challenges, as the restricted area made it difficult to examine the cartilage components thoroughly. Secondly, although we attempted to avoid them during measurements, the vacuum phenomenon and joint fluid, which are frequently observed in the sacroiliac joint, may have affected our T2 measurements. Thirdly, despite performing multiple measurements and taking their average, our findings may have been influenced by our pixel-level sampling approach. Fourthly, potential calculation errors due to the partial volume effect of surrounding tissues may have affected our results. Fifthly, the absence of inter-observer repeatability assessment represents a limitation of our methodology. Finally, our study was carried out with a small sample size, and a reference T2 relaxation time could not be determined for osteitis. Working with larger patient groups is necessary to establish a reference T2 relaxation time for osteitis.
5. Conclusions
In conclusion, T2 mapping imaging was evaluated as a successful imaging technique for distinguishing areas with osteitis from normal bone tissue. Findings of this study demonstrated that the T2 mapping can be used as a tool for the diognosis of sacroiliitis associated with SpA. In the future, working with larger patient groups and determining a reference T2 relaxation value for osteitis through T2 mapping imaging may be beneficial in both diagnosing SpA sacroiliitis and evaluating the effectiveness of applied treatments.
Author Contributions
Conceptualization, M.K.; methodology, M.K. and K.N.A; validation, M.K., and K.N.A; formal analysis, M.K.; investigation, M.K.; resources, M.K.; data curation, M.K.; writing—original draft preparation, M.K.; writing—review and editing, M.K. and K.N.A; visualization, K.N.A.; supervision, K.N.A. All authors have read and agreed to the published version of the manuscript.
Funding
This research received no external funding.
Institutional Review Board Statement
This study was approved by the institutional research ethics committee of Gülhane Training and Research Hospital (Decision No.: 18/146, Date: May 22, 2018).
Informed Consent Statement
Informed consent was obtained from all subjects involved in the study.
Data Availability Statement
The data presented in this study are available upon request from the corresponding author. The data are not publicly available due to privacy.
Acknowledgments
During the preparation of this manuscript, the authors used Claude Sonnet 4 (developed by Anthropic, San Francisco, CA, USA) for text generation, editing, and translation between languages. The authors have reviewed and edited all outputs and take full responsibility for the content of this publication.
Conflicts of Interest
The authors declare no conflicts of interest. The funders had no role in the design of the study; in the collection, analyses, or interpretation of data; in the writing of the manuscript; or in the decision to publish the results.
References
- Cohen, S.P. Sacroiliac joint pain: a comprehensive review of anatomy, diagnosis, and treatment. Anesthesia & Analgesia 2005, 101, 1440–1453. [Google Scholar]
- Tsoi, C.; Griffith, J.F.; Lee, R.K.L.; Wong, P.C.H.; Tam, L.S. Imaging of sacroiliitis: Current status, limitations and pitfalls. Quant Imaging Med Surg 2019, 9, 318–335. [Google Scholar] [CrossRef] [PubMed]
- Cihan, O.F.; Karabulut, M.; Kilincoglu, V.; Yavuz, N. The variations and degenerative changes of sacroiliac joints in asymptomatic adults. Folia Morphol (Warsz) 2021, 80, 87–96. [Google Scholar] [CrossRef] [PubMed]
- Demir, M.; Mavi, A.; Gümüsburun, E.; Bayram, M.; Gürsoy, S.; Nishio, H. Anatomical variations with joint space measurements on CT. Kobe J Med Sci 2007, 53, 209–217. [Google Scholar]
- Sudol-Szopinska, I.; Urbanik, A. Diagnostic imaging of sacroiliac joints and the spine in the course of spondyloarthropathies. Pol J Radiol 2013, 78, 43–49. [Google Scholar] [CrossRef]
- Rudwaleit, M.; Khan, M.A.; Sieper, J. The challenge of diagnosis and classification in early ankylosing spondylitis: do we need new criteria? Arthritis Rheum 2005, 52, 1000–1008. [Google Scholar] [CrossRef]
- Sieper, J.; Rudwaleit, M.; Baraliakos, X.; Brandt, J.; Braun, J.; Burgos-Vargas, R.; Dougados, M.; Hermann, K.G.; Landewé, R.; Maksymowych, W.; et al. The Assessment of SpondyloArthritis international Society (ASAS) handbook: a guide to assess spondyloarthritis. Ann Rheum Dis 2009, 68 Suppl 2, ii1–44. [Google Scholar] [CrossRef]
- Navallas, M.; Ares, J.; Beltrán, B.; Lisbona, M.P.; Maymó, J.; Solano, A. Sacroiliitis associated with axial spondyloarthropathy: new concepts and latest trends. Radiographics 2013, 33, 933–956. [Google Scholar] [CrossRef]
- Ozgen, A. The Value of the T2-Weighted Multipoint Dixon Sequence in MRI of Sacroiliac Joints for the Diagnosis of Active and Chronic Sacroiliitis. AJR Am J Roentgenol 2017, 208, 603–608. [Google Scholar] [CrossRef]
- Banegas Illescas, M.E.; López Menéndez, C.; Rozas Rodríguez, M.L.; Fernández Quintero, R.M. [New ASAS criteria for the diagnosis of spondyloarthritis: diagnosing sacroiliitis by magnetic resonance imaging]. Radiologia 2014, 56, 7–15. [Google Scholar] [CrossRef]
- Zhang, K.; Liu, C.; Zhu, Y.; Li, W.; Li, X.; Zheng, J.; Hong, G. Synthetic MRI in the detection and quantitative evaluation of sacroiliac joint lesions in axial spondyloarthritis. Front Immunol 2022, 13, 1000314. [Google Scholar] [CrossRef] [PubMed]
- Quirbach, S.; Trattnig, S.; Marlovits, S.; Zimmermann, V.; Domayer, S.; Dorotka, R.; Mamisch, T.C.; Bohndorf, K.; Welsch, G.H. Initial results of in vivo high-resolution morphological and biochemical cartilage imaging of patients after matrix-associated autologous chondrocyte transplantation (MACT) of the ankle. Skeletal Radiol 2009, 38, 751–760. [Google Scholar] [CrossRef] [PubMed]
- Lefebvre, G.; Bergere, A.; Rafei, M.E.; Duhamel, A.; Teixeira, P.; Cotten, A. T2 Mapping of the Sacroiliac Joints With 3-T MRI: A Preliminary Study. AJR Am J Roentgenol 2017, 209, 389–394. [Google Scholar] [CrossRef] [PubMed]
- Albano, D.; Chianca, V.; Cuocolo, R.; Bignone, R.; Ciccia, F.; Sconfienza, L.M.; Midiri, M.; Brunetti, A.; Lagalla, R.; Galia, M. T2-mapping of the sacroiliac joints at 1.5 Tesla: a feasibility and reproducibility study. Skeletal Radiol 2018, 47, 1691–1696. [Google Scholar] [CrossRef]
- Huang, T.Y.; Liu, Y.J.; Stemmer, A.; Poncelet, B.P. T2 measurement of the human myocardium using a T2-prepared transient-state TrueFISP sequence. Magn Reson Med 2007, 57, 960–966. [Google Scholar] [CrossRef]
- Baessler, B.; Schaarschmidt, F.; Stehning, C.; Schnackenburg, B.; Maintz, D.; Bunck, A.C. Cardiac T2-mapping using a fast gradient echo spin echo sequence - first in vitro and in vivo experience. J Cardiovasc Magn Reson 2015, 17, 67. [Google Scholar] [CrossRef]
- Sabouri, S.; Chang, S.D.; Savdie, R.; Zhang, J.; Jones, E.C.; Goldenberg, S.L.; Black, P.C.; Kozlowski, P. Luminal Water Imaging: A New MR Imaging T2 Mapping Technique for Prostate Cancer Diagnosis. Radiology 2017, 284, 451–459. [Google Scholar] [CrossRef]
- Harrison, R.; Bronskill, M.J.; Henkelman, R.M. Magnetization transfer and T2 relaxation components in tissue. Magn Reson Med 1995, 33, 490–496. [Google Scholar] [CrossRef]
- Henkelman, R.M.; Stanisz, G.J.; Kim, J.K.; Bronskill, M.J. Anisotropy of NMR properties of tissues. Magn Reson Med 1994, 32, 592–601. [Google Scholar] [CrossRef]
- Packer, K.J. The dynamics of water in heterogeneous systems. Philos Trans R Soc Lond B Biol Sci 1977, 278, 59–87. [Google Scholar] [CrossRef]
- Zhou, N.; Chu, C.; Dou, X.; Chen, W.; He, J.; Yan, J.; Zhou, Z.; Yang, X. Early evaluation of radiation-induced parotid damage in patients with nasopharyngeal carcinoma by T2 mapping and mDIXON Quant imaging: initial findings. Radiat Oncol 2018, 13, 22. [Google Scholar] [CrossRef] [PubMed]
- Ece, B.; Yigit, H.; Ergun, E.; Koseoglu, E.N.; Karavas, E.; Aydin, S.; Kosar, P.N. Quantitative Analysis of Supraspinatus Tendon Pathologies via T2/T2* Mapping Techniques with 1.5 T MRI. Diagnostics (Basel) 2023, 13. [Google Scholar] [CrossRef] [PubMed]
- Baessler, B.; Luecke, C.; Lurz, J.; Klingel, K.; von Roeder, M.; de Waha, S.; Besler, C.; Maintz, D.; Gutberlet, M.; Thiele, H.; et al. Cardiac MRI Texture Analysis of T1 and T2 Maps in Patients with Infarctlike Acute Myocarditis. Radiology 2018, 289, 357–365. [Google Scholar] [CrossRef] [PubMed]
- Hueper, K.; Lang, H.; Hartleben, B.; Gutberlet, M.; Derlin, T.; Getzin, T.; Chen, R.; Abou-Rebyeh, H.; Lehner, F.; Meier, M.; et al. Assessment of liver ischemia reperfusion injury in mice using hepatic T(2) mapping: Comparison with histopathology. J Magn Reson Imaging 2018, 48, 1586–1594. [Google Scholar] [CrossRef]
- Dunn, T.C.; Lu, Y.; Jin, H.; Ries, M.D.; Majumdar, S. T2 relaxation time of cartilage at MR imaging: comparison with severity of knee osteoarthritis. Radiology 2004, 232, 592–598. [Google Scholar] [CrossRef]
- Lazovic-Stojkovic, J.; Mosher, T.J.; Smith, H.E.; Yang, Q.X.; Dardzinski, B.J.; Smith, M.B. Interphalangeal joint cartilage: high-spatial-resolution in vivo MR T2 mapping--a feasibility study. Radiology 2004, 233, 292–296. [Google Scholar] [CrossRef]
- Maizlin, Z.V.; Clement, J.J.; Patola, W.B.; Fenton, D.M.; Gillies, J.H.; Vos, P.M.; Jacobson, J.A. T2 mapping of articular cartilage of glenohumeral joint with routine MRI correlation--initial experience. HSS J 2009, 5, 61–66. [Google Scholar] [CrossRef]
- Mosher, T.J.; Dardzinski, B.J. Cartilage MRI T2 relaxation time mapping: overview and applications. Semin Musculoskelet Radiol 2004, 8, 355–368. [Google Scholar] [CrossRef]
- Matzat, S.J.; McWalter, E.J.; Kogan, F.; Chen, W.; Gold, G.E. T2 Relaxation time quantitation differs between pulse sequences in articular cartilage. J Magn Reson Imaging 2015, 42, 105–113. [Google Scholar] [CrossRef]
- Keenan, K.E.; Besier, T.F.; Pauly, J.M.; Han, E.; Rosenberg, J.; Smith, R.L.; Delp, S.L.; Beaupre, G.S.; Gold, G.E. Prediction of glycosaminoglycan content in human cartilage by age, T1rho and T2 MRI. Osteoarthritis Cartilage 2011, 19, 171–179. [Google Scholar] [CrossRef]
- White, L.M.; Sussman, M.S.; Hurtig, M.; Probyn, L.; Tomlinson, G.; Kandel, R. Cartilage T2 assessment: differentiation of normal hyaline cartilage and reparative tissue after arthroscopic cartilage repair in equine subjects. Radiology 2006, 241, 407–414. [Google Scholar] [CrossRef] [PubMed]
- Wang, D.; Yin, H.; Liu, W.; Li, Z.; Ren, J.; Wang, K.; Han, D. Comparative analysis of the diagnostic values of T2 mapping and diffusion-weighted imaging for sacroiliitis in ankylosing spondylitis. Skeletal Radiol 2020, 49, 1597–1606. [Google Scholar] [CrossRef] [PubMed]
- Messroghli, D.R.; Rudolph, A.; Abdel-Aty, H.; Wassmuth, R.; Kuhne, T.; Dietz, R.; Schulz-Menger, J. An open-source software tool for the generation of relaxation time maps in magnetic resonance imaging. BMC Med Imaging 2010, 10, 16. [Google Scholar] [CrossRef] [PubMed]
- SourceForge. MRmap v1.4. Available online: https://sourceforge.net/p/mrmap/mailman/message/30100362/ (accessed on January, 2021).
- Albano, D.; Bignone, R.; Chianca, V.; Cuocolo, R.; Messina, C.; Sconfienza, L.M.; Ciccia, F.; Brunetti, A.; Midiri, M.; Galia, M. T2 mapping of the sacroiliac joints in patients with axial spondyloarthritis. Eur J Radiol 2020, 131, 109246. [Google Scholar] [CrossRef]
- Hermann, K.G.; Bollow, M. Magnetic resonance imaging of sacroiliitis in patients with spondyloarthritis: correlation with anatomy and histology. Rofo 2014, 186, 230–237. [Google Scholar] [CrossRef]
- Tuite, M.J. Sacroiliac joint imaging. Semin Musculoskelet Radiol 2008, 12, 72–82. [Google Scholar] [CrossRef]
- Dautry, R.; Bousson, V.; Manelfe, J.; Perozziello, A.; Boyer, P.; Loriaut, P.; Koch, P.; Silvestre, A.; Schouman-Claeys, E.; Laredo, J.D.; et al. Correlation of MRI T2 mapping sequence with knee pain location in young patients with normal standard MRI. Jbr-btr 2014, 97, 11–16. [Google Scholar] [CrossRef]
- Qian, W.; Chen, W.; Xu, X.Q.; Wu, F.Y. T2 mapping of the extraocular muscles in healthy volunteers: preliminary research on scan-rescan and observer-observer reproducibility. Acta Radiol 2020, 61, 804–812. [Google Scholar] [CrossRef]
- Lüsse, S.; Claassen, H.; Gehrke, T.; Hassenpflug, J.; Schünke, M.; Heller, M.; Glüer, C.C. Evaluation of water content by spatially resolved transverse relaxation times of human articular cartilage. Magn Reson Imaging 2000, 18, 423–430. [Google Scholar] [CrossRef]
- Wiesmueller, M.; Wuest, W.; Heiss, R.; Treutlein, C.; Uder, M.; May, M.S. Cardiac T2 mapping: robustness and homogeneity of standardized in-line analysis. J Cardiovasc Magn Reson 2020, 22, 39. [Google Scholar] [CrossRef]
Figure 1.
Conversion of multi-echo turbo spin echo images to a T2 mapping image using MRmap v1.4 software.
Figure 1.
Conversion of multi-echo turbo spin echo images to a T2 mapping image using MRmap v1.4 software.
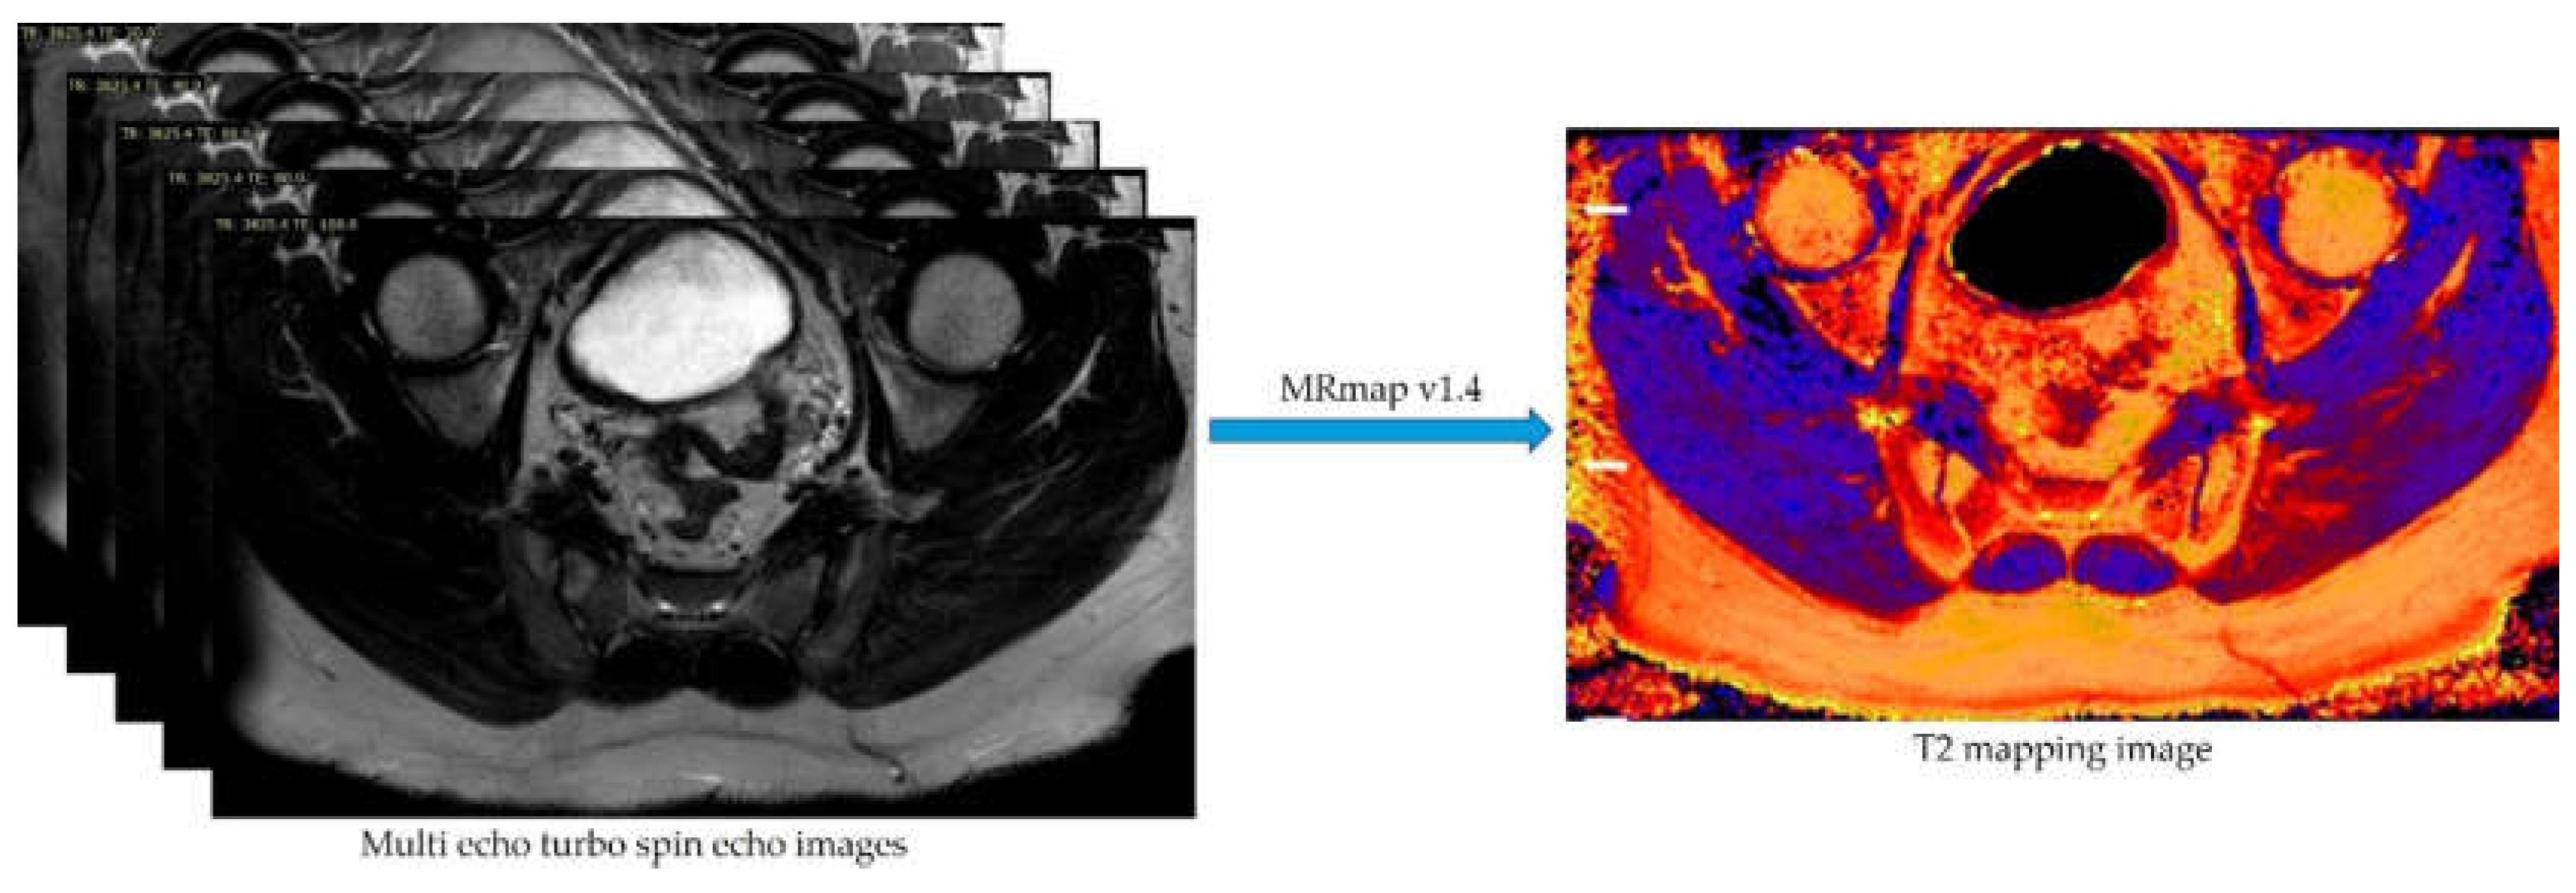
Figure 2.
Images of a 31-year-old male patient with spondyloarthritis (SpA)-associated sacroiliitis. A. Coronal oblique turbo spin echo (TSE) T1-weighted image of the sacroiliac joints demonstrates hypointense areas representing bone marrow edema/osteitis in bilateral sacroiliac joints (white arrows). B. Axial oblique TSE spectral attenuated inversion recovery (SPAIR) image obtained through the lower sacroiliac joint level reveals hyperintense signal abnormalities consistent with osteitis, particularly prominent in the right sacroiliac joint (white arrows). C. Axial oblique T2 mapping image acquired at the corresponding lower sacroiliac joint level, with osteitis indicated by white arrows. D. T2 relaxation time curve derived from the sacral component of the right sacroiliac joint, demonstrating an elevated T2 relaxation time of 114 ms. E. T2 relaxation time curve obtained from the anterior cartilaginous region of the right sacroiliac joint, showing a T2 relaxation time of 46 ms.
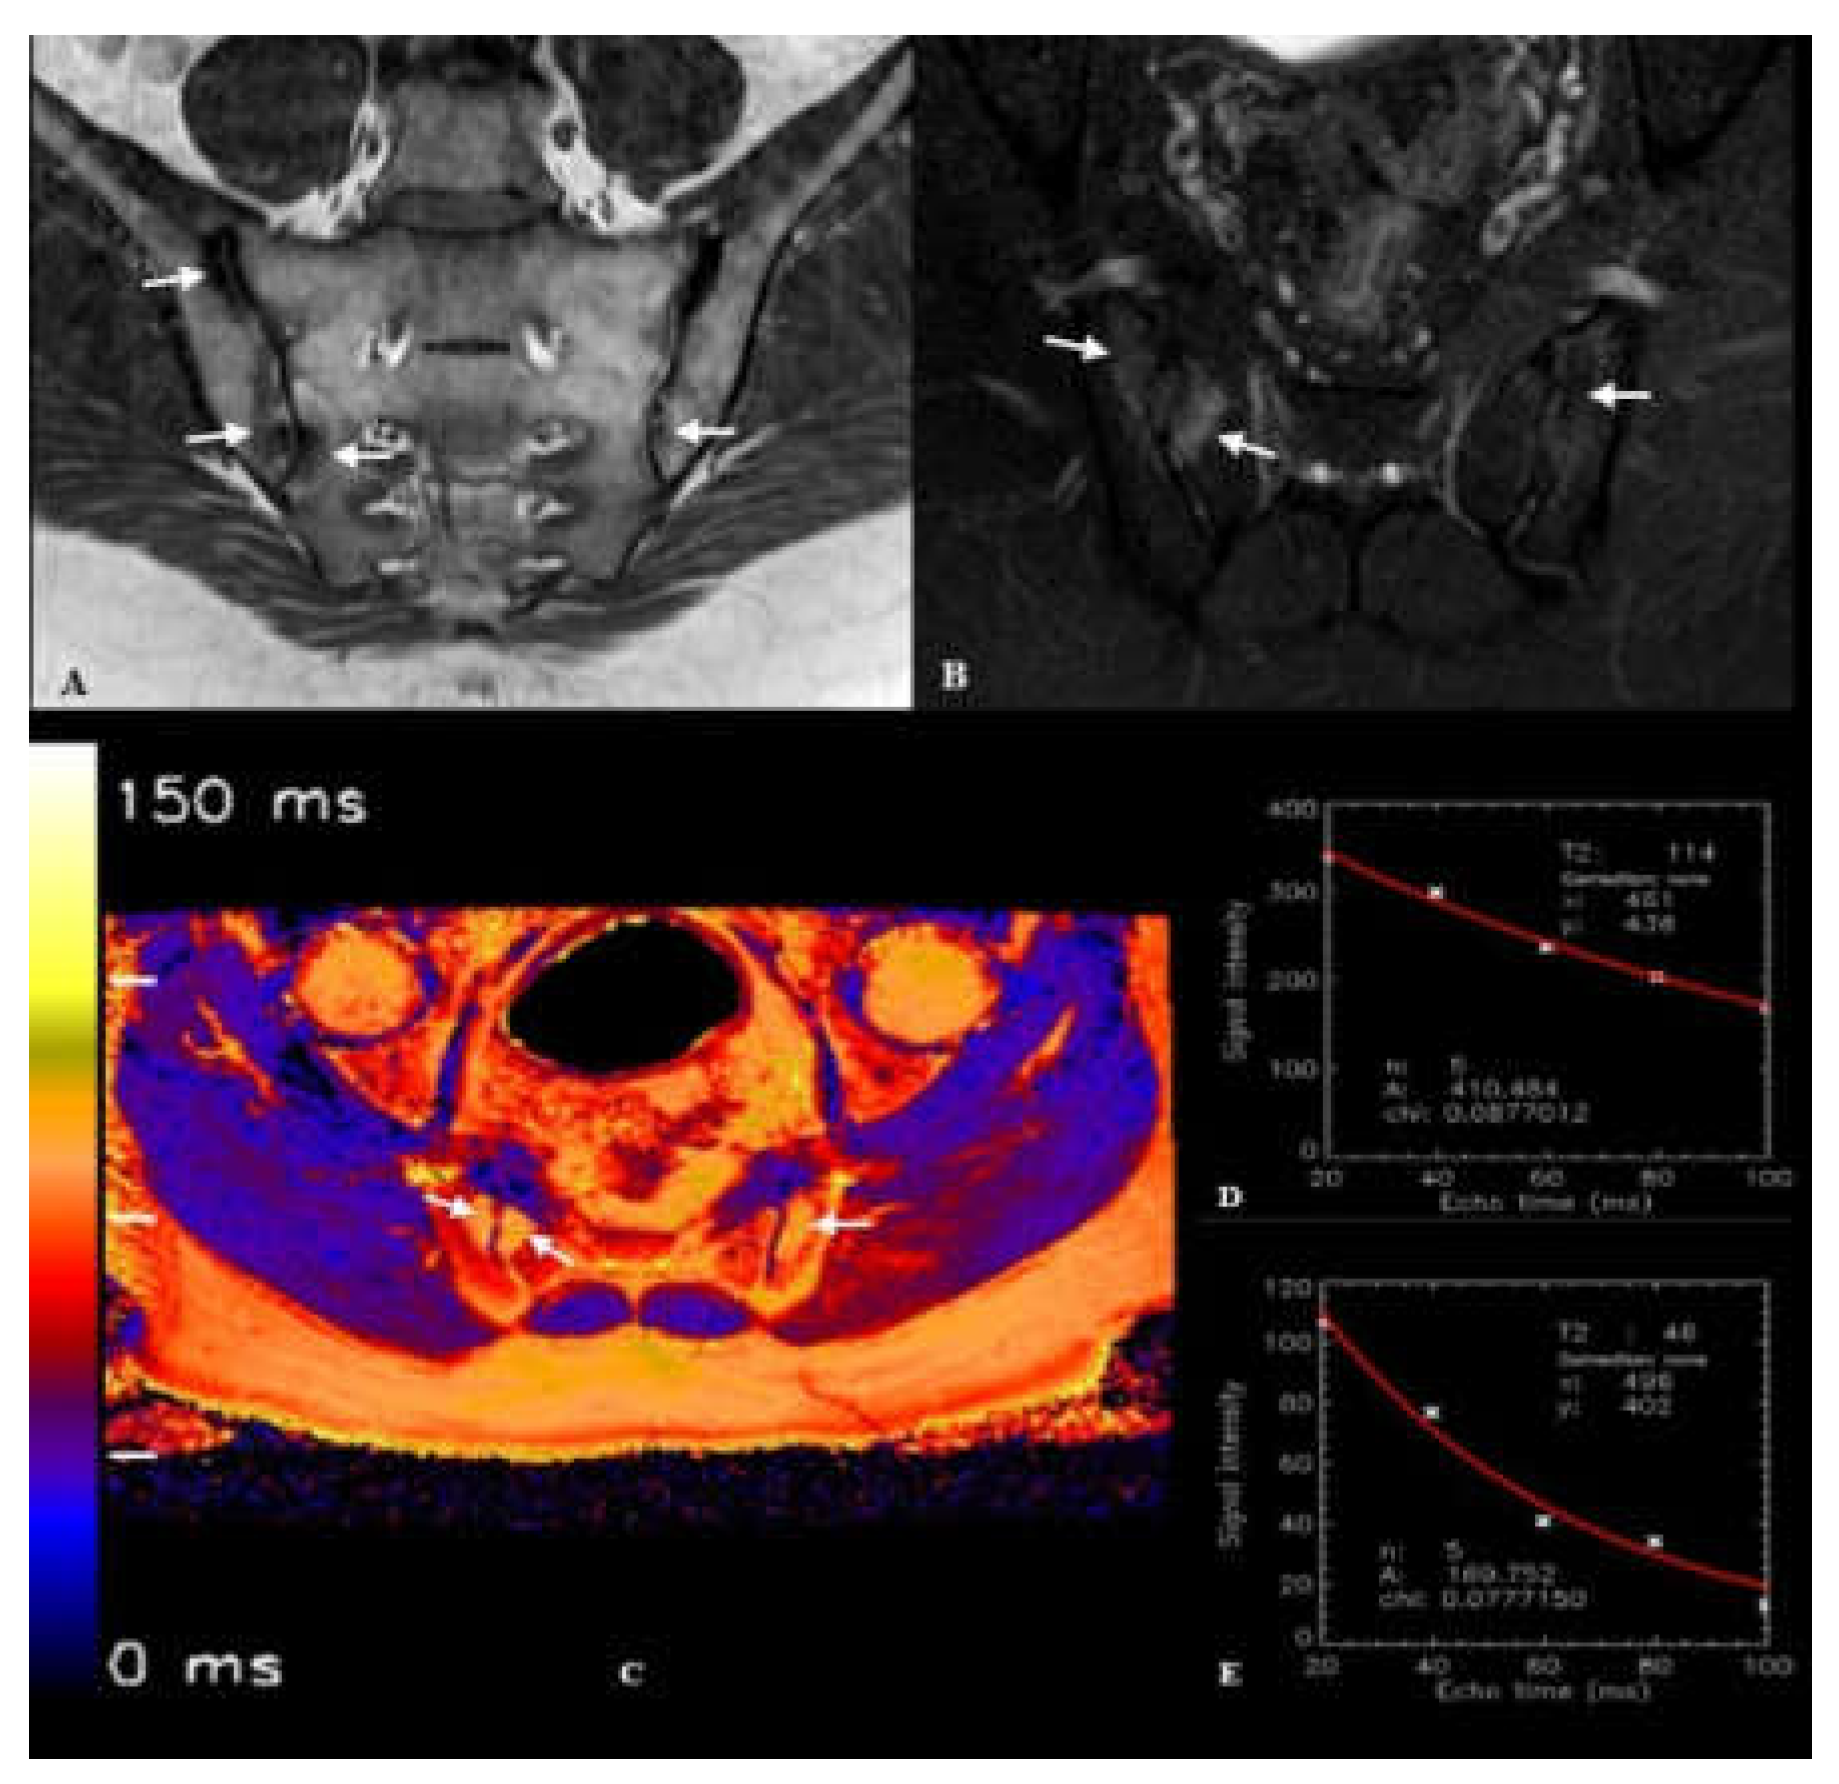
Figure 3.
Images of a 40-year-old male patient with normal sacroiliac joint anatomy. A. Coronal oblique turbo spin echo (TSE) T1-weighted image demonstrates normal morphology of bilateral sacroiliac joints. B. Axial oblique TSE spectral attenuated inversion recovery (SPAIR) image through the lower sacroiliac joint level shows normal signal characteristics in both sacroiliac joints without evidence of bone marrow edema or structural abnormalities. C. Axial oblique T2 mapping image obtained at the corresponding lower sacroiliac joint level. D. T2 relaxation time curve derived from the sacral component of the left sacroiliac joint, demonstrating a T2 relaxation time of 75 ms. E. T2 relaxation time curve obtained from the anterior cartilaginous region of the left sacroiliac joint, showing a T2 relaxation time of 44 ms.
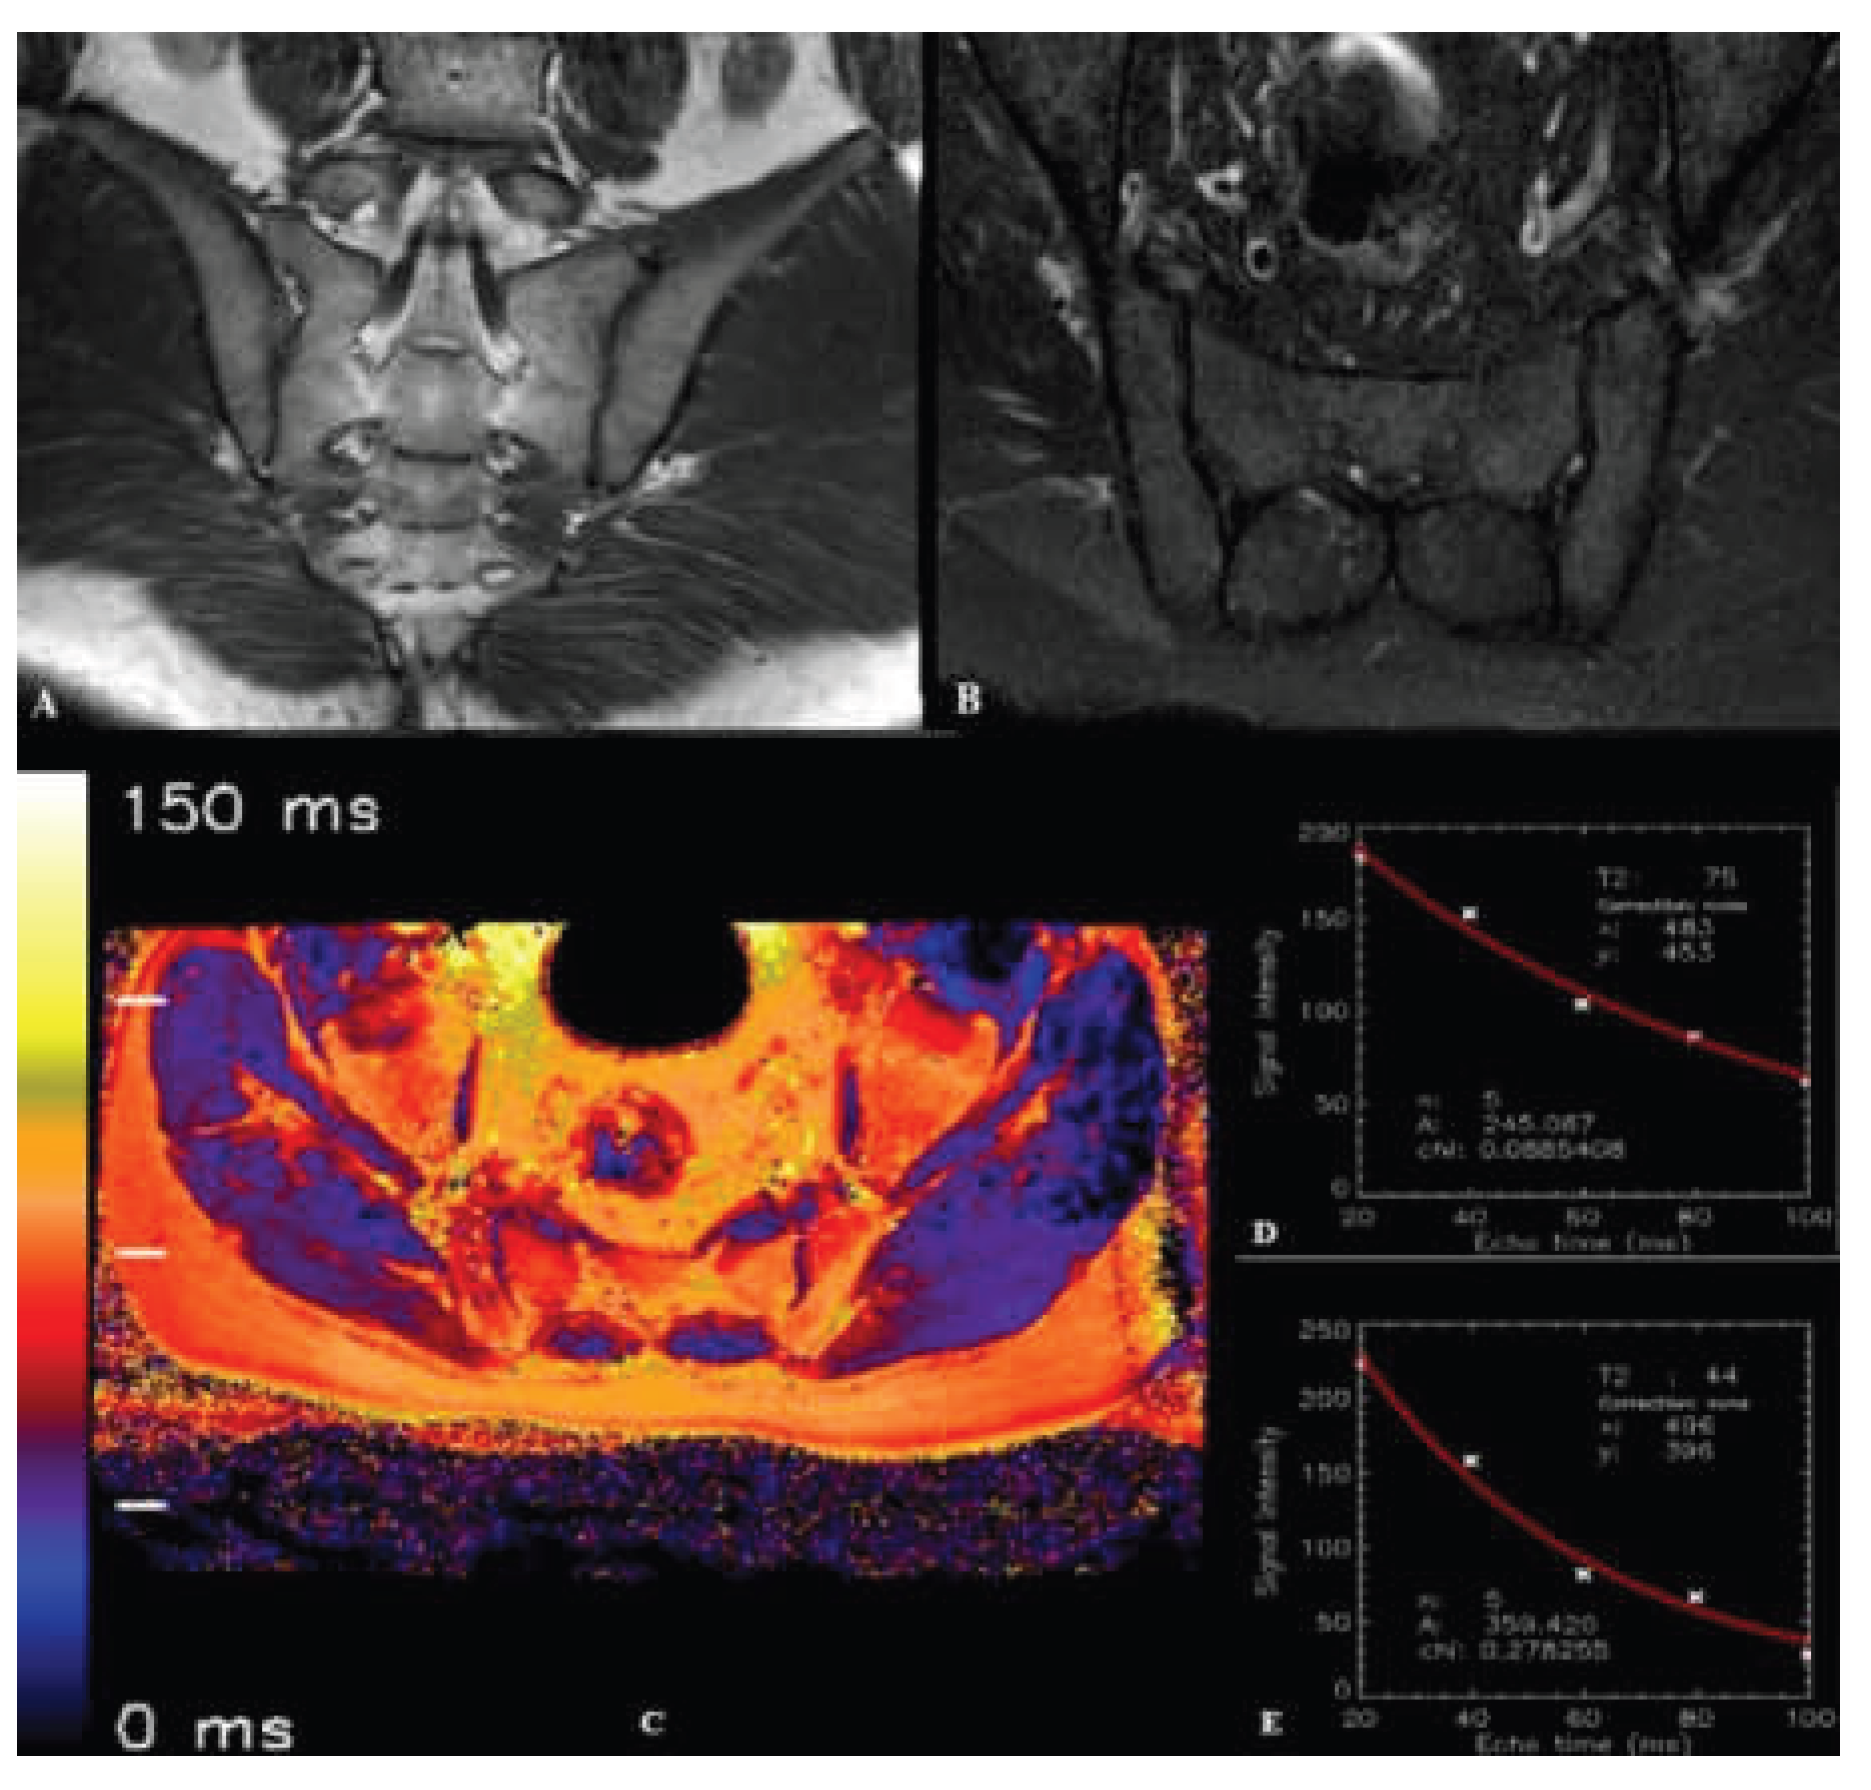

Table 1.
Sequences and their parameters used in routine sacroiliac joint MRI.
| Parameters | T1-weighted TSE | SPAIR TSE |
| Plane | Coronal oblique | Axial / Coronal oblique |
| TE (ms) | 8 | 80 |
| TR (ms) | 593 | 3431 |
| FOV (mm) | 200 | 200 |
| Flip angle (°) | 90 | 90 |
| No. of signal averages | 2 | 2 |
| Slice thickness (mm) | 4 | 4 |
| Echo train length | 6 | 19 |
FOV: field of view; TE: time to echo; TR: repetition time; TSE: turbo spin echo; SPAIR: spectral attenuated inversion recovery
Table 2.
Parameters of the multi-echo TSE sequence used to generate T2 mapping images.
| Parameters | Multi-echo TSE |
| Plane | Axial oblique |
| TE (ms) | 20, 40, 60, 80, 100 |
| TR (ms) | 3825 |
| No. of echoes | 5 |
| Echo spacing (ms) | 20 |
| FOV (mm) | 200 |
| Flip angle (°) | 90 |
| No. of signal averages | 1 |
| Slice thickness (mm) | 4 |
| Bandwidth (pixels) | 219 |
| Acquisition matrix | 268x265 |
| Acquisition time | 6.53 min |
| Acquired pixel resolution (mm) | 0.75x0.75 |
FOV: field of view; TE: time to echo; TR: repetition time; TSE: turbo spin echo
Table 3.
Demographic characteristics (gender and age) of the control and SpA groups.
| Gender |
SpA Group (n=31) |
Control Group (n=25) |
Total (n=56) |
P Value |
| Female, n(%) | 15 (48.3) | 11 (44) | 26 (100) | >0.05 |
| Male, n(%) | 16 (51.7) | 14 (56) | 30 (100) | >0.05 |
| Age, Mean ± SD | 35.4 ± 13.0 | 37.2 ± 9.6 | 36.2 ± 12.0 | >0.05 |
SD: standart deviation; SpA: spondyloarthropathy
Table 4.
The frequencies of ASAS criteria observed in SpA patients.
| ASAS Criteria | n (%) | |
| Inflammatory Back Pain | 19 (61.2) | |
| Arthritis | 12 (38.7) | |
| Enthesitis | 4 (12.9) | |
| Uveitis | 2 (6.4) | |
| Dactylitis | 3 (9.6) | |
| Psoriasis | 2 (6.4) | |
| Crohn's/Ulcerative Colitis | 0 (0) | |
| Family history for SpA | 6 (19.3) | |
| HLA-B27 | Negative | 16 (51.6) |
| Positive | 7 (22.6) | |
| Unknown | 8 (25.8) | |
| Good Response to NSAIDs | No | 5 (16.1) |
| Yes | 12 (38.7) | |
| Unknown | 14 (45.2) | |
| CRP Level | <5 mg/L | 7 (22.6) |
| >5 mg/L | 24 (77.4) | |
| Active Sacroiliitis on MRI | 31 (100) | |
ASAS: Assessment of Spondyloarthritis International Society; CRP: C-reactive protein; HLA: human leukocyte antigen; MRI: magnetic resonance imaging; NSAIDs: nonsteroidal antiinflammatory drugs; SpA: spondyloarthropathy
Table 5.
Comparison of the mean T2 relaxation times of bone and cartilage tissues obtained from the SpA and control groups.
Table 5.
Comparison of the mean T2 relaxation times of bone and cartilage tissues obtained from the SpA and control groups.
| SpA Group (n=31) | Control Group (n=25) | P Value | |
| T2 relaxation time - bone (ms)*, (Mean ± SD) |
100.23 ± 7.41 | 69.44 ± 4.37 | <0.001 |
| T2 relaxation time - cartilage (ms)**, (Mean ± SD) |
44.0 ± 3.19 | 43.2 ± 3.41 | 0.249 |
*Independent samples t-test; **Mann Whitney U Test; SD: standart deviation; SpA:spondyloarthropathy
Disclaimer/Publisher’s Note: The statements, opinions and data contained in all publications are solely those of the individual author(s) and contributor(s) and not of MDPI and/or the editor(s). MDPI and/or the editor(s) disclaim responsibility for any injury to people or property resulting from any ideas, methods, instructions or products referred to in the content. |
© 2025 by the authors. Licensee MDPI, Basel, Switzerland. This article is an open access article distributed under the terms and conditions of the Creative Commons Attribution (CC BY) license (http://creativecommons.org/licenses/by/4.0/).
Copyright: This open access article is published under a Creative Commons CC BY 4.0 license, which permit the free download, distribution, and reuse, provided that the author and preprint are cited in any reuse.


