
Submitted:
02 June 2025
Posted:
02 June 2025
You are already at the latest version
Abstract
The DNDC-Rice model effectively simulates the yield and greenhouse gas emissions within paddy system, while its performance under upland conditions remains unclear. This study validated the model using data from a long-term cover crop experiment (fallow [FA] and rye [RY]) in a soybean field, evaluating its limitations in upland systems simulation. The model underestimated water-filled pore space (WFPS) and nitrous oxide (N2O) flux while overestimating soybean biomass, yield, and carbon dioxide (CO2) flux. The underestimation of cumulative N2O flux (25.6% in FA and 5.1% in RY) was attributed to both underestimated WFPS and algorithm’s limitations in simulating N2O emission pulses. Overestimated soybean growth increased respiration, leading to the overestimation of CO2 flux. Although the model captured trends in soil organic carbon (SOC) stock, the simulated annual values differed from observations (-9.9% to +10.1%), potentially due to sampling errors. Both observed and simulated results showed that RY increased N2O emissions and SOC stock compared to FA. However, enhanced SOC sequestration under RY offset the increased N2O emissions, resulting in a lower net global warming potential than FA. These findings indicate that the DNDC-Rice model requires improvements in its nitrogen cycling algorithm and crop growth sub-models to improve predictions for upland systems.
Keywords:
DNDC-Rice
; greenhouse gas
; soil organic carbon
; cover crop
1. Introduction
Agricultural production is a significant source of greenhouse gas (GHG) emissions, which are key drivers of climate change [1]. Extreme climate events, in turn, reduce agricultural yields, thereby threatening global food security [2]. Agricultural soils can function as either sources or sinks of GHGs, depending on various conditions [3]. Implementing effective agricultural management practices to reduce GHG emissions and enhance carbon sequestration is a crucial strategy for mitigating climate change at the agricultural level.
In recent years, conservation agricultural management practices have rapidly spread due to their ability to enhance ecosystem services and promote sustainable agricultural development [4]. Cover crop management, a typical and historic conservation agriculture method, massive studies have confirmed its positive effect on mitigating soil erosion [5], improving soil structure and water-stable aggregates [6,7], enhancing soil fertility [8] and reducing weeds infestation [9,10]. For example, a cover crop experiment conducted in Japan demonstrated that a rye cover crop significantly improved soil health within a soybean cropping system [11]. However, the impact of cover crops on GHG emissions and soil carbon sequestration remains contentious. Some studies have reported that cover crops can reduce nitrous oxide (N2O) emissions by scavenging excess NO3-N in the soil [12,13]. The biomass remaining after cover crop termination serves as a carbon source, contributing to increased soil organic carbon (SOC) stocks [14,15]. However, the release of organic carbon and nitrogen during the decomposition of cover crop residues may also result in elevated N2O emissions [16,17]. These increased N2O emissions, in turn, could potentially offset the climate change mitigation benefits associated with the enhanced SOC stocks [18,19]. The potential of cover crops to mitigate climate change varies based on factors such as site characteristics, agronomic practices, and cover crop species [18,20]. Consequently, evaluating the effect of cover crops on climate change requires incorporating context-specific considerations.
Although field experiments can provide direct observations of GHG emissions and SOC stock at a specific point in time, they are difficult to use for continuous monitoring of intermediate processes, such as the carbon-nitrogen-water-crop balances [21]. Additionally, field experiments are resource-intensive and time-consuming due to the necessity of conducting extensive repeated measurements [22]. A well-calibrated model has the capacity to simulate the physical, chemical, and microbiological processes in soil using mathematical principles and computational power to calculate soil GHG emissions [23]. Simulation models are diverse, varying in complexity from simple empirical estimates based on statistical analysis to complex process-based biogeochemical models [23,24]. The DeNitrification-Decomposition (DNDC) model, a process-based model, focus on the carbon and nitrogen biogeochemistry in agro-ecosystem [25]. By integrating classical physic, chemistry and biology laws, the model is capable of parameterizing specific geochemical or biochemical processes, such as simulating and quantifying the GHG emissions, as well as carbon and nitrogen dynamics in soil [26]. Currently, the DNDC model is widely adopted to estimate and compare the GHG mitigation potential across diverse agricultural management scenarios at regional and national scales [27,28]. Moreover, the DNDC model has been modified numerous times and integrated with various sub-models to produce different versions to meet the specific needs of different regions, agronomic management and crops. For instance, DNDC-Rice is a revised version specifically designed for rice cultivation [29]. The DNDC-Rice model significantly enhances the ability to estimate greenhouse gas emissions from paddy fields and has been validated using GHG data from paddy fields across Asia, including Japan [30], India [31], and Thailand [32]. It demonstrates high accuracy and performance in simulating and predicting greenhouse gas emissions from paddy fields under different irrigation management scenarios [31].
In rice production systems, alongside the prevalent practice of continuous rice monoculture, the rotation of paddy with upland crops is also commonly employed [33]. Numerous studies have reported that the DNDC-Rice model is a powerful tool for accurately estimating soil GHG emissions in the continuous rice monoculture system [28,34]. In rice systems with paddy-upland rotation, it is impractical to use different versions of the DNDC model to simulate and predict the paddy and upland periods separately. However, field validation of the DNDC-Rice model for N2O emissions in upland cropping systems remains limited. Furthermore, previous studies have primarily focused on estimating GHG emissions, while field validations concerning the dynamics of carbon sequestration are still scarce.
Thus, we conducted a field validation of the DNDC-Rice using data from a long-term soybean-cover crop cropping system. This study aims to address the gap in the validation of the DNDC-Rice model for upland systems, thereby advancing its application in simulating paddy-upland rotation systems. Specifically, the objectives of this study were to: (1) evaluate the performance of the DNDC-Rice model in simulating N2O emissions and soil organic carbon stock dynamics in an upland cropping system with a cover crop; and (2) discuss the strategies to improve the accuracy of the predictions.
2. Materials and Methods
2.1. The DNDC-Rice Model
The DNDC model is a process based model to simulate greenhouse gases, such as nitrous oxide, carbon dioxide and methane, from agricultural ecosystems [26] by focusing on the carbon and nitrogen biogeochemistry in agro-ecosystem [25]. DNDC consists of six sub-models divided among two components. The first component consists of soil climate, plant growth, and decomposition sub-models. These sub-models are driven by ecological drivers (i.e. climate, soil, vegetation, and human activity) and predict soil environmental factors (e.g. temperature, moisture, pH, substrate concentrations). The second component consists of denitrification, nitrification, and fermentation sub-models. These sub-models predict gas fluxes (CO2, CH4, NH3, NO, N2O, and N2) through denitrification, nitrification, and CH4 production and oxidation processes [26,35,36].
DNDC-Rice is a revised DNDC model to simulate CH4 emission from rice paddies [29,30]. The revised model quantifies the production of electron donors [H2 and dissolved organic carbon (DOC)] by decomposition and rice root exudation, and simulates CH4 production and other reductive reactions based on the availability of electron donors and acceptors (NO3−, Mn4+, Fe3+, and SO42−) under anaerobic soil processes. Rice growth process and methane emission through rice by a diffusion routine were also modified in DNDC-Rice.
In this study, we used DNDC-Rice model to simulate a soybean system with rye cover crop management and to improve the simulation results by modifying the source codes. DNDC-Rice simulation was conducted for the period of 1987-2022 with the input of measured soil properties, daily meteorological data and the field managements at the experimental site. Carbon input from plant biomass to the soil was simulated as application of straw or green manure based on measured biomass of soybean residue, rye and natural weed.
2.2. Modification and Initialization of the Model
At first, the maximum tillage depth was changed: the maximum tillage depth in DNDC-Rice was 20 cm depth, and it was changed to 30 cm same as field practice. During the validation, it was found that DNDC-Rice simulated soil carbon decomposition too fast and tillage strongly affected to soil carbon decomposition. Therefore, tillage factor was changed from the default of 1.5 to 1.0. Deepest tilled layer number also modified. In the DNDC, the deepest tilled layer was set to be 3 when it was less than 3, but it was modified to be 1 when it was less than 1 to decrease tillage effect to SOC decomposition. We also modified temperature limit, T_limit, which was the based degree to calculate thermal degree days (TDD). T_limit for rye was decreased from 10 to 4.4 based on Mirsky et.al [37] to improve the growth.
In simulating nitrification process in soil, DNDC-Rice assumes that fixed portion of nitrified N is lost as N2O and NO [26]. After validation of SOC, crop growth, and CO2 emission, these factors for nitrification-induced N2O and NO production were changed from 0.015 and 0.0025 to 0.00015 and 0.006, respectively, to minimize the RMSE of simulated daily N2O emissions from the RY system .
2.3. Experiment Site
We used a long-term cover crop experiment data, initiated in 2003, at the farm of the Center for International Field Agriculture Research and Education, Ibaraki University, Japan. The site lacates in a humid subtropical climate, where the average annual precipitation was 1373 mm and the mean daily temperature was 14.5°C throughout the experimental period (2003–2021) (Figure 1). According to the World Reference Base for Soil Resources, the soil in this region is classified as a typical Andosol. Further details about the site description and soil parameters can be found in Higashi et al. [38].
2.4. Experiment Design and Field Management
In this experimental field, experiments have been concurrently conducted, employing a range of tillage methods and fertilization management practices. In the present study, the field data were collected from the sub-plot that adopted moldboard plowing without fertilization. Tillage was implemented in the summer and autumn using a moldboard plow to a depth of 30 cm. The main crop in the field experiment was upland rice from 2003 to 2007, after which it was replaced by soybean in 2008. In this study, two cover crop management practices [fallow (FA) and rye (RY)] were compared within the soybean system, with four replications for each treatment. Soybean (cv. Sachiyuta) was planted between July and November at a seeding density of 60 kg ha−1. During the cover crop season (November to June), rye (cv. Ryokusei) was sown in the RY plots at a seeding rate of 100 kg ha−1, whereas the FA plots received no artificial intervention, allowing weeds to grow naturally (Table 1). All of main crop residues and cover crop biomass was plowed into the soil. Further details on tillage, crops, and management practices are provided in Gong et al., Higashi et al and Huang et. al. [38,39,40].
2.5. Soil and Crop Measurement
Soybean samples were collected from the center of each plot using a 0.6 m2 quadrat on the day of harvest. Biomass was determined by weighing the oven-dried samples. The oven-dried samples were then threshed, and the grains were weighed for yield analysis. Aboveground biomass from both rye cover crops in RY plots and natural weeds in FA plots was collected prior to summer tillage using a 0.25 m2 quadrat. These plant materials were oven-dried to constant mass and weighed to determine dry biomass.
Soil core samples were taken from each plot at a depth of 30 cm in October each year for the measurement of SOC. The samples were dried, ground, and analyzed for SOC content using a C/N analyzer. SOC stock was subsequently determined based on SOC content, depth, and soil bulk density using the soil mass equivalent method [41]. Soil temperature at a depth of 0-5 cm was continuously monitored from 2020 to 2021 using soil temperature sensors. Soil volumetric water content was measured during each gas samples collection to determine the water-filled pore space (WFPS) at a depth of 5 cm. More details regarding the measurement and calculation processes for soybean and soil samples can be found in Gong et al., Higashi et al and Huang et. al. [38,39,40].
2.6. Greenhouse Gas Measurement
N2O and CO2 emissions were monitored from June 2020 to May 2022. Weekly gas samples were collected using the static closed chamber method and analyzed with a gas chromatograph to quantify the concentrations of N2O and CO2. Daily fluxes were determined using a concentration-time linear function, while cumulative emissions were calculated through linear interpolation. Further details on the collection, measurement and calculation of gas samples are shown in Huang et al and Ratih et al [40,42].
The net global warming potential (GWP) in agricultural systems consists of greenhouse gas emissions and variation in SOC stock (ΔSOC). The calculation of the net GWP for the period 2020-2021 is as follows:
where 265 represents the GWP indicator for N2O conversion to CO2 over a 100-year period.; 44/12 denotes the conversion factor for converting C to CO2.
2.7. Statistical Analysis
The simulated results, including daily soil temperature, daily water-filled pore space (WFPS), daily N2O flux, daily CO2 flux, SOC stock, soybean biomass, and soybean yield, were assessed using the root mean square error (RMSE) calculated as follows:
where αi and βi denote the simulated and observed values of parameter i; and N denotes the number of samples. The normalized RMSE (nRMSE) was also used in this study to evaluate the accuracy of the model simulations and was calculated as follows:
where is the average of the observed values.
3. Results
3.1. Soil Temperature and Water-Filled Pore Space
The DNDC-Rice model effectively estimated the daily soil temperature at a depth of 0-5 cm for both the FA and RY system during the experimental period, with minimal difference between observed and simulated results (Figure 2). The nRMSE of daily soil temperature in FA system was 10.7%, while in RY system was 11.4% (Table 2). The mean simulated soil temperature was marginally higher than the mean observed temperature, with an increase of 2.1% in FA and 1.6% in RY. Overall, the model accurately captured the seasonal fluctuations in soil temperature throughout the year. However, it consistently tended to overestimate soil temperature during the winter months. Field observations across different systems revealed that the mean daily soil temperature in the RY system was 1.7% higher than in the FA system. Similarly, the model replicated this difference, showing a 1.2% higher simulated value for the RY system compared to the FA system.
The DNDC-Rice model successfully simulated the trend of daily WFPS (0-5 cm), although the simulated values were underestimated compared with observed WFPS on average (Figure 3). In the FA system, the mean simulated WFPS was 6.2% lower than the mean observed value, while in the RY system, it showed a 2.5% reduction compared to the mean observed WFPS (Table 2). For all cropping systems, the model overestimated the daily WFPS during winter-spring season but underestimated it during summer-autumn season. In this study, the nRMSE of WFPS in FA system was 42.7%, while in the RY system was 41.9%. The observed mean daily WFPS in the FA system was 3.7% lower compared to the RY system, and the model also captured this trend, with the simulated value for the FA system being 7.3% lower than that for the RY system.
3.2. Crop Productivity
In order to validate the model performance on simulating crop productivity, we calculated the average biomass and yield of soybean from 2008 to 2021 compared with simulated values (Table 3). The DNDC-Rice model generally simulated soybean yields accurately in both the FA and RY systems, despite a slight overestimation of the mean simulated values. In the FA system, the model overestimated the mean soybean yield by 3.4%, with a nRMSE of 17.4%. Similarly, in the RY system, the average simulated soybean yield was 12.0% higher compared to observed value, with an nRMSE of 17.2%. On the other hand, DNDC-Rice model overestimated the soybean biomass for both the cropping system. Specifically, the simulated soybean biomass for FA was 15.1% higher than the observed value, whereas for RY it was 18.4% higher. The nRMSE for soybean biomass was 25.5% for FA and 23.5% for RY.
Based on field observations, RY tended to reduce the biomass and yield of soybean, resulting in a 3.2% decrease in mean biomass and an 8.8% decrease in mean yield compared to FA. In contrast, the difference in simulated biomass and yield between FA and RY was minimal, with FA showing only a 0.5% increase.
3.3. Soil Organic Carbon and Carbon Dioxide Emission
In the present study, the DNDC-Rice model effectively simulated the variation in SOC stock from 2008 to 2021 (Figure 4 and Table 3). In FA system, the observed and simulated average SOC stock were 80.4 Mg C ha−1 and 78.8 Mg C ha−1, with a nRMSE of 5.4%. In the RY system, the nRMSE for average SOC stock was 5.0%, with the simulated value (90.4 Mg C ha−1) being 2.2% higher than the observed value (88.5 Mg C ha−1). Additionally, both the observed and simulated SOC stocks in RY were higher than those in FA, with increases of 10.0% and 14.8%, respectively.
During field observations, surface vegetation within the chamber area was carefully removed to exclude photosynthetic CO2 uptake. Therefore, the observed CO2 emission presumably consisted of soil respiration and root respiration, and was compared with simulated CO2 emissions as the sum of soil respiration and root respiration. The DNDC-Rice model reasonably simulated the trend of daily CO2 emissions across all cropping systems, although it tended to overestimate the actual daily value (Figure 5). The mean simulated daily CO2 emissions for FA system was 11.1% higher than the observed value, with a nRMSE of 60.2%. In RY system, the model overestimated the mean daily CO2 by 77.1%, resulting in a nRMSE of 101.3% (Table 2). Additionally, the simulated daily CO2 flux increased rapidly following each tillage operation.
Regarding cumulative CO2 emissions, the model's performance exhibited seasonal variation in the FA system (Table 4). Specifically, during the soybean season, the model overestimated cumulative CO2 emissions by 42.4% in 2020 and 27.3% in 2021. However, during the cover crop season, the model underestimated cumulative CO2 emissions, with reductions of 21.3% in 2020 and 53.0% in 2021. In contrast, for the RY system, the model consistently overestimated cumulative CO2 emissions across all seasons, resulting in an average overestimation of 75.5%. Field observations revealed that the FA system exhibited lower daily CO2 emissions and total cumulative CO2 emissions, reducing 38% and 34.2%, respectively, compared to the RY system. The model also captured this trend, amplifying the difference, with daily CO2 emissions and total cumulative CO2 emissions in the FA system being 60.9% and 62.0% lower, respectively, than those in the RY system.
3.4. Soil Nitrous Oxide Emission
In both the FA and RY systems, the DNDC-Rice model effectively captured the seasonal variation trends of daily N2O emissions throughout the experimental period (Figure 6). However, the model exhibited a poor fit of daily N2O emission between the simulated and observed value, with the high nRMSE value (105.2% in FA and 94.9% in RY) (Table 2). Compared to mean observed daily N2O emission, the simulated value decreased by 28.9% in the FA system, while in the RY system, the reduction was 3.5%. The model consistently underestimated the cumulative N2O emissions for the FA system across all crop seasons (Table 5). In the case of the MP system, the cumulative N2O emissions were underestimated during the soybean season, but overestimated during the cover crop season. Overall, the simulated total N2O emissions were 25.6% lower than the observed values for the FA system and 5.1% lower for the RY system. Moreover, both the simulated and observed values indicated that the daily N2O flux and total N2O emissions under the FA system were lower than those under the RY system, with reductions ranging from 24.3% to 62.0%.
3.5. Global Warming Potential
The net GWP of different cropping systems was assessed and analyzed based on the GWP of N2O and net CO2 retention for the period from 2020 to 2021 (Table 6). The simulated N2O GWP for FA and RY were 20.6% and 2.3% lower, respectively, compared to field observation. Moreover, RY exhibited a higher N2O GWP than FA, with observed values showing a 35.9% increase and simulated values a 67.2% increase. For net CO2 retention, the observed value for FA and RY were −7895.25 and −2833.60 kg CO2 eq ha−1 year−1, whereas the simulated values were 168.82 and 901.60 kg CO2 eq ha−1 year−1. Based on field observation, the net GWP for FA and RY were 8057.58 and 3054.14 kg CO2 eq ha−1 year−1. However, the model simulated minus net GWP values for both FA (−39.96 kg CO2 eq ha−1 year−1) and RY (−686.07 kg CO2 eq ha−1 year−1).
4. Discussion
4.1. Simulation of Soil Temperature, Water-Filled Pore Space and Crop Growth
Soil temperature and WFPS are vital factors influencing crop growth [43,44]. Simultaneously, those significantly affect N2O emissions and the decomposition or sequestration of SOC [45,46]. Thus, accurate estimation of soil temperature and WFPS by the DNDC-Rice model is a critical prerequisite for reliably simulating N2O emissions and SOC stock dynamics. In some versions of the DNDC model, soil surface temperature is assumed to be equal to the daily average air temperature, as the soil temperature profile is calculated based on a heat flux model [22,36]. In contrast, DNDC-Rice integrates a micrometeorological model, enhancing the accuracy of soil temperature profile estimation [29]. Our study findings indicate that DNDC-Rice effectively simulated the soil temperature (0-5 cm) in both FA and RY system, achieving a nRMSE below 12%, which is comparable to or better than results reported in previous studies for upland cropping systems [47,48]. In our study, the simulated WFPS successfully captured the temporal trends of the observed WFPS, consistent with previous findings [48,49]. However, discrepancies were noted in the dynamic values between the observed and simulated WFPS. The observed WFPS was measured manually on gas sampling days, making it susceptible to human error and limited by discontinuous observation periods. The non-continuous observation may have overlooked critical rainfall or drought events, potentially missing the peaks and troughs in WFPS dynamics. Unlike the observed WFPS, which represents point measurements, the simulated WFPS is continuous, calculated at daily time steps, and represents site-averaged values [50,51]. Therefore, owing to the influence of soil heterogeneity, the simulated WFPS values may not align with the observed values. Additionally, a previous study reported that the DNDC-Rice model overestimated water loss through evapotranspiration [52], resulting in an underestimation of soil water content, which is consistent with our results.
Several studies conducted in rice systems have reported that DNDC-Rice tends to overestimate rice straw biomass [52,53]. Similarly, our findings showed that simulated biomass and yield of soybean were higher than the observed values. The crop growth sub-model of DNDC-Rice integrates a crop carbon metabolism model, resulting in simulated crop growth being influenced by nitrogen availability and carbon allocation [29]. The DNDC-Rice model incorporates specific growth functions, calibrated for different rice varieties, to simulate rice growth [31], while it still lacks specific growth functions for other dryland crops, such as soybean and rye. In the empirical crop growth sub-model, plant growth and the allocation ratio of absorbed nitrogen (N) are calculated based on TDD, while N uptake is regulated by TDD and the availability of soil N. It is well established that soybean is capable of absorbing and transporting substantial amounts of N through biological N fixation, providing N for utilization by all parts of the plant [54] and nitrogen fixation is, of course, assumed in DNDC-Rice. Nitrogen fixation rate can be set for each crop as a constant in DNDC-Rice. However, it doesn’t vary with environmental factors and crop growth. In field conditions, nitrogen fixation increases or decreases as rhizobia increase or decrease, but DNDC-Rice does not predict such temporal variability. Due to the absence of accurate simulation of biological nitrogen fixation in soybean, the DNDC-Rice model may inaccurately estimate nitrogen uptake, leading to incorrect simulations of soybean biomass and yield. Therefore, it is essential to develop and calibrate the relevant modules to improve the DNDC-Rice model.
4.2. Simulation of Greenhouse Gas Emission and Soil Organic Carbon Stock
While the trend of daily CO2 flux simulated by the DNDC-Rice model was similar to the observed data, both the daily fluxes and cumulative fluxes were overestimated. Due to the physical disturbance of the soil surface, tillage events often produce a temporary burst of soil CO2 emission [55]. Following tillage, the DNDC-Rice model exhibited an immediate response, rapidly increasing the simulated daily soil CO2 flux (Figure 5). In the model, daily CO2 flux is regulated by the tillage factor. To prevent an excessive increase in CO2 emissions induced by tillage, this study reduced the tillage factor in the model. In contrast, the observed daily CO2 flux during the same period showed no significant changes, possibly due to the limitations of discontinuous field sampling, which may have failed to capture the emission peaks induced by tillage events. Consequently, for a period following the tillage event, the simulated daily soil CO2 emissions were always higher than the observed values. Soil respiration is divided into autotrophic respiration, primarily driven by plant roots, and heterotrophic respiration, which is mainly driven by microorganisms [56]. In this study, the DNDC-Rice model overestimated soybean biomass, which is associated with a well-developed underground root system. Furthermore, the biomass distribution among various organs during crop growth simulation is determined by the ratios of grain, shoot, and root specified in the crop parameter settings of the DNDC-Rice model. An excessively high root allocation ratio may result in an overestimation of the simulated root biomass. This likely led to an overestimation of root autotrophic respiration during the simulation, resulting in an excessively high CO2 flux. Another main source for the soil CO2 flux is the soil heterotrophic respiration, which is linked to the sequestration and decomposition of SOC [57]. In the field experiment, both autotrophic and heterotrophic respiration of soil occurred throughout the cover crop season (from November to June) in both the FA and RY systems. Compared to natural weeds in the FA system, the cultivation of cover crops within the RY system contributed to a higher root biomass, thereby enhancing soil autotrophic respiration and resulting in higher CO2 emissions. In DNDC-Rice, weeding dates and the degree of weed growth can be set in three levels (no, moderate, and serious), but we did not set it. Instead, weed biomass input was set as green manure input to reproduce accurate carbon input. The absence of weed growth process would cause the poor accuracy of soil autotrophic respiration during the cover crop season in the FA system. As a result, the simulated CO2 emissions for the cover crop season in the FA system were lower than the observed values, thereby exacerbating the discrepancy in CO2 emissions estimation between the FA and RY systems in estimation. Therefore, it must be crucial to improve the accuracy of weed growth process CO2 emission
Some studies have documented that cover crops have the potential to enhance SOC stocks [58,59]. The biomass carbon from cover crop residues supplies nutrients and energy to soil microorganisms, a portion of which is subsequently converted into microbial carbon, thereby contributing to an increase in SOC stocks and enhancing carbon sequestration [60]. The observed SOC stock in the RY system was higher than that in the FA system, and the DNDC-Rice model reproduced these results, although the discrepancy was amplified. These results demonstrate the DNDC-Rice model's capability to accurately simulate the cover crop-induced SOC enhancement. The amplified difference between the FA and RY systems may also be attributed to the absence of natural weed growth calculation mentioned above, which prevented the DNDC-Rice model from accurately simulating the contribution of weed biomass to the soil carbon pool in the FA system. Overall, the simulated variation in SOC stock closely followed the observed trend over the period from 2008 to 2021. However, the model could not reproduce the interannual variability observed in the field. In the DNDC model, SOC is automatically allocated to litter, labile humus (humad), and recalcitrant humus pools in fixed proportion [36], and this same algorithm is also employed in the DNDC-Rice model. However, whether the proportion set within the model aligns with the observed data remains uncertain, as we did not conduct a carbon composition analysis of the field soil. We speculate that inconsistent allocation proportion and pathways of SOC may be one of the factors contributing to the discrepancies between the model simulations and field observations. Moreover, in DNDC-Rice, SOC stock was calculated on a daily time step using predefined equations. During the estimation process, the soil bulk density remained consistently aligned with the initial settings. In contrast, observed data were gained through manual sampling and measurement at fixed annual time points, which may introduce considerable sampling errors and increase uncertainty.
In the present study, DNDC-Rice model effectively reproduced the cover crop-induced divergence in N2O emissions (FA < RY). The reproduction of elevated N2O emissions in RY systems likely reflects model's effective parameterization of cover crop decomposition dynamics, particularly the enhanced denitrification potential from increased biomass carbon and soil moisture retention. Although the DNDC-Rice model effectively captured the seasonal variation in N2O fluxes, it significantly underestimated the cumulative fluxes. N2O emissions from soil are commonly released into the atmosphere in a pulsed manner [61], with peak emissions persisting for no more than a few weeks [62]. Meanwhile, in cropping systems, peak N2O emission events typically account for 50–90% of the annual emissions [63,64]. However, previous studies have identified limitations in the DNDC-Rice model, which fails to accurately predict the timing and magnitude of high N2O emission pulses [52]. Our findings showed that the simulated daily N2O fluxes were lower than the observed values during peak N2O emission events, leading to an underestimation of cumulative N2O fluxes. Additionally, we observed that the periods of underestimation in daily N2O fluxes roughly coincided with those of underestimation in WFPS. WFPS is a key driver in the model's simulation of nitrification and denitrification processes, with a profound impact on the prediction of N2O emissions [65]. Therefore, the discrepancy between the simulated daily N2O fluxes and observed values is likely due to the underestimation of WFPS. Therefore, improving the accuracy of WFPS simulations, as well as modifying the equations governing soil nitrogen dynamics to better simulate N2O emission pulse events, will be key directions for enhancing the DNDC-Rice model's accuracy in predicting N2O emissions.
Net GWP is derived from the GWP of N2O and changes in SOC stock in this study and the substantial interannual variability in observed SOC values also contributes to unavoidable errors in net GWP calculations. Field observations indicated a reduction in SOC stock during the period from 2019 to 2021. In contrast, the DNDC-Rice model, which fits a time-dependent curve for SOC stock based on long-term observational data (2008-2021), simulated an increase in SOC stock during the 2019-2021 period, contradicting the observed results. This inconsistent SOC variation resulted in a discrepancy between the observed and simulated net GWP values. Given the noticeable interannual variation in the observed SOC stock, comparing the observed and simulated net GWP over longer time intervals would be more reasonable.
5. Conclusions
This study conducted a field validation of the DNDC-Rice model using data on crop productivity, soil parameters, and GHG fluxes from a soybean system incorporating two cover crop management practices, to evaluate its simulation performance within the context of an upland cropping system. The model accurately simulated soil temperature, but it underestimated WFPS and N2O emissions. In contrast, the simulated values for CO2 emissions, soybean biomass, and yield were overestimated. While the model successfully captured the long-term variation in SOC stock, the annual SOC values were frequently either underestimated or overestimated. Moreover, the DNDC-Rice model could reproduce the differences between RY and FA in terms of crop yield, GHG emissions and SOC stock, although these differences may be exaggerated or diminished due to discrepancies between the simulated and observed values. These findings indicated that further refinements are needed to improve the model's accuracy in estimation. Due to algorithmic limitations, the model failed to accurately simulate the growth of soybean and N2O emission pulse events. Therefore, the crop growth sub-model for upland systems and the N dynamics equations in the DNDC-Rice model required further refinement.
Author Contributions
Q.H.: Conceptualization, Investigation, Data curation, Formal analysis, Methodology, Visualization, Writing – original draft; N.K.: Conceptualization, Methodology, Software, Validation, Supervision, Writing – review & editing, Funding acquisition; M.K.: Resources, Supervision, Writing – review & editing; T.F.: Methodology, Software, Writing – review & editing. All authors have read and agreed to the published version of the manuscript.
Funding
This work was supported by Cross-ministerial Strategic Innovation Promotion Program (SIP), “Building a Resilient and Nourishing Food Supply Chain Management for a Sustainable Future” (Grant Number JPJ012287; funding agency: Bio-oriented Technology Research Advancement Institution)
Data Availability Statement
Data are available from the corresponding author upon reasonable request.
Conflicts of Interest
The authors declare no conflicts of interest.
References
- IPCC Climate Change and Land: An IPCC Special Report. Clim. Chang. L. an IPCC Spec. Rep. Clim. Chang. Desertif. L. Degrad. Sustain. L. Manag. food Secur. Greenh. gas fluxes Terr. Ecosyst. 2019, 1–864.
- Malhi, G.S.; Kaur, M.; Kaushik, P. Impact of Climate Change on Agriculture and Its Mitigation Strategies: A Review. Sustain. 2021, 13, 1–21. [Google Scholar] [CrossRef]
- Oertel, C.; Matschullat, J.; Zurba, K.; Zimmermann, F.; Erasmi, S. Greenhouse Gas Emissions from Soils—A Review. Chemie der Erde 2016, 76, 327–352. [Google Scholar] [CrossRef]
- Adetunji, A.T.; Ncube, B.; Mulidzi, R.; Lewu, F.B. Management Impact and Benefit of Cover Crops on Soil Quality: A Review. Soil Tillage Res. 2020, 204, 104717. [Google Scholar] [CrossRef]
- Chen, L.; Rejesus, R.M.; Aglasan, S.; Hagen, S.C.; Salas, W. The Impact of Cover Crops on Soil Erosion in the US Midwest. J. Environ. Manage. 2022, 324, 116168. [Google Scholar] [CrossRef]
- Dai, W.; Feng, G.; Huang, Y.; Adeli, A.; Jenkins, J.N. Influence of Cover Crops on Soil Aggregate Stability, Size Distribution and Related Factors in a No-till Field. Soil Tillage Res. 2024, 244, 0–2. [Google Scholar] [CrossRef]
- Haruna, S.I.; Nkongolo, N.V. Influence of Cover Crop, Tillage, and Crop Rotation Management on Soil Nutrients. Agric. 2020, 10, 1–14. [Google Scholar] [CrossRef]
- Scavo, A.; Fontanazza, S.; Restuccia, A.; Pesce, G.R.; Abbate, C.; Mauromicale, G. The Role of Cover Crops in Improving Soil Fertility and Plant Nutritional Status in Temperate Climates. A Review. Agron. Sustain. Dev. 2022, 42. [Google Scholar] [CrossRef]
- Büchi, L.; Wendling, M.; Amossé, C.; Jeangros, B.; Charles, R. Cover Crops to Secure Weed Control Strategies in a Maize Crop with Reduced Tillage. Field. Crop. Res. 2020, 247, 107583. [Google Scholar] [CrossRef]
- Mennan, H.; Jabran, K.; Zandstra, B.H.; Pala, F. Non-chemical Weed Management in Vegetables by Using Cover Crops: A Review. Agronomy 2020, 10, 1–16. [Google Scholar] [CrossRef]
- Wulanningtyas, H.S.; Gong, Y.; Li, P.; Sakagami, N.; Nishiwaki, J.; Komatsuzaki, M. A Cover Crop and No-Tillage System for Enhancing Soil Health by Increasing Soil Organic Matter in Soybean Cultivation. Soil Tillage Res. 2021, 205, 104749. [Google Scholar] [CrossRef]
- Behnke, G.D.; Villamil, M.B. Cover Crop Rotations Affect Greenhouse Gas Emissions and Crop Production in Illinois, USA. Field. Crop. Res. 2019, 241, 107580. [Google Scholar] [CrossRef]
- Preza-Fontes, G.; Christianson, L.E.; Greer, K.; Bhattarai, R.; Pittelkow, C.M. In-Season Split Nitrogen Application and Cover Cropping Effects on Nitrous Oxide Emissions in Rainfed Maize. Agric. Ecosyst. Environ. 2022, 326, 107813. [Google Scholar] [CrossRef]
- Peng, Y.; Rieke, E.L.; Chahal, I.; Norris, C.E.; Janovicek, K.; Mitchell, J.P.; Roozeboom, K.L.; Hayden, Z.D.; Strock, J.S.; Machado, S.; et al. Maximizing Soil Organic Carbon Stocks under Cover Cropping: Insights from Long-Term Agricultural Experiments in North America. Agric. Ecosyst. Environ. 2023, 356. [Google Scholar] [CrossRef]
- Van Eerd, L.L.; Chahal, I.; Peng, Y.; Awrey, J.C. Influence of Cover Crops at the Four Spheres: A Review of Ecosystem Services, Potential Barriers, and Future Directions for North America. Sci. Total Environ. 2023, 858, 159990. [Google Scholar] [CrossRef]
- Basche, A.D.; Miguez, F.E.; Kaspar, T.C.; Castellano, M.J. Do Cover Crops Increase or Decrease Nitrous Oxide Emissions? A Meta-Analysis. J. Soil Water Conserv. 2014, 69, 471–482. [Google Scholar] [CrossRef]
- Singh, H.; Kandel, T.P.; Gowda, P.H.; Northup, B.K.; Kakani, V.G.; Baath, G.S. Soil N2O Emissions Following Termination of Grass Pea and Oat Cover Crop Residues with Different Maturity Levels. J. Plant Nutr. Soil Sci. 2020, 183, 734–744. [Google Scholar] [CrossRef]
- Guenet, B.; Gabrielle, B.; Chenu, C.; Arrouays, D.; Balesdent, J.; Bernoux, M.; Bruni, E.; Caliman, J.P.; Cardinael, R.; Chen, S.; et al. Can N2O Emissions Offset the Benefits from Soil Organic Carbon Storage? Glob. Chang. Biol. 2021, 27, 237–256. [Google Scholar] [CrossRef] [PubMed]
- Lugato, E.; Leip, A.; Jones, A. Mitigation Potential of Soil Carbon Management Overestimated by Neglecting N2O Emissions. Nat. Clim. Chang. 2018, 8, 219–223. [Google Scholar] [CrossRef]
- Abdalla, M.; Hastings, A.; Cheng, K.; Yue, Q.; Chadwick, D.; Espenberg, M.; Truu, J.; Rees, R.M.; Smith, P. A Critical Review of the Impacts of Cover Crops on Nitrogen Leaching, Net Greenhouse Gas Balance and Crop Productivity. Glob. Chang. Biol. 2019, 25, 2530–2543. [Google Scholar] [CrossRef]
- Priya, *!!! REPLACE !!!*; Singh, S.P. Assessing and Comparing the Sustainability of Organic and Conventional Wheat Farming in India: An Indicator-Based Approach. J. Clean. Prod. 2023, 423, 138652. [Google Scholar] [CrossRef]
- Zhang, Y.; Niu, H. The Development of the DNDC Plant Growth Sub-Model and the Application of DNDC in Agriculture: A Review. Agric. Ecosyst. Environ. 2016, 230, 271–282. [Google Scholar] [CrossRef]
- Abdalla, M.; Song, X.; Ju, X.; Topp, C.F.E.; Smith, P. Calibration and Validation of the DNDC Model to Estimate Nitrous Oxide Emissions and Crop Productivity for a Summer Maize-Winter Wheat Double Cropping System in Hebei, China. Environ. Pollut. 2020, 262. [Google Scholar] [CrossRef] [PubMed]
- Foltz, M.E.; Kent, A.D.; Koloutsou-Vakakis, S.; Zilles, J.L. Influence of Rye Cover Cropping on Denitrification Potential and Year-Round Field N2O Emissions. Sci. Total Environ. 2021, 765. [Google Scholar] [CrossRef]
- Gilhespy, S.L.; Anthony, S.; Cardenas, L.; Chadwick, D.; del Prado, A.; Li, C.; Misselbrook, T.; Rees, R.M.; Salas, W.; Sanz-Cobena, A.; et al. First 20 Years of DNDC (DeNitrification DeComposition): Model Evolution. Ecol. Modell. 2014, 292, 51–62. [Google Scholar] [CrossRef]
- Li, C. Modeling Trace Gas Emissions from Agricultural Ecosystems. Nutr. Cycl. Agroecosystems 2000, 58, 259–276. [Google Scholar] [CrossRef]
- Chang, N.; Chen, D.; Cai, Y.; Li, J.; Zhang, M.; Li, H.; Wang, L. Enhancing Crop Yield and Carbon Sequestration and Greenhouse Gas Emission Mitigation through Different Organic Matter Input in the Bohai Rim Region: An Estimation Based on the DNDC-RF Framework. Field. Crop. Res. 2024, 319. [Google Scholar] [CrossRef]
- Katayanagi, N.; Fumoto, T.; Hayano, M.; Shirato, Y.; Takata, Y.; Leon, A.; Yagi, K. Estimation of Total CH4 Emission from Japanese Rice Paddies Using a New Estimation Method Based on the DNDC-Rice Simulation Model. Sci. Total Environ. 2017, 601–602, 346–355. [Google Scholar] [CrossRef]
- Fumoto, T.; Kobayashi, K.; Li, C.; Yagi, K.; Hasegawa, T. Revising a Process-Based Biogeochemistry Model (DNDC) to Simulate Methane Emission from Rice Paddy Fields under Various Residue Management and Fertilizer Regimes. Glob. Chang. Biol. 2008, 14, 382–402. [Google Scholar] [CrossRef]
- Fumoto, T.; Yanagihara, T.; Saito, T.; Yagi, K. Assessment of the Methane Mitigation Potentials of Alternative Water Regimes in Rice Fields Using a Process-Based Biogeochemistry Model. Glob. Chang. Biol. 2010, 16, 1847–1859. [Google Scholar] [CrossRef]
- Oo, A.Z.; Sudo, S.; Fumoto, T.; Inubushi, K.; Ono, K.; Yamamoto, A.; Bellingrath-Kimura, S.D.; Win, K.T.; Umamageswari, C.; Bama, K.S.; et al. Field Validation of the Dndc-Rice Model for Methane and Nitrous Oxide Emissions from Double-Cropping Paddy Rice under Different Irrigation Practices in Tamil Nadu, India. Agric. 2020, 10, 1–16. [Google Scholar] [CrossRef]
- Minamikawa, K.; Fumoto, T.; Iizumi, T.; Cha-un, N.; Pimple, U.; Nishimori, M.; Ishigooka, Y.; Kuwagata, T. Prediction of Future Methane Emission from Irrigated Rice Paddies in Central Thailand under Different Water Management Practices. Sci. Total Environ. 2016, 566–567, 641–651. [Google Scholar] [CrossRef]
- He, D.C.; Ma, Y.L.; Li, Z.Z.; Zhong, C.S.; Cheng, Z.B.; Zhan, J. Crop Rotation Enhances Agricultural Sustainability: From an Empirical Evaluation of Eco-Economic Benefits in Rice Production. Agric. 2021, 11, 1–13. [Google Scholar] [CrossRef]
- Minamikawa, K.; Fumoto, T.; Itoh, M.; Hayano, M.; Sudo, S.; Yagi, K. Potential of Prolonged Midseason Drainage for Reducing Methane Emission from Rice Paddies in Japan: A Long-Term Simulation Using the DNDC-Rice Model. Biol. Fertil. Soils 2014, 50, 879–889. [Google Scholar] [CrossRef]
- Li, C.; Frolking, S.; Harriss, R. Modeling Carbon Biogeochemistry in Agricultural Soils. Global Biogeochem. Cycles 1994, 8, 237–254. [Google Scholar] [CrossRef]
- Li, C.; Frolking, S.; Frolking, T.A. A Model of Nitrous Oxide Evolution from Soil Driven by Rainfall Events: 2. Model Applications. J. Geophys. Res. 1992, 97, 9777–9783. [Google Scholar] [CrossRef]
- Mirsky, S.B.; Curran, W.S.; Mortensen, D.A.; Ryan, M.R.; Shumway, D.L. Control of Cereal Rye with a Roller/Crimper as Influenced by Cover Crop Phenology. Agron. J. 2009, 101, 1589–1596. [Google Scholar] [CrossRef]
- Higashi, T.; Yunghui, M.; Komatsuzaki, M.; Miura, S.; Hirata, T.; Araki, H.; Kaneko, N.; Ohta, H. Tillage and Cover Crop Species Affect Soil Organic Carbon in Andosol, Kanto, Japan. Soil Tillage Res. 2014, 138, 64–72. [Google Scholar] [CrossRef]
- Gong, Y.; Li, P.; Sakagami, N.; Komatsuzaki, M. No-Tillage with Rye Cover Crop Can Reduce Net Global Warming Potential and Yield-Scaled Global Warming Potential in the Long-Term Organic Soybean Field. Soil Tillage Res. 2021, 205, 104747. [Google Scholar] [CrossRef]
- Huang, Q.; Gong, Y.; Dewi, R.K.; Li, P.; Wang, X.; Hashimi, R.; Komatsuzaki, M. Enhancing Energy Efficiency and Reducing Carbon Footprint in Organic Soybean Production through No-Tillage and Rye Cover Crop Integration. J. Clean. Prod. 2023, 419, 138247. [Google Scholar] [CrossRef]
- Ellert, B.H.; Bettany, J.R. Calculation of Organic Matter and Nutrients Stored in Soils under Contrasting Management Regimes. Can. J. Soil Sci. 1995, 75, 529–538. [Google Scholar] [CrossRef]
- Dewi, R.K.; Gong, Y.; Huang, Q.; Li, P.; Hashimi, R.; Komatsuzaki, M. Addition of Biochar Decreased Soil Respiration in a Permanent No-till Cover Crop System for Organic Soybean Production. Soil Tillage Res. 2024, 237, 105977. [Google Scholar] [CrossRef]
- Onwuka, B. Effects of Soil Temperature on Some Soil Properties and Plant Growth. Adv. Plants Agric. Res. 2018, 8, 89–93. [Google Scholar] [CrossRef]
- Hatfield, J.L.; Sauer, T.J.; Prueger, J.H. Managing Soils to Achieve Greater Water Use Efficiency: A Review. Agron. J. 2001, 93, 271–280. [Google Scholar] [CrossRef]
- Butterbach-Bahl, K.; Baggs, E.M.; Dannenmann, M.; Kiese, R.; Zechmeister-Boltenstern, S. Nitrous Oxide Emissions from Soils: How Well Do We Understand the Processes and Their Controls? Philos. Trans. R. Soc. B Biol. Sci. 2013, 368. [Google Scholar] [CrossRef]
- Xu, X.; Shi, Z.; Li, D.; Rey, A.; Ruan, H.; Craine, J.M.; Liang, J.; Zhou, J.; Luo, Y. Soil Properties Control Decomposition of Soil Organic Carbon: Results from Data-Assimilation Analysis. Geoderma 2016, 262, 235–242. [Google Scholar] [CrossRef]
- Li, Z.; Yang, J.Y.; Drury, C.F.; Yang, X.M.; Reynolds, W.D.; Li, X.; Hu, C. Evaluation of the DNDC Model for Simulating Soil Temperature, Moisture and Respiration from Monoculture and Rotational Corn, Soybean and Winter Wheat in Canada. Ecol. Modell. 2017, 360, 230–243. [Google Scholar] [CrossRef]
- Abdalla, M.; Song, X.; Ju, X.; Smith, P. Evaluation of the DNDC Model to Estimate Soil Parameters, Crop Yield and Nitrous Oxide Emissions for Alternative Long-Term Multi-Cropping Systems in the North China Plain. Agronomy 2022, 12. [Google Scholar] [CrossRef]
- Nisar, S.; Benbi, D.K.; Toor, A.S. Energy Budgeting and Carbon Footprints of Three Tillage Systems in Maize-Wheat Sequence of North-Western Indo-Gangetic Plains. Energy 2021, 229, 120661. [Google Scholar] [CrossRef]
- Shen, J.; Treu, R.; Wang, J.; Hao, X.; Thomas, B.W. Modeling Growing Season and Annual Cumulative Nitrous Oxide Emissions and Emission Factors from Organically Fertilized Soils Planted with Barley in Lethbridge, Alberta, Canada. Agric. Syst. 2019, 176, 102654. [Google Scholar] [CrossRef]
- Shen, Y.; Sui, P.; Huang, J.; Wang, D.; Whalen, J.K.; Chen, Y. Greenhouse Gas Emissions from Soil under Maize–Soybean Intercrop in the North China Plain. Nutr. Cycl. Agroecosystems 2018, 110, 451–465. [Google Scholar] [CrossRef]
- Katayanagi, N.; Furukawa, Y.; Fumoto, T.; Hosen, Y. Validation of the DNDC-Rice Model by Using CH4 and N2O Flux Data from Rice Cultivated in Pots under Alternate Wetting and Drying Irrigation Management. Soil Sci. Plant Nutr. 2012, 58, 360–372. [Google Scholar] [CrossRef]
- Katayanagi, N.; Ono, K.; Fumoto, T.; Mano, M.; Miyata, A.; Hayashi, K. Validation of the DNDC-Rice Model to Discover Problems in Evaluating the Nitrogen Balance at a Paddy-Field Scale for Single-Cropping of Rice. Nutr. Cycl. Agroecosystems 2013, 95, 255–268. [Google Scholar] [CrossRef]
- Ciampitti, I.A.; de Borja Reis, A.F.; Córdova, S.C.; Castellano, M.J.; Archontoulis, S.V.; Correndo, A.A.; Antunes De Almeida, L.F.; Moro Rosso, L.H. Revisiting Biological Nitrogen Fixation Dynamics in Soybeans. Front. Plant Sci. 2021, 12, 1–11. [Google Scholar] [CrossRef]
- Jackson, L.E.; Calderon, F.J.; Steenwerth, K.L.; Scow, K.M.; Rolston, D.E. Responses of Soil Microbial Processes and Community Structure to Tillage Events and Implications for Soil Quality. Geoderma 2003, 114, 305–317. [Google Scholar] [CrossRef]
- Kuzyakov, Y.; Larionova, A.A. Root and Rhizomicrobial Respiration: A Review of Approaches to Estimate Respiration by Autotrophic and Heterotrophic Organisms in Soil. J. Plant Nutr. Soil Sci. 2005, 168, 503–520. [Google Scholar] [CrossRef]
- Navarro-Pedreño, J.; Almendro-Candel, M.B.; Zorpas, A.A. The Increase of Soil Organic Matter Reduces Global Warming, Myth or Reality? Sci 2021, 3, 1–14. [Google Scholar] [CrossRef]
- Poeplau, C.; Don, A. Carbon Sequestration in Agricultural Soils via Cultivation of Cover Crops - A Meta-Analysis. Agric. Ecosyst. Environ. 2015, 200, 33–41. [Google Scholar] [CrossRef]
- Repullo-Ruibérriz de Torres, M.A.; Moreno-García, M.; Ordóñez-Fernández, R.; Rodríguez-Lizana, A.; Rodríguez, B.C.; García-Tejero, I.F.; Zuazo, V.H.D.; Carbonell-Bojollo, R.M. Cover Crop Contributions to Improve the Soil Nitrogen and Carbon Sequestration in Almond Orchards (Sw Spain). Agronomy 2021, 11. [Google Scholar] [CrossRef]
- Mendes, I.C.; Bandick, A.K.; Dick, R.P.; Bottomley, P.J. Microbial Biomass and Activities in Soil Aggregates Affected by Winter Cover Crops. Soil Sci. Soc. Am. J. 1999, 63, 873–881. [Google Scholar] [CrossRef]
- Hastings, A.F.; Wattenbach, M.; Eugster, W.; Li, C.; Buchmann, N.; Smith, P. Uncertainty Propagation in Soil Greenhouse Gas Emission Models: An Experiment Using the DNDC Model and at the Oensingen Cropland Site. Agric. Ecosyst. Environ. 2010, 136, 97–110. [Google Scholar] [CrossRef]
- Bell, M.J.; Jones, E.; Smith, J.; Smith, P.; Yeluripati, J.; Augustin, J.; Juszczak, R.; Olejnik, J.; Sommer, M. Simulation of Soil Nitrogen, Nitrous Oxide Emissions and Mitigation Scenarios at 3 European Cropland Sites Using the ECOSSE Model. Nutr. Cycl. Agroecosystems 2012, 92, 161–181. [Google Scholar] [CrossRef]
- Abdalla, M.; Hastings, A.; Helmy, M.; Prescher, A.; Osborne, B.; Lanigan, G.; Forristal, D.; Killi, D.; Maratha, P.; Williams, M.; et al. Assessing the Combined Use of Reduced Tillage and Cover Crops for Mitigating Greenhouse Gas Emissions from Arable Ecosystem. Geoderma 2014, 223–225, 9–20. [Google Scholar] [CrossRef]
- Wolf, B.; Zheng, X.; Brüggemann, N.; Chen, W.; Dannenmann, M.; Han, X.; Sutton, M.A.; Wu, H.; Yao, Z.; Butterbach-Bahl, K. Grazing-Induced Reduction of Natural Nitrous Oxide Release from Continental Steppe. Nature 2010, 464, 881–884. [Google Scholar] [CrossRef]
- Li, C.; Zhuang, Y.; Cao, M.; Crill, P.; Dai, Z.; Frolking, S.; Moore, B.; Salas, W.; Song, W.; Wang, X. Comparing a Process-Based Agro-Ecosystem Model to the IPCC Methodology for Developing a National Inventory of N2O Emissions from Arable Lands in China. Nutr. Cycl. Agroecosystems 2001, 60, 159–175. [Google Scholar] [CrossRef]
Figure 1.
Average monthly precipitation and air temperature from 2008 to 2022.
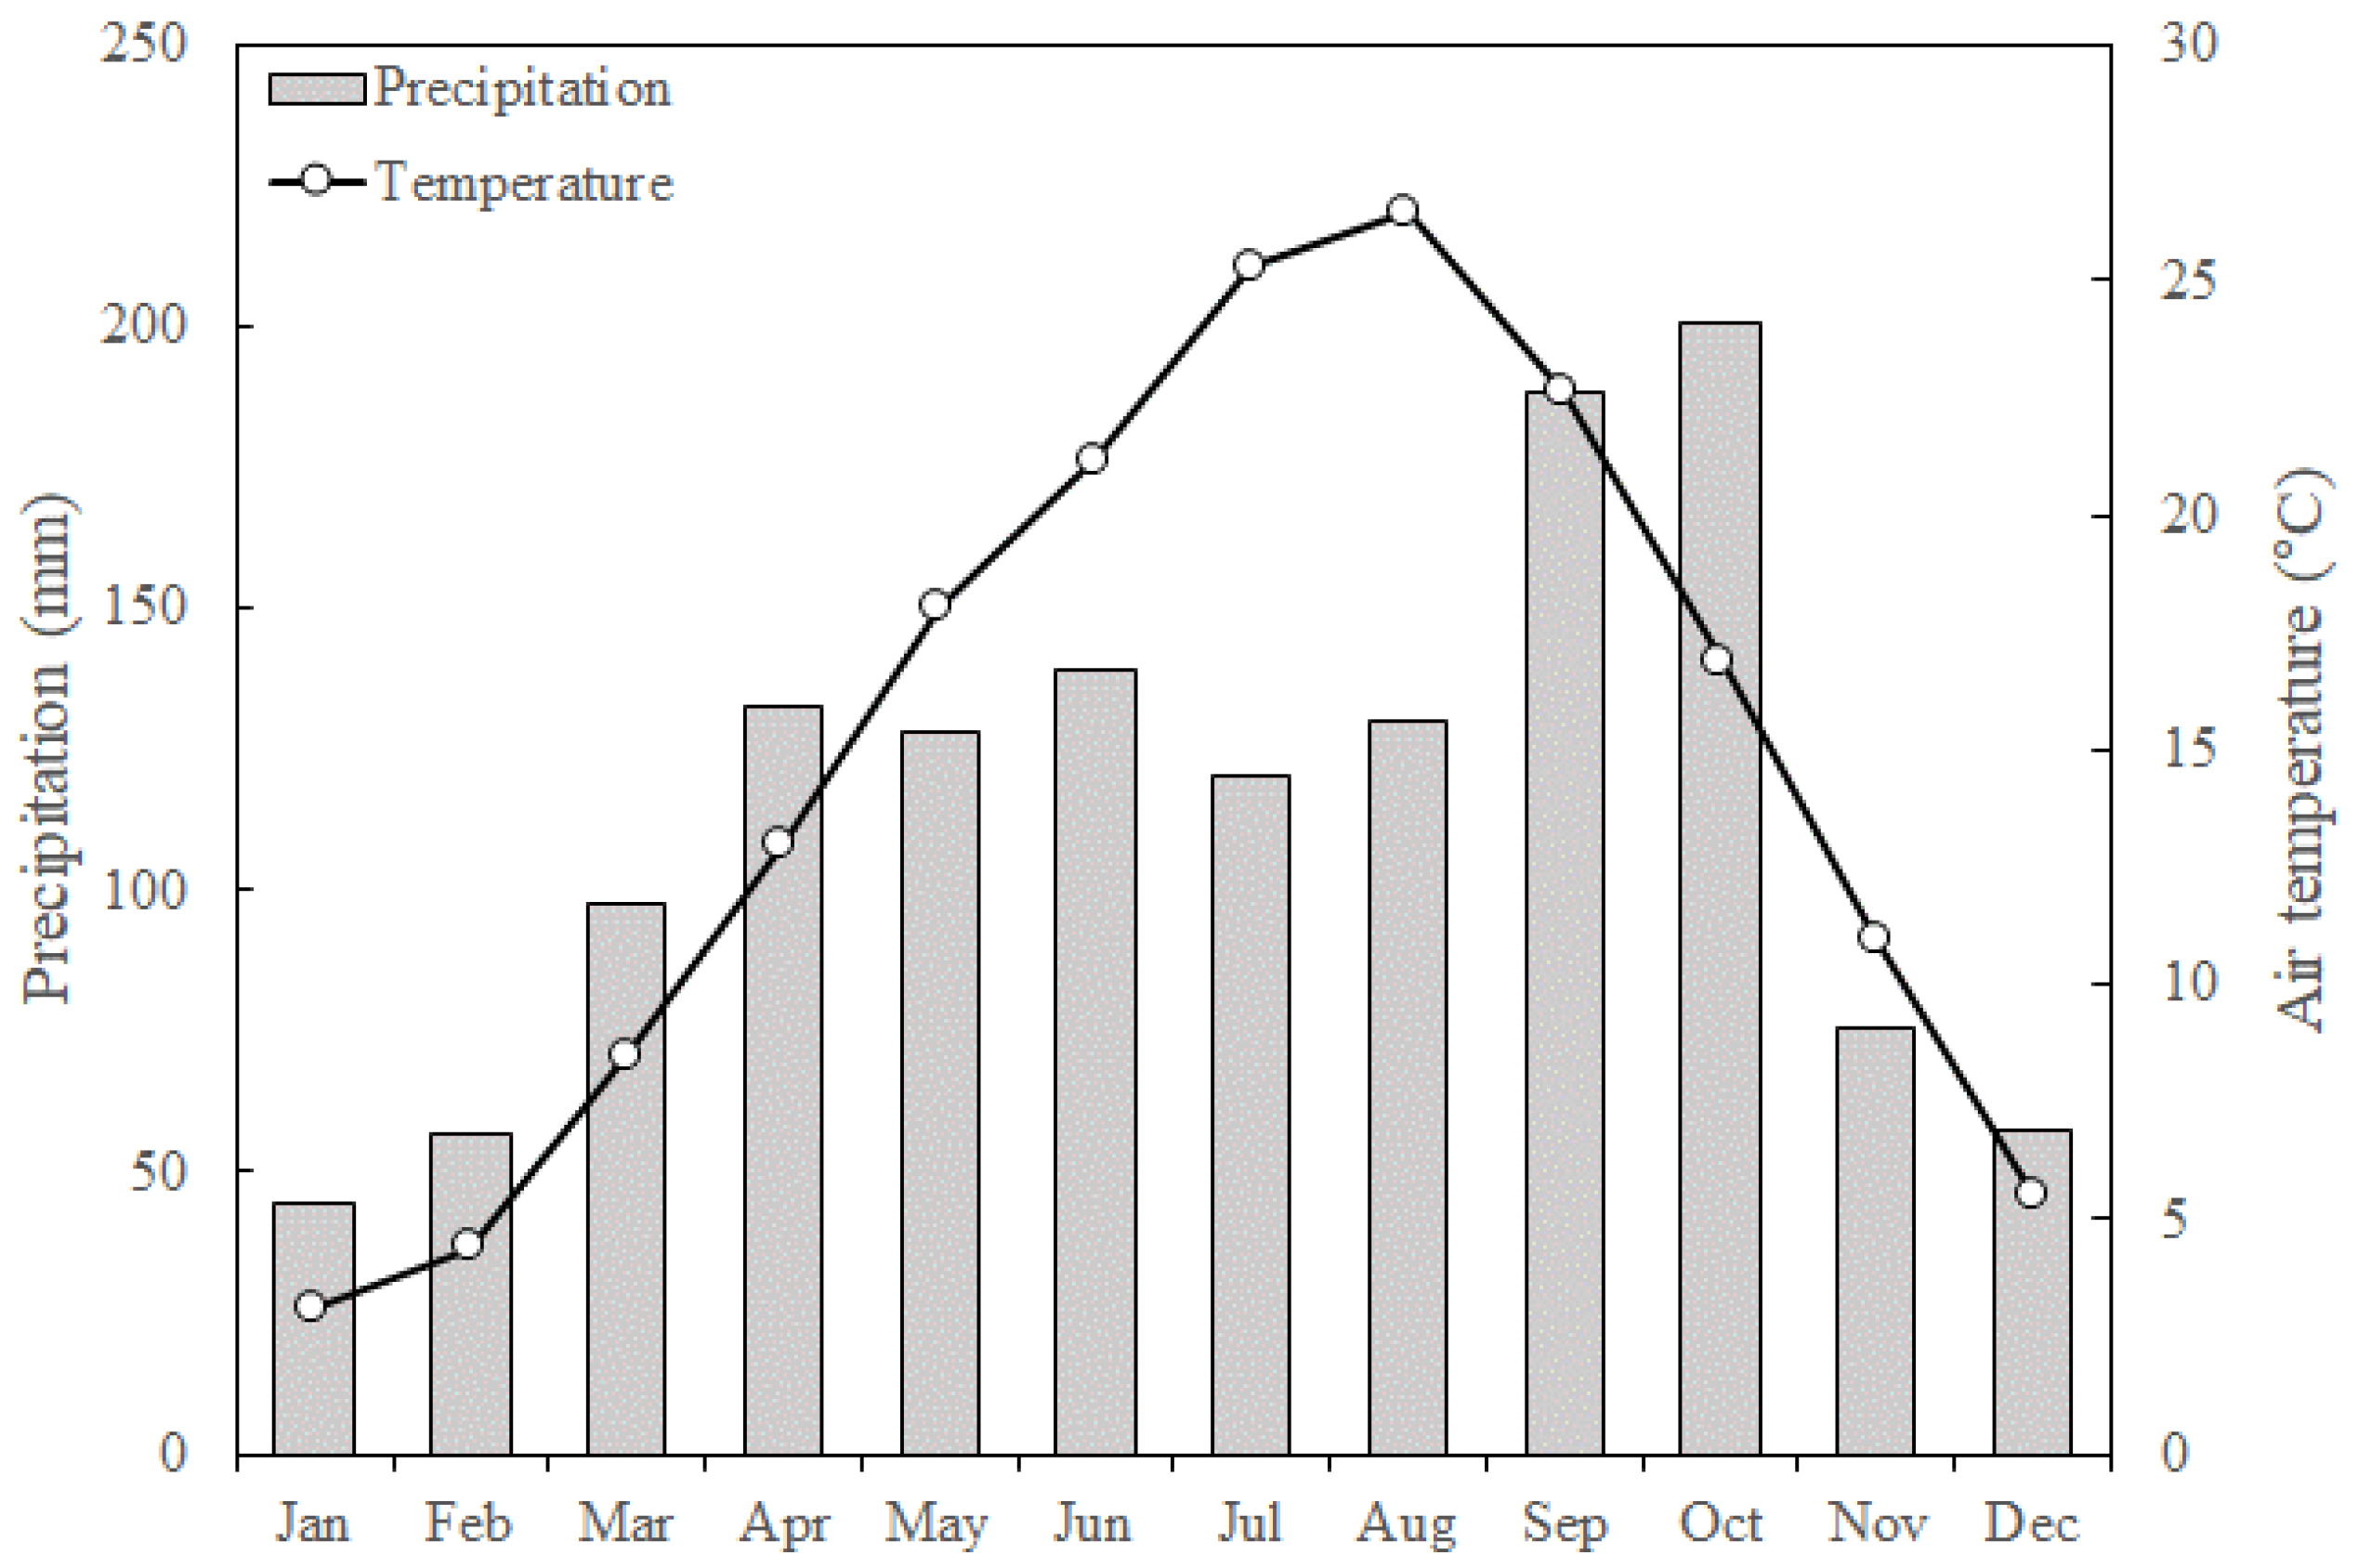
Figure 2.
Comparisons between observed and simulated daily soil temperature under fallow (A) and rye (B) system during the 2020 and 2021 cropping year.
Figure 2.
Comparisons between observed and simulated daily soil temperature under fallow (A) and rye (B) system during the 2020 and 2021 cropping year.
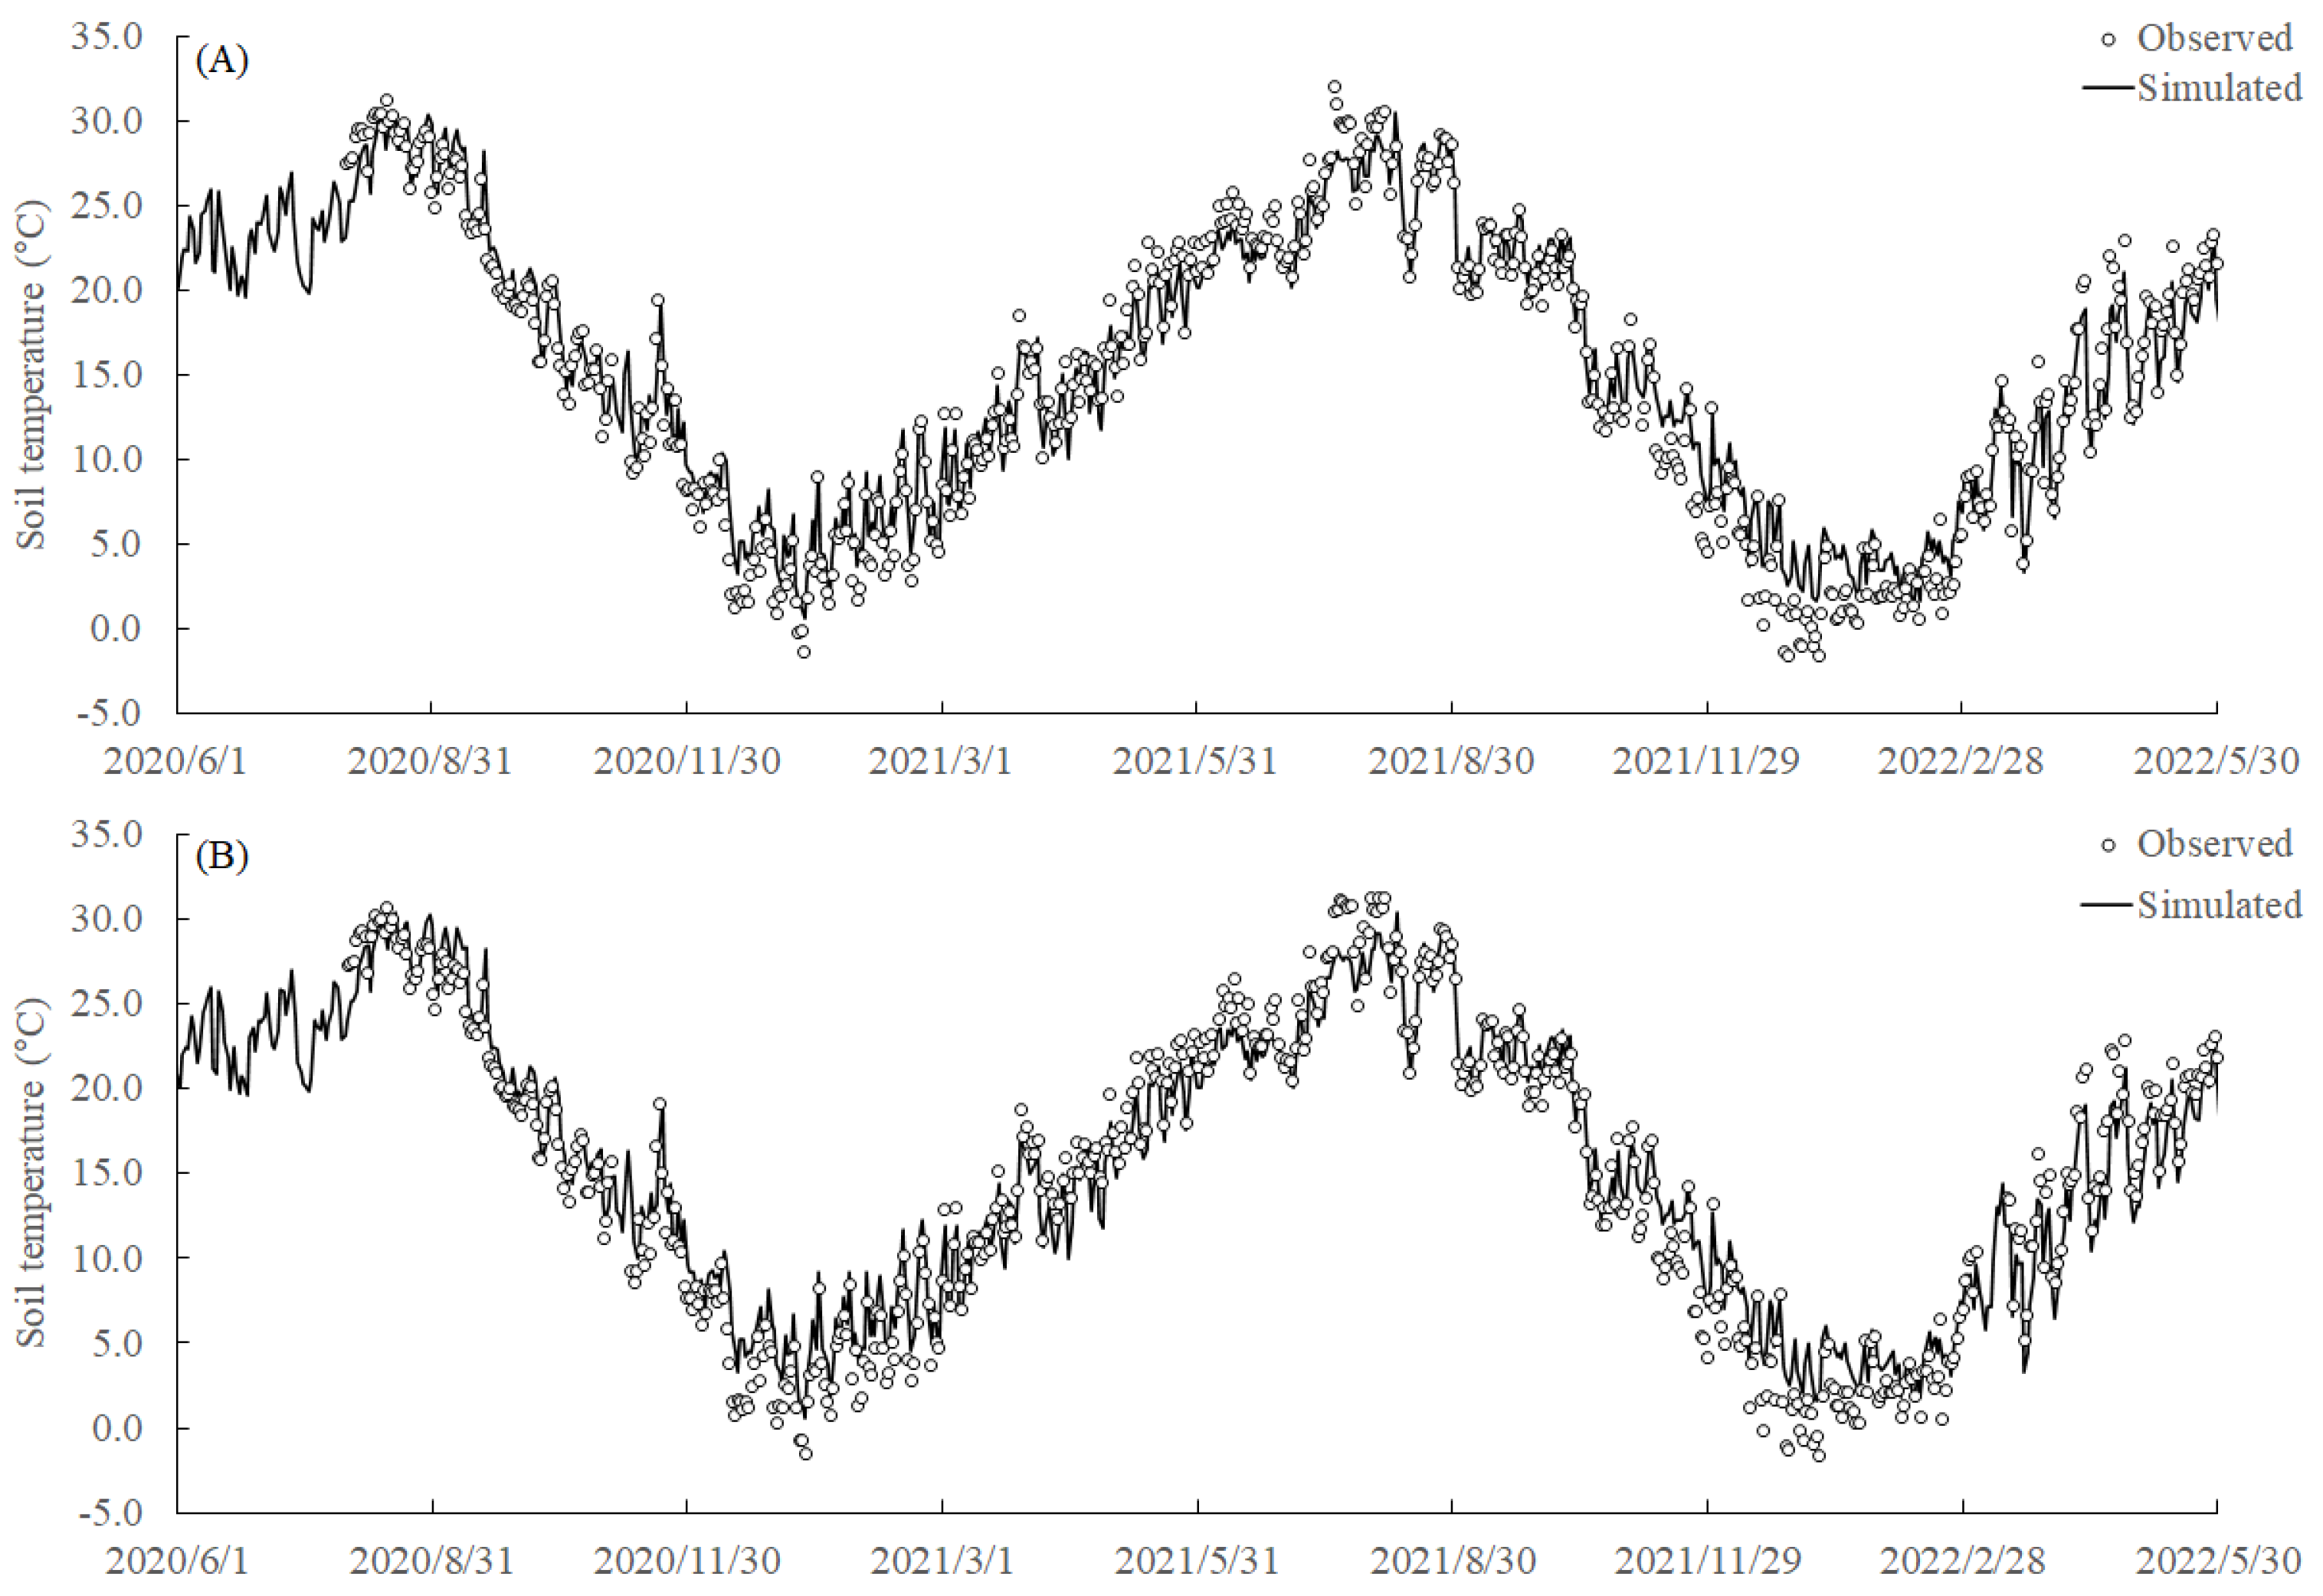
Figure 3.
Observed and simulated daily water-filled pore space (WFPS) under fallow (A) and rye (B) system during the 2020 and 2021 cropping year.
Figure 3.
Observed and simulated daily water-filled pore space (WFPS) under fallow (A) and rye (B) system during the 2020 and 2021 cropping year.
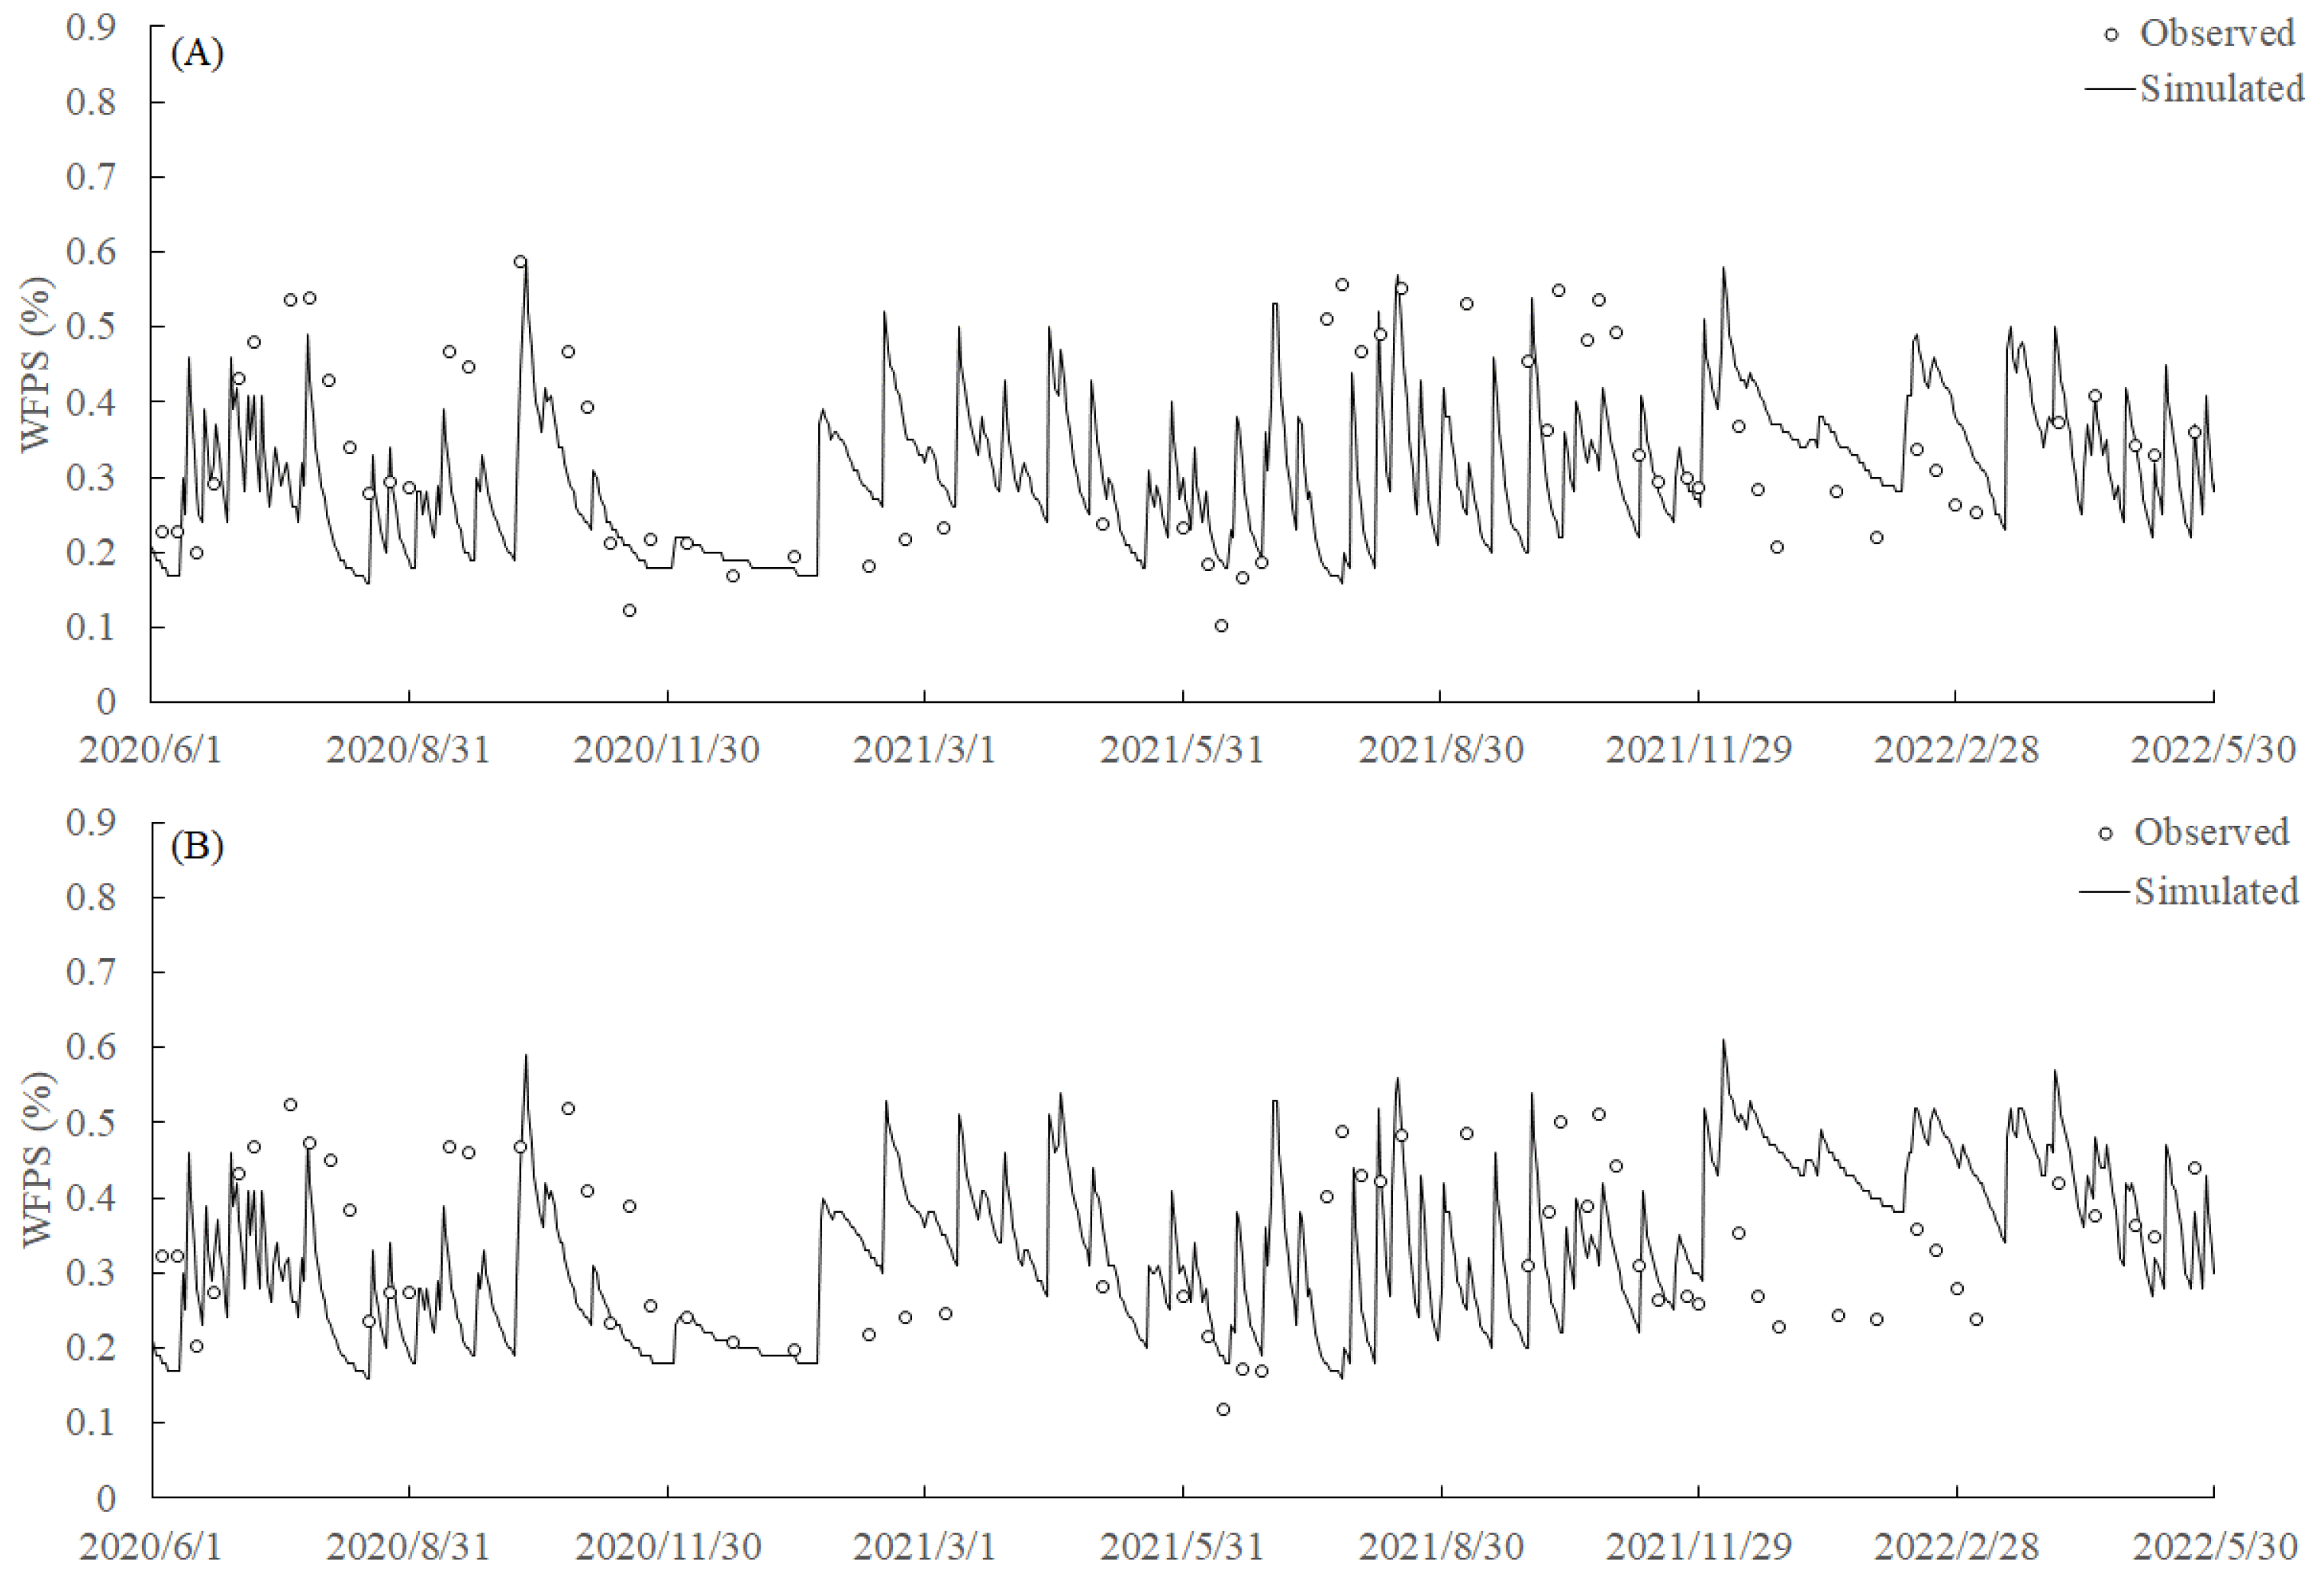
Figure 4.
Observed and simulated SOC stock under fallow (FA) and rye (RY) system from 2008 to 2021.
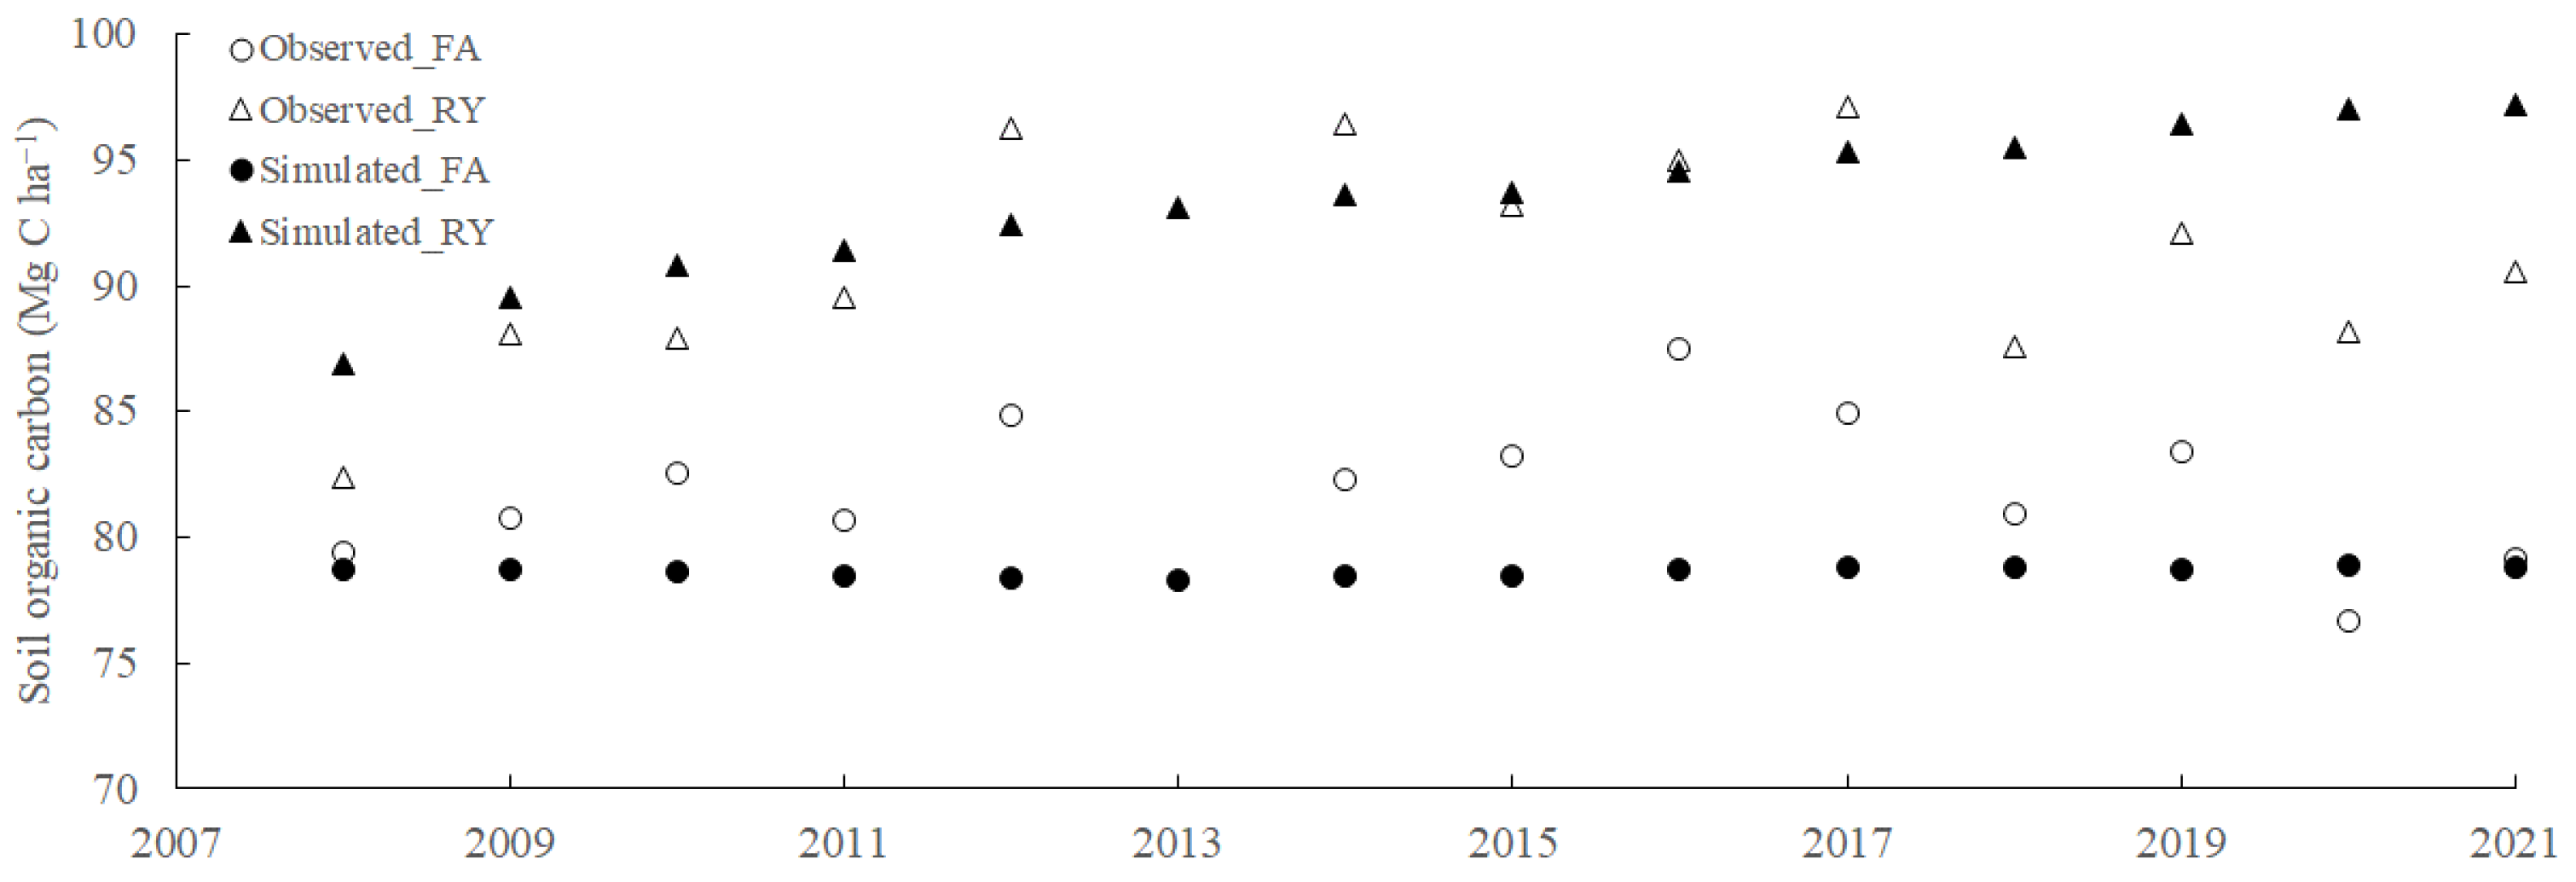
Figure 5.
Observed and simulated daily CO2 emission under fallow (A) and rye (B) system during the 2020 and 2021 cropping year. The gray vertical line, perpendicular to the x-axis, indicates the date of tillage implementation.
Figure 5.
Observed and simulated daily CO2 emission under fallow (A) and rye (B) system during the 2020 and 2021 cropping year. The gray vertical line, perpendicular to the x-axis, indicates the date of tillage implementation.
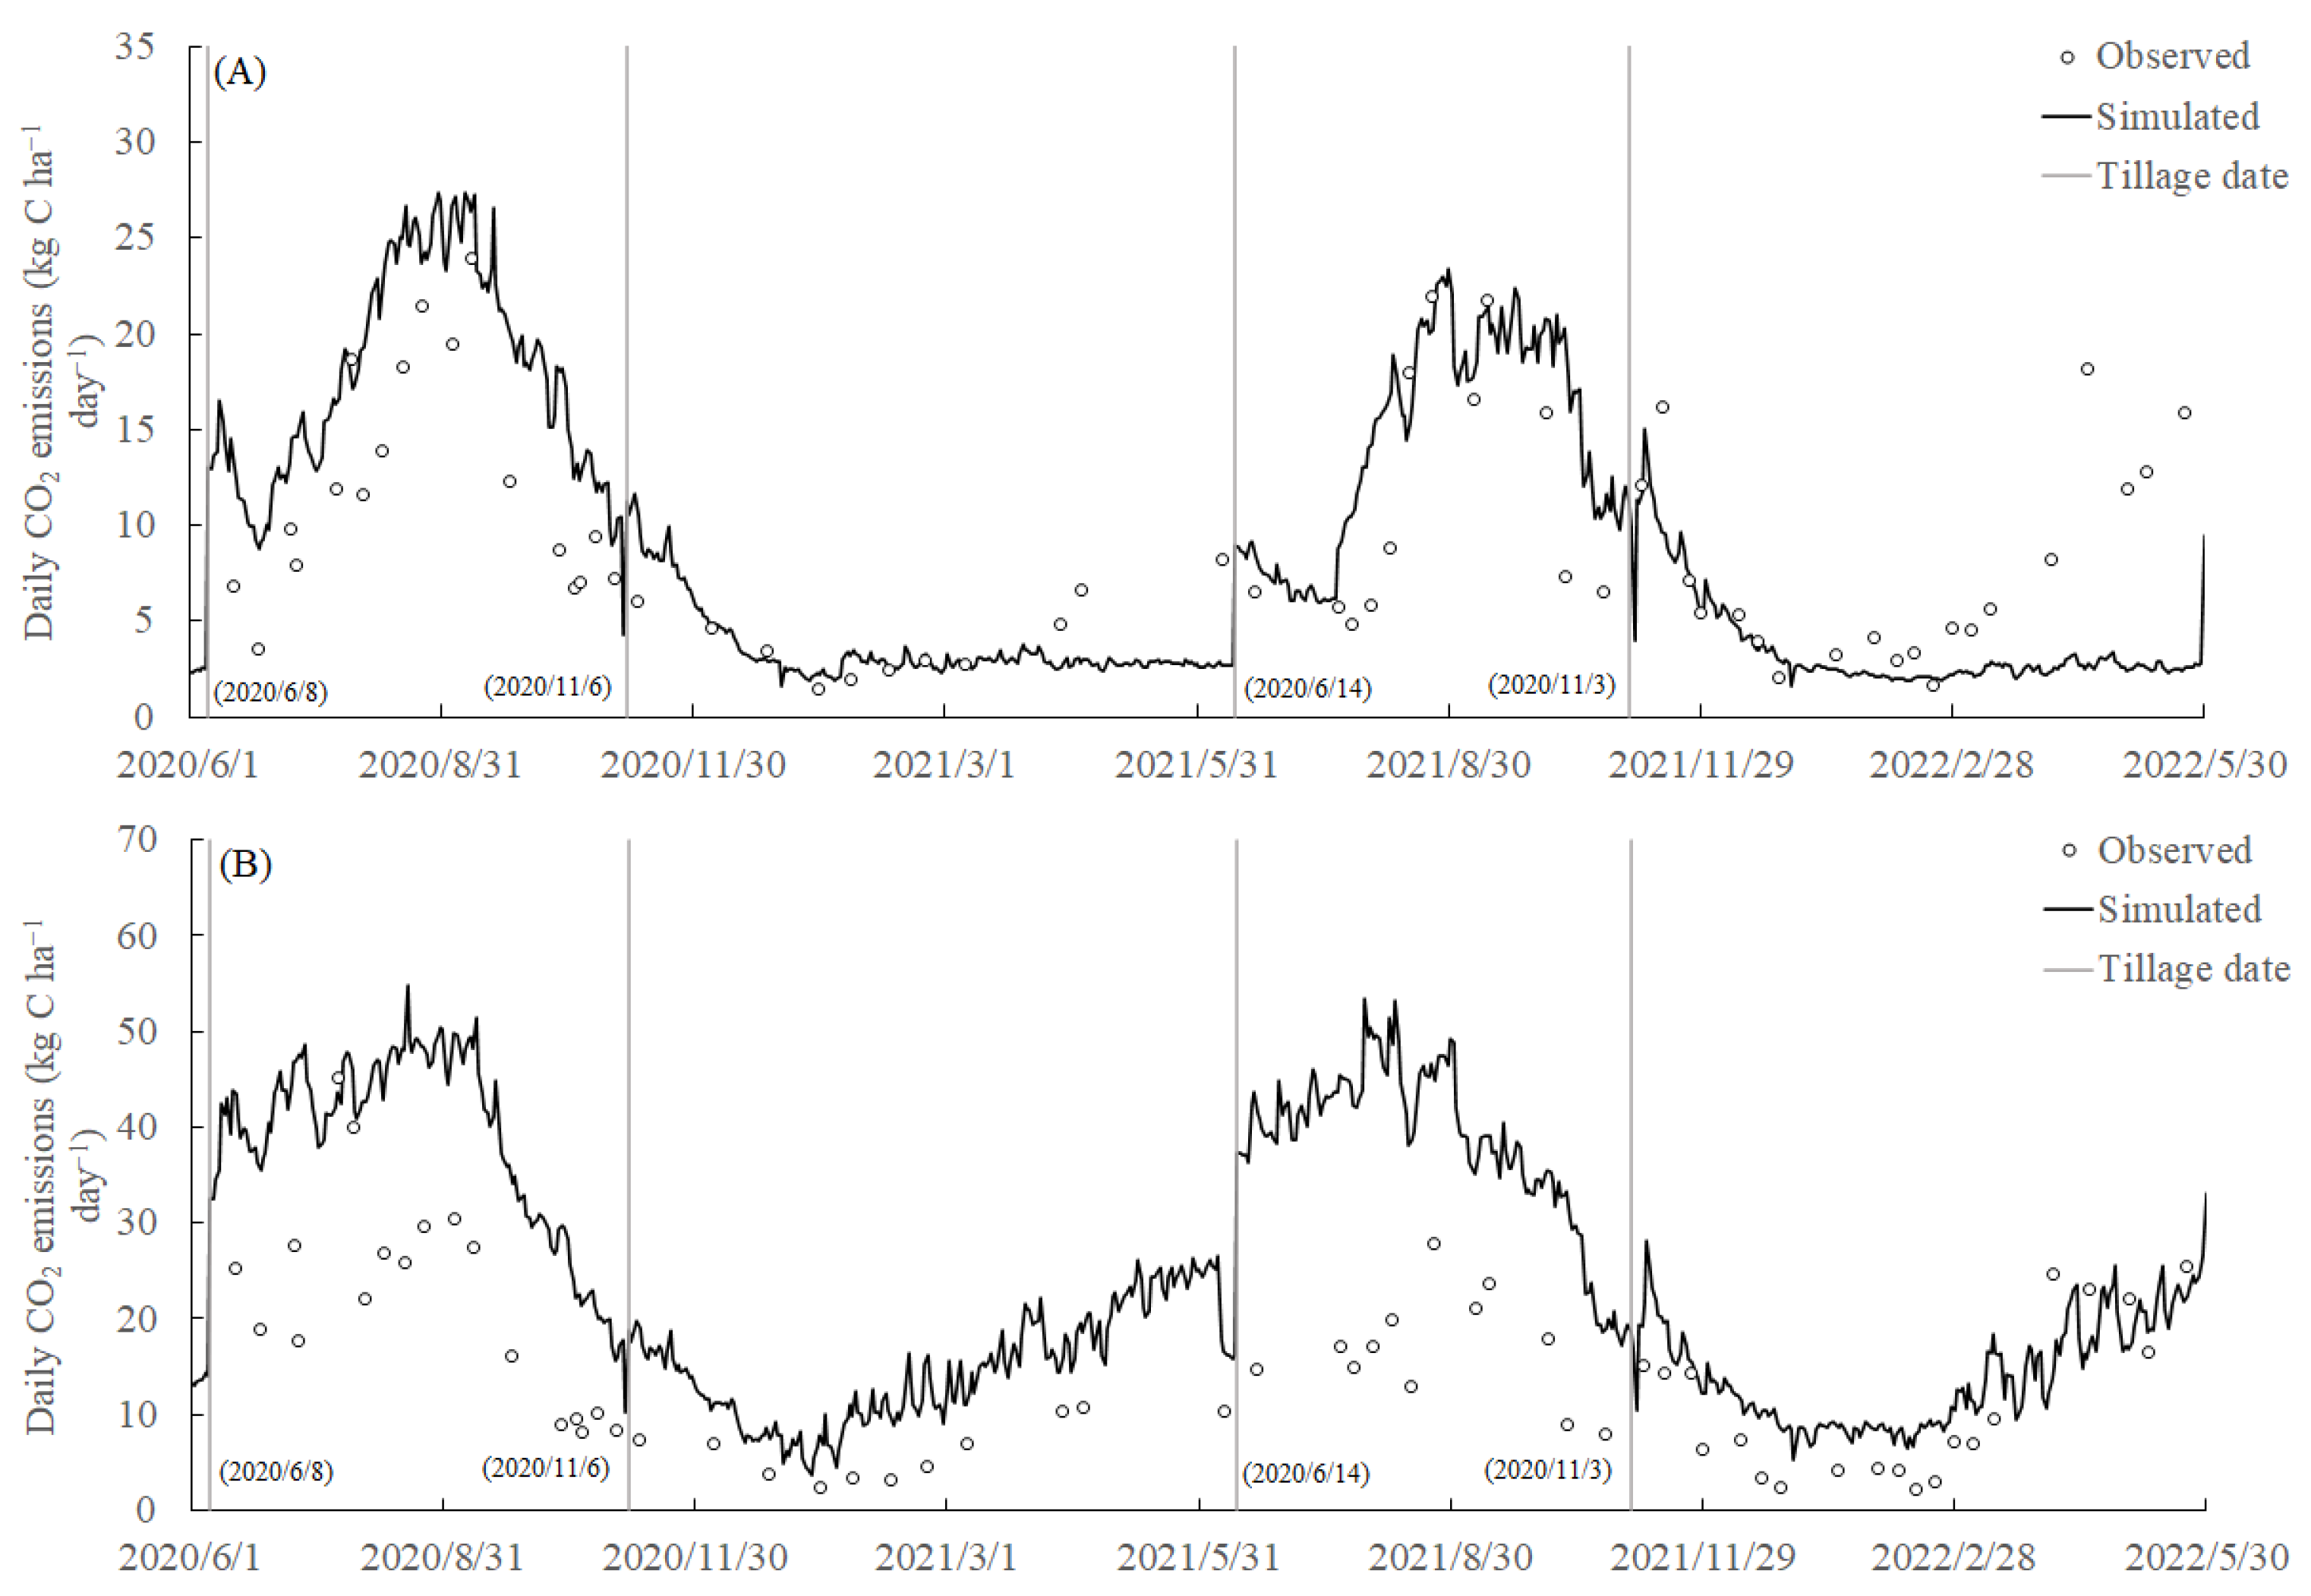
Figure 6.
Observed and simulated daily N2O emission under fallow (A) and rye (B) system during the 2020 and 2021 cropping year. The gray vertical line, perpendicular to the x-axis, indicates the date of tillage implementation.
Figure 6.
Observed and simulated daily N2O emission under fallow (A) and rye (B) system during the 2020 and 2021 cropping year. The gray vertical line, perpendicular to the x-axis, indicates the date of tillage implementation.
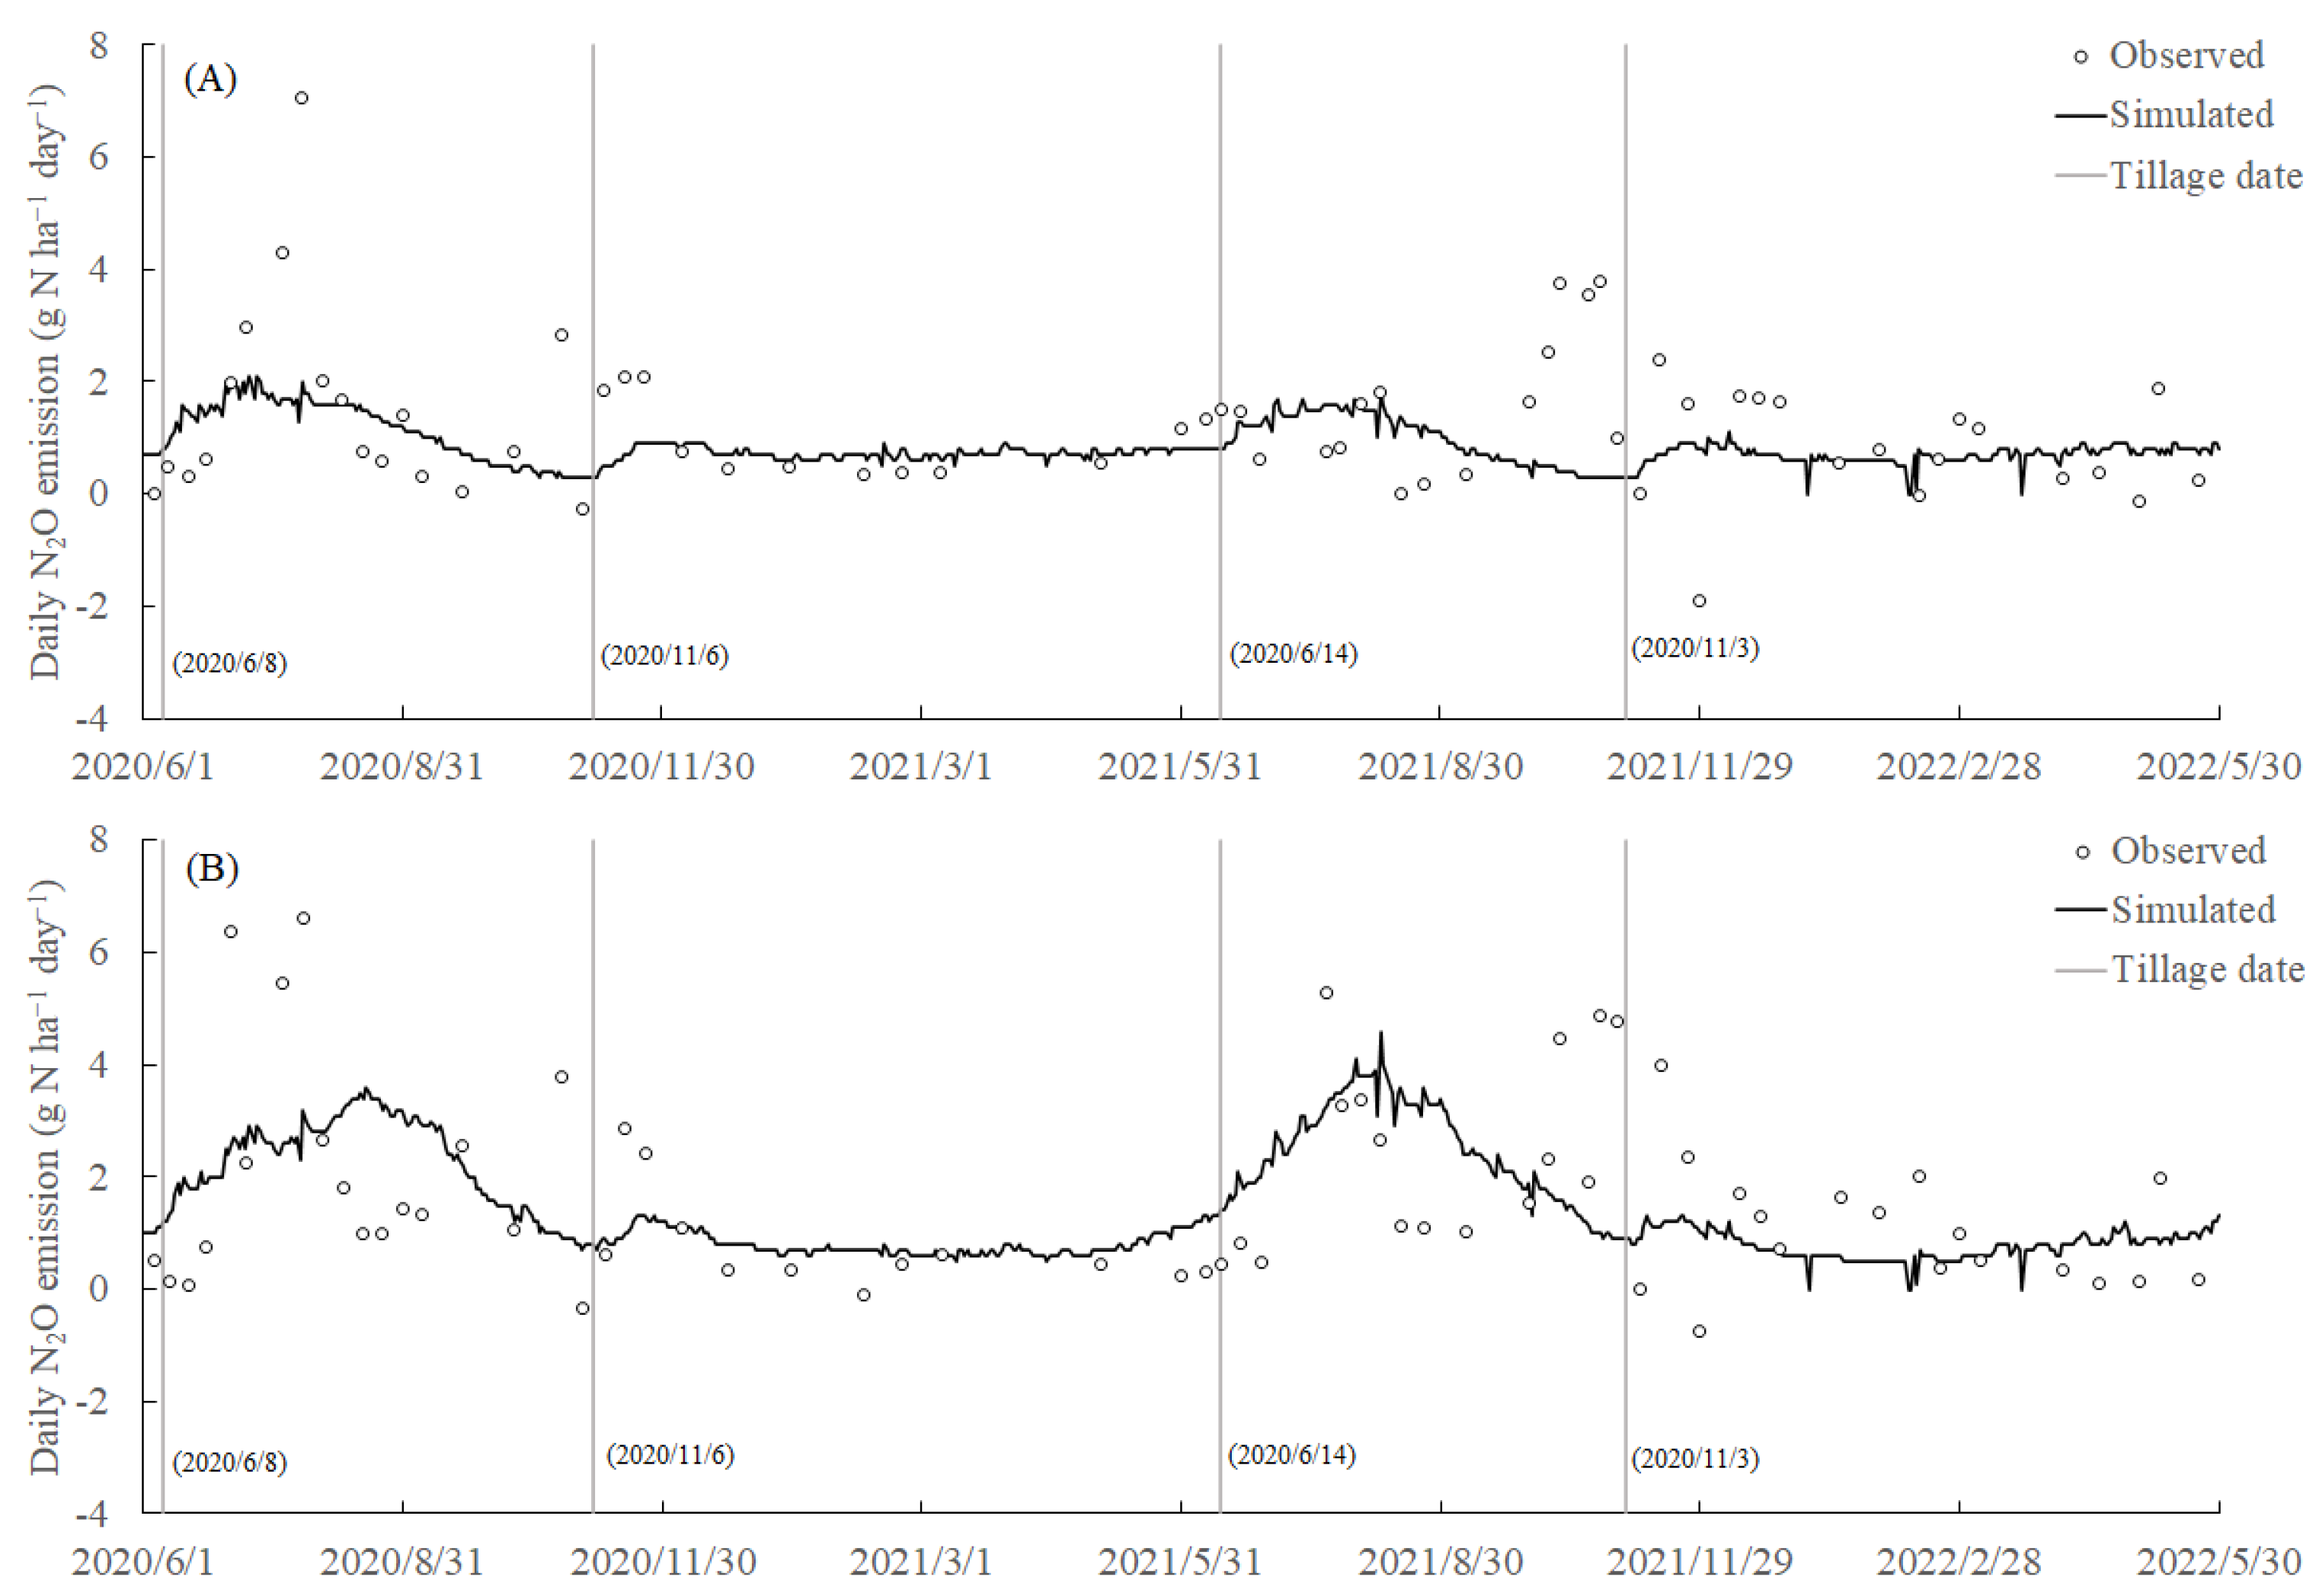

Table 1.
Field management schedule for the 2020 and 2021 cropping years. Dates are described as Day/Month/Year.
Table 1.
Field management schedule for the 2020 and 2021 cropping years. Dates are described as Day/Month/Year.
| Management | 2020 | 2021 |
|---|---|---|
| Summer tillage | 2020/6/8 | 2021/6/14 |
| Soybean sowing | 2020/6/30 | 2021/7/20 |
| Soybean harvest | 2020/11/5 | 2021/11/2 |
| Autumn tillage | 2020/11/6 | 2021/11/3 |
| Cover crop sowing | 2020/11/9 | 2021/11/3 |
| Cover crop harvesting | 2021/6/8 | 2022/5/30 |
Table 2.
Observed and simulated mean soil temperature, water-filled pore space (WFPS), daily N2O emission and daily CO2 emission during the 2020 and 2021 cropping year. FA: fallow; RY: rye; SD: standard deviation; nRMSE: normalized root mean square error.
Table 2.
Observed and simulated mean soil temperature, water-filled pore space (WFPS), daily N2O emission and daily CO2 emission during the 2020 and 2021 cropping year. FA: fallow; RY: rye; SD: standard deviation; nRMSE: normalized root mean square error.
| Variables | Units | Treatment | n | Observed value | Simulated value | nRMSE (%) | ||
|---|---|---|---|---|---|---|---|---|
| Mean | SD | Mean | SD | |||||
| Soil temperature | °C | FA | 678 | 14.98 | 0.34 | 15.29 | 0.31 | 10.69 |
| RY | 682 | 15.24 | 0.34 | 15.48 | 0.31 | 11.39 | ||
| WFPS | % | FA | 63 | 32.15 | 1.39 | 30.17 | 0.98 | 42.67 |
| RY | 63 | 33.37 | 1.18 | 32.56 | 1.13 | 41.90 | ||
| Daily N2O emission | kg N ha−1 | FA | 62 | 1.28 | 0.17 | 0.91 | 0.06 | 105.16 |
| RY | 63 | 1.69 | 0.21 | 1.63 | 0.13 | 94.93 | ||
| Daily CO2 emission | kg C ha−1 | FA | 61 | 9.07 | 0.77 | 10.07 | 0.99 | 60.16 |
| RY | 61 | 14.55 | 1.26 | 25.77 | 1.90 | 101.31 | ||
Table 3.
Observed and simulated mean soil organic carbon (SOC) stock, soybean biomass and soybean yield from 2008 to 2021. FA: fallow; RY: rye; SD: standard deviation; nRMSE: normalized root mean square error.
Table 3.
Observed and simulated mean soil organic carbon (SOC) stock, soybean biomass and soybean yield from 2008 to 2021. FA: fallow; RY: rye; SD: standard deviation; nRMSE: normalized root mean square error.
| Variables | Units | Treatment | n | Observed value | Simulated value | nRMSE (%) | ||
|---|---|---|---|---|---|---|---|---|
| Mean | SD | Mean | SD | |||||
| Soybean biomass | Mg C ha−1 | FA | 13 | 3.23 | 0.23 | 3.72 | 0.16 | 25.52 |
| RY | 13 | 3.13 | 0.18 | 3.70 | 0.16 | 23.52 | ||
| Soybean yield | Mg C ha−1 | FA | 13 | 1.35 | 0.11 | 1.39 | 0.06 | 17.44 |
| RY | 13 | 1.24 | 0.10 | 1.38 | 0.06 | 17.21 | ||
| SOC stock | Mg C ha−1 | FA | 13 | 80.41 | 0.88 | 78.76 | 0.05 | 5.38 |
| RY | 13 | 88.48 | 1.38 | 90.43 | 1.34 | 4.95 | ||
Table 4.
Observed and simulated cumulative CO2 emission in each crop season under different cropping system from 2020 to 2021. FA: fallow; RY: rye.
Table 4.
Observed and simulated cumulative CO2 emission in each crop season under different cropping system from 2020 to 2021. FA: fallow; RY: rye.
| Variable | Treatment | Observed | Simulated |
|---|---|---|---|
| kg C ha−1 | |||
| 2020 Soybean season | FA | 1701.37 | 2422.93 |
| RY | 2869.44 | 4979.66 | |
| 2020 Cover crop season | FA | 951.51 | 748.77 |
| RY | 1485.84 | 3133.97 | |
| 2021 Soybean season | FA | 1421.41 | 1809.51 |
| RY | 1841.09 | 3999.32 | |
| 2021 Cover crop season | FA | 1554.02 | 730.55 |
| RY | 2360.57 | 2905.00 | |
| Total cumulation | FA | 5628.32 | 5711.76 |
| RY | 8556.94 | 15017.95 | |
Table 5.
Observed and simulated cumulative N2O emission in each crop season under different cropping systems from 2020 to 2021. FA: fallow; RY: rye.
Table 5.
Observed and simulated cumulative N2O emission in each crop season under different cropping systems from 2020 to 2021. FA: fallow; RY: rye.
| Variable | Treatment | Observed | Simulated |
|---|---|---|---|
| kg N ha−1 | |||
| 2020 Soybean season | FA | 231.73 | 142.80 |
| RY | 335.18 | 300.30 | |
| 2020 Cover crop season | FA | 150.08 | 152.20 |
| RY | 126.26 | 166.90 | |
| 2021 Soybean season | FA | 165.64 | 92.60 |
| RY | 255.25 | 267.30 | |
| 2021 Cover crop season | FA | 164.90 | 142.70 |
| RY | 224.70 | 158.70 | |
| Total cumulation | FA | 712.36 | 530.30 |
| RY | 941.38 | 893.20 | |
Table 6.
Observed and simulated global warming potential (GWP) under different cropping systems during the 2020 and 2021 cropping year. FA: fallow; RY: rye; ΔSOC: change of soil organic carbon stock.
Table 6.
Observed and simulated global warming potential (GWP) under different cropping systems during the 2020 and 2021 cropping year. FA: fallow; RY: rye; ΔSOC: change of soil organic carbon stock.
| Variable | Treatment | Observed | Simulated |
|---|---|---|---|
| kg C ha−1 year−1 | |||
| N2O GWP | FA | 162.33 | 128.86 |
| RY | 220.53 | 215.52 | |
| ΔSOC | FA | -7895.25 | 168.82 |
| RY | -2833.60 | 901.60 | |
| Net GWP | FA | 8057.58 | -39.96 |
| RY | 3054.14 | -686.07 | |
Disclaimer/Publisher’s Note: The statements, opinions and data contained in all publications are solely those of the individual author(s) and contributor(s) and not of MDPI and/or the editor(s). MDPI and/or the editor(s) disclaim responsibility for any injury to people or property resulting from any ideas, methods, instructions or products referred to in the content. |
© 2025 by the authors. Licensee MDPI, Basel, Switzerland. This article is an open access article distributed under the terms and conditions of the Creative Commons Attribution (CC BY) license (http://creativecommons.org/licenses/by/4.0/).
Copyright: This open access article is published under a Creative Commons CC BY 4.0 license, which permit the free download, distribution, and reuse, provided that the author and preprint are cited in any reuse.


