Submitted:
30 May 2025
Posted:
02 June 2025
You are already at the latest version
Abstract
Introduction: Pediatric prosthetic knee joints must be appropriately scaled from adult designs to ensure proper gait biomechanics. However, direct dimensional scaling without considering biomechanical implications may lead to functional discrepancies. This study aims to evaluate whether a linear scaling factor can effectively adapt the knee for pediatric use. The study assesses whether such an approach yields a viable pediatric prosthetic knee joint by applying a fixed scaling factor and analyzing the resultant knee geometry. Methods: The linear scaling factor was determined based on the pylon tube diameter, a key constraint in compact pediatric knee design. Given a pediatric pylon diameter of 22 mm, the length of tibial link was set to 22 mm, yielding a scaling factor of 0.6875 when compared to the adult-sized knee. This scaling factor was used to identify the dimensions of the pediatric four-bar (scaled) knee joint. Static geometric analysis was conducted using GeoGebra® to model the lower body segment lengths. The knee joint performance was evaluated based on stance and swing phase parameters. These metrics were compared between the scaled knee and a commercial pediatric knee. Results: The geometric analysis revealed that while the linear scaling factor maintained proportional relationships, certain biomechanical parameters deviated from expected pediatric norms. The scaled knee maintained negative x/y ratios at heel contact, showing significant stability in push-off moments, while the stance flexion angle remained within an acceptable range. The scaled knee exhibited slightly lower toe clearance compared to the commercial pediatric knee, which may impact swing phase efficiency. Conclusion: A linear scaling factor provides a straightforward method for adapting adult prosthetic knee designs to pediatric use. However, deviations in key biomechanical parameters indicate that further experimental study may be required to validate the applicability of the scaled knee joint for pediatric users. Future work should explore dynamic simulations and experimental validations to refine the design further and ensure optimal gait performance.
Keywords:
Geometric Scaling Factor
; Pediatric
; Mechanical Knee Joint
; Stance Phase Stability
; Swing Phase Clearance
; ISO10328
1. Introduction
The development of pediatric prosthetic knee joints presents unique challenges due to children's distinct biomechanical and anthropometric characteristics. In contrast to adult prosthetic knees, which have been extensively studied and optimized for function and durability, pediatric knee joints must accommodate lower loads, smaller anatomical dimensions, and different gait dynamics. Ensuring pediatric prostheses provide adequate stability during stance and sufficient clearance during the swing phase is critical for successful ambulation and long-term comfort [1,2].
Scaling techniques have been used in numerous engineering applications, including biomechanics and prosthetic design, to adapt existing designs for different population groups. In particular, linear dimensional scaling has been explored as a method to proportionally adjust the size of mechanical components while maintaining functional performance [3,4,5]. However, its applicability to pediatric prosthetic knee joints remains uncertain.
The International Organization for Standardization (ISO) standard 10328 outlines structural testing requirements for lower-limb prosthetic components, specifying loading conditions to evaluate the strength and durability of prosthetic knees under simulated use [6]. Although these standards provide guidelines for adult prostheses, adapting them for pediatric applications necessitates appropriate scaling of both geometric and loading parameters. An effective scaling method should preserve key biomechanical performance indicators, such as stance-phase stability and swing-phase clearance, to ensure the safe and functional use of the prosthetic knee in young users.
Although scaling principles are commonly applied in prosthetic design, the validity of a linear dimensional scaling factor for pediatric knee joints remains unclear. Existing adult prosthetic knees, such as the IITM knee [7], have been designed to meet the demands of adult users, and their direct downscaling may not necessarily yield a functionally equivalent pediatric prosthetic knee. The primary concern is whether a uniform scaling approach adequately accounts for biomechanical constraints, such as joint stability and clearance when transitioning from an adult-sized knee to a pediatric one.
This study aims to assess if a linear scaling factor can effectively translate the design of an existing adult knee joint into a pediatric version that meets the biomechanical requirements of children aged 3–5 years. Specifically, the research will i) develop a scaling methodology to adjust the dimensions and loading conditions of the adult knee based on a predetermined scaling factor, ii) validate the scaled design through biomechanical analysis, focusing on stance-phase stability and swing-phase clearance, and iii) compare the performance of the scaled knee joint against a commercial pediatric knee to assess its feasibility and effectiveness.
By addressing these objectives, this research seeks to contribute to developing more effective and biomechanically sound pediatric knee prostheses, ultimately improving mobility and quality of life for young transfemoral amputees.
2. Methods
The overall method has five stages i) Calculating the scaling factor & scaling the knee, ii) Identification of performance parameters, iii) Identification of segment length, iv) Geometrical reconstruction, and v) Analysis & comparison.
2.1. Calculating the Scaling Factor & Scaling the Knee
A typical four-bar mechanism with hinges A, B, OA & OB, links a1, a2, a3 & a4 is shown in Figure 1. The angles made by the links to OX are represented by θ1, θ2, θ3 & θ4. Point I is the instantaneous center of rotation (ICR) for the four-bar mechanism formed by extending links a2 and a4 [8].
A four-bar knee joint was scaled down for toddlers based on the design of IITM Knee, an indigenously designed prosthetic knee joint by IIT Madras, India [7]. A scaled knee works on the principle of a four-bar mechanism permitting a specific range of motion. The design parameters for the scaled knee were derived based on the functional requirements of a prosthetic user. As the Kadam met most design parameters like better stance phase stability and swing phase control, it was selected as a reference knee. It has been designed, optimized, and tested for adults or the P5 category of ISO10328 [9].
Pylon diameter is one of the limiting factors in making the scaled knee as compact as possible. Considering the pylon tube diameter, which is generally 22 mm for pediatric cases, the length of the link that is just above the pylon was set to 22mm. Thus, the scaling factor to scale the link dimensions from reference knee to scaled knee was calculated by dividing the length of the bottom link of scaled knee to that of the reference knee joint.
The remaining three links were scaled down from their respective lengths in the reference knee using the calculated scaling factor of 0.6875
2.2. Identification of Performance Parameters
Performance parameters indicate satisfaction with the design. For scaled knee, the performance parameters check the overall stability and swing phase clearance. A prosthetic knee needs to be designed considering that it will guarantee stable movement, avoiding non-intentional buckling. A total of nine performance parameters (Six for stance phase stability and three for swing phase clearance) were identified with the help of literature. The performance criteria/requirements for the identified parameters were also set based on the literature. Table 1 depicts the performance parameters that were identified and the requirements of the identified performance parameters.
Here, x is the offset of ICR from load line and y is the distance from center of pressure at the foot to ICR along the load line. According to [8] the ICR can be estimated by extending the two links of the four-bar and intersecting them at a point. Similarly, the α-value is the distance between the ICR and the load line. Then, a third straight line (the alpha line) is drawn to the load line. This alpha line indicates the stability of the system. The α-value is positive if the ICR moves further to the posterior side of the load line and negative if the ICR moves to the anterior side. Here, if the α-value is positive at full extension, the knee is considered stable.
2.3. Identification of Segment Length
In [3], C. Colombo et al. devised a method to rescale the loading conditions based on the predictions of geometric dimensions comparing it to Hybrid III dummies with dimensions provided by the ISO10328 standard. The author used geometrical dimensions from Hybrid III dummies for 3, 6, 10 years old children as a reference to extrapolate the knee height (uK) for a 12-year-old boy. The projected knee height (uK) based on the dimensions from Hybrid III dummies can be represented by Equation (2).
Using Equation (2), the knee height for the required condition can be approximated. As this equation has been generated based on the geometrical dimensions from Hybrid III dummies representing 3, 6, and 10-year-olds, it cannot be used to estimate the knee height of an adult. The average knee height for a 5-year-old would be 292.92 mm.
Based on the method devised by [3], the ratio of uK for an adult and a child can be assumed to be a linear coefficient k to calculate other dimensions. The knee height for P3 category in ISO10328 is 500 mm can be used in Equation (3) to get the value of the coefficient.
Thus, the ratio will be
where,
: knee height for 5-years old
: knee height for P3 category of ISO 10328
Another method to approximate knee height is to use the growth chart published by WHO and the knee height ratio proposed by [5], utilized by [4]. WHO has published a table with approximated data of age vs. total height for 0 to 5-years children whereas knee height equals 0.284 times the total height as per [4,5]. The value of k was 0.63 using Eq 3 when calculated based on the WHO [12] & Drillis and Contini [5]. The calculated knee heights and the values of the coefficient for 3 to 5-year-old children are shown in Table 2.
The largest of the calculated coefficients (k=0.63) was taken as the proportionality coefficient. With the help of this coefficient, the distances required to specify the reference planes, offset distances, and loading conditions in compliance with ISO 10328 were identified. The values of the scaled reference planes and offset distances are shown in Figure 2 and the scaled values of the load for loading conditions 1 and 2 are shown in Table 3.
As per ISO 10328, the axes of a coordinate system in relation to a prosthetic user who is standing in an upright position can be expressed in terms of u, f, and o where u is upwards, f is forward, and o is outside. The top, knee, ankle, and bottom reference planes are located along axis-u at a distance of uT, uK, uA and uB from the origin, respectively.
2.4. Geometrical Reconstruction
The obtained dimensions of the 5-year-old’s limbs were plotted along with the scaled knee mechanism, as shown in Figure 3. It shows the length of a lower limb starting from the hip joint (JH) to the foot (F) including the knee joint (JK) with the centrode of the ICR. This complete set of lower limbs for a 5-year-old was constructed in an open-source software named GeoGebra® with lines representing various segments of the foot and the pediatric knee. Here, the points JH, JK, JA, & F represent the anatomical hip joint, knee joint, ankle joint, and foot respectively. Similarly, A-B, B-OB, OB-OA, & OA-A represent the four links of the knee. The instantaneous center of rotation (I) and the path traced by I are shown in Figure 3. The hinge A of the scaled knee joint lies posterior to the anatomical knee (JK) at the same height from the base. Similarly, the link lengths of a commercial pediatric knee joint were measured, and its geometrical reconstruction was prepared. Both reconstructions (scaled knee & commercial knee) were evaluated side-by-side for each performance parameter and checked if they fulfilled the requirements.
2.5. Analysis & Comparison
The geometric reconstruction of the lower limb in GeoGebra® was simulated to evaluate the performance of the scaled knee & commercial knee for stance stability and swing phase clearance. The performance of both knees in the simulation was compared with the reference values of the identified performance parameters.
3. Results
3.1. (X/Y) Ratio
The x and y values for the scaled knee during heel contact are -19.08 mm and 432.44 mm, respectively. They change to -49.68 mm and 443.56 mm during push-off. The values are close to the x and y values of the commercial knee, which are -19.3 mm and 424.8 mm, respectively, for heel contact and -49.72 mm and 435.43 mm for push-off. This results in an (x/y) ratio of -0.044 and -0.045 for heel contact, whereas -0.112 and -0.114 for push-off, respectively, for scaled and commercial knee joints (Figure 4).
3.2. Stable Knee Flexion Angle
As the knee flexes, the ICR approaches the load line, and the scaled knee joint can flex approximately 2.01º, whereas it is limited to 1.6º in the commercial knee before the (x/y) ratio for heel strike becomes positive, as shown in Figure 5. The value of x is almost zero at this knee flexion angle for both knees.
3.3. Stabilizing Hip Moment
At 15º knee flexion, the values of x and y are 77.89 mm (72.2 mm) and 369.74 mm (340 mm), respectively, as shown in Figure 6 for scaled knee and commercial knee, resulting in 0.21 (x/y) ratio for heel contact in both knees which is near to zero. The standard deviation of the positive heel contact (x/y) ratio of the scaled knee is around 0.068, almost equal to 0.065, which is for the commercial knee. Both have a lower value of standard deviation resulting in the requirement of lower amount of stabilizing moment.
3.4. α and β Stability
The values of α and β are the distance of ICR from the knee joint in X and Y directions, which are 29.77 mm and 120.1 mm for the scaled knee, and 28.9 mm and 124 mm for the commercial knee, respectively. Both the values are positive, as required (Figure 7).
3.5. Toe Clearance
From Figure 8, K” is the intersection between the extended tibial line (JA-M as shown in Figure 3) and femoral line (JH-JK as shown in Figure 3). C1 is the overall length of the lower limb from the ankle to the hip joint (H), whereas C2 is the sum of the ankle to K” and K” to the hip joint. L is the difference between C1 and C2, which gives the value by which the limb is shortened while flexing the knee during the swing phase.
Thus, the leg is shortened by 18.2 mm in the scaled knee, which is higher than that of the commercial knee that has 12.5 mm shortening while swinging the leg due to the shortening effect of the polycentric four-bar knee, as shown in Table 4.
3.6. Heel Clearance
Figure 10 shows that the heel clearance remains positive while advancing from mid-wing to terminal swing. The minimum heel clearance of 13.8 mm for scaled knee and 25.5 mm for commercial knee from the ground is attained at 12° knee flexion.
4. Discussion
The GRF at the heel strike is almost 120% of the body weight which demands a greater hip moment for stability [10]. Stability can be parameterized by the (x/y) ratio during heel contact and push-off. For the scaled knee, the heel contact (x/y) ratio was found to be -0.044, almost equal to -0.045 for the commercial knee. The negative heel-contact ratio implies that the knee is stable at heel contact without requiring the stabilizing hip moment to ensure stability. The scaled knee seems as stable as the commercial knee.
As shown in Table 5, the push-off (x/y) ratio (-0.112) approaches zero, which means the knee is stable and comparable to the commercial knee (-0.114). The knee can flex up to 2.01° during heel contact without buckling the knee. Here, the scaled knee is even superior to the commercial knee, which can only flex up to 1.6° without buckling. As the value of the standard deviation of the positive heel contact (x/y) ratio is small and consistent till 15º, the knee can maintain stability with the minimum hip moment and prevent buckling in the range of 2 to 15 degrees.
During full extension, if the α-value is positive, the knee is considered stable. Compared to the commercial knee joint with α-value 28.9 mm, the scaled knee joint has 29.77 mm, which lies on the posterior side of the load line and is considered stable at full extension.
Here, β-value represents the location of ICR from the mechanical knee center and is preferred to be greater than zero. For the scaled knee, the β-value is observed to be 120.1 mm, which is superior to the mechanical knee center, reducing the moment required to buckle the knee and increasing the stability. However, the moment required is slightly higher than the commercial knee, having a β-value of 124 mm.
The minimum toe clearance of 13.5 mm was observed in the scaled knee joint at 23º hip flexion and 49º knee flexion which is slightly less than the 19.7 mm in the commercial knee. Similarly, the minimum heel clearance at 23º hip flexion and 12º knee flexion was 11.7 mm less than the commercial knee. Though the toe and heel clearances are higher than zero to avoid stumbling while walking, it is lower than the commercial knee’s clearances.
The spider chart (radar chart) shown in Figure 11 compares the Scaled Knee (solid line) and the Commercial Knee (dashed line) across multiple biomechanical performance parameters identified earlier. Each axis represents a key performance metric, and normalized values range outward from 0 (center) to 1.25 (outer ring), with higher values indicating better or stronger performance in that metric. Both the Scaled Knee and Commercial Knee have similar values in these metrics, suggesting that the scaled knee retains comparable stability during initial heel contact and push-off. The scaled knee follows a similar pattern to the commercial knee, indicating that its stance-phase biomechanics are comparable. The Commercial Knee performs slightly better in the Heel contact (x/y) ratio, β-Stability, Toe Clearance, and Heel Clearance, particularly in Toe Clearance and Heel Clearance, which are crucial for swing phase clearance. The Scaled Knee shows a significant reduction in length, confirming that the scaling method successfully minimizes overall prosthesis size while still maintaining essential biomechanical functions.
The Scaled Knee maintains stability and stance-phase performance close to that of the Commercial Knee, making it a promising alternative for pediatric prostheses. Swing phase metrics require further refinement, as the scaled knee has lower toe clearance and β-stability, which could increase the risk of tripping. The linear scaling approach effectively reduces prosthetic size, but adjustments in certain link lengths may be necessary to optimize performance. However, the scaled knee shows reasonable values, meaning that its design still supports an effective walking gait.
5. Conclusions
The thorough examination provided in this study highlights that the scaled knee joint satisfies the crucial requirements for stability and clearance necessary for a normal gait, as painstakingly detailed in Table 5. The encouraging results firmly support the practicality of using the scaled knee joint in pediatric situations.
- The study successfully demonstrates that the linear geometric scaling factor can translate the dimensions of an adult prosthetic knee joint to pediatric transfemoral prostheses. The scaled knee maintains the proportional geometric relationships while meeting key stance stability and swing phase clearance criteria.
- The scaled knee exhibits heel contact and push-off (x/y) ratios comparable to a commercial pediatric knee, ensuring stability during stance in gait. Stance flexion angle and stabilizing hip moment values indicate that the scaled knees provide reliable support during loading.
- The scaled knee achieves positive toe and heel clearance values, minimizing the risk of stumbling. While slightly lower than the commercial knee, these clearances remain functional, indicating a strong basis for further refinement.
- Linear scaling offers a straightforward and reproducible method for designing pediatric knee joints, reducing complexity in design and manufacturing. The approach allows for the adaptation of existing adult prosthetic designs to meet pediatric needs, enhancing accessibility.
- The study establishes a strong foundation for scaling adult knee prosthetic designs to pediatric applications. With further refinements, this method can significantly improve mobility and quality of life for young transfemoral amputees.
Furthermore, the method's effective implementation for scaling the prosthetic knee joint validates its dependability and establishes a basis for wider applicability. The results bring a significant perspective to prosthetic improvements by validating the scaling method and furthering the understanding of the effectiveness of the scaled knee joint in pediatric instances. Physical prototyping and gait analysis can be conducted to validate theoretical predictions ensuring that the proposed scaling method translates effectively into real-world applications.
Author Contributions
Conceptualization, P.L.S., and B.T.; methodology, P.L.S., B.T., and S.S.; software, P.L.S.; validation, P.L.S., and S.S.; formal analysis, P.L.S., and S.S..; investigation, P.L.S.; resources, B.T. and S.S..; data curation, P.L.S..; writing—original draft preparation, P.L.S.; writing—review and editing, P.L.S., B.T. and S.S..; visualization, P.L.S..; supervision, B.T.; and S.S..; project administration, B.T., and S.S.; funding acquisition, P.L.S. and B.T. All authors have read and agreed to the published version of the manuscript.
Funding
The authors received no financial support for the research, authorship, and/or publication of this article.
Institutional Review Board Statement
Not applicable.
Informed Consent Statement
Not applicable.
Data Availability Statement
Data are disclosed in this article; no more new data were created.
Acknowledgments
During the preparation of this manuscript/study, the author(s) used ChatGPT and Grammarly for language and grammar improvement. The authors have reviewed and edited the output and take full responsibility for the content of this publication.
Conflicts of Interest
The authors declare no conflicts of interest.
References
- Zmitrewicz, R.J.; Neptune, R.R.; Sasaki, K. Mechanical Energetic Contributions from Individual Muscles and Elastic Prosthetic Feet during Symmetric Unilateral Transtibial Amputee Walking: A Theoretical Study. J. Biomech. 2007, 40, 1824–1831. [Google Scholar] [CrossRef] [PubMed]
- Geil, M.D.; Coulter-O’Berry, C.; Schmitz, M.; Heriza, C. Crawling Kinematics in an Early Knee Protocol for Pediatric Prosthetic Prescription. J. Prosthetics Orthot. 2013, 25, 22–29. [Google Scholar] [CrossRef]
- Colombo, C.; Marchesin, E.G.; Vergani, L.; Boccafogli, E.; Verni, G. A Method for the Verification of Structural Integrity of Lower Limbs Prostheses. SDHM Struct. Durab. Heal. Monit. 2012, 8, 307–327. [Google Scholar] [CrossRef]
- Winter, D.A. Biomechanics and Motor Control of Human Movement: Fourth Edition; 2009; ISBN 9780470398180.
- Drillis, R.; Contini, R.; Bluestein, M. Body Segment Parameters: A Survey of Measurement Techniques. Artif. Limbs 1964, 25, 44–66. [Google Scholar]
- ISO 10328:2016 Prosthetics-Structural Testing of Lower-Limb Prostheses-Requirements and Test Methods 2016.
- Anand, T.S.; Sujatha, S. A Method for Performance Comparison of Polycentric Knees and Its Application to the Design of a Knee for Developing Countries. Prosthet. Orthot. Int. 2017, 41, 402–411. [Google Scholar] [CrossRef] [PubMed]
- Greene, M.P. Four Bar Linkage Knee Analysis. Orthot. Prosthetics 1983, 37, 15–24. [Google Scholar]
- Sudeesh, S.; Sujatha, S.; Shunmugam, M.S. The Effects of Polycentric Knee Design and Alignment on Swing Phase Gait Parameters: A Simulation Approach. J. Prosthetics Orthot. 2021, 33, 266–278. [Google Scholar] [CrossRef]
- Radcliffe, C.W. Biomechanics of Knee Stability Control with Four-Bar Prosthetic Knees. Proc. ISPO Aust. Annu. Meet. 2003. [Google Scholar]
- Winter DA Foot Trajectory in Human Gait: A Precise and Multifactorial Motor Control Task. Phys. Ther. 1992.
- WHO Child Growth Standards; 2006;
- Theron, J. Design, Development and Testing of an Adjustable Above-Knee Prosthetic Leg for Toddlers, Stellenbosch University, 2017.
Figure 1.
Configuration of a four-bar mechanism.
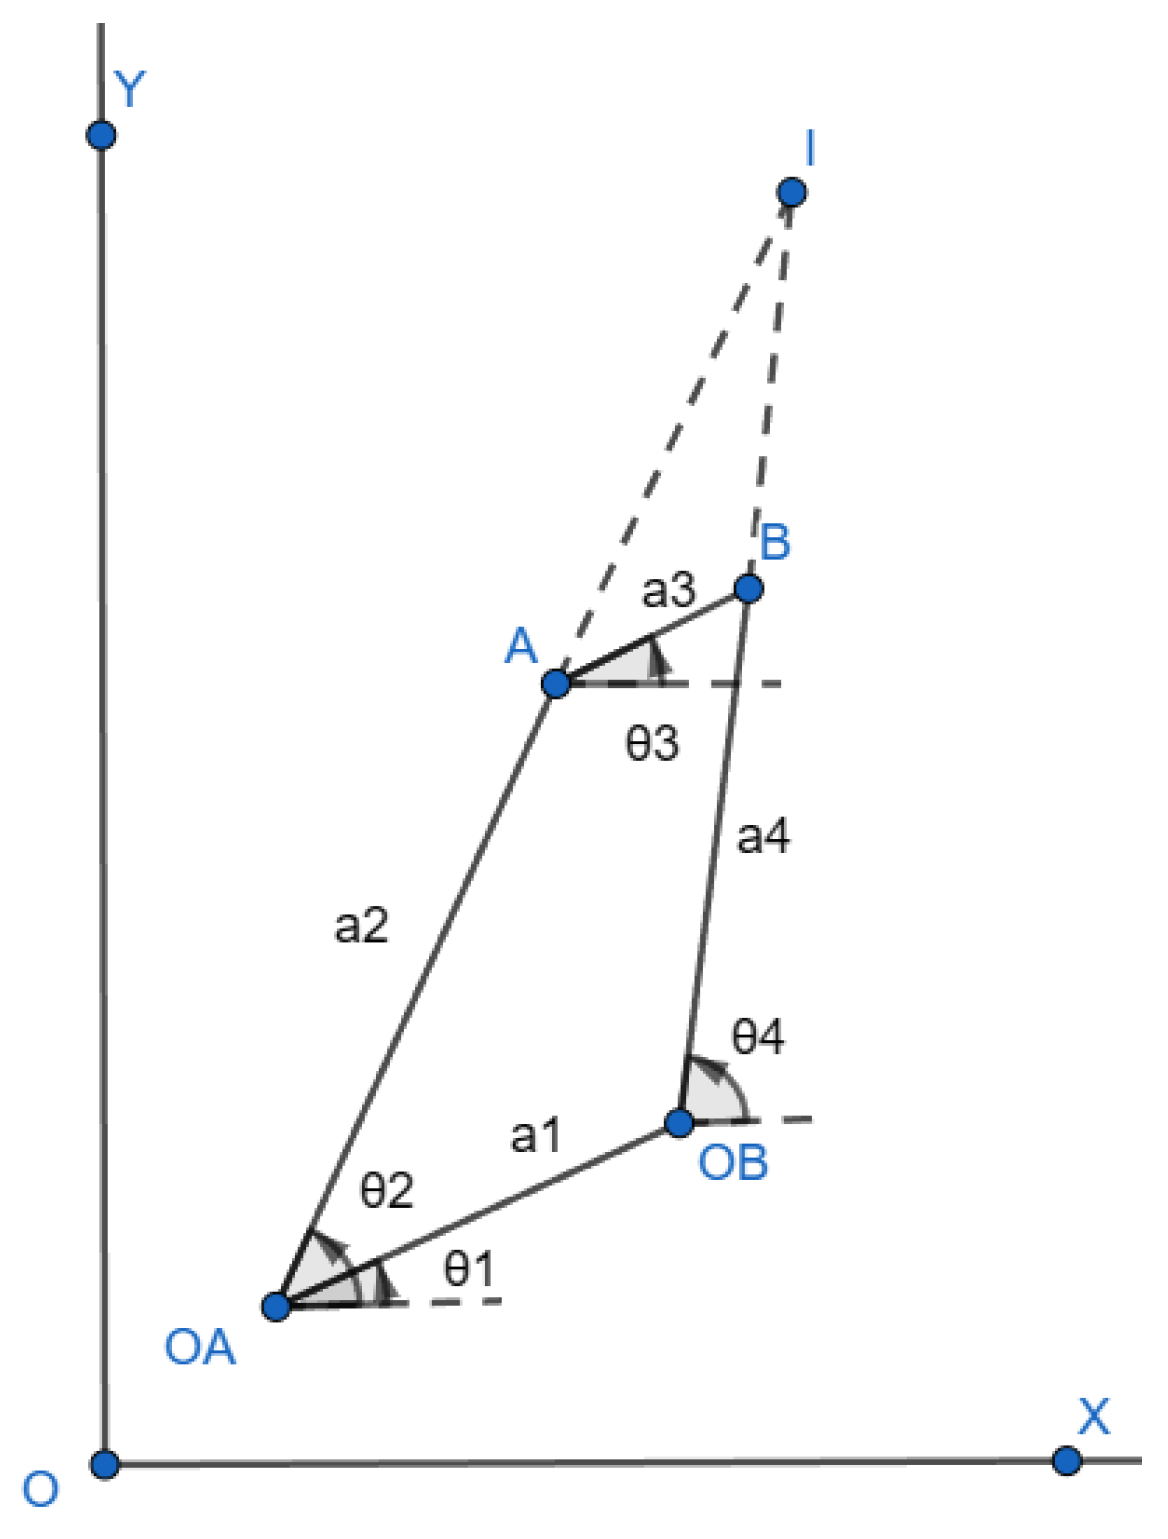
Figure 2.
Reference plane, their offset with values for the scaled P3 (for 5 year old) & P3 category of ISO10328 (inside bracket).
Figure 2.
Reference plane, their offset with values for the scaled P3 (for 5 year old) & P3 category of ISO10328 (inside bracket).
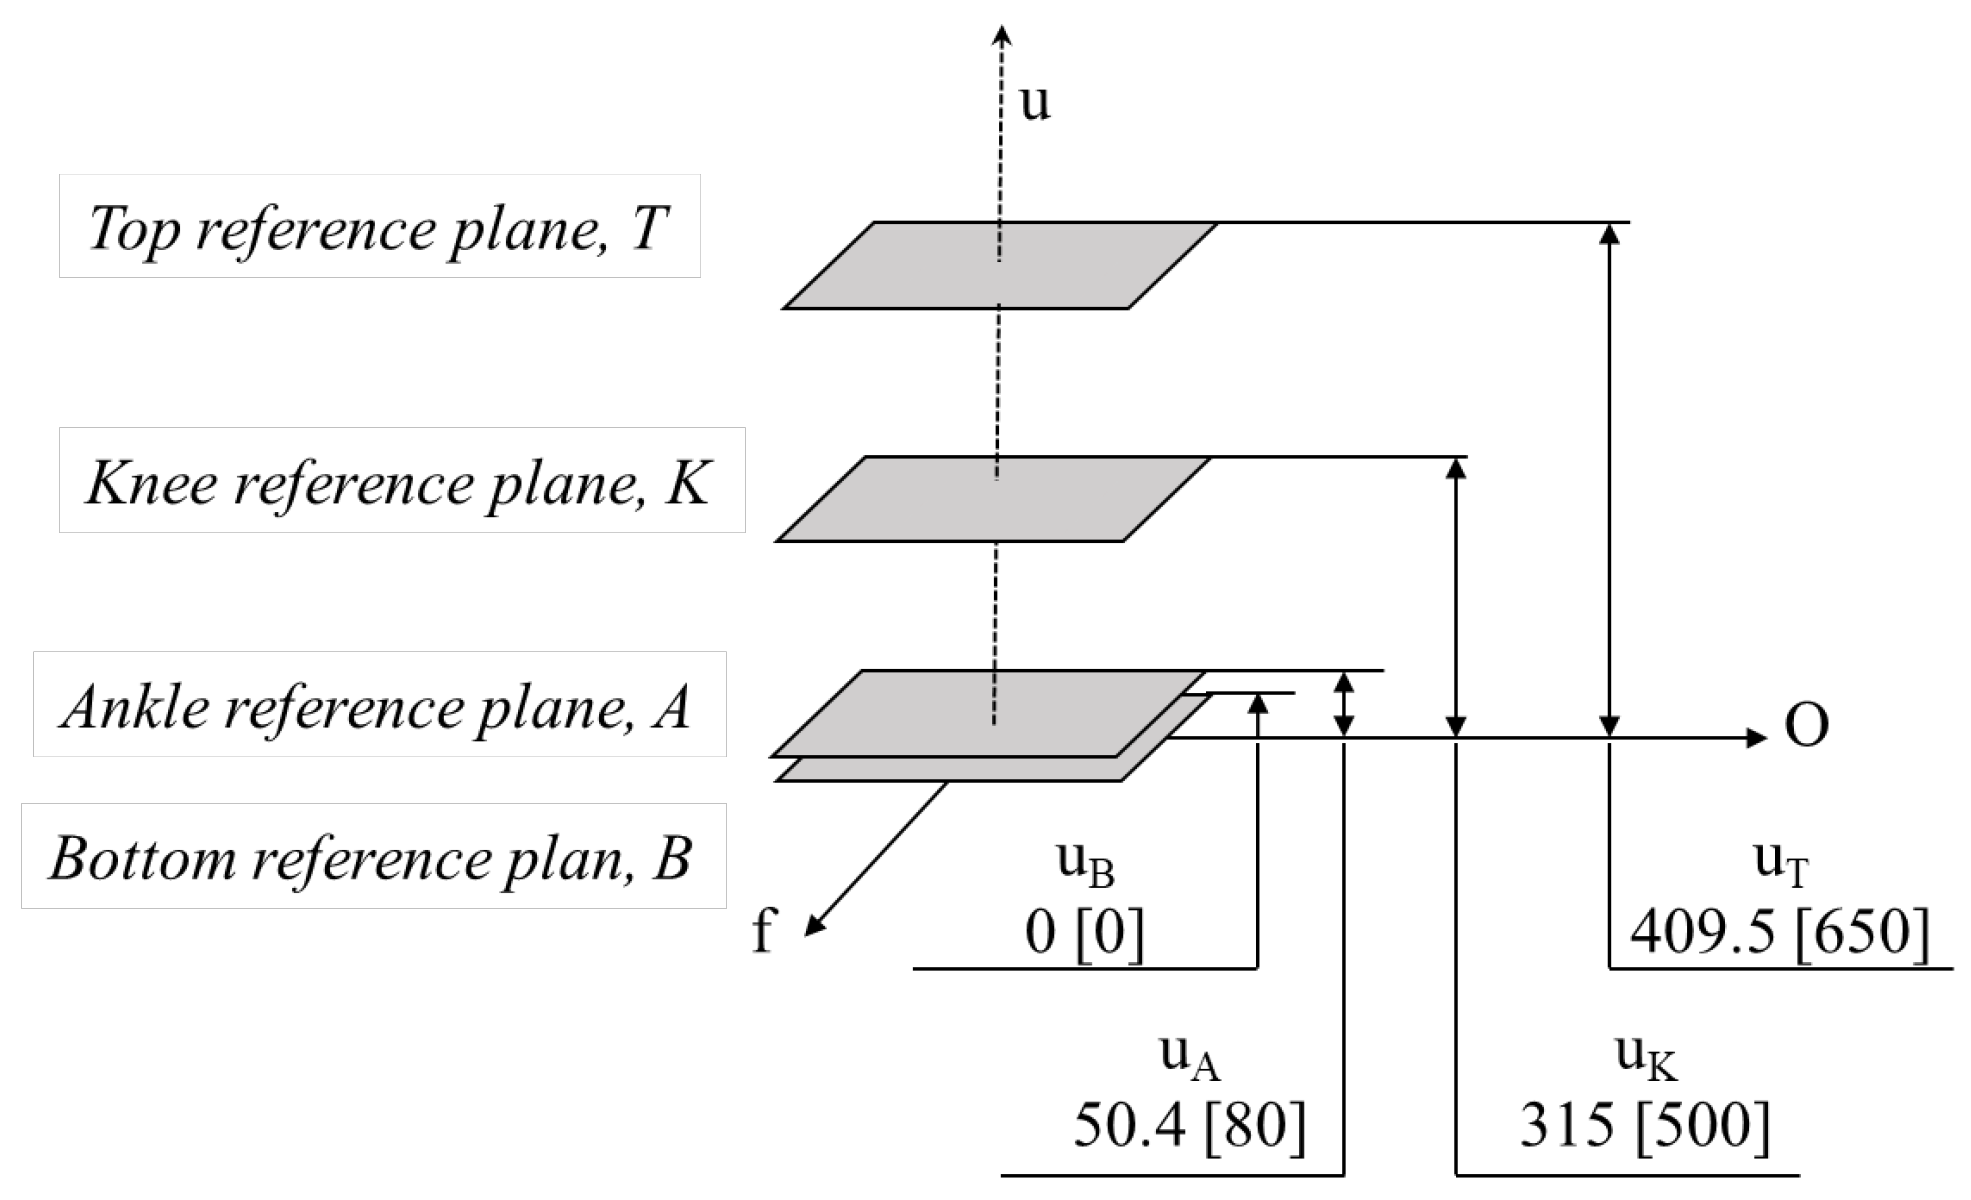
Figure 3.
Geometrical reconstruction of lower limb.
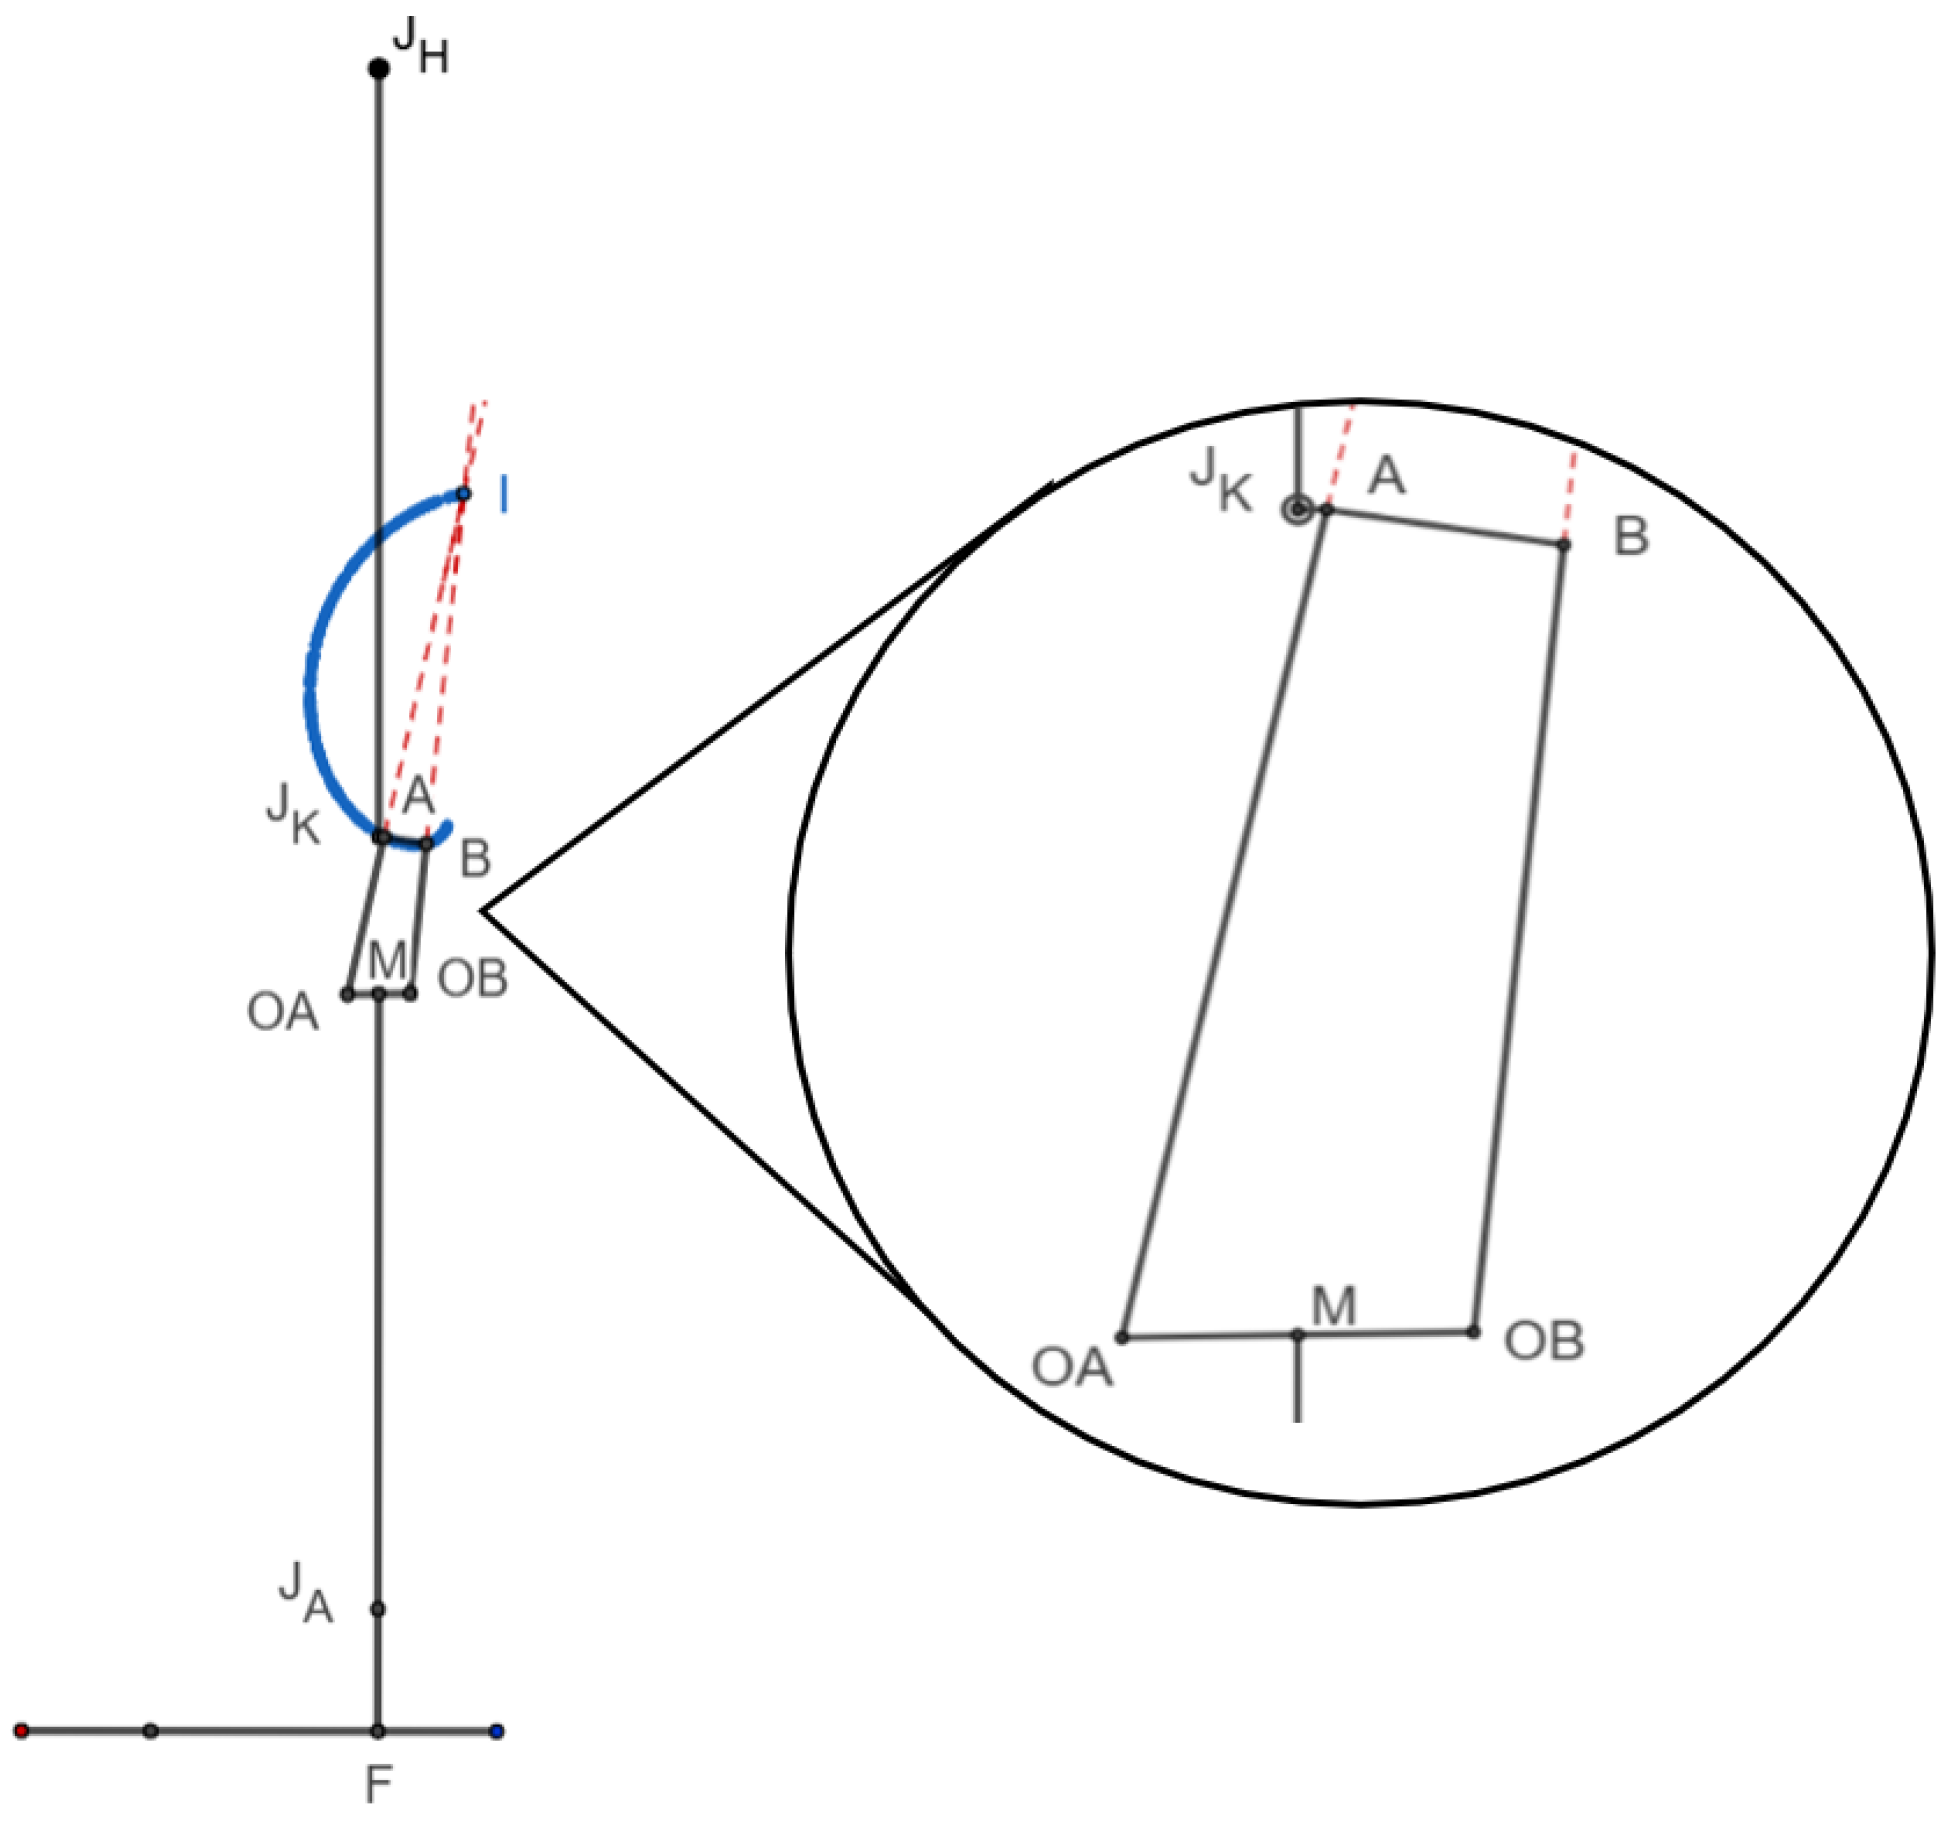
Figure 4.
Heel contact x and y values for (a) scaled knee (b) commercial knee & push-off x and y values for (c) scaled knee (d) commercial knee (in mm).
Figure 4.
Heel contact x and y values for (a) scaled knee (b) commercial knee & push-off x and y values for (c) scaled knee (d) commercial knee (in mm).
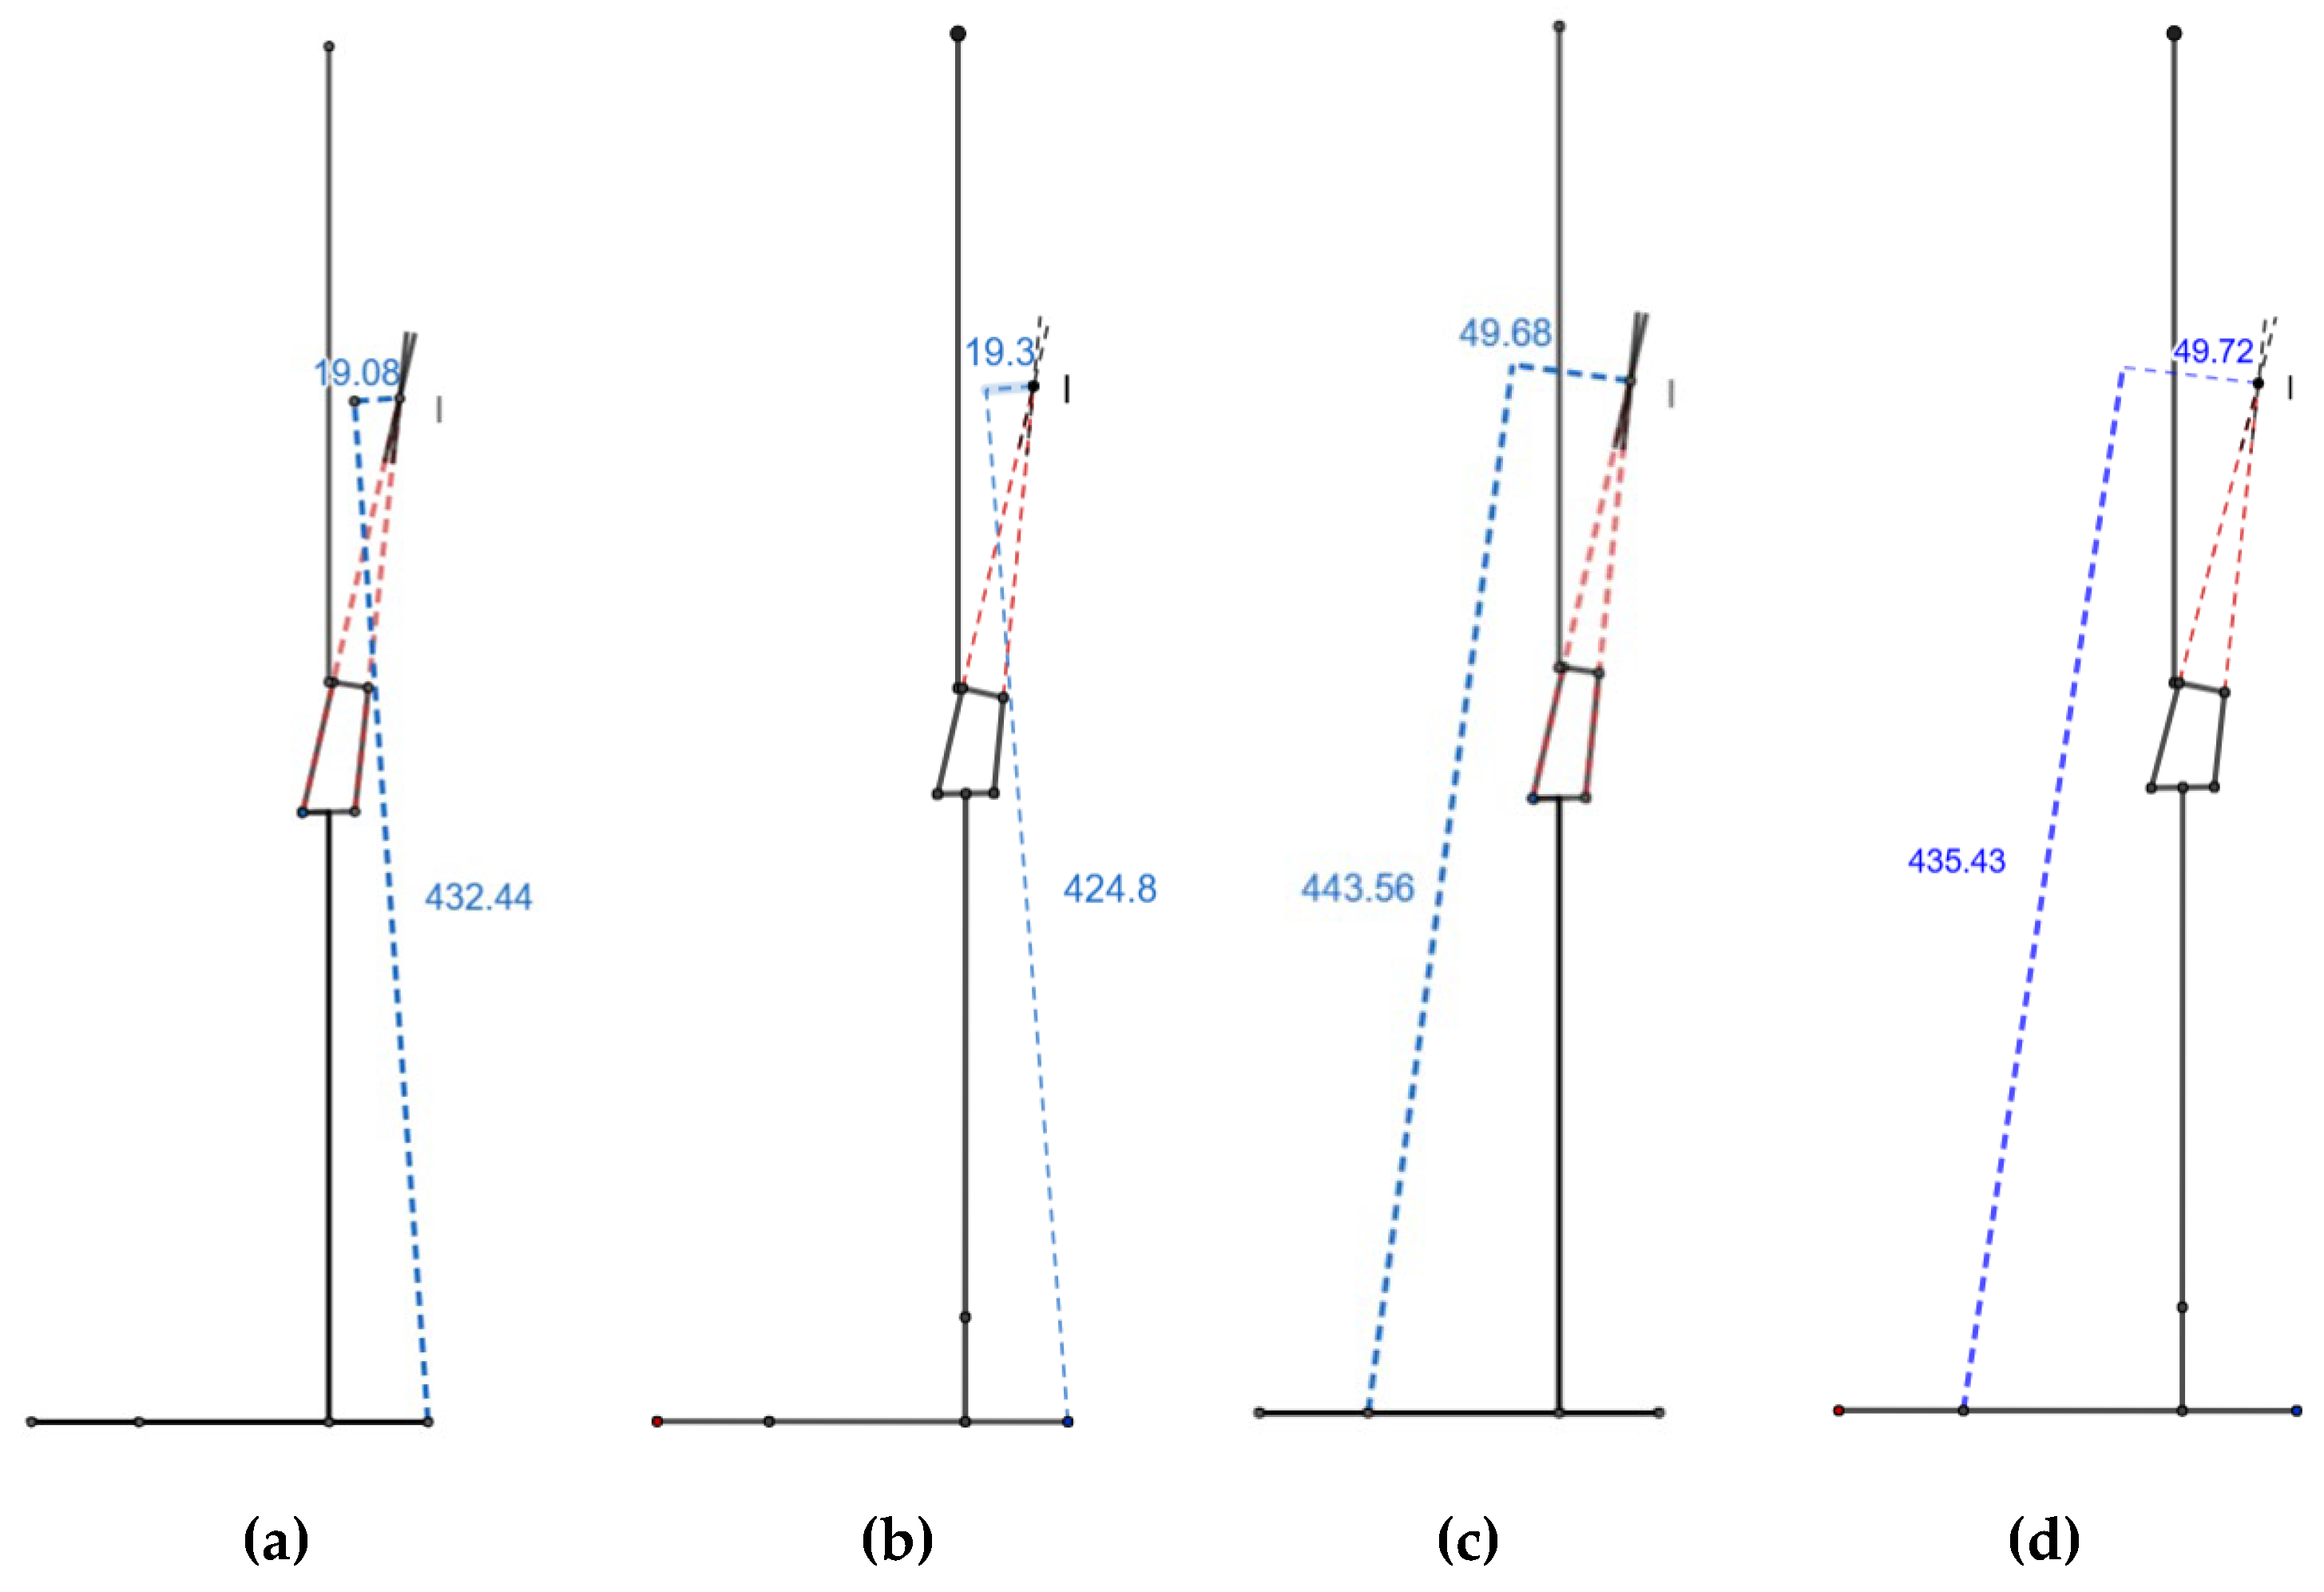
Figure 5.
Stable knee flexion angle during heel contact for (a) scaled knee (b) commercial knee.
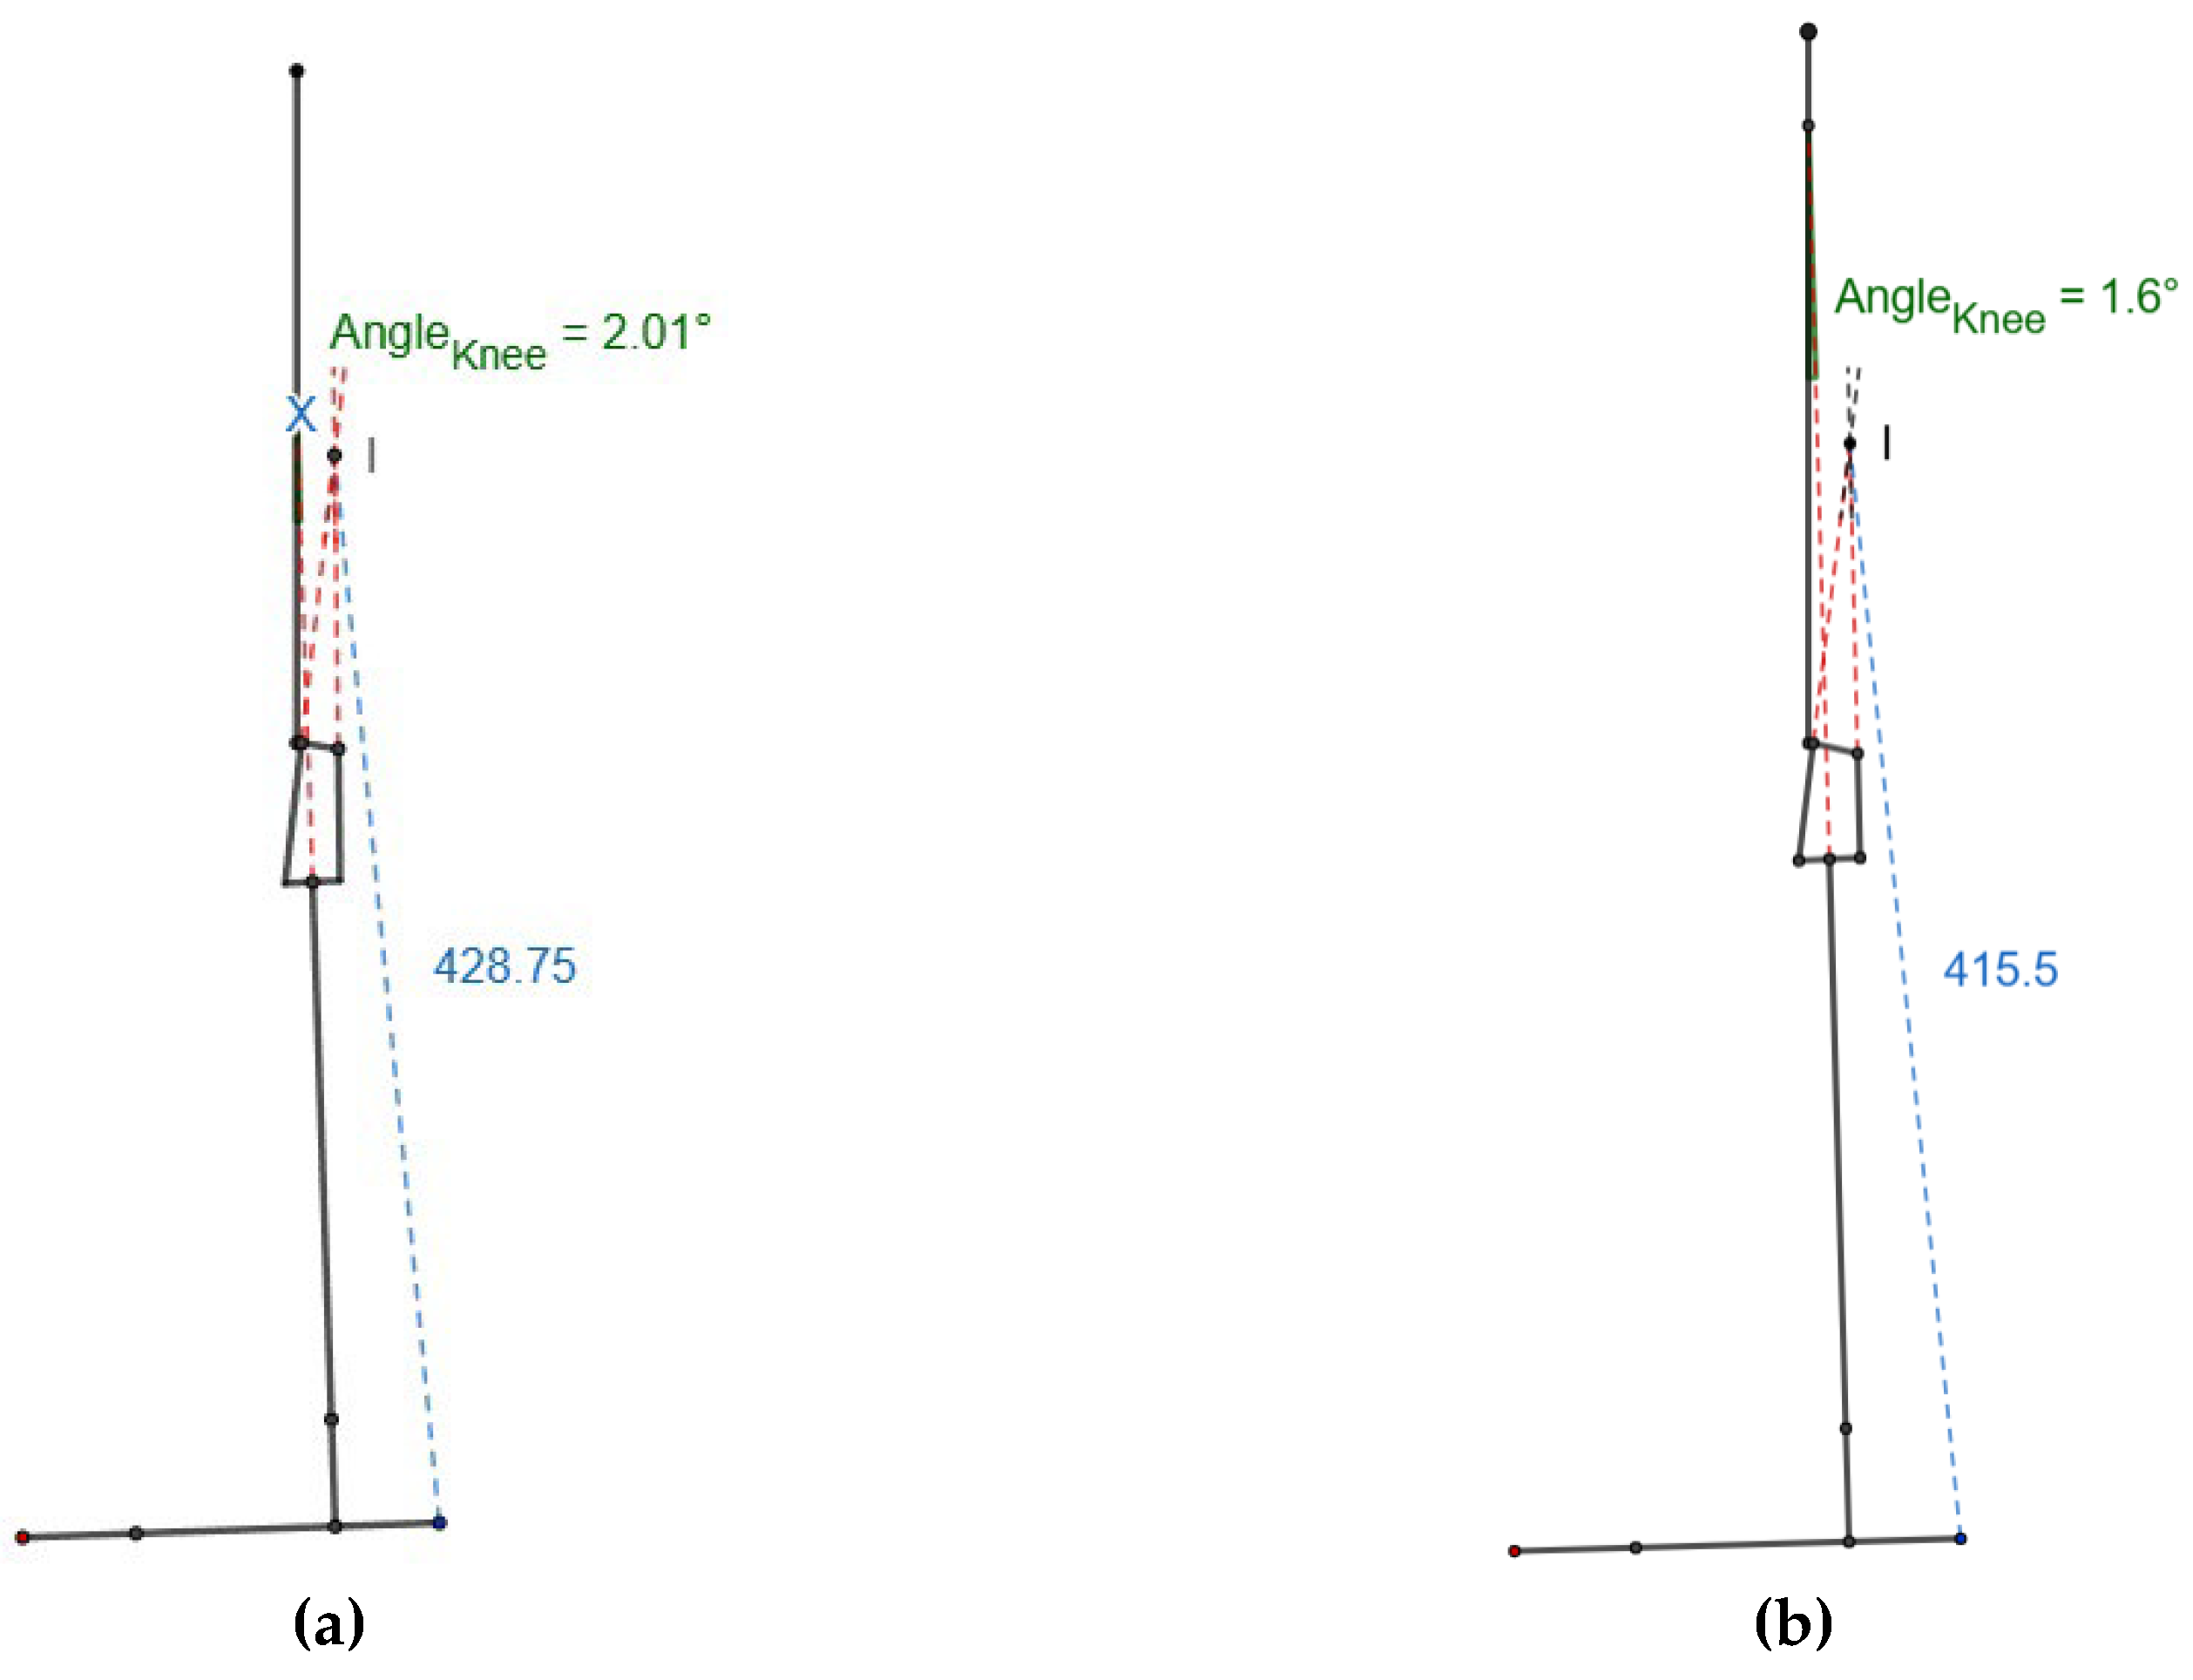
Figure 6.
Values of x and y at 15º knee flexion for (a) scaled knee and (b) commercial knee.
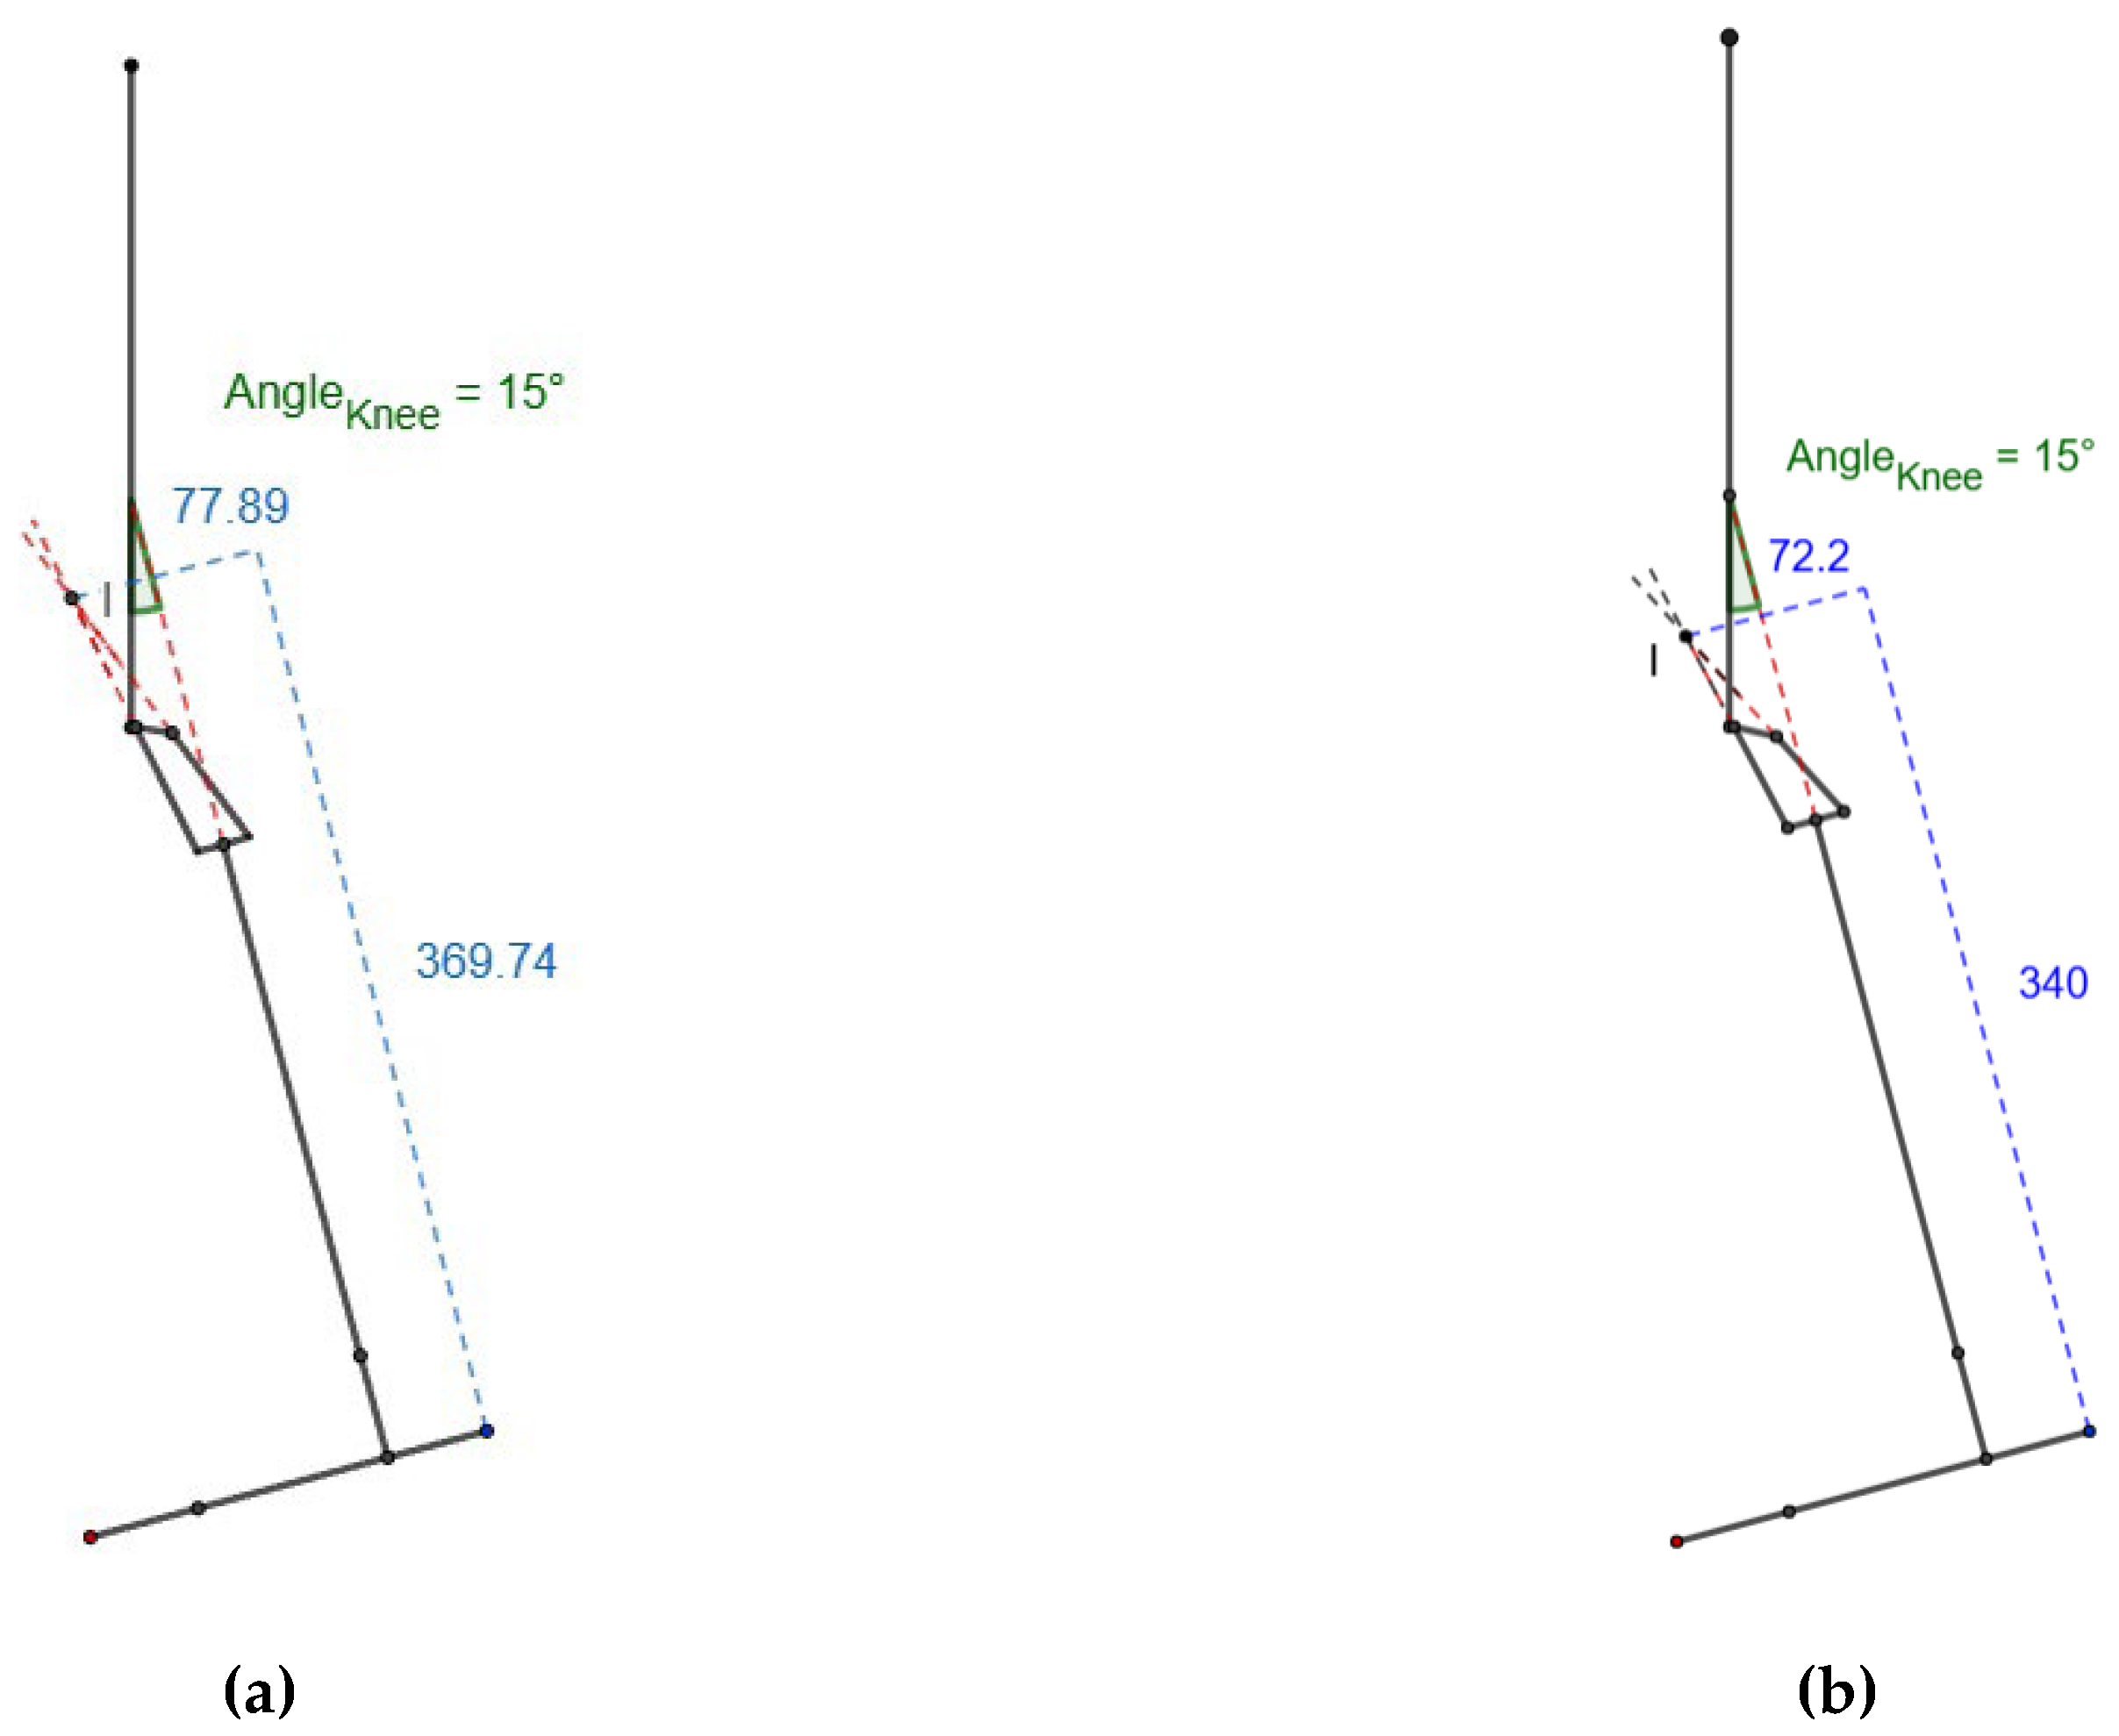
Figure 7.
Values of α and β (in mm) for (a) scaled knee (b) commercial knee.
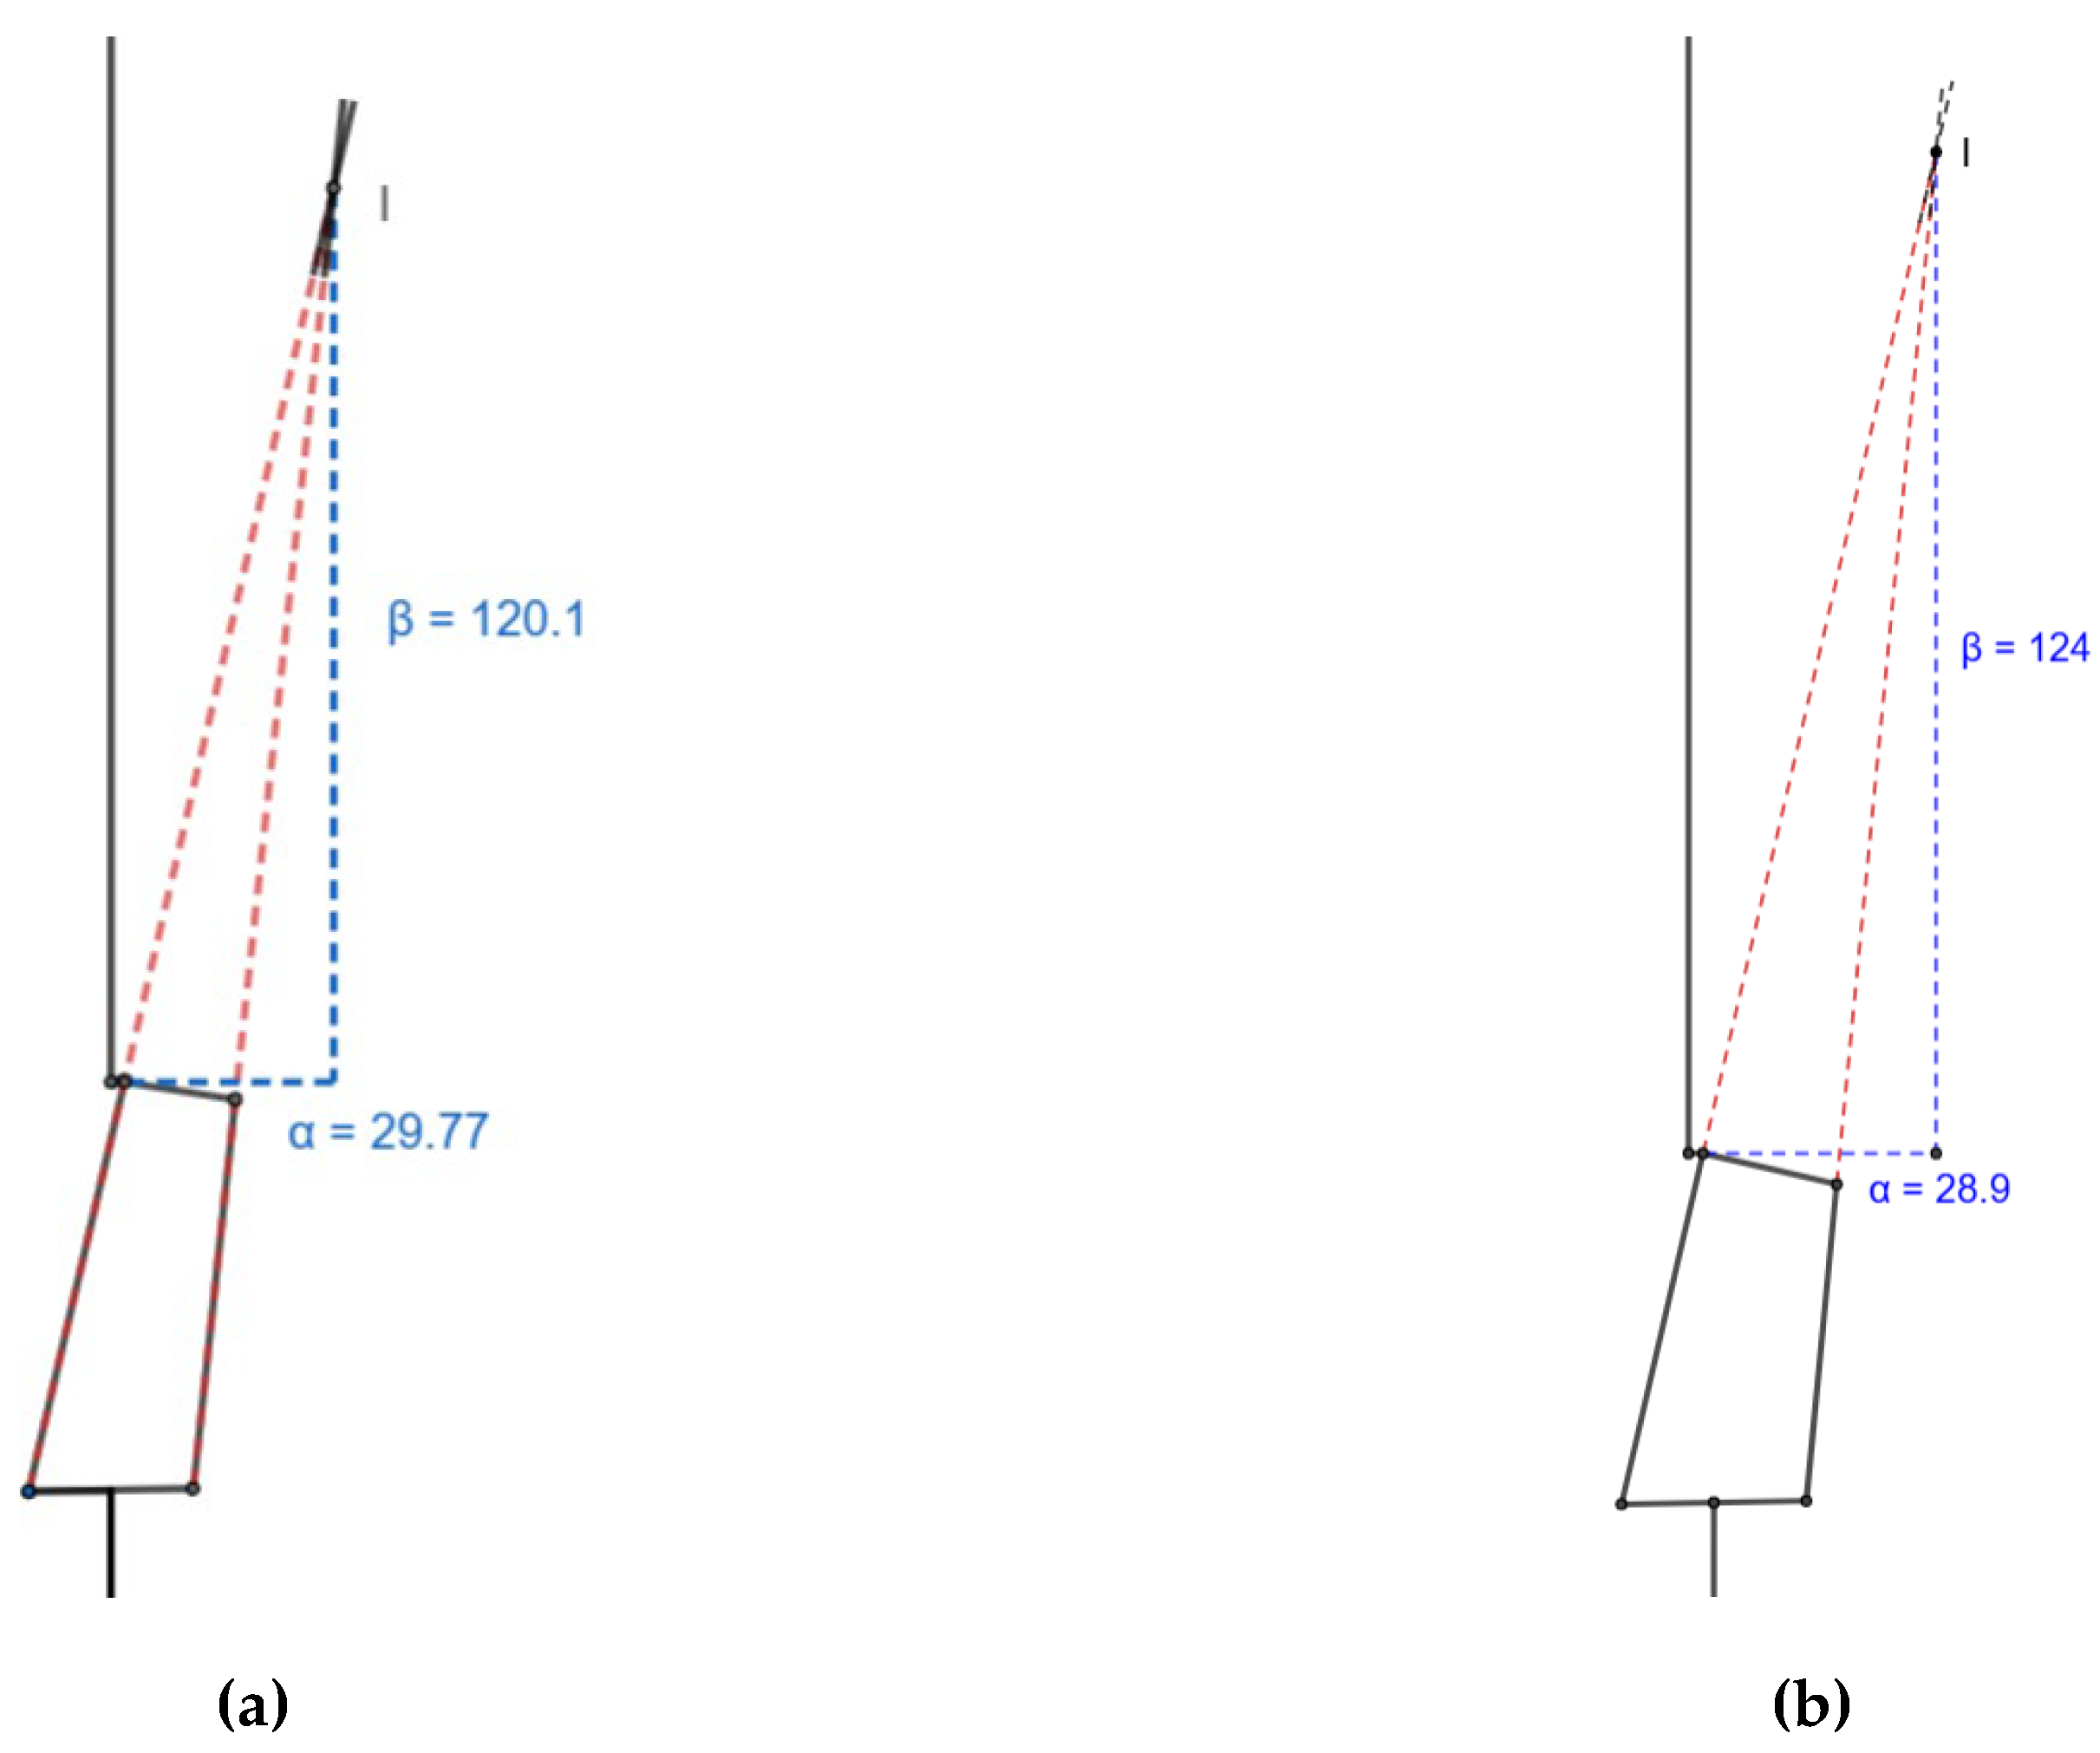
Figure 8.
Length of the lower limb (mm) fully extended (a) scaled knee (b) commercial knee and flexed at 65° during mid-swing for (c) scaled knee and (b) commercial knee.
Figure 8.
Length of the lower limb (mm) fully extended (a) scaled knee (b) commercial knee and flexed at 65° during mid-swing for (c) scaled knee and (b) commercial knee.
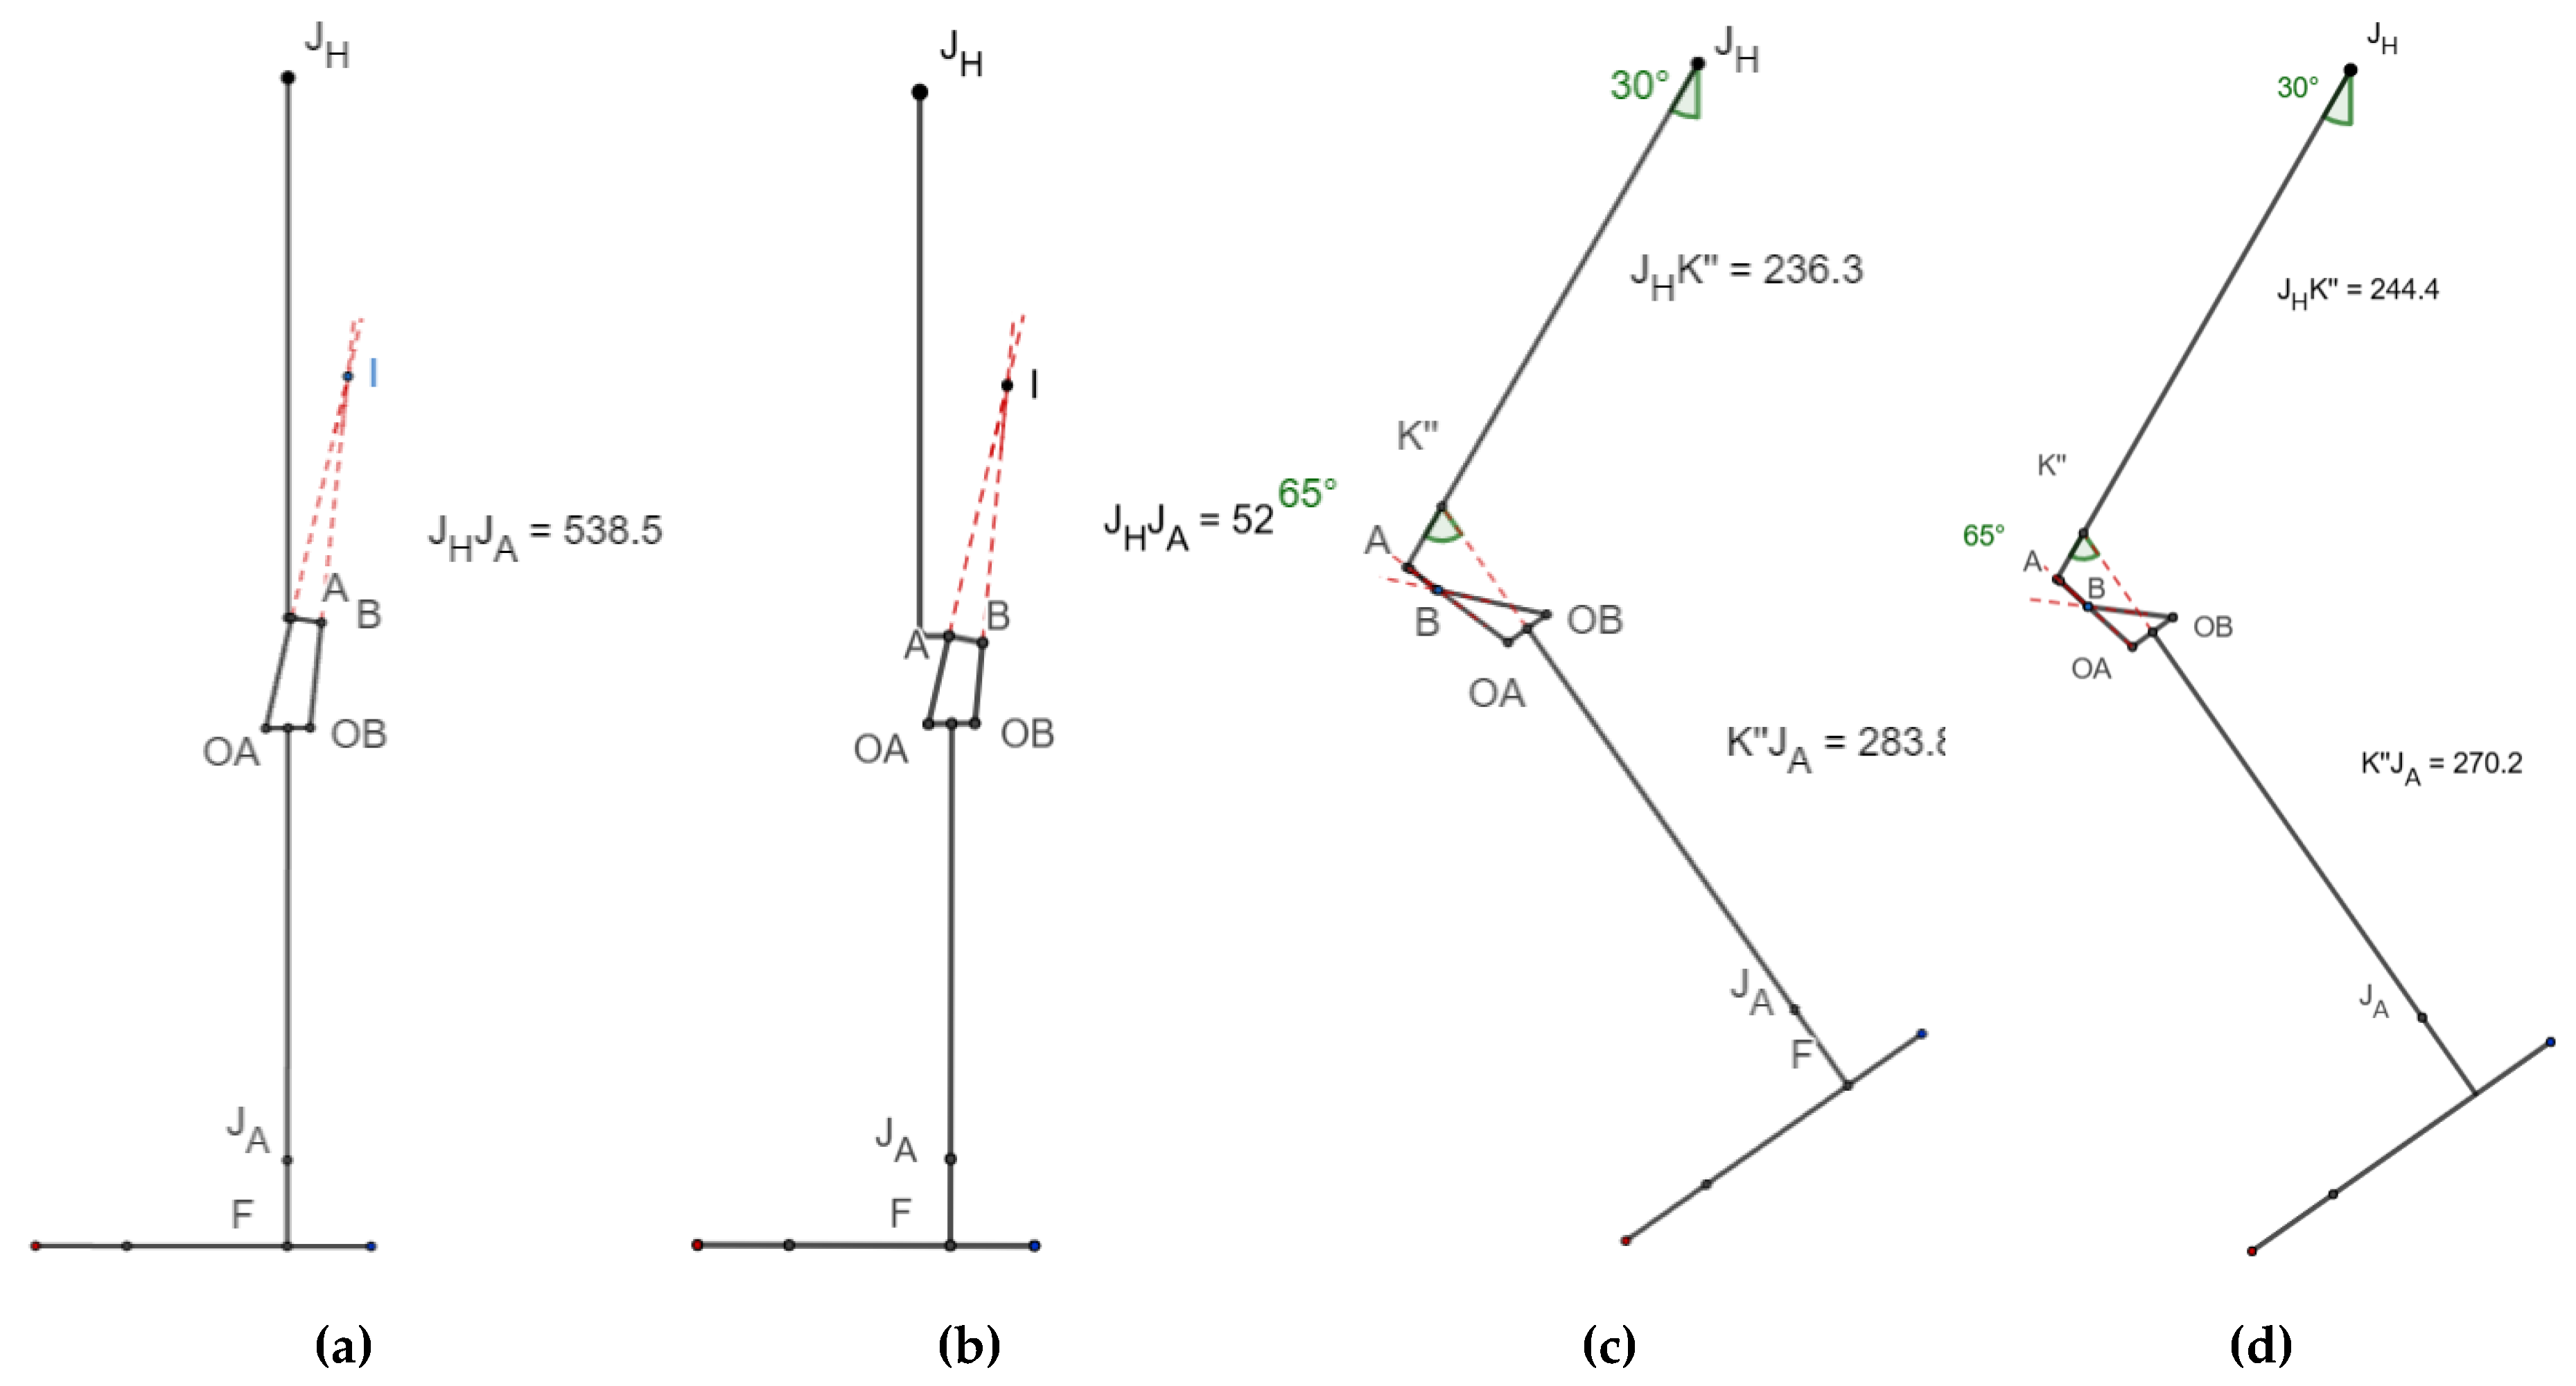
Figure 9.
Toe clearance at 23° hip flexion, 49° knee flexion for (a) scaled knee (b) commercial knee.
Figure 9.
Toe clearance at 23° hip flexion, 49° knee flexion for (a) scaled knee (b) commercial knee.
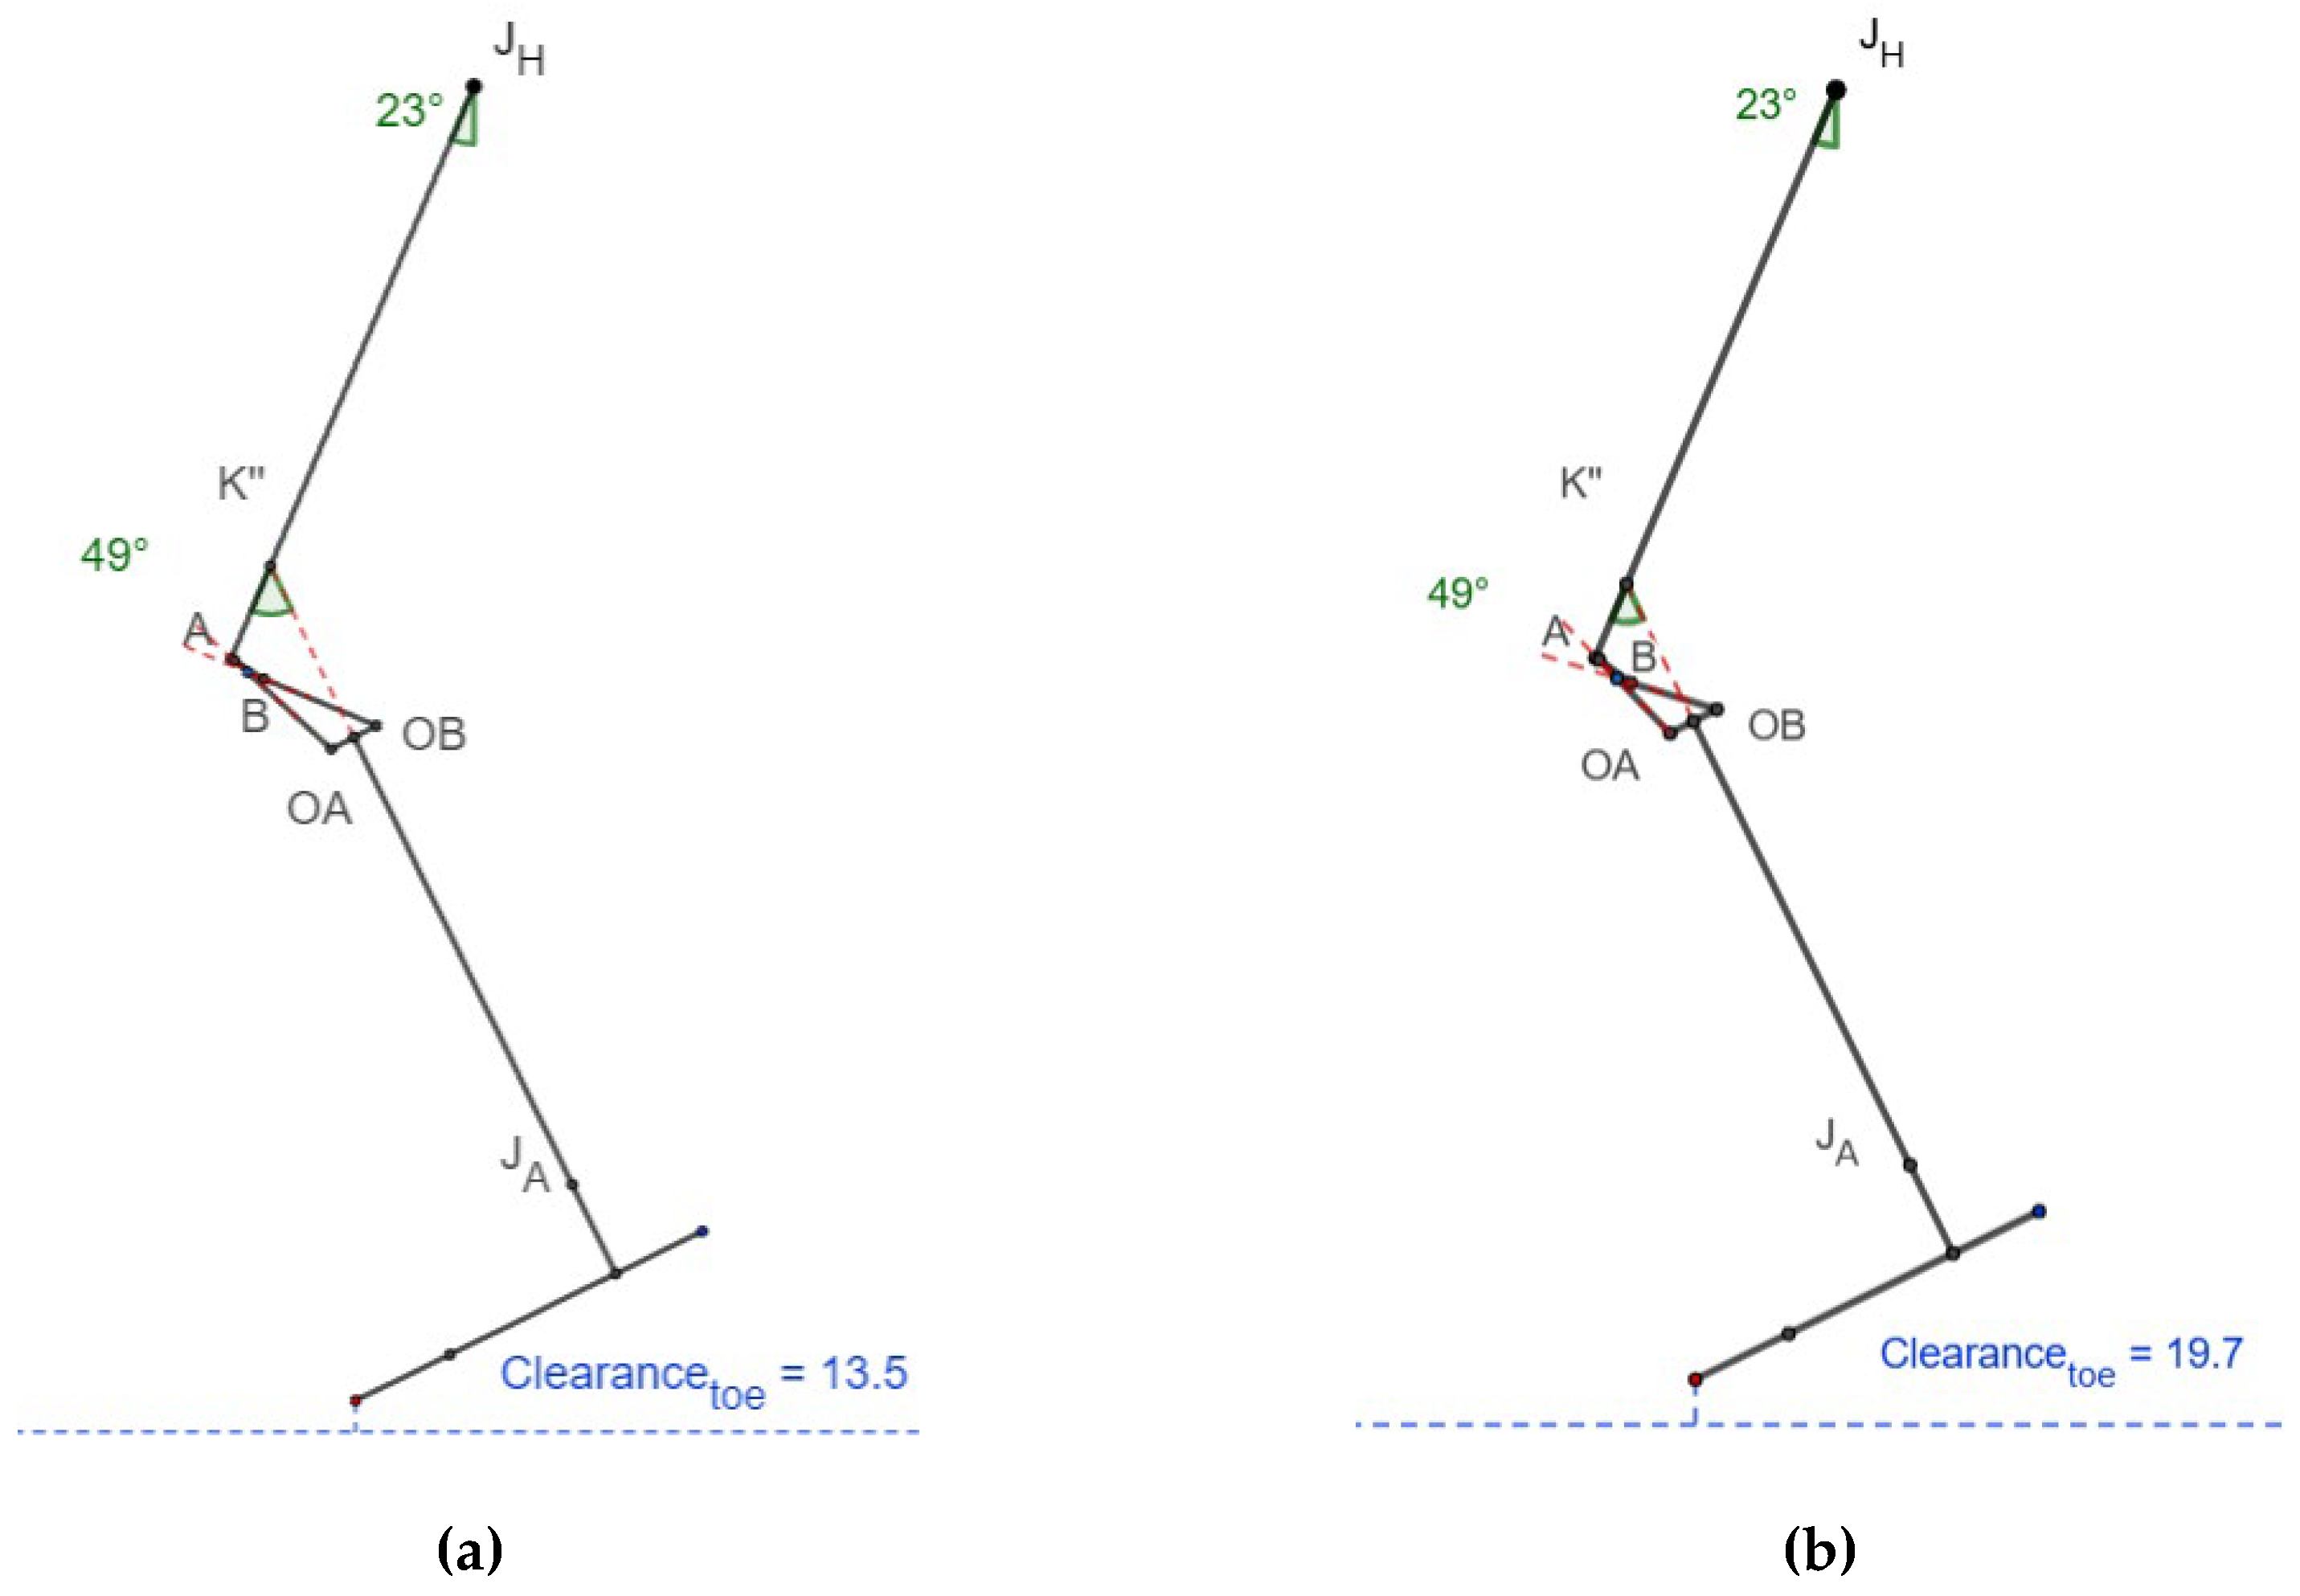
Figure 10.
Toe & Heel clearance from mid to terminal swing for (a) scaled knee (b) commercial knee.
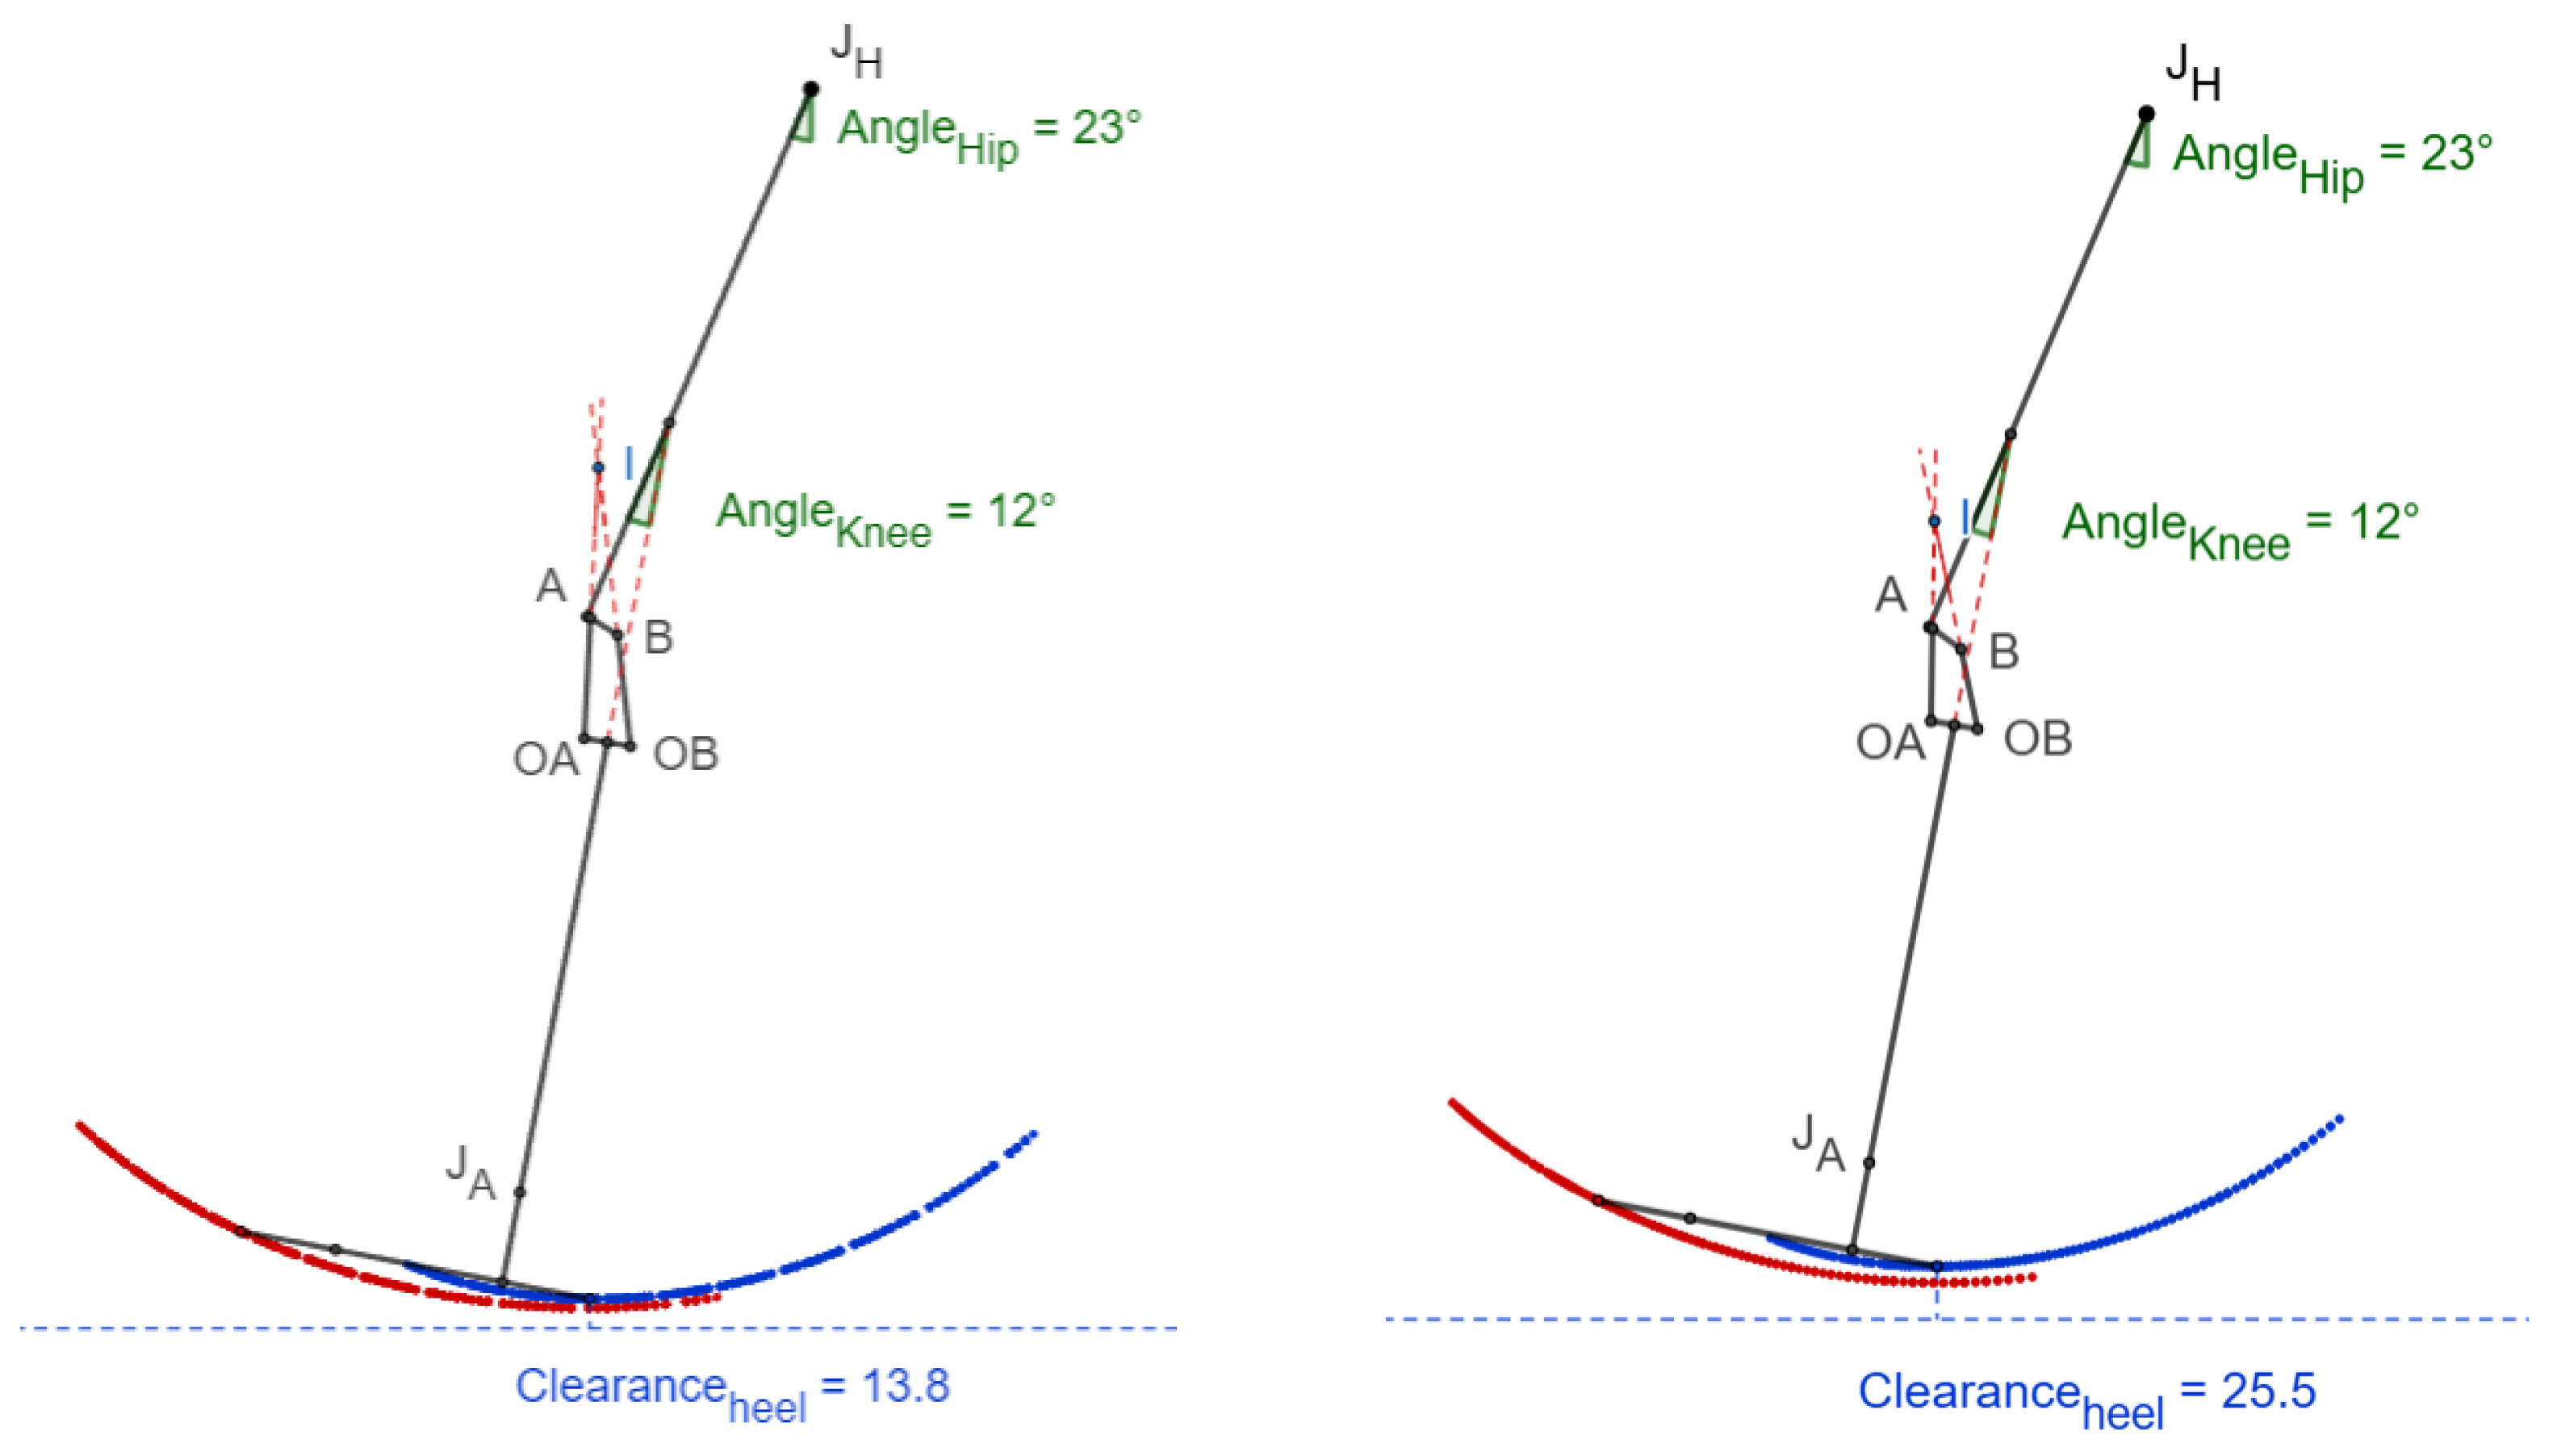
Figure 11.
Performance comparison of the scaled knee with the commercial knee (all values normalized so that best has been converted to 1).
Figure 11.
Performance comparison of the scaled knee with the commercial knee (all values normalized so that best has been converted to 1).
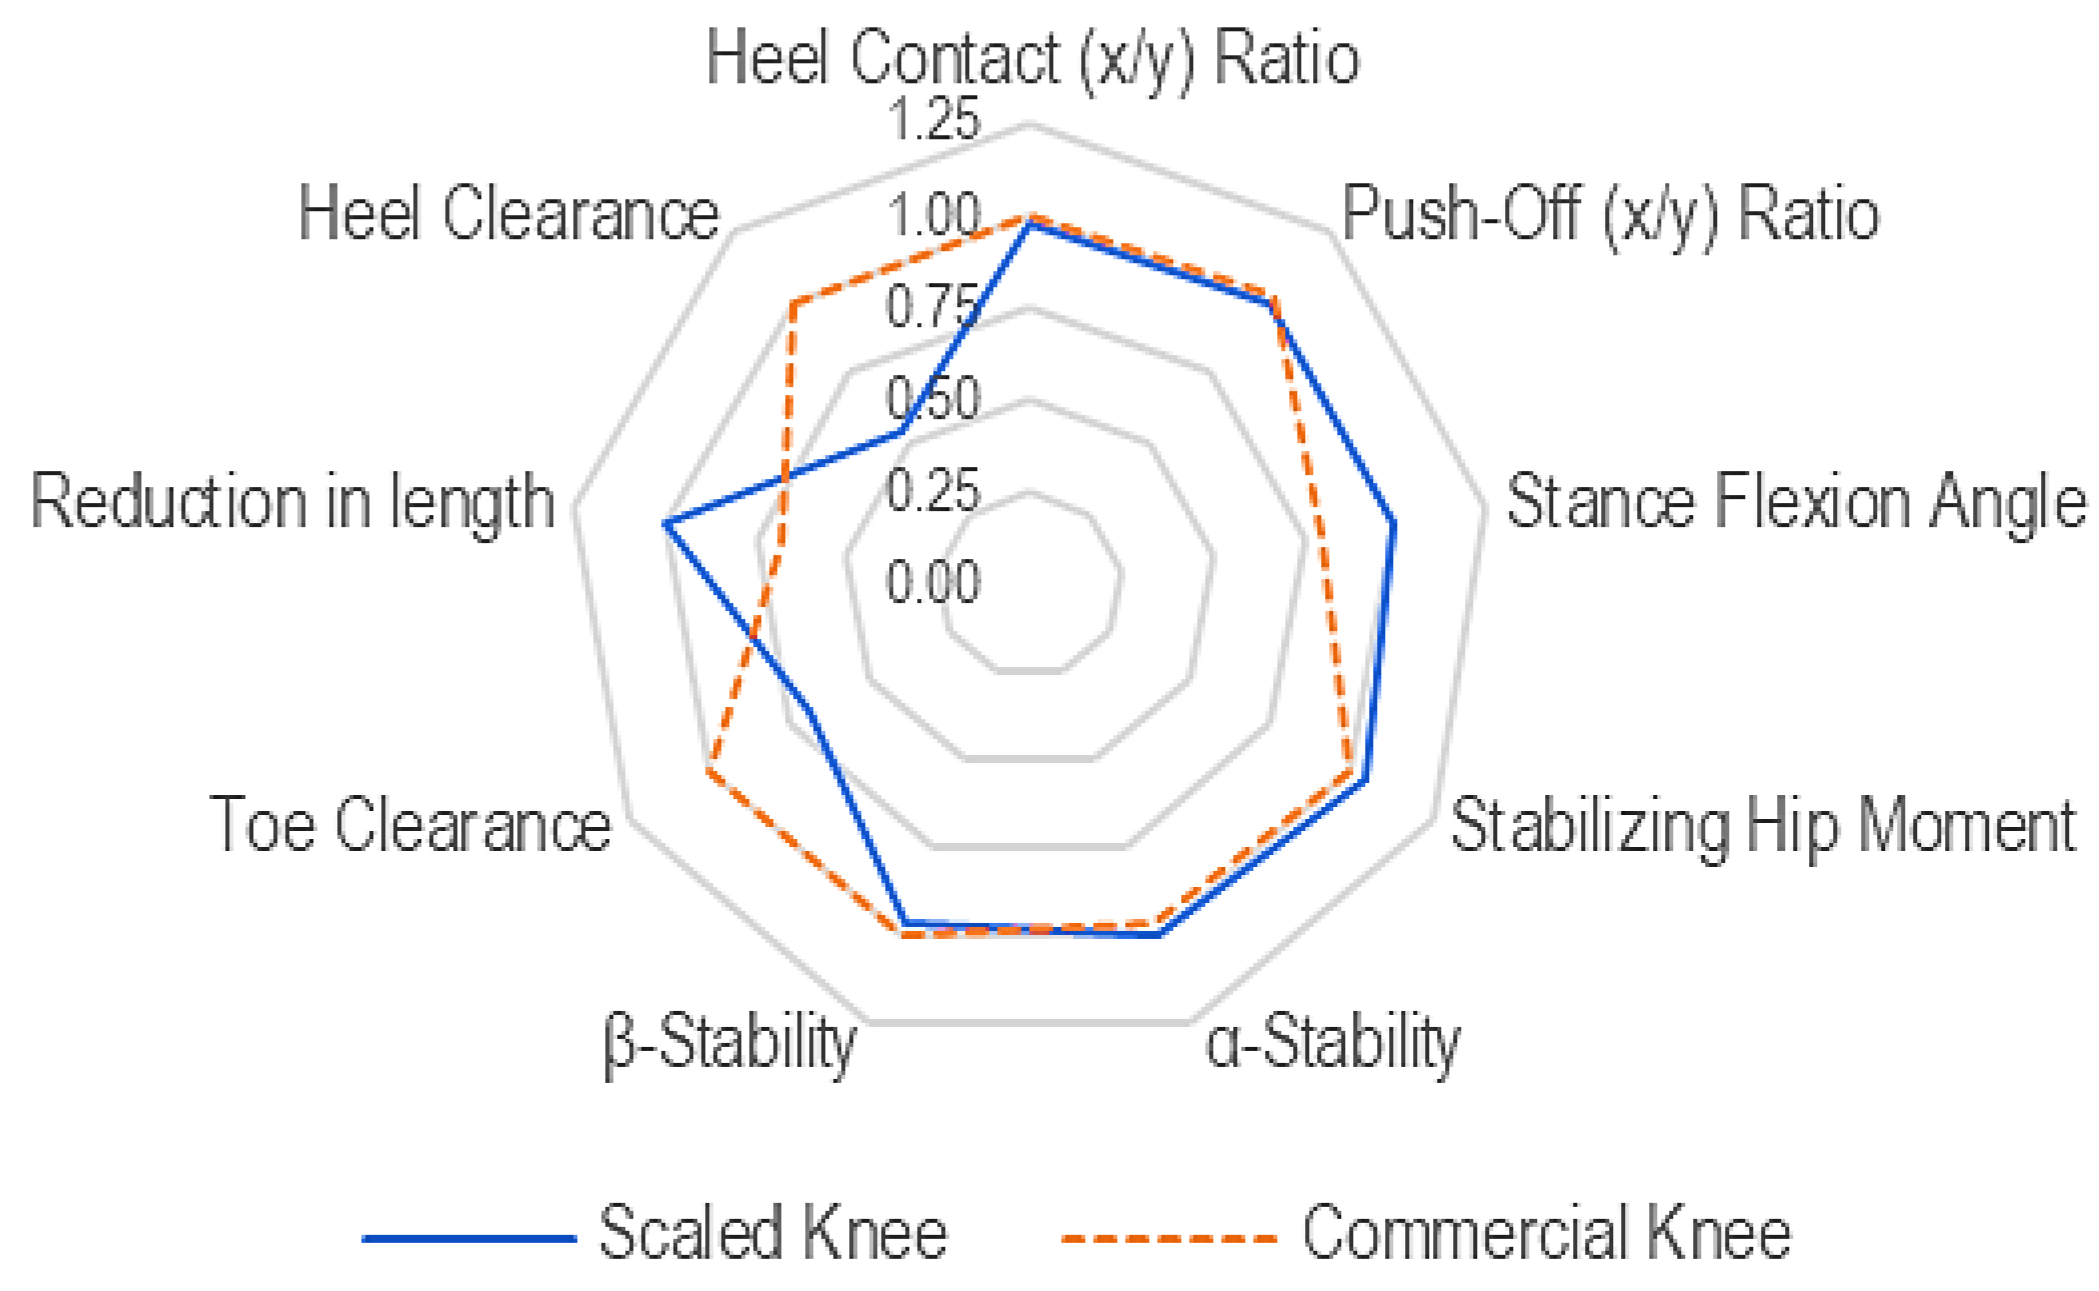

Table 1.
Knee performance parameters, their interpretation & requirements.
| SN | Performance Parameters | Interpretation | Ref | Requirement |
|---|---|---|---|---|
| Stance Phase | ||||
| 1 | Heel contact (x/y) ratio [ |
A negative value of x/y ratio means stable heel contact (distance posterior to load line as negative) |
[7,10] | Negative, < 0 |
| 2 | Push off (x/y) ratio |
A near-to-zero value of x/y means a smaller stabilizing moment i.e. easy-to-flex knee (distance posterior to load line as negative) |
[7,10] | Near to zero |
| 3 | Stance flexion angle [θsf] |
A larger stable knee flexion range means the knee will be stable even with the knee slightly flexed (until the value of heel contact x/y ratio is negative) | [7] | ≥ 0° |
| 4 | Stabilizing hip moment [SDstabilizing] |
The smaller standard deviation of the positive heel strike x/y ratio would mean a smaller and consistent stabilizing hip moment requirement for up to 15° of knee flexion | [7] | Standard deviation (SD) Small, consistent |
| 5 | α-stability [α] | Distance of ICR from TA line should be positive (posterior to TA line) | [8] | > 0 |
| 6 | β-stability [β] | Distance of ICR from anatomical knee center should be positive (ICR superior to anatomical knee center) | [8] | > 0 |
| Swing Phase | ||||
| 7 | Toe Clearance [Ct] | Toe clearance for normal walking at 23° hip flexion and 49° knee flexion | [7],[11] | > 0 |
| 8 | Toe Clearance [L] | Limb length (Ll) = Distance of Trochanter to Ankle C1 = Ll @ full extension C2 = Ll @ 65° knee flexion during mid-swing |
[8] | > 0 |
| 9 | Heel clearance [Ch] | During terminal swing, heel clearance is more significant than toe clearance | [9] | > 0 |
Table 2.
Knee height estimation & proportionality coefficient based on various methods.
| Age [years] |
Knee height, uK [mm] | Proportionality coefficient, k | ||
| Using [3] | Using [5] & [12] | Using [3] | Using [5] & [12] | |
| 3 | 242.01 | 272.26 | 0.48 | 0.54 |
| 4 | 268.58 | 293.58 | 0.54 | 0.59 |
| 5 | 292.91 | 312.56 | 0.59 | 0.63 |
Table 3.
Structural test forces (Principal tests).
| Test procedure and test load (in N) | Load (P3) | Load (P3*) | ||||
|---|---|---|---|---|---|---|
| I | II | I | II | |||
| Static and cyclic test procedures | Stabilizing test force | Fstab | 50 | 50 | ||
| Settling test force | Fset | 736 | 638 | 464 | 402 | |
| Static test procedure | Proof test force | Fsp | 1610 | 1395 | 1014 | 879 |
| Ultimate static test force | Fsu,lower level | 2415 | 2092 | 1521 | 1318 | |
| Fsu, upper level | 3220 | 2790 | 2029 | 1758 | ||
| Cyclic test procedure | Minimum test force | Fcmin | 50 | 50 | ||
| Cyclic range | Fcr | 920 | 797 | 580 | 502 | |
| Maximum test force | Fcmax = Fcmin+Fcr | 970 | 847 | 630 | 552 | |
| Mean test force | Fcmean=0.5(Fcmin+Fcmax) | 510 | 449 | 340 | 301 | |
| Cyclic amplitude | Fca=0.5Fcr | 460 | 399 | 290 | 251 | |
| Final static force | Ffin = Fsp | 1610 | 1395 | 1014 | 879 | |
| Prescribed number of cycles | 3x10⁶ | 1.8x10⁶ | ||||
Table 4.
Shortening of length.
| Knee | C1 [mm] | C2 [mm] | L = C1 - C2 [mm] |
|---|---|---|---|
| Scaled knee | 538.3 | 236.3 + 283.8 = 520.1 | 18.2 |
| Commercial knee | 527.1 | 244.4 + 270.2 = 514.6 | 12.5 |
Table 4.
Performance evaluation of scaled knee vs commercial knee.
| SN | Symbol | Suggested Values | Scaled knee Values | Comparison | Commercial Knee Values | Remarks |
|---|---|---|---|---|---|---|
| Stance Phase | ||||||
| 1 | Negative, < 0 | -0.044 | -0.045 | Negative value, stable | ||
| 2 | Near to zero | -0.112 | -0.114 | Negative and nearing zero, stable | ||
| 3 | θsf | ≥ 0° | ≈2.01° | > | ≈1.6° | Positive value, greater than zero |
| 4 | SDstabilizing | Small | SD = 0.068 | < | SD = 0.065 | Small value, small hip moment required |
| 5 | α | > 0 | 29.77 mm | > | 28.9 mm | Positive value, posterior to load line, stable |
| 6 | β | > 0 | 120.1 mm | < | 124 mm | Superior to the knee center, a lower amount of hip moment required |
| Swing Phase | ||||||
| 7 | Ct | > 0 | 13.5 mm | < | 19.7 mm | Sufficient toe clearance |
| 8 | Lt | > 0 | 18.2 mm | > | 12.4 mm | |
| 9 | Ch | > 0 | 13.8 mm | < | 25.5 mm | Sufficient heel clearance |
Disclaimer/Publisher’s Note: The statements, opinions and data contained in all publications are solely those of the individual author(s) and contributor(s) and not of MDPI and/or the editor(s). MDPI and/or the editor(s) disclaim responsibility for any injury to people or property resulting from any ideas, methods, instructions or products referred to in the content. |
© 2025 by the authors. Licensee MDPI, Basel, Switzerland. This article is an open access article distributed under the terms and conditions of the Creative Commons Attribution (CC BY) license (http://creativecommons.org/licenses/by/4.0/).
Copyright: This open access article is published under a Creative Commons CC BY 4.0 license, which permit the free download, distribution, and reuse, provided that the author and preprint are cited in any reuse.


