
Submitted:
30 May 2025
Posted:
30 May 2025
You are already at the latest version
Abstract
Background/Objectives: This study aims to investigate progression of retinal microvascular changes using OCTA in young T1DM patients without clinical signs of DR, over a period of 3 years. Methods: This prospective, longitudinal study analyzed OCT angiograms of T1DM patients without clinical signs of DR. It included 40 T1DM patients aged between 7 and 20 years old who formed the T1DM study group and 40 healthy subjects, with similar demographic characteristics for the control group. The patients underwent comprehensive ophthalmic examination and OCT imaging using a Retina Wide protocol (6x6 mm). We analyzed the following microvascular retinal parameters: FAZ area, perimeter and circularity and superficial capillary plexus (SCP) and deep capillary plexus (DCP) vessel density. Results: Statistically significant differences between the two groups were identified for the following parameters: the mean FAZ area at follow-up (0.38±0.13) was larger than the mean FAZ area at baseline (0.31 ±0.11), the mean FAZ perimeter at follow-up (3.22±0.75) was larger than the mean FAZ perimeter at baseline (2.61±00.52) and the men FAZ circularity index at follow-up (0.47±0.13) was decreased compared to the FAZ circularity index at baseline (0.56±0.12). Statistically significant differences were also registered for the following parameters: the total SCP and DCP vessel density was decreased at follow-up (37.47±1.57), compared to baseline (38.79±1.00). Conclusions: OCTA long-term monitoring of T1DM patients represents an effective method for tracking the progressive changes of FAZ parameters capillary plexus vascular density.
Keywords:
OCT angiography
; retina
; Type 1 Diabetes Mellitus
1. Introduction
Type 1 diabetes mellitus (T1DM) is a chronic autoimmune condition characterized by the immune-mediated destruction of insulin-producing pancreatic β-cells, leading to absolute insulin deficiency [1]. The global incidence and prevalence of T1DM continues to rise yearly [2], particularly among children and adolescents [3]. Recent estimates are indicating that over 9 million individuals are affected worldwide, with an incidence of 15 per 100,000 people and a prevalence of 9.5% [4]. Chronic hyperglycemia in T1DM contributes to the development of long-term microvascular complications [5], including diabetic retinopathy (DR), which remains a leading cause of vision impairment in working-age populations [6].
Currently, approximately 285 million individuals globally are diagnosed with DR, highlighting the urgent need for effective screening and management strategies [7]. Although DR is clinically diagnosed based on fundoscopic findings—such as microaneurysms, hemorrhages, exudates and neovascularization, the retinal neurovascular dysfunction begins long before the visible signs appear on fundus examination [8]. These subtle alterations include capillary nonperfusion, early disruption of the blood-retinal barrier and neurodegeneration [9], suggesting a preclinical phase of DR that currently remains undetectable through conventional screening methods.
For decades, imaging devices have represented an indispensable tool in ophthalmology diagnosis, providing high-resolution imaging critical for early diagnosis, disease monitoring and treatment guidance [10]. Optical coherence tomography angiography (OCTA) represents one of the most recent imaging techniques, which enables an in-depth visualization of the retinal and choroidal microvasculature without the need for contrast dye injection [11]. Unlike traditional techniques such as fluorescein angiography, OCTA does not require contrast agents enabling detailed assessment of both the superficial and deep capillary plexuses [12]. This facilitates early detection of microvascular alterations associated with DR progression. Moreover, while conventional DR screening methods rely on manual interpretation, which is time-consuming and subjective, AI-assisted OCTA could enable rapid and objective image analysis, enhancing screening efficiency and reducing diagnostic delays [13].
OCTA retinal scans are based on capturing blood flow using repeated B-scans, offering three-dimensional information on microvascular morphology and perfusion of retinal layers [14]. OCTA assessment of key vascular parameters, such as foveal avascular zone (FAZ) and vascular density of the capillary networks have been shown to be altered in diabetic patients, even in the absence of clinically apparent DR [15]. The progression rate of DR varies significantly among patients, highlighting the importance of identifying specific biomarkers associated with the risk of progression of the disease. As retinal changes can also regress, it becomes essential to identify these biomarkers and the risk profiles of the patients in order to prevent or delay the clinical diagnosis of DR [16].
This study aims to investigate progression of retinal microvascular changes using OCTA in young T1DM patients without clinical signs of DR, over a period of 3 years. By identifying early biomarkers of retinal dysfunction, we aim to contribute to a better understanding of the microvascular changes which precede the clinical diagnosis of DR.
2. Materials and Methods
2.1. Patients
This prospective, longitudinal study analyzed OCT angiograms of T1DM patients without clinical signs of DR, over a period of 3 years. The study population was selected from patients attending the ATB Ophthalmology Clinic, Craiova, Romania. It included 40 T1DM patients aged between 7 and 20 years old, who formed the T1DM study group and 40 healthy subjects, with similar demographic characteristics for the control group. The study protocol was approved by the Ethics Committee of the University of Medicine and Pharmacy Craiova (Project Identification Code 8612/07/06/2021) and was carried out in accordance with the rules of the Declaration of Helsinki, revised in 2013. Written informed consent was obtained from all the participating patients who met the inclusion criteria or their legal guardians, if patients were younger than 18 years old.
Our initial clinical study started in 2022, including 61 T1DM patients and 58 individuals for the control group. Baseline examinations were registered for all the study patients and statistically significant differences between the two groups were identified for the FAZ area, perimeter and circularity, as well as the vessel density of the SCP. These published results [17], suggest early microvascular dysfunction in T1DM patients compared to healthy subjects: the FAZ area and perimeter were statistically larger for the T1DM group, while the circularity index and the vascular density of the SCP were lower in the T1DM group compared to the control group. For the current research, we expanded on these findings by longitudinally tracking a subset of 40 patients from the initial T1DM group of 61 patients, as 19 patients were lost for follow-up and 2 patients developed clinical signs of non-proliferative DR.
The study participating patients met the following inclusion criteria for the T1DM group: patients diagnosed with T1DM, with duration of the disease of at least 5 years; no clinical signs of DR and no other ophthalmic or systemic disorders, except for small refractive errors no higher than 2.00 diopters. The exclusion criteria were: patients with insufficient OCTA image quality (quality score < 7), as were those with history of: retinopathy of prematurity, vitreoretinal diseases including DR, optic nerve disorders, as well as history of uveitis, ocular trauma, previous ocular surgery, ocular media opacities including cataracts or any other ocular or systemic conditions which may affect ocular system. The control group consisted of individuals who visited the ophthalmology clinic for routine eye examinations and agreed to participate in the study. They were of the same age group and had no ocular or systemic conditions, except for spherical or cylindrical refractive errors not exceeding 2.00 diopters.
For each participant, demographics and clinical characteristics were collected at the baseline visit, including age, duration of T1DM and glycemic control by HbA1c levels. The HbA1c average values were obtained by calculating the mean value of 4 measurements per year. All participants underwent full ophthalmic examination and OCTA imaging at baseline and at the 3-year follow-up visit.
2.2. Ophthalmic Examination
The ophthalmic examination for the study patients included: best-corrected visual acuity assessment, refractive measurements with Nidek Ark-1 refractor device, intraocular pressure using an I Care tonometer, biomicroscopic examination and dilated fundus examination using tropicamide 1% eye drops.
The OCTA retinal scans were obtained with the RevoNX 130 OCTA device (Optopol) using a Retina Wide 6x6 mm protocol. With the help of the OCTA software, we analyzed the following microvascular retinal parameters: FAZ area, perimeter and circularity and superficial capillary plexus (SCP) and deep capillary plexus (DCP) vessel density. The OCTA software segments the structural data to identify the boundaries of the SCP (located between the inner limiting membrane to the inner plexiform layer) and DCP (located between the inner nuclear layer and the outer plexiform layer). The vessel density is calculated as the percentage of vessel area with blood flow over the total area measured.
Poor-quality images with blink or motion artifacts were excluded from the analysis. The OCTA scans were captured at baseline and 3 years later for each patient and the progression tool of the OCTA software was used to evaluate the retinal changes.
2.3. Statistical analysis
The data obtained from the OCTA reports was processed using Microsoft Excel 2021 (San Francisco, CA, USA). Statistical analysis of the results was then conducted to evaluate key parameters using unpaired 2-tailed T-tests to compare the data sets for the T1DM patients, with a significant value of p<0.05. For comparison of TDM baseline, follow-up and Control Group, the ordinary one-way Anova test was conducted, with a significant value of p<0.05. The statistical analysis was conducted using the commercial GraphPad Prism 10 software.
3. Results
The study included 80 participants aged between 7 and 20 years old, with a mean age of 14.9 ± 3.57 years. The sample was divided into 40 patients with T1DM and 40 control subjects. The T1DM patients had a duration of the disease between 5 years and 12 years, with a mead duration of 7.17 ±2.08 years, and average HbA1c values of 8.05±1.42 as detailed in Table 1.
The OCTA parameters analyzed for the study included FAZ area (mm2), perimeter (mm), and circularity index (with the value 1 considered to be a perfect circle), vessel density of the SCP and DCP. We analyzed these OCTA metrics for each patient at baseline and at the 3 years follow-up, as presented in Table 2.
Statistically significant differences between the two groups were identified for the following parameters: the mean FAZ area at follow-up (0.38±0.13) was larger than the mean FAZ area at baseline (0.31 ±0.11), the mean FAZ perimeter at follow-up (3.22±0.75) was larger than the mean FAZ perimeter at baseline (2.61±00.52) and the men FAZ circularity index at follow-up (0.47±0.13) was decreased compared to the FAZ circularity index at baseline (0.56±0.12) (Figure 1, Figure 2, Figure 3 and Figure 4).
Further on, we analyzed the vascular density of the SCP and DCP for the T1DM patients at baseline and follow-up (Figure 5, Table 2). Statistically significant differences were registered for the following parameters: the total SCP vessel density was decreased at follow-up (37.47±1.57), compared to baseline (38.79±1.00). Both superior and inferior parafoveal regions of the SCP had significantly lower vascular density at follow-up compared to baseline (Figure 6, Table 2). Regarding the DCP, the total vessel density was significantly lower at follow-up (41.15±1.60) compared to baseline (41.90±1.41), based only on the inferior DCP parafoveal sector (Figure 7, Table 2). We found no statistical difference between the follow-up and baseline analysis of the superior parafoveal region of the DCP. .
4. Discussion
The results of our current study provide insights into retinal microvascular alterations preceding DR, using OCTA FAZ parameters and vessel density of the capillary plexus analysis, over a three-year follow-up in T1DM patients without DR. Recent studies have provided both qualitative and quantitative OCTA data in diabetic patients, reporting a gradual decline in capillary density and branching complexity, along with a progressive increase in average vascular caliber across various stages of DR [18].
Previous research on the OCTA metrics for monitoring the severity progression of DR over a period of 3 years in adults with type 2 diabetes mellitus [19] indicated that progressive capillary loss serves as a valuable tool for monitoring the progression of DR. Our study specifically investigated young T1DM patients without clinical signs of DR, demonstrating that alterations in FAZ parameters and in capillary vessel density progressively accentuate on 3- year follow-up.
One of the earliest OCTA detectable changes that precede the clinical diagnosis of DR is represented by reduced vascular density in the parafoveal region [20] while capillary non-perfusion is one of the characteristic OCTA manifestations of DR [21,22]. Our previous research, conducted on T1DM patients without DR, demonstrated alterations in FAZ parameters and SCP vessel density, suggesting early microvascular dysfunction compared to healthy subjects. We have built upon these findings by continuing to track a part of these patients over time, assessing the progression of their OCTA retinal parameters to gain further insight into the dynamic of the microvascular change.
Our findings are consistent with previous longitudinal studies on patients with clinical DR, which have demonstrated a significant decrease in parafoveal vessel density in the SCP, while reduction in the DCP did not reach statistical significance over a s period of 2 years [23]. Moreover, our study extends this evidence to a younger T1DM cohort without clinical signs of DR, highlighting the potential of OCTA-derived metrics as sensitive, non-invasive biomarkers for early detection and progression monitoring of retinal microvascular alterations, preceding DR.
Our results demonstrate that FAZ parameters including area, perimeter, and circularity exhibit progressive alterations in T1DM patients with a disease duration of more than 5 years, reflecting early microvascular impairment and offering potential biomarkers for the onset and progression of DR.
Ensuring a rigorous quality check of OCTA vessel metrics is essential when comparing multiple examinations of the same patient in longitudinal studies and assessing disease progression. In our study, the examinations were conducted by experienced technicians and only high-quality images, without blink artefacts were analyzed.
A limitation of the current research is represented by the reduced number of patients and low variability of disease severity. At baseline, 61 patients were included in the T1DM group, but as they turned 18 years old, a part of them were lost for follow-up, as they moved away for work or study purposes and 2 of them developed clinical signs of DR. The incidence of DR in pediatric population shows that children are currently within the group of low risk of developing the disease, however the risk increases as they reach adolescence, with diabetic macular oedema, or even proliferative DR being reported in this age group [24]. Considering that the risk of developing DR increases with duration of T1DM, it is essential to ensure the best achievable glycemic control as this is considered to be the most important preventive measurement to delay the retinal changes [25].
The reported results confirm that alterations in FAZ parameters and vessel density become more pronounced in T1DM patients as the duration of the disease increases, even if clinical DR is not visible at conventional fundus examination. Also, previous research conducted by Marwa Abdelshafy [26] demonstrated that FAZ area and perimeter increase with disease duration in patients with clinically diagnosed DR. Multiple studies have demonstrated the high degree of repeatability and reliability of OCTA in measuring vascular changes in patients with DR compared to healthy subjects, associating these vascular changes with several degrees of DR severity [27,28].
In ophthalmic imaging, artificial intelligence (AI) has become integral in supporting clinical practice through the application of machine learning (ML) and deep learning (DL) technologies [29]. DL represents a specialized branch of ML which uses a complex architecture of neuron-like nodes that mimic the structure of the human brain, giving rise to the term “Convolutional Neural Networks” (CNNs) for systems that specialize in image recognition and classification [30]. DR is one of the primary causes of vision impairment worldwide, highlighting the importance of early automated detection for effective management. Automated DR classification has recently benefited of significant progress through the use of deep learning models, with CNNs and Vision Transformer (ViT) architectures being the most widely adopted, due to their ability to capture spatial hierarchies and local patterns in images [31]. Although CNNs and ViT have demonstrated impressive performance in classifying the severity of DR, imaging biomarkers which precede the clinical signs of DR need further study.
The current AI applications in DR primarily focus on identifying the classical signs of DR such as hemorrhages, microaneurysms, exudates and macular edema. However, through our research we aim to contribute to the development of guidelines for predicting progression towards DR. Moreover, based on the ocular data, AI algorithms could help predict the systemic impact of diabetes mellitus [32]. Considering that the OCTA technique enables direct, noninvasive in vivo visualization of the retinal microvascular alterations, it is reasonable to consider that similar microvascular changes may occur elsewhere in the body, such as heart or kidneys [33,34]. This highlights relevance of OCTA retinal parameters as potential marker for systemic microvascular health in diabetic patients.
5. Conclusions
In conclusion, our findings highlight a significant increase in the FAZ area and perimeter with a decrease in FAZ circularity, as well as a decrease in vascular density of the SCP and DCP in the parafoveal region T1DM patients over a 3-year follow-up period. OCTA long-term monitoring of T1DM patients represents an effective method for tracking the progressive changes of FAZ parameters and for the capillary plexus vascular density. By providing high-resolution imaging, the OCTA retinal evaluation of these patients enables detection of retinal microvascular abnormalities, which may lead to personalized management strategies for improved glycemic control.
Author Contributions
Conceptualization, A.O.D. and A.T.B; methodology, C.L.M., V.E.M; software, A.O.D., A.E.T.; validation, C.L.M. A.E.T.; formal analysis A.T.B. A.C.T.; investigation A.O.D and A.T.B.; data curation A.E.T; A.S.S.D.; writing—A.O.D.; writing—review and editing A.C.T. V.E.M.; visualization, A.T.B. A.S.S.D.; supervision, C.L.M.; project administration, A.O.D, A.E.T. All authors have read and agreed to the published version of the manuscript.
Funding
This research received no external funding.
Institutional Review Board Statement
The study was conducted in accordance with the Declaration of Helsinki, and approved by the Institutional Ethics Committee of the University of Medicine and Pharmacy of Craiova (project identification code 861/07/06/2021, date of approval 7 June 2021).
Informed Consent Statement
Informed consent was obtained from all subjects involved in the study.
Data Availability Statement
The authors declare that the data for this research are available from the correspondence authors upon reasonable request.
Acknowledgments
The authors have reviewed and edited the output and take full responsibility for the content of this publication.
Conflicts of Interest
The authors declare no conflicts of interest.
Abbreviations
The following abbreviations are used in this manuscript:
| T1DM | Type 1 Diabetes Mellitus |
| DR | Diabetic Retinopathy |
| OCTA | Optical coherence tomography angiography |
| FAZ | Foveal avascular zone |
| SCP | Superficial capillary plexus |
| DCP | Deep capillary plexus |
| AI | Artificial Intelligence |
| ML | Machine Learning |
| DL | Deep Learning |
| CNNs | Convolutional Neural Networks |
| ViT | Vision Transformer |
References
- Lucier J, Mathias PM. Type 1 Diabetes. [Updated 2024 Oct 5]. In: StatPearls [Internet]. Treasure Island (FL): StatPearls Publishing; 2025 Jan-. Available from: https://www.ncbi.nlm.nih.gov/books/NBK507713/.
- Mobasseri M, Shirmohammadi M, Amiri T, Vahed N, Hosseini Fard H, Ghojazadeh M. Prevalence and incidence of type 1 diabetes in the world: a systematic review and meta-analysis. Health Promot Perspect. 2020 Mar 30;10(2):98-115. doi: 10.34172/hpp.2020.18. Erratum in: Health Promot Perspect. 2024 Jul 29;14(2):202-205. doi: 10.34172/hpp. [CrossRef]
- Dan, A.O.; Bălășoiu, A.T.; Puiu, I.; Tănasie, A.C.; Târtea, A.E.; Sfredel, V. Retinal Microvascular Alterations in a Patient with Type 1 Diabetes Mellitus, Hemoglobin D Hemoglobinopathy, and High Myopia—Case Report and Review of the Literature. Diagnostics 2023, 13, 2934. [Google Scholar] [CrossRef] [PubMed]
- DeSalvo DJ, Noor N, Xie C, et al. Patient Demographics and Clinical Outcomes Among Type 1 Diabetes Patients Using Continuous Glucose Monitors: Data From T1D Exchange Real-World Observational Study. Journal of Diabetes Science and Technology. 2021;17(2):322-328. [CrossRef]
- Târtea, G.; Popa-Wagner, A.; Sfredel, V.; Mitran, S.I.; Dan, A.O.; Țucă, A.-M.; Preda, A.N.; Raicea, V.; Țieranu, E.; Cozma, D.; et al. Chitosan Versus Dapagliflozin in a Diabetic Cardiomyopathy Mouse Model. Int. J. Mol. Sci. 2024, 25, 2118. [Google Scholar] [CrossRef] [PubMed]
- Akil AA, Yassin E, Al-Maraghi A, Aliyev E, Al-Malki K, Fakhro KA. Diagnosis and treatment of type 1 diabetes at the dawn of the personalized medicine era. J Transl Med. 2021 Apr 1;19(1):137. [CrossRef] [PubMed] [PubMed Central]
- US Preventive Services Task Force, Davidson KW, Barry MJ, et al. Screening for Prediabetes and Type 2 Diabetes: US Preventive Services Task Force Recommendation Statement. JAMA. 2021;326(8):736-743. [CrossRef]
- Chong DD, Das N, Singh RP. Diabetic retinopathy: Screening, prevention, and treatment. Cleve Clin J Med. 2024 Aug 1;91(8):503-510. [CrossRef] [PubMed]
- Tănasie, C.A.; Dan, A.O.; Ică, O.M.; Mercuț, M.F.; Mitroi, G.; Taisescu, C.-I.; Sfredel, V.; Corbeanu, R.I.; Mocanu, C.L.; Danielescu, C. Retinal Functional Impairment in Diabetic Retinopathy. Biomedicines 2024, 12, 44. [Google Scholar] [CrossRef] [PubMed]
- Ştefănescu-Dima AŞ, Mănescu MR, Bălăşoiu AT, et al. Behavior pattern of early-stage ocular surface squamous cell carcinoma in non-HIV patients. Rom J Morphol Embryol. 2019;60(2):455-461.
- Waheed NK, Rosen RB, Jia Y, Munk MR, Huang D, Fawzi A, Chong V, Nguyen QD, Sepah Y, Pearce E. Optical coherence tomography angiography in diabetic retinopathy. Prog Retin Eye Res. 2023 Nov;97:101206. [CrossRef]
- Hayati, A.; Abdol Homayuni, M.R.; Sadeghi, R.; Asadigandomani, H.; Dashtkoohi, M.; Eslami, S.; Soleimani, M. Advancing Diabetic Retinopathy Screening: A Systematic Review of Artificial Intelligence and Optical Coherence Tomography Angiography Innovations. Diagnostics 2025, 15, 737. [Google Scholar] [CrossRef] [PubMed]
- Kong M, Song SJ. Artificial Intelligence Applications in Diabetic Retinopathy: What We Have Now and What to Expect in the Future. Endocrinol Metab (Seoul). 2024;39(3):416-424. [CrossRef]
- Zhang, L.; Van Dijk, E.H.C.; Borrelli, E.; Fragiotta, S.; Breazzano, M.P. OCT and OCT Angiography Update: Clinical Application to Age-Related Macular Degeneration, Central Serous Chorioretinopathy, Macular Telangiectasia, and Diabetic Retinopathy. Diagnostics 2023, 13, 232. [Google Scholar] [CrossRef] [PubMed]
- Dan, A.O.; Mocanu, C.L.; Bălășoiu, A.T.; Tănasie, C.A.; Puiu, I.; Târtea, A.E.; Sfredel, V. Correlations between Retinal Microvascular Parameters and Clinical Parameters in Young Patients with Type 1 Diabetes Mellitus: An Optical Coherence Tomography Angiography Study. Diagnostics 2024, 14, 317. [Google Scholar] [CrossRef] [PubMed]
- Marques IP, Ribeiro ML, Santos TP, Mendes LG, Reste-Ferreira D, Santos AR, Lobo CL, Cunha-Vaz JG. Different Risk Profiles for Progression of Nonproliferative Diabetic Retinopathy: A 2-Year Study. Ophthalmol Ther. 2023 Feb;12(1):485-500. [CrossRef]
- Dan, A.O.; Ștefănescu-Dima, A.; Bălășoiu, A.T.; Puiu, I.; Mocanu, C.L.; Ionescu, M.; Tănasie, A.C.; Târtea, A.E.; Sfredel, V. Early Retinal Microvascular Alterations in Young Type 1 Diabetic Patients without Clinical Retinopathy. Diagnostics 2023, 13, 1648. [Google Scholar] [CrossRef] [PubMed]
- Vinković, M.; Kopić, A.; Benašić, T.; Biuk, D.; Maduna, I.; Vujosevic, S. HD-OCT Angiography and SD-OCT in Patients with Mild or No Clinically Apparent Diabetic Retinopathy. Biomedicines 2025, 13, 1251. [Google Scholar] [CrossRef] [PubMed]
- Marques IP, Kubach S, Santos T, Mendes L, Madeira MH, de Sisternes L, Tavares D, Santos AR, Lewis W, Lobo C, Durbin MK, Cunha-Vaz J. Optical Coherence Tomography Angiography Metrics Monitor Severity Progression of Diabetic Retinopathy-3-Year Longitudinal Study. J Clin Med. 2021 May 25;10(11):2296. [CrossRef]
- You QS, Wang J, Guo Y, et al. Optical Coherence Tomography Angiography Avascular Area Association With 1-Year Treatment Requirement and Disease Progression in Diabetic Retinopathy. Am J Ophthalmol. 2020;217:268-277. [CrossRef]
- Haj Najeeb, B.; Gerendas, B.S.; Montuoro, A.; Simader, C.; Deák, G.G.; Schmidt-Erfurth, U.M. A Novel Effect of Microaneurysms and Retinal Cysts on Capillary Perfusion in Diabetic Macular Edema: A Multimodal Imaging Study. J. Clin. Med. 2025, 14, 2985. [Google Scholar] [CrossRef] [PubMed]
- Fasolino, G.; Lazaar, M.; Rocca, D.G.D.; Oellerich, S.; Ní Dhubhghaill, S. Predictive Value of Optical Coherence Tomography Biomarkers in Patients with Persistent Diabetic Macular Edema Undergoing Cataract Surgery Combined with a Dexamethasone Intravitreal Implant. Bioengineering 2025, 12, 556. [Google Scholar] [CrossRef] [PubMed]
- Aschauer J, Pollreisz A, Karst S, et al, Longitudinal analysis of microvascular perfusion and neurodegenerative changes in early type 2 diabetic retinal disease. British Journal of Ophthalmology 2022;106:528-533. [CrossRef]
- Wysocka-Mincewicz, M.; Gołębiewska, J.; Olechowski, A.; Szalecki, M. Diabetic Retinopathy in Children with Type 1 Diabetes—Occurrence and Screening Using Optical Coherence Tomography. Life 2021, 11, 590. [Google Scholar] [CrossRef] [PubMed]
- Alessandro Invernizzi, Jay Chhablani, Francesco Viola, Pierre Henry Gabrielle, Javier Zarranz-Ventura, Giovanni Staurenghi, Diabetic retinopathy in the pediatric population: Pathophysiology, screening, current and future treatments, Pharmacological Research,Volume 188, 2023, 106670, ISSN 1043-6618. [CrossRef]
- Abdelshafy M, Abdelshafy A. Correlations Between Optical Coherence Tomography Angiography Parameters and the Visual Acuity in Patients with Diabetic Retinopathy. Clin Ophthalmol. 2020;14:1107-1115. Published 2020 Apr 23. [CrossRef]
- Gregori, G.; Mangoni, L.; Muzi, A.; Mogetta, V.; Gujar, R.; Chiapponi, M.; Fruttini, D.; Dolz-Marco, R.; Chhablani, J.; Mariotti, C.; et al. Vascular Perfusion Variability in Diabetic Retinopathy: A Sequential Interscan Optical Coherence Tomography Angiography Assessment. J. Clin. Med. 2025, 14, 2312. [Google Scholar] [CrossRef] [PubMed]
- Sopeña-Pinilla, M.; Arias-Alvarez, M.; Lopez-Galvez, M.I.; Orduna-Hospital, E.; Fernandez-Espinosa, G.; Boned-Murillo, A.; Díaz-Barreda, M.D.; Tomas-Grasa, C.; Pinilla, I. Retinal Vascular Density and Thickness in Long-Term Type 1 Diabetes Without Visible Vascular Signs of Retinopathy. J. Clin. Med. 2025, 14, 1082. [Google Scholar] [CrossRef] [PubMed]
- Al Kuwaiti A, Nazer K, Al-Reedy A, Al-Shehri S, Al-Muhanna A, Subbarayalu AV, Al Muhanna D, Al-Muhanna FA. A Review of the Role of Artificial Intelligence in Healthcare. J Pers Med. 2023 Jun 5;13(6):951. [CrossRef] [PubMed] [PubMed Central]
- Kong M, Song SJ. Artificial Intelligence Applications in Diabetic Retinopathy: What We Have Now and What to Expect in the Future. Endocrinol Metab (Seoul). 2024 Jun;39(3):416-424. [CrossRef] [PubMed] [PubMed Central]
- Tejas Karkera, Chandranath Adak, Soumi Chattopadhyay, Muhammad Saqib, Detecting severity of Diabetic Retinopathy from fundus images: A transformer network-based review, Neurocomputing,Volume 597,2024,127991,ISSN 0925-2312. [CrossRef]
- Cheung CY, Xu D, Cheng CY, Sabanayagam C, Tham YC, Yu M, et al. A deep-learning system for the assessment of cardiovascular disease risk via the measurement of retinal-vessel calibre. Nat Biomed Eng. 2021;5:498–508. [CrossRef]
- Alé-Chilet, A.; Bernal-Morales, C.; Barraso, M.; Hernández, T.; Oliva, C.; Vinagre, I.; Ortega, E.; Figueras-Roca, M.; Sala-Puigdollers, A.; Esquinas, C.; et al. Optical Coherence Tomography Angiography in Type 1 Diabetes Mellitus—Report 2: Diabetic Kidney Disease. J. Clin. Med. 2022, 11, 197. [Google Scholar] [CrossRef] [PubMed]
- Carollo, C.; Vadalà, M.; Sorce, A.; Cirafici, E.; Bennici, M.; Castellucci, M.; Bonfiglio, V.M.E.; Mulè, G.; Geraci, G. Early Renal Dysfunction and Reduced Retinal Vascular Density Assessed by Angio-OCT in Hypertensive Patients. Biomedicines 2025, 13, 1176. [Google Scholar] [CrossRef] [PubMed]
Figure 1.
T1DM patient: Representative OCTA comparison report between the baseline visit and the follow-up visit, showing alteration of FAZ area and perimeter; decrease in vessel density of the SCP.
Figure 1.
T1DM patient: Representative OCTA comparison report between the baseline visit and the follow-up visit, showing alteration of FAZ area and perimeter; decrease in vessel density of the SCP.
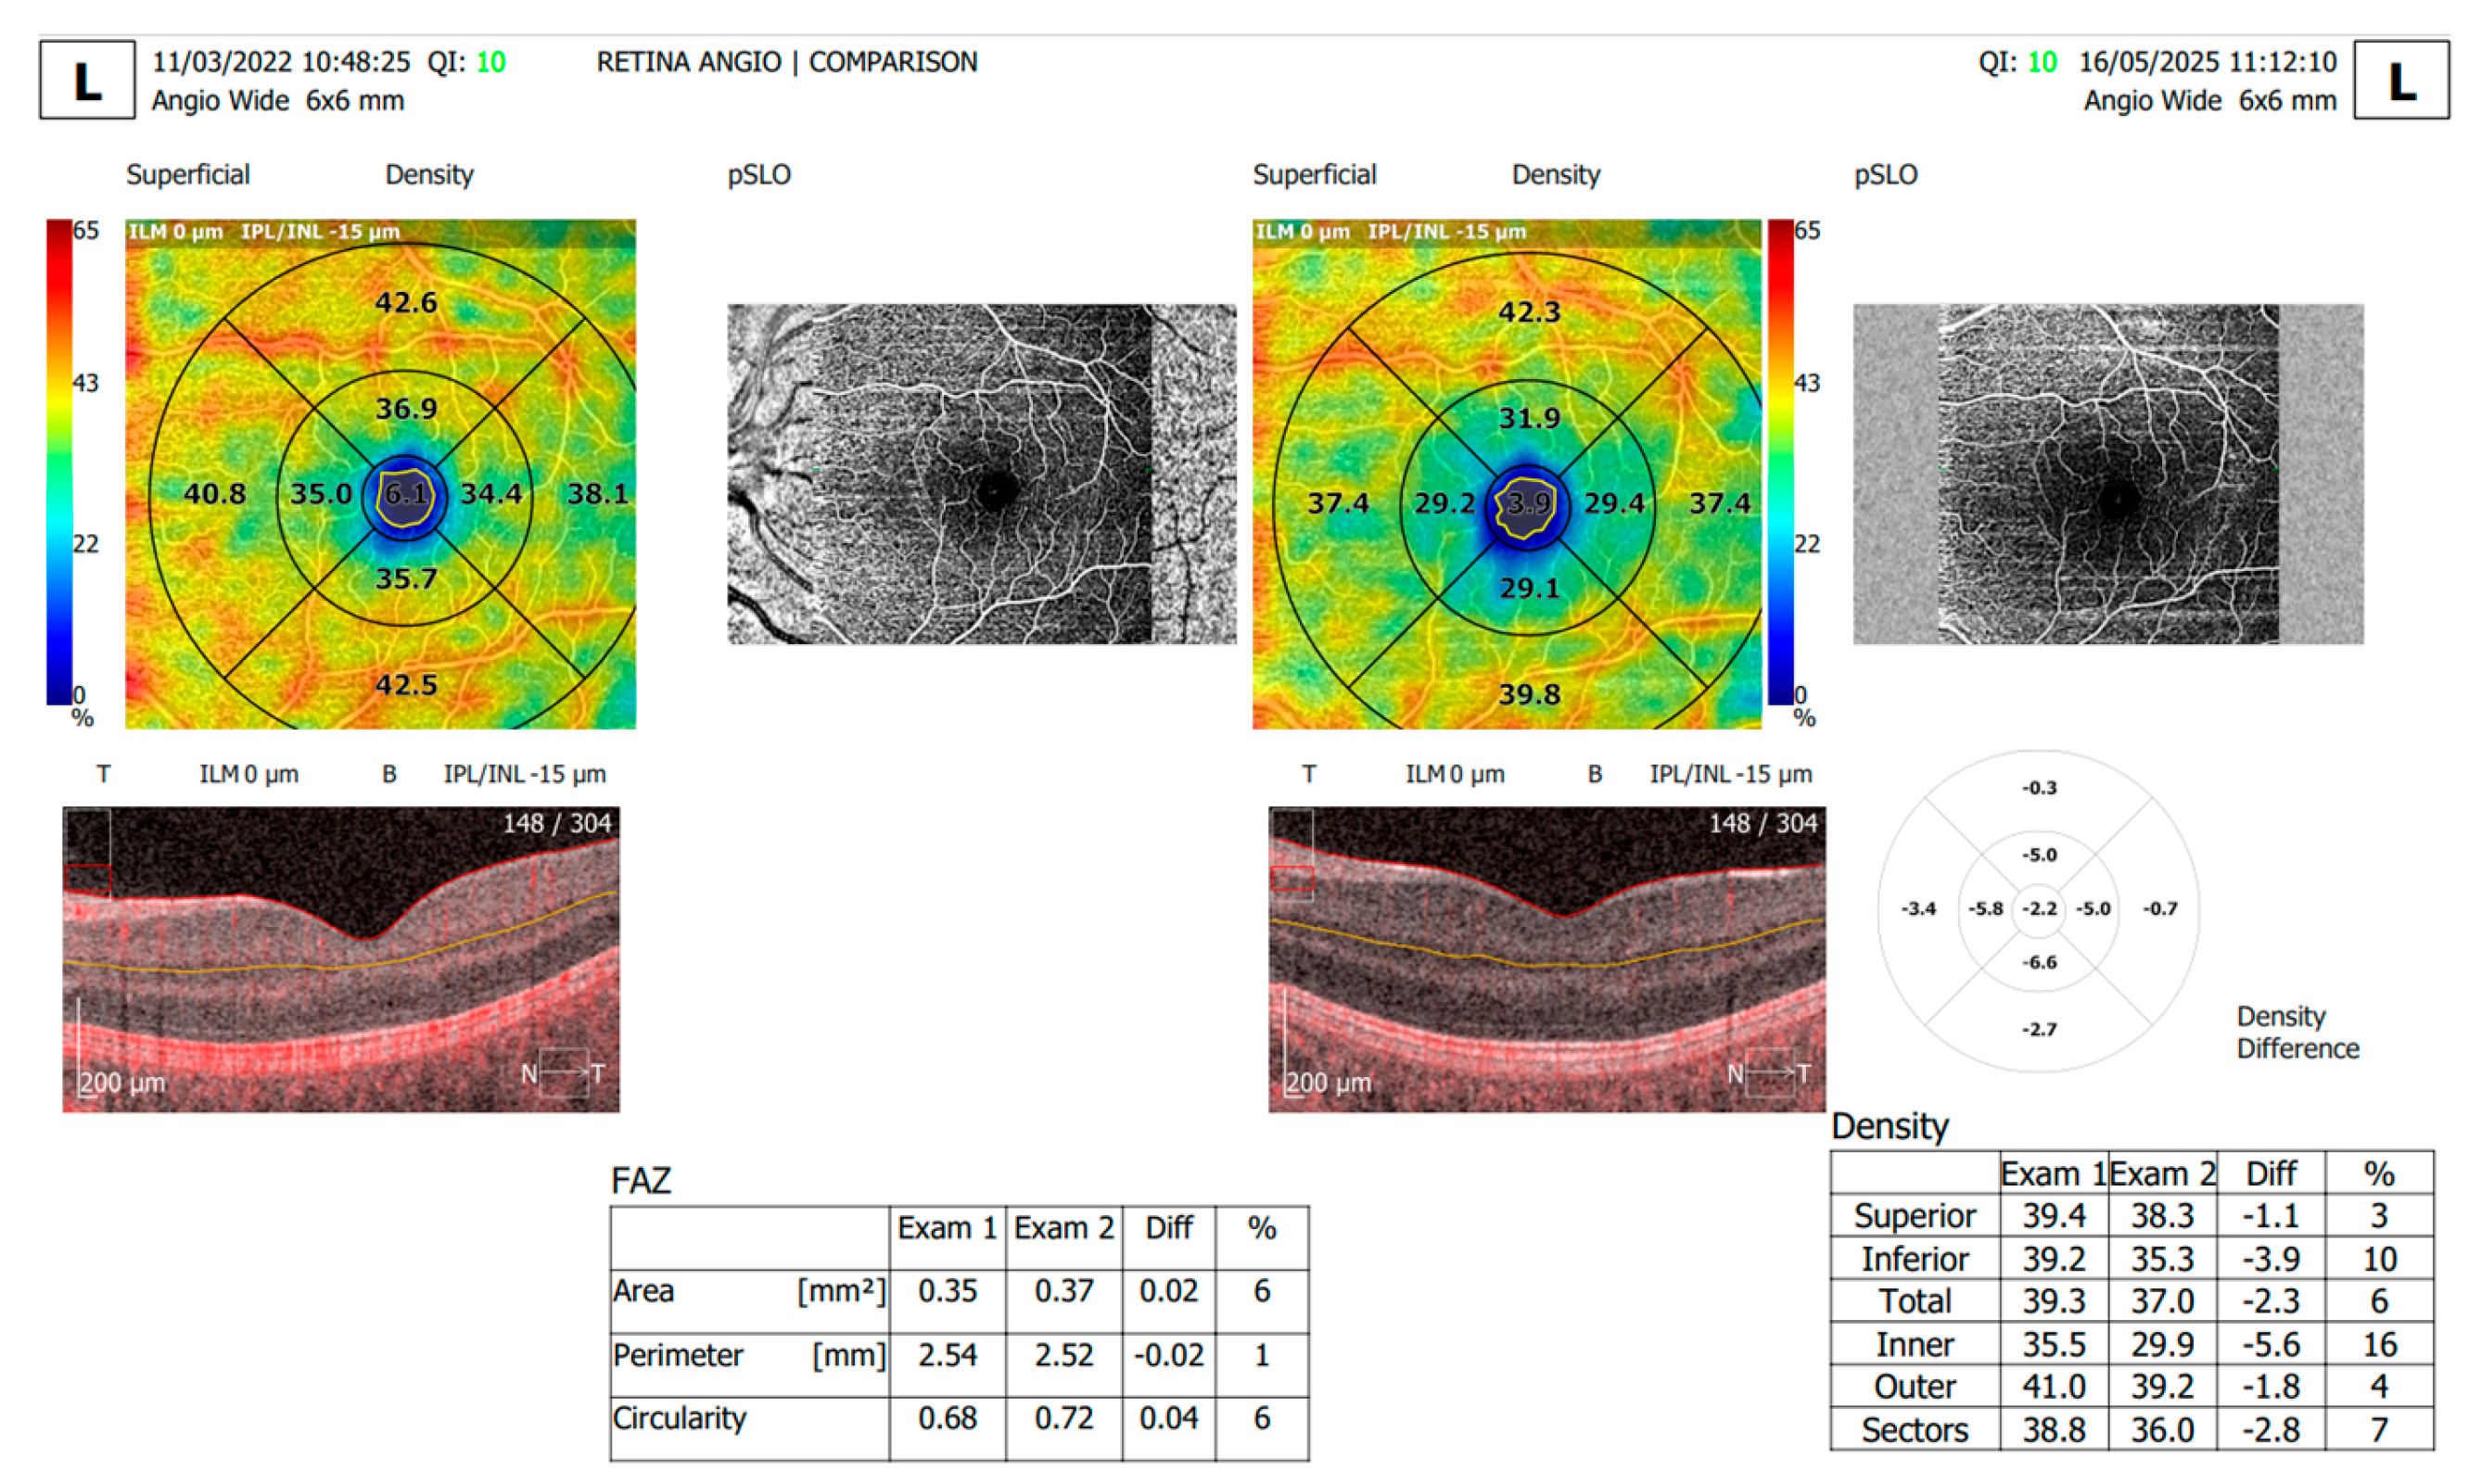
Figure 2.
FAZ area at baseline, and follow-up for the T1DM compared with the Control Group, using (a) ordinary one-way Anova analysis, with p< 0.01; (b) unpaired 2 tailed T test analysis of the follow-up and baseline FAZ area, with p=0.01.
Figure 2.
FAZ area at baseline, and follow-up for the T1DM compared with the Control Group, using (a) ordinary one-way Anova analysis, with p< 0.01; (b) unpaired 2 tailed T test analysis of the follow-up and baseline FAZ area, with p=0.01.
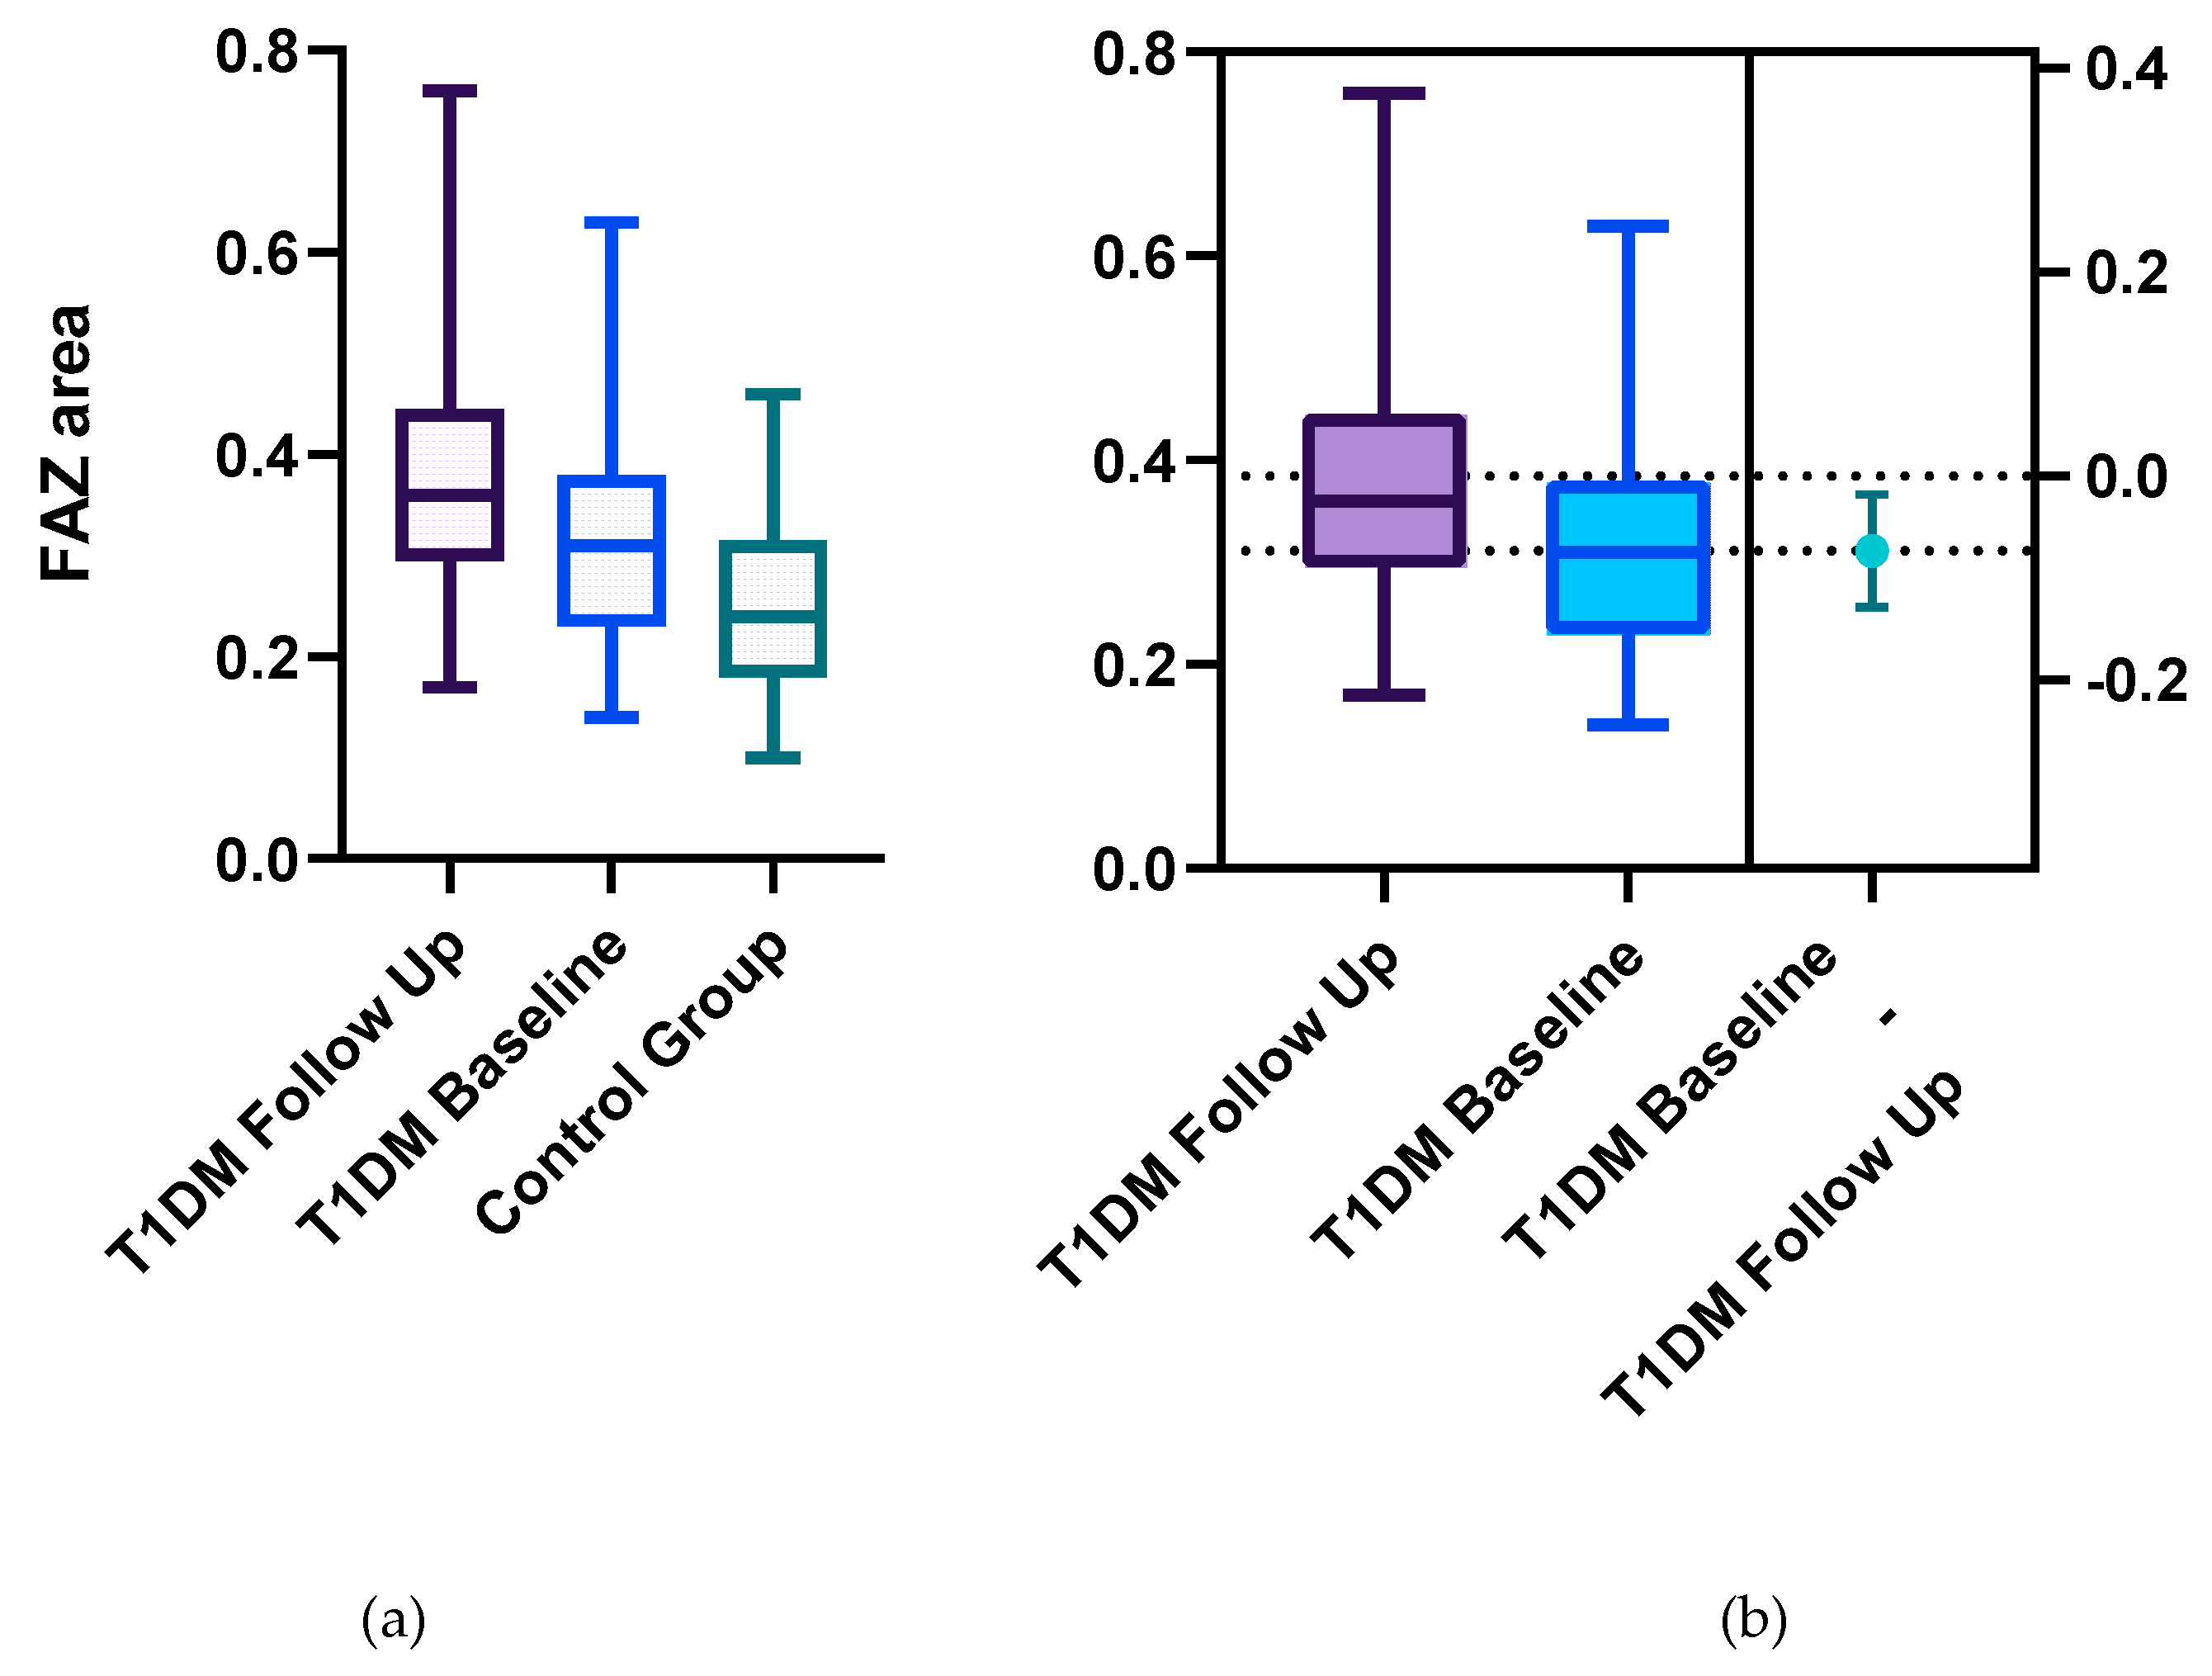
Figure 3.
FAZ perimeter at baseline, and follow-up for the T1DM group compared with the Control Group, using (a) ordinary one-way Anova analysis, with p= 0.02; (b) unpaired 2-tailed T test analysis of the follow-up and baseline FAZ perimeter for the T1DM group, with p=0.01.
Figure 3.
FAZ perimeter at baseline, and follow-up for the T1DM group compared with the Control Group, using (a) ordinary one-way Anova analysis, with p= 0.02; (b) unpaired 2-tailed T test analysis of the follow-up and baseline FAZ perimeter for the T1DM group, with p=0.01.
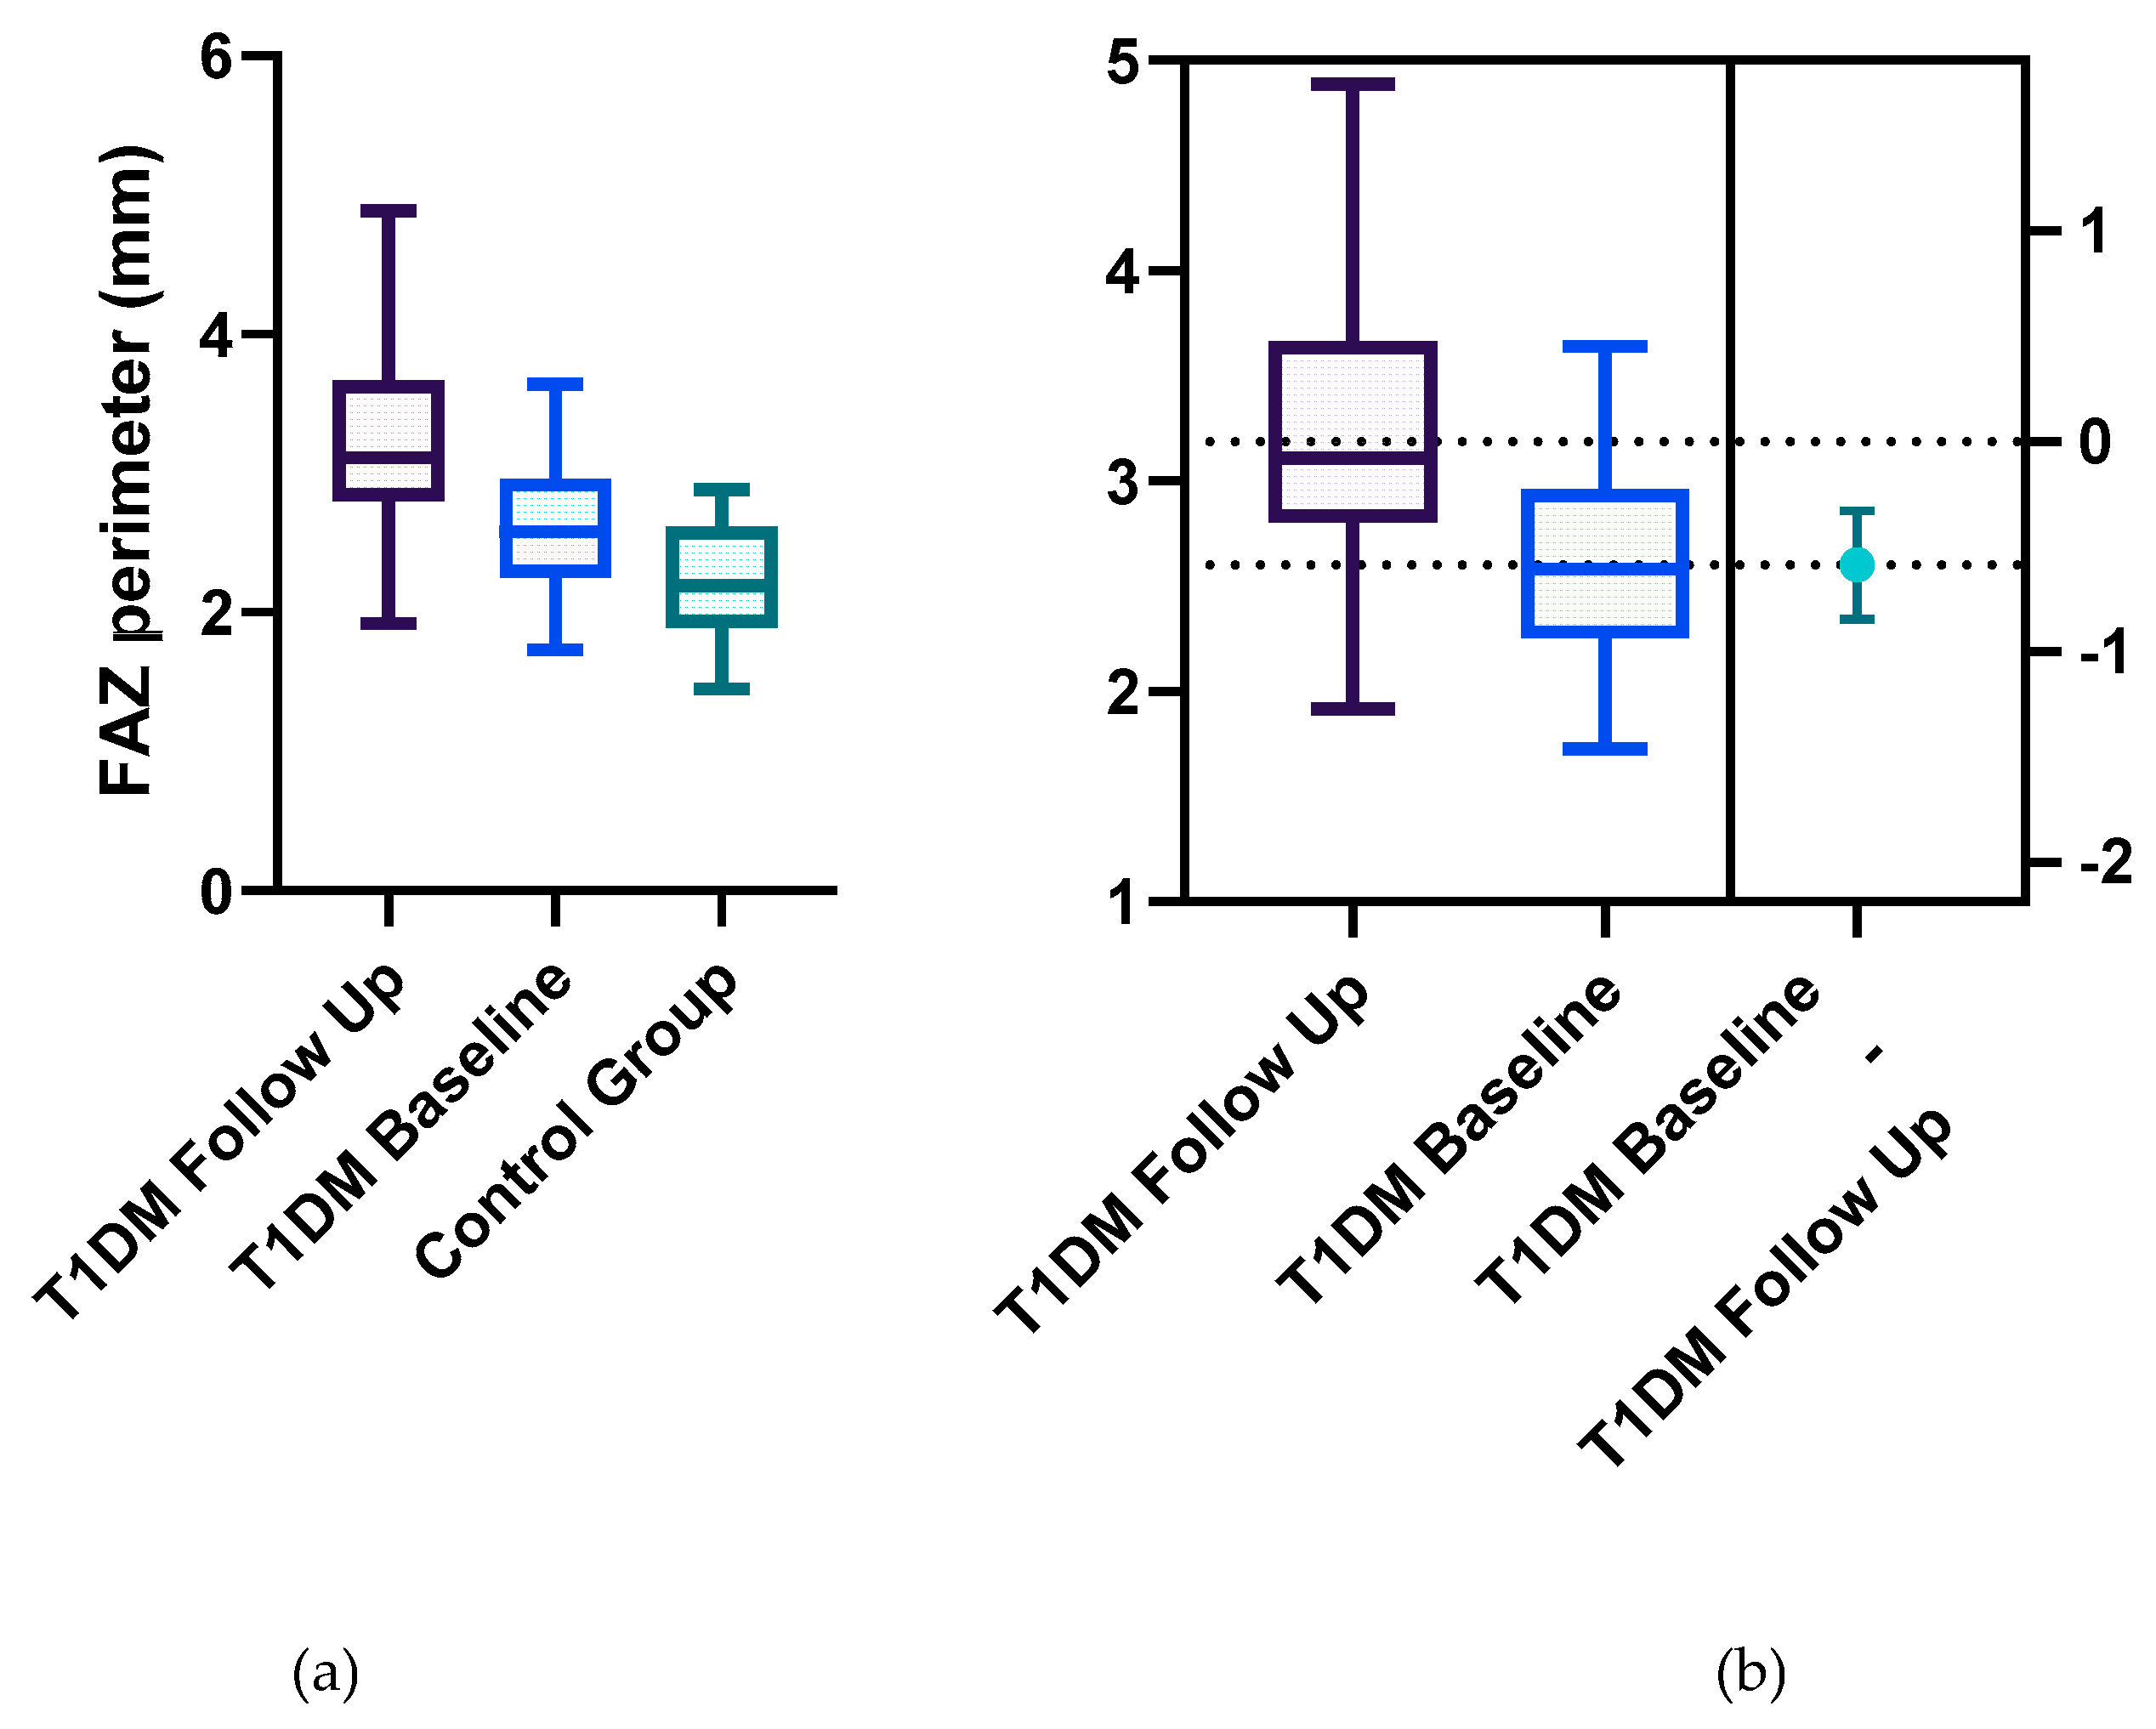
Figure 4.
FAZ Circularity index at follow-up and baseline for the T1DM group compared with the Control Group, using (a) ordinary one-way Anova analysis, with p< 0.01; (b) unpaired 2-tailed T test analysis of the follow-up and baseline FAZ perimeter for the T1DM group, with p=0.01.
Figure 4.
FAZ Circularity index at follow-up and baseline for the T1DM group compared with the Control Group, using (a) ordinary one-way Anova analysis, with p< 0.01; (b) unpaired 2-tailed T test analysis of the follow-up and baseline FAZ perimeter for the T1DM group, with p=0.01.
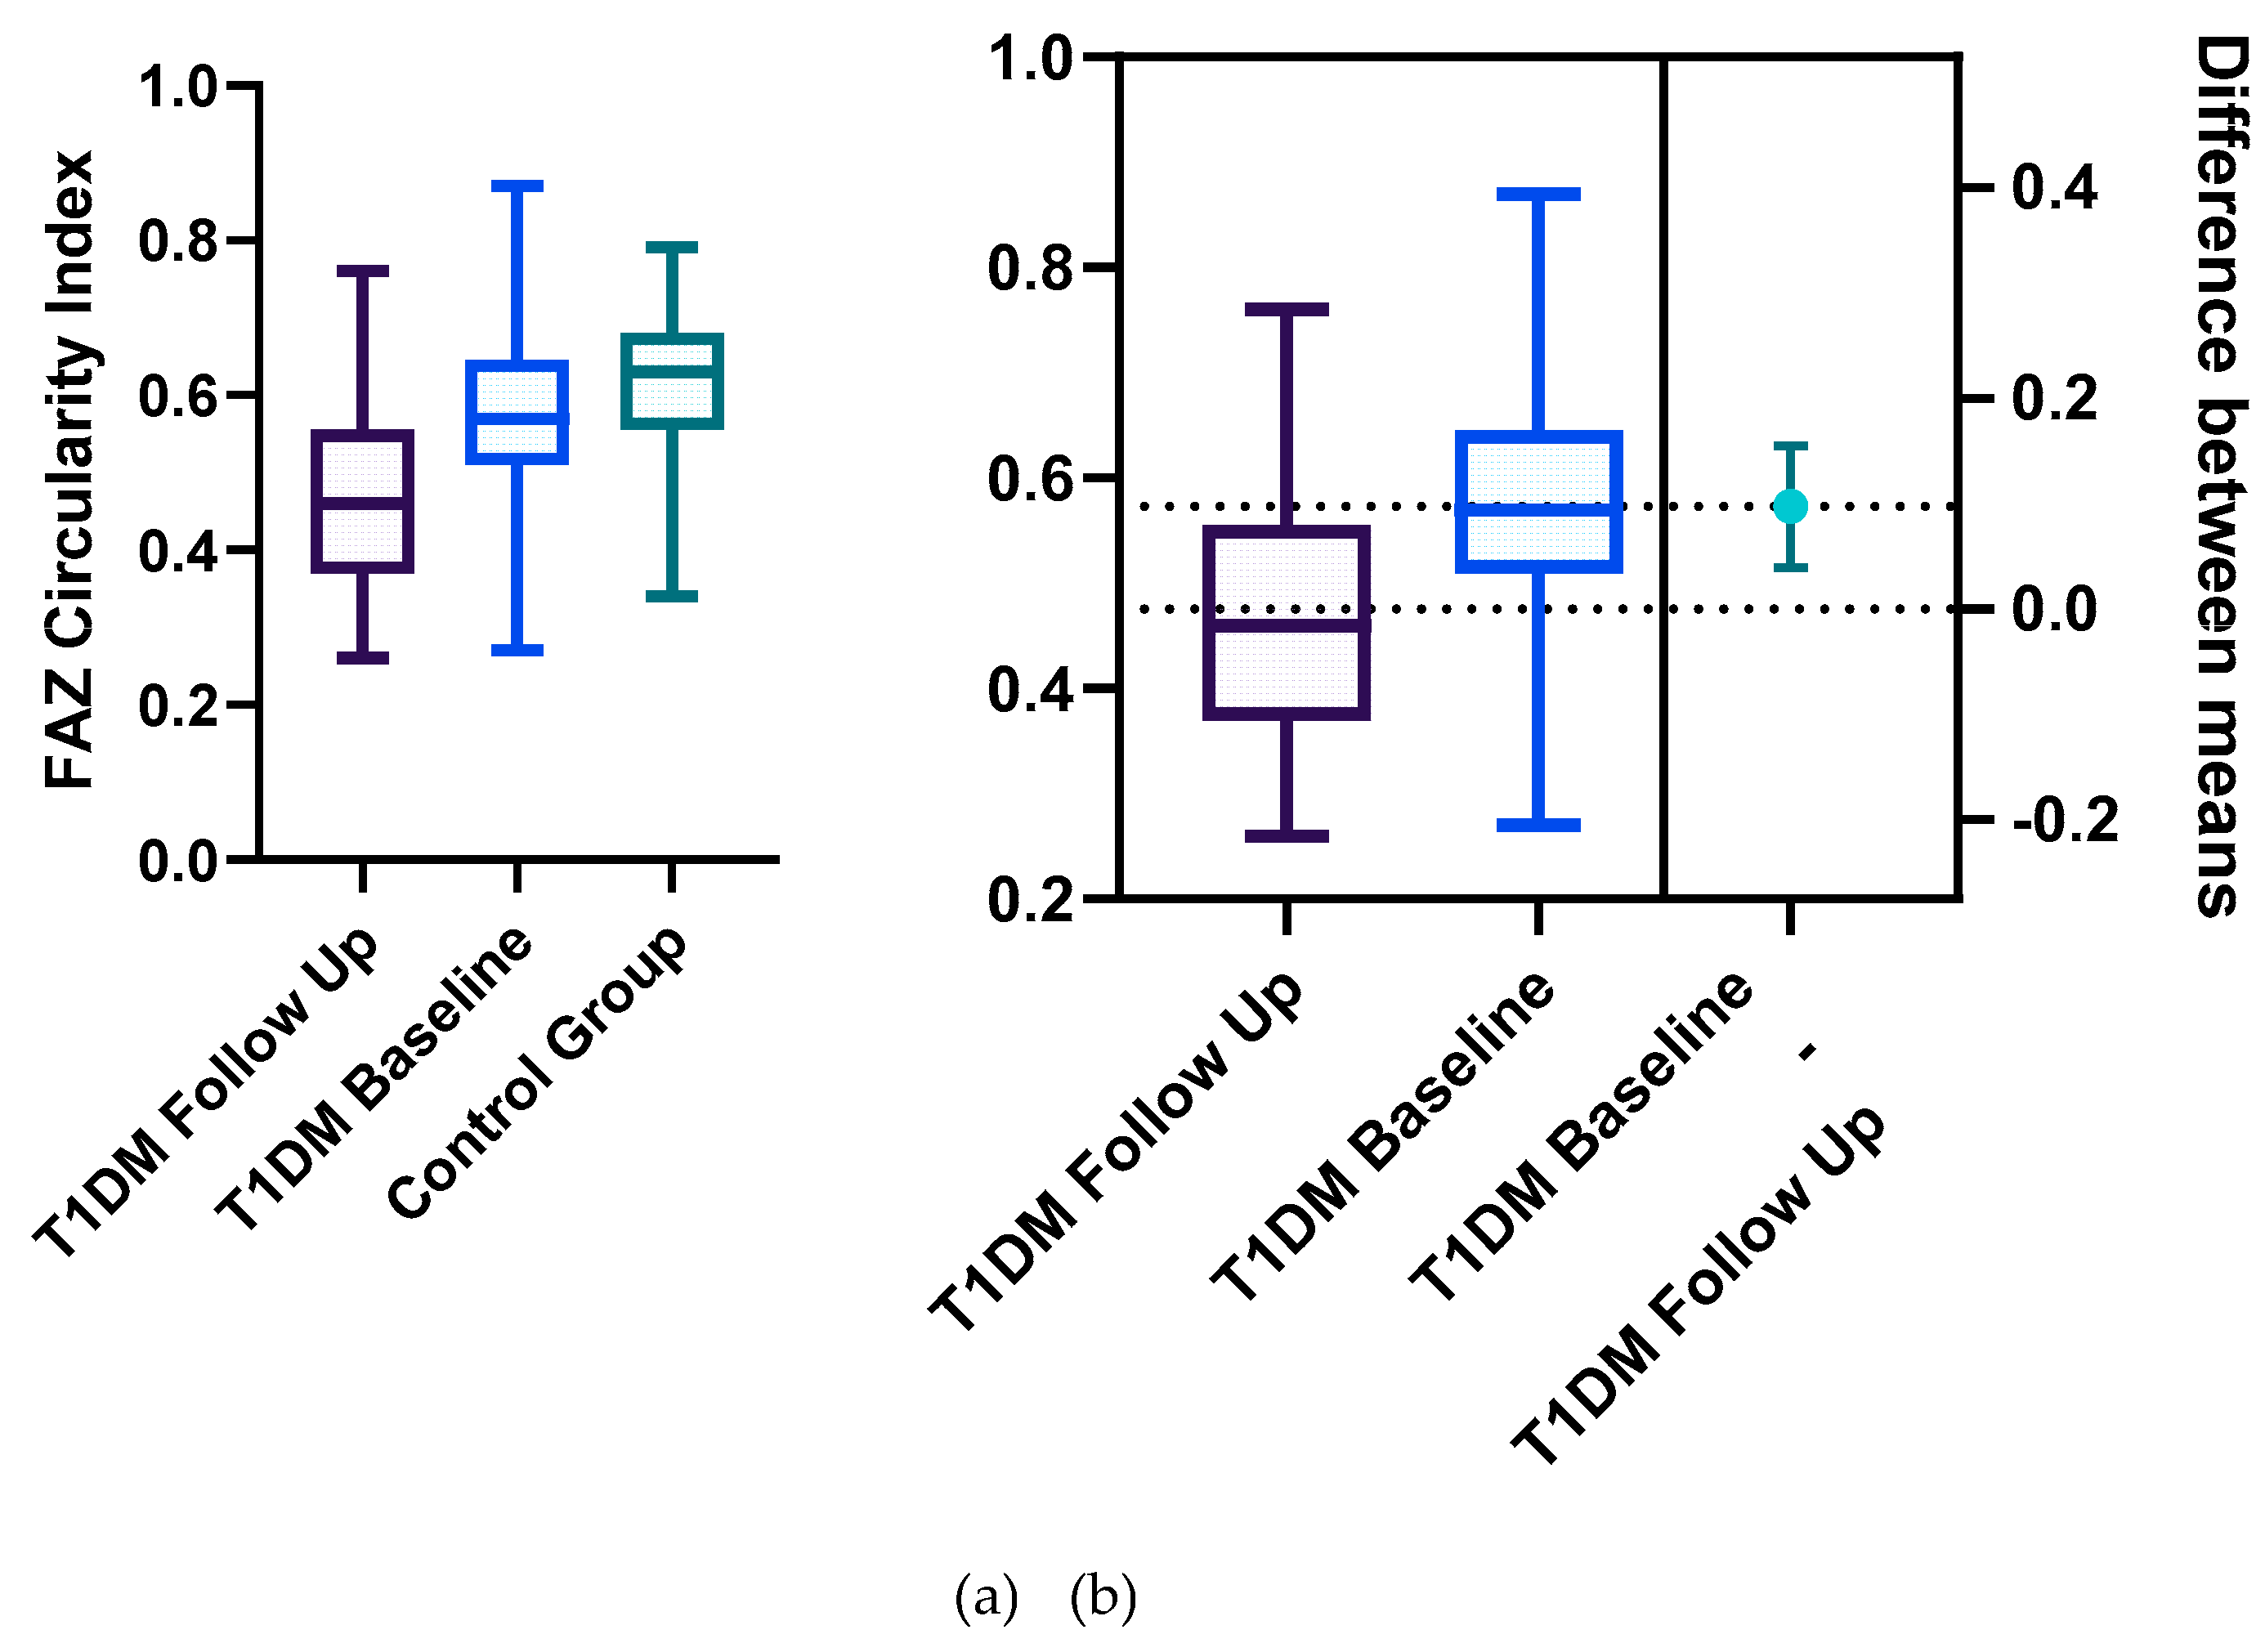
Figure 5.
(a) SCP vessel density at baseline and follow-up for the T1DM using unpaired 2-tailed T test analysis, with p=0.001; (b) DCP vessel density at baseline and follow-up for the T1DM using unpaired 2-tailed T test analysis, with p=0.03.
Figure 5.
(a) SCP vessel density at baseline and follow-up for the T1DM using unpaired 2-tailed T test analysis, with p=0.001; (b) DCP vessel density at baseline and follow-up for the T1DM using unpaired 2-tailed T test analysis, with p=0.03.
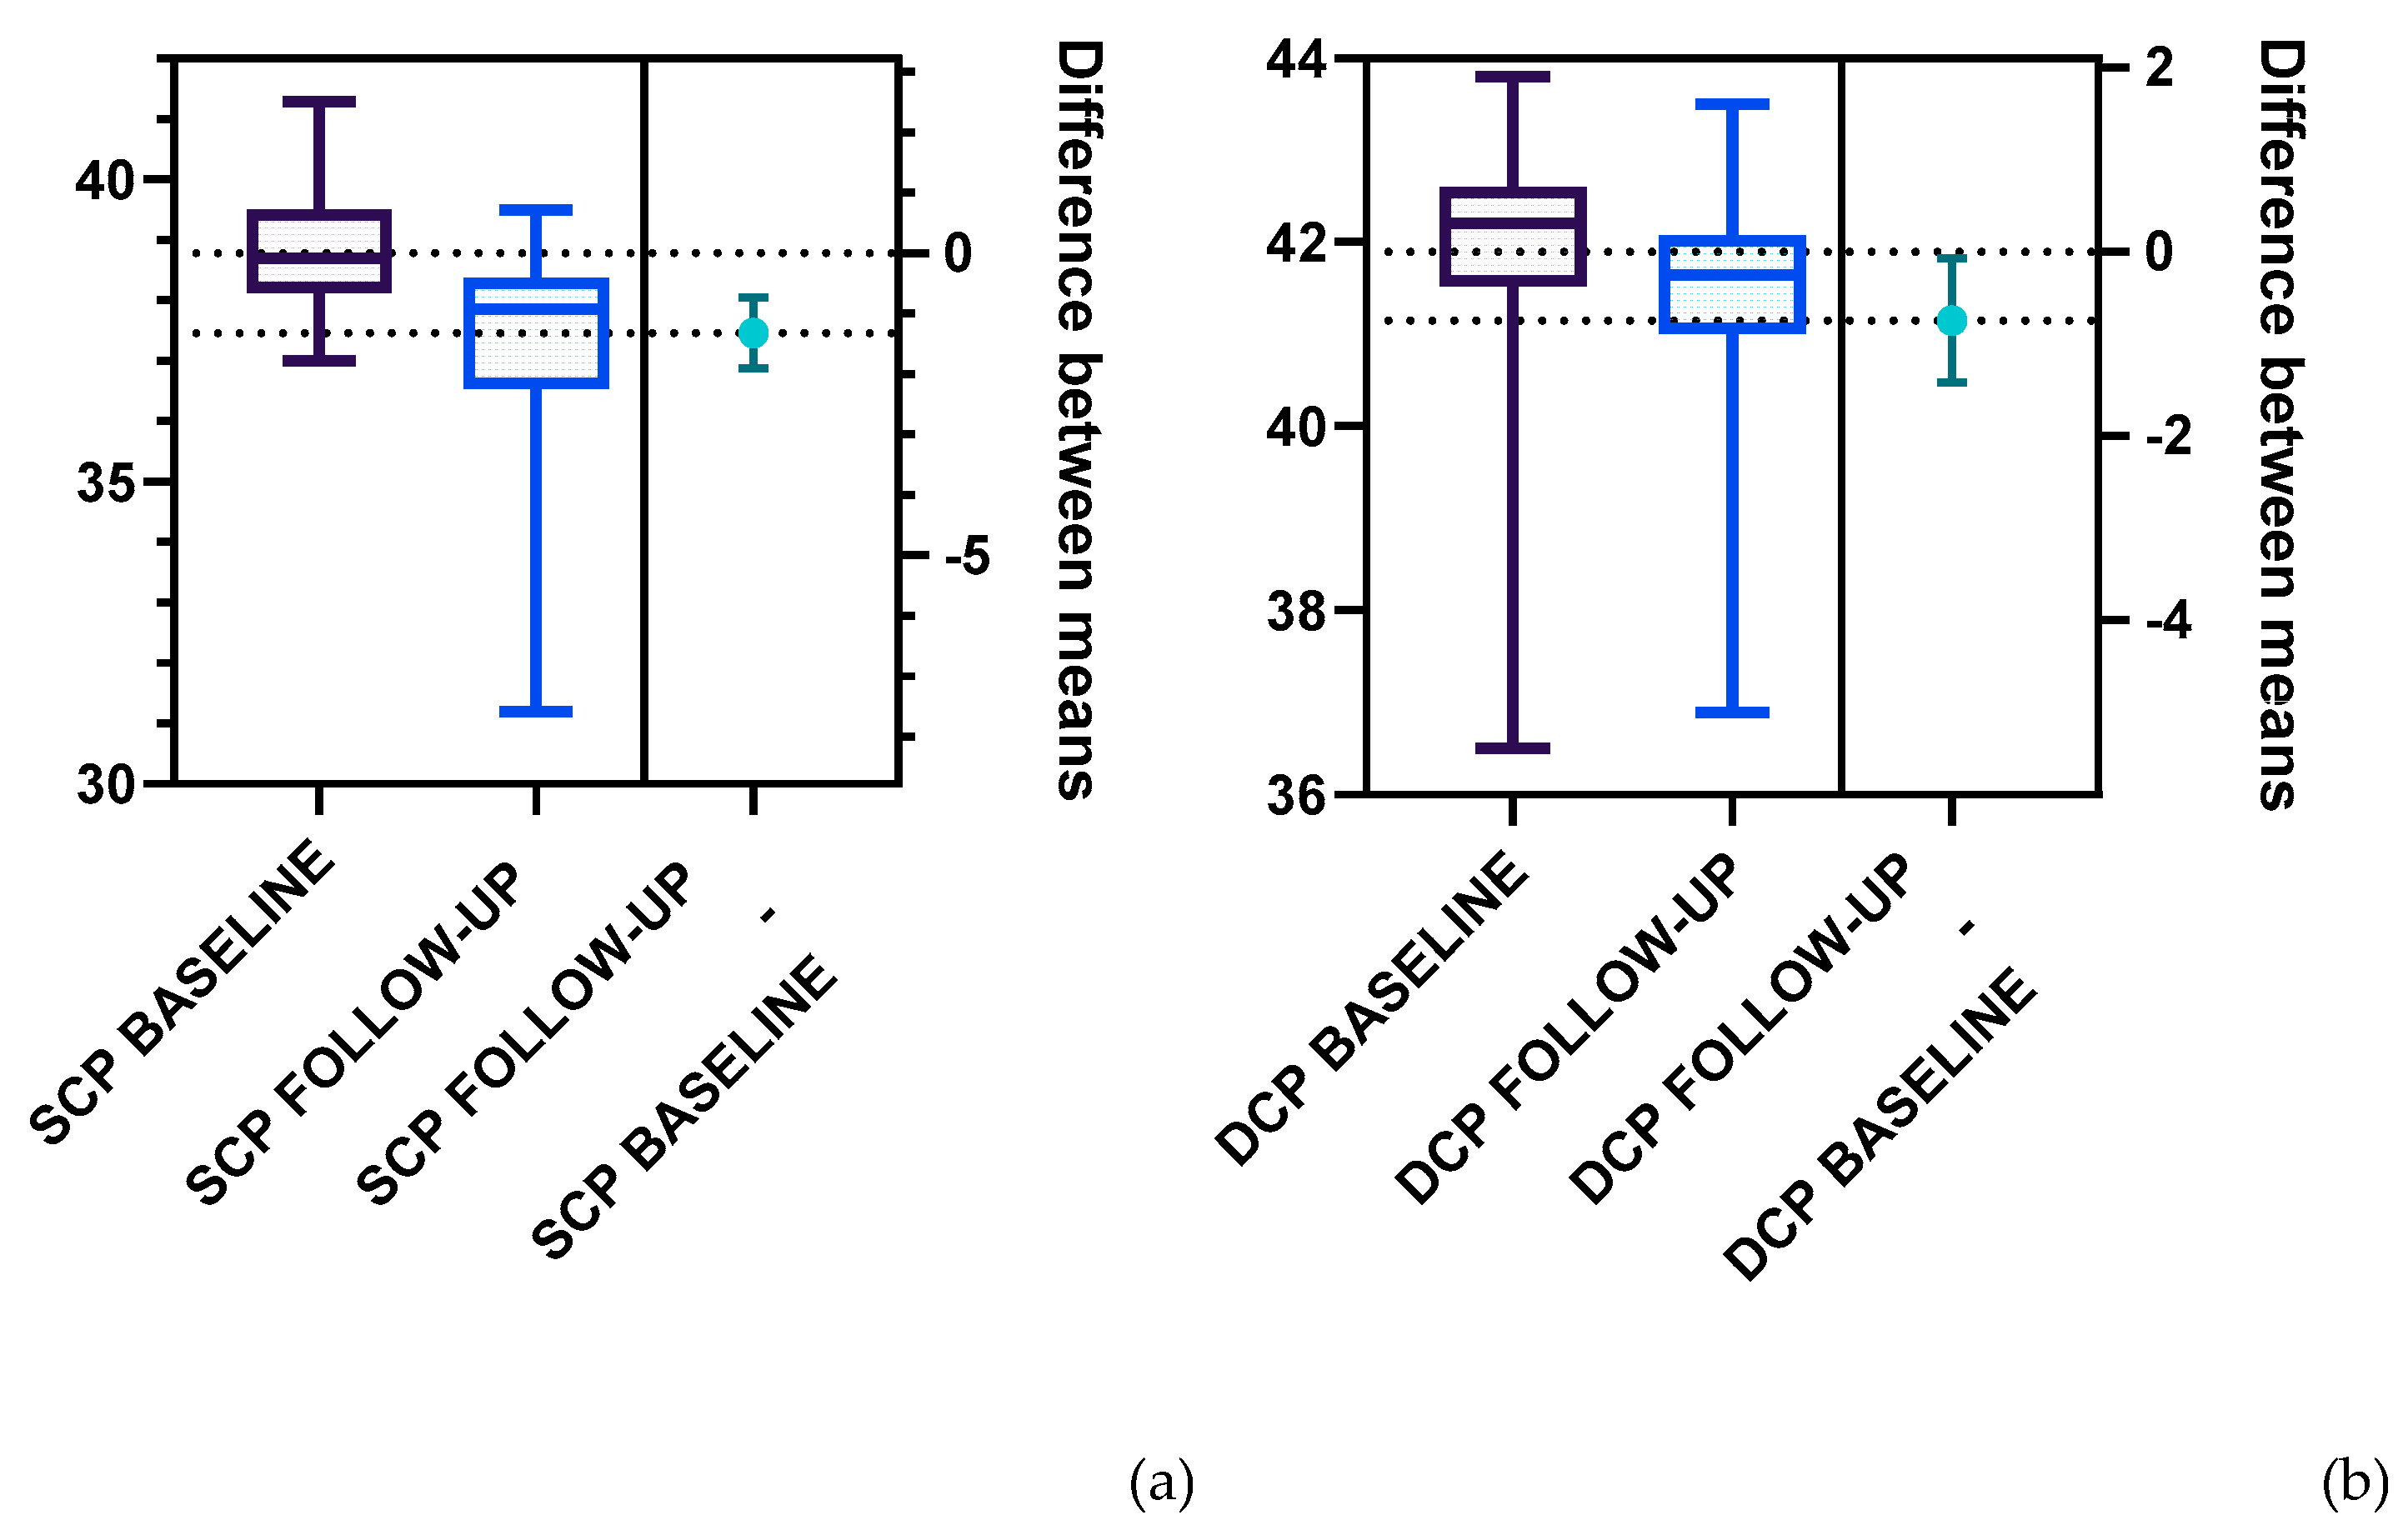
Figure 6.
SCP vessel density in the superior and inferior parafoveal region at baseline and follow-up, unpaired 2-tail T test, p<0.01.
Figure 6.
SCP vessel density in the superior and inferior parafoveal region at baseline and follow-up, unpaired 2-tail T test, p<0.01.
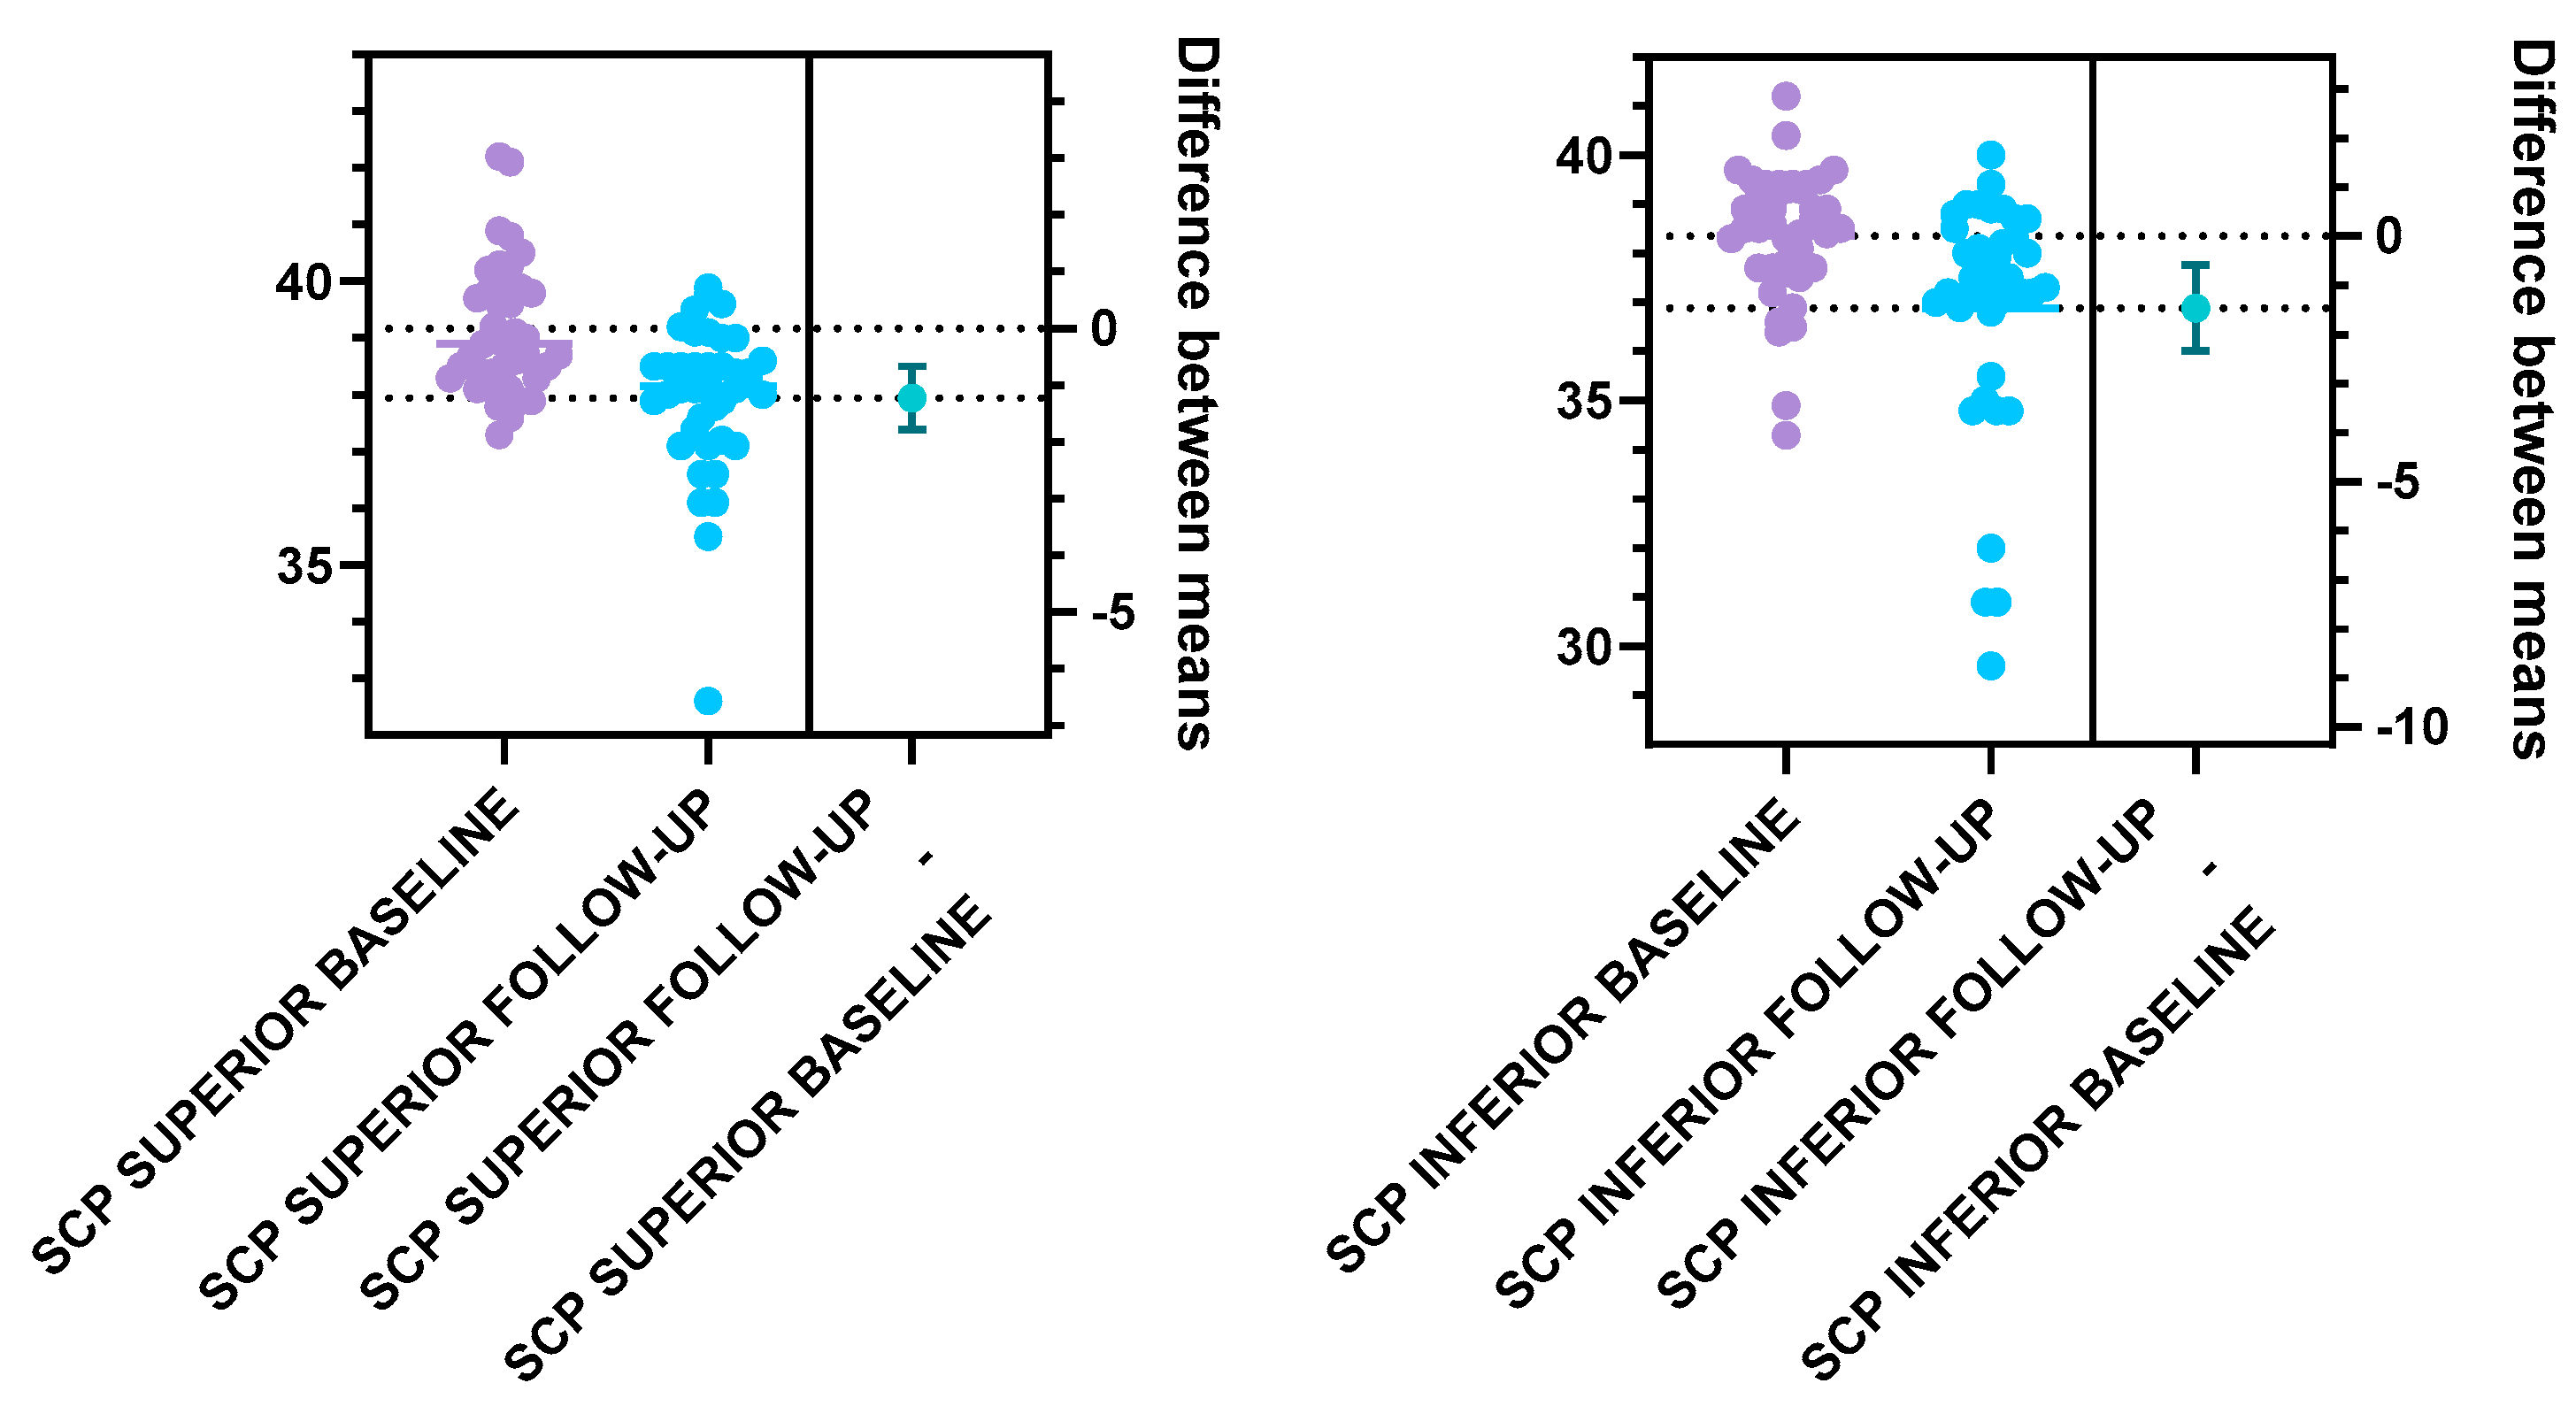

Table 1.
Clinical characteristics of study participants.
| Clinical characteristics | T1DM Group | Control Group |
| Gender (male/female) | 29/11 | 17/23 |
| Age (years) | 14.9± 3.57 | 15.5±2.75 |
| T1DM duration | 7.17±2.08 | - |
| HbA1c (mean %) | 8.05±1.42 | - |
Table 2.
Analysis of OCTA parameters of the T1DM patients at follow-up and baseline using unpaired two-tail T-test, with *p< 0.05 statistically significant.
Table 2.
Analysis of OCTA parameters of the T1DM patients at follow-up and baseline using unpaired two-tail T-test, with *p< 0.05 statistically significant.
| OCTA parameters |
T1DM Follow-up | T1DM Baseline | p value |
|---|---|---|---|
| FAZ area (mm2) | 0.38±0.13 | 0.31 ±0.11 | 0.01* |
| FAZ Perimeter (mm) |
3.22±0.75 | 2.61±00.52 | <0.01* |
| FAZ circularity |
0.47±0.13 | 0.56±0.12 | <0.01* |
| SCP total vessel density (%) |
37.47±1.57 | 38.79±1.00 | <0.01* |
| SCP superior vessel density (%) |
37.95±1.33 | 39.18±1.14 | <0.01* |
| SCP inferior vessel density (%) |
36.89±2.40 | 38.35±1.35 | <0.01* |
| DCP total vessel density (%) |
41.15±1.60 | 41.90±1.41 | 0.03* |
| DCP superior vessel density (%) |
41.51±1.37 | 42.03±1.64 | 0.12 |
| DCP inferior vessel density (%) |
40.78±2.26 | 41.63±1.46 | 0.02* |
Disclaimer/Publisher’s Note: The statements, opinions and data contained in all publications are solely those of the individual author(s) and contributor(s) and not of MDPI and/or the editor(s). MDPI and/or the editor(s) disclaim responsibility for any injury to people or property resulting from any ideas, methods, instructions or products referred to in the content. |
© 2025 by the authors. Licensee MDPI, Basel, Switzerland. This article is an open access article distributed under the terms and conditions of the Creative Commons Attribution (CC BY) license (http://creativecommons.org/licenses/by/4.0/).
Copyright: This open access article is published under a Creative Commons CC BY 4.0 license, which permit the free download, distribution, and reuse, provided that the author and preprint are cited in any reuse.


