
Submitted:
30 May 2025
Posted:
31 May 2025
You are already at the latest version
Abstract
Life expectancy is a critical indicator of public health, influenced by multiple factors including behavioral and lifestyle choices such as physical activity, diet, smoking, and alcohol consumption. This study aims to identify key risk factors that influence life expectancy and contribute to mortality changes. Using data from 2000 to 2021,utilizing statistical regression models and deep learning techniques (LSTM), a comparative analysis was conducted for Kyrgyzstan, Japan, and Kazakhstan, focusing on smoking, alcohol consumption, and Body Mass Index (BMI). The findings demonstrate significant impacts of these factors on life expectancy and mortality rates and reveal substantial differences between developed and developing coun- tries. This study highlights the importance of strategic public health measures and shows the potential for developing predictive models that can support personalized healthcare and help shape policies aimed at improving life expectancy.
Keywords:
Life expectancy
; risk factors
; smoking
; alcohol
; BMI
; predictive modeling
; Kyrgyzstan
; Japan
; Kazakhstan
1. Introduction
Numerous studies have established links between modifiable lifestyle factors—such as alcohol consumption, smoking, and BMI—and health outcomes including life expectancy and mortality. However, the magnitude and nature of these associ- ations vary widely between countries, influenced by healthcare systems, cultural practices, socioeconomic development, and public health policies. Developed countries generally exhibit higher life expectancy rates, whereas lower life expectancy in developing nations is often ascribed to healthcare limitations, poor education access, insufficient government programs, and high population density.
This research analyzes the impact of smoking, alcohol use, and BMI on life expectancy and mortality in two economically developing countries (Kyrgyzstan and Kazakhstan) and one highly developed country (Japan) from 2000 to 2021, and includes a prediction of life expectancy for the next ten years.
Research questions:
- To what extent do risk factors (smoking, alcohol use, and BMI) affect life expectancy?
- How significantly do these risk factors influence mortality rates?
Hypotheses:
Identify applicable funding agency here. If none, delete this.
- Risk factors such as smoking, alcohol consumption, and BMI have either a positive or negative impact on life expectancy.
- Risk factors such as smoking, alcohol consumption, and BMI have either a positive or negative impact to mortality rates.
2. Literature Review
There various types of studies have been performed to assess factors that affect life expectancy, adult mortality. However there are limited comparative studies across these nations using a combination of statistical and machine learning models. To research conducted in developing countries, studies on life expectancy and mortality in developed countries, such as Japan, have provided valuable insights.
The population of Japan has the longest life expectancy at birth in the world. Life expectancy at birth for Japanese women was 54.0 y in 1947 and rapidly increased until 1986, at which point, at 81.0 y, it became the longest in the world for the first time; female life expectancy at birth also reached its highest ever worldwide figure, 86.4 y, in Japan in 2009 [1].
Tsuji’s [2] study employed various methods, including cohort studies, randomized controlled trials, and propensity score matching, to analyze factors influencing healthy life expectancy. Regression models were used to assess the impact of health indicators like blood pressure, serum levels, and lifestyle habits (e.g., green tea consumption and diet) on mor- tality risk and ADL disability. Key risk factors, including blood pressure, serum adiponectin levels, and lifestyle habits, were found to have the most significant impact on life expectancy. Recent studies highlight avoidable mortality as a key indicator of healthcare performance.
In a study [3] of urban Japanese civil servants, smoking was found to be strongly associated with other unhealthy lifestyle behaviors—such as heavy drinking, irregular breakfast con- sumption, and lower physical activity—that collectively con- tribute to reduced life expectancy and increased mortality risk. The Japan Collaborative Cohort (JACC) [4] study demonstrates that maintaining six healthy lifestyle behav- iors—including nonsmoking, moderate drinking, regular walk- ing, adequate sleep, vegetable consumption, and normal
BMI—significantly increases life expectancy by approxi- mately 8 to 10 years at ages 40 and 60. Importantly, smoking cessation was identified as the most impactful factor, with smokers exhibiting shorter life expectancy even if adhering to other healthy behaviors. These findings underscore the critical role of smoking cessation alongside other lifestyle modifica- tions in reducing mortality risk among Japanese adults.
Several studies have provided valuable insights into the health challenges faced by Kazakhstan.
Kosherbayeva [5] examined trends in Kazakhstan (2015–2021), identifying circulatory, respiratory diseases, and cancer as leading causes, particularly among men. A rise in avoidable deaths after 2019 emphasizes the need for targeted health policies to improve life expectancy and reduce disparities.
Arupzhanov [6] (2024) demonstrates the effective use of machine learning to predict one-year mortality in chronic viral hepatitis patients using health data. Key risk factors include age, sex, hepatitis type, and ethnicity, highlighting the value of integrating clinical and demographic variables to improve mortality predictions.
According to Panzabekova and Digel [7], regional life expectancy in Kazakhstan was analyzed using panel data and a modified regression model. Their study found that economic factors were the most significant influencers, providing valu- able insights for forecasting and informing policies to improve population health.
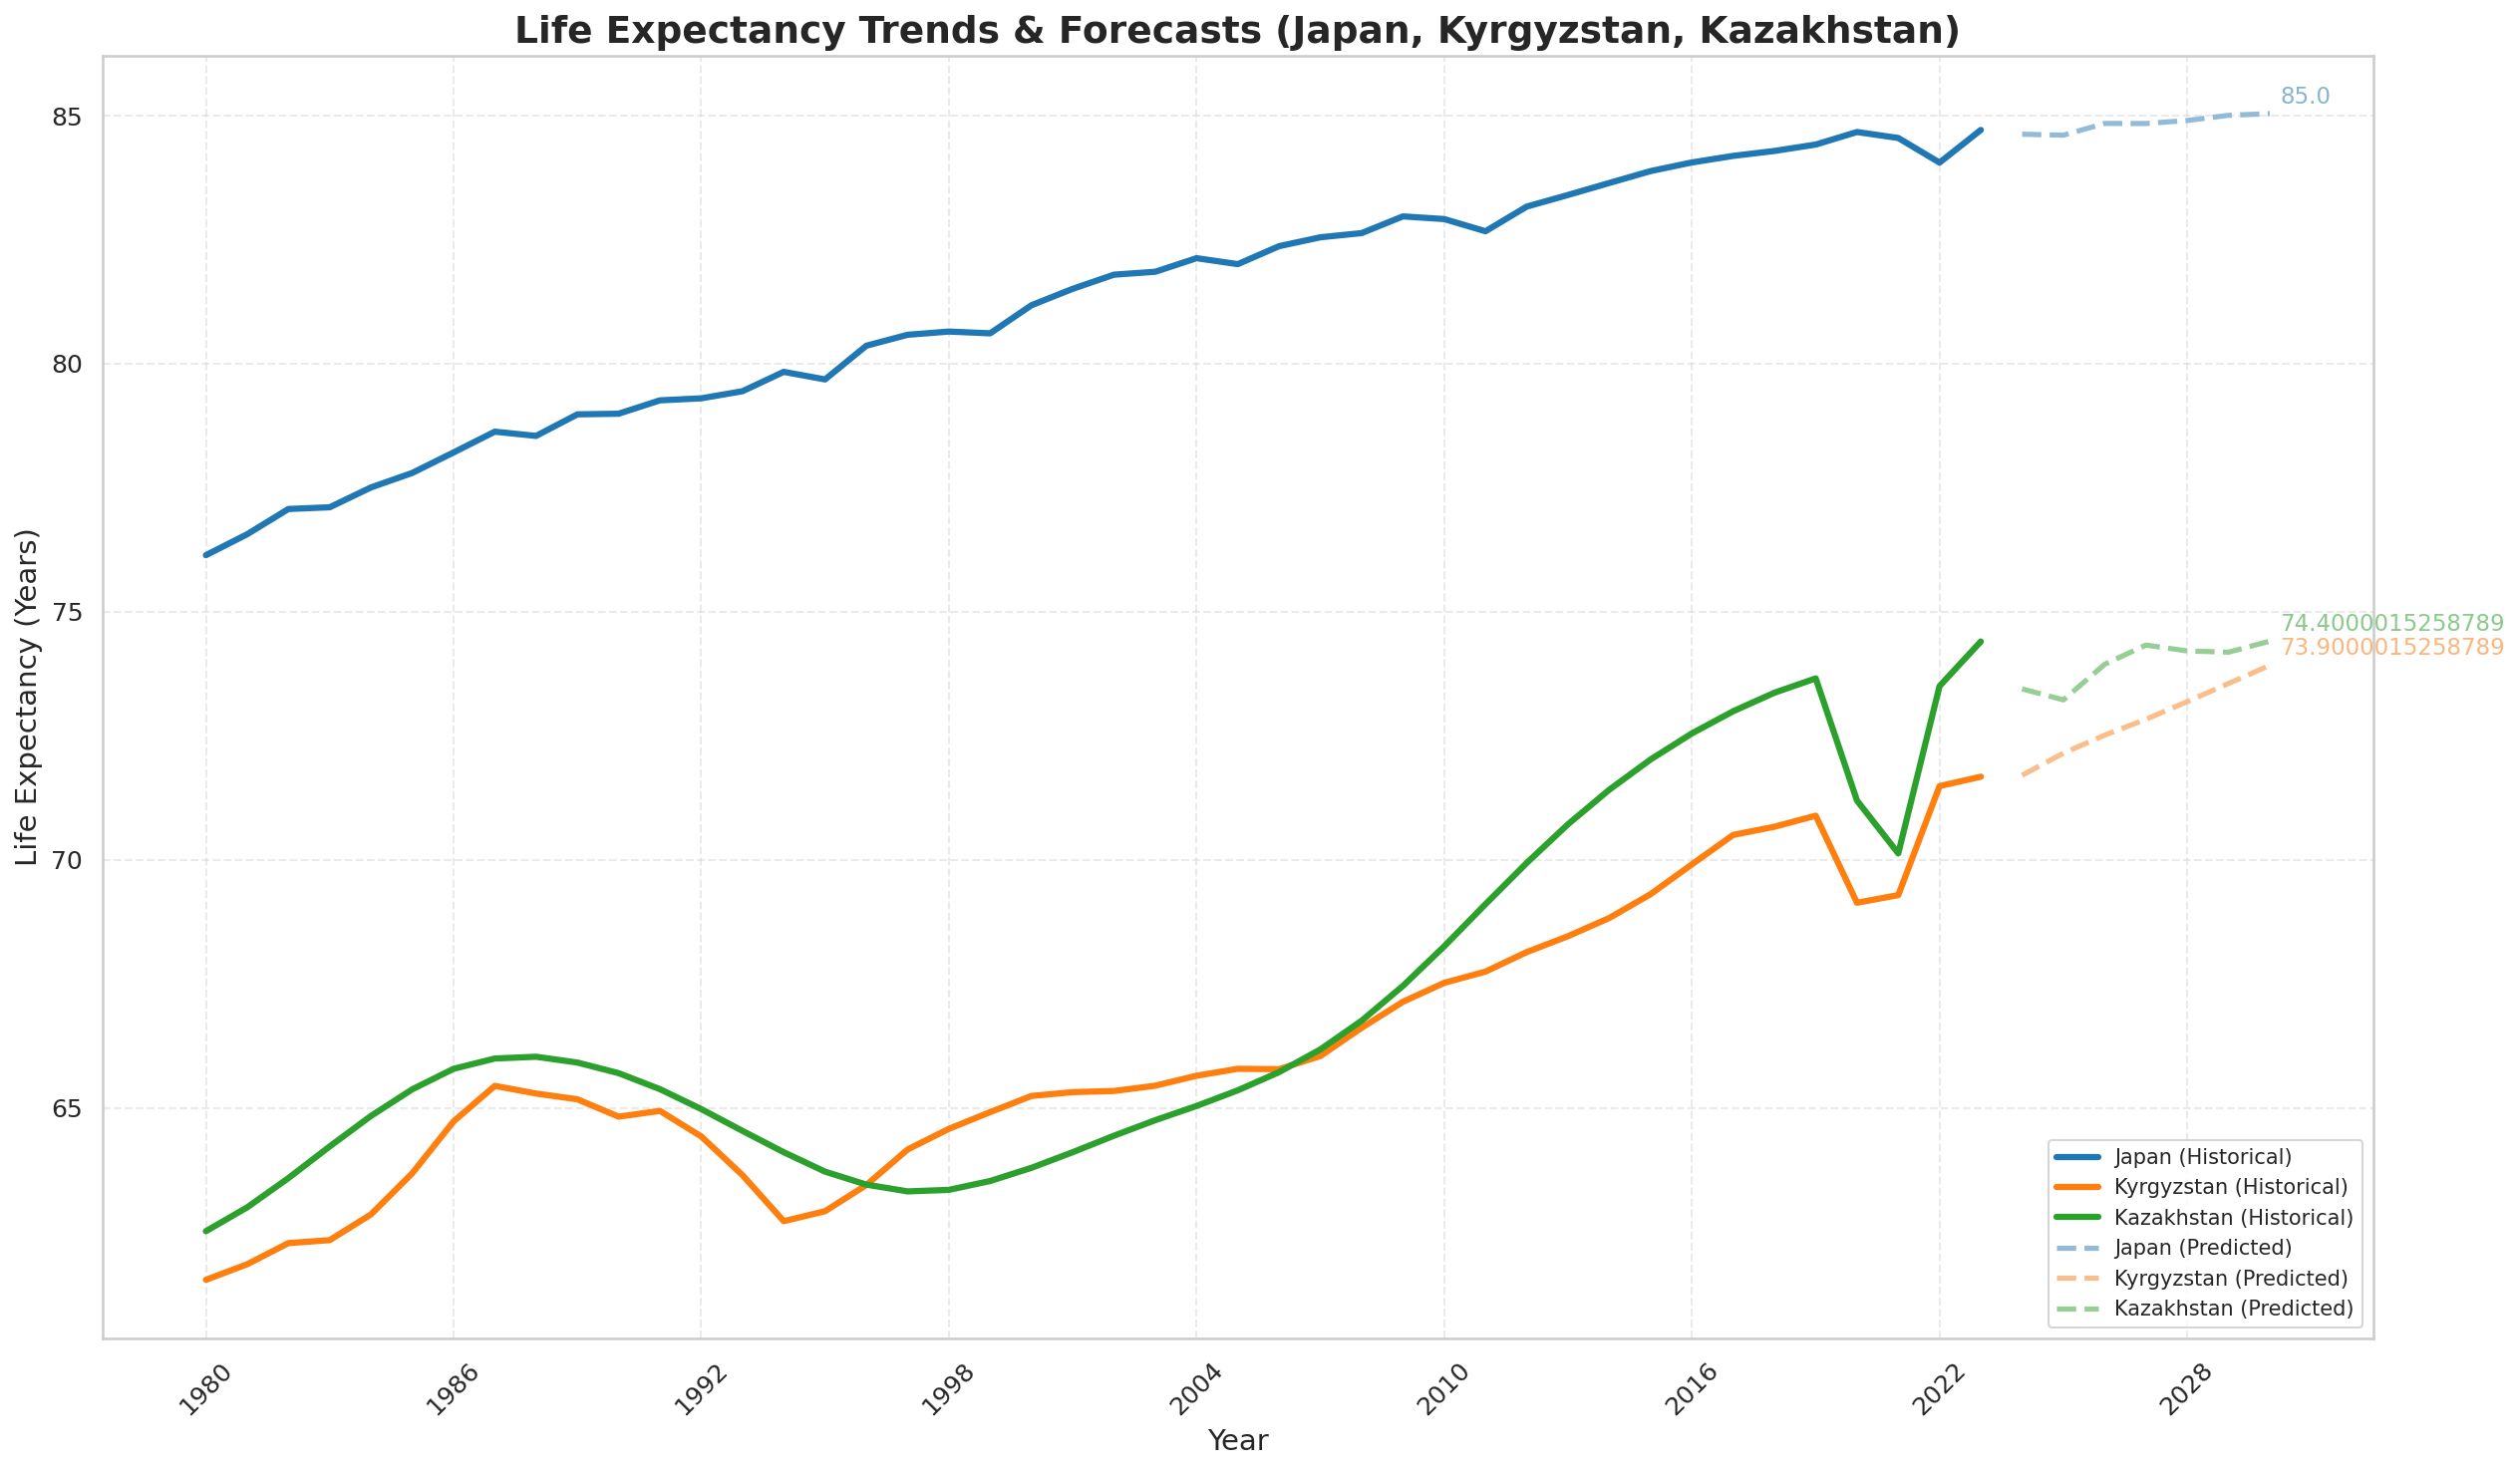
Below on Figure 1 and Figure 2 shown the trends of life expectancy and mortality (2000-2021) in these three countries :
Figure 1 illustrates the trends in life expectancy for Kyr- gyzstan, Kazakhstan, and Japan from 2000 to 2021. It visually represents how life expectancy has changed over the years in these three countries. The data indicates that Japan consistently maintains the highest life expectancy, reflecting its status as a developed country. In contrast, Kyrgyzstan and Kazakhstan, as developing countries, exhibit lower life expectancy rates, with variances indicating the influence of various health factors and socio-economic conditions over the years. Overall, the figure highlights the significant gap in life expectancy between developed and developing nations during the specified period.
Despite being a highly developed nation, Japan’s mortality rates appear elevated during certain periods, particularly in relation to its aging population and potentially unique health challenges faced by older adults. This underscores the com- plexity of health outcomes even in countries with advanced healthcare systems.
Further studies like Li [8] found that adopting five low- risk lifestyle factors—healthy diet, physical activity, no smok- ing, moderate alcohol consumption, and healthy BMI—could increase life expectancy by up to 14 years for women and 12 years for men in the U.S. They highlighted that smoking, physical activity, and diet had the greatest impact on reducing mortality risk, underscoring the importance of lifestyle inter- ventions in public health.
This study by Willcox [9] highlights the widening gender gap in life expectancy in Okinawa, Japan, between 1975 and 2005. It identifies that men have higher mortality rates, especially from cancer, cardiovascular disease, and suicide, driven by poorer health behaviors such as smoking, alcohol consumption, and obesity. The authors suggest that addressing these risk factors in men’s health should be a public health priority.
Study of Agarwal [10] emphasizes the impact of health and economic factors on life expectancy and disease occurrence. Key risk factors like adult mortality, GDP, healthcare expen- diture, and immunization rates significantly influenced life expectancy and disease prediction. Machine learning models, including Linear Regression for life expectancy and Decision Tree, Random Forest, and K-Nearest Neighbors for disease classification, were used to analyze and predict outcomes.
Modifiable lifestyle factors—smoking, alcohol consump- tion, and BMI—strongly impact life expectancy and mortality across countries. Japanese studies emphasize smoking cessa- tion and healthy habits as key to longer life, while Kazakhstan faces economic and health challenges needing targeted poli- cies,. Additionally, machine learning models improve mortal- ity predictions by integrating clinical and demographic data. Together, these insights reveal the vital role of lifestyle and socioeconomic factors in shaping health outcomes.
The study [11] is devoted to the analysis of factors af- fecting human health and life expectancy using mathematical modeling and modern data analysis methods. It examines how genetic, behavioral, and concomitant diseases affect the risks of disease and death. perevedi na angliyskiy continue studing papers on this topic we can stop at work [12] analyzes life expectancy in Russian regions using Rosstat data and compares it with global data from the World Bank. Using multiple regression and machine learning—especially gradient boosting, which achieved perfect classification (AUC= 1)—the study identifies key socio-economic factors like birth rate, infant mortality, unemployment, and population density that influence life expectancy. The results show that machine learning outperforms traditional regression in predicting life expectancy categories.
3. Methodology
Data Collection and Used Variables
We used a panel dataset (2000–2021) containing the fol- lowing independent and dependent variables for Kyrgyzstan, Japan, and Kazakhstan:
LEit = β0 + β1 · Alcit + β2 · Smkit + β3 · BMIit + εit

Table 1.
- Life Expectancy Regression.
| Name of Variable | Source |
|---|---|
|
Life expectancy - average life expectancy |
World Bank, Macrotrends (https://www.macrotrends.net/) |
|
Mortality rate - death rate per 1000 people |
Macrotrends (https://www.macrotrends.net/) |
|
Smoking (%)- percent- age of the adult population that smokes |
Our World in Data (https://ourworldindata.org/smoking ) World Health Organization (https://www.who.int/data/gho/data/ indicators/indicator-details/GHO/gho- tobacco-control-monitor-current-tobaccouse- tobaccosmoking-cigarrettesmoking-agestd- tobagestdcurr) |
|
Alcohol use (liters per capita) - annual alcohol consump- tion |
Our world in data (https://ourworldindata.org/alcohol-consumption) |
|
Average BMI - average Body Mass Index of the adult population. |
World health organization (https://www.who.int/data) |
Model 2 - Mortality Regression:
MRit = α0 + α1 · Alcit + α2 · Smkit + α3 · BMIit + µit
Where:
- i denotes the country (Kazakhstan, Kyrgyzstan, or Japan),
- t denotes the year (2000–2021),
- LEit is the life expectancy at birth in country i at time
t,
- MRit is the crude death rate per 1,000 people,
- Alcit is the annual alcohol consumption per capita (in liters),
- Smkit is the percentage of the adult population that smokes,
- BMIit represents the average Body Mass Index of the adult population,
- εit and µit are the error terms capturing unobserved factors.
Missing values and outliers are checked in the data to be used. The provided data contains missing values, as some countries do not have statistics for certain variables. Therefore, the missing values will be omitted from the analysis. Addi- tionally, smoking rates data was unavailable for a few years, so interpolation was used for the more recent years. The same method was applied for alcohol use and average BMI.
Methodology
We used multiple linear regression analysis to assess the relationships between the independent variables (alcohol use,
4. Results
This section presents a comprehensive overview of the descriptive statistics and regression analysis results regarding the impact of key lifestyle risk factors—smoking, alcohol con- sumption, and Body Mass Index (BMI)—on life expectancy and mortality rates in Kyrgyzstan, Kazakhstan, and Japan from 2000 to 2021.
Table 2.
Average Health Indicators by Country (2000–2021).
| Country | Life Exp. (Yrs) | Mortality (/1000) | Smoking (%) | Alcohol (L) | BMI |
|---|---|---|---|---|---|
| Japan | 82.4 | 9.3 | 19.5 | 7.2 | 22.8 |
| Kazakhstan | 69.1 | 10.8 | 26.3 | 10.1 | 25.6 |
| Kyrgyzstan | 70.5 | 8.7 | 27.8 | 6.5 | 24.3 |
Table II provides a summary of the average life expectancy, mortality rate, and key health-related risk factors—smoking, alcohol consumption, and BMI—for Japan, Kazakhstan, and Kyrgyzstan between 2000 and 2021. Japan, as a developed country, shows the highest average life expectancy (82.4 years) and a moderate mortality rate (9.3 per 1000 people), alongside lower smoking rates and BMI compared to the other two coun- tries. Kazakhstan and Kyrgyzstan, representing developing countries, report significantly lower life expectancies (69.1 and 70.5 years, respectively). Notably, Kyrgyzstan has the highest smoking rate (27.8(%), while Kazakhstan has the highest alcohol consumption (10.1 liters per capita) and BMI (25.6). These differences suggest a possible link between higher levels of risk factors and reduced life expectancy in the Central Asian countries compared to Japan.
The analyses were performed separately for each of the three countries in the study. We begin by focusing on Kyrgyzs- tan, providing separate regression models for life expectancy and mortality. Table III displays the estimated coefficients for the life expectancy model, while the table IV summarizes the results for the mortality model. These findings offer insight into the extent to which behavioral factors influence public health outcomes in Kyrgyzstan.
Table 3.
Multiple Regression Results for Kyrgyzstan – Life. EXPECTANCY (2000–2021)
| Variables | Coef | P>—t— | Std. Err | t |
|---|---|---|---|---|
| Smoking (%) | -1.6963 | 0.011 | 0.376 | -4.508 |
| Alcohol (L) | -0.4888 | 0.184 | 0.305 | -1.603 |
| Average BMI | -0.1366 | 0.495 | 0.182 | -0.751 |
Table 4.
Multiple Regression Results for Kyrgyzstan – Mortality. (2000–2021).
| Variables | Coef | Std. Err | t | P>—t— |
|---|---|---|---|---|
| Smoking (%) | 0.6513 | 0.164 | 3.97 | 0.017 |
| Alcohol (L) | 0.2546 | 0.133 | 1.92 | 0.128 |
| Average BMI | 0.1031 | 0.079 | 1.30 | 0.263 |
Regression results for Kyrgyzstan show that smoking sig- nificantly decreases life expectancy (coef = -1.6963, p =
Table 5.
Multiple Regression Results for Kazakhstan – Life EXPECTANCY (2000–2021).
| Variables | Coef | Std. Err | t | P>—t— |
|---|---|---|---|---|
| Smoking (%) | -0.3641 | 1.101 | -0.33 | 0.763 |
| Alcohol (L) | -1.1087 | 2.790 | -0.40 | 0.718 |
| Average BMI | -0.6925 | 1.601 | -0.43 | 0.694 |
Table 6.
Multiple Regression Results for Kazakhstan – Mortality. (2000–2021).
| Variables | Coef | Std. Err | t | P>—t— |
|---|---|---|---|---|
| Smoking (%) | 0.3726 | 0.108 | 3.45 | 0.041 |
| Alcohol (L) | -0.0969 | 0.274 | -0.35 | 0.747 |
| Average BMI | -0.0150 | 0.157 | -0.10 | 0.930 |
Table 7.
Multiple Regression Results for Japan – Life Expectancy. (2000–2021).
| Variables | Coef | Std. Err | t | P>—t— |
|---|---|---|---|---|
| Smoking (%) | -0.3085 | 0.179 | -1.720 | 0.184 |
| Alcohol (L) | 0.2987 | 0.613 | 0.487 | 0.659 |
| Average BMI | -0.0365 | 0.288 | -0.127 | 0.907 |
Table 8.
Multiple Regression Results for Japan – Mortality (2000–2021).
| Variables | Coef | Std. Err | t | P>—t— |
|---|---|---|---|---|
| Smoking (%) | 0.0608 | 0.265 | 0.230 | 0.833 |
| Alcohol (L) | 0.1791 | 0.905 | 0.198 | 0.856 |
| Average BMI | 0.5199 | 0.425 | 1.224 | 0.308 |
0.011) and increases mortality (coef = 0.6513, p = 0.017), while alcohol consumption and BMI do not show statistically significant effects. In Kazakhstan, none of the lifestyle factors significantly affect life expectancy or mortality at conventional levels, suggesting other underlying factors may be influential. For Japan, none of the variables reached statistical significance in impacting life expectancy or mortality during 2000–2021, though smoking showed a negative, albeit non-significant, effect on life expectancy.
These results suggest that behavioral risk factors, particu- larly smoking, have a strong adverse effect on health outcomes in Kyrgyzstan, while their influence appears weaker or more complex in Kazakhstan and Japan.
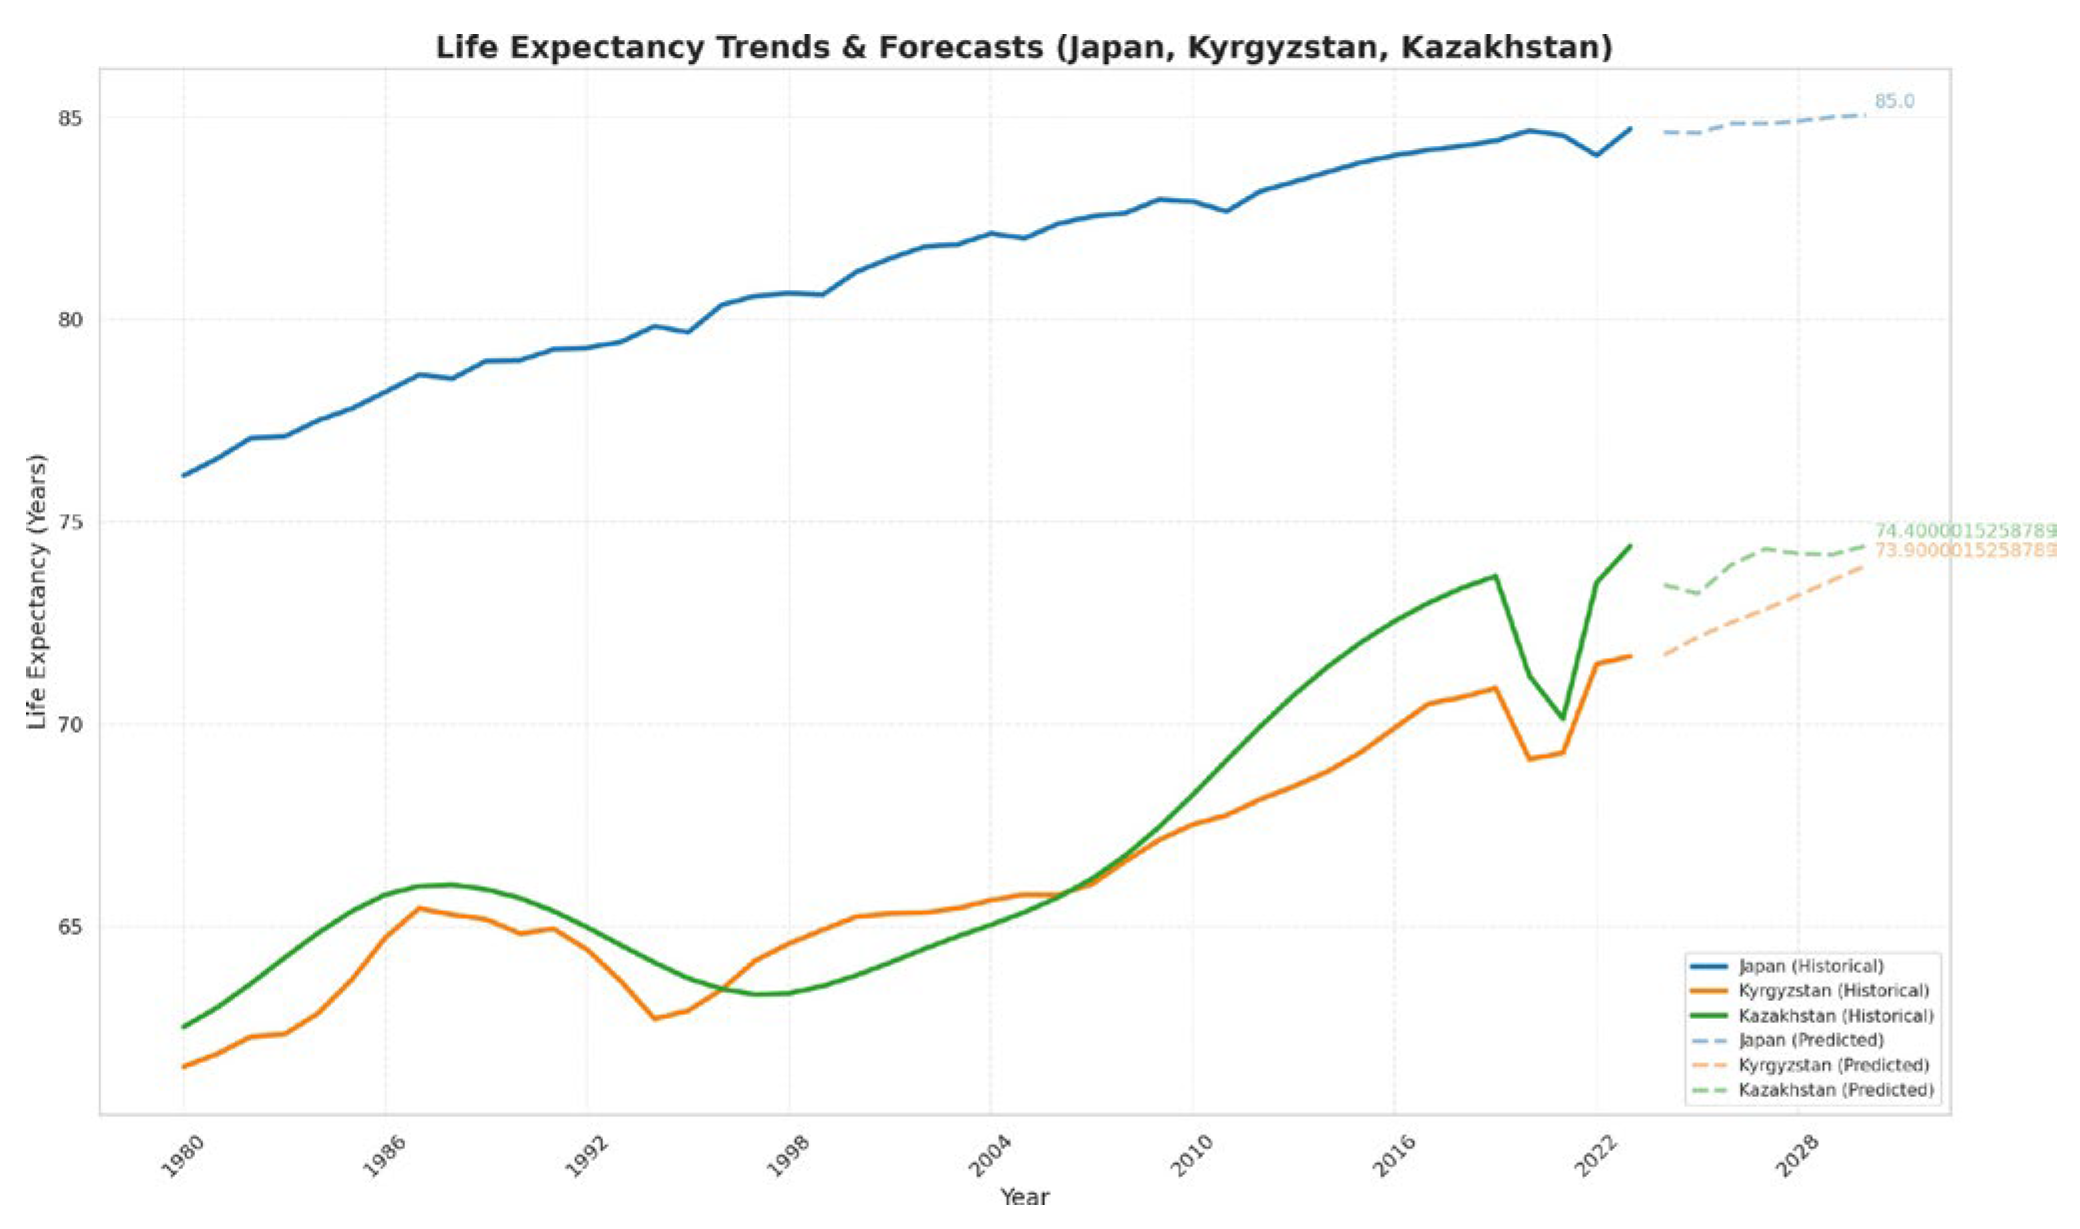
Prediction
Figure 3 presents the predicted trends of life expectancy in Kyrgyzstan, Kazakhstan, and Japan for next years, till 2030, obtained through LSTM (Long Short-Term Memory) deep learning models. As shown in the figure, Japan’s life ex- pectancy continues to grow gradually but with small changes. While the change is modest, this indicates a consistent upward trend in population longevity, reflecting Japan’s advanced healthcare and health promotion policies.
Similarly, in Kyrgyzstan and Kazakhstan, the prediction show a slow but persistent increase in life expectancy, suggest- ing ongoing improvements in health outcomes. However, the longevity age of these increases is smaller compared to Japan, highlighting the persistent disparities between developed and developing countries.
Alongside life expectancy, the figure illustrates the projected trajectories of key lifestyle risk factors, particularly smoking rates, BMI, and alcohol consumption. In Kyrgyzstan, the smoking prevalence remains relatively high and shows little change in the forecast period. BMI remains elevated, indicat- ing ongoing concerns around obesity, which is associated with non-communicable diseases and mortality.
In Kazakhstan, the projections suggest stable or slightly declining smoking rates, but alcohol consumption remains a concern, potentially influencing future health outcomes.
In Japan, smoking rates are already low and continue to decrease slightly, contributing to the steady increase in life expectancy, but the percentage of alcohol use is higher than in Kyrgyzstan and Kazakhstan. The relatively small but consistent growth in predicted life expectancy underscores the importance of maintaining health promotion efforts.
Overall, these projections emphasize that while progress is evident, especially in developed countries like Japan, sustained efforts targeting lifestyle risk factors such as smoking, obe- sity, and alcohol consumption are necessary to achieve more substantial improvements in life expectancy, particularly in Kyrgyzstan and Kazakhstan.
5. Conclusions
This study provides a comparative analysis of the impact of key lifestyle risk factors—smoking, alcohol consumption, and Body Mass Index (BMI)—on life expectancy and mortality in Kyrgyzstan, Kazakhstan, and Japan over the period from 2000 to 2021. The results highlight notable differences in how these factors influence health outcomes across countries at varying stages of socioeconomic and healthcare development.
Smoking was identified as the most significant and consis- tent risk factor in Kyrgyzstan, where it significantly decreases life expectancy and increases mortality rates. This finding emphasizes the critical need for robust tobacco control policies and public health initiatives focused on smoking cessation in Kyrgyzstan. The lack of statistically significant effects from smoking, alcohol use, and BMI on life expectancy and mortality in Kazakhstan suggests potential influences from other social determinants or limitations in measured variables, indicating the complexity of health outcomes within the country. In Japan, despite non-significant statistical results in this timeframe, lower smoking prevalence and healthier lifestyle behaviors likely contribute to its substantially higher life expectancy and lower mortality rates, reaffirming the importance of sustained health promotion efforts in developed contexts. The result of prediction which done by using ML method- LSTM shows that that next 10 years will be slowly grow the life expectancy.
Overall, integrating predictive analytics into public health frameworks offers a powerful approach to reducing mortal- ity, extending life expectancy, and achieving better health outcomes globally—especially in developing countries where resource constraints and health disparities remain pressing issues.
References
- Ministry of Health, Labour and Welfare (2010) Abridged life tables for Japan 2009. Tokyo: Ministry of Health, Labour and Welfare.
- Tsuji I. (2020). Epidemiologic Research on Healthy Life Expectancy and Proposal for Its Extension: A Revised English Version of Japanese in the Journal of the Japan Medical Association 2019;148(9):1781-4. JMA journal, 3(3), 149–153. [CrossRef]
- Higashibata, T., Wakai, K., Okada, R., Nakagawa, H., Hamajima, N. (2016). Associations of smoking status with other lifestyle behaviors are modified by sex and occupational category among urban civil servants in Japan. Environmental health and preventive medicine, 21(6), 539–546. [CrossRef]
- Tamakoshi, A., Kawado, M., Ozasa, K., Tamakoshi, K., Lin, Y., Yagyu, K., Kikuchi, S., Hashimoto, S., JACC Study Group (2010). Impact of smoking and other lifestyle factors on life expectancy among japanese: findings from the Japan Collaborative Cohort (JACC) Study. Journal of epidemiology, 20(5), 370–376. [CrossRef]
- -Kosherbayeva, L., Akhtayeva, N., Tolganbayeva, K., Samambayeva, (2024). Trends in Avoidable Mortality in Kazakhstan From 2015 to 2021. International journal of health policy and management, 13, 7919. [CrossRef]
- Arupzhanov, I., Syssoyev, D., Alimbayev, A., Zhakhina, G., Sakko, Y., Yerdessov, S., Zollanvari, A., Gaipov, A. (2024). One-year mortality prediction of patients with hepatitis in Kazakhstan based on adminis- trative health data: A machine learning approach. Electronic Journal of General Medicine, 21(6), em618. [CrossRef]
- Aksanat Zh. Panzabekova Ivan E. Digel, 2020. ”Factors affecting life expectancy in Kazakhstan,” R-Economy, Ural Federal University, Graduate School of Economics and Management, vol. 6(4), pages 261- 270.
- Li, Y., Pan, A., Wang, D. D., Liu, X., Dhana, K., Franco, O. H., Kaptoge, S., Di Angelantonio, E., Stampfer, M., Willett, W. C., Hu, F. B. (2018). Impact of Healthy Lifestyle Factors on Life Expectancies in the US Population. Circulation, 138(4), 345–355. [CrossRef]
- Willcox, D.C., Willcox, B., Yasura, S., Ashitomi, I., Suzuki, M. (2012). Gender gap in healthspan and life expectancy in Okinawa: health behaviours.
- Agarwal, Palak Shetty, Navisha Jhajharia, Dr Aggarwal, Gau- rav Sharma, Neha. (2019). Machine Learning For Prognosis of Life Expectancy and Diseases. International Journal of Innovative Technology and Exploring Engineering. 8. 1765-1771. [CrossRef]
- Mikhalsky, A. I., Tsurko, V. V. (2018). Data modeling in the analysis of health risks and human life expectancy. Automation and Telemechanics, (10), 164-182.
- Borisova, L. R. (2021). ANALYSIS OF LIFE EXPECTANCY IN THE REGIONS OF THE RUSSIAN FEDERATION USING MACHINE LEARNING AND REGRESSION ANALYSIS METHODS. Modern Mathematics and Concepts of Innovative Mathematical Education, 8(1), 224-230.
Figure 1.
Life Expectancy trends in Kyrgyzstan, Kazakhstan, and Japan (2000–2021).
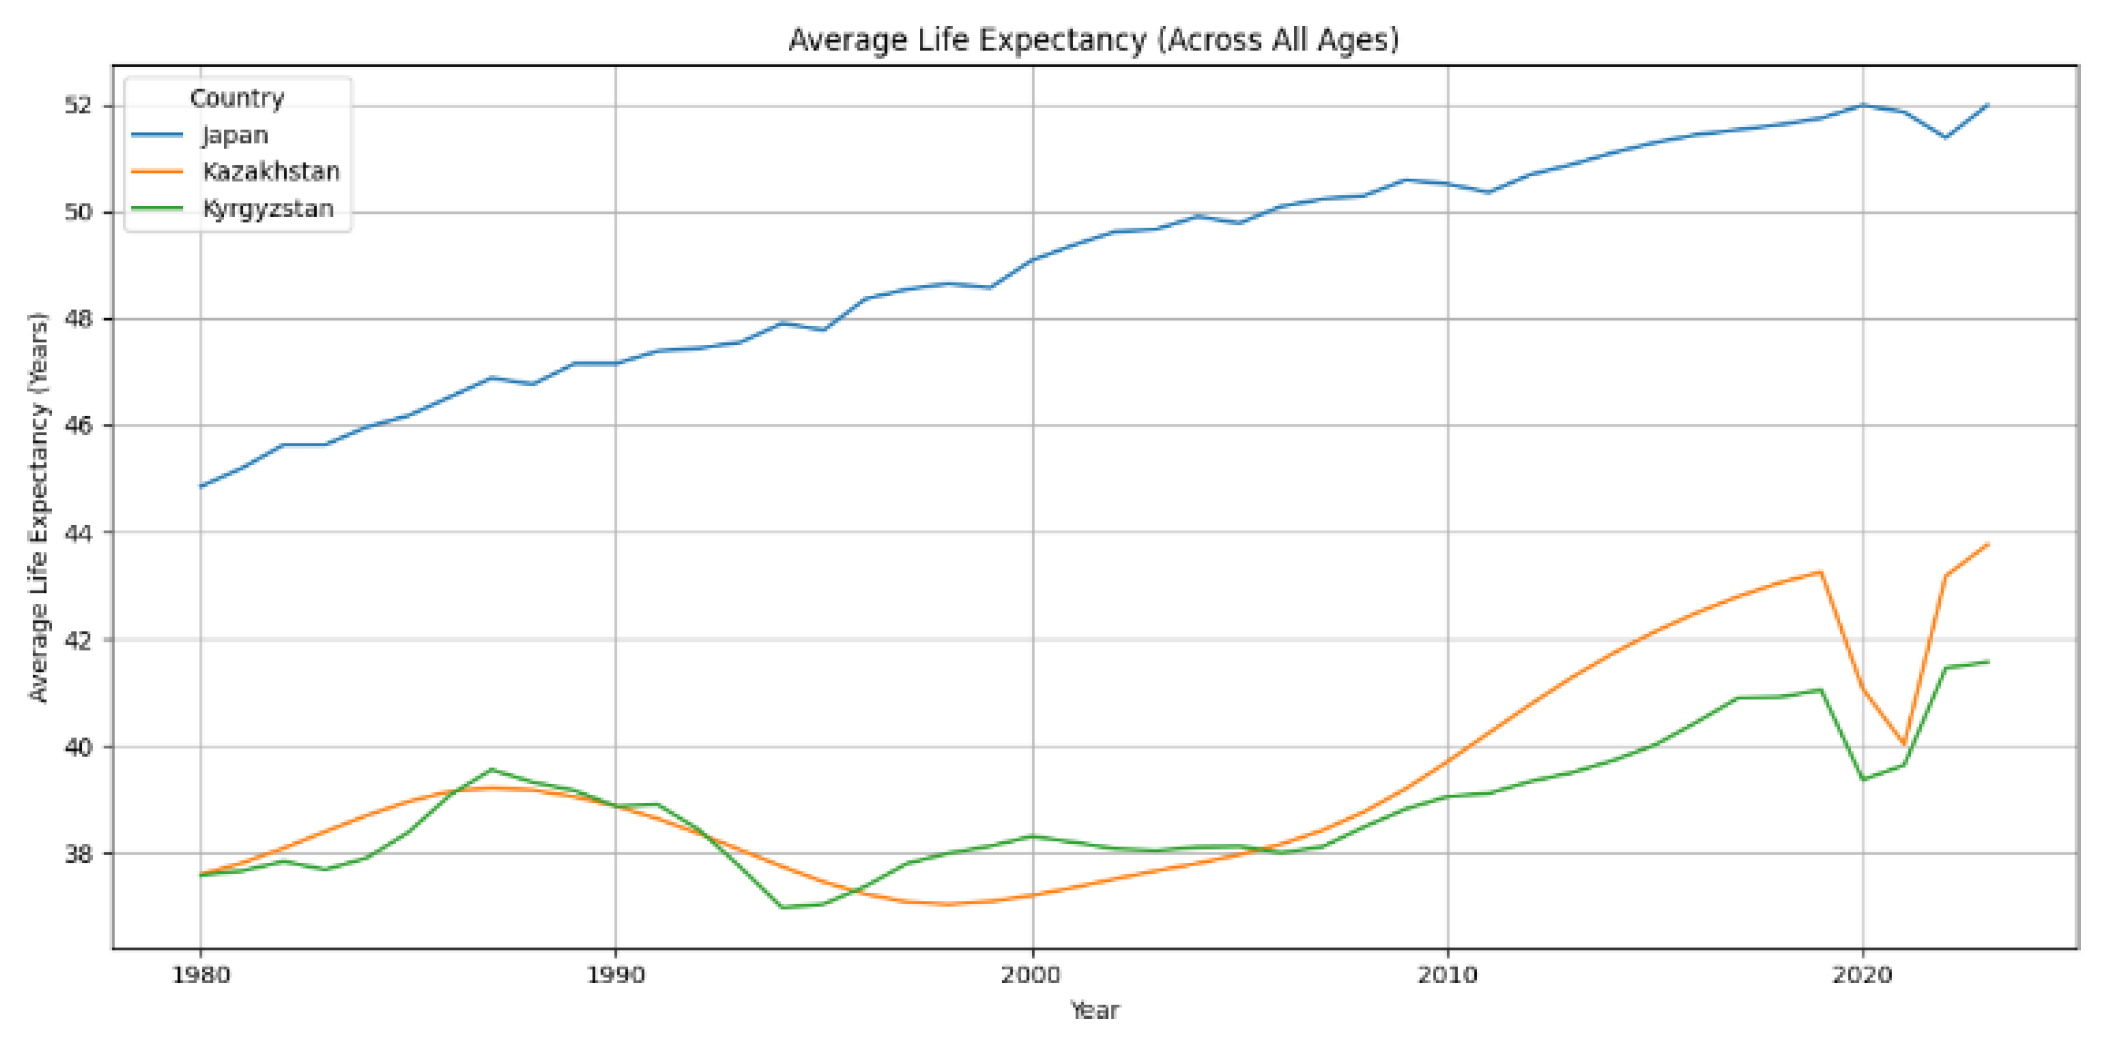
Figure 2.
Mortality Over Time in Kyrgyzstan, Kazakhstan, and Japan (2000–2021). World Health Organization, Macrotrends (https://www.who.int/data/gho/data),(https://www.macrotrends.net).
Figure 2.
Mortality Over Time in Kyrgyzstan, Kazakhstan, and Japan (2000–2021). World Health Organization, Macrotrends (https://www.who.int/data/gho/data),(https://www.macrotrends.net).
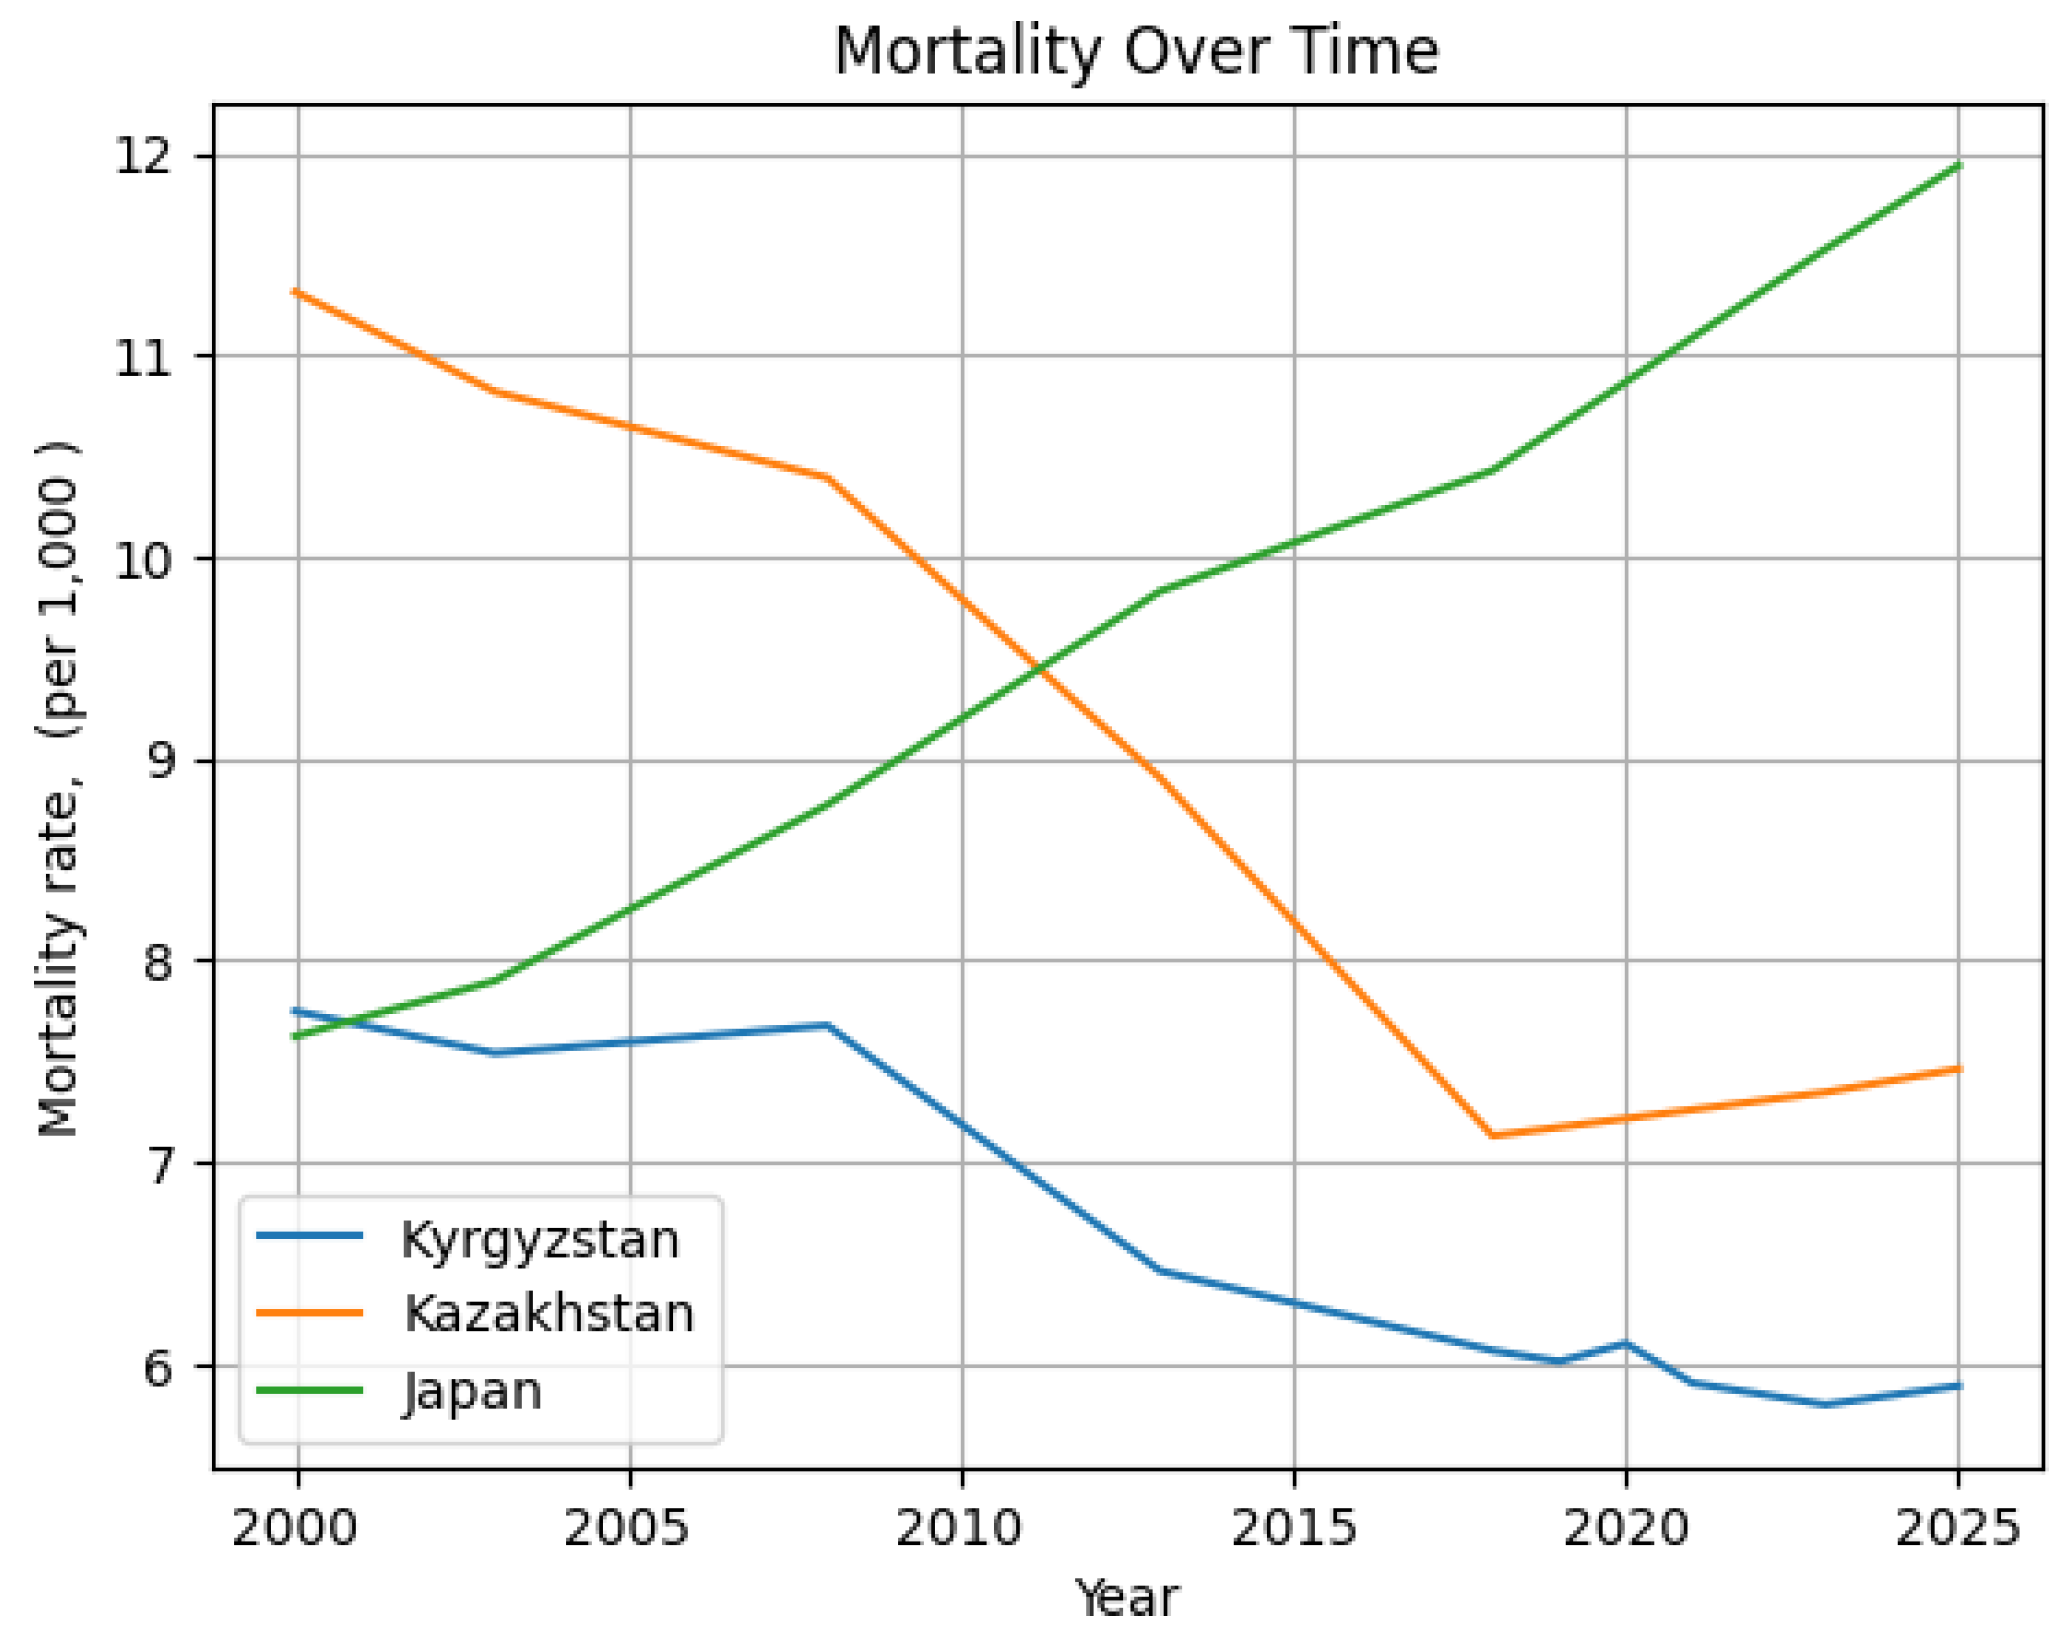
Figure 3.
Life Expectancy trends in Kyrgyzstan, Kazakhstan, and Japan (2000–2021).
Disclaimer/Publisher’s Note: The statements, opinions and data contained in all publications are solely those of the individual author(s) and contributor(s) and not of MDPI and/or the editor(s). MDPI and/or the editor(s) disclaim responsibility for any injury to people or property resulting from any ideas, methods, instructions or products referred to in the content. |
© 2025 by the authors. Licensee MDPI, Basel, Switzerland. This article is an open access article distributed under the terms and conditions of the Creative Commons Attribution (CC BY) license (http://creativecommons.org/licenses/by/4.0/).
Copyright: This open access article is published under a Creative Commons CC BY 4.0 license, which permit the free download, distribution, and reuse, provided that the author and preprint are cited in any reuse.


