
Submitted:
30 May 2025
Posted:
30 May 2025
You are already at the latest version
Abstract
The surface modification of zinc oxide nanoparticles (ZnONPs) with organic compounds has been shown to improve their dispersibility. In this study, to develop a highly functional material, ZnONP modified with 6-amino-1-hexanol bearing both amino and hydroxyl functional groups was synthesized. Scanning electron microscopy–energy dispersive X-ray spectroscopy (SEM-EDS) and X-ray photoelectron spectroscopy (XPS) analyses confirmed that functionalized ZnONP was successfully obtained by a hydrothermal synthetic method. The mechanical properties of composite films of polylactic acid (PLA) reinforced with the functionalized ZnONP were then evaluated. The composite containing functionalized ZnONP exhibited a higher maximum stress than that containing unmodified ZnONP. These ZnONP/polymer composites therefore show promise as novel high-performance materials.
Keywords:
zinc oxide
; bioplastics
; surface modification
; nanoparticles
; hydrothermal synthesis
; composites
1. Introduction
Metal oxides [1,2,3,4] such as ZnO, TiO2, and NiO have a wide range of applications in electronic devices, energy-storage systems, and structural materials. Among them, ZnO has been used in everyday products and biomedical applications because of its UV absorption [5,6], antibacterial properties [7], biocompatibility [8,9], and affordability. To maximize its potential, a ZnO nanoparticle (ZnONP) have attracted intense interest for use in cosmetics, industrial films, and paints due to their UV-shielding ability [10,11,12,13,14,15]. Surface modification of ZnONP has been employed to prevent aggregation of fine particles and stabilize the suspension [7,11,16,17]. Moreover, functionalizing the ZnONP surface has enabled the creation of high-value-added materials. For example, Kumar and co-workers demonstrated control of oxidative stress in bacteria using ZnONP with surface-adsorbed isopropylamine, and a material for a biosensor was fabricated by chemically modifying ZnONP with triethanolamine to improve stability [18]. Although high-performance ZnONP has been produced through surface functionalization, their practical applications remain limited because they often respond selectively to a specific substrate.
Numerous synthetic methods for ZnONP have been developed [19,20,21,22,23,24,25,26,27,28,29,30,31,32,33,34,35,36,37,38,39]. For example, commonly used methods are sol-gel [19,20], hydrothermal [21,22,23], wet-chemical [24,25], and spray-pyrolysis [26,27] techniques. The hydrothermal method is particularly attractive because it is sustainable, operates at relatively low temperatures, and requires short processing times. Using this approach, chemical modification of ZnONP with hexanol has also been reported [23]. Nevertheless, comprehensive studies on creating high-value-added ZnONPs through surface functionalization are still scarce.
In this work, we synthesized surface-functionalized ZnONP by the hydrothermal method and explored its use as a reinforcing filler in composite materials. Our goal was to obtain high-strength polymer materials through interactions between the polymer matrix and the functionalized ZnONP. We chose 6-amino-1-hexanol (6AH) as the modifier because its amino group would donate hydrogen bonds, and we selected polylactic acid (PLA) as the polymer matrix because its carbonyl oxygen atom would accept hydrogen bonds (Figure 1). PLA is a biodegradable polymer and therefore offers potential for eco-friendly materials. Because supramolecular interactions are highly versatile, introducing modifiers with diverse chemical structures should open the way to a wide variety of functional composites.
2. Materials and Methods
2.1. Reagents
Reagents used for the experiments were purchased from Fujifilm Wako Pure Chemical Industries, Ltd., and used without further purification.
2.2. Syntheses of Surface-Modified ZnONPs
Syntheses of ZnONPs were conducted by modifying the previously reported hydrothermal method [23]. Zn(NO3)2∙6H2O (2.97 g, 10.0 mol) and KOH (1.12 g, 20.0 mol) were added in an autoclave. In the case of surface modifications, 6AH (6.23 g, 53.2 mmol) or 1-hexanol (6.67 mL, 53.2 mmol) was also added as a modifier. The autoclave was kept in an oven at a constant temperature (80 or 120 °C) for a fixed duration (1 or 24 h), subsequently, the product was collected by centrifugation (3500 rpm for 10 min) and washed with water for the sample without using the modifier or ethanol and water for that with the modifier.
2.3. Structural Analysis of ZnONP Samples
X-ray diffraction (XRD) measurements were carried out with a SmartLab 3 fully automated multipurpose diffractometer (Rigaku Corp.). The wavelength used for the measurement was CuKα radiation. The crystallite size was averaged at three representative peaks observed within 2θ from 30° to 40°.
2.4. Evaluations of Surface Modification
Scanning electron microscopy (SEM) coupled with energy-dispersive X-ray spectroscopy (EDS) was performed on a JSM-IT200 (Keyence Corp.). In the case of SEM measurements for organic samples, each sample was Au ion coated by using an IB-2 ion coater (Eiko Corporation) for charge prevention. For the observation of ZnONP, the sample was prepared by attaching carbon tape to a brass sample stage and mounting the sample on it. For the observation of film, the sample was prepared by attaching a brass sample stage for cross-sectional observation, carbon tape, and fixing the film. ZnONPs were analyzed by SEM-EDS using a secondary electron detector (SED) at an accelerating voltage of 20.0 kV, a working distance (WD) of 10.5 mm under high vacuum conditions. Cross-sectional SEM-EDS analysis of the film was performed using a backscattered electron detector (BED-S) at an accelerating voltage of 15.0 kV, a working distance (WD) of 10.4 mm under low vacuum conditions. X-ray photoelectron spectroscopy (XPS) data were collected on a JPS-9200 photoelectron spectrometer (JEOL Ltd.). XPS samples were prepared by attaching a paste of In to an Al plate cut in 50 mm × 50 mm size and then embedding ZnONP samples on top of the paste. The XPS spectrum was measured using monochromatic X-rays (Al). Before XPS measurements, each sample was Au ion coated by using an IB-2 ion coater (Eiko Corporation). The binding energy scale was calibulated with reference to the Au 4f7/2 at 84.0 eV [40].
2.5. Preparations of PLA Composite Films
ZnONP/PLA composite films were prepared by melting PLA on a hot plate at 220 °C and mechanically mixing ZnONPs of 0, 0.5, 1, 2, and 5 wt%. Subsequently, films were prepared by heating at 200 °C with pressure under 10 MPa. Figure S1 shows the appearance of the films.
2.6. Tensile Testing of Films
Tensile tests were conducted on an EZ-SX tester (EZ Test series, Shimadzu Corp.). To fit into the tensile strength tester, the films were cut to 5 mm × 50 mm using a cutter. The Young’s modulus (E) of the film was determined from the equation , where W is the applied load measured during the tensile test, A is the cross-sectional area of the sample, X is the elongation, and L is the initial gauge length. The load (W) and elongation (X) were obtained from tensile test data. The cross-sectional area (A) was calculated by multiplying the film width (5 mm) with its thickness, measured using a film thickness meter. The gauge length (L) was set to 10 mm for all samples. Stress and strain were defined as W/A and X/L, respectively, and the stress–strain curve was constructed from the tensile test results. The values of the mechanical properties of each film were the averages of 10 test pieces.
2.7. Water Repellency Test for Films
Static contact angles were measured with a Drop Master system (Kyowa Interface Science Co., Ltd.). All pictures were taken within 10 seconds after dropping water on the film surface. The values of the contact angles of each film were the averages of 5 test pieces.
2.8. Analyses for Particle Distribution in the Composite Film
Image analysis was performed by MATLAB. Five images were analyzed for each sample. The binarized images were obtained using the following procedure: the original image was first converted to grayscale to transform color information into luminance values; a Gaussian filter (σ = 2) was then applied to suppress noise; adaptive thresholding, which determines local thresholds based on the neighborhood intensity distribution, was used to robustly extract target regions under varying illumination conditions; morphological erosion was subsequently applied to remove small artifacts and protrusions; finally, a hole-filling process was performed to close internal cavities within the segmented regions.
3. Results and Discussion
3.1. Structural Analyses of Products
Surface-modified ZnONPs were synthesized under four conditions: 80 or 120 °C for 1 or 24 h. In the paper, we represent the sample as ZnONP-temp.-time, such as ZnONP-80-24. XRD patterns confirmed that every sample crystallized as single-phase hexagonal wurtzite-type ZnO [41] (Figure 2 and Figure S2). In Table S1, their crystallite sizes are summarized.
3.2. Evaluations of Surface Modification
Next, SEM-EDS analyses were carried out to examine particle morphology and elemental distribution. Figure 3a–e and Figure S3a presents SEM images, and Figure 3f–j and Figure S3b–d shows the corresponding EDS mapping for carbon, zinc, and oxygen. Although fine primary particles were present in all samples, they formed micrometer-scale agglomerates, likely during drying. In all cases, zinc and oxygen signals were detected. On the other hand, carbon signals appeared only in the samples modified with 6AH, while unmodified ZnO showed no surface carbon. Because the modifier was the only carbon source, these results confirm successful surface modification under all conditions for the 6AH and 1-hexanol modification.
XPS measurements were conducted to confirm the chemical modification of 6AH on the ZnONP surface. Figure 4 and Figure S4 present the XPS spectra of the O 1s and Zn 2p1/2 regions, respectively. As shown in Figure S4, the Zn 2p1/2 peak positions for all samples matched previously reported values [42]. Reported binding energies for bulk oxygen, surface hydroxyl oxygen, and carbon-bonded oxygen are 530.6, 531.4, and 533.1 eV, respectively [42]. Each O 1s spectrum was deconvoluted into three components by Gaussian–Lorentzian fitting using these reference values. The resulting binding energies and peak area ratios are summarized in Table 1. For unmodified ZnONP (Figure 4a), peaks at 530.8 and 531.5 eV correspond to bulk and surface oxygen, respectively, whereas the component attributable to carbon-bonded oxygen was too weak to appear as a distinct peak. In contrast, all 6AH-modified samples exhibited three components assigned to bulk, surface, and carbon-bonded oxygen, indicating successful chemical modification. Quantitative evaluation based on the relative areas of the three peaks showed modification ratios below 10% for every temperature/time combination, with no systematic dependence on either parameter. For the 1-hexanol modification, a similar XPS analysis at O 1s region was performed (Figure S5). Its modification ratio was estimated to be 8.8%, which was similar to that obtained with the 6AH modifications.
3.3. Functional Evaluations of Composite Films
The reinforcing potential of the surface-modified particles was assessed in PLA composite films. Figure S1 shows the appearance of the films: the neat PLA was uniform and transparent, whereas the ZnONP-containing films were opaque. Mechanical properties were measured by tensile testing. Representative stress–strain curves are displayed in Figure S6, and elastic modulus, maximum stress, and elongation at break plotted against ZnONP content in Figure 5. Incorporation of ZnONPs, whether functionalized or not, generally increased the tensile modulus and reduced elongation at break relative to neat PLA, indicating reduced deformability. Regarding maximum stress, functionalized ZnONP provided higher strength than unmodified ZnONP at loadings ≤ 2 wt%. Although no clear correlation emerged between the XPS-determined functionalization ratio (Table 1) and film strength, the mechanical trends were consistent across all synthesis conditions without 5 wt% containing films. Although this study could not fully elucidate the mechanical properties of the composites, the intermolecular interactions between the functional groups and polymer matrix likely affected the mechanical performance. In the film containing 5 wt%, large variations were observed, and the average values differed significantly depending on the synthetic conditions.
Subsequently, the composite using 6AH-ZnONP, which was synthesized at 120 °C for 1 h and exhibited distinct mechanical properties, was subjected to a detailed analysis of its film interior to evaluate the dispersibility of ZnONPs. Figure 6a–d, and 6e shows the SEM images and corresponding EDS mappings of Zn from the cross-sections of the composite films with 6AH-ZnONP at 1 and 5 wt% ratios. The regions where Zn was detected were identified as corresponding to particles. The particle size was evaluated by image analyses based on binarization of the data. Details of the binarization method are provided in the Materials and Methods section. A representative binarized EDS mapping image is shown in Figure 6c,f. A histogram of the particle area was fabricated based on the Zn mapping processed by binarization (Figure 7). The ratios of nanometer-sized particle, that is below 1 μm², for the composites with 1 and 5 wt% of modified ZnONP were estimated to be 0.69 and 0.71, respectively. In addition, the average particle area was estimated to be 0.54 ± 1.04 µm² for the film with 1 wt% of ZnONP. In contrast, in the film containing 5 wt% ZnONP, it was 0.31 ± 1.24 µm². The higher variance suggests that, despite the decrease in average particle size, the larger particles increased probably due to aggregation in the case of 5 wt%.
Contact angle measurements were carried out to assess the water repellency of the composite surfaces. Side-view images of water droplets on the films and the measured contact angles are shown in Figure 8. Incorporation of surface-modified ZnONP increased the contact angle, indicating reduced surface free energy—presumably as the result of hydrogen bonding between PLA and the functionalized ZnONP.
4. Conclusions
In this study, ZnO nanoparticles (ZnONPs) surface-functionalized with an amino group were synthesized via a hydrothermal method, and their potential use as a reinforcing filler in a polylatic acid (PLA) composite film was investigated. Within the range of reaction conditions employed, XPS measurements revealed that the surface modification ratio of the ZnONPs remained below 10%. Composite films with PLA were fabricated and subjected to a tensile test to evaluate their mechanical properties. It was found that films containing 6AH-modified ZnONPs exhibited higher tensile strengths than those with unmodified ZnONPs. Furthermore, an increase in water contact angle indicated that the surface modification enhanced the hydrophobicity of the films. In addition, SEM–EDS analyses of the film cross-sections, combined with image analyses, confirmed nanoparticle aggregation; however, no clear dependence on ZnONP content was observed.
This study demonstrated the potential of surface-functionalized ZnONPs as reinforcing fillers, highlighting a promising approach for the development of next-generation sustainable materials. The methodology established here is expected to serve as a foundational technology for the creation of such materials. In particular, due to its low cost and minimal environmental impact, this approach holds significant promise for a wide range of applications, not only in industrial films but also in medical and food-related materials.
Supplementary Materials
The following supporting information can be downloaded at the website of this paper posted on Preprints.org, Figure S1: Appearance of the composite films; Figure S2: X-ray diffraction of the synthesized samples; Figure S3: SEM images and EDS mappings for modified 1-hexanol-ZnONP; Figure S5: XPS spectra of the Zn2p1/2 region for ZnONP; Figure S6: Typical stress-strain curves of PLA film and composites film; Table S1 Crystallite size of the synthesized samples.
Author Contributions
Conceptualization, H. N. and K. I.; methodology, H. N.; formal analysis, H. N.; Investigation, H. N.; writing-original draft of the manuscript, H. N.; writing-review and editing, supervision, K. I. All authors have read and agreed to the published version of the manuscript.
Funding
This research received no external funding.
Acknowledgments
We would like to thank Prof. Masao Takahashi for his valuable guidance during the early stages of this research, particularly for his instruction on the XPS measurement method for powder samples. We also appreciate the foundational knowledge on ZnO he provided during our undergraduate and early graduate studies. We thank Editage (www.editage.jp) for English language editing.
Conflicts of Interest
The sponsors had no role in the design, execution, interpretation, or writing of the study.
References
- Schilling, K.; Bradford, B.; Castelli, D.; Dufour, E.; Nash, J. F.; Pape, W.; Schulte, S.; Tooley, I.; van den Boschi, J.; Schellauf, F. Human safety review of “nano” titanium dioxide and zinc oxide. Photochem. Photobiol. Sci. 2010, 9, 495–509. [Google Scholar] [CrossRef] [PubMed]
- Falcaro, P.; Ricco, R.; Yazdi, A.; Imaz, I.; Furukawa, S.; Maspoch, D.; Ameloot, R.; Evans, J. D.; Doonan, C. J. Application of metal and metal oxide nanoparticles@MOFs. Coord. Chem. Rev. 2016, 307, 237–254. [Google Scholar] [CrossRef]
- Chavali, M. S.; Nikolova, M. P. Metal oxide nanoparticles and their applications in nanotechnology. Appl. Sci. 2019, 1, 607. [Google Scholar] [CrossRef]
- Shang, G.; Tang, L.; Wu, G.; Yuan, S.; Jia, M.; Guo, X.; Zheng, X.; Wang, W.; Yue, B.; Teng, K. S. Sensors 2023, 23, 2741.
- Song, Z.; Kelf, T. A.; Sanchez, W. H.; Roberts, M. S.; Ricka, J.; Frenz, M.; Zvyagin, A. V. Characterization of optical properties of ZnO nanoparticles for quantitative imaging of transdermal transport. Biomed. Opt. Express 2011, 2, 3321–3333. [Google Scholar] [CrossRef] [PubMed]
- Singh, S.; Gade, J. V.; Verma, D. K.; Elyor, B.; Jain, B. Exploring ZnO nanoparticles: UV–visible analysis and different size estimation methods. Opt. Mater. 2024, 152, 115422. [Google Scholar] [CrossRef]
- Tang, E.; Cheng, G.; Ma, X.; Pang, X.; Zhao, Q. Surface modification of zinc oxide nanoparticle by PMAA and its dispersion in aqueous system. Appl. Surf. Sci. 2006, 252, 5227–5232. [Google Scholar] [CrossRef]
- Zhao, L.-H.; Zhang, R.; Zhang, J.; Sun. S.-Q.; Synthesis and characterization of biocompatible ZnO nanoparticles. CrystEngComm 2012, 14, 945.
- Liu, J.-H.; Ma, X.; Xu, Y.; Tang, H.; Yang, S.-T.; Yang, Y.-F.; Kang, D.-D.; Wang, H.; Liu, Y. Low toxicity and accumulation of zinc oxide nanoparticles in mice after 270-day consecutive dietary supplementation. Toxicol. Res. 2017, 6, 134–143. [Google Scholar] [CrossRef]
- Zhang, Z.-Y.; Xiong, H.-M. Photoluminescent ZnO Nanoparticles and Their Biological Applications. Materials 2015, 8, 3101–3127. [Google Scholar] [CrossRef]
- Raha, S.; Ahmaruzzaman, M. ZnO nanostructured materials and their potential applications: progress, challenges and perspectives. Nanoscale Adv. 2022, 4, 1868–1925. [Google Scholar] [CrossRef]
- Yuan, Q.; Hein, S.; Misara, R.D.K. New generation of chitosan-encapsulated ZnO quantum dots loaded with drug: Synthesis, characterization and in vitro drug delivery response. Acta Biomater. 2010, 6, 2732–2739. [Google Scholar] [CrossRef]
- Nie, L.; Gao, L.; Feng, P.; Zhang, J.; Fu, X.; Liu, Y.; Yan, X.; Wang, T. Three-Dimensional Functionalized Tetrapod-like ZnO Nanostructures for Plasmid DNA Delivery. Small 2006, 2, 621–625. [Google Scholar] [CrossRef] [PubMed]
- Zhang, P.; Liu, W. ZnO QD@PMAA-co-PDMAEMA nonviral vector for plasmid DNA delivery and bioimaging. Biomaterials 2010, 31, 3087–3094. [Google Scholar] [CrossRef]
- Zhu, P.; Weng, Z.; Li, X.; Liu, X.; Wu, S.; Yeung, K. W. K.; Wang, X.; Cui, Z.; Yang, X.; Chu, P. K. ; Biomedical Applications of Functionalized ZnO Nanomaterials: from Biosensors to Bioimaging. Adv. Mater. Interfaces 2016, 3, 1500494. [Google Scholar] [CrossRef]
- Mahajan, M.; Kaur, R.; Gaur, J.; Kumar, S.; Kaushal, S.; Kaur, H.; Bajwa, A.; Nainawat, A. K.; Singh, G. Surface-modified ZnO nanoparticles for enhanced environmental and biomedical performance. Hybrid Adv. 2025, 8, 100342. [Google Scholar] [CrossRef]
- Khan, A. U. H.; Liu, Y.; Naidu, R.; Fang, C.; Shon, H. K.; Zhang, H.; Dharmarajan, R. Changes in the Aggregation Behaviour of Zinc Oxide Nanoparticles Influenced by Perfluorooctanoic Acid, Salts, and Humic Acid in Simulated Waters. Toxics 2024, 12, 602. [Google Scholar] [CrossRef] [PubMed]
- Kumar, A.; Ansari, Z. A.; Fouad, H.; Umar, A.; Ansari, S. G. Oxidative Stress Control in E. coli and S. aureus Cells Using Amines Adsorbed ZnO. Sci. Adv. Mater. 2014, 6, 1236–1243. [Google Scholar] [CrossRef]
- Mondelaers, D.; Vanhoyland, G.; Van den Rul, H.; D’Haen, J.; Van Bael, M. K.; Mullens, J.; Van Poucke, L. C. Synthesis of ZnO nanopowder via an aqueous acetate-citrate gelation method. Mater. Res. Bull. 2002, 37, 901–914. [Google Scholar] [CrossRef]
- Tokumoto, M. S.; Pulcinelli, S. H.; Santilli, C. V.; Briois, V. Catalysis and Temperature Dependence on the Formation of ZnO Nanoparticles and of Zinc Acetate Derivatives Prepared by the Sol-Gel Route. J. Phys. Chem. B 2003, 107, 568–574. [Google Scholar] [CrossRef]
- Zhang, H.; Yang, D.; Ji, Y.; Ma, X.; Xu, J.; Que, D. Low Temperature Synthesis of Flowerlike ZnO Nanostructures by Cetyltrimethylammonium Bromide-Assisted Hydrothermal Process. J. Phys. Chem. B 2004, 108, 3955–3958. [Google Scholar] [CrossRef]
- Liu, B.; Zeng, H. C. Hydrothermal Synthesis of ZnO Nanorods in the Diameter Regime of 50 nm. J. Am. Chem. Soc. 2003, 125, 4430–4431. [Google Scholar] [CrossRef]
- Mousavand, T.; Ohara, S.; Naka, T.; Umetsu, M.; Takami, S.; Adschiri, T. Organic-ligand-assisted hydrothermal synthesis of ultrafine and hydrophobic ZnO nanoparticles. J. Mater. Res. 2010, 25, 219–223. [Google Scholar] [CrossRef]
- Mahmood, N. B.; Saeed, F. R.; Gbashi, K. R.; Mahmood, Mahmood, U.-S. Synthesis and characterization of zinc oxide nanoparticles via oxalate co-precipitation method. Mater. Lett.: X 2022, 13, 100126.
- Ghorbani, H. R.; Mehr, F. P.; Pazoki, H.; Rahmani, B. M. Synthesis of ZnO Nanoparticles by Precipitation Method. Orient. J. Chem. 2015, 31, 1219–1221. [Google Scholar] [CrossRef]
- Ghaffarian, H. R.; Saiedi, M.; Sayyadnejad, M. A.; Rashidi, A. M. Synthesis of ZnO Nanoparticles by Spray Pyrolysis Method. Iran. J. Chem. Chem. Eng. 2011, 30, 1–6. [Google Scholar]
- Wallace, R.; Brown, A. P.; Brydson, R.; Wegner, K.; Milne, S. J. Synthesis of ZnO nanoparticles by flame spray pyrolysis and characterisation protocol. J. Mater. Sci. 2013, 48, 6393–6403. [Google Scholar] [CrossRef]
- Liang, Y.; Wicker, S.; Wang, X.; Erichsen, E. S.; Fu, F. Organozinc Precursor-Derived Crystalline ZnO Nanoparticles: Synthesis, Characterization and Their Spectroscopic Properties. Nanomaterials 2018, 8, 22. [Google Scholar] [CrossRef]
- Primc, G.; Brencic, K.; Mozetic, M.; Gorjanc, M. Recent Advances in the Plasma-Assisted Synthesis of Zinc Oxide Nanoparticles. Nanomaterials 2021, 11, 1191. [Google Scholar] [CrossRef]
- Messai, R.; Ferhat, M. F.; Belmekki, B.; Alam, M. W.; Al-Othoum, M. A. S.; Sadaf, S. ; GAD plasma-assisted synthesis of ZnO nanoparticles and their photocatalytic activity. Mater. Res. Express 2024, 11, 015006. [Google Scholar] [CrossRef]
- Lu, J.; Ng, K. M.; Yang, S. Efficient, One-Step Mechanochemical Process for the Synthesis of ZnO Nanoparticles. Ind. Eng. Chem. Res. 2008, 47, 1095–1101. [Google Scholar] [CrossRef]
- Otis, G.; Ejgenberg, M.; Mastai, Y. Solvent-Free Mechanochemical Synthesis of ZnO Nanoparticles by High-Energy Ball Milling of ε-Zn(OH)2 Crystals. Nanomaterials 2021, 11, 238. [Google Scholar] [CrossRef]
- Liu, W.; Wang, S.; Wang, J.; Zhang, B.; Liu, L.; Liu, H.; Yang, J. Supercritical hydrothermal synthesis of nano-zinc oxide: Process and mechanism. Ceram. Int. 2022, 48, 22629–22646. [Google Scholar] [CrossRef]
- Sun, P.; Lv, Z.; Sun, C. Study on the Synthesis of Nano Zinc Oxide Particles under Supercritical Hydrothermal Conditions. Nanomaterials 2024, 14, 844. [Google Scholar] [CrossRef] [PubMed]
- Trad, T. M.; Donley, K. B.; Look, D. C.; Eyink, K. G.; Tomich, D. H.; Taylor, C. R. Low temperature deposition of zinc oxide nanoparticles via zinc-rich vapor phase transport and condensation. J. Cryst. Growth 2010, 312, 3675–3679. [Google Scholar] [CrossRef]
- Marin, O.; Real, S. C.; Vega, N. C.; Tirado, M.; Comedi, D. ZnO Nanostructures Synthesized by Vapor Transport and Liquid Phase Synthesis Techniques: Growth and Properties. Sci. Rev. 2020, 1, 6–23. [Google Scholar] [CrossRef]
- López-Cuenca, S.; Pérez Carrillo, L. A.; Rabelero Velasco, M.; Díaz de León, R.; Saade, H.; López, R. G.; Mendizábal, E.; Puig, J. E. High-Yield Synthesis of Zinc Oxide Nanoparticles from Bicontinuous Microemulsions. J. Nanomater. 2011, 2011, 6. [Google Scholar] [CrossRef]
- Yildirim, O. A.; Durucan, C. Synthesis of zinc oxide nanoparticles elaborated by microemulsion method. J. Alloys Compd. 2010, 506, 944–949. [Google Scholar] [CrossRef]
- Usui, H. Electrochemical self-assembly synthesis of zinc oxide nanoparticles and lamellar-structured organic/inorganic hybrids by electrodeposition in surfactant solution. Electrochim. Acta 2011, 56, 3934–3940. [Google Scholar] [CrossRef]
- Yakimchuk, D. V.; Bundyukova, V. D.; Ustarroz, J.; Terryn, H.; Baert, K.; Kozlovskiy A. L.; Zdorovets, M. V.; Khubezhov, S. A.; Trukhanov, A. V.; Trukhanov, S. V.; Panina, L. V.; Arzumanyan, G. M.; Mamatkulov, K. Z.; Tishkevich. D. I.; Kaniukov, E. Y.; Sivakov, V. Morphology and Microstructure Evolution of Gold Nanostructures in the Limited Volume Porous Matrices. Sensors 2020, 20, 4397.
- FIZ Karlsruhe—Leibniz Institute for Information Infrastructure. Inorganic Crystal Structure Database (ICSD), Collection Code 26170. Available online: https://icsd.fiz-karlsruhe.de/ (accessed on May 26, 2025).
- Rafaela, R.; Dejan, M.; Damjan, B.; Julio, C.; Niksa, K. Synthesis of Silver, Gold, and Platinum Doped Zinc Oxide Nanoparticles by Pulsed Laser Ablation in Water. Nanomaterials 2022, 12, 3484. [Google Scholar] [CrossRef]
Figure 1.
Schematic illustration for fabrication of the composite of PLA with functionalized ZnONP; hydrogen-bond formation between the amino group on ZnONP and carbonyl group attached with PLA.
Figure 1.
Schematic illustration for fabrication of the composite of PLA with functionalized ZnONP; hydrogen-bond formation between the amino group on ZnONP and carbonyl group attached with PLA.
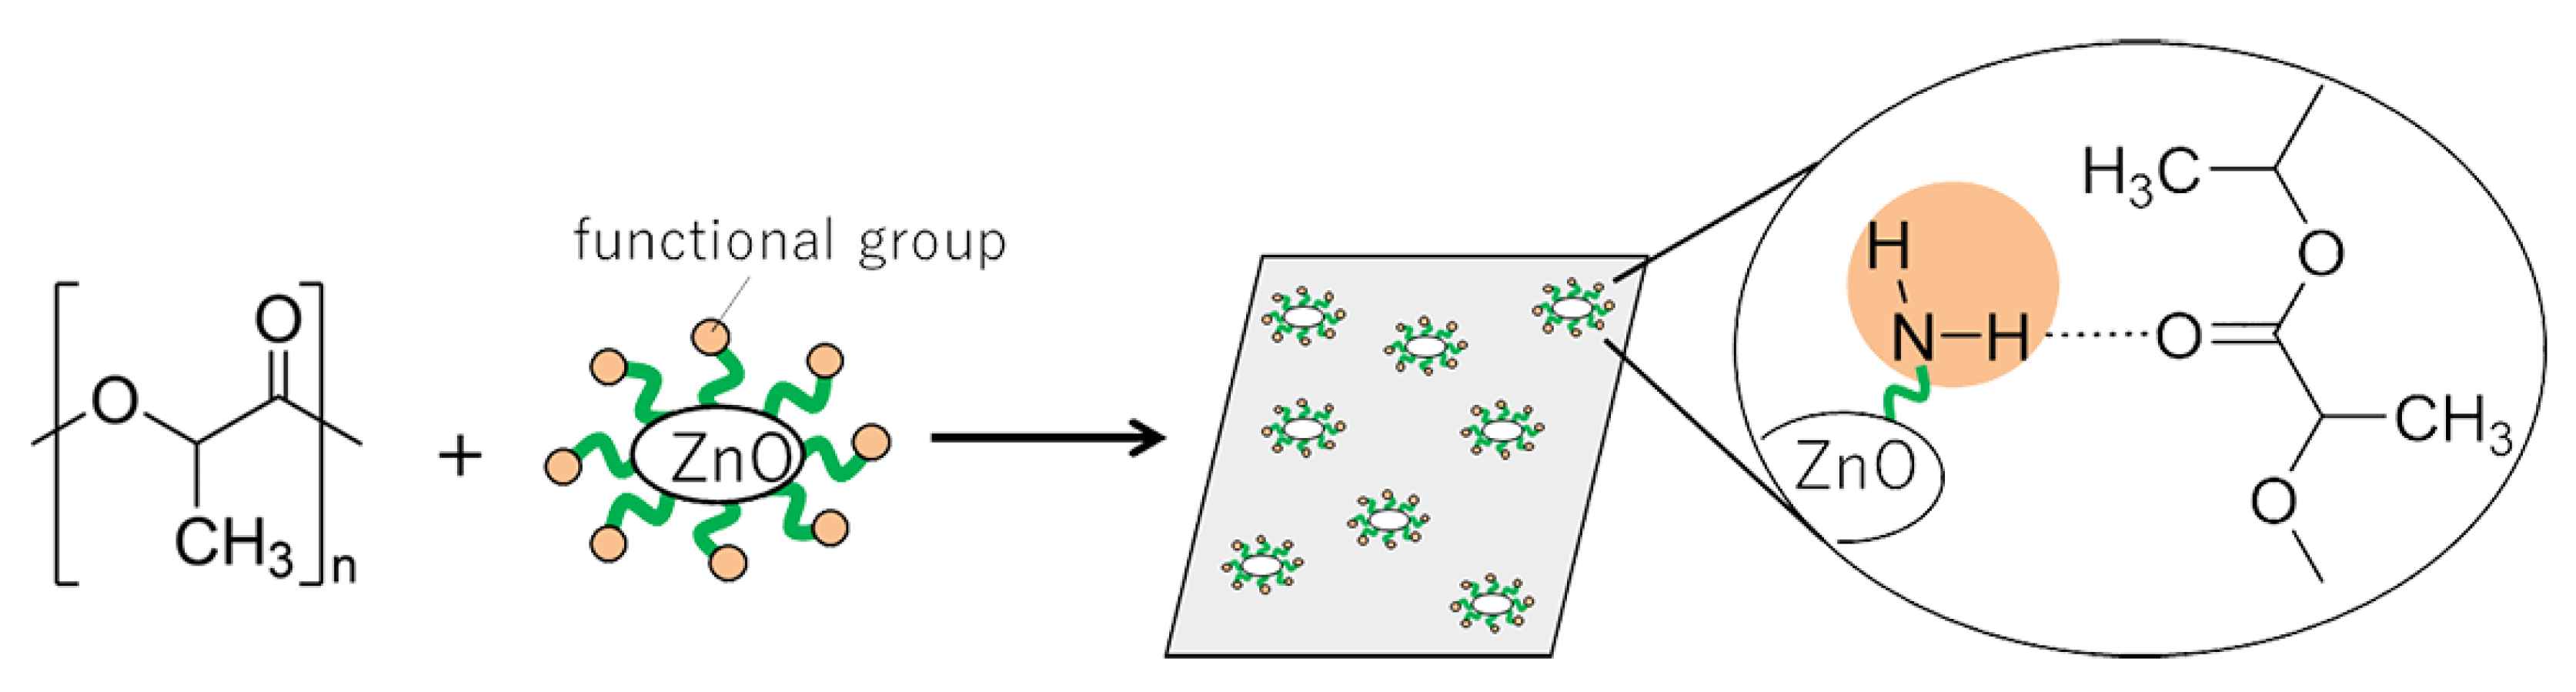
Figure 2.
XRD patterns of ZnONP-80-1 (a), ZnONP-120-1 (b), ZnONP-80-24 (c), and ZnONP-120-24 (d).
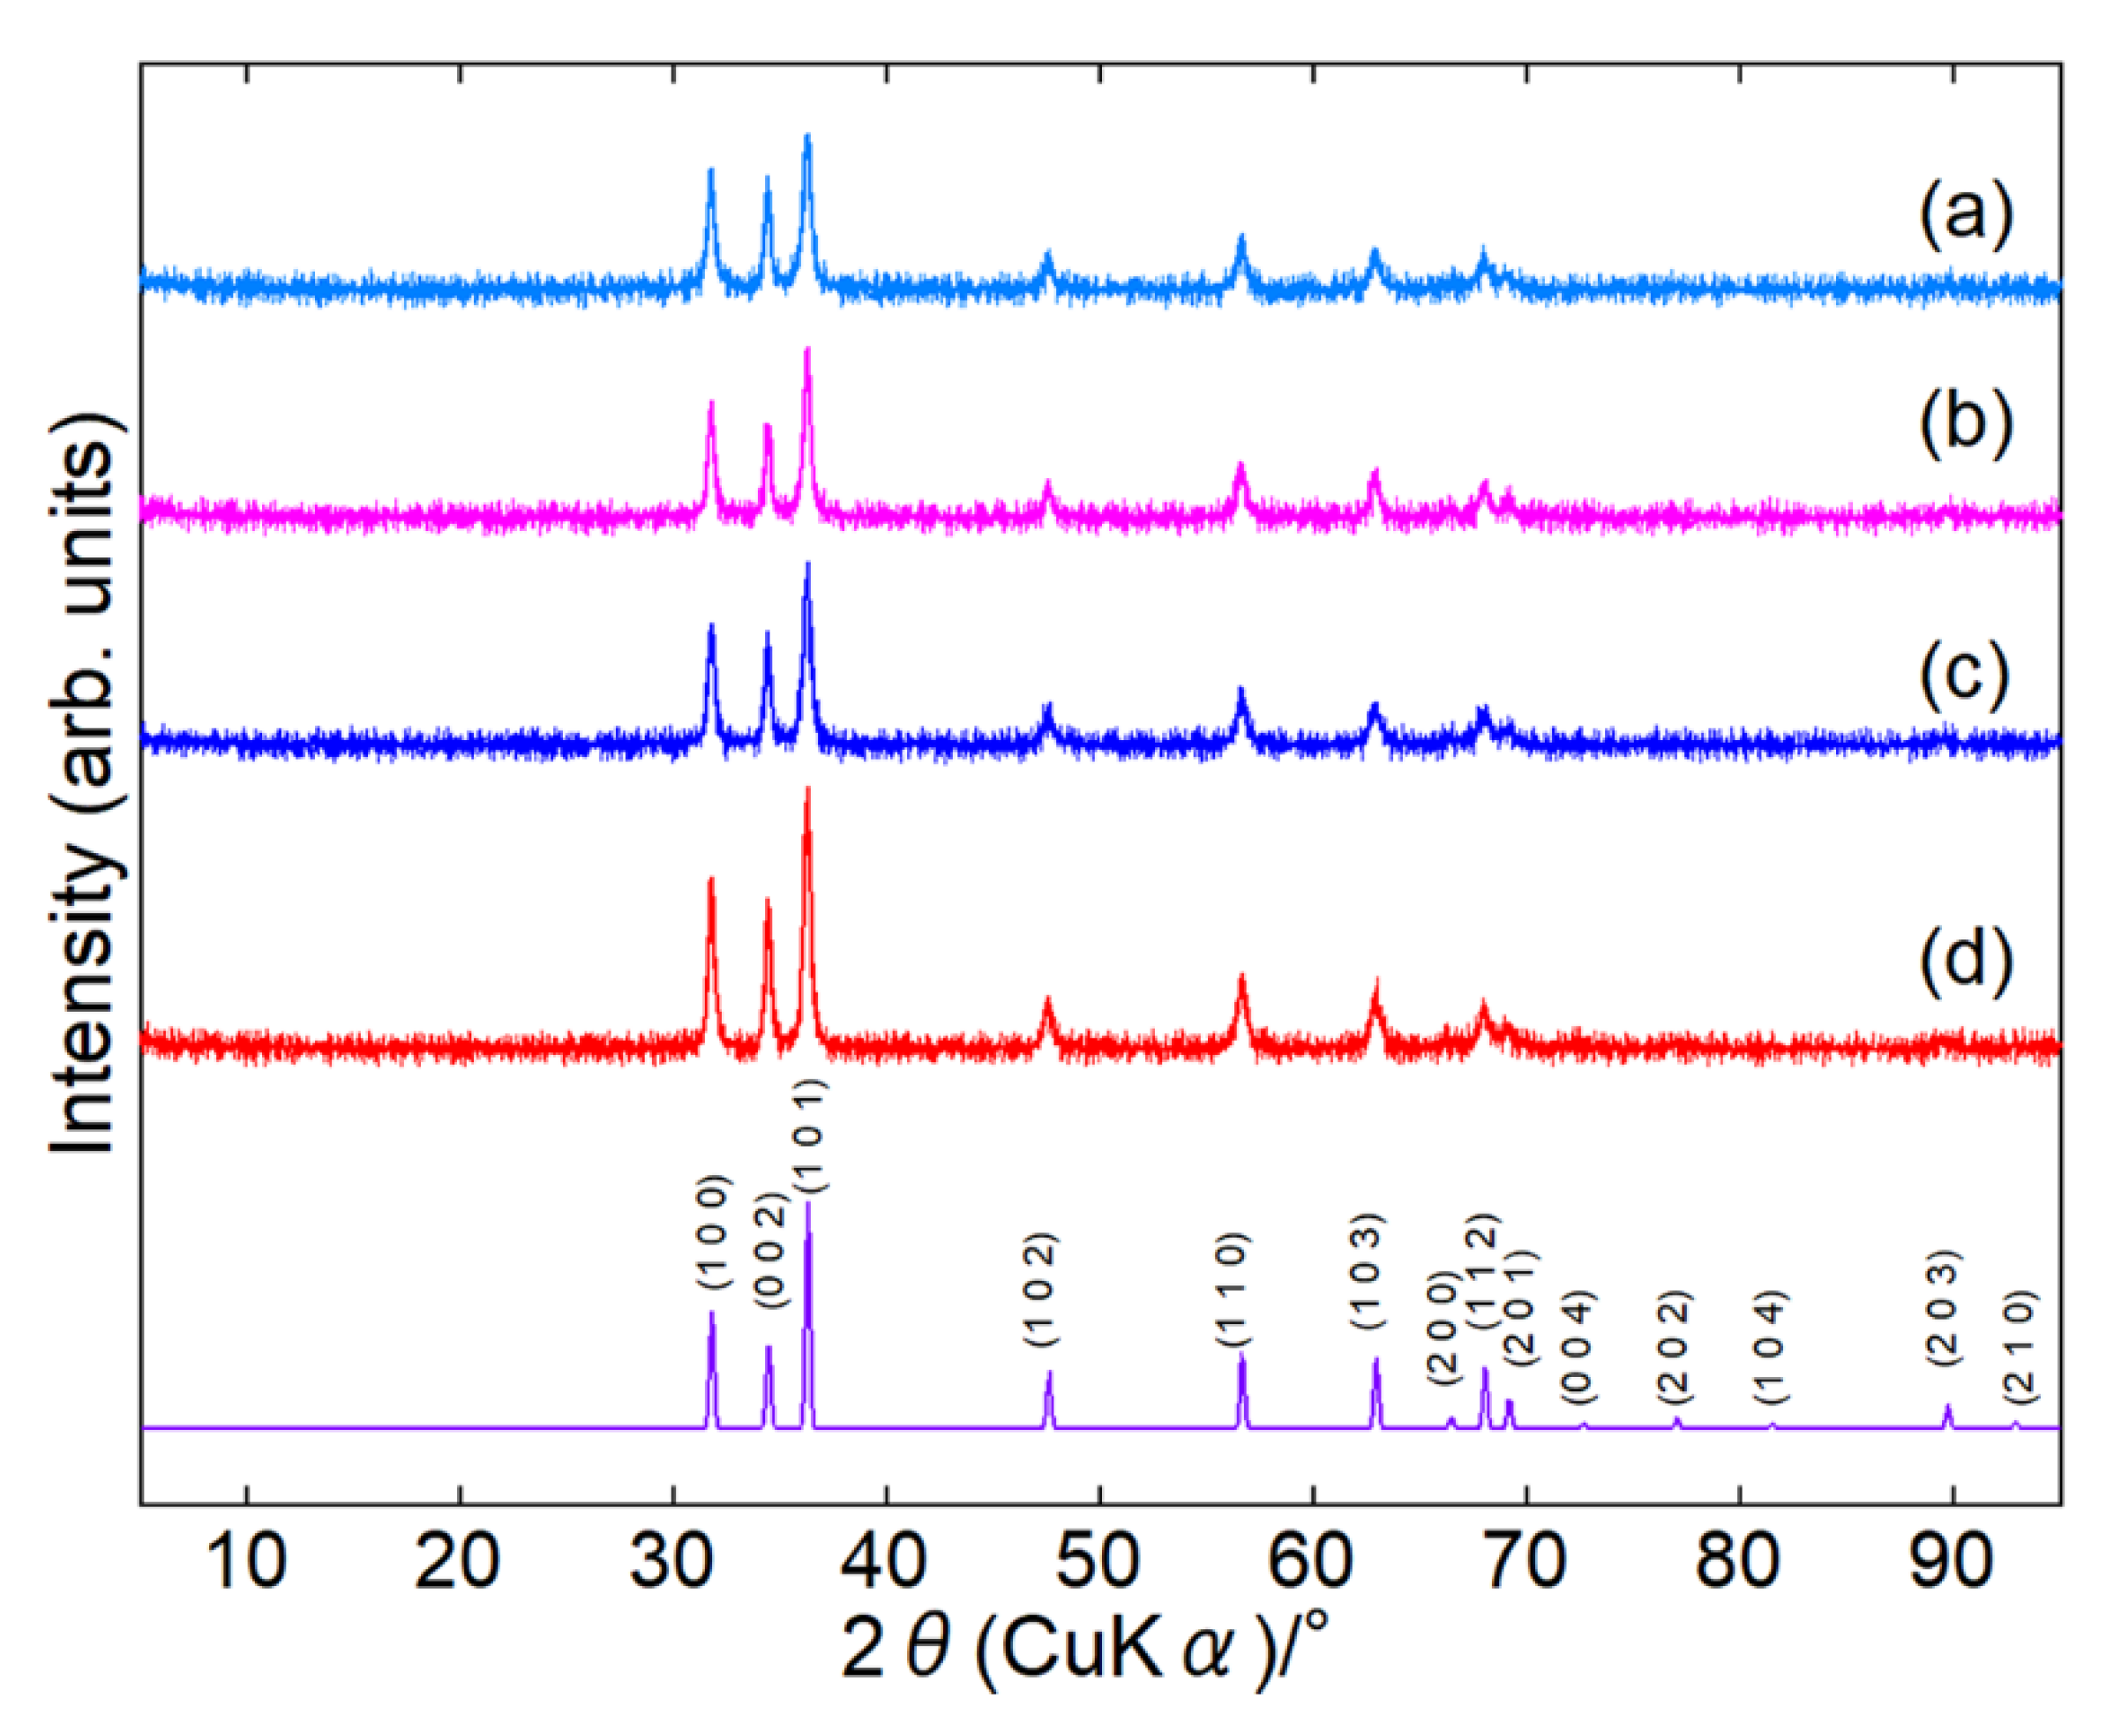
Figure 3.
(a–e) SEM images and (f–j) EDS mappings (top: carbon, middle: zinc, bottom: oxygen) for modified ZnONP-80-1 (a and f), ZnONP-120-1 (b and g), ZnONP-80-24 (c and h), ZnONP-120-24 (d and i), and unmodified ZnONP-120-1 (e and j).
Figure 3.
(a–e) SEM images and (f–j) EDS mappings (top: carbon, middle: zinc, bottom: oxygen) for modified ZnONP-80-1 (a and f), ZnONP-120-1 (b and g), ZnONP-80-24 (c and h), ZnONP-120-24 (d and i), and unmodified ZnONP-120-1 (e and j).
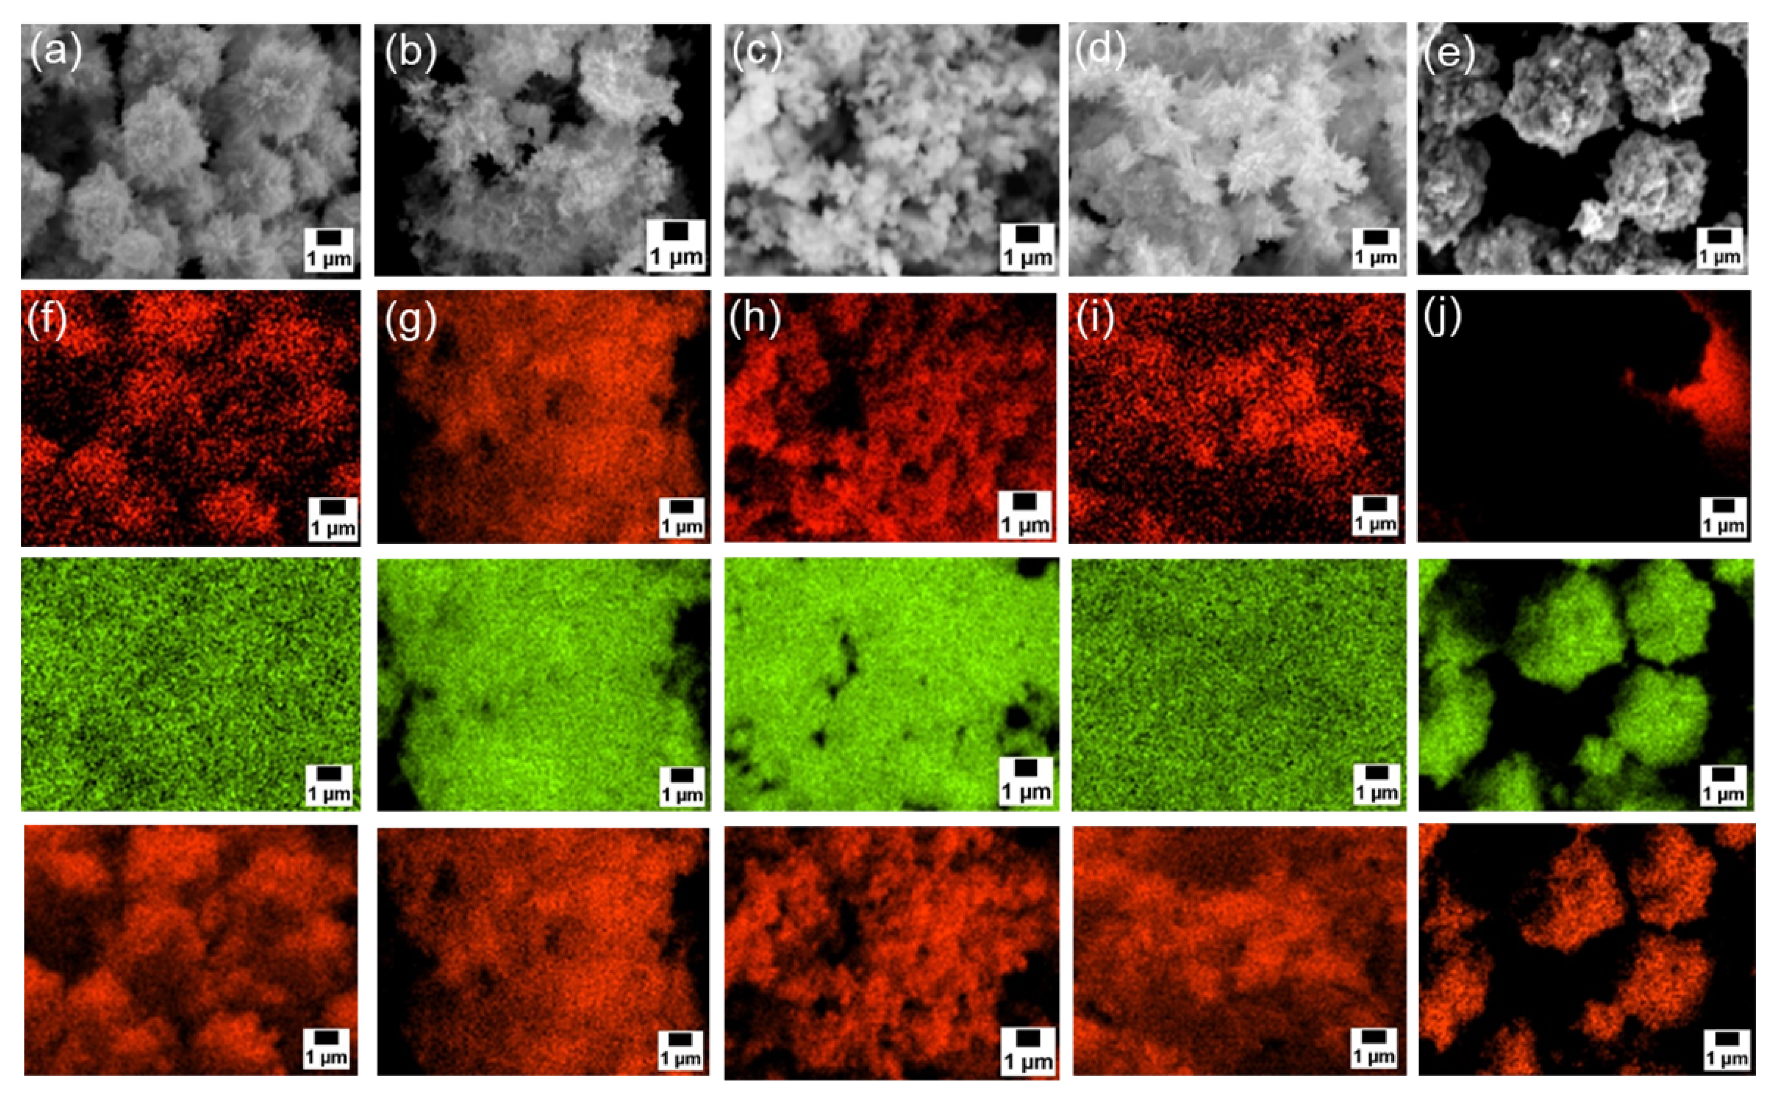
Figure 4.
XPS spectra of the O 1s region for unmodified ZnONP (a), modified ZnONP-80-1 (b), ZnONP-80-24 (c), ZnONP-120-1 (d), and ZnONP-120-24 (e).
Figure 4.
XPS spectra of the O 1s region for unmodified ZnONP (a), modified ZnONP-80-1 (b), ZnONP-80-24 (c), ZnONP-120-1 (d), and ZnONP-120-24 (e).
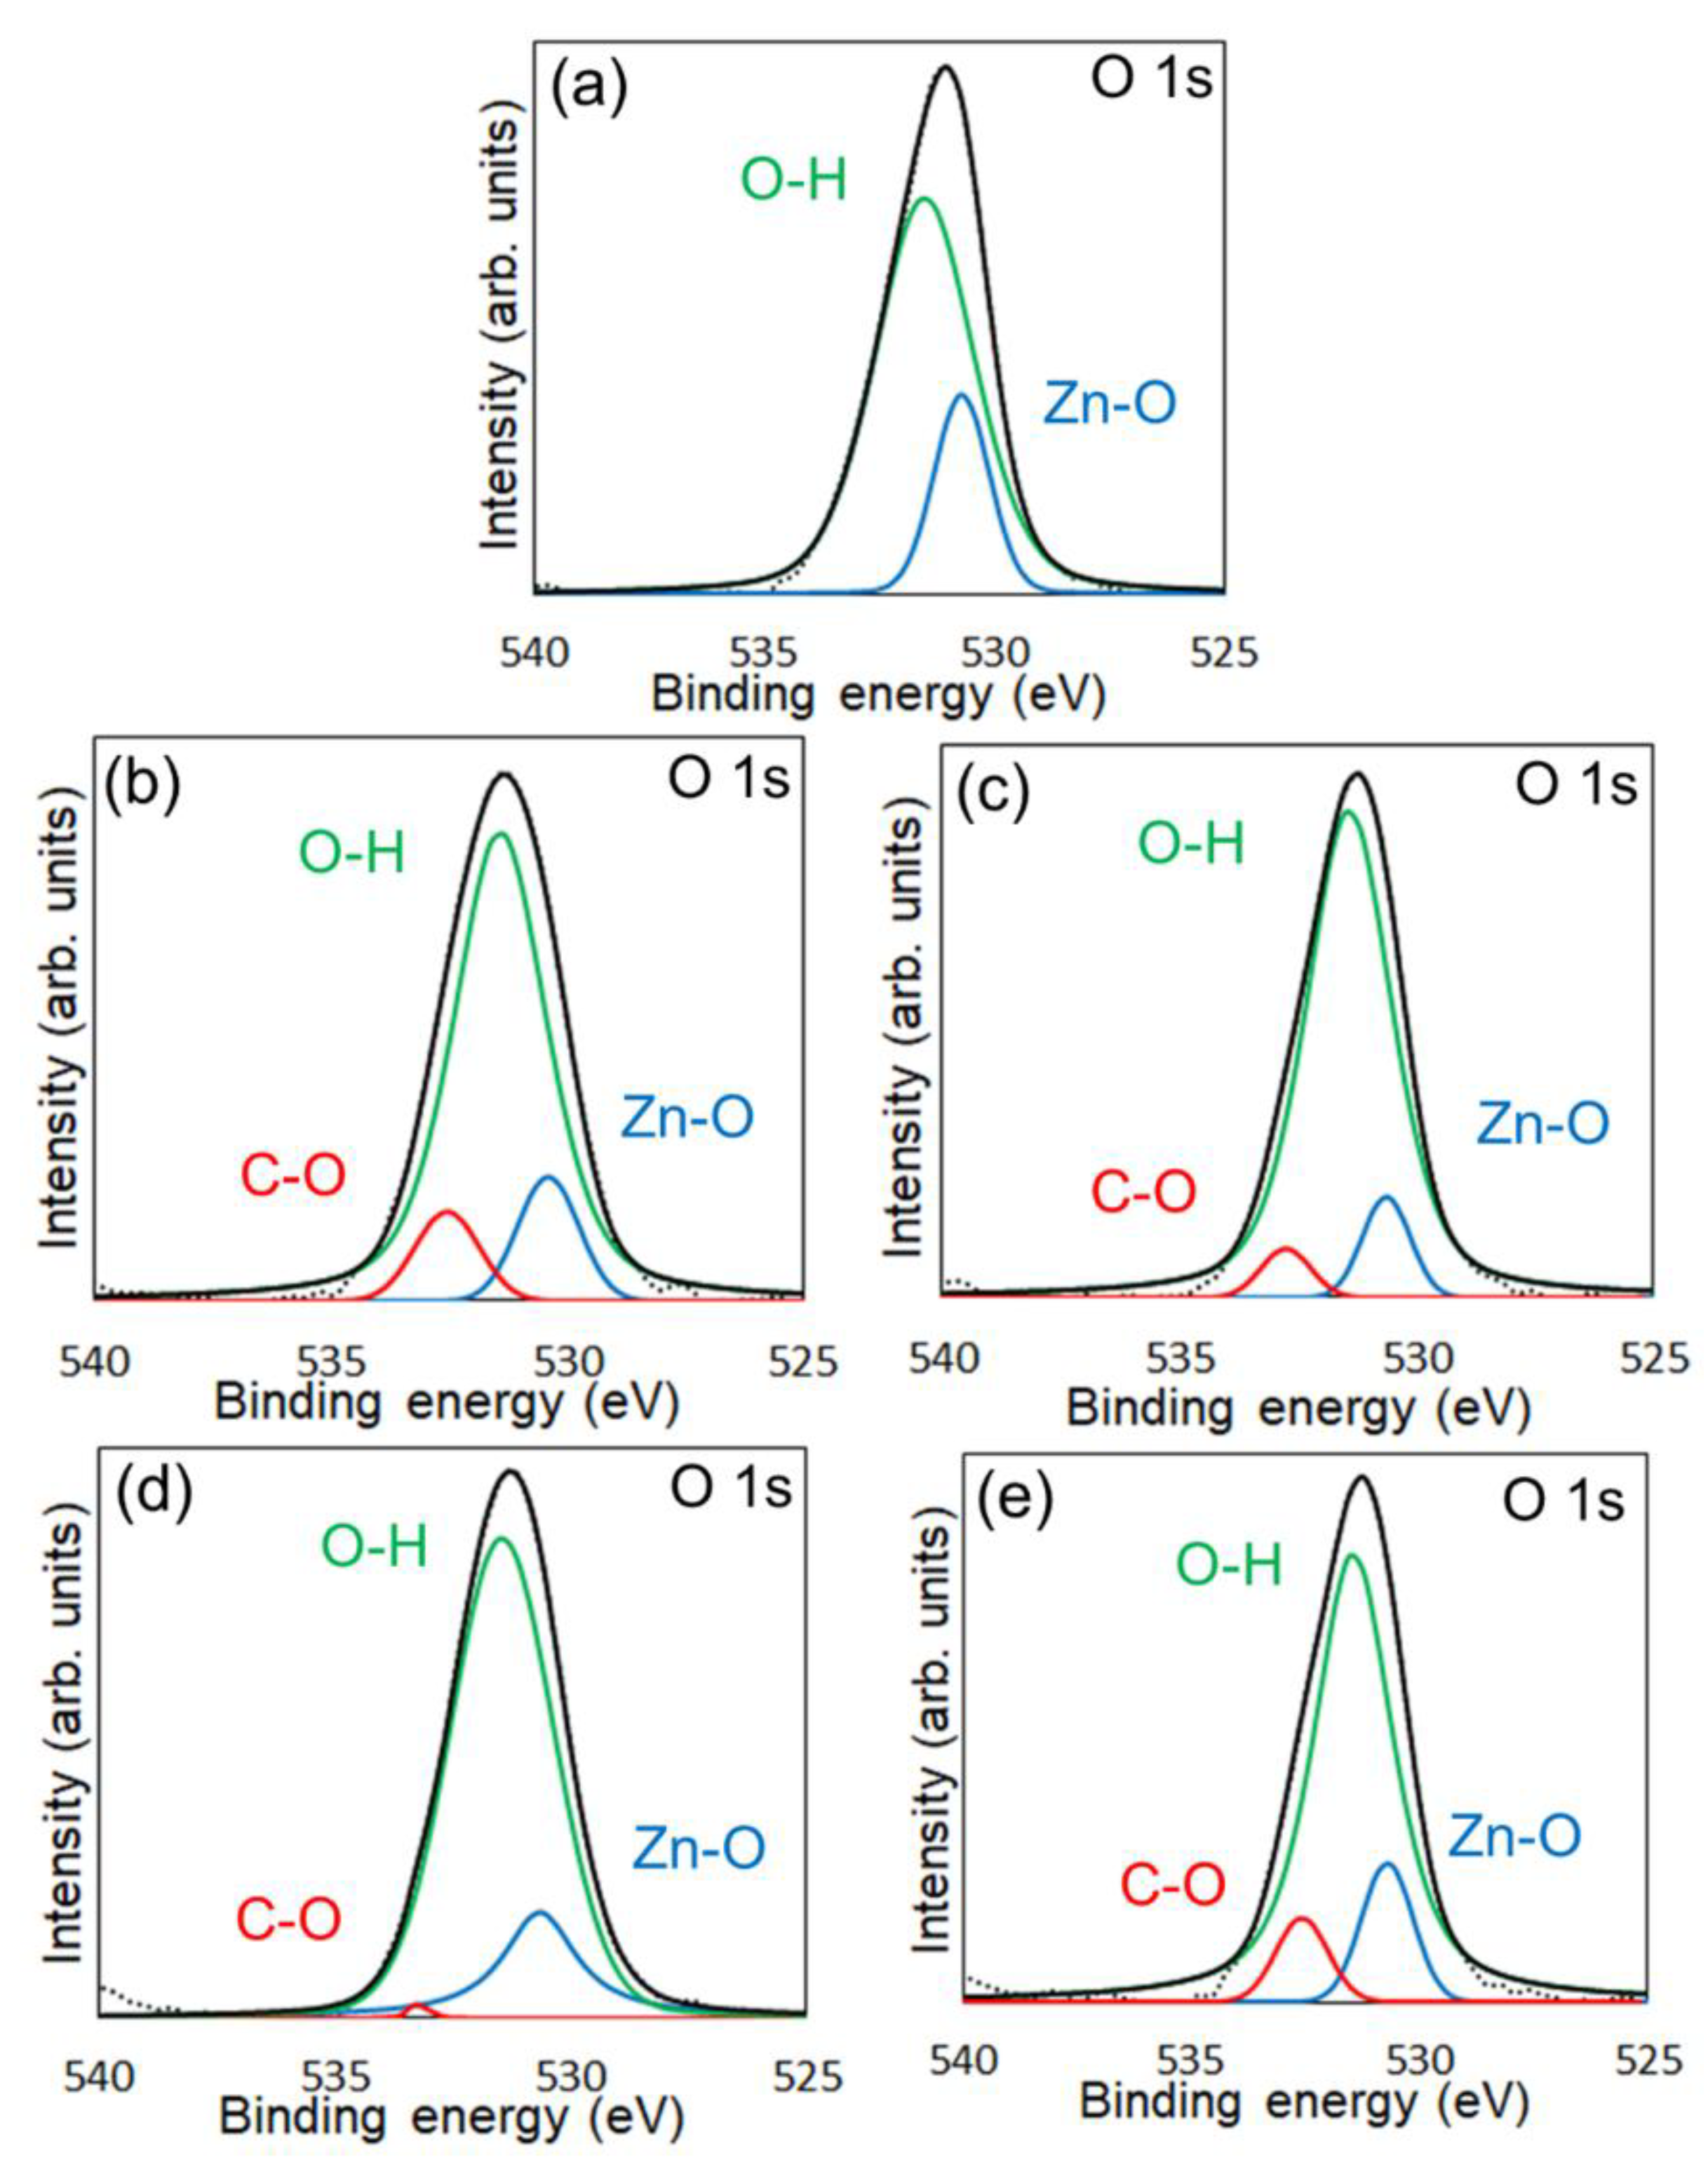
Figure 5.
Plots of (a) tensile modulus, (b) maximum strength, and (c) elongation at break of ZnONP-120-1 (black), 6AH-modified ZnONP80-1 (light blue), 6AH-modified ZnONP-80-24(navy blue), 6AH-modified ZnONP-120-1 (pink), 6AH-modified ZnONP-120-24, and 1-hexanol-modified ZnONP-120-1 (green).
Figure 5.
Plots of (a) tensile modulus, (b) maximum strength, and (c) elongation at break of ZnONP-120-1 (black), 6AH-modified ZnONP80-1 (light blue), 6AH-modified ZnONP-80-24(navy blue), 6AH-modified ZnONP-120-1 (pink), 6AH-modified ZnONP-120-24, and 1-hexanol-modified ZnONP-120-1 (green).
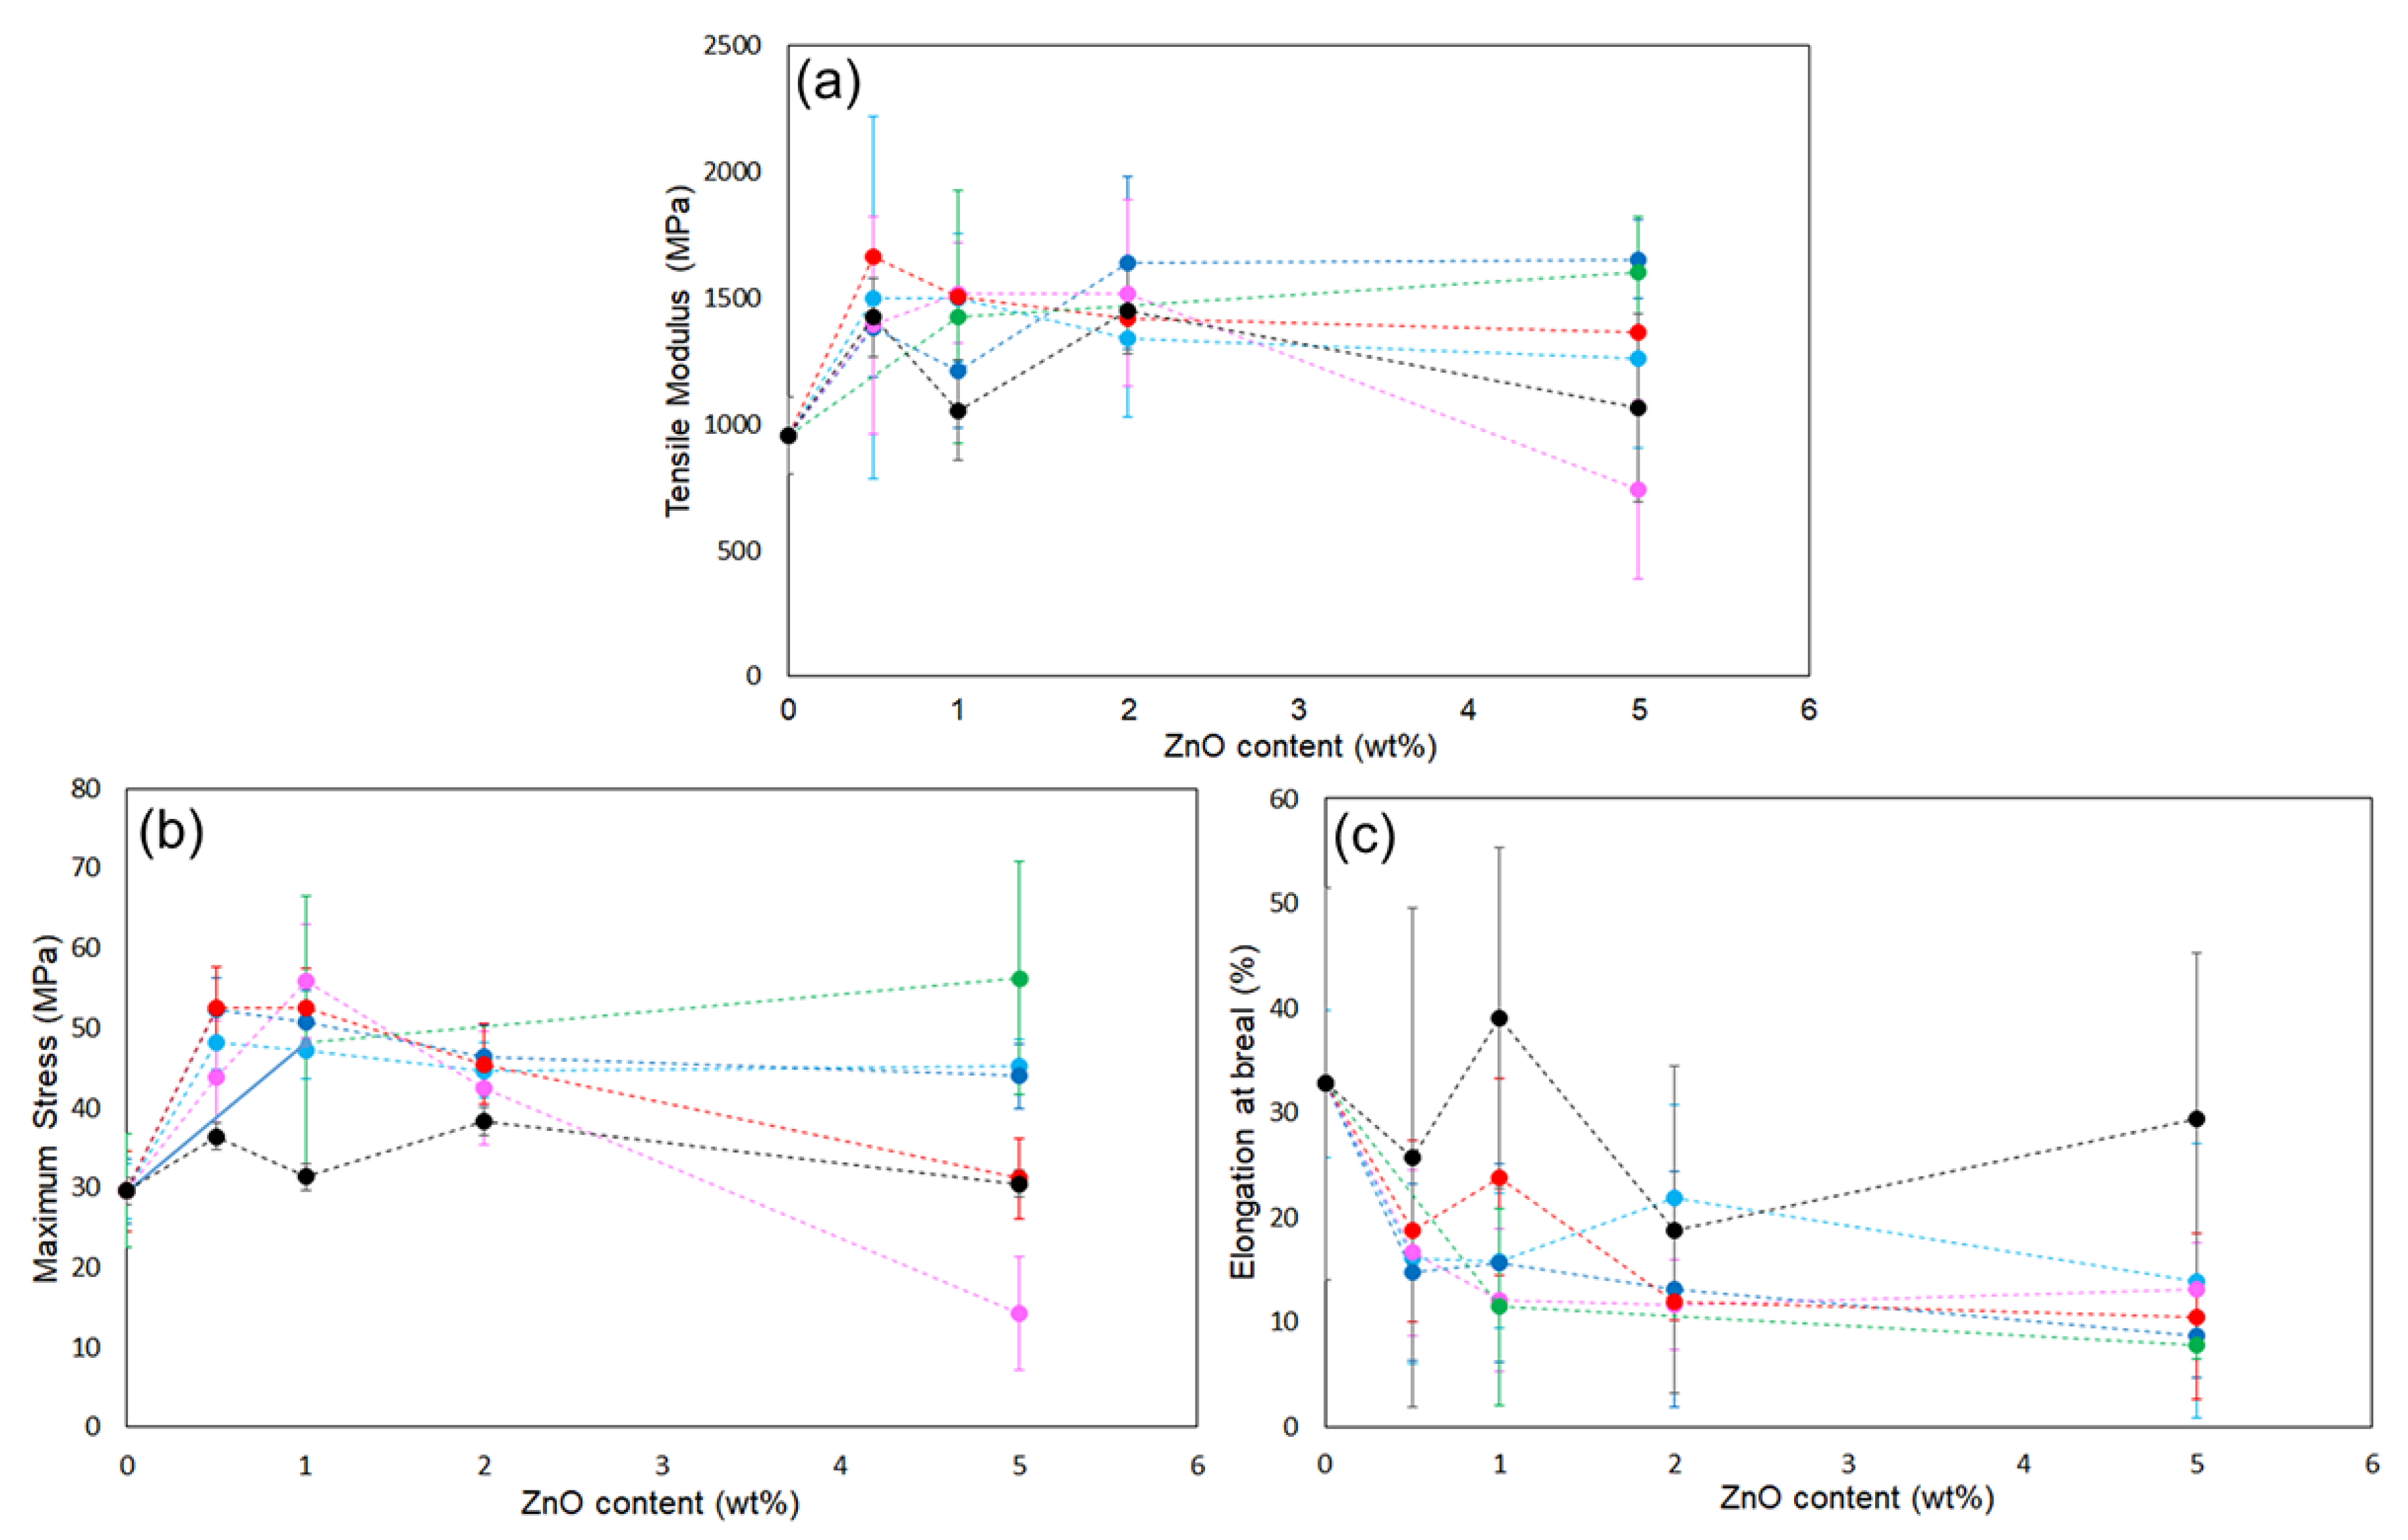
Figure 6.
SEM images (a and d), EDS mappings (b and e), and binarized images (c and f) of the cross sections of the PLA composite films with 6AH-modified ZnONP at 1 wt% (a and b) and 5 wt% (d and e).
Figure 6.
SEM images (a and d), EDS mappings (b and e), and binarized images (c and f) of the cross sections of the PLA composite films with 6AH-modified ZnONP at 1 wt% (a and b) and 5 wt% (d and e).
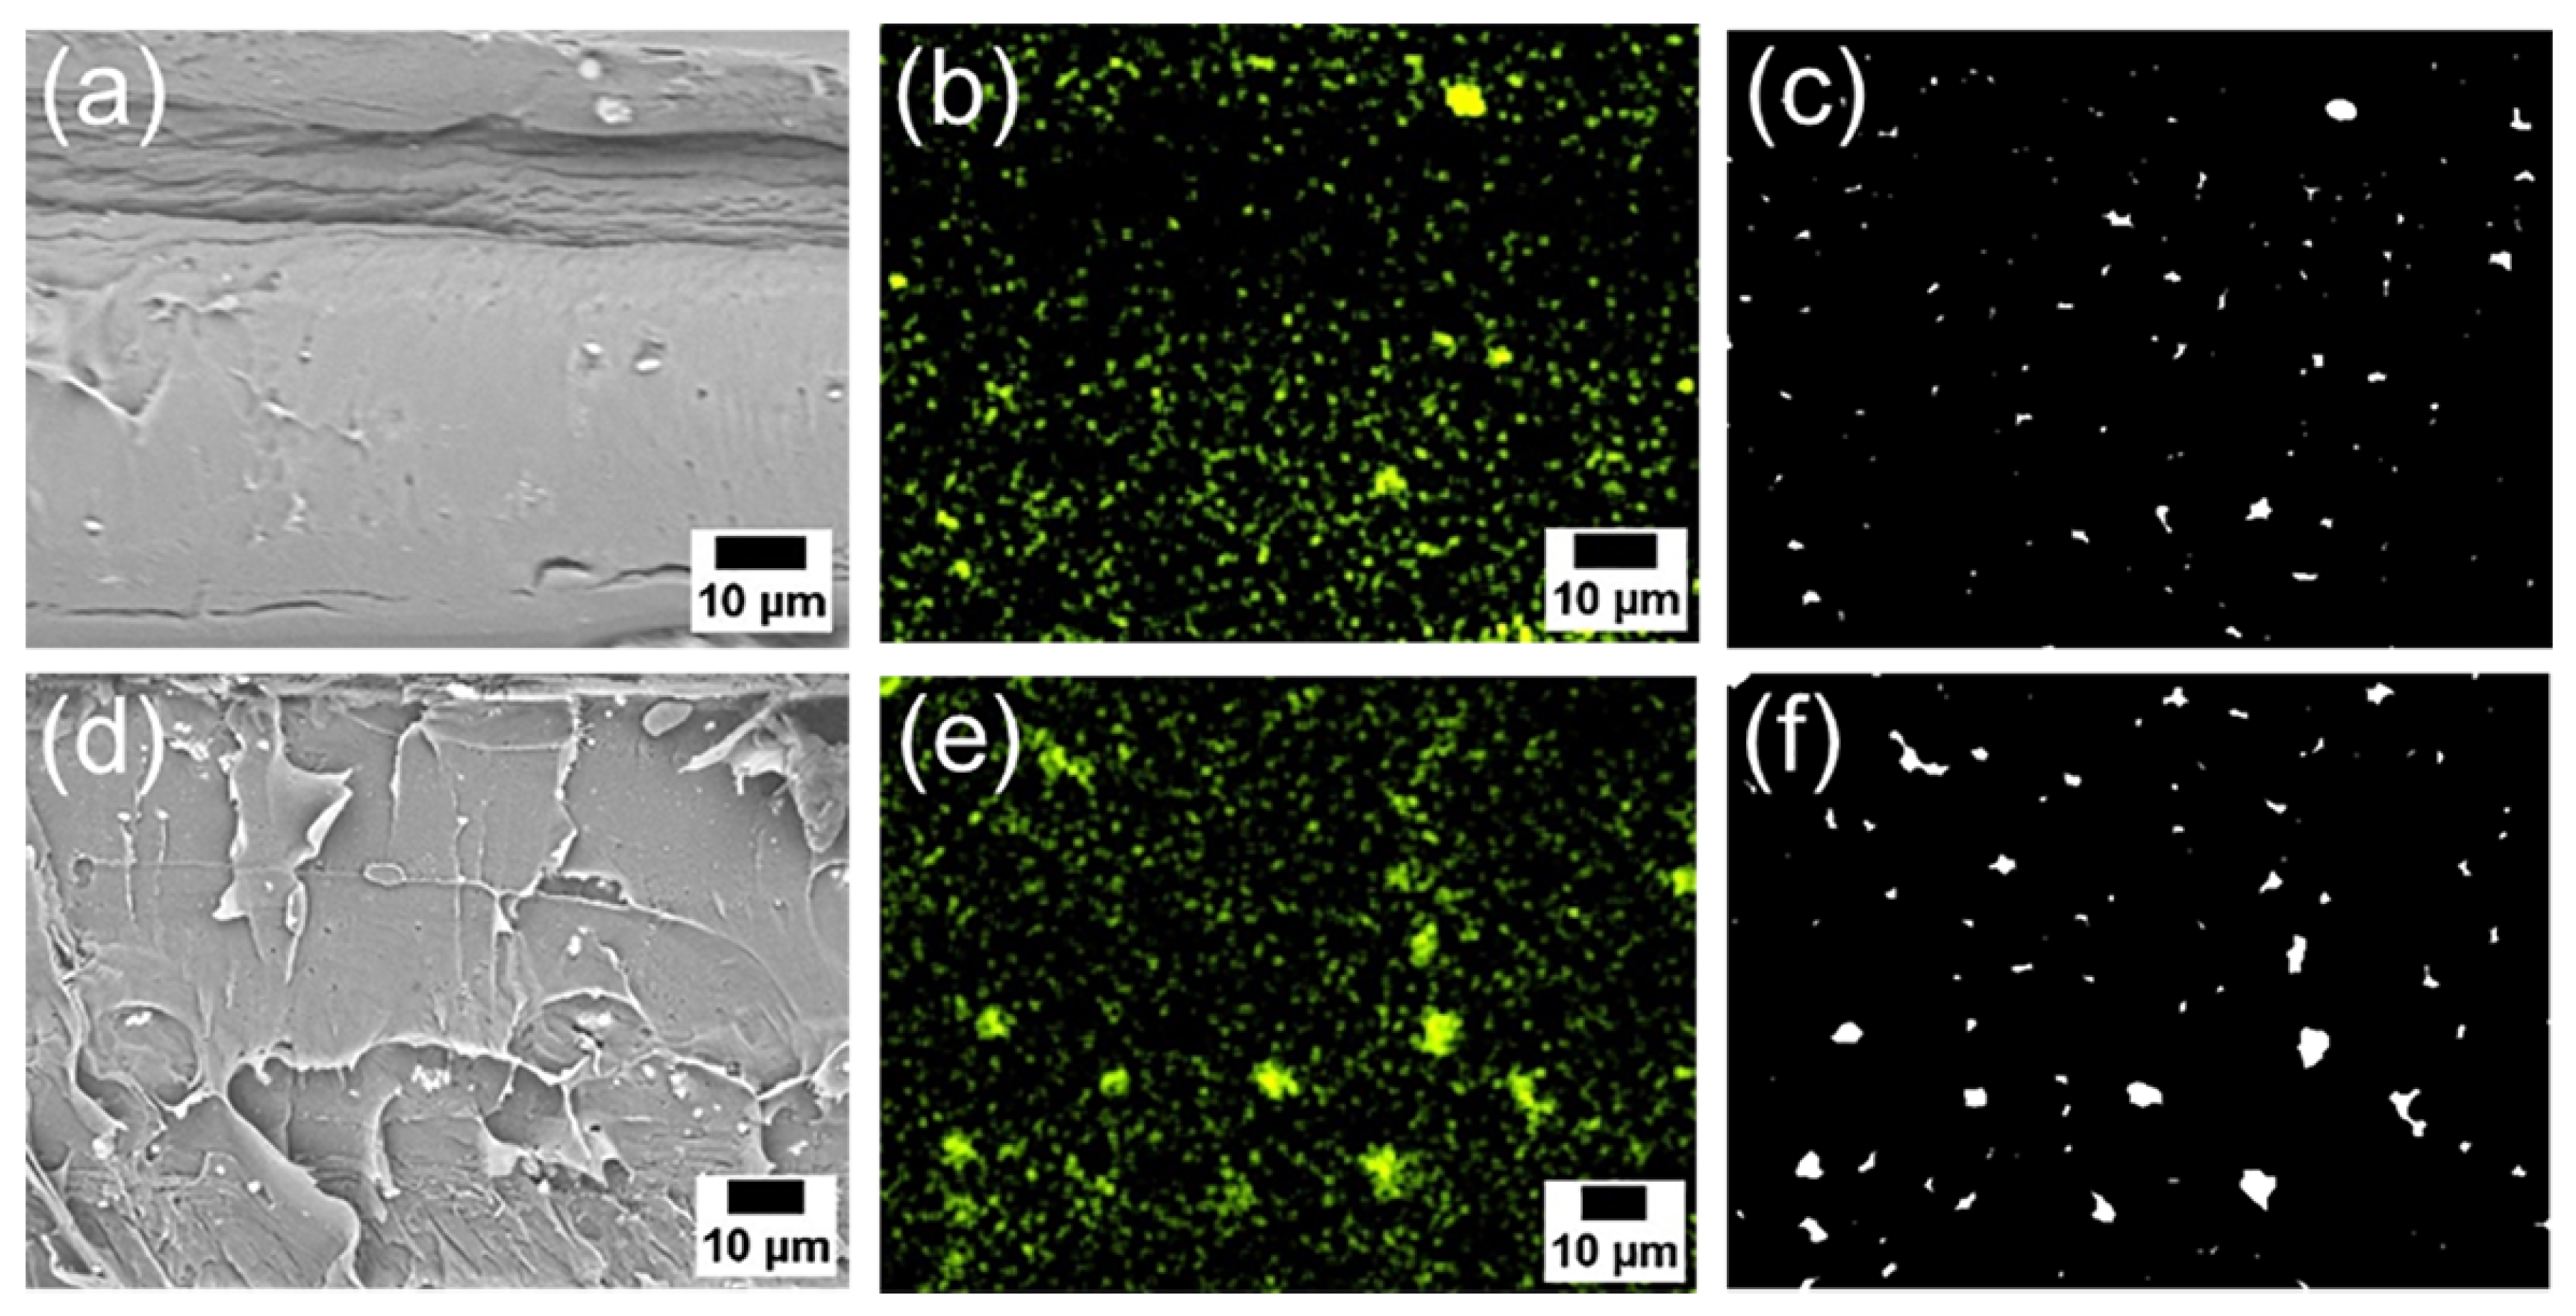
Figure 7.
A histogram of particle frequency against estimated particle area from the binarized images of composites with 1 wt% (a) and 5 wt% (b) of 6AH-modified ZnONPs.
Figure 7.
A histogram of particle frequency against estimated particle area from the binarized images of composites with 1 wt% (a) and 5 wt% (b) of 6AH-modified ZnONPs.
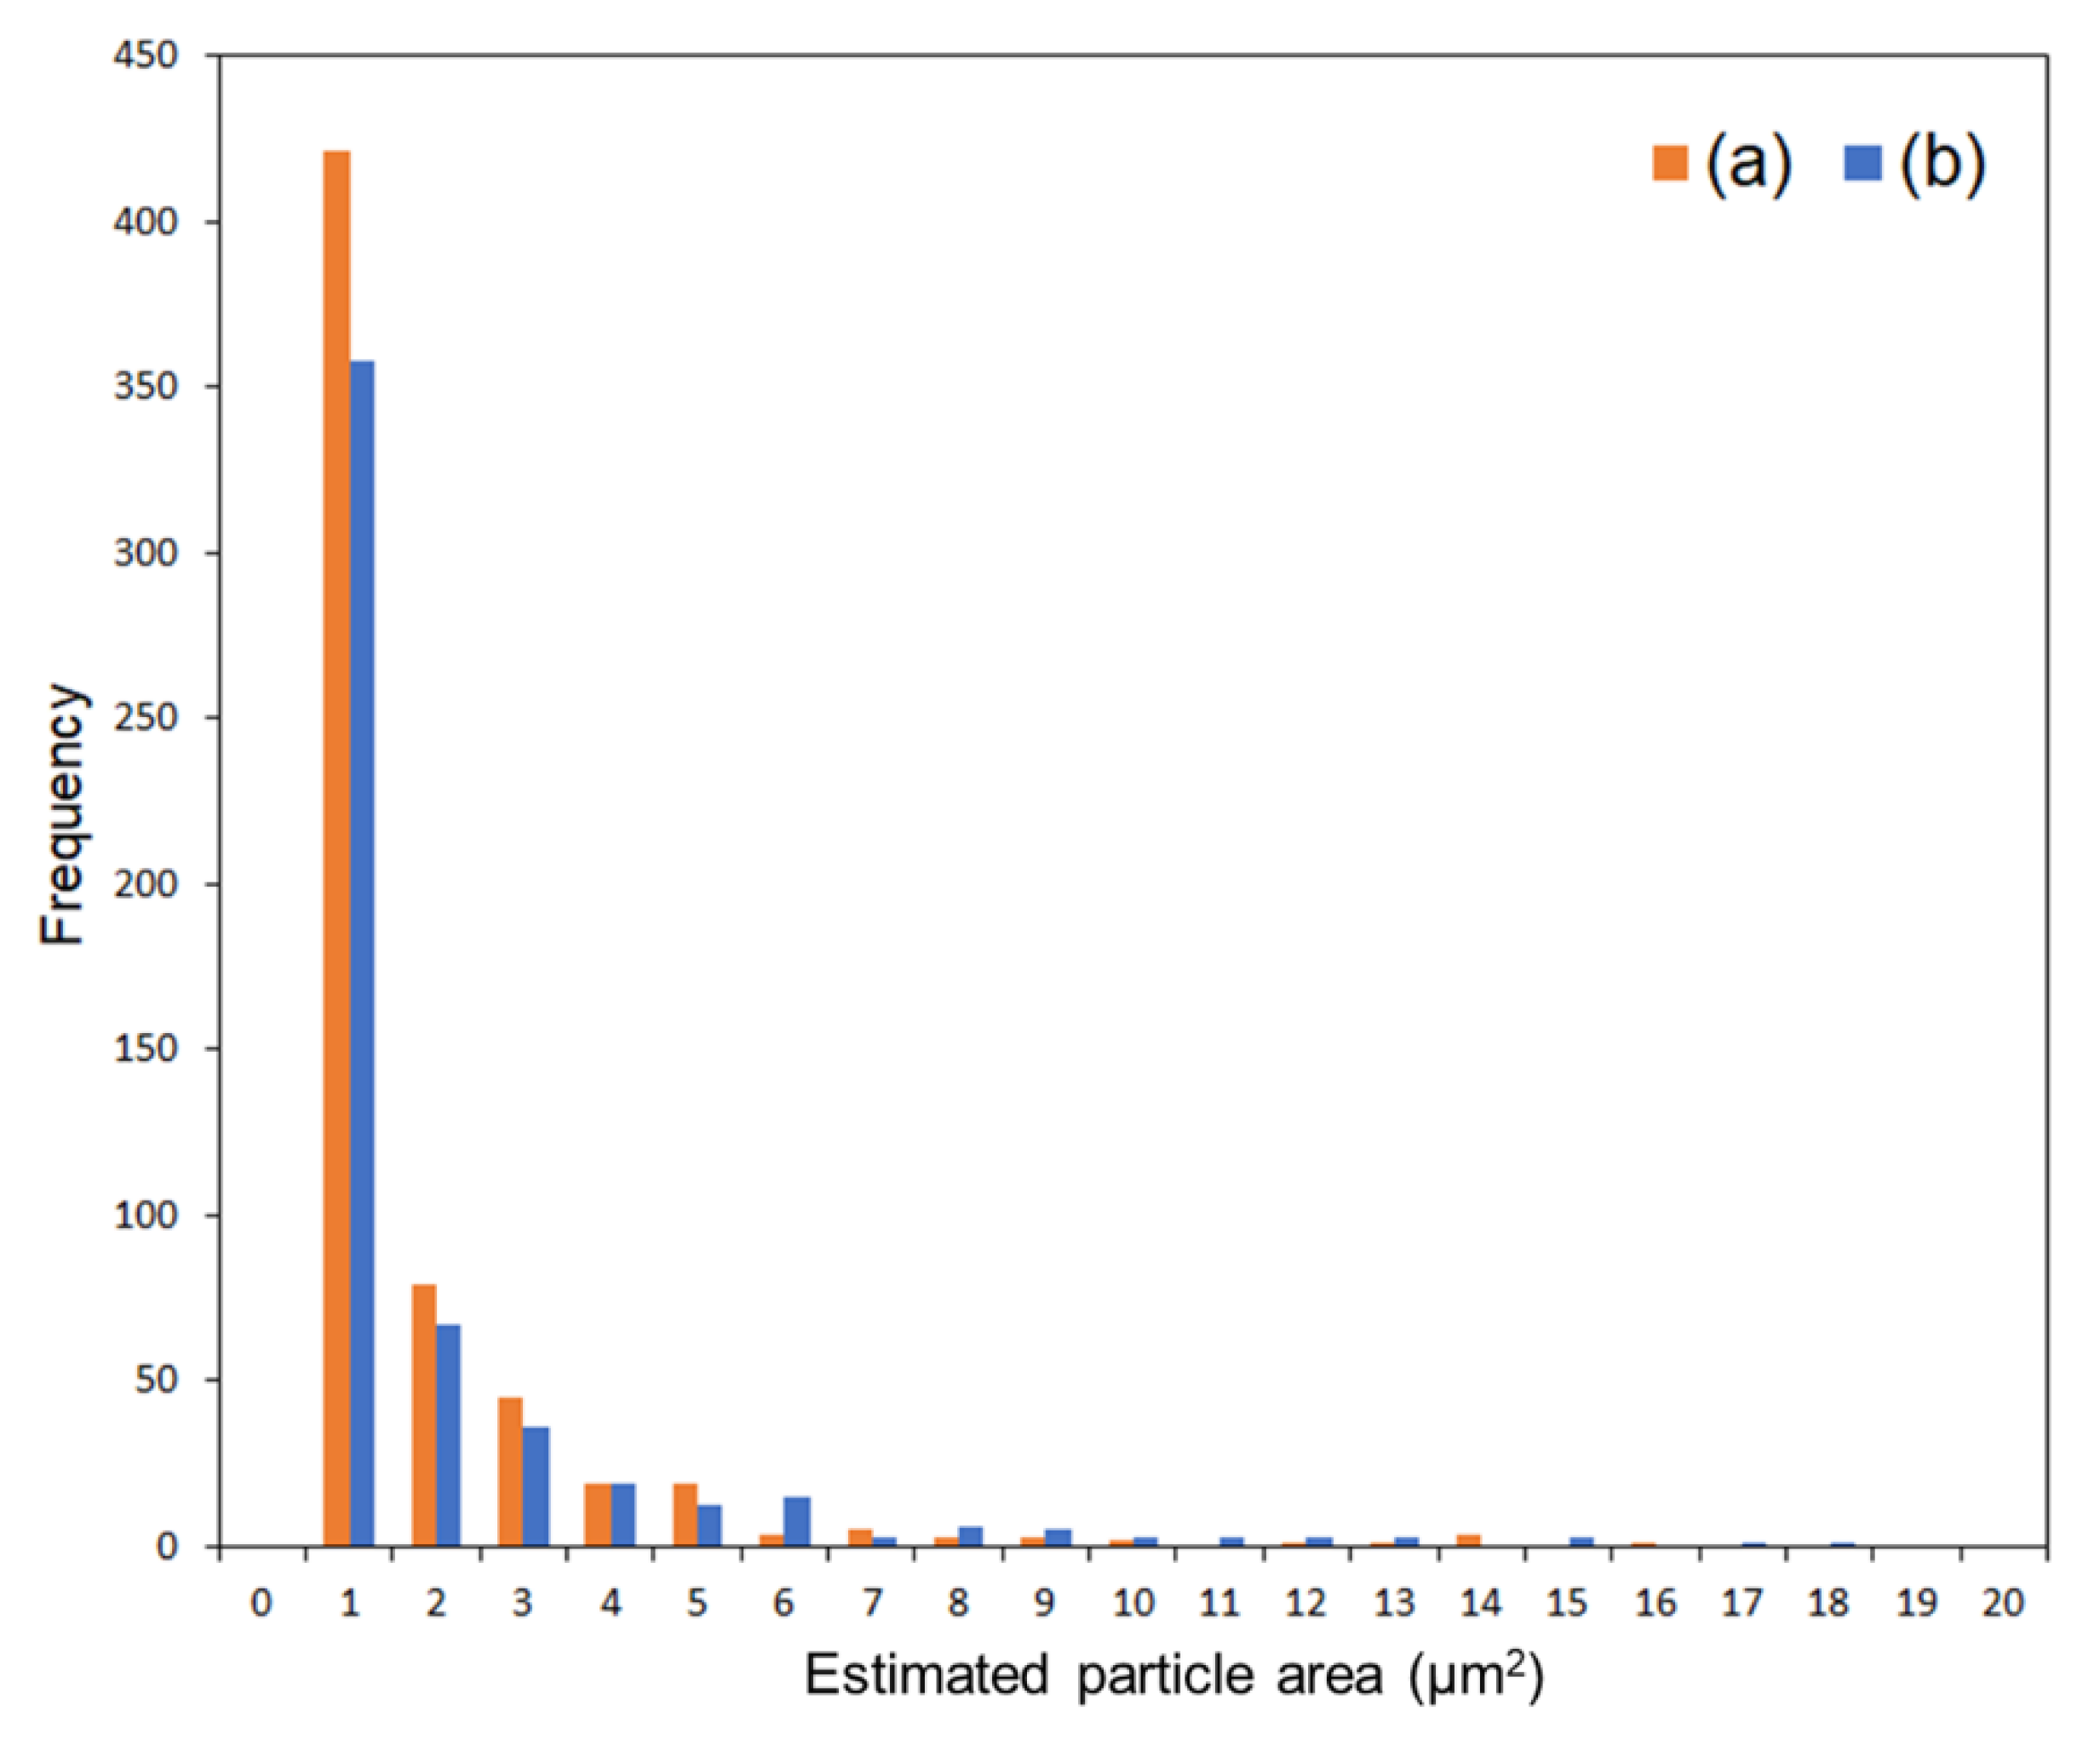
Figure 8.
Photographs of neat PLA (a) and composite films with unmodified ZnONPs at 1 wt% (b) and 5 wt% (c); 1-hexanol-modified ZnONPs at 1 wt% (d) and 5 wt% (e); and 6AH-modified ZnONPs at 1 wt% (f) and 5 wt% (g). The inserted values indicate contact angles.
Figure 8.
Photographs of neat PLA (a) and composite films with unmodified ZnONPs at 1 wt% (b) and 5 wt% (c); 1-hexanol-modified ZnONPs at 1 wt% (d) and 5 wt% (e); and 6AH-modified ZnONPs at 1 wt% (f) and 5 wt% (g). The inserted values indicate contact angles.
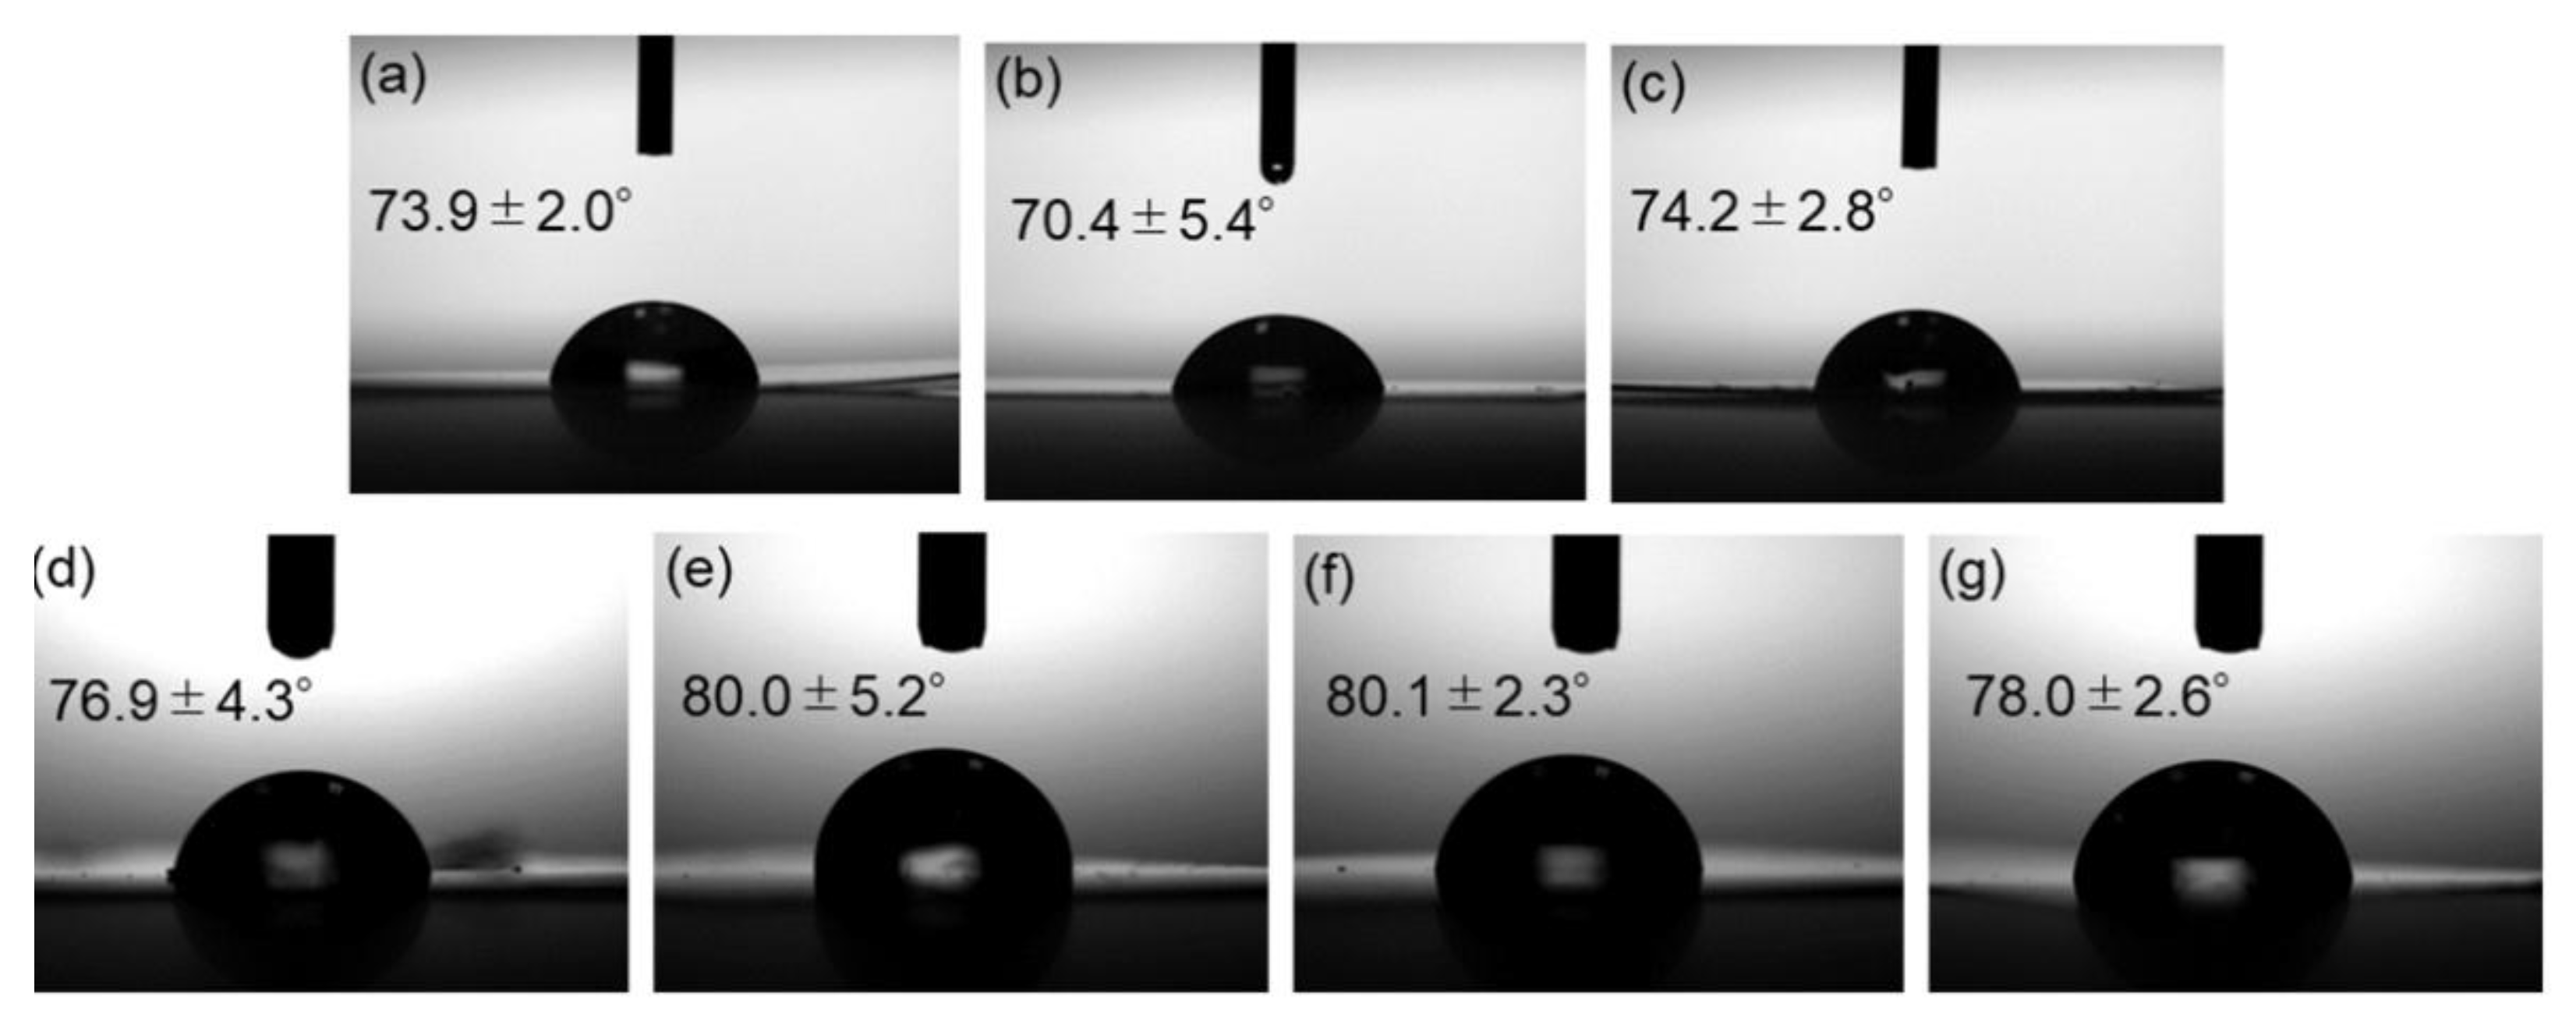

Table 1.
Binding energy and peak areas for the O 1s region of each XPS analysis.
| Average binding energy (eV) | Peak area (%) | ||||
| Zn-O | Zn-OH | C-O | ZnO+Zn-OH | C-O | |
| Modified ZnONP-80-1 | 530.6 | 531.4 | 532.5 | 91.2 | 8.8 |
| Modified ZnONP-120-1 | 530.7 | 531.5 | 532.2 | 99.4 | 0.6 |
| Modified ZnONP-80-24 | 530.6 | 531.4 | 532.8 | 95.6 | 4.4 |
| Modified ZnONP-120-24 | 530.7 | 531.4 | 532.6 | 92.2 | 7.8 |
| Unmodified ZnONP-120-1 | 530.7 | 531.5 | n. d. | - | - |
Disclaimer/Publisher’s Note: The statements, opinions and data contained in all publications are solely those of the individual author(s) and contributor(s) and not of MDPI and/or the editor(s). MDPI and/or the editor(s) disclaim responsibility for any injury to people or property resulting from any ideas, methods, instructions or products referred to in the content. |
© 2025 by the authors. Licensee MDPI, Basel, Switzerland. This article is an open access article distributed under the terms and conditions of the Creative Commons Attribution (CC BY) license (http://creativecommons.org/licenses/by/4.0/).
Copyright: This open access article is published under a Creative Commons CC BY 4.0 license, which permit the free download, distribution, and reuse, provided that the author and preprint are cited in any reuse.


