
Submitted:
28 May 2025
Posted:
29 May 2025
You are already at the latest version
Abstract
Earthquake prediction remains a significant challenge in seismology, and advancements in signal processing techniques have opened new avenues for improving prediction accuracy. This paper explores the application of Time-Frequency Distributions (TFDs) to seismic signals for earthquake prediction. TFDs provide a comprehensive analysis of the non-stationary nature of seismic data, allowing for identification of precursory patterns based on energy concentration features. Current earthquake prediction models primarily focus on long-term forecasts, predicting events by identifying a cycle in historical data, or on nowcasting, providing alerts seconds after a quake has begun. However, both approaches offer limited utility for disaster management, compared to short-term earthquake prediction methods. This paper proposes a new method for short-term earthquake prediction, tested through analysis of recent major earthquakes and their respective prior minor earthquakes for five earthquake-prone countries, namely Türkiye, Indonesia, Philippines, New Zealand, and Japan. Precursors in the time-frequency domain have been consistently identified in all datasets within several hours or a few days before the major earthquakes occurred, which were not present in the observation and analysis of the earthquake catalogs in time domain. This research contributes towards the ongoing efforts in earthquake prediction, highlighting the potential of quadratic non-linear TFDs as a significant tool for non-stationary seismic signal analysis and timely earthquake prediction. To the best of the authors’ knowledge, no similar approach for consistently detecting earthquake diagnostics precursors has been proposed, and therefore, we propose a novel approach in reliable earthquake prediction using TFDs analysis.
Keywords:
Diagnostic precursor detection
; time-frequency distribution
; major earthquake prediction
1. Introduction
In the recent years, the world has seen devastating earthquakes in various regions, namely the Turkey-Syria earthquake in 2023, Noto earthquake on New Year’s Day in 2024, and most recently, the Myanmar-Thailand earthquake.
Earthquakes are crucial for releasing energy accumulated in the Earth’s brittle outer layer, the lithosphere, through the movement of adjacent sections of the Earth’s crust driven by tectonic stresses. [1]. This energy is measured in Mw or Moment Magnitude Scale, which is the most popular metric used by seismologists worldwide to measure an earthquake in terms of energy released. Mw is derived from the seismic moment of an earthquake, calculated as the product of the fault displacement and the force required to cause the movement. This scale is logarithmic, where a one-unit increase in magnitude represents a tenfold increase in amplitude on a seismogram and approximately 31.6 times more energy release [2].
An early and accurate prediction of earthquake occurrences would lead to better disaster management and preparations for structural damage control, which reduces injuries and deaths caused by earthquakes, as well as economic losses [3,4,5]. As such, earthquake prediction is thought to be the ‘holy grail’ of seismology, as it is near impossible given the various factors and margin of error in time, place, and magnitude [6,7]. The Geological Society of United Kingdom in Earthquake Briefing, a policy document, mentions that currently, deterministically predicting the specific timing and location of earthquakes is not achievable; however, the identification of a ‘diagnostic precursor’ would be essential to enable such predictions [8]. Vladimir Keilis-Borok, the founding director of International Institute of Earthquake Prediction Theory and Mathematical Geophysics, Russian Academy of Sciences, in his seminal paper entitled Earthquake Prediction, stated that “Earthquake prediction is necessary to undertake disaster preparedness measures, reducing the damage from earthquakes. This requires that the accuracy of prediction be known, but, contrary to common belief, a timely prediction of low accuracy may be useful” [9]. Perhaps due to these glimpses of hope and optimistic sentiments that there are now many detection and early warning systems for earthquakes using big data through a network of seismic monitoring stations around the world [10,11], including a network of smartphones by the participating population [12]. China, for example, launched currently the largest Earthquake Early Warning system (EEW) in the world, named the National System for Fast Seismic Intensity Report and Earthquake Early Warning, comprising about 2,000 seismic stations, 3,200 strong-motion stations, and 10,000 micro-electro-mechanical system (MEMs) stations [13]. Ironically, the earliest known seismometer used for earthquake detection and by extension, an EEW, to mankind was also invented in China circa 132 CE during the Han dynasty by the legendary astronomer Zhang Heng [14]. While EEWs are crucial in enhancing survivability, and reducing injuries by alerting the masses, its effectiveness is hindered by its alert time-window, which is only several seconds before the earthquake shock reaches the masses. Short-term prediction systems, meanwhile, aim to predict major earthquake events in a location with a longer time-window i.e., hours prior. However, reliable short-term prediction systems for earthquakes remain a challenge, receiving critical responses [15,16] due to the impact of such a prediction system existing. Based on the state-of-the-art literature reviews, the key to predicting seismic events lie in big data, signal processing, and machine learning, including neural networks [17,18,19,20]. Among approaches performed previously are analysis on changes in horizontal positioning of geodetic stations [21,22], as well as analysis on FM radio wave-based signals [18].
Disturbingly, most of the earth’s fault lines that cause earthquakes have yet to experience their largest possible earthquake along their individual fault lines [23]. The analyzed 2023 Turkey-Syria earthquake, 2018 Sulawesi earthquake, 2022 Luzon earthquake, 2016 Kaikōura earthquake, and 2024 Noto earthquake, are the most recent major earthquakes from these earthquake-prone countries that saw earthquakes of magnitudes 7 and greater, in which destruction of physical structures caused by the disaster are almost guaranteed [24]; the 2023 Turkey-Syria earthquake saw the largest earthquake of the region in historical period. As for the selected earthquake incidents, reports estimate the total casualty of over 56,000 deaths, and total structural damages and immediate production capacity losses are estimated upwards of US$101 billion where the latest Noto earthquake losses alone is estimated to cost US$17 billion [25,26,27,28,29,30,31].
As these seismic movements or waves can be measured and recorded, with the intensity of the waves noted as magnitude, the recorded waves are essentially a time-series function describing the occurrences of earthquakes and their respective magnitudes. In a research conducted in 2023 aimed to answer the question “does catalogues of smaller earthquakes contain information about future larger earthquakes?”, John B. Rundle concluded, “that catalogues contain significant information on predictability of future large earthquakes” [32], consistent with his other related research [33,34]. This sentiment is also shared by other researchers [35]. As an earthquake can also be described as the dissipation of accumulated energy from tectonic stress in the lithosphere [1], Time-Frequency Distributions (TFD) analysis, with its energy concentration feature to describe the variation of energy over time, may prove to be useful to understand earthquakes [36]. TFDs are used in signal processing to analyze and characterize signals in the time and frequency domains simultaneously and have been used to analyze earthquake motion measured using accelerograms [37,38,39]. In this research, we propose to analyze earthquake records using TFDs method. While analyzing seismic data using TFD in the form of Short-Time Fourier Transform (STFT) and Wavelet Transform (WT) has been performed previously to obtain geological and stratigraphic information [40] as well as for earthquake pattern recognition and detection [41,42], this research introduces the calculation of mean energy concentration, as well as utilization of Cohen’s class TFD specifically Wigner-Ville (WVD) and Choi-Williams (CWD) distributions, aiming to seek major earthquake precursory patterns in the analyzed results for the purpose of timely short-time earthquake prediction. This method of combining Cohen’s class TFDs and calculation of mean energy concentration has been shown to be able to successfully identify precursory patterns to arrhythmia and ischemia occurrences based on electrocardiogram (ECG) datasets with high accuracy [43,44].
2. Materials and Methods
2.1. Data Sources
Datasets of the Turkey-Syria (2023), Sulawesi (2018), Luzon (2022), Kaikōura (2016), and Noto (2024) major earthquakes were used for the analysis conducted in this research [45,46,47,48,49]. The chosen earthquakes have a similarity in that the major earthquakes reported have Mw magnitudes of 7 or greater, as they are destructive and thus are more important to predict, and it is found previously that such earthquakes have precursors [21,22]. The datasets selected to be analyzed span one month inclusive of the major earthquakes, since this research focuses on short-term prediction in the range of hours and days before the earthquake occurrences. It is noted that the datasets used in this research are sampled using geophonic sensors. For this research, we will only be focusing on the timestamp and magnitude data as the time-series function to undergo Time-Frequency Distributions (TFDs). The earthquakes that are selected to be part of the analysis are the latest major earthquakes of each region or country, and the minor earthquakes spanning 1 month before the respective major earthquakes. It is noted that the dataset obtained for the 5 countries are incomplete with irregular samples, thus a data interpolation method is required to obtain a regularly sampled time-series function for analysis. This is especially so for Noto, Kaikōura, and Luzon earthquake catalogs, as the threshold set for an earthquake to be recorded in their respective catalogues is Mw 3.0.
2.2. Data Interpolation
While the average sampling period can be calculated from observing the summary of each dataset (refer Table 1), all datasets appear to show irregular sampling, which is not meeting a crucial criterion for applying the key function for TFDs - Fast Fourier Transform (FFT) - i.e., the time-series data provided must be, or is assumed to be, regularly sampled [50]. Therefore, a data interpolation method is used to estimate and produce regularly sampled data based on each dataset. The interpolation method used is linear interpolation, which is done by estimating values between two adjacent points using a straight line. As earthquake occurrences are not a high frequency phenomenon, losing high frequency information due to linear data interpolation can be considered minimal impact to analysis result reliability, if not negligible. The linear interpolation formula used to determine the magnitude Mw of the interpolated data at a time T with the known discrete magnitude and time before T (Mw0, T0) and after T (Mw1, T1) is as follows [51]:
(1)
2.3. Time-Frequency Distributions (TFDs)
Time-frequency analysis is mainly achieved by formulating a function which represents the input signal in both time and frequency spectrum simultaneously, instead of either within time or frequency domain. This function or process can then be changed to suit the various use-cases that contain a time-varying spectrum [52]. There is no objective representation for signal energy changes over time and frequency, and this resulted in several proposals [53]. These proposals can be summarized in the following process in Figure 1.
2.4. Short-Time Fourier Transform (STFT)
The Short-Time Fourier Transform (STFT), also known as spectrogram distribution, is a signal processing method used to analyze multi-component signals. The key idea of this method is to apply FFT over a fixed width window moving over time, resulting in the change of spectrum of a signal over each frame.
2.5. Wigner-Ville Distribution (WVD)
One of the most significant and well-known representations of signal energy distribution is the quadratic class, or Cohen’s class [53]. However, Cohen’s class distribution is hampered by unwanted cross-terms between frequency components [55]. The Wigner-Ville distribution (WVD) belongs to this non-linear TFD category, with its calculation for a continuous signal on a specific frequency is given in (2) [56]. WVD covers most mathematical properties involved in analysis; real-valued, maintains time and shifting frequencies, and satisfies marginal features that generate an instantaneous power and power spectrum.
(2)
Where x(t) is the interpolated magnitude signal in time-series with constant sampling rate, and is a desired single frequency band.
2.6. Choi-Williams Distribution
One of the best methods from the Cohen’s Class of non-linear time-frequency for reducing these terms to the minimum is the Choi-Williams class kernel (CWD), with the distribution on a specific frequency of a discrete signal x(n) expressed as (3) [57].
(3)
2.7. Continuous Wavelet Transform (CWT)
Continuous Wavelet Transform is more dynamic to represent a signal without constant windowing as compared to STFT [58]. CWT utilizes a group of functions called wavelets, which are generated by shifting and scaling a mother wavelet function. The CWT of a signal x(t) can be defined as follows [58]:
, (4)
where
2.8. Mean Energy Concentration
The mean energy concentration of TFDs refers to the distribution of energy across the time and/or frequency axes in the TFD representation and provides insights into the dominant time-frequency regions where the signal’s energy is concentrated. As earthquakes are essentially energy released by the lithosphere, mean energy concentration of TFDs would be an appropriate measurement to reflect the nature of earthquakes [59]. For this research, we will be focusing on the mean energy concentration on the time axis of the TFD representation of the earthquake datasets for any precursory behavior prior to the major earthquakes that are not apparent in the raw earthquake catalogues.
2.9. Analysis Procedure
The analysis procedure performed on the earthquake datasets providing the results for this research are shown in Figure 2.
3. Results
Each data is linearly interpolated to preserve the low frequency content. This allows the interpolated data to be analyzed using the time-frequency analysis methods of STFT, WVD, CWD, and CWT, as a constant sampling rate of a signal is a prerequisite for these discrete time-frequency analysis. It is noted that the datasets for these earthquakes have varying ranges of samples, and therefore, several parameters are adjusted, namely the resampling rate for interpolation of data, the window sizes to optimize both time and frequency resolution for STFT, and the time slots used for mean energy concentration calculation. The estimated time of occurrence for each major earthquake is noted and set as the origin time for better visualization and comprehension. Figure 3, Figure 4, Figure 5, Figure 6 and Figure 7 visualizes the comparisons for the interpolated data against the STFT, CWD, WVD, and CWT sets for each of the earthquakes respectively.
4. Discussion
From the TFD visualizations of the earthquakes, it can be said that the TFD methods were able to provide spectral information of the earthquakes, as well as the frequency variations over time, providing more insight into the earthquakes. Each of the mean energy concentration results were also able to correctly show the estimated time when the major earthquakes occurred, marking them with a peak.
On observation of the comparisons of the earthquake data, heatmap, and the mean energy concentration derived from the respective TFDs, it is seen that there are a few minor peaks visualized in the mean energy concentration graphs, which were initially barely, if not unnoticeable, in the earthquake signals. The elapsed time in seconds of the peaks since the first sample timestamp of each dataset were noted, and the estimated timestamps in UTC are calculated and tabulated in Table 2, Table 3, Table 4, Table 5 and Table 6.
It is shown that for all major earthquakes in question, there are at least 1 minor earthquake occurring between 11 to 66 hours prior. This timeframe is consistent with results from different approaches [18,21,22]. On the raw earthquake data, it is noted that lower magnitude level earthquakes are significantly more common compared to higher magnitude level earthquakes (Table 7). It is also noted that earthquakes of magnitudes 4.0 to 5.0 are consciously noticeable, and magnitudes 5.0 to 6.0 are noticeable but incidents or injuries caused by these magnitudes are not common [24].
Observing the percentage of minor earthquakes recorded against the percentage of major earthquakes recorded (Table 7), the ratio of recorded minor earthquakes to major earthquakes is staggeringly high. This indicates that the occurrences of minor earthquakes alone do not constitute a precursor to the occurrence of major earthquakes, and as such, observing the time-series data of earthquake signals is insufficient to predict major earthquakes.
In support of this research’s proposed method, the mean energy concentration of the TFD data of the earthquake signals provides possible hints towards the major earthquake occurrences, with peaks corresponding to some of the minor earthquakes. However, it is also noted that not all recorded minor earthquakes have a corresponding mean energy concentration peak, as seen from the overwhelming number of minor earthquakes with magnitudes 1 to 4, compared to only a few mean energy concentration peaks. In other words, the occurrence or lack of minor earthquakes within a timeframe is not the sole factor contributing to the mean energy concentration of that timeframe, but the mean energy concentration is indicative of a signal or data pattern which could indicate a major earthquake.
While the number of major earthquakes analyzed in this research is currently insufficient for rigorous statistical analysis, it can be said that there are no false negative occurrences thus far.
4.1. Endpoint Effect
It is worth noting that the earthquake catalog for Sulawesi earthquake spanned until 2018-11-29 23:54:50 UTC, which is relatively close to the main shock at around 2018-09-28 10:02:00 UTC. This may cause an error during TFD process known as endpoint effect, which causes distorted or inaccurate representations of the signal’s time-frequency content near the edges of the analyzed signal [59]. For this reason, a method to reduce said endpoint effect has been adapted [59].
4.2. TFD Comparisons
Among the visualized results (STFT, CWD, WVD, CWT), STFT visualization is the easiest to understand intuitively followed by CWT, and are more suitable for viewing, while CWD and WVD showed more well-defined mean energy concentration visualizations. In terms of accuracy, CWD shows a more accurate-to-reality graph of mean energy concentration, correctly placing all major peaks at 100% mean energy concentration, as opposed to STFT and WVD (see Figure 5c as opposed to Figure 5a,b), while CWT, although having some similar features in its mean energy concentration graph with STFT, CWD, and WVD such as the presence of minor peaks and major peaks, seems to be the most different from the rest. This can be attributed to the fact that CWT does not produce a time-frequency domain result of the input signal, but rather a time-scale output.
The fundamentals of earthquakes lie in the complex interactions of the Earth’s lithosphere at plate boundaries, and understanding these interactions is the key to studying earthquake mechanisms and potentially predicting their occurrence [60,61]. Due to the non-linearity nature of lithosphere dynamics causing non-stationary, time-varying, and multi-spectral earthquake motion, non-linear TFDs (WVD, CWD) prove to be more effective as compared to linear TFD (STFT), showing more well-defined mean energy concentration visualization. Of the Cohen’s class TFDs used, it can be concluded that CWD is more effective and accurate between the two. This conclusion is expected as CWD does have advantages over WVD in multi-component signal analysis [62]. A summary of the CWD TFDs results across all earthquake datasets are shown in Table 8.
4.3. Limitations and Further Research
This research employs only the magnitude and timestamp of the earthquake datasets in the investigated regions to form a time-series signal in the method of analysis, and therefore, can predict only an estimated time, magnitude, and the region of major earthquake (time, size, and location) [63]. Various other measured parameters have yet to be included in the calculation.
The time window between the precursor pattern to the major earthquake found in this research ranges between 11 to 66 hours, which perhaps is acceptable for a prediction timeframe, providing enough time for authorities to warn the public, however the authors believe that the accuracy of the time window can be further improved, with more complete data at a higher and regular sampling rate. The authors also believe that deep learning-based methods in combination with the proposed TFDs analysis would be able to provide a prediction process with enhanced efficiency and efficacy, possibly solving the issue of sparse data in our proposed process [64].
5. Conclusions
In this study, we have explored the utilization of Time-Frequency Distributions (TFDs) on seismic signals for earthquake prediction, demonstrating the effectiveness of TFD-based techniques and enabling the identification of patterns leading up to major earthquakes. Notably, non-linear quadratic Cohen’s class TFDs, especially Choi-Williams Distribution (CWD), prove to be more effective and accurate in analyzing earthquake records as they are non-stationary, multi-spectral, and time-varying in nature.
Through experimentation on real-world earthquakes, the results indicate that TFD-based techniques show great potential in short-term prediction of seismic events. The usage of TFDs provides valuable insights into the dynamics of earthquakes, while the identification of diagnostic precursor patterns enables improved prediction capabilities. This information can aid in the development of advanced prediction models and early warning systems, and consequently, proactive measures for disaster and potentially reduce human and economic losses caused by earthquakes. With a reliable prediction method, countries expecting a major earthquake in the upcoming years such as Japan [65] and Philippines [66] would be able to better prepare their citizens and crisis teams.
In a similar sentiment that smaller earthquakes contain insight to future larger earthquakes [32,33,34,35], this paper concludes that the analysis of earthquake records using TFDs opens new possibilities in earthquake short-term prediction, a possibility which many considered to be impossible previously. The advancements made in this study contribute to the growing body of knowledge in seismology.
Author Contributions
Conceptualization, S.H. and F.L.; methodology, S.H.; software, F.L.; validation, N.M., N.K. and F.R.; formal analysis, F.L.; investigation, F.L. and S.H.; data curation, F.L.; writing—original draft preparation, F.L.; writing—review and editing, S.H, N.M., N.K. and F.R.; visualization, F.L.; supervision, S.H., F.R., and N.K. All authors have read and agreed to the published version of the manuscript.
Funding
This research received no external funding.
Institutional Review Board Statement
Not applicable.
Informed Consent Statement
Not applicable.
Data Availability Statement
All earthquake datasets used in this paper are publicly available: 1. Dincer, B. (2023). EarthQuake Turkey 06 Feb 2023 - Latest. Kaggle. https://www.kaggle.com/datasets/brsdincer/earthquake-turkey-06-feb-2023-latest. 2. BMKG Earthquakes in Indonesia 2023. https://www.kaggle.com/dsv/5415797. 3. PHIVOLCS Latest Earthquake Information. https://earthquake.phivolcs.dost.gov.ph/EQLatest-Monthly/2022/2022_July.html. 4. GeoNet Quake Search. https://quakesearch.geonet.org.nz/csv?bbox=172.8479,-43.3012,177.7368,-39.0704&startdate=2016-11-01T0:00:00&enddate=2016-11-30T23:00:00. 5. Earthquake Information. https://www.data.jma.go.jp/multi/quake/index.html?lang=en
Acknowledgments
We express gratitude to Universiti Putra Malaysia for their commitment to fostering academic research and innovation.
Conflicts of Interest
The authors declare no conflicts of interest.
Abbreviations
The following abbreviations are used in this manuscript:
| TFD | Time-Frequency Distribution |
| FM | Frequency Modulation |
| EEW | Earthquake Early Warning |
| MEM | Micro-electro-mechanical |
| WT | Wavelet Transform |
| FFT | Fast-Fourier Transform |
| STFT | Short-Time Fourier Transform |
| WVD | Wigner-Ville Distribution |
| CWD | Choi-Williams Distribution |
| CWT | Continuous Wavelet Transform |
| UTC | Universal Time Coordinated |
References
- Zaccagnino, D.; Doglioni, C. The Impact of Faulting Complexity and Type on Earthquake Rupture Dynamics. Commun Earth Environ 2022, 3, 258. [Google Scholar] [CrossRef]
- Hanks, T.C.; Kanamori, H. A Moment Magnitude Scale. J Geophys Res Solid Earth 1979, 84, 2348–2350. [Google Scholar] [CrossRef]
- Tao, D.; Lin, J.; Lu, Z. Time-Frequency Energy Distribution of Ground Motion and Its Effect on the Dynamic Response of Nonlinear Structures. Sustainability 2019, 11. [Google Scholar] [CrossRef]
- Li, S.; Tang, J. On Vibration Suppression and Energy Dissipation Using Tuned Mass Particle Damper. J Vib Acoust 2017, 139, 11008. [Google Scholar] [CrossRef]
- Spencer, B.F.; Nagarajaiah, S. State of the Art of Structural Control. Journal of Structural Engineering 2003, 129, 845–856. [Google Scholar] [CrossRef]
- Hough, S. T: Great Quake Debate, 2020.
- Can You Predict Earthquakes? Available online: https://www.usgs.gov/faqs/can-you-predict-earthquakes (accessed on 26 March 2024).
- Earthquakes: Prediction, Forecasting and Mitigation Available online:. Available online: https://www.geolsoc.org.uk/earthquake-briefing (accessed on 8 February 2024).
- Keilis-Borok, V. Earthquake Prediction: State-of-the-Art and Emerging Possibilities. Annu Rev Earth Planet Sci 2002, 30, 1–33. [Google Scholar] [CrossRef]
- Kodera, Y.; Hayashimoto, N.; Moriwaki, K.; Noguchi, K.; Saito, J.; Akutagawa, J.; Adachi, S.; Morimoto, M.; Okamoto, K.; Honda, S.; et al. First-Year Performance of a Nationwide Earthquake Early Warning System Using a Wavefield-Based Ground-Motion Prediction Algorithm in Japan. Seismological Research Letters 2020, 91, 826–834. [Google Scholar] [CrossRef]
- Datta, A.; Wu, D.J.; Zhu, W.; Cai, M.; Ellsworth, W.L. DeepShake: Shaking Intensity Prediction Using Deep Spatiotemporal RNNs for Earthquake Early Warning. Seismological Research Letters 2022, 93, 1636–1649. [Google Scholar] [CrossRef]
- Kong, Q.; Allen, R.M.; Schreier, L.; Kwon, Y.W. Earth Sciences: MyShake: A Smartphone Seismic Network for Earthquake Early Warning and Beyond. Sci Adv 2016, 2. [Google Scholar] [CrossRef]
- Peng, C.; Jiang, P.; Ma, Q.; Su, J.; Cai, Y.; Zheng, Y. Chinese Nationwide Earthquake Early Warning System and Its Performance in the 2022 Lushan M6.1 Earthquake. Remote Sens (Basel) 2022, 14, 4269. [Google Scholar] [CrossRef]
- Feng, R.; Yu, Y. ZHANG Heng’s Seismometer and Longxi Earthquake in AD 134. Acta Seismologica Sinica 2006, 19, 704–719. [Google Scholar] [CrossRef]
- Geller, R.J. Earthquake Prediction: A Critical Review. Geophys J Int 1997, 131, 425–450. [Google Scholar] [CrossRef]
- Kato, M. On the Apparently Inappropriate Use of Multiple Hypothesis Testing in Earthquake Prediction Studies. Seismological Research Letters 2019, 90, 1330–1334. [Google Scholar] [CrossRef]
- Arrowsmith, S.J.; Trugman, D.T.; MacCarthy, J.; Bergen, K.J.; Lumley, D.; Magnani, M.B. Big Data Seismology. Reviews of Geophysics 2022, 60, e2021RG000769. [Google Scholar] [CrossRef]
- L, S.; N, A.; Prasanna, K.; Haneesh, A.N. FM Radio Wave Based Early Earthquake Detection. 2021 8th International Conference on Computing for Sustainable Global Development (INDIACom) 2021, 736–741. [Google Scholar]
- Hutchison, A. How Machine Learning Might Unlock Earthquake Prediction Available online:. Available online: https://www.technologyreview.com/2023/12/29/1084699/machine-learning-earthquake-prediction-ai-artificial-intelligence/ (accessed on 26 March 2024).
- Mignan, A.; Broccardo, M. Neural Network Applications in Earthquake Prediction (1994–2019): Meta-Analytic and Statistical Insights on Their Limitations. Seismological Research Letters 2020, 91, 2330–2342. [Google Scholar] [CrossRef]
- Bürgmann, R. Reliable Earthquake Precursors? Science (1979) 2023, 381, 266–267. [Google Scholar] [CrossRef]
- Bletery, Q.; Nocquet, J.-M. The Precursory Phase of Large Earthquakes. Science (1979) 2023, 381, 297–301. [Google Scholar] [CrossRef]
- Wells, D.L.; Coppersmith, K.J. New Empirical Relationships among Magnitude, Rupture Length, Rupture Width, Rupture Area, and Surface Displacement. Bulletin of the Seismological Society of America 1994, 84, 974–1002. [Google Scholar] [CrossRef]
- Rafferty, J.P. Richter Scale Available online:. Available online: https://www.britannica.com/science/Richter-scale (accessed on 20 July 2023).
- Naddaf, M. Turkey–Syria Earthquake: What Scientists Know. Nature 2023, 614, 398–399. [Google Scholar] [CrossRef]
- BNPB: Kerugian Akibat Gempa Palu Capai Rp18,4 Triliun. CNN Indonesia 2018.
- Loft, P. 20 February 2023.
- Dal Zilio, L.; Ampuero, J.-P. Earthquake Doublet in Turkey and Syria. Commun Earth Environ 2023, 4, 71. [Google Scholar] [CrossRef]
- Economic Impact of Kaikōura Quake Revealed. New Zealand Government 2017.
- Demiralp, S. The Economic Impact of the Turkish Earthquakes and Policy Options 2023.
- AFP Quake Could Cost US$17bil. Star 2024.
- Rundle, J.B.; Donnellan, A.; Fox, G.; Ludwig, L.G.; Crutchfield, J. Does the Catalog of California Earthquakes, With Aftershocks Included, Contain Information About Future Large Earthquakes? Earth and Space Science 2023, 10, e2022EA002521. [Google Scholar] [CrossRef]
- Baughman, I.; Rundle, J.B.; Zhang, T. Nowcasting ETAS Earthquakes: Information Entropy of Earthquake Catalogs 2023.
- Rundle, J.B.; Giguere, A.; Turcotte, D.L.; Crutchfield, J.P.; Donnellan, A. Global Seismic Nowcasting With Shannon Information Entropy. Earth and Space Science 2019, 6, 191–197. [Google Scholar] [CrossRef]
- Wang, X.; Zhong, Z.; Yao, Y.; Li, Z.; Zhou, S.; Jiang, C.; Jia, K. Small Earthquakes Can Help Predict Large Earthquakes: A Machine Learning Perspective. Applied Sciences 2023, 13. [Google Scholar] [CrossRef]
- Sejdić, E.; Djurović, I.; Jiang, J. Time–Frequency Feature Representation Using Energy Concentration: An Overview of Recent Advances. Digit Signal Process 2009, 19, 153–183. [Google Scholar] [CrossRef]
- Demetriu, S.; Romica, T. Time-Frequency Representations of Earthquake Motion Records. 2003, 11. 11.
- Huerta-Lopez, C.I.; Shin, Y.; Powers, E.J.; Roesset, J.M. Time-Frequency Analysis of Earthquake Records. In Proceedings of the 12th World Conference on Earthquake Engineering, Auckland; 2000. [Google Scholar]
- Upegui-Botero, F.M.; Huerta-López, C.I.; Caro-Cortes, J.A.; Mart\’\inez-Cruzado, J.A.; Suarez-Colche, L.E. Joint Time-Frequency Analysis of Seismic Records. In Proceedings of the Proceedings of the 15th world conference on earthquake engineering.
- Liu, W.; Cao, S.; Chen, Y. Seismic Time-Frequency Analysis via Empirical Wavelet Transform. IEEE Geoscience and Remote Sensing Letters 2016, 13, 28–32. [Google Scholar] [CrossRef]
- Han, L.; Bonar, D.; Sacchi, M. Seismic Denoising by Time-Frequency Reassignment. CSEG Expanded Abstracts 2012. [Google Scholar]
- Rivero-Moreno, C.; Escalante-Ramirez, B. Seismic Signal Detection with Time-Frequency Models. In Proceedings of the Proceedings of Third International Symposium on Time-Frequency and Time-Scale Analysis (TFTS-96).
- Hussein, A.F.; Hashim, S.J.; Aziz, A.F.A.; Rokhani, F.Z.; Adnan, W.A.W. Performance Evaluation of Time-Frequency Distributions for ECG Signal Analysis. J Med Syst 2018, 42, 15. [Google Scholar] [CrossRef] [PubMed]
- Hussein, A.F.; Hashim, S.J.; Rokhani, F.Z.; Wan Adnan, W.A. An Automated High-Accuracy Detection Scheme for Myocardial Ischemia Based on Multi-Lead Long-Interval ECG and Choi-Williams Time-Frequency Analysis Incorporating a Multi-Class SVM Classifier. Sensors 2021, 21. [Google Scholar] [CrossRef] [PubMed]
- Dincer, B. EarthQuake Turkey 06 Feb 2023 - Latest 2023. Available online: https://www.kaggle.com/datasets/brsdincer/earthquake-turkey-06-feb-2023-latest (accessed on 14 March 2023).
- BMKG Earthquakes in Indonesia 2023. Available online: https://www.kaggle.com/dsv/5415797 (accessed on 22 May 023). [CrossRef]
- PHIVOLCS Latest Earthquake Information Available online:. Available online: https://earthquake.phivolcs.dost.gov.ph/EQLatest-Monthly/2022/2022_July.html (accessed on 14 May 2023).
- GeoNet Quake Search Available online:. Available online: https://quakesearch.geonet.org.nz/csv?bbox=172.8479,-43.3012,177.7368,-39.0704&startdate=2016-11-01T0:00:00&enddate=2016-11-30T23:00:00 (accessed on 3 August 2023).
- Earthquake Information Available online:. Available online: https://www.data.jma.go.jp/multi/quake/index.html?lang=en (accessed on 5 January 2024).
- Cochran, W.T.; Cooley, J.W.; Favin, D.L.; Helms, H.D.; Kaenel, R.A.; Lang, W.W.; Maling, G.C.; Nelson, D.E.; Rader, C.M.; Welch, P.D. What Is the Fast Fourier Transform? Proceedings of the IEEE 1967, 55, 1664–1674. [Google Scholar] [CrossRef]
- RP, C.S.C.C. Numerical Methods for Engineers 2002.
- Hlawatsch, F.; Auger, F. Time-Frequency Analysis; ISTE; Wiley, 2013; ISBN 9781118623831.
- Li, G.Z.; Ren, X.; Zhang, B.; Zong, G. Analysis of Time-Frequency Energy for Environmental Vibration Induced by Metro. In Proceedings of the Proceedings of the 6th International Conference on Advances in Experimental Structural Engineering, United States.
- Najmi, A.H. The Wigner Distribution: A Time-Frequency Analysis Tool. Johns Hopkins APL Tech Dig 1994, 15, 298. [Google Scholar]
- Pereira, G.R.; de Oliveira, L.F.; Nadal, J. Reducing Cross Terms Effects in the Choi–Williams Transform of Mioelectric Signals. Comput Methods Programs Biomed 2013, 111, 685–692. [Google Scholar] [CrossRef]
- Cohen, L. Time-Frequency Analysis; Electrical engineering signal processing; Prentice Hall PTR, 1995; ISBN 9780135945322.
- Choi, H.-I.; Williams, W.J. Improved Time-Frequency Representation of Multicomponent Signals Using Exponential Kernels. IEEE Trans Acoust 1989, 37, 862–871. [Google Scholar] [CrossRef]
- Mallat, S. A Wavelet Tour of Signal Processing, Third Edition: The Sparse Way; 3rd ed.; Academic Press, Inc.: USA, 2008; ISBN 0123743702. [Google Scholar]
- LV, C.; ZHAO, J.; WU, C.; GUO, T.; CHEN, H. Optimization of the End Effect of Hilbert-Huang Transform (HHT). Chinese Journal of Mechanical Engineering 2017, 30, 732–745. [Google Scholar] [CrossRef]
- Keilis-Borok, V.; Ismail-Zadeh, A.; Kossobokov, V.; Shebalin, P. Non-Linear Dynamics of the Lithosphere and Intermediate-Term Earthquake Prediction. Tectonophysics 2001, 338, 247–260. [Google Scholar] [CrossRef]
- Nonlinear Dynamics of the Lithosphere and Earthquake Prediction; Keilis-Borok, V. I., Soloviev, A.A., Eds.; Springer Berlin Heidelberg: Berlin, Heidelberg, 2003; ISBN 978-3-642-07806-4. [Google Scholar]
- Shafi, I.; Ahmad, J.; Shah, S.I.; Kashif, F.M. Techniques to Obtain Good Resolution and Concentrated Time-Frequency Distributions: A Review. EURASIP J Adv Signal Process 2009, 2009, 673539. [Google Scholar] [CrossRef]
- Wyss, M. Why Is Earthquake Prediction Research Not Progressing Faster? Tectonophysics 2001, 338, 217–223. [Google Scholar] [CrossRef]
- Liu, N.; Lei, Y.; Liu, R.; Yang, Y.; Wei, T.; Gao, J. Sparse Time-Frequency Analysis of Seismic Data: Sparse Representation to Unrolled Optimization. IEEE Transactions on Geoscience and Remote Sensing 2023. [Google Scholar] [CrossRef]
- Hurst, D. “This Is Not a ‘What If’ Story”: Tokyo Braces for the Earthquake of a Century. The Guardian 2019.
- Are You Ready For “The Big One”? Lockforce 2022.
Figure 1.
Computation of Time-Frequency Distributions (FFT = Fast Fourier Transform) [54].
Figure 1.
Computation of Time-Frequency Distributions (FFT = Fast Fourier Transform) [54].
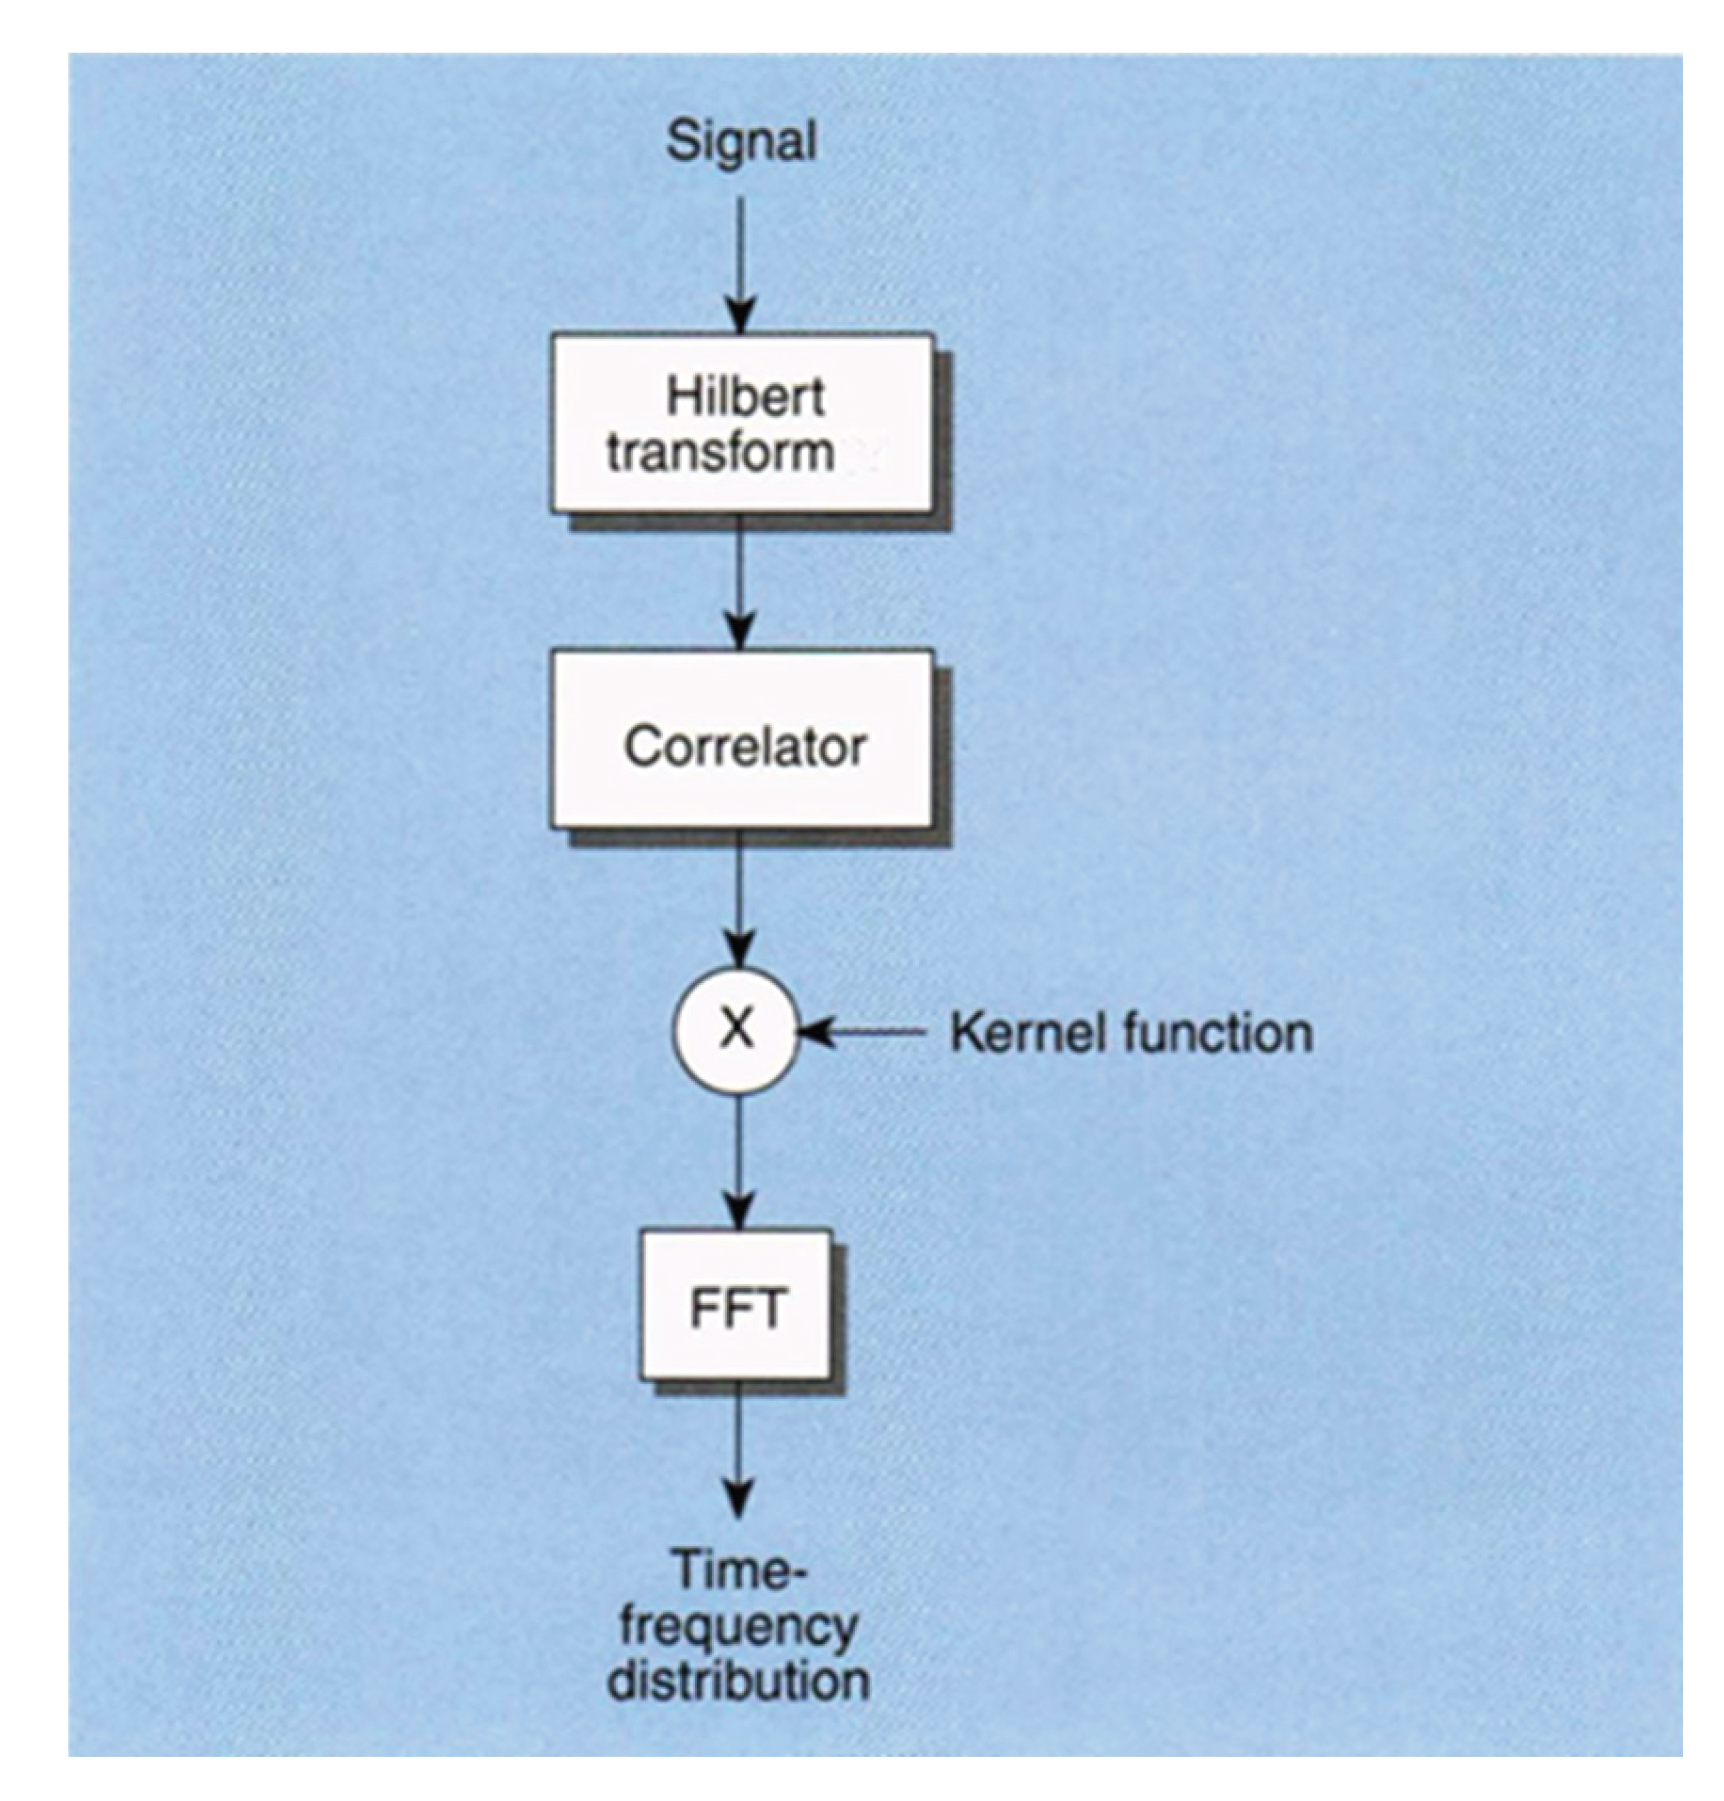
Figure 2.
Full Analysis Procedure.
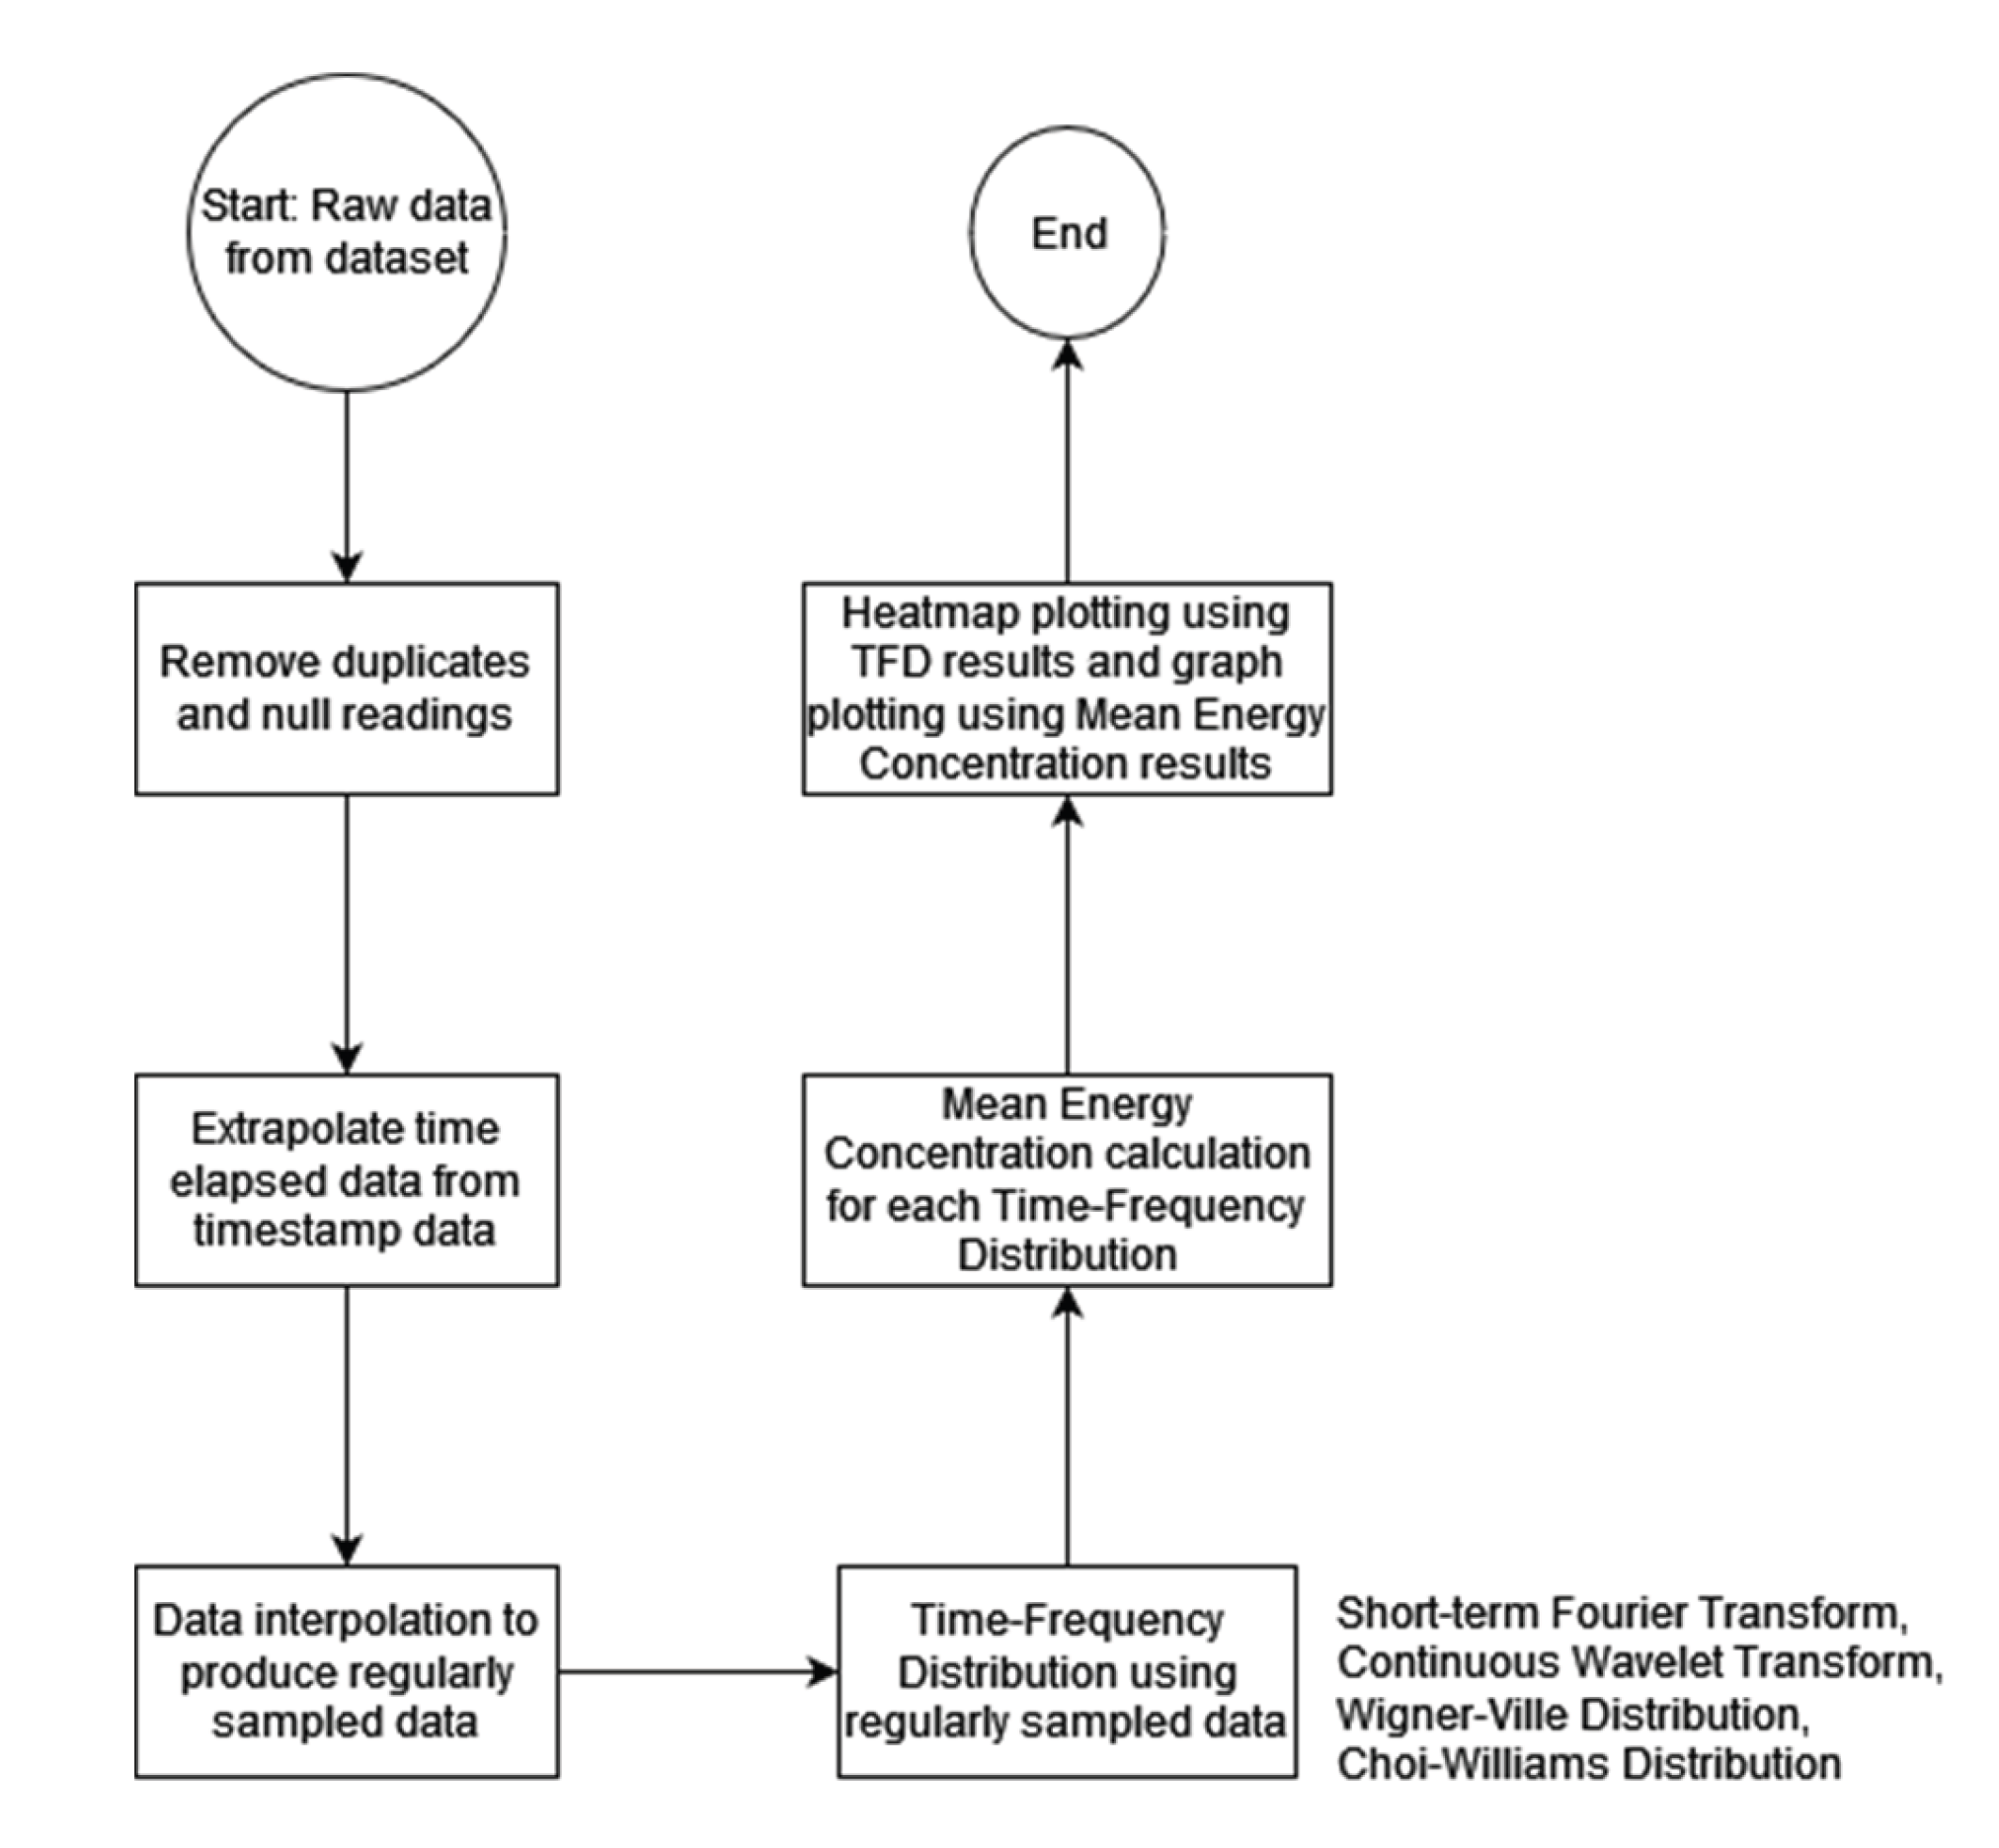
Figure 3.
Comparison Between Interpolated Signal of the Turkey-Syria Earthquake Dataset Against Heatmap and Mean Energy Concentration.
Figure 3.
Comparison Between Interpolated Signal of the Turkey-Syria Earthquake Dataset Against Heatmap and Mean Energy Concentration.
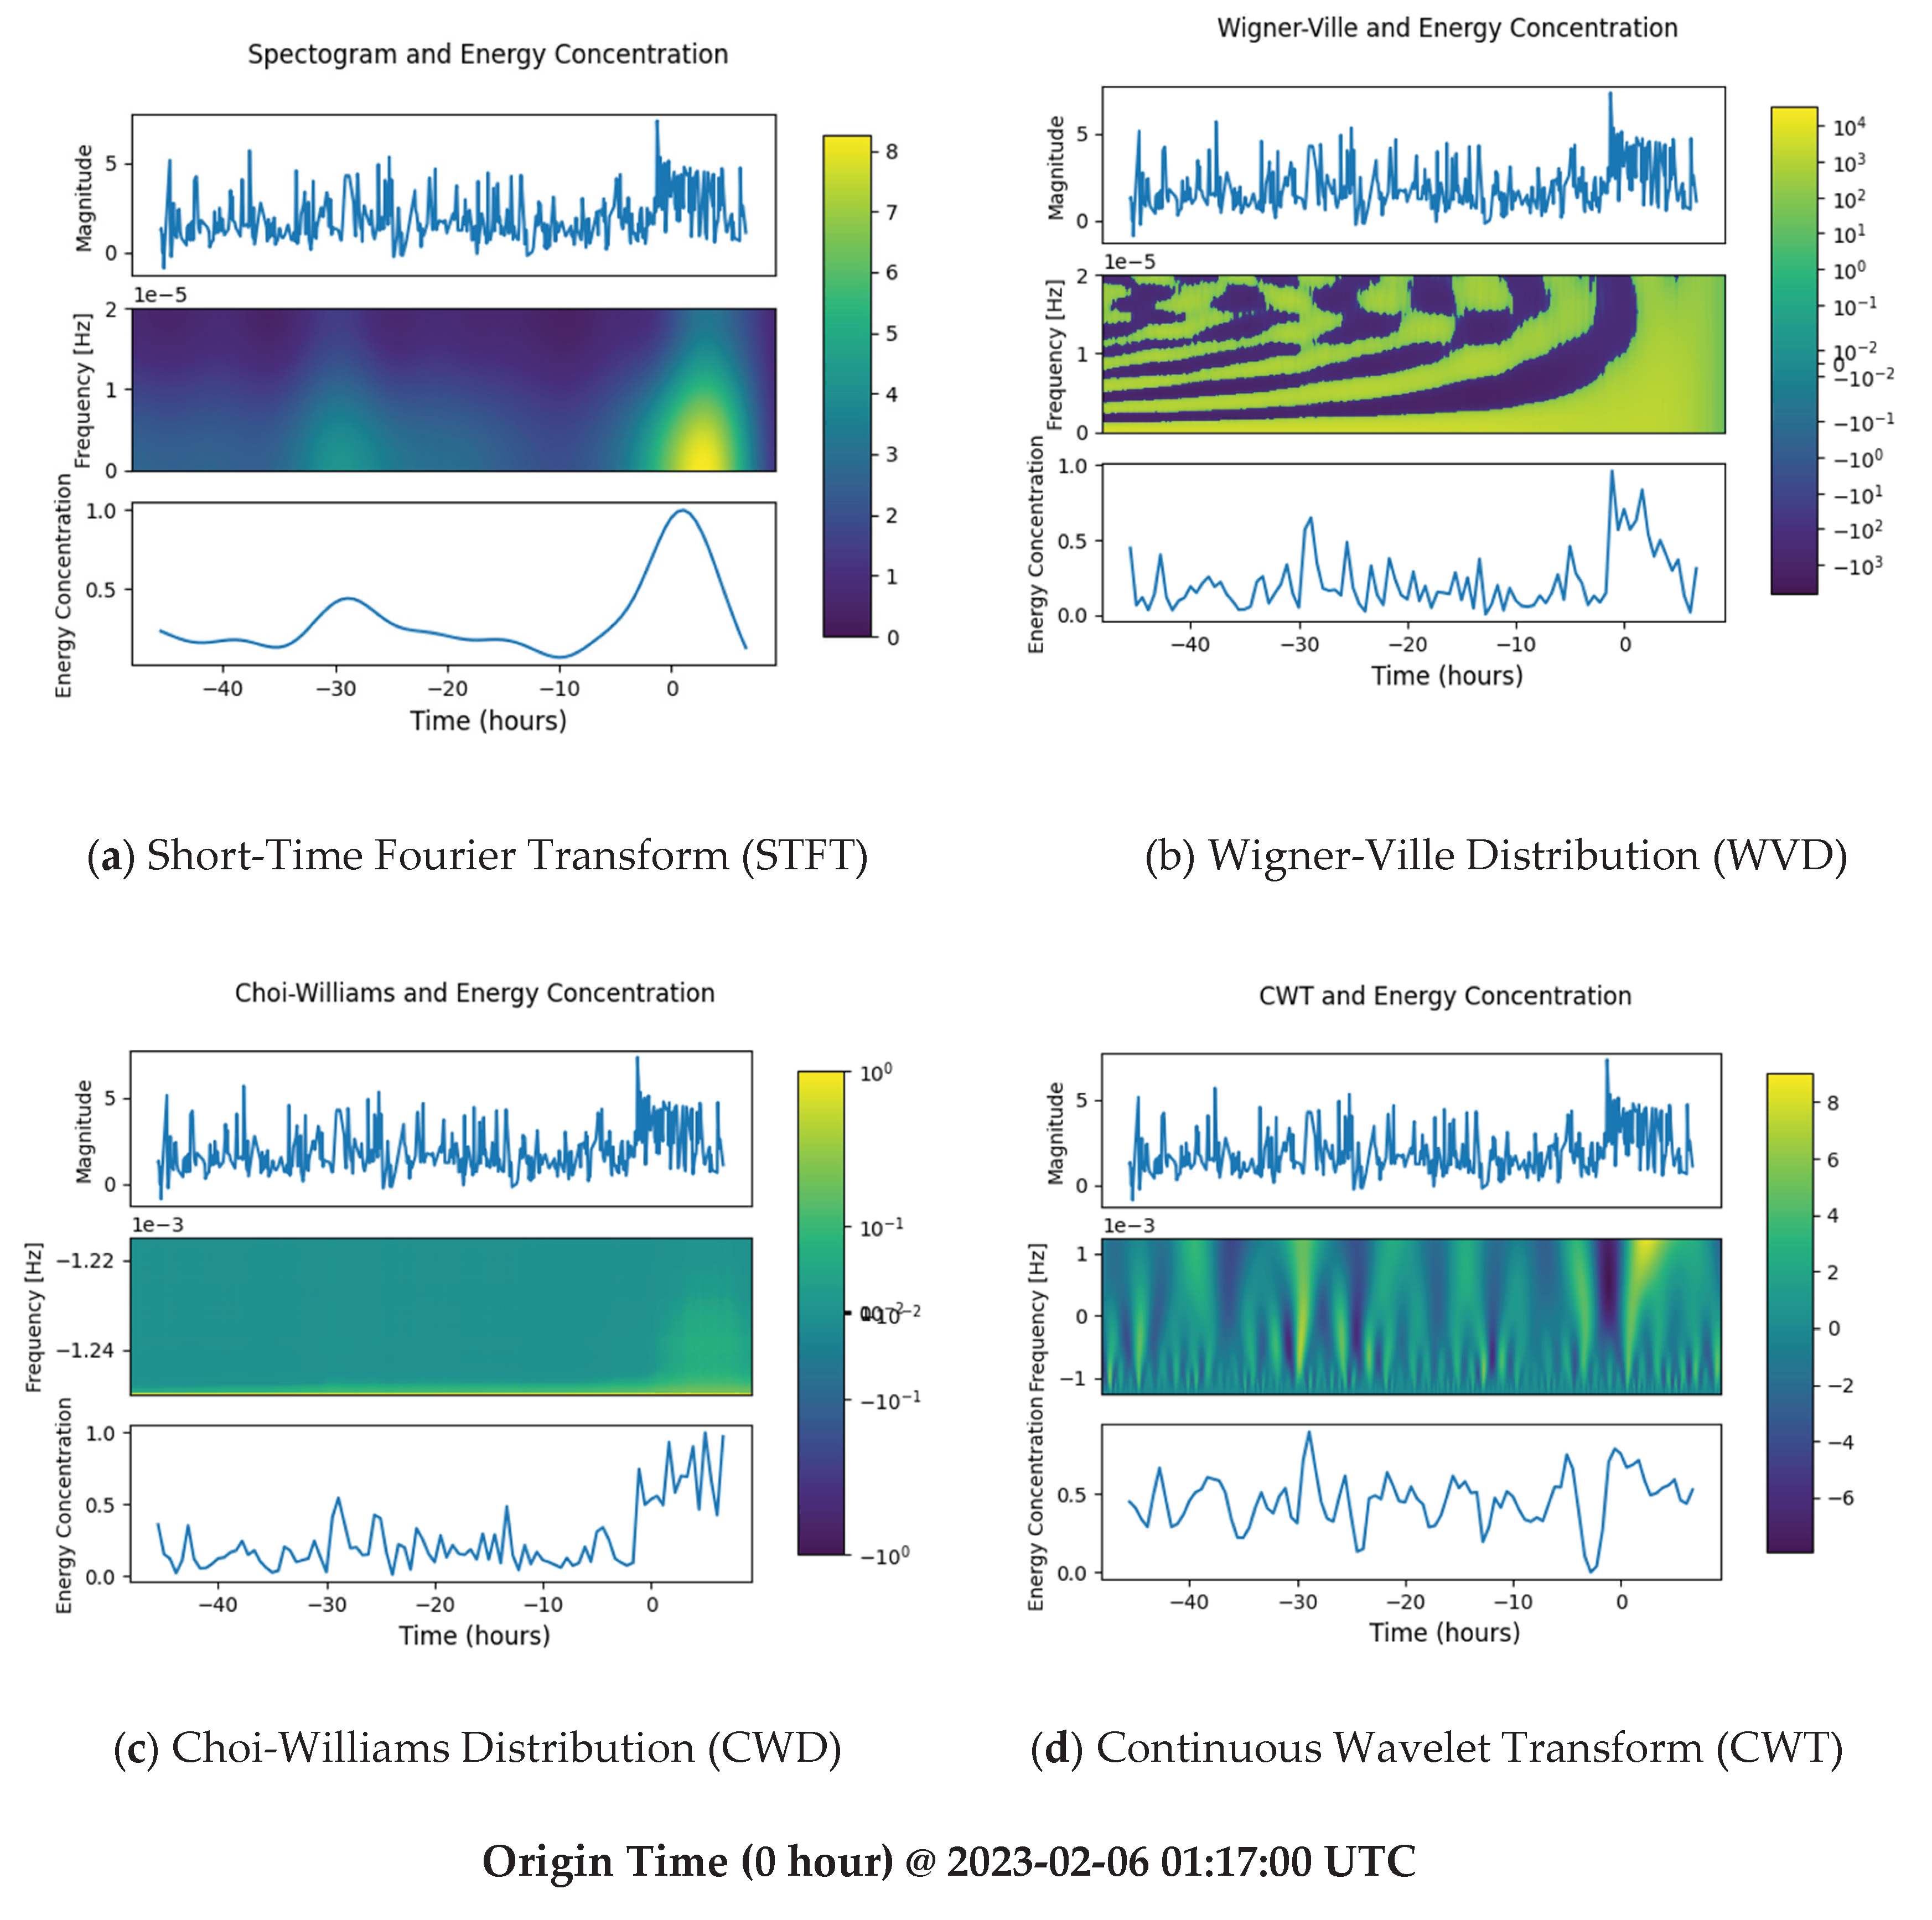
Figure 4.
Comparison Between Interpolated Signal of the Sulawesi Earthquake Dataset Against Heatmap and Mean Energy Concentration.
Figure 4.
Comparison Between Interpolated Signal of the Sulawesi Earthquake Dataset Against Heatmap and Mean Energy Concentration.
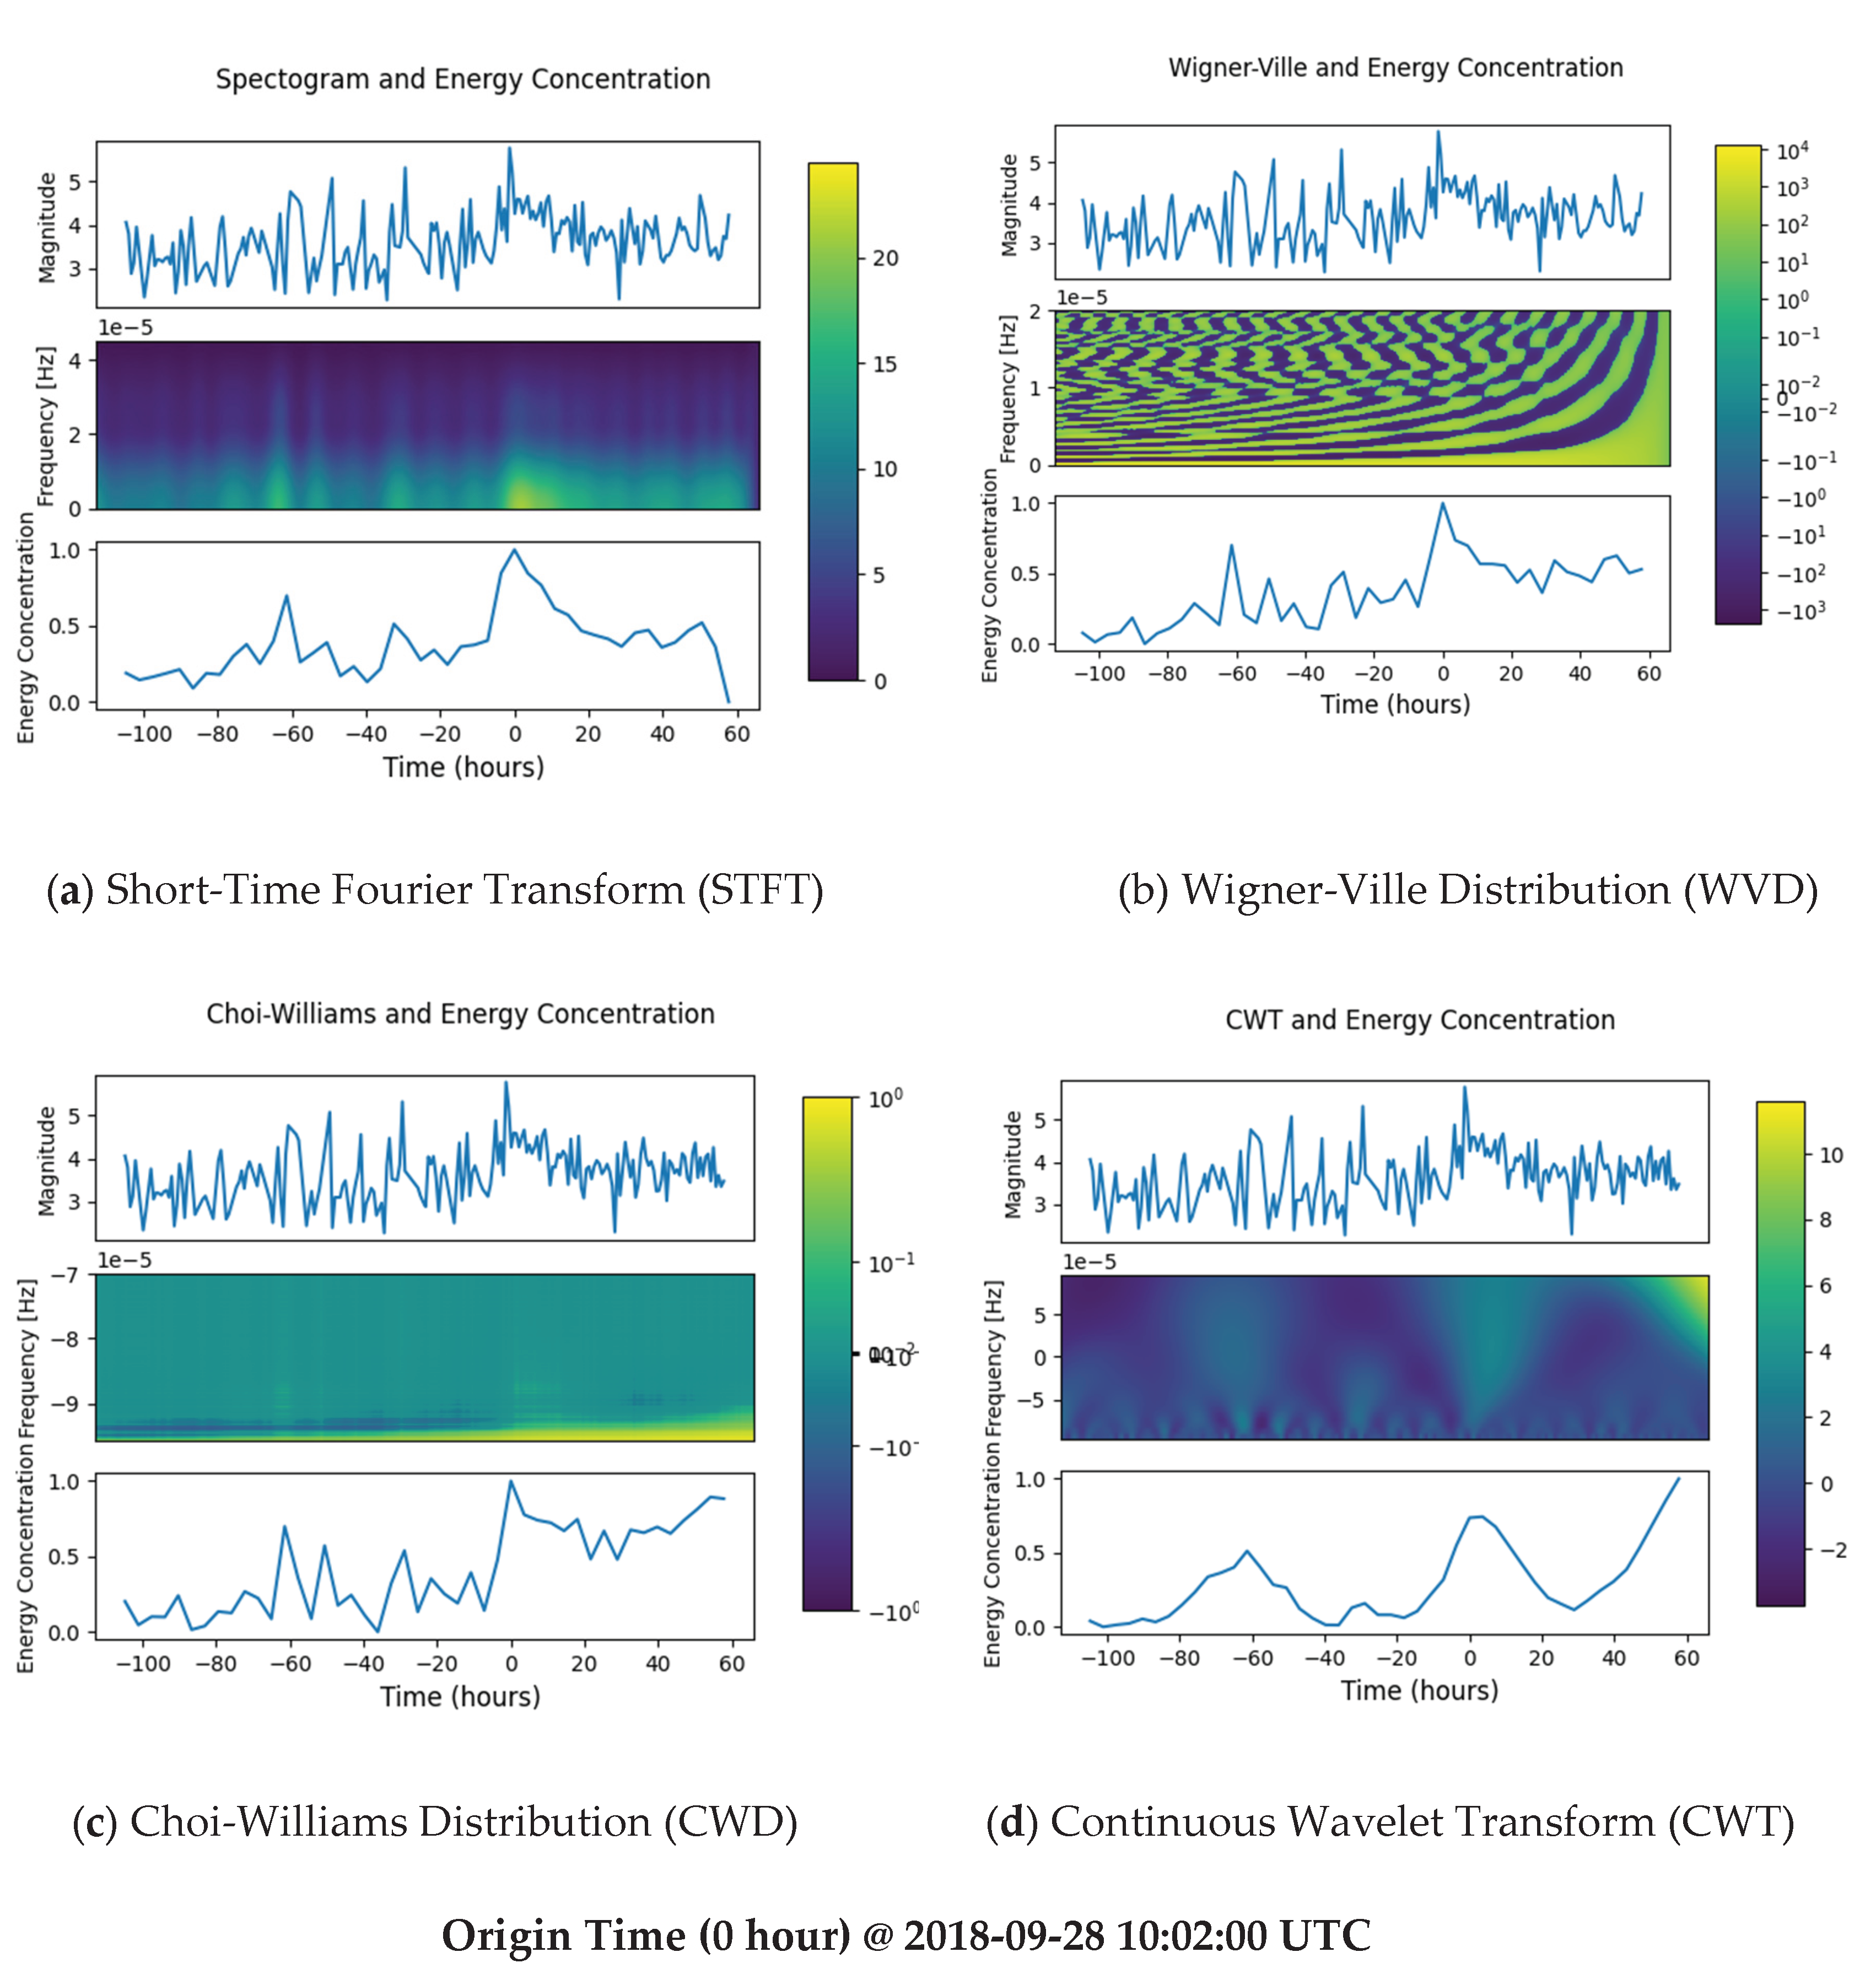
Figure 5.
Comparison Between Interpolated Signal of the Luzon Earthquake Dataset Against Heatmap and Mean Energy Concentration.
Figure 5.
Comparison Between Interpolated Signal of the Luzon Earthquake Dataset Against Heatmap and Mean Energy Concentration.
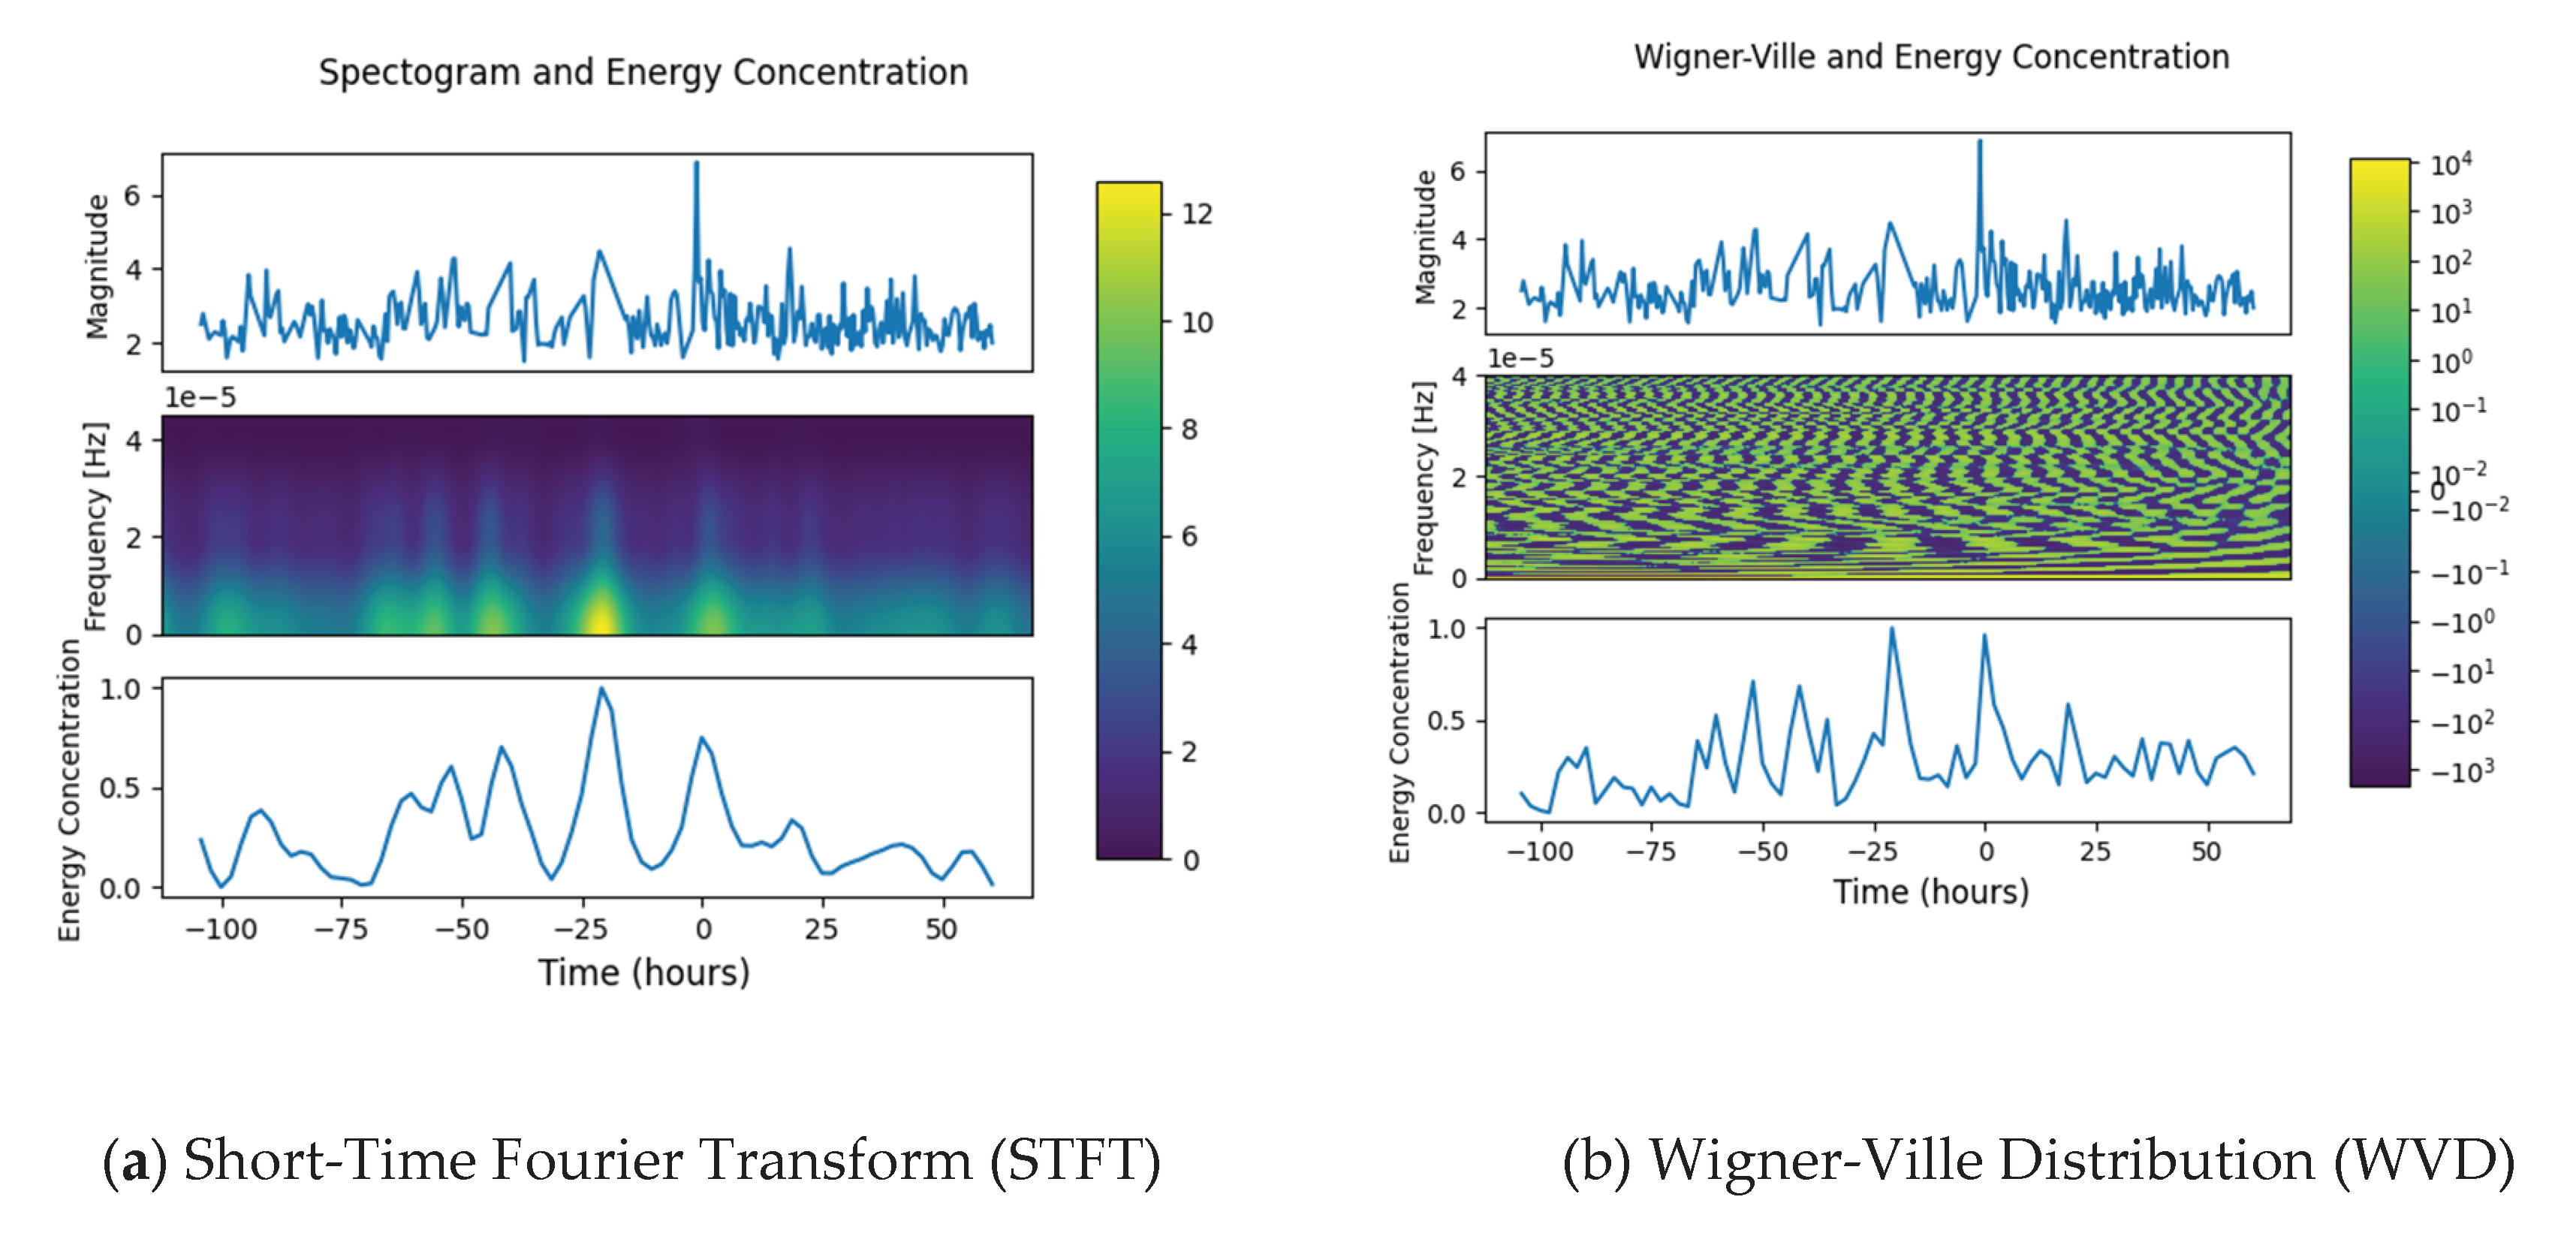
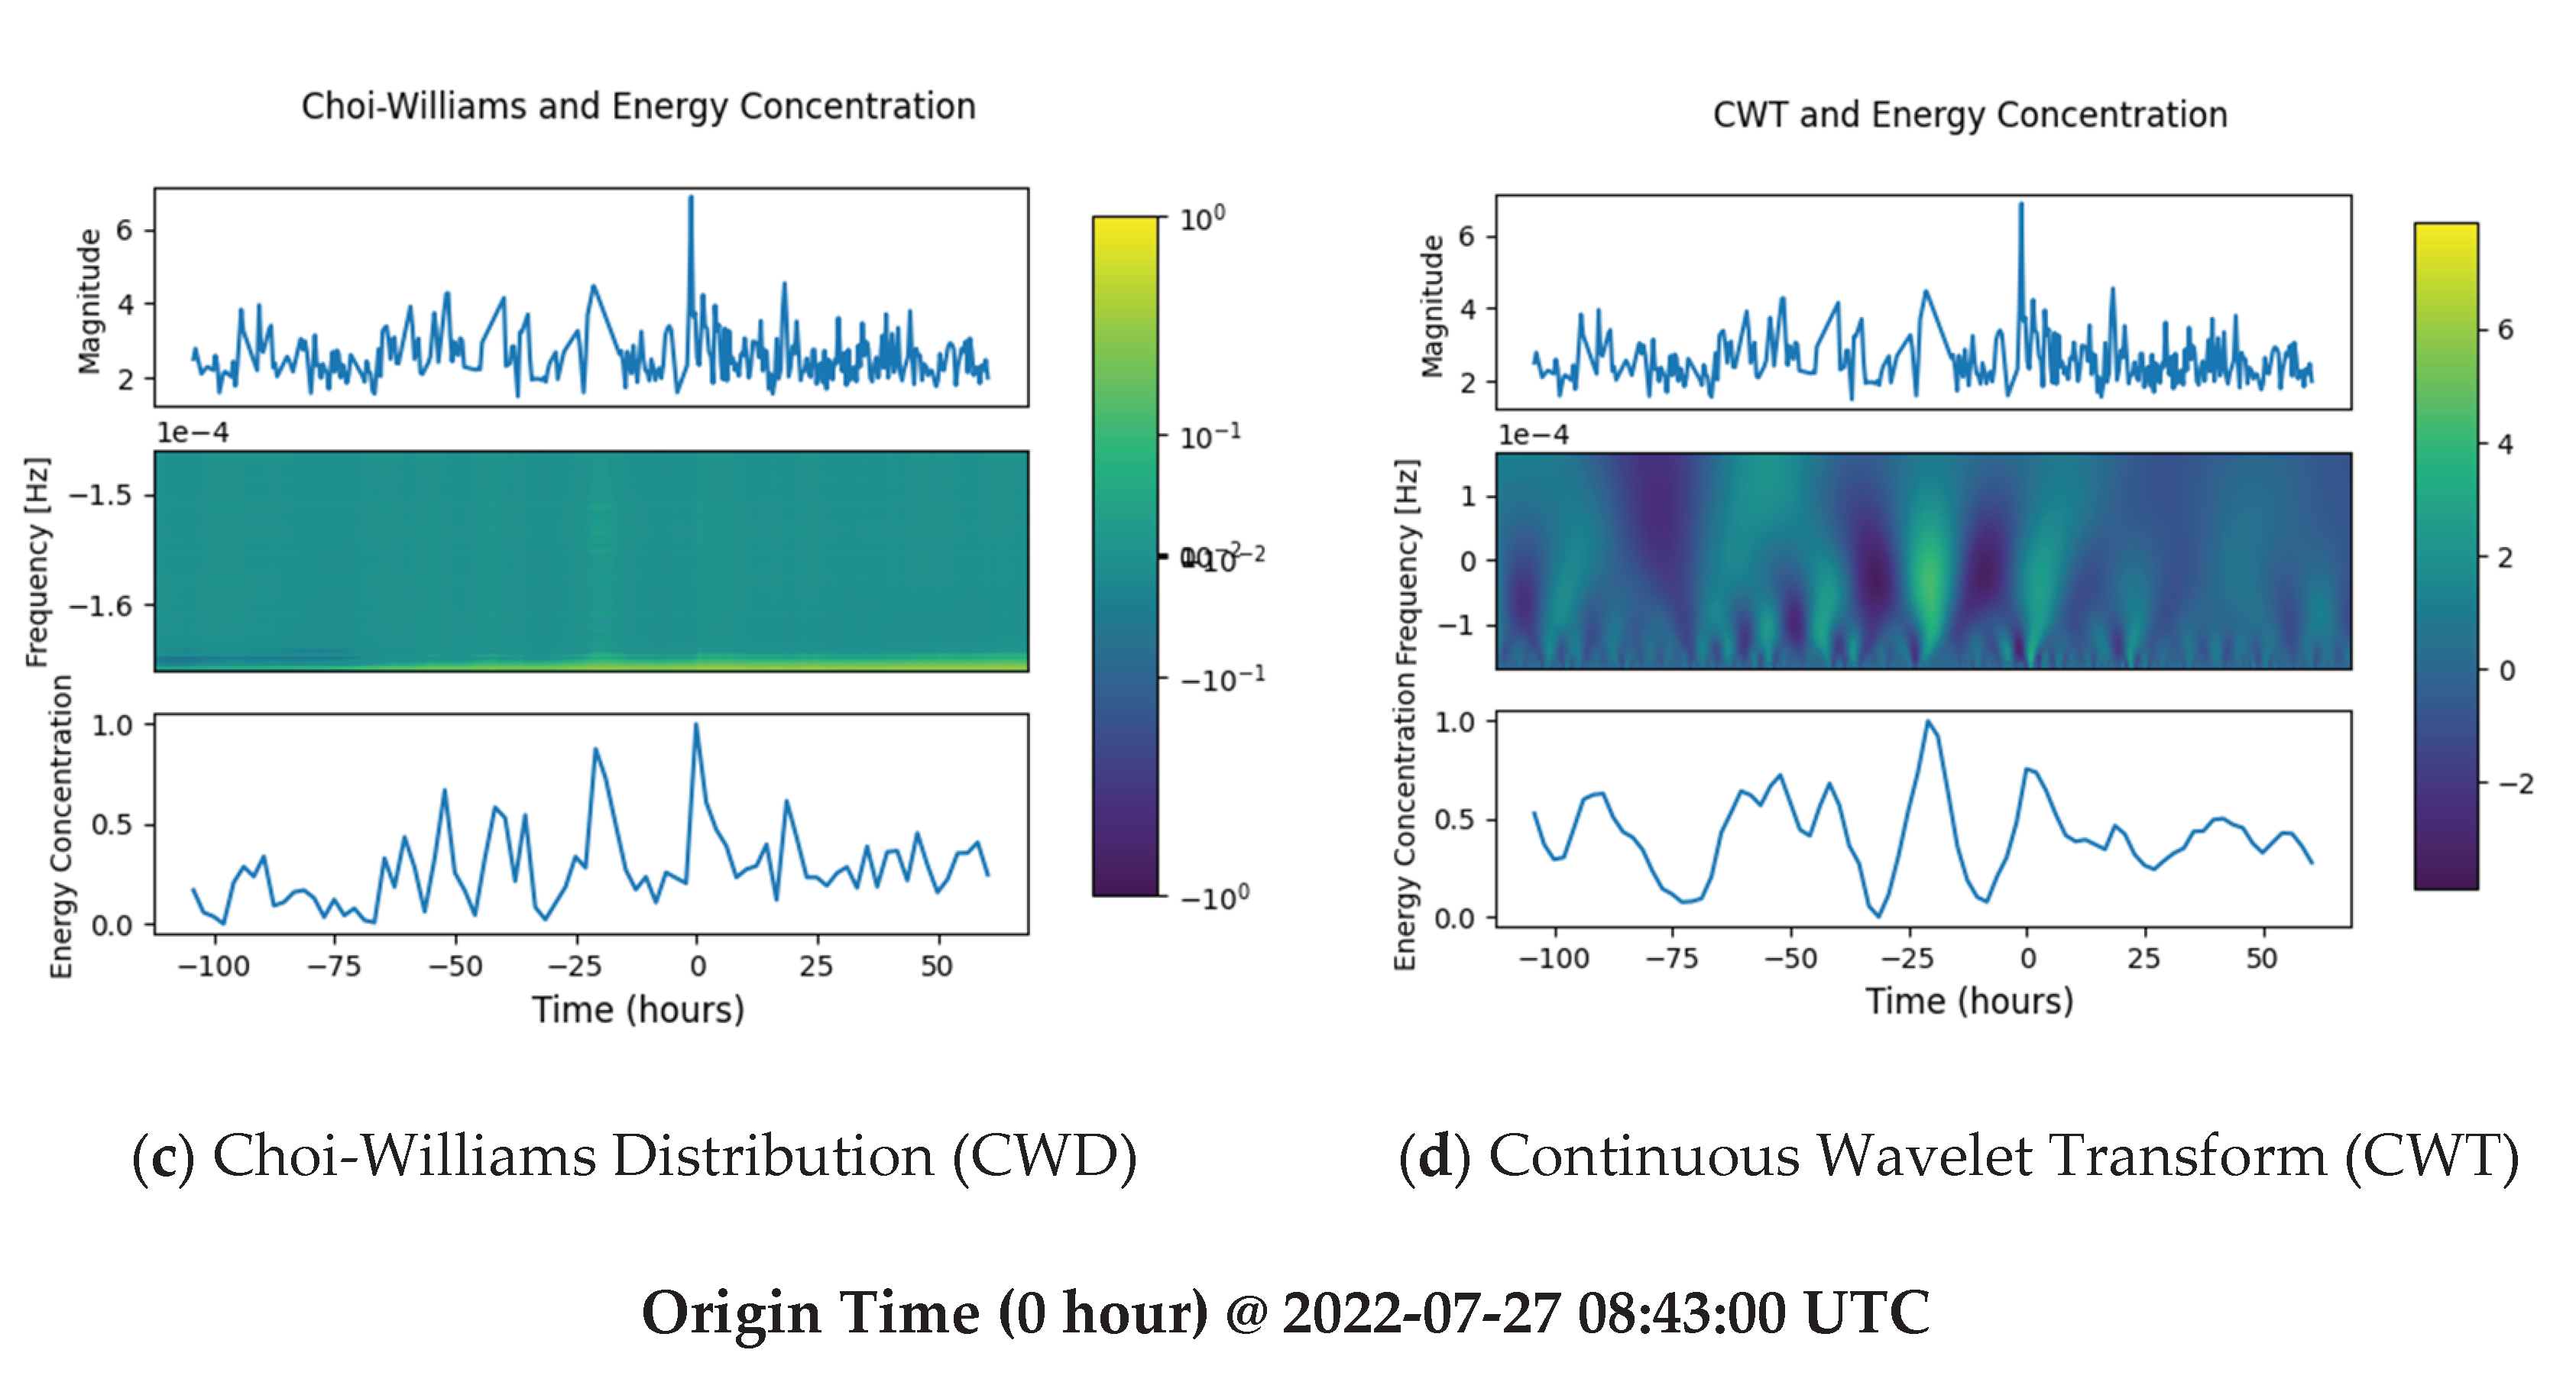
Figure 6.
Comparison Between Interpolated Signal of the Kaikōura Earthquake Dataset Against Heatmap and Mean Energy Concentration.
Figure 6.
Comparison Between Interpolated Signal of the Kaikōura Earthquake Dataset Against Heatmap and Mean Energy Concentration.
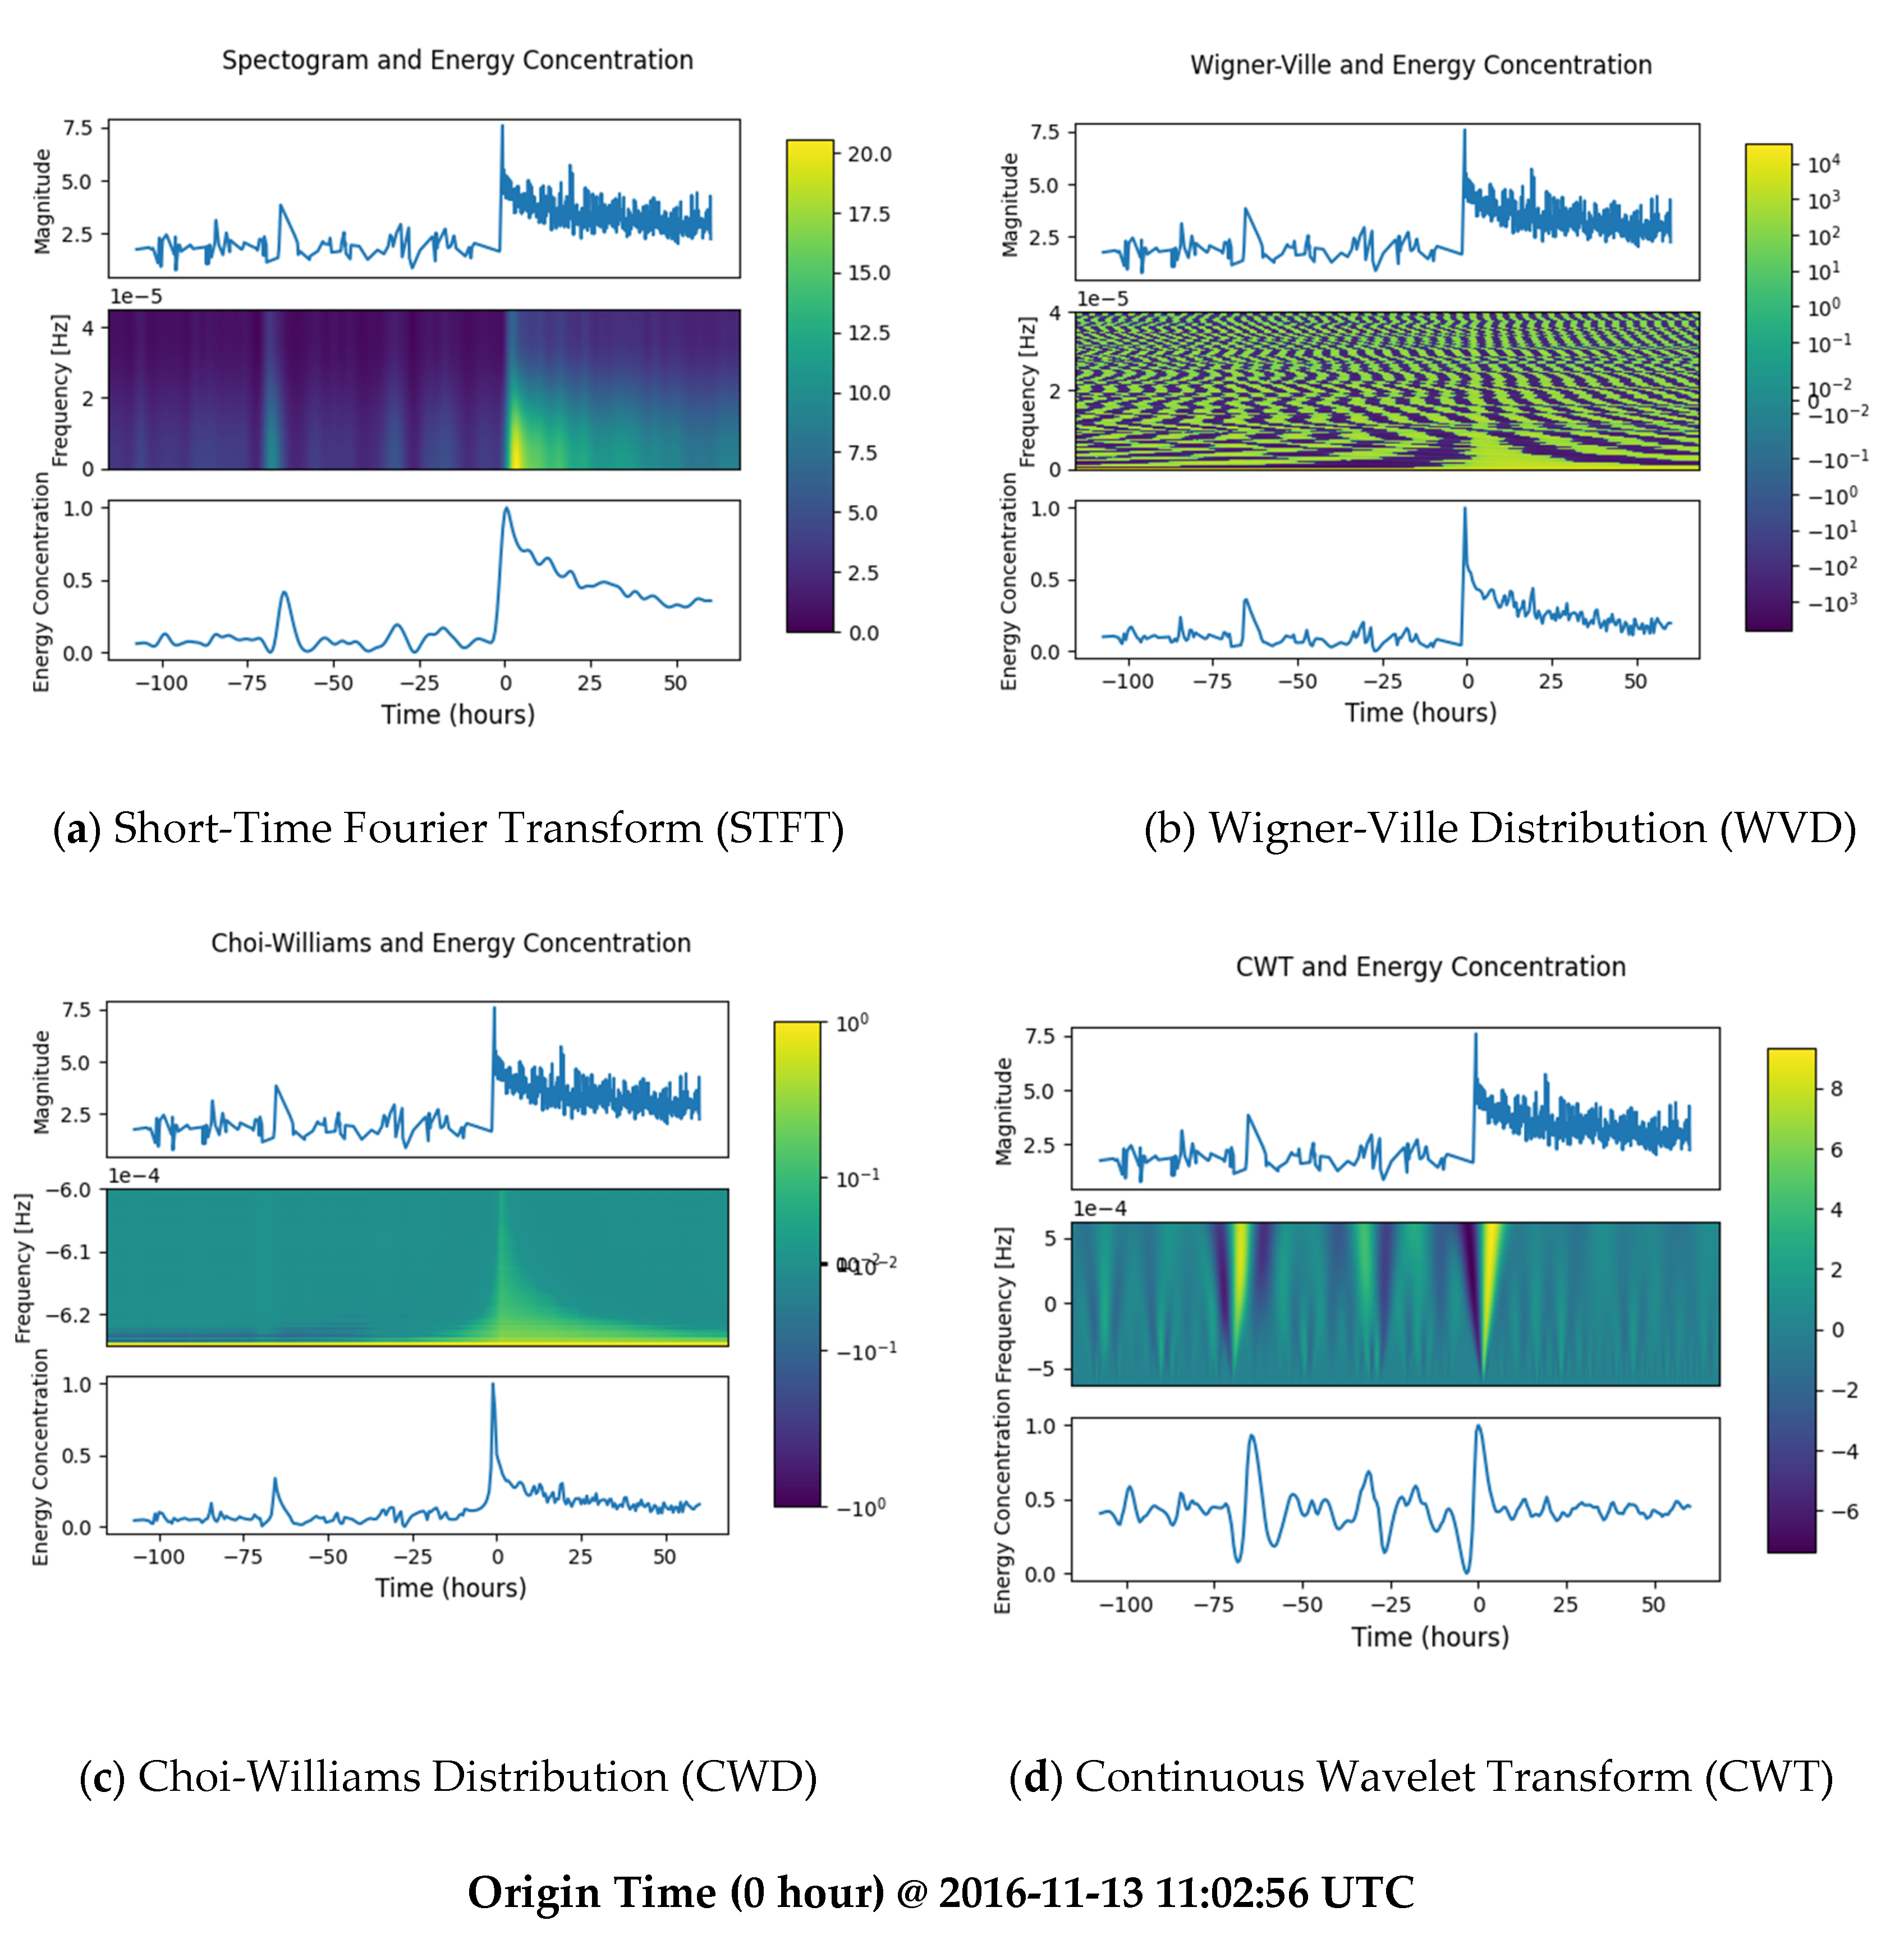
Figure 7.
Comparison Between Interpolated Signal of the Noto Earthquake Dataset Against Heatmap and Mean Energy Concentration.
Figure 7.
Comparison Between Interpolated Signal of the Noto Earthquake Dataset Against Heatmap and Mean Energy Concentration.
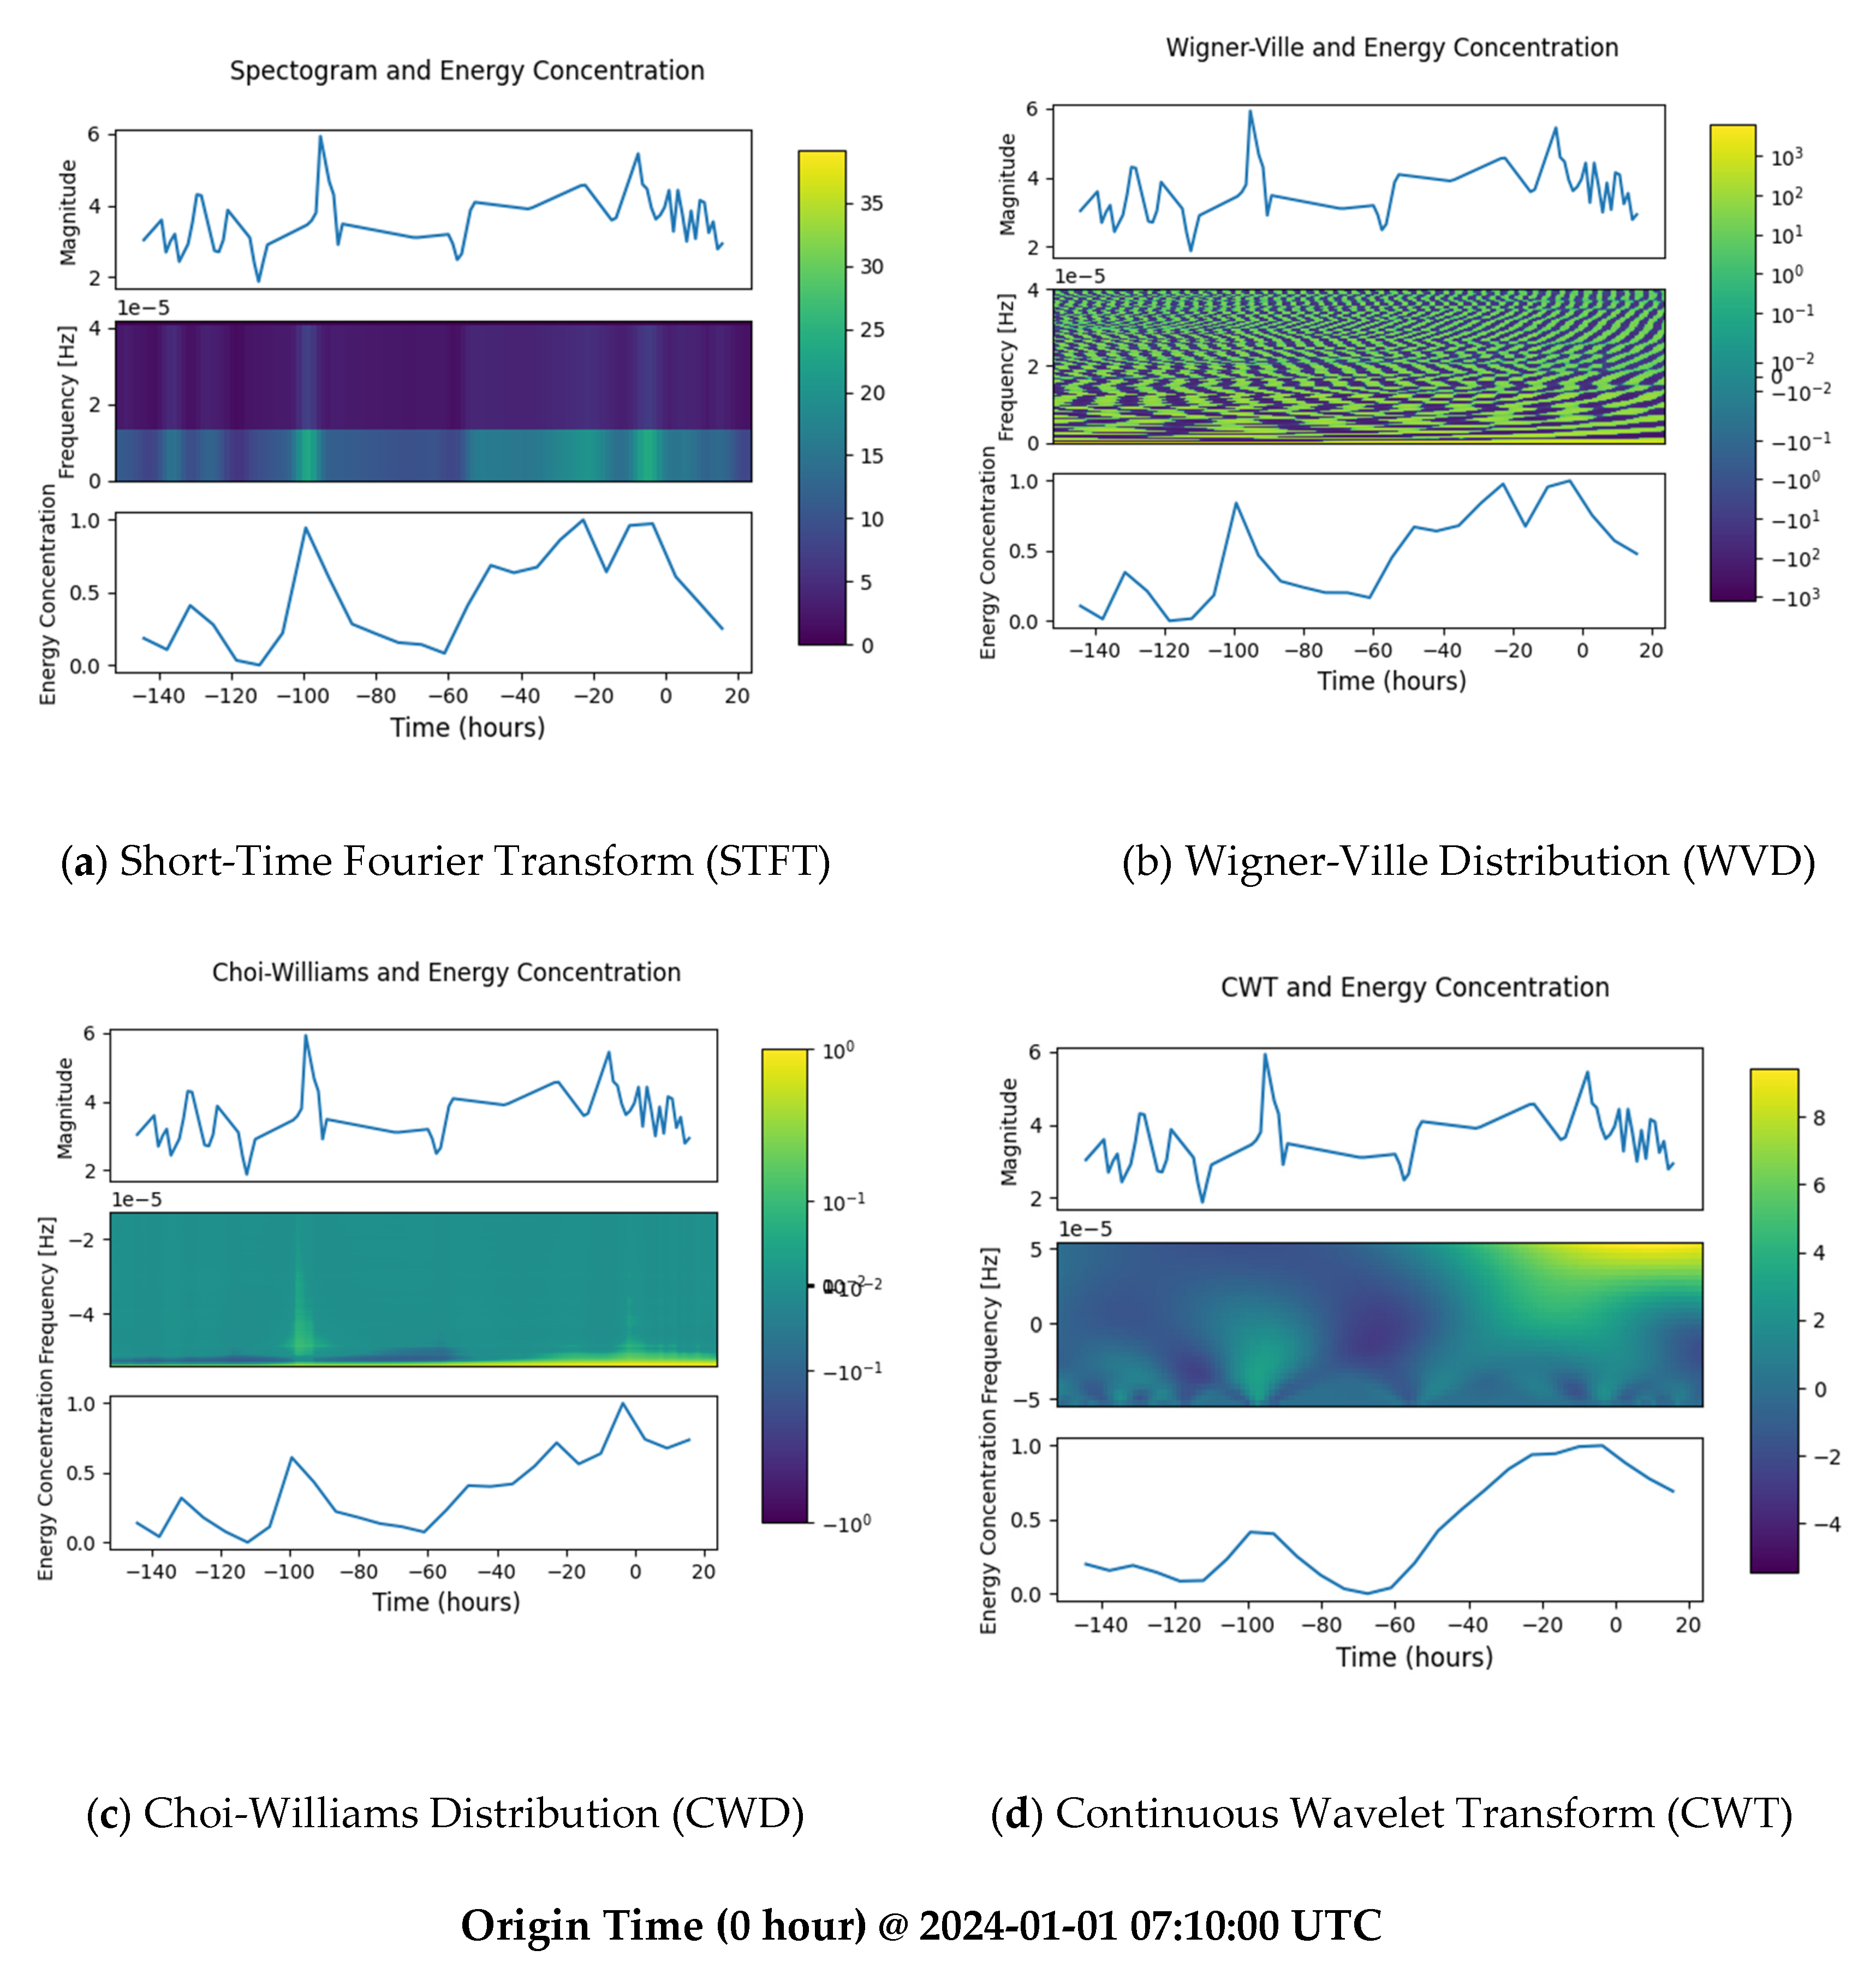

Table 1.
Summary of Dataset to be Processed.
| Earthquake | Number of samples | Average Sampling Period (s) |
|---|---|---|
| Turkey-Syria | 9399 | 275.681 |
| Sulawesi | 2709 | 924.244 |
| Luzon | 1801 | 1485.441 |
| Kaikōura | 7767 | 332.316 |
| Noto | 554 | 4653.032 |
Table 2.
Summary of Mean Energy Concentration Peaks and Corresponding Earthquakes of the Turkey-Syria Earthquake.
Table 2.
Summary of Mean Energy Concentration Peaks and Corresponding Earthquakes of the Turkey-Syria Earthquake.
| Earthquake | Mean Energy Peak Timestamp (UTC) | Mean Energy Concentration |
|---|---|---|
| Minor EQ 1 | 2023-02-04 21:32:44 | 44.04% (STFT), 54.59% (CWD), 64.93% (WVD) |
| Major EQ | 2023-02-06 03:32:44 (STFT), 2023-02-06 01:19:24 (CWD, WVD) |
100% (STFT), 74.69% (CWD), 96.05% (WVD) |
Table 3.
Summary of Mean Energy Concentration Peaks and Corresponding Earthquakes of the Sulawesi Earthquake.
Table 3.
Summary of Mean Energy Concentration Peaks and Corresponding Earthquakes of the Sulawesi Earthquake.
| Earthquake | Mean Energy Peak Timestamp (UTC) | Mean Energy Concentration |
|---|---|---|
| Minor EQ 1 | 2018-09-25 23:08:33 | 69.75% (STFT), 69.91% (CWD), 70.07% (WVD), 51.23% (CWT) |
| Minor EQ 2 | 2018-09-27 04:01:53 (STFT), 2018-09-27 07:38:44 (CWD, WVD) |
51.22% (STFT), 53.85% (CWD), 51.06% (WVD) |
| Major EQ | 2023-02-06 12:31:53 | 100% (STFT, CWD, WVD) 73.63% (CWT) |
Table 4.
Summary of Mean Energy Concentration Peaks and Corresponding Earthquakes of the Luzon Earthquake.
Table 4.
Summary of Mean Energy Concentration Peaks and Corresponding Earthquakes of the Luzon Earthquake.
| Earthquake | Mean Energy Peak Timestamp (UTC) | Mean Energy Concentration |
|---|---|---|
| Minor EQ 1 | 2022-07-25 04:37:00 | 60.51% (STFT), 66.94% (CWD), 71.01% (WVD), 72.44% (CWT) |
| Minor EQ 2 | 2022-07-25 15:02:00 | 70.30% (STFT), 58.35% (CWD), 68.48% (WVD), 68.08% (CWT) |
| Minor EQ 3 | 2022-07-26 11:52:00 | 100% (STFT, WVD, CWT), 87.63% (CWD) |
| Major EQ | 2022-07-27 08:42:00 | 75.04% (STFT), 100% (CWD), 96.16% (WVD), 75.45% (CWT) |
Table 5.
Summary of Mean Energy Concentration Peaks and Corresponding Earthquakes of the Kaikōura Earthquake.
Table 5.
Summary of Mean Energy Concentration Peaks and Corresponding Earthquakes of the Kaikōura Earthquake.
| Earthquake | Mean Energy Peak Timestamp (UTC) | Mean Energy Concentration |
|---|---|---|
| Minor EQ 1 | 2016-11-10 18:47:35 (STFT) 2016-11-10 17:40:55 (CWD) 2016-11-10 18:14:15 (WVD) 2016-11-10 18:47:35 (CWT) |
41.63% (STFT), 34.02% (CWD), 36.07% (WVD), 93.29% (CWT) |
| Major EQ | 2016-11-13 11:47:35 (STFT) 2016-11-13 10:07:35 (CWD) 2016-11-13 10:40:55 (WVD) 2016-11-13 11:14:15 (CWT) |
100% |
Table 6.
Summary of Mean Energy Concentration Peaks and Corresponding Earthquakes of the Noto Earthquake.
Table 6.
Summary of Mean Energy Concentration Peaks and Corresponding Earthquakes of the Noto Earthquake.
| Earthquake | Mean Energy Peak Timestamp (UTC) | Mean Energy Concentration |
|---|---|---|
| Minor EQ 1 | 2023-12-28 03:48:20 | 94.53% (STFT), 61.00% (CWD), 84.12% (WVD), 41.56% (CWT) |
| Minor EQ 2 | 2023-12-30 06:55:00 | 68.67% (STFT), 40.78% (CWD), 67.02% (WVD) |
| Minor EQ 3 | 2023-12-31 08:28:20 | 100% (STFT), 71.58% (CWD), 97.76% (WVD), 93.89% (CWT) |
| Major EQ | 2024-01-01 03:38:20 | 97.35% (STFT), 100% (CWD, WVD, CWT) |
Table 7.
Summary of Raw Earthquake Signal Collected from Datasets.
| Earthquake | Percentage between Mw 1.0 – 4.0 | Percentage Mw > 4.0 |
|---|---|---|
| Turkey-Syria | 58.94 | 8.715 |
| Sulawesi | 69.62 | 30.38 |
| Luzon | 97.08 | 2.96 |
| Kaikōura | 93.83 | 5.71 |
| Noto | 79.57 | 20.43 |
Table 8.
Summary of Mean Energy Concentration Calculated via Choi-Williams Distribution Peaks and Corresponding Earthquakes.
Table 8.
Summary of Mean Energy Concentration Calculated via Choi-Williams Distribution Peaks and Corresponding Earthquakes.
| Earthquake | No. of peaks | Estimate time between peaks |
|---|---|---|
| Turkey-Syria | 2 | 13 hours |
| Sulawesi | 3 | 30 hours |
| Luzon | 4 | 23 hours |
| Kaikōura | 2 | 60 hours |
| Noto | 4 | 20 hours |
Disclaimer/Publisher’s Note: The statements, opinions and data contained in all publications are solely those of the individual author(s) and contributor(s) and not of MDPI and/or the editor(s). MDPI and/or the editor(s) disclaim responsibility for any injury to people or property resulting from any ideas, methods, instructions or products referred to in the content. |
© 2025 by the authors. Licensee MDPI, Basel, Switzerland. This article is an open access article distributed under the terms and conditions of the Creative Commons Attribution (CC BY) license (http://creativecommons.org/licenses/by/4.0/).
Copyright: This open access article is published under a Creative Commons CC BY 4.0 license, which permit the free download, distribution, and reuse, provided that the author and preprint are cited in any reuse.


