Submitted:
28 May 2025
Posted:
29 May 2025
You are already at the latest version
Abstract
This study examines how architectural expertise shapes visual perception, extending the "Seeing for Speaking" hypothesis into a non-linguistic domain. Specifically, it investigates whether architectural training influences unconscious visual processing of architectural content. Using eye-tracking, 48 architects and 48 laypeople freely viewed 15 still images of built, mixed, and natural environments. Visual behavior was analyzed using Shannon’s entropy scores based on dwell times within 16×16 grids during the first six seconds of viewing. Results revealed distinct visual attention patterns between groups. Architects showed lower entropy, indicating more focused and systematic gaze behavior, and their attention was consistently drawn to built structures. In contrast, laypeople exhibited more variable and less organized scanning patterns, with greater individual differences. Moreover, architects demonstrated higher intra-group similarity in their gaze behavior, suggesting a shared attentional schema shaped by professional training. Notably, only architects exhibited patterns consistent with a "Grammar of Space," a structured way of visually parsing spatial elements. These findings highlight that domain-specific expertise deeply influences perceptual processing, resulting in systematic and efficient attention allocation. Entropy-based metrics proved effective in capturing these differences, offering a robust tool for quantifying expert vs. non-expert visual strategies in architectural cognition.
Keywords:
eye-tracking
; experts
; architecture
; entropy
; attention
1. Introduction
Spatial cognition is a fundamental cognitive ability observed across species, enabling navigation, perception, and interaction with the surrounding environment. In humans, the increasing prevalence of urban lifestyles has brought about a pervasive exposure to built environments, with modern individuals spending most of their time in urban settings. Despite this omnipresence of architecture, research on how expertise, particularly in architecture, shapes spatial cognition remains limited. This gap in the literature highlights the need to explore how professional training and expertise in architecture influences cognitive processes such as visual attention and spatial understanding.
This study seeks to address this gap by investigating how architectural expertise shapes spatial cognition, with a specific focus on the visual attention patterns of architects when engaging with diverse urban landscapes and architectural contexts. To this end, we conducted a controlled eye-tracking experiment, comparing the visual attention of 48 architects and 48 non-architects. Participants were presented with scenes depicting architecture in various urban and natural contexts, followed by unrelated questions to maintain engagement and ensure task consistency across participants. The stimulus set included images of built environments, architecture integrated into natural landscapes, and control scenes depicting natural landscapes without architectural elements.
Building on the "Seeing for Speaking" hypothesis, which posits that language expertise influences cognitive processes relevant to linguistic tasks, we extend this principle to non-linguistic domains [1,2]. While the original hypothesis focuses on the interplay between language and cognition, we consider language as one of many cognitive skills humans can acquire and master. Given humans’ extensive exposure to language, it is arguably one of the most developed areas of expertise. However, as individuals acquire additional expertise throughout their lives, other domains, such as architecture, may similarly shape cognitive processes in ways that are specific to their respective contexts.
In this study, we designed a framework that varies architectural expertise while holding other expertise domains, such as language, constant. Our primary research question examines whether architectural expertise influences unconscious visual processing of architectural imagery and if the experts’ visual architectural processing can be measured. We hypothesize that years of architectural training led architects to internalize specific patterns of visual attention, adhering to a "grammar of space" that governs their perception of architectural content, even when performing tasks not overtly architectural in nature.
This paper is structured as follows: Section 2 introduces key theoretical concepts and provides a concise review of relevant literature. Section 3 outlines the methodology and data collection procedures used. Section 4 presents the results of the study, while Section 5 offers a discussion, summary, and conclusion.
2. Materials and Methods
2.1. The Grammar of Space
The way human beings experience space and the way it is encoded grammatically in language are not necessarily universal, but influenced by human physical configuration, neurophysiological apparatus, and cultural experiences. This complex interplay between universal biological and cognitive constraints and cultural-linguistic variation in spatial representation is generally referred to as the grammar of space [3]. Languages vary a lot cross-linguistically with regard to which spatial relations they encode and with which grammatical means they do so (for example using prepositions, specialized verbs, etc.). So, although the cognitive foundations of humans and the physicality of perceiving and interacting with space are fairly universal, the cultural and linguistic experiences of different groups of people can greatly influence how they experience and interact with their environment. For instance, living in mountainous vs. flat terrain may influence the spatial grammar of the languages spoken in these areas. In the case of the Northern Alta language [4], spoken in a mountainous region of the Philippines, the morphological system of the language has different spatial subdomains —location, disposition, and orientation— encoded through specific derivational affixes and lexical roots with spatial meanings such as ‘front’, ‘side’, ‘top’, and ‘back’ to derive a variety of spatial verbs that are key for expressing space relations in that language.
2.2. Seeing-for-Speaking
The general theoretical framework of this paper is based on the principle of linguistic relativity, also known as the Sapir-Whorf Hypothesis, that posits that language helps shape thought and cognition. Empirical and experimental evidence for linguistic relativity has been documented across various cognitive domains, including color cognition [5,6], motion cognition [7,8], gender cognition [9,10], numeral cognition [11,12], and spatial cognition [13,14,15].
Within the framework of linguistic relativity, the idea that grammatical features of a language influence the mental processes involved in conceptualization is known as the Thinking-for-Speaking Hypothesis [7]. Numerous studies [16,17] have demonstrated that conceptualization is language-specific rather than universal, with thinking processes shaped by the structure of the language being spoken.
The Seeing-for-Speaking Hypothesis [17,18,19,20] extends the Thinking-for-Speaking Hypothesis by the influence of core grammatical features beyond conceptualization, affecting visual attention and, consequently, perception. These findings are largely derived from eye-tracking studies, which effectively capture patterns of attention and conceptualization. Additionally, experimental studies suggest that the effects of grammar persist even in non-verbal tasks, such as memory tasks [20,21].
2.3. Expertise Acquired Through Architectural Education and Training
Architectural education fosters a specialized understanding of the multifaceted nature of space and its underpinnings. Through rigorous and systematic training in spatial thinking, design principles, and the interplay between built environments and human behavior, architects develop an acute awareness of the organization, flow, and aesthetics of spaces. Architectural education emphasizes the dynamic interactions between people and their environments, framing space as an experiential domain rather than a static container. Circulation paths, transitions, and spatial relationships are deliberately designed to evoke specific emotions and reactions.
Architects learn to analyze space through multiple lenses (functional, experiential, and symbolic) enabling them to discern layers of meaning and purpose embedded in architectural design that transcends mere functionality [22,23]. In an architectural context, the fictional sense refers to how the space fulfils its intended purpose, the experiential sense to the emotional and psychological impact on the users of the space, and the symbolic to the cultural or metaphorical significance embedded in architectural design. Architects possess specialized knowledge of design elements, proportions, and historical contexts of buildings and public spaces, allowing them to notice details such as facade materials, the placement of street furniture, or pedestrian flow patterns that untrained observers might overlook. Their perspective extends beyond individual spaces to consider the relationships with their surroundings. Interior spaces are designed in harmony with exterior views and natural light, while the interaction between buildings and landscapes reflects cultural and historical contexts. Central to architectural training is the understanding of space as dynamic and user-centered. Architects design circulation paths to guide movement and craft transitions between spaces to evoke emotions or reactions, creating a cohesive spatial experience. This perspective underscores the importance of the interplay between users and the designed environment.
Previous research has highlighted the broader role of architectural design in shaping human experiences, such as how school building design influences learning [24]. While the specific impact of architectural education on the perception of everyday environments, such as streets, has received little attention in academic research, we propose that architects' expertise in spatial thinking provides them with a heightened sensitivity to design elements and the interaction between buildings and their (built or natural) surroundings. This unique lens, cultivated through training, allows architects to interpret and engage with the built world in ways that differ significantly from those without such training.
2.4. Some Previous Studies on Expertise
Cognitive changes due to a high spatial expertise have been found on the biological level. For example, a neuro-imaging study [25] showed that a comparison of MRIs of the brains of 16 right-handed taxi-drivers with those of a control group consisting of non-drivers, showed an altered structure of the posterior hippocampus in the taxi drivers. Since the hippocampus is an area of the brain involved in processing spatial representation of the environment, it was concluded that the expansion of this area was due to the high dependence on navigational skills.
There have also been studies on the expertise of architects. For example, the opinions of architects have been found to be different from those of laypeople: Benz & Rambow [26] compared the oral evaluation of 65 architects and 75 laypeople regarding the use of exposed concrete, using interviews conducted in front of two buildings with examples of exposed concrete architecture. Results show that architects value the material and can recognize it even if it is painted, while laypeople value the material less and have trouble recognizing it, especially when it is painted.
The eye-tracking method has been used to study the visual attention of architects. In a previous experiment using similar stimuli [2], differences in the eye movements of architects and laypeople were observed: 19 architects and a control group of 45 laypeople freely viewed five naturalistic pictures of the outdoors and six rendered images depicting scenes inside of buildings before answering questions about the images. The analysis of the eye-tracking data was based on dwell times on areas of interest (AOI) in the six seconds of free looking. Differences in the visual attention between groups were calculated by means of hypothesis testing (t-tests). In the scenes inside of buildings, architects had significantly lower dwell times (ms) in the AOIs surrounding human figures compared to the group of laypeople. In the case of the outside stimuli (corresponding to the built environment category in this study), architects had significantly higher dwell times on the AOI defined over the cubature of buildings compared to the controls. Both results corresponded to medium effect sizes. Results were interpreted to mean that architects spend significantly more time looking at the architectural features themselves and less time looking at human occupants of the space; while laypeople were mostly interested in the human occupants in the inside scenes and explored the outside scenes mostly only at the pedestrian level.
2.5. Entropy in Visual Attention
The theoretical framework for the analysis is grounded in Shannon’s information theory. In information theory, entropy serves as a measure of unpredictability or complexity in a system [27,28]. Entropy quantifies the distribution of probabilities in a dataset: Low entropy reflects highly predictable distributions with unequal probabilities, whereas high entropy corresponds to scenarios where all possibilities are equally probable, i.e. higher entropy values signify greater unpredictability, while lower values indicate structured and predictable patterns. Originally developed to optimize data compression in telecommunications, Shannon’s entropy has since become a versatile tool in fields such as linguistics, psychology, and neurolinguistics. Applied to the complexity of visual behavior, a high level of Shannon’s entropy values indicates greater complexity in visual patterns. For instance, a high-entropy eye movement pattern in a classroom setting suggests that a teacher distributes their gaze equally among students, making it equally likely for any student to be looked at next [29]. In visual expertise research, experts often exhibit more complex scanpaths, characterized by higher entropy coefficients. This indicates frequent revisits to multiple areas of interest (AOIs), reflecting a more distributed visual attention strategy. Entropy can also be calculated for specific gaze behaviors: higher transition entropy signifies more frequent and random shifts between AOIs, while higher stationary entropy reflects more equal distribution of attention across AOIs. For example, Krejtz et al. [30] conducted an eye-tracking study to explore the use of entropy as a measure of visual behavior in laypeople. A sample of 43 students viewed three works of art for 30 seconds each, after a positive or neutral mood was induced through sentences and music. The artworks were divided into two or three large Areas of Interest (AOIs). Eye movements were modeled using first-order Markov chains, demonstrating that a participant's next fixation depended only on their current fixation. Two types of entropy were calculated: transition entropy, which measured the predictability of gaze transitions between AOIs (lower transition entropy indicated more focused viewing), and stationary entropy, which measured the evenness of gaze distribution across AOIs (higher stationary entropy indicated more evenly distributed attention). The study found that individuals with high curiosity exhibited lower transition entropy, suggesting more focused viewing patterns, while stationary entropy did not differ significantly between curiosity groups. Additionally, participants who rated the artwork more favorably tended to have lower transition entropy and higher stationary entropy, indicating deliberate and focused viewing paired with broader attention distribution. The authors concluded that entropy, particularly transition entropy, is a valuable metric for analyzing eye movement patterns and understanding visual attention.
The eye-tracking method has been used to study visual attention of experts, quantifying the complexity of visual behavior using Shannon’s entropy of information. Kosel et al. [29] investigated scanpath patterns of 44 teachers (35 novice teachers and nine expert teachers) during an assessment task. Participants watched a video of a classroom and were subsequently asked to assess five different students. The researchers found that, consistent with prior research, scanpaths were more similar within an individual than between individuals, indicating idiosyncratic visual behavior. Further, experts’ scanpaths were more complex, involving more frequent revisits of all students, which was quantified using Shannon’s entropy score. Importantly, experts’ scanpaths were more similar to those of other experts within the group, and experts’ visual behavior was statistically linked to higher judgment accuracy.
Recent studies on the application of entropy measures on eye-tracking data [31] have shown, that while high or low entropy values can characterize fixations, the interpretation of these metrics is highly dataset-dependent: Melnyk et al. [31] evaluated six entropy metrics—fuzzy, increment, sample, gridded distribution, phase, and spectral entropies—applied to fixation eye movement trajectories. In one dataset, high gridded distribution entropy and high fuzzy entropy correlated with high-frequency noise, potentially indicative of ocular microtremor. Conversely, in another dataset, low sample entropy was linked to fixations with significant linear drift. These results underscore the need for further research to elucidate the relationship between gaze complexity and assessment competence, as no universal interpretation of entropy values has been established across datasets.
3. Materials and Methods
To investigate visual attention patterns, the empirical method employed was eye-tracking. This method was chosen because eye movements are highly automatized and not easily influenced consciously by participants. The study aimed to compare the visual attention patterns of architects and non-architects (laypeople) when viewing scenes with architectural content, but without a specific architectural task (free viewing). The task asked of the participants was to look at different scenes depicting architecture in different contexts and directly afterwards respond to questions not relevant for the analysis.
The study was approved by the Ethics Committee of the TU Dortmund University (GEKTUDO_2025-09), and was conducted in accordance with the standards specified in the 2013 Declaration of Helsinki.
3.1. Stimuli
Real-world photos were used as stimuli, comprising 15 pictures divided into three categories: built urban environments (build environment stimuli), natural landscapes (natural environment stimuli), and a mixed category of architecture in landscapes (mixed environment stimuli), as shown in Figure 1.
The images were not selected by directly controlling for image entropy in the traditional sense, i.e. measuring the randomness or information content within the image relating to the pixels of the image. High-entropy images exhibit a wide range of pixel values and tend to be more complex and textured, while low-entropy images display a limited range of pixel values and appear more uniform or simple. To ensure comparability, images within each category (e.g., urban scenes) should ideally have similar entropy values, reflecting comparable levels of visual complexity and information content.
However, while entropy quantifies complexity, it does not account for the semantic content of the image, i.e., the specific subject matter. Although a formal entropy analysis was not conducted, the images were visually inspected and selected beforehand: A whole bunch of images were selected as candidates. To ensure consistency, all images were in full color, and only those with similar resolutions and dimensions were included in the preselection. A panel of five reviewers classified the images independently into the three categories based on their subject matter (built, mixed, or natural environment) and flagged any potential issues. This classification ensured that the urban features depicted in the images were comparable across the categories. Since, for example, comparing a city skyline with a park might lead to misleading conclusions, even if both images share similar entropy values. Ultimately, the 15 images that were most consistently classified and were flagged less often were selected for the study. Thus, the photographs that were the critical stimuli for the study were carefully selected to ensure comparability across conditions.
3.2. Procedure
The stimuli were presented as still images on a monitor in randomized order. Each stimulus was shown for six seconds, followed by an overlaid caption in the bottom part of the screen posing a question. The question remained for three seconds. Participants were instructed to freely observe the picture and then shortly respond to the question orally. These questions were related to the picture shown, but unrelated to the research goals, and served as a pseudo-task to maintain the participants engaged. Examples for questions are “Would you like to live/take a vacation here“, or “Does this seem like an expensive neighborhood?”. The oral responses were not analyzed. This way, all participants were given the same explicit task and kept their attention high through all stimuli. To hide the 15 critical stimuli and vary the task, 30 filler images were used, that depicted non-architectural content such as clothing items, food and sports, with the same six seconds delayed appearance of a related question. The experimental design is shown in Figure 2. The instructions and materials were all in German, which was the native language of all participants. The materials have been translated into English for the reader’s convenience in this paper.
All stimuli were presented on a computer monitor (1680 × 1050 resolution; 22–inch LCD) connected to a standard PC computer. Data analyses as well as calculations were conducted with R [32]. Participants' gaze positions were recorded during the initial six seconds (before the appearance of the question) using an SMI RED500 eye-tracker in a controlled laboratory environment, the first 250 milliseconds were excluded from measurements since at the beginning of the viewing time the gaze was always in the middle of the screen, because of the fixation cross used just beforehand, so the first 250 ms show a very strong center bias artefact. This means that the total measured timeline for the critical and control stimuli was from 0,25 – 6 s.
3.3. Participants
The study included 96 participants in total, evenly divided between the expert group and the control group. The expert group consisted of 48 architects or graduate students in architecture, while the control group included 48 age and sex-matched graduate students from language studies. Participants in the control group were screened using a post-experiment questionnaire to confirm they had no expertise in architecture or related spatial skills, such as arts, photography, 3d-modelling, gaming, or sports. That way, the group of language students can be considered laypeople for the goals of this study, since they have no experience in architecture at all. Both experimental groups consisted of 32 males and 16 females per group. Participants were of similar age across groups, with a mean age of 24.4 years in both groups. Their educational levels were also comparable, all participants were either pursuing Bachelor’s or Master’s degrees, and both groups average 7.1 semesters of higher education training. All participants were native speakers of German, and the experiment was conducted entirely in German. Informed consent was obtained from all subjects involved in the study.
Eye-tracking data were collected with an average tracking ratio of 97.7% (range: 92.9% to 99.8%). Calibration accuracy was measured at 0.45° in average on the x-axis and 0.42° on average for the y-axis.
3.4. Methods
In this section, we introduce methods that describe the distribution of attention measured as dwell times across areas of interest (AOI). In this analysis, we are using gridded areas of interest [33], a systematic approach to dividing a visual stimulus into a uniform matrix of rectangular cells. This method allows for objective quantification of visual attention distribution across the entire stimulus, independent of specific semantic features, since it consists of a regular geometric grid that is overlaid on top of each stimulus, regardless of the stimuli content. Gridded AOIs provide a standardized framework for analyzing how participants engage with different regions of the stimulus without the need for predefined, feature-specific AOIs. For this analysis, we decided to use a 16 x 16 grid for defining 256 AOIs per stimuli (figure 3), a high granularity setting. The AOIs in the grid can be counted using an 8 bit variable in computing. Each individual AOI has a size of 6825 pixels, equaling 0,4% of the total image. In the analysis, we will compare the total amount of time spent on each individual AOI in comparison to the other AOIs, irrespective of the temporal order in which AOIs were visited.
If an observer was watching a picture without any features, such as a completely white screen, all points of the screen could be assumed to be of equal interest to the observer. The only exception would be the expectation of a certain center bias, acquired by experience in watching content presented on screens, where the most important content tends to be presented in the center of the screen, the action framed in the middle. In an AOI-grid with cells of equal size, participants can be assumed to spend roughly equal amounts of time on each cell of the AOI-grid. In a picture which has one central feature, for example a small cross in the middle of an otherwise white screen, participants’ gaze dwells on this feature, and very little time is spent on the rest of the screen, at least until they get bored of the one central feature. Exploiting this behavior, psycholinguistics studies use a fixation cross to assure the attention of the participants is in the middle of the screen before presenting a new stimulus. In real pictures, participants spend more time on interesting parts of the picture, and less time on the background or features that they do not find interesting.
It would be possible to count how many AOIs are visually visited in total, but this measure does not reflect the complete distribution if visual attention, since AOIs that are only visited very briefly would be counted equally to those which are dwelled on for very long. Measuring the mean or median of time spent per AOI solves this problem, but any measure of average also does not respect the complete distribution of visual attention. In addition, means are affected by outliers, medians by non-normal distribution, and modes by heavy tails. A measure that can deliver one single number for visual exploration and at the same time overcome all these statistical shortcomings is Shannon’s entropy [34]. Entropy measures the absence of order, i.e. the presence of randomness. If participants spend equal amounts on each AOI of the grid, as in the example of the white screen, we get a homogenous distribution and thus high entropy. If in contrast all participants only look at one AOI-cell, we have the highest possible order, and no entropy. Imagine you are searching for the housekeys in a messy chaotic room versus in a tidy and organized room. In the messy room, your eyes would be darting all over the place, visually searching. This visual behavior would get a high entropy measure because there is no clear focus. But in the tidy room, you could direct your gaze right to the hook where the house keys are usually kept. This behavior would give a low entropy measure.
In technical terms, entropy measures the number of bits that are required to describe the irregularity found in the data. Shannon's Entropy (H) measures the degree of absence of order, that is, how non-homogenous a distribution is:
Where N is the number of AOIs and pi is the relative frequency of visits. If pi = 0 for some i, then pi log2(pi) = 0 is set as a convention. An easily interpretable measure is relative entropy, defined as follows if there is random distribution:
A perfectly random distribution has a relative entropy of 1; a distribution that is dominated by one variant has (almost) 0 entropy, and a Zipfian distribution about 0.7 [35].
Relative entropy depends on the randomness of the distribution of types (if each type has equal token frequency, entropy is highest) but also the number of types (more types lead to higher entropy). Our AOI grid always has the same number of types (8 x 8 = 256). We will mainly report absolute Shannon entropy (H), but relative entropies can always be calculated.
A popular visual representation of order versus entropy are heat maps. While individual heat maps are easy to interpret, a systematic comparison of how much heat (i.e. order) an individual picture shows in comparison to another picture, or whether one group of participants (architects) shows more or less variance in heat than another group (laypeople) is tedious if not confusing.
A low entropy indicates a trend for participants to focus particularly strongly on few, selected features in the picture, probably because they find it particularly interesting; high entropy indicates that the participants explore all aspects of the picture (systematically or not). We decided to analyze a relatively short time segment (seconds 0.25 to 6) because bored participants could also either absent-mindedly stare onto a random part of the picture (which leads to low entropy) or restlessly wander across the picture (which leads to high entropy). The entropy is calculated for each stimulus and each participant, over the times between 0.25 and 6.00 seconds.
3.4.1. Visualization with Histograms and Densities
Summarizations abstract from the individual data, for example though heatmaps of pictures to more easily comparable measures. Shannon’s Entropy offers a single number, but it leaves the distribution of the time spent underspecified. In order to interpret differences in entropy, we use histograms and density plots to reveal the peaks – i.e. the mode – and the tails and maxima in the distribution of participant-level entropy values. A low mode indicates that many participants skip many AOIs in the grid, while a long right tail, or even a high maximum, reveals that some participants find one AOI cell particularly interesting. For clarification, we will first show a histogram to visualize the discrete intervals. Later we will mainly use densities, displayed using idealized continuous curves.
3.4.1. Skewness
We have no fixed expectation of the distribution of the times spent per AOI shown by these histograms and density plots. A homogenous distribution (highest entropy) would be characterized by a normal distribution, while high order (low entropy) would lead to a Zipfian distribution with most AOIs showing a dwell time of 0 or a very low number.
As we do not expect normal distribution, measures used to describe how far the distributions deviate from normality can also reveal patterns. Skewness is one of such measures. Skewness describes how much, in comparison to a perfect normal distribution, our data is left- or right-distributed. As order in our data leads away from a normal to an increasingly Zipfian distribution, we expect a strong right distribution, i.e. a left peak and strong outliers far on the right, particularly in the pictures in which certain features kindle a strong interest.
Skewness is defined as
Where Ȳ is the mean, N the number of observations and s is the standard deviation. A value of 0 indicates normal distribution, left distributions are negative, and right distributions positive.
3.4.2. Kurtosis
While skewness allows us to assess a left or right distribution, kurtosis measures the heaviness of the tail. A heavy tail would arrive in a distribution containing many high, and some extremely high values, due to some visual features that participants focus on particularly strongly. Kurtosis is defined as
Positive values express “excessive” heavy tails. We can use this measure as a proxy for how interesting participants find certain features in the picture.
4. Results
In this section, we present the results of the analysis, encompassing general findings, trends across the three types of categories (built environment, mixed environment and natural environment), and specific examples of individual stimuli to enhance understanding. General results highlight the overall trends and patterns observed in the visual attention of both architects and laypeople. Specific examples of particular stimuli are provided to illustrate these trends more concretely, demonstrating how different groups responded to various types of scenes. The eye-tracking data was analyzed for the first 6 seconds of freely viewing the critical images. The first 0.25 seconds were excluded from the analysis since – due to the fixation cross - all visual attention begins concentrated on the center of the screen. Thus, 0 on the timeline actually corresponds to the 2500 ms mark.
4.1. Overall Trends
To give a feeling for the overall trends, we first aggregated dwell times for each AOI across all 48 participants and all 15 stimuli. Figure 4 shows a histogram comparing this general aggregation for both groups. The discrete intervals are shown in the histogram. In following visualisations, only densities that display idealized continuous curves will be represented. Figure 4 shows that the distribution is closer to a Zipfian value than to normal for both groups, which means that, in all pictures, certain areas attracted more attention than others. The laypeople group has more AOI-cells in which they spent no or hardly any time, while the architect group has more AOI-cells in which they spent relatively more time than the laypeople; the range from 800 ms to 2000 ms has clearly higher bars for the architects. This is also in line with the fact that 43% of the laypeoples’ AOIs have a dwell time of 0 ms, opposed to 41% in the case of the architects. Since laypeople have a more dominant class of dwell time = 0 ms, their entropy is also a bit higher. Table 1 summarizes key values.
The more dominant value of dwell time = 0 leads to a lower median for the laypeople, while (unexpectedly) the mean is slightly higher, due to several outliers. Skewness is higher for the architects, due to a more Zipfian distribution, which indicates that certain features draw their visual attention. Kurtosis is much higher for architects, due to heavier tails. The value of the Pearson correlation is challenging to interpret in this context, as we are comparing multiple stimuli that vary significantly from one another. Consequently, the strength and direction of the linear relationship do not provide much meaningful insight. The value is included here for completeness and to enable comparison with the values in the individual categories.
4.2. Individual Stimuli
After providing a broad overview of the eye tracking data aggregated across all 15 stimuli, we now take a closer look at each individual stimulus. The stimuli are grouped into the categories “built environment”, “natural environment”, and “mixed environment”, depending on the content of the presented images. We were able to identify general trends for each category. The density curves for each individual stimuli are displayed in figure 5.
We can observe the same trends in all stimuli belonging to the built environment category: Entropy is higher and standard deviation is lower for architects, indicating that they leave fewer parts of the picture unexplored. The means are similar, the median is higher in the case of architects. Skewness and kurtosis are lower in architects’ group, because the peak is lower and comes later. Architects also have a lower standard deviation than laypeople. Since out of the three categories built environments are the most relevant for architecture, we visualize the distribution of the density for all five built environment stimuli, aggregated in Figure 6, and present the measures summed over all built environment stimuli in Table 2. The reactions to the mixed enviroment stimuli show the opposite pattern: Architects have more pronounced peaks around zero than the group of laypeople, indicating that they concentrate on a smaller number of AOIs. Skewness and kurtosis are about the same for both groups. Still, entropy is slightly lower for architects. For the natural environment stimuli, architects show slightly more pronounced peaks around zero than the control group, with the exception of N1. This is difficult to explain, since N1 and N2 are quite comparable. It is noteworthy that, in this type of stimulus, the entropy is the lowest for both groups and the differences between the two groups are the smallest.
Comparing across the natural environment stimuli does not lead to clear trends. The natural environment category was included as control to see how architects visually scan a scene when no architectural elements are to be seen.
4.3. Selected Individual Stimuli
To show how participants look at individual stimuli, one picture from each category was selected as an example: B1, M2 and N2. The diagnostic measures for the three chosen axamples can be found in Table 3. Architects consistently exhibit higher entropy values than laypeople across all three categories. This suggests that architects have more complex scanpaths as compared to laypeople. Architects also display slightly higher relative entropy values compared to laypeople, indicating a greater focus on specific features. The mean fixation times are similar between architects and laypeople, with minor variations. Laypeople generally show higher variability in fixation times compared to architects. This may indicate more inconsistent viewing patterns among laypeople. Architects tend to have slightly higher median fixation durations than laypeople (except in the case of stimuli M2 Scotland, where the median for architects is 0.0 ms compared to 0.7 ms for laypeople). This may indicate different scanning strategies or priorities. Laypeople exhibit higher skewness in fixation durations, indicating a more uneven distribution, with occasional long fixations. Laypeople show significantly higher kurtosis, suggesting a sharper distribution with extreme values. Architects, by contrast, demonstrate more consistent fixation patterns. In summary, architects generally demonstrate more systematic and consistent visual behavior, reflected in higher entropy and lower variability. Laypeople, on the other hand, show more dispersed and irregular viewing patterns, as seen in their higher standard deviations, skewness, and kurtosis values. These differences likely reflect the distinct cognitive strategies employed by architects and laypeople when analyzing visual scenes.
4.3.1. A Picture from the Built Environment Category: B1 (St. Louis)
The chosen example for the built environment category is stimulus B1, a picture showing a street in the American city of Saint Louis. The Stimulus is reproduced in Figure 7a. Figure 7c-d shows heatmaps for both the architects and the laypeople separately and figure 7b shows the visualization of the density for this stimulus. The diagnostic measures for B1 can be found in table 3. The heat maps indicate that laypeople disproportionately focused on the parked green car, which is an uncommon color for vehicles. Regarding the density, the differences are bigger than across all pictures, which also results in a lower Pearson correlation. In particular, the peak around zero is more pronounced for laypeople. The high skewness of the laypeople follows from that, and the high kurtosis is also anticipated by the fact that the mean is higher, although the median is lower, and also the maximum and the standard deviation for the laypeople are higher.
4.3.2. A Picture from the Mixed Environment Category: M2 (Scotland)
The chosen example for the mixed environment category is stimulus M2, a picture showing a castle in the highlands of Scotland. The stimulus is reproduced in Figure 9. Figure 10 shows heatmaps for both the architects and the laypeople separately. The heat maps indicate that while both groups are primarily interested in the castle, the architects tend to focus on the bridge leading to the castle. This bridge represents an additional architectural element that complements the primary subject of the image. Figure 11 shows the visualization of the density for stimulus M2. The diagnostic measures for M2 can also be found in Table 3. For stimulus M2, entropy is generally lower than in both other exemplary scenes. The architectural feature attracts much attention, so that very many, in the case of the architects even the majority of AOIs are not visited (median=0). The Pearson correlation is very high as both groups have a trend to skip many AOIs and only concentrate on a few selected ones. The maximum dwell times (710 ms for laypeople and 629 for architects) are more than twice as high as in the two other exemplary pictures. The arising distribution is much further away from a normal distribution than in the previous pictures. The peak is higher, but there is still considerable mass very far to the right, which is why up to 250 ms are displayed in this graph. Despite the similarities between experts and laypeople, we can also notice some differences: entropy is slightly lower for architects, unlike in the other two exemplary pictures, the architects are drawn even more strongly towards the built areas.
4.3.3. A Picture from the Natural Environment Category: N2 (Canada)
The chosen example for the natural environment category is stimulus N2, a picture showing a lake in Canada. The stimulus is reproduced in figure 9a. Figure 9c-d shows heatmaps for both the architects and the laypeople while looking at this stimulus. The heat maps indicate that, while both groups are primarily interested in the rock in the foreground and the vanishing point, the architects focus more on the vanishing point and the laypeople on the foreground. Figure 8b shows the visualization of the density for stimulus N2. The diagnostic measures for N2 can also be found in table 3 below. Entropy is generally higher than in the B1 picture, skewness and kurtosis are smaller, which indicates a smaller focus on a few interesting AOIs. The much lower peak and the higher medians also show that fewer parts are missed, and fewer parts are of particular interest. While the differences to the other categories are marked, the differences between laypeople and architects are small. This results in a higher Pearson correlation between the two groups.
5. Discussion
In the current study, we investigate the visual exploratory behavior of architects compared to a control group, by measuring the two groups’ eye movements while looking at landscape photographs with varying degrees of architectural elements. We analyze the distribution of their visual attention using gridded AOIs. Our findings reveal clear differences between architects and laypeople in their visual attention patterns: Architects exhibit a stronger attraction to built structures and demonstrate less entropy in the distribution of their visual attention, indicating a greater tendency for focused examination rather than random scanning. Moreover, architects display more consistent visual attention patterns within their group compared to laypeople, whose attention patterns exhibit greater variability. In the case of images combining nature with built elements, such as a castle in Scotland, both groups exhibited similar attention patterns. However, architects demonstrated more intensely concentrated attention on the built structures, indicating a deeper engagement with architectural elements, even in cases in which attention patterns are otherwise similar. Interestingly, while architects displayed consistent differences in visual attention when viewing images set in urban landscapes, these patterns were absent in natural landscapes, suggesting their perceptual distinctions are domain-specific. As expected, in photographs not containing any architectural elements, such as the pictures in the natural environment category, no differences regarding the utilization of grammar of space were found between the two groups. These results are in line with other eye-tracking studies comparing the visual attention of architects versus laypeople [2], that showed that as experts architects allocate their attention differently from laypeople when looking at outdoor and indoor spaces. Architects were more interested in facade structures, and features that allow for a volumetric estimation of buildings while laypeople were more interested in human occupants and objects on eye level. While Mertins et al. [2] only used built environment stimuli, we examine three different categories of stimuli depending on the prevalence of architectural elements: Built environments (high relevance), mixed environments (medium relevance) and natural environments (low relevance). In this way, our results provide further evidence that visuospatial perception of architectural space is affected by expertise.
The measures that appear most promising for quantifying differences in entropy between experts and laypeople are the standard deviation of the entropy, the kurtosis rather than the skewness, and Shannon's entropy itself. While both entropy and relative entropy seem to be effective measures, mean fixation times do not appear to serve as a reliable indicator, since this measure remains stable across groups and across categories. The interpretation of the entropy variables is not straightforward, which underscores the value of the insights provided in this project. However, the interpretation we propose diverges from that of Kosel et al. [29], who use Shannon's entropy to analyze the eye movements of teachers. Their findings indicated that teachers exhibit higher entropy coefficients, which they associated with more complex scan-paths.
Rather than just claiming that expertise influences visual attention, the objective of this paper is to examine whether these differences can be measured, especially because the differences themselves are not particularly large. We explored various variables related to entropy to determine which variable best reflects the particular way in which architects observe architectural content as compared to lay people. Our conclusion is that entropy is a useful and effective measurement of differences in the temporal allocation of visual attention between experts and laypeople.
Shannon’s concept, in essence, posits that in contexts where probabilities are highly unequal, entropy is low, reflecting reduced uncertainty. Conversely, when many outcomes have approximately equal probabilities, entropy is high, indicating maximum uncertainty. The interpretation we propose is that low entropy suggests a tendency for viewers to focus intensely on a few selected features in an image, likely because they find these features particularly relevant. In contrast, high entropy indicates that participants explore the image more broadly, attending to multiple aspects. A low mode suggests that many participants skip numerous areas of interest within the grid, while a long right tail or a high maximum value indicates that certain participants find a few AOIs especially interesting.
5.1. Limitations and Future Work
The main limitation of the study is that the sample primarily comprised recently graduated architects, which may not adequately represent the deeper spectrum of expertise in the field of architecture. Ideally, the sample should include mainly senior architects nearing retirement, as their extensive experience might yield different insights. Another limitation lies in the two-dimensional nature of the experimental setup, which does not fully capture the inherently three-dimensional nature of architecture. While architects frequently work with two-dimensional representations, such as blueprints and CAD software, their professional practice ultimately engages with three-dimensional space. Future research should address these limitations by incorporating virtual reality (VR) to explore visual perception and expertise in a three-dimensional context. This approach would allow for the examination of how experts interact with architectural spaces in a more immersive manner. For instance, participants could engage with virtual or physical models of buildings rather than static photographs, enabling a deeper understanding of perception in spatially complex environments. Similar to the approach of Benz and Rambow [26], who asked architects and laypeople to provide oral evaluations of exposed concrete use in situ (instead of using pictures of the buildings), incorporating VR could offer valuable insights into the multi-sensory nature of architectural expertise while keeping the procedure controlled and comparable within subjects. These findings also open avenues for investigating how expertise in other disciplines influences perception.
6. Conclusions
We propose that the prolonged exposure and targeted education of architects contribute to architects acquiring a grammar of space. This conceptual framework, as previously described [1,2,3], directs experts’ visual attention towards specific spatial elements and structures, such as facades and volumetric features of buildings. Furthermore, this grammar shifts architects’ perspective beyond ground level, encouraging them to focus on spatial elements not typically of interest to laypeople.
This study demonstrates that expertise fundamentally shapes perception, with architects exhibiting distinct visual attention patterns compared to laypeople when viewing buildings and built environments. Using eye-tracking and entropy metrics, we found that architects show a more distributed gaze pattern (higher entropy), yet their attention is simultaneously concentrated on key architectural elements, such as structural features, volumetric forms, and the how buildings are embedded within their surroundings.
Architects’ visual processing appears to operate through an internalized “spatial grammar” developed through years of training. This allows them to analyze not only the structural integrity and design details of buildings, but also their contextual relationships. Unlike non-experts, who might focus on decorative elements, architects subconsciously prioritize the functional and spatial aspects that define a building’s role within its environment. This dual capacity to absorb broader scenes while honing in on specific details reflects a heightened visual acuity related to their expertise. This research underscores the adaptability of the human brain, where prolonged exposure and training in a specific domain foster specialized perceptual mechanisms. For architects, this results in a subconscious, efficient processing of spatial information, akin to fluency in a native language. The same way that your native language shapes the way you think, their expertise shapes the way architects perceive architectural elements, even when the task at hand is not overtly related to architecture at all. By understanding the cognitive processes underlying architects’ perception, we gain a greater appreciation for the depth of expertise involved in designing spaces that are not only functional and aesthetically pleasing but also harmoniously integrated in their environments.
Authors' Contributions
BM and GS performed conceptualization of the project. HM and RDD collected the data. BM, RDD and GS contributed to the methodology. HM and RDD performed data curation. GS and RDD performed formal analysis. BM handled project administration and managed resources. RDD and GS performed the visualizations. GS and RDD wrote the manuscript. All authors have read and agreed to the published version of the manuscript.
Supplementary Materials
The following supporting information can be downloaded at the website of this paper posted on Preprints.org, Stimuli, Results and RAW data: https://osf.io/6xbgp/.
Funding
This research received no external funding.
Institutional Review Board Statement
The study was conducted in accordance with the Declaration of Helsinki, and approved by the Ethics Committee of Gemeinsamen Ethikkommission der Fakultäten 9,11-17 der TU Dortmund (protocol code GEKTUDO_2025-09 on May 2025).
Informed Consent Statement
Informed consent was obtained from all subjects involved in the study.
Data Availability Statement
The original data presented in the study are openly available in https://osf.io/6xbgp/ at DOI 10.17605/OSF.IO/6XBGP.
Conflicts of Interest
The authors declare no conflicts of interest.
Abbreviations
The following abbreviations are used in this manuscript:
| AOI | Areas of Interest |
| CAD | Computer-aided Design |
| VR | Virtual Reality |
| MRI | Magnetic Resonance Imaging |
| LCD | Liquid-crystal display |
References
- Mertins, H.; Mertins, B.; Delucchi Danhier, R.; Schulz, A.; Schulz, B. Architekten haben eine andere Wahrnehmung. Detail 2017, 9, 80–81. [Google Scholar]
- Mertins, H.; Delucchi Danhier, R.; Mertins, B.; Schulz, A.; Schulz, B. The Role of Expertise in the Perception of Architectural Space. In Research Culture in Architecture; Leopold, C., Robeller, C., Weber, U., Eds.; Birkhäuser: Basel, Switzerland, 2020; pp. 279–288. [Google Scholar]
- Levinson, S.C.; Wilkins, D.P. (Eds.) Grammars of Space: Explorations in Cognitive Diversity; Cambridge University Press: Cambridge, UK, 2006. [Google Scholar] [CrossRef]
- Garcia-Laguia, A.X. Giving voice to space: the grammar of Northern Alta spatial roots. Folia Linguistica 2022, 56, 351–387. [Google Scholar] [CrossRef]
- Winawer, J.; Witthoft, N.; Frank, M.C.; Wu, L.; Wade, A.R.; Boroditsky, L. Russian blues reveal effects of language on color discrimination. Proc. Natl. Acad. Sci. USA 2007, 104, 7780–7785. [Google Scholar] [CrossRef] [PubMed]
- Roberson, D.; Davies, I.; Davidoff, J. Color categories are not universal: Replications and new evidence from a stone-age culture. J. Exp. Psychol. Gen. 2000, 129, 369–398. [Google Scholar] [CrossRef]
- Slobin, D.I. From "thought and language" to "thinking for speaking". In Rethinking Linguistic Relativity; Gumperz, J.J., Levinson, S.C., Eds.; Cambridge University Press: Cambridge, UK, 1996; pp. 70–96. [Google Scholar]
- Papafragou, A.; Hulbert, J.; Trueswell, J. Does language guide event perception? Evidence from eye movements. Cognition 2008, 108, 155–184. [Google Scholar] [CrossRef]
- Sera, M.D.; Elieff, C.; Forbes, J.; Burch, M.C.; Rodríguez, W.; Dubois, D.P. When language affects cognition and when it does not: An analysis of grammatical gender and classification. J. Exp. Psychol. Gen. 2002, 131, 377–397. [Google Scholar] [CrossRef]
- Konishi, T. The semantics of grammatical gender: A cross-cultural study. J. Psycholinguist. Res. 1993, 22, 519–534. [Google Scholar] [CrossRef]
- Gordon, P. Numerical cognition without words: Evidence from Amazonia. Science 2004, 306, 496–499. [Google Scholar] [CrossRef]
- Pica, P.; Lemer, C.; Izard, V.; Dehaene, S. Exact and approximate arithmetic in an Amazonian indigene group. Science 2004, 306, 499–503. [Google Scholar] [CrossRef]
- Levinson, S.C. Space in Language and Cognition: Explorations in Cognitive Diversity; Cambridge University Press: Cambridge, UK, 2003. [Google Scholar]
- Majid, A.; Bowerman, M.; Kita, S.; Haun, D.B.; Levinson, S.C. Can language restructure cognition? The case for space. Trends Cogn. Sci. 2004, 8, 108–114. [Google Scholar] [CrossRef]
- Hickmann, M.; Robert, S. Space in Languages: Linguistic Systems and Cognitive Categories; John Benjamins: Amsterdam/Philadelphia, Netherlands/USA, 2006. [Google Scholar]
- Brown, P.; Levinson, S.C. Linguistic and nonlinguistic coding of spatial arrays: Explorations in Mayan cognition. Working Paper No. 24, 1993. [Google Scholar]
- von Stutterheim, C.; Andermann, M.; Carroll, M.; Flecken, M.; Schmiedtová, B. How grammaticized concepts shape event conceptualization in language production: Insights from linguistic analysis, eye tracking data and memory performance. Linguistics 2012, 4, 833–867. [Google Scholar] [CrossRef]
- Carroll, M.; von Stutterheim, C.; Nuese, R. The language and thought debate: A psycholinguistic approach. In Multidisciplinary Approaches to Language Production; Pechmann, T., Habel, C., Eds.; De Gruyter Mouton: Berlin, Germany, 2004; pp. 183–218. [Google Scholar]
- Schmiedtová, B.; von Stutterheim, C.; Carroll, M. Implications of language-specific patterns in event construal of advanced L2 speakers. In Thinking and Speaking in Two Languages; Pavlenko, A., Ed.; Multilingual Matters: Clevendon, UK, 2011; pp. 66–107. [Google Scholar]
- Mertins, B. Sprache und Kognition. Ereigniskonzeptualisierung im Deutschen und Tschechischen; De Gruyter: Berlin/Boston, Germany/USA, 2018. [Google Scholar]
- Schmiedtová, B. Do L2 speakers think in the L1 when speaking in the L2? Int. J. Appl. Linguist. (VIAL) 2011, 8, 97–122. [Google Scholar]
- Psarra, S. Architecture and Narrative: The Formation of Space and Cultural Meaning; Routledge: London, UK, 2009. [Google Scholar]
- Coates, N. Narrative Architecture; Wiley: Hoboken, NJ, USA, 2012. [Google Scholar]
- Correia, L.G. Spaces and places of education: prelude. Paedagogica Historica 2021, 57, 1–10. [Google Scholar] [CrossRef]
- Maguire, E.A.; Gadian, D.G.; Johnsrude, I.S.; Good, C.D.; Ashburner, J.; Frackowiak, R.S.J.; Frith, C.D. Navigation-related structural change in the hippocampi of taxi drivers. Proc. Natl. Acad. Sci. USA 2000, 97, 4398–4403. [Google Scholar] [CrossRef]
- Benz, I.; Rambow, R. Sichtbeton in der Architektur. Perspektivenunterschiede zwischen ArchitektInnen und Laien. Umweltpsychologie 2011, 15, 112–129. [Google Scholar]
- Shannon, C.E. A mathematical theory of communication. Bell Syst. Tech. J. 1948, 27, 379–423. [Google Scholar] [CrossRef]
- Bromiley, P.; Thacker, N.; Bouhova-Thacker, E. Shannon entropy, Renyi entropy, and information. Statistics and Information Series (2004-004).
- Kosel, C.; Holzberger, D.; Seidel, T. Identifying expert and novice visual scanpath patterns and their relationship to assessing learning-relevant student characteristics. Front. Educ. 2021, 5, Article 612175. [Google Scholar] [CrossRef]
- Krejtz, K.; Szmidt, T.; Duchowski, A.T.; Krejtz, I. Entropy-based Statistical Analysis of Eye Movement Transitions. In Proceedings of the Eye Tracking Research & Applications (ETRA) Conference, Safety Harbor, FL, USA, 26–28 March 2014; ACM; pp. 159–166. [Google Scholar]
- Melnyk, K.; Friedman, L.; Komogortsev, O.V. What can entropy metrics tell us about the characteristics of ocular fixation trajectories? PLoS ONE 2024, 19, e0291823. [Google Scholar] [CrossRef]
- R Development Core Team. R: A Language and Environment for Statistical Computing; R Foundation for Statistical Computing: Vienna, Austria, 2011; ISBN 3-900051-07-0. [Google Scholar]
- Hessels, R.S.; Kemner, C.; van den Boomen, C.; Hooge, I.T.C. The area-of-interest problem in eye-tracking research: A noise-robust solution for face and sparse stimuli. Behav. Res. Methods 2016, 48, 1694–1712. [Google Scholar] [CrossRef]
- Shannon, C.E. Prediction and entropy of printed English. Bell Syst. Tech. J. 1951, 30, 50–64. [Google Scholar] [CrossRef]
- Ahmad, K.; Khan, M.A.; Khan, S.; Ali, A.; Chu, Y.M. New estimation of Zipf–Mandelbrot and Shannon entropies via refinements of Jensen’s inequality. AIP Adv. 2021, 11, 015147. [Google Scholar] [CrossRef]
Figure 1.
All 15 stimuli used in the study, categorized in built, mixed and natural environments, depending on the density of built elements.
Figure 1.
All 15 stimuli used in the study, categorized in built, mixed and natural environments, depending on the density of built elements.
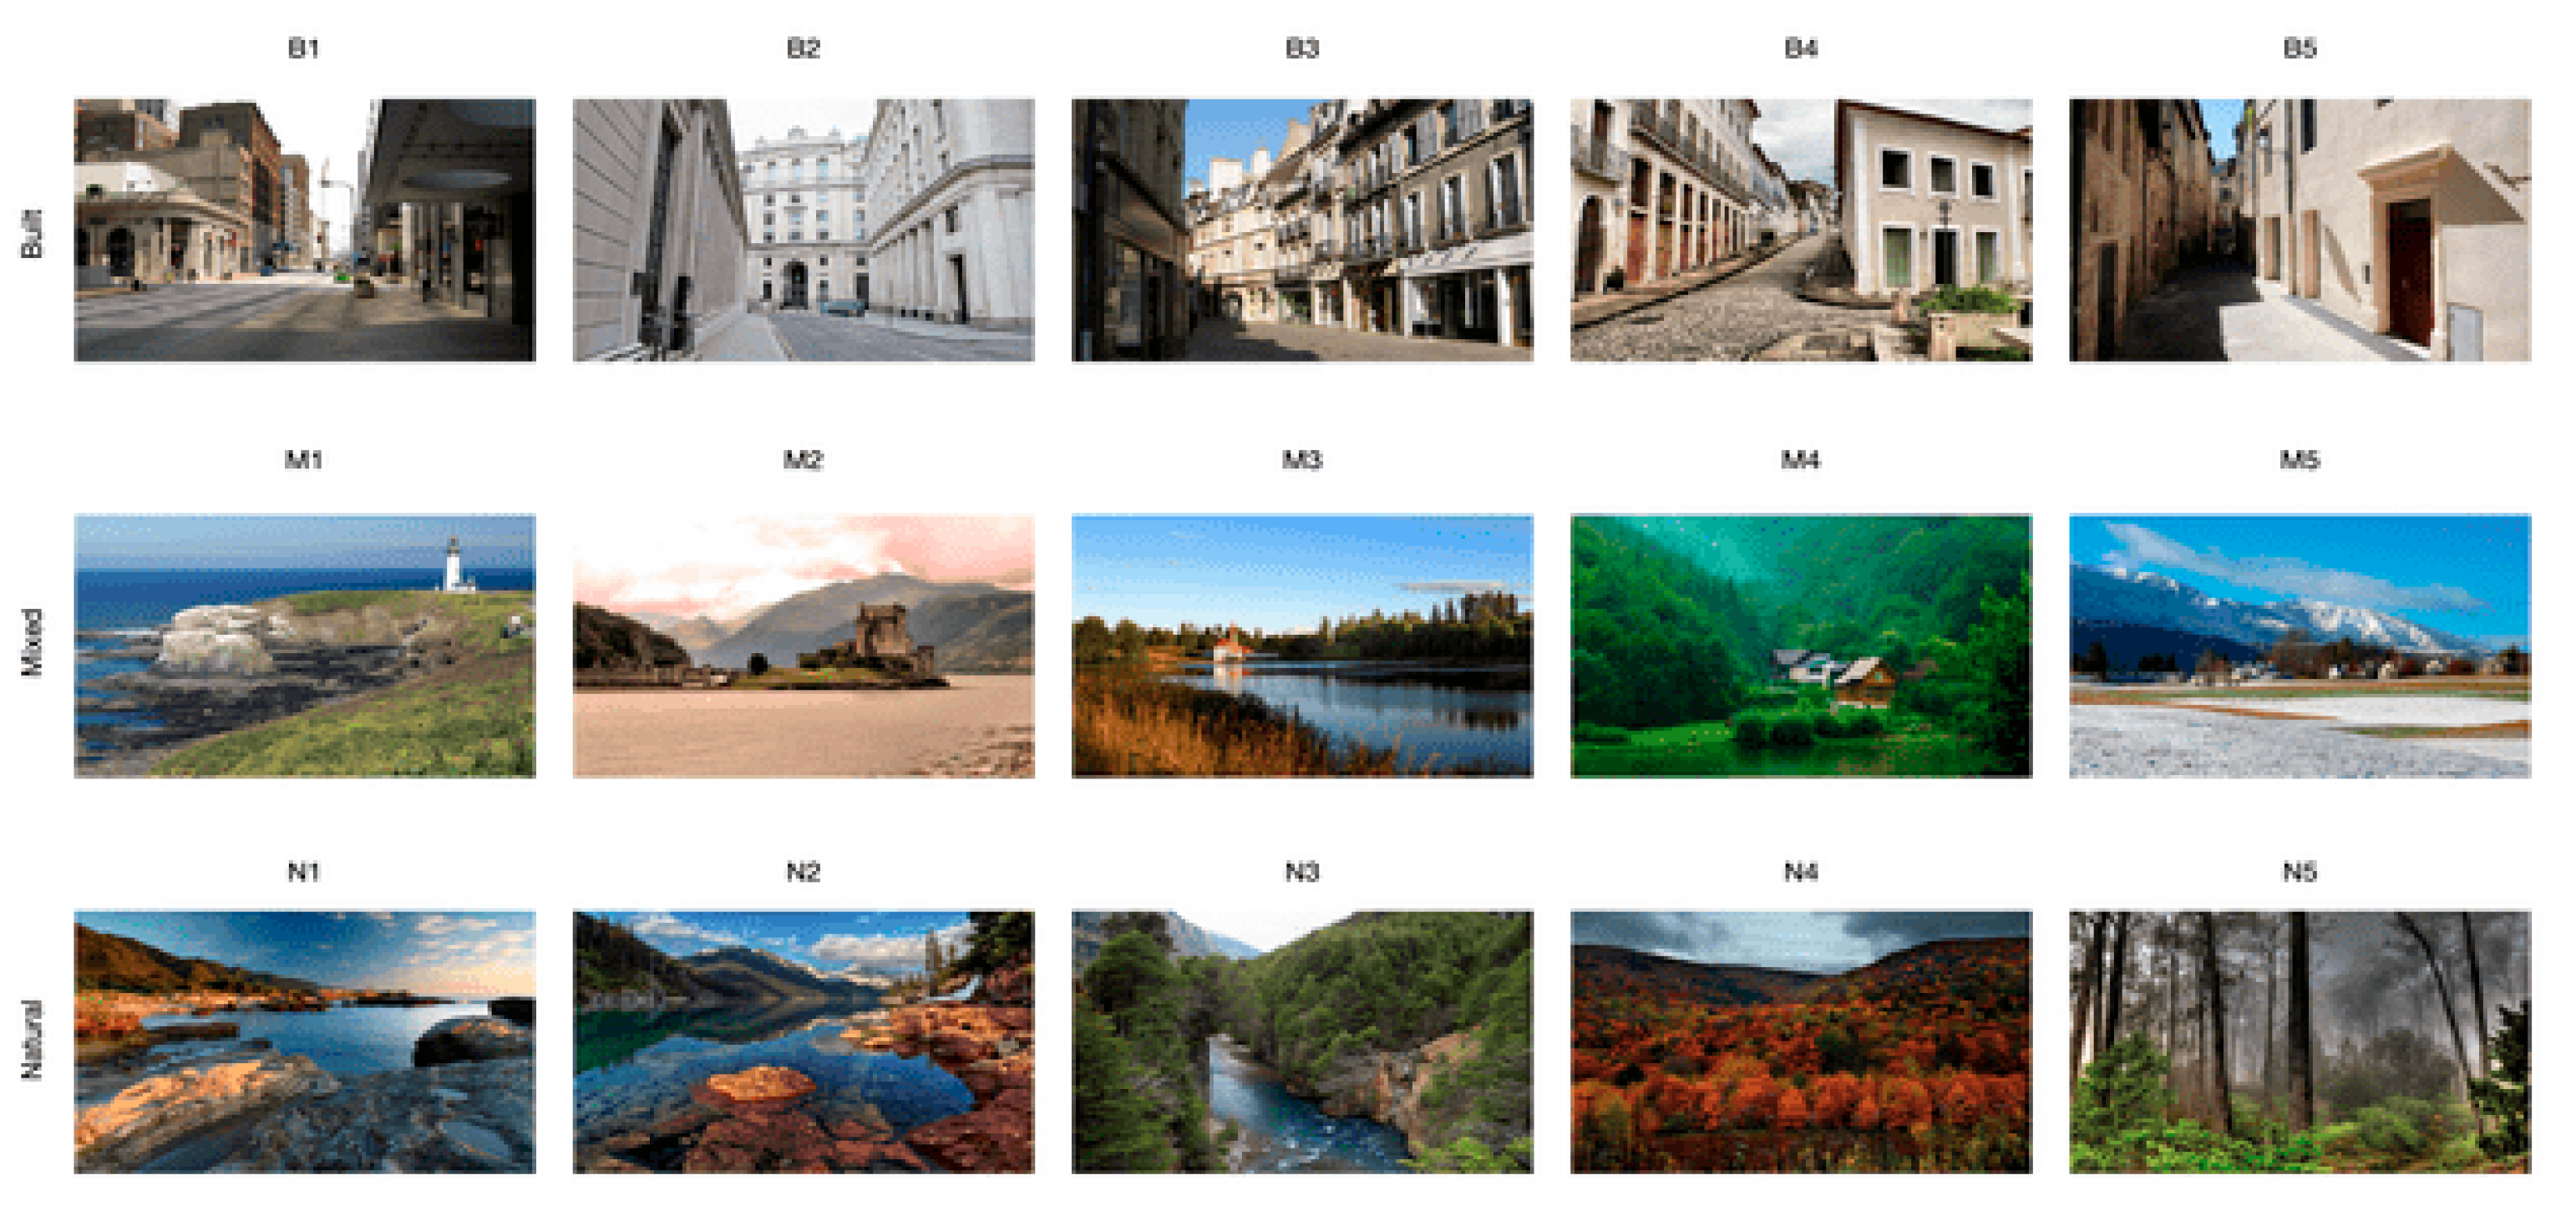
Figure 2.
Experimental design.
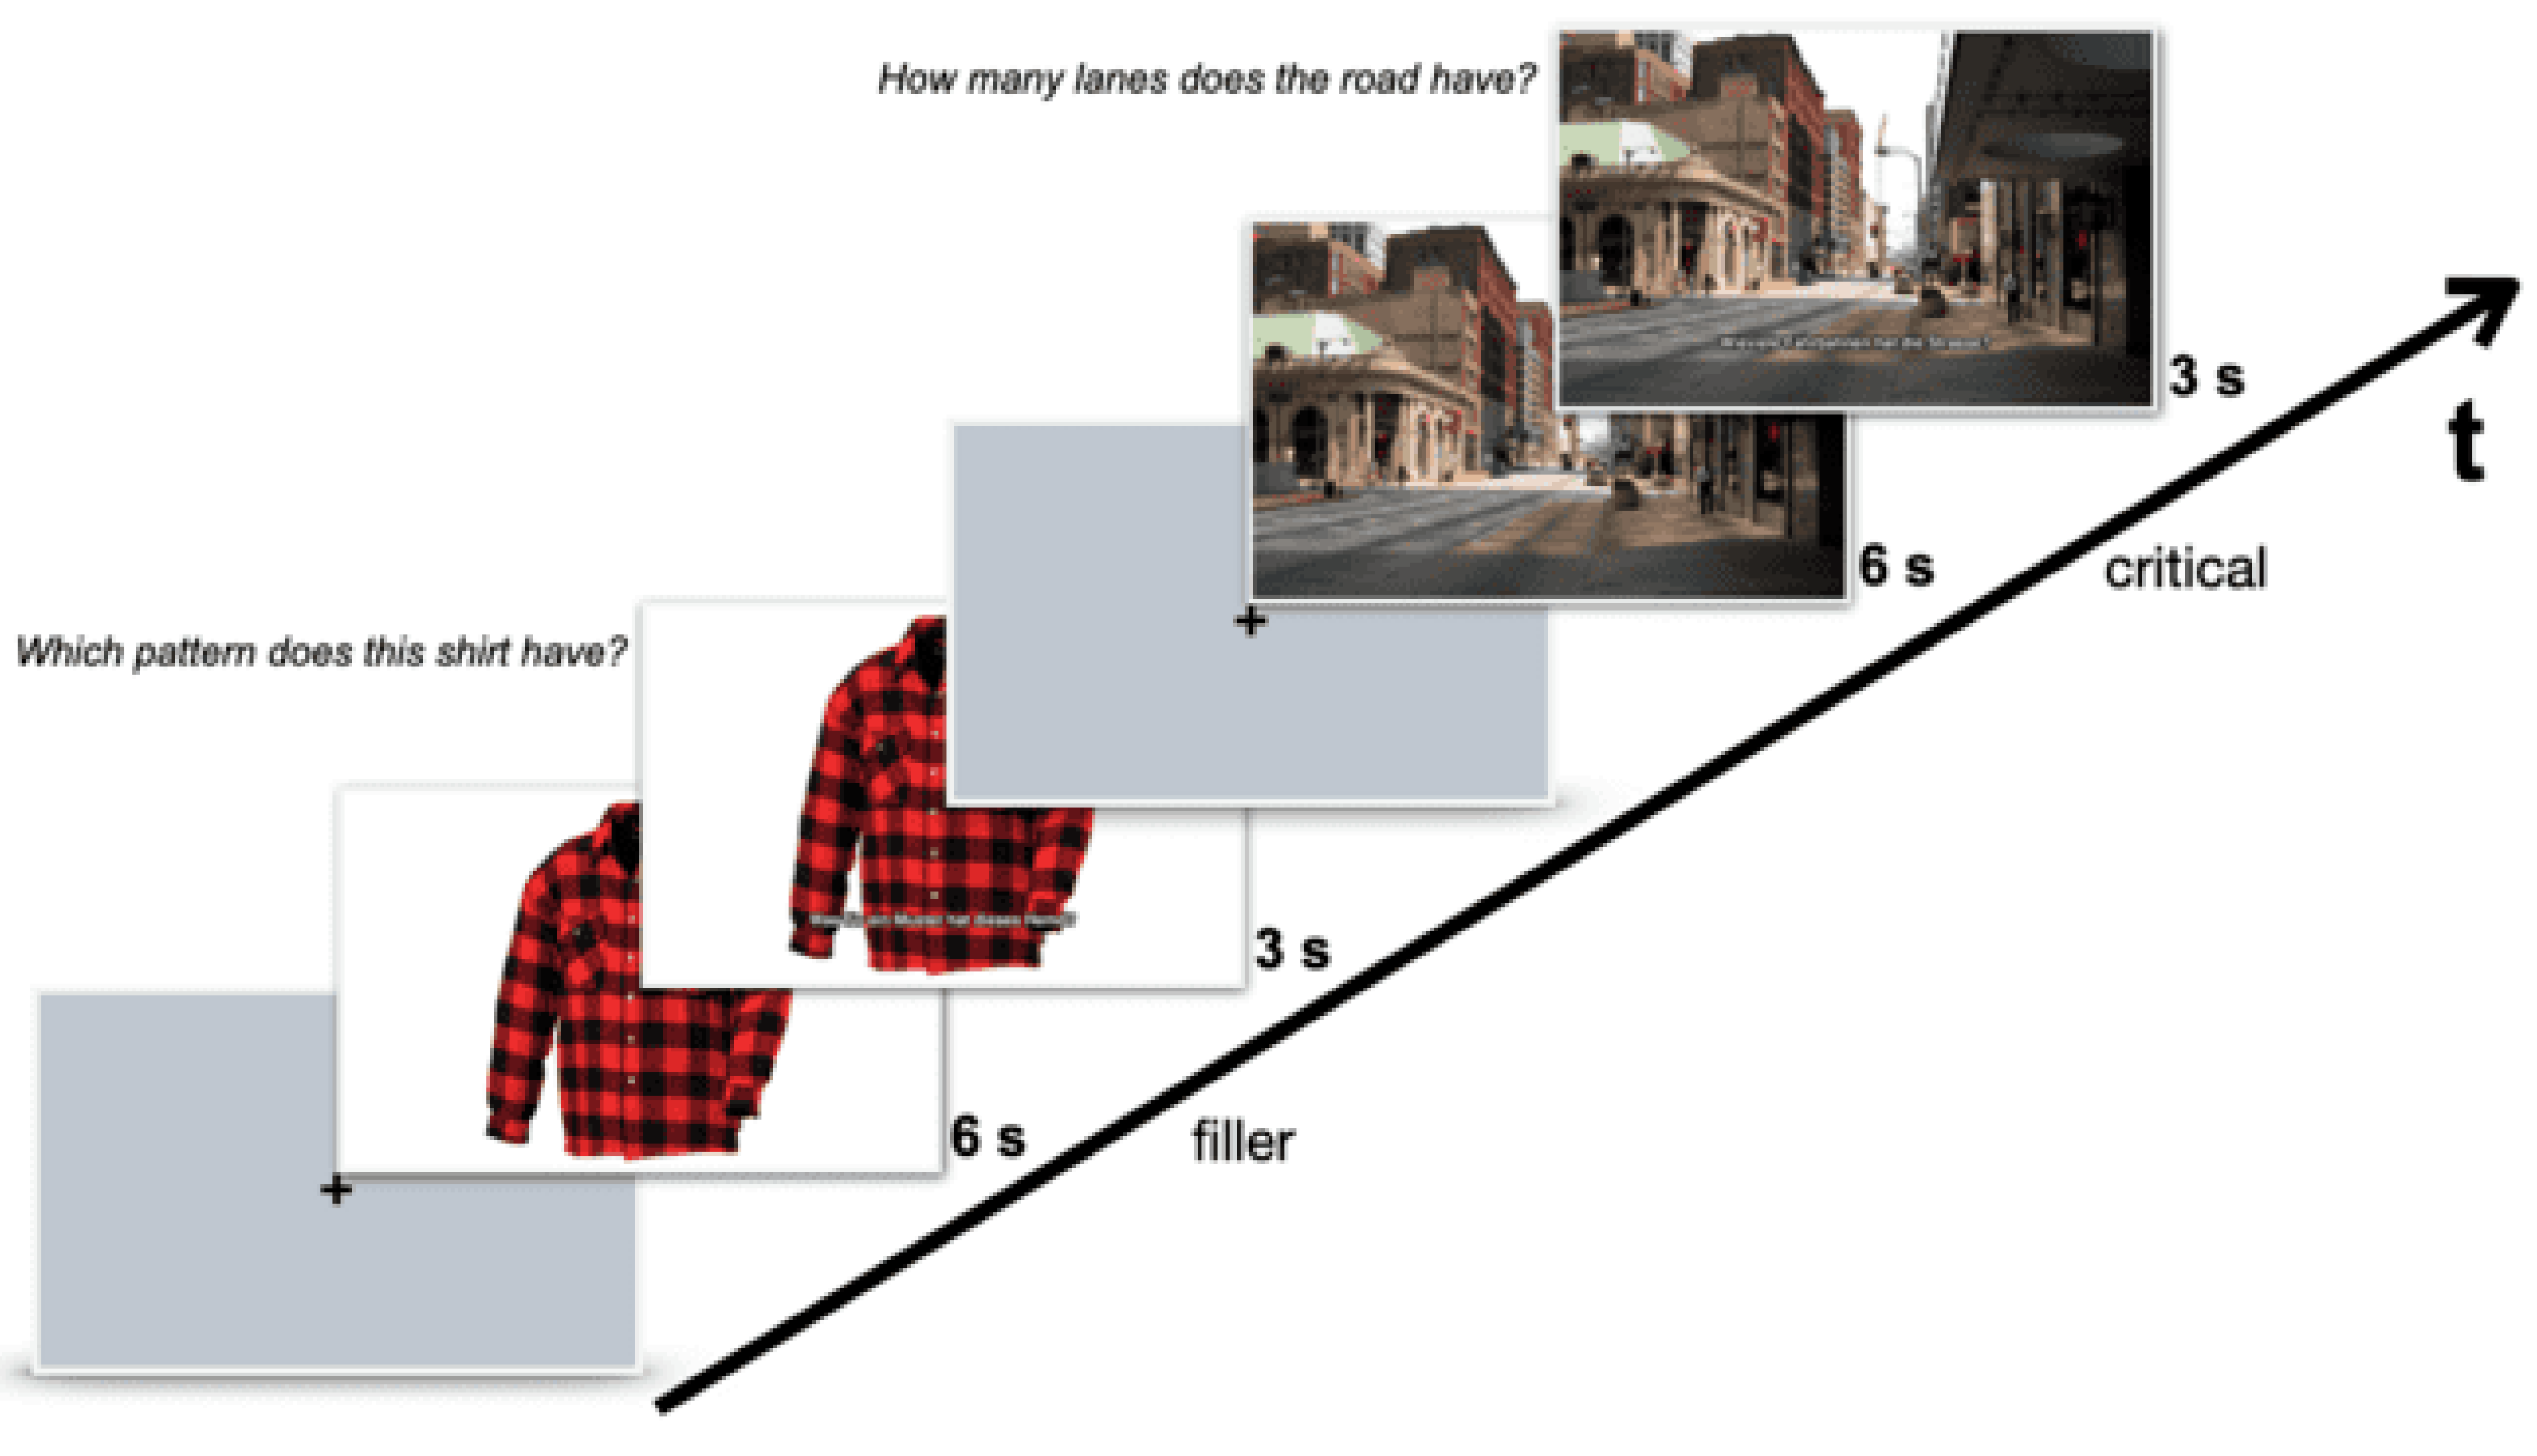
Figure 3.
Gridded AOIs (16x16) overlaid on top of the mixed environment stimulus M2. The grid results in 256 AOIs of equal size per stimulus.
Figure 3.
Gridded AOIs (16x16) overlaid on top of the mixed environment stimulus M2. The grid results in 256 AOIs of equal size per stimulus.
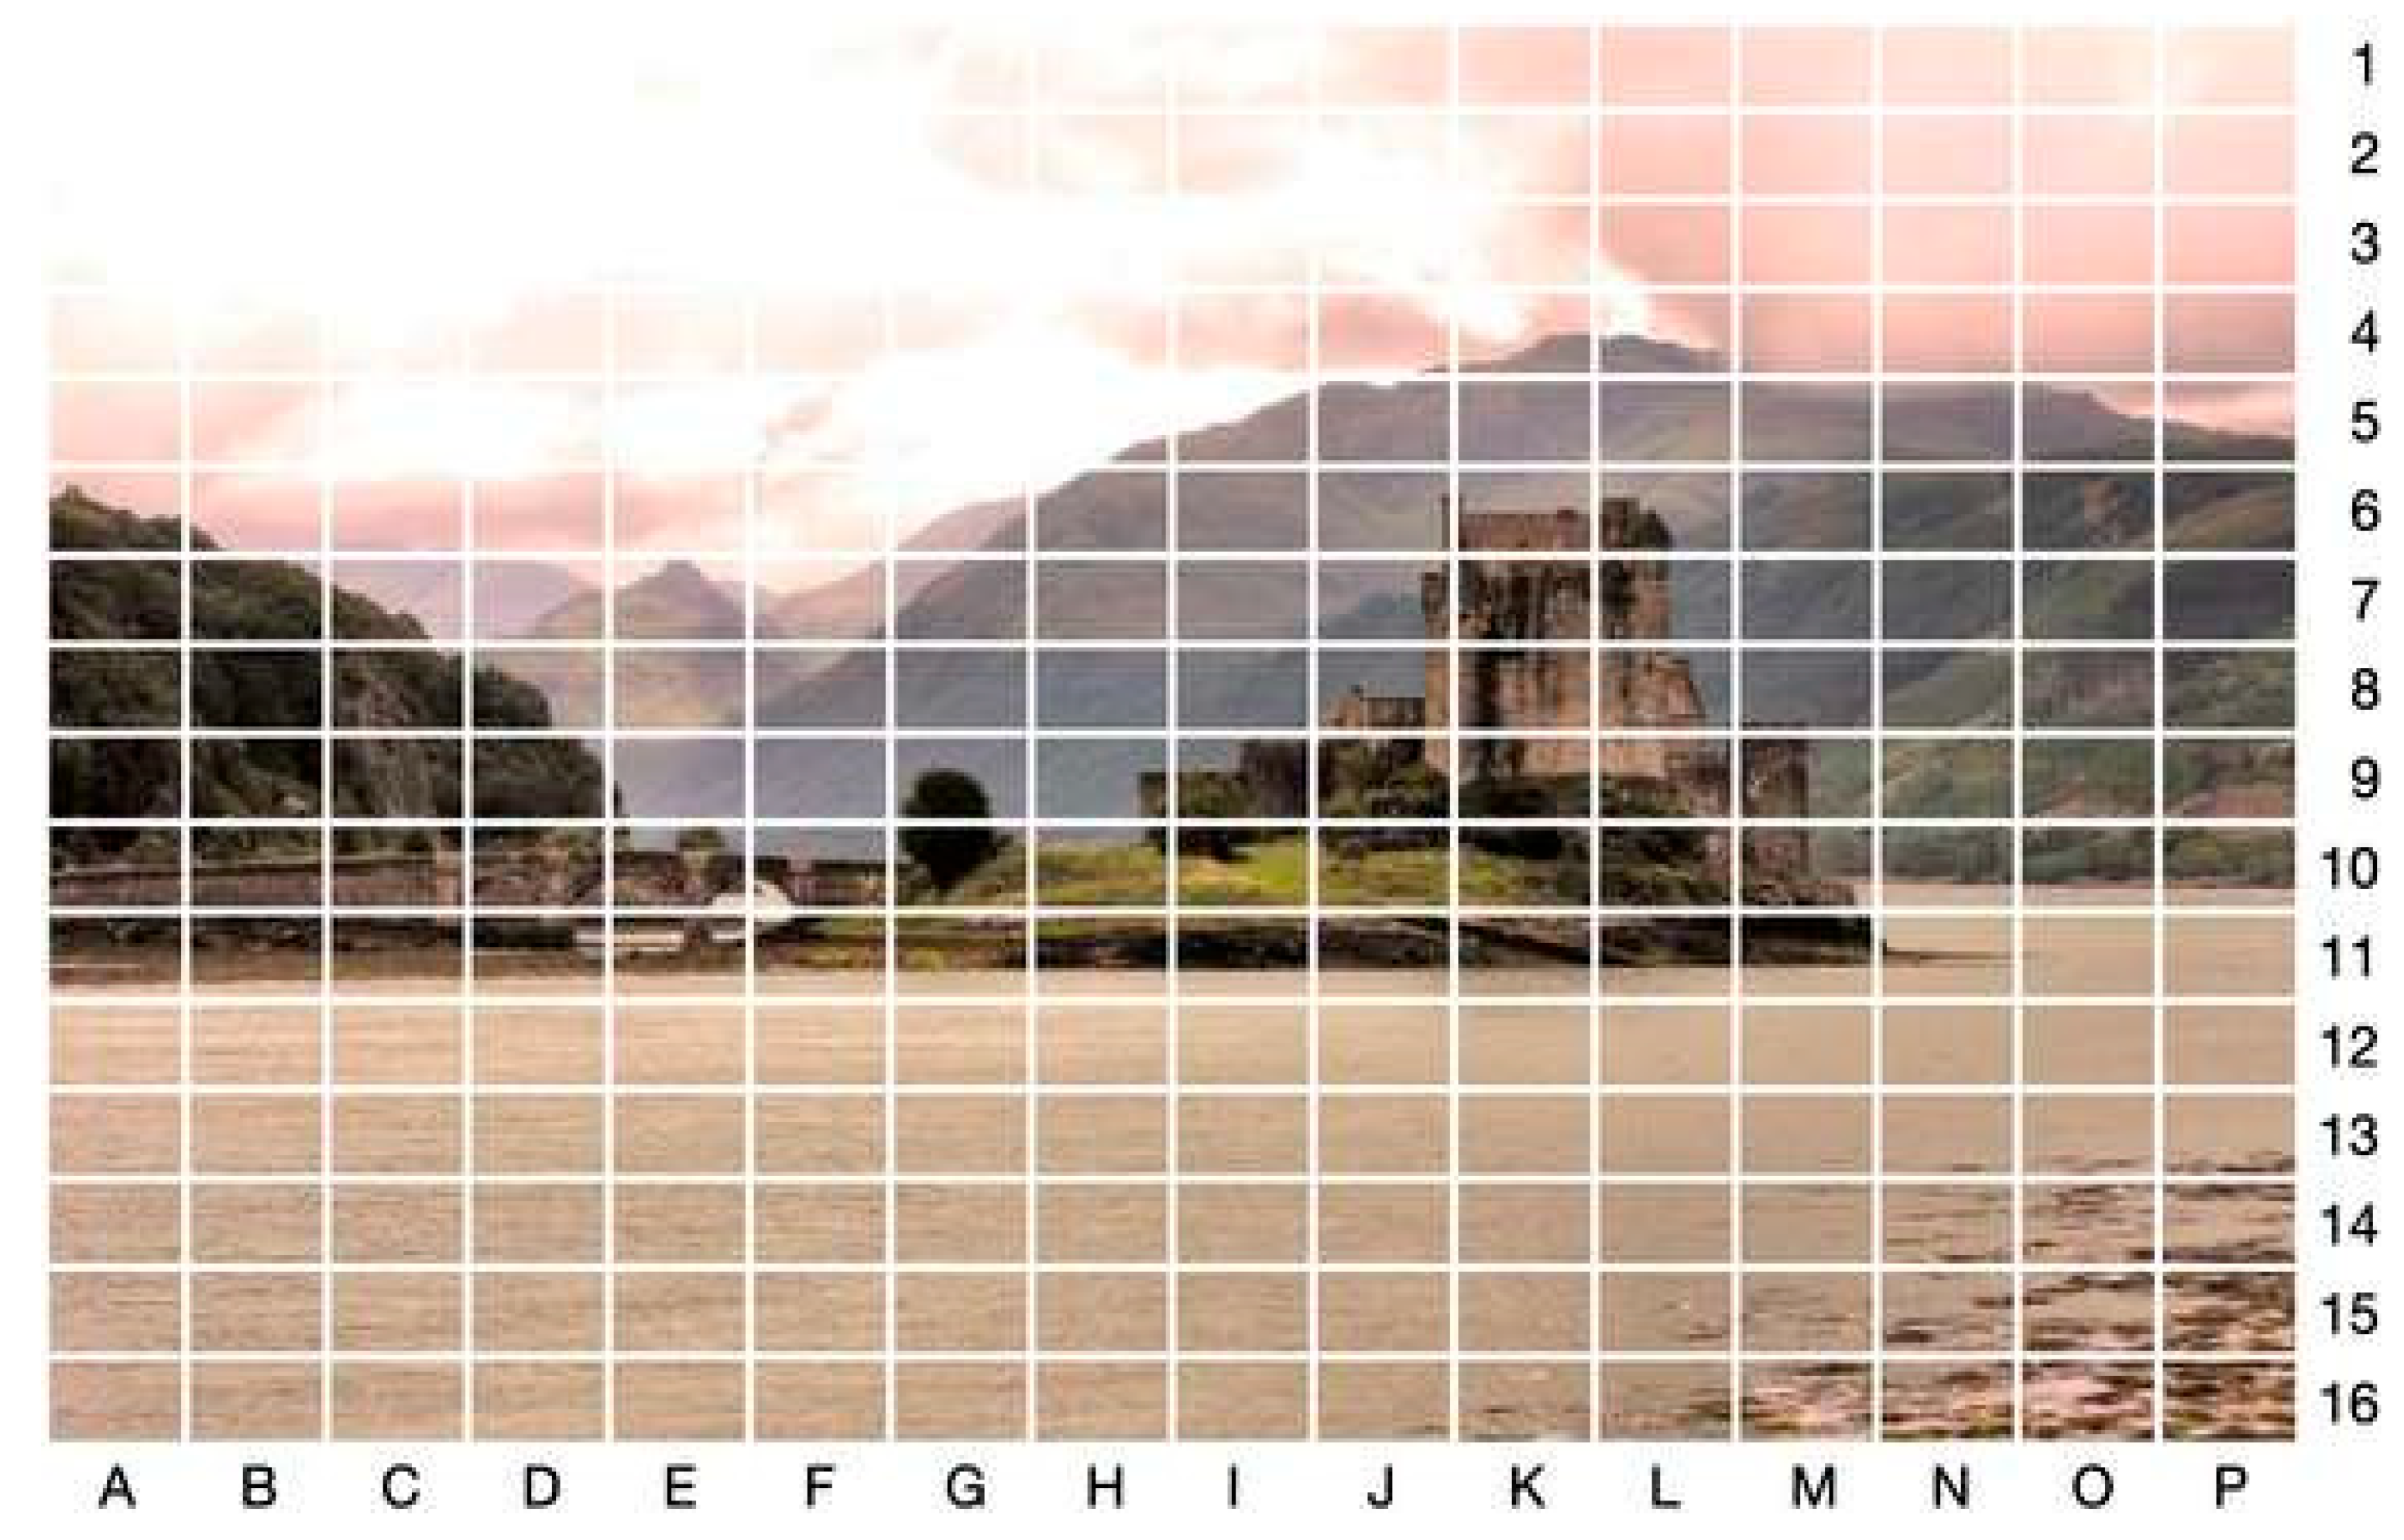
Figure 4.
Overall trend. Comparison between groups for all participants and all stimuli.
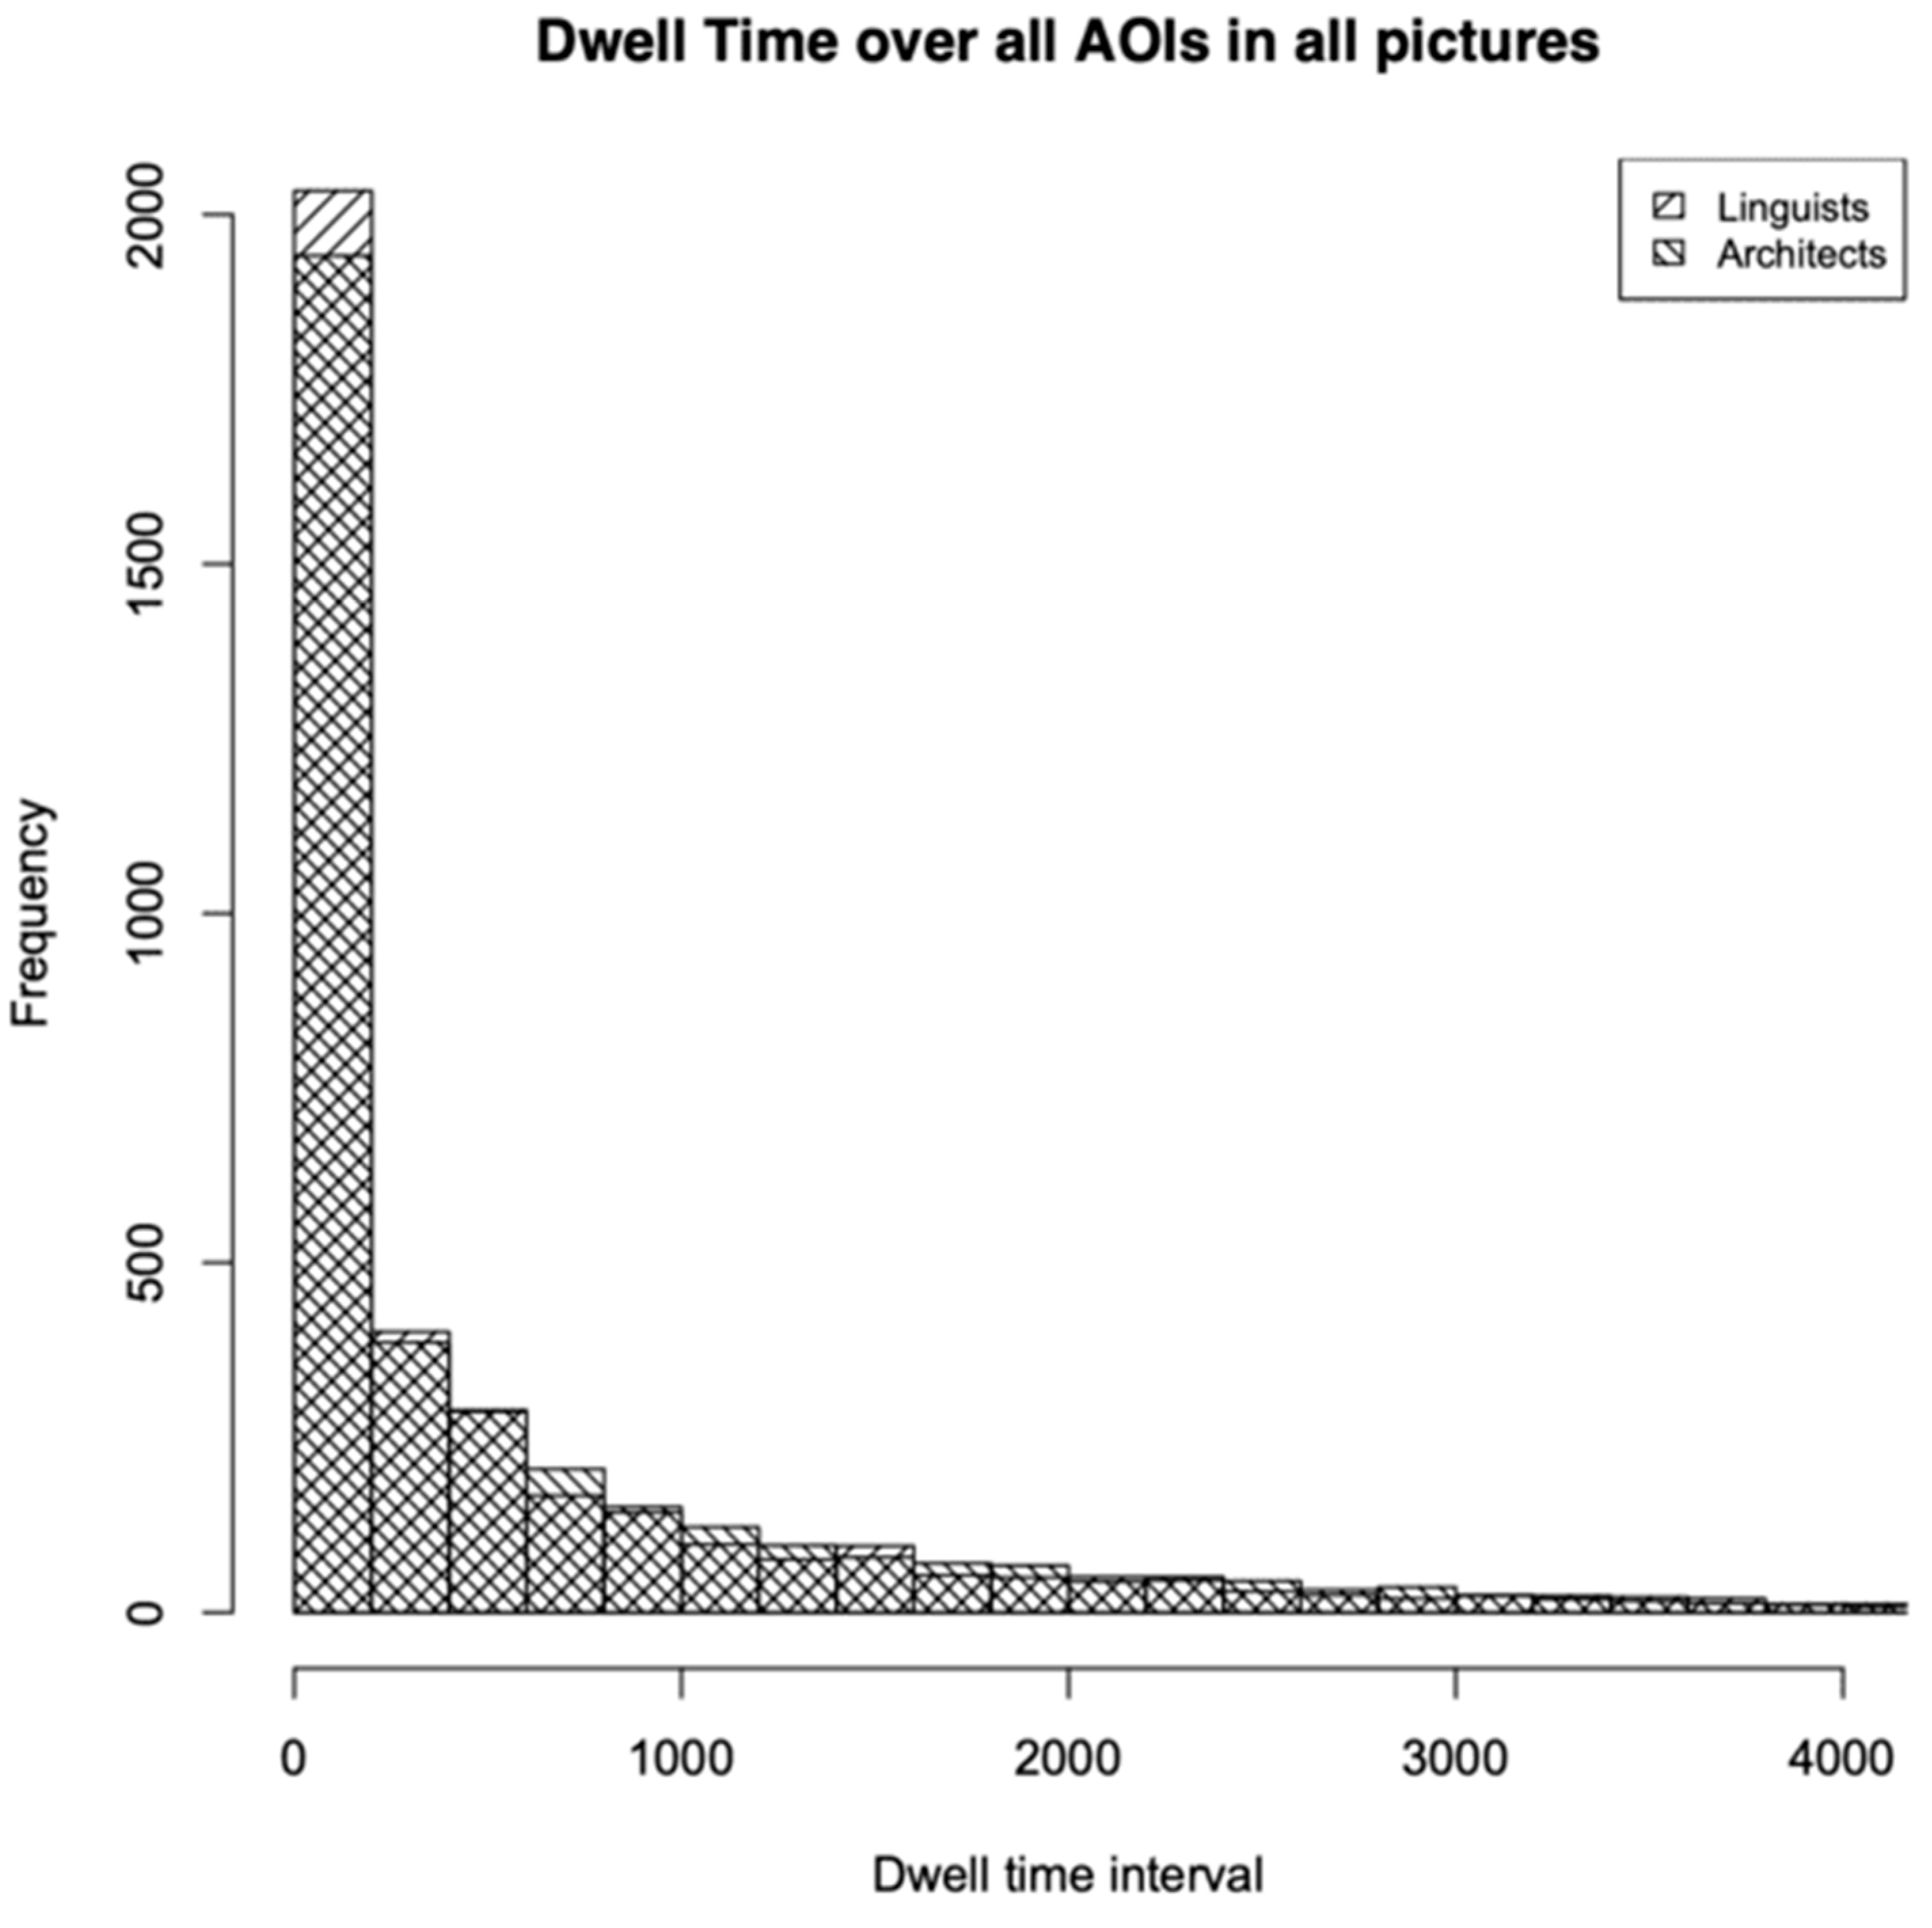
Figure 5.
Dwell time densities for each of the 15 stimuli arranged as small multiples.
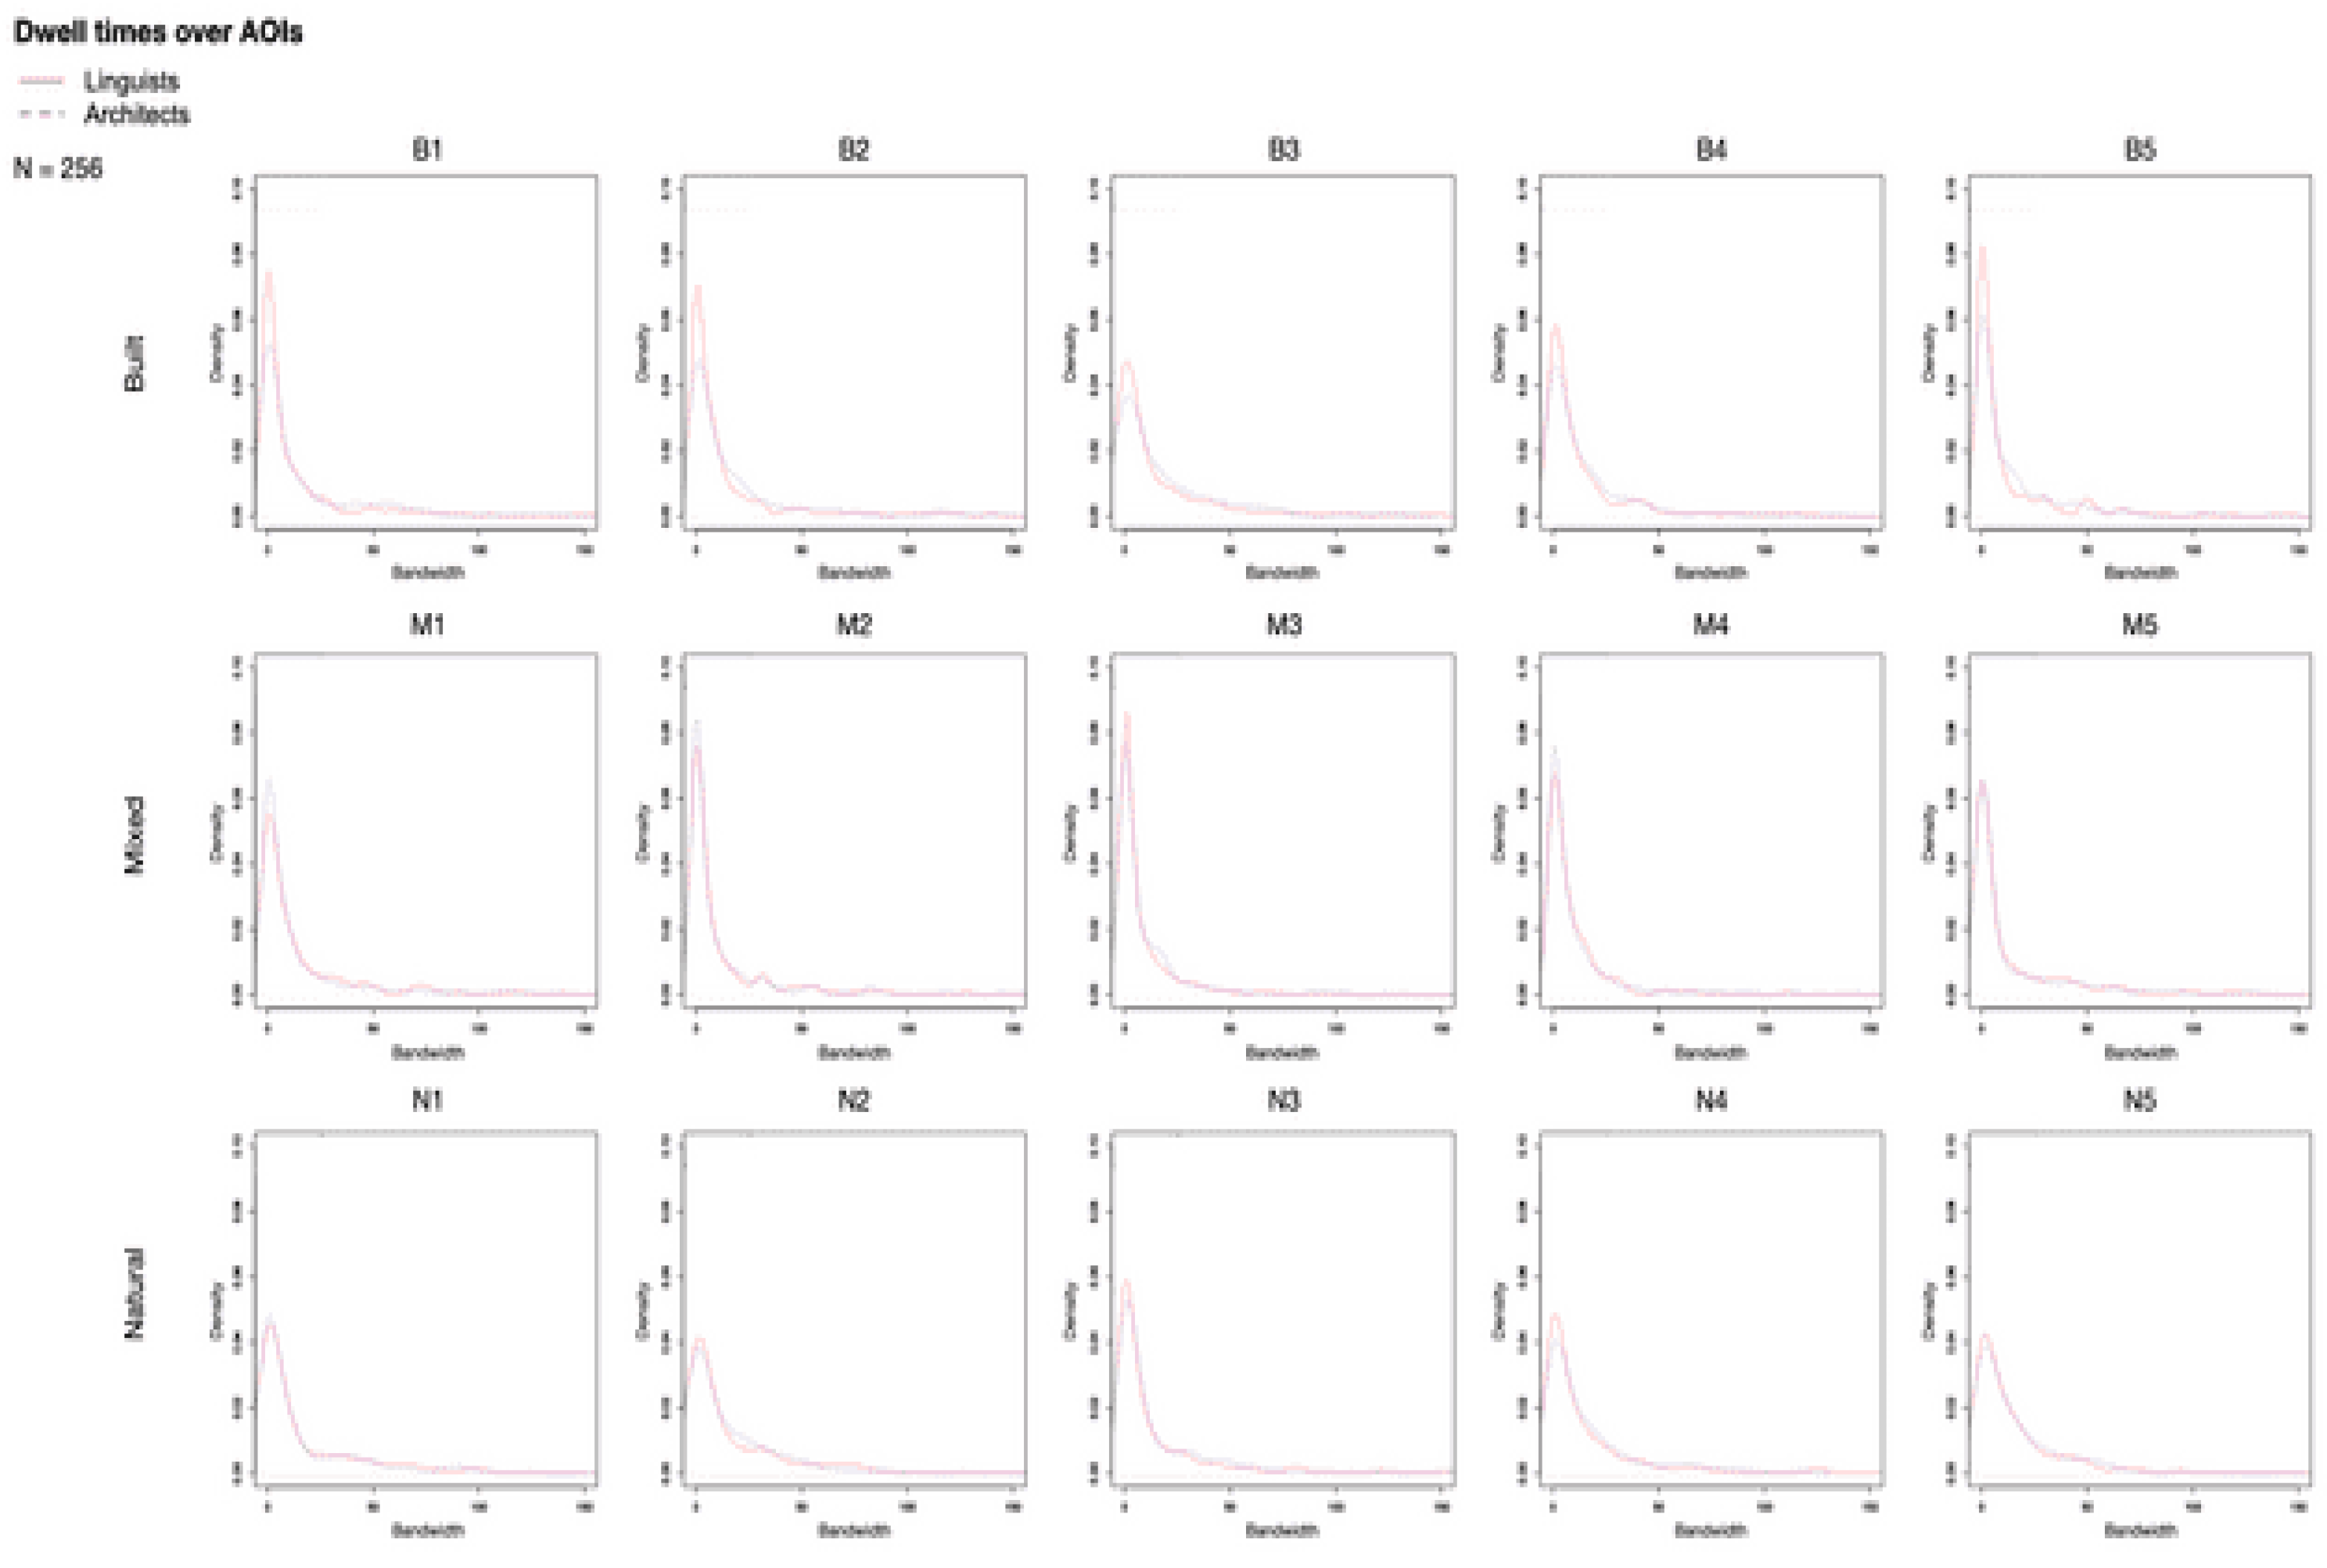
Figure 6.
Distribution of dwell time for all built environment stimuli.
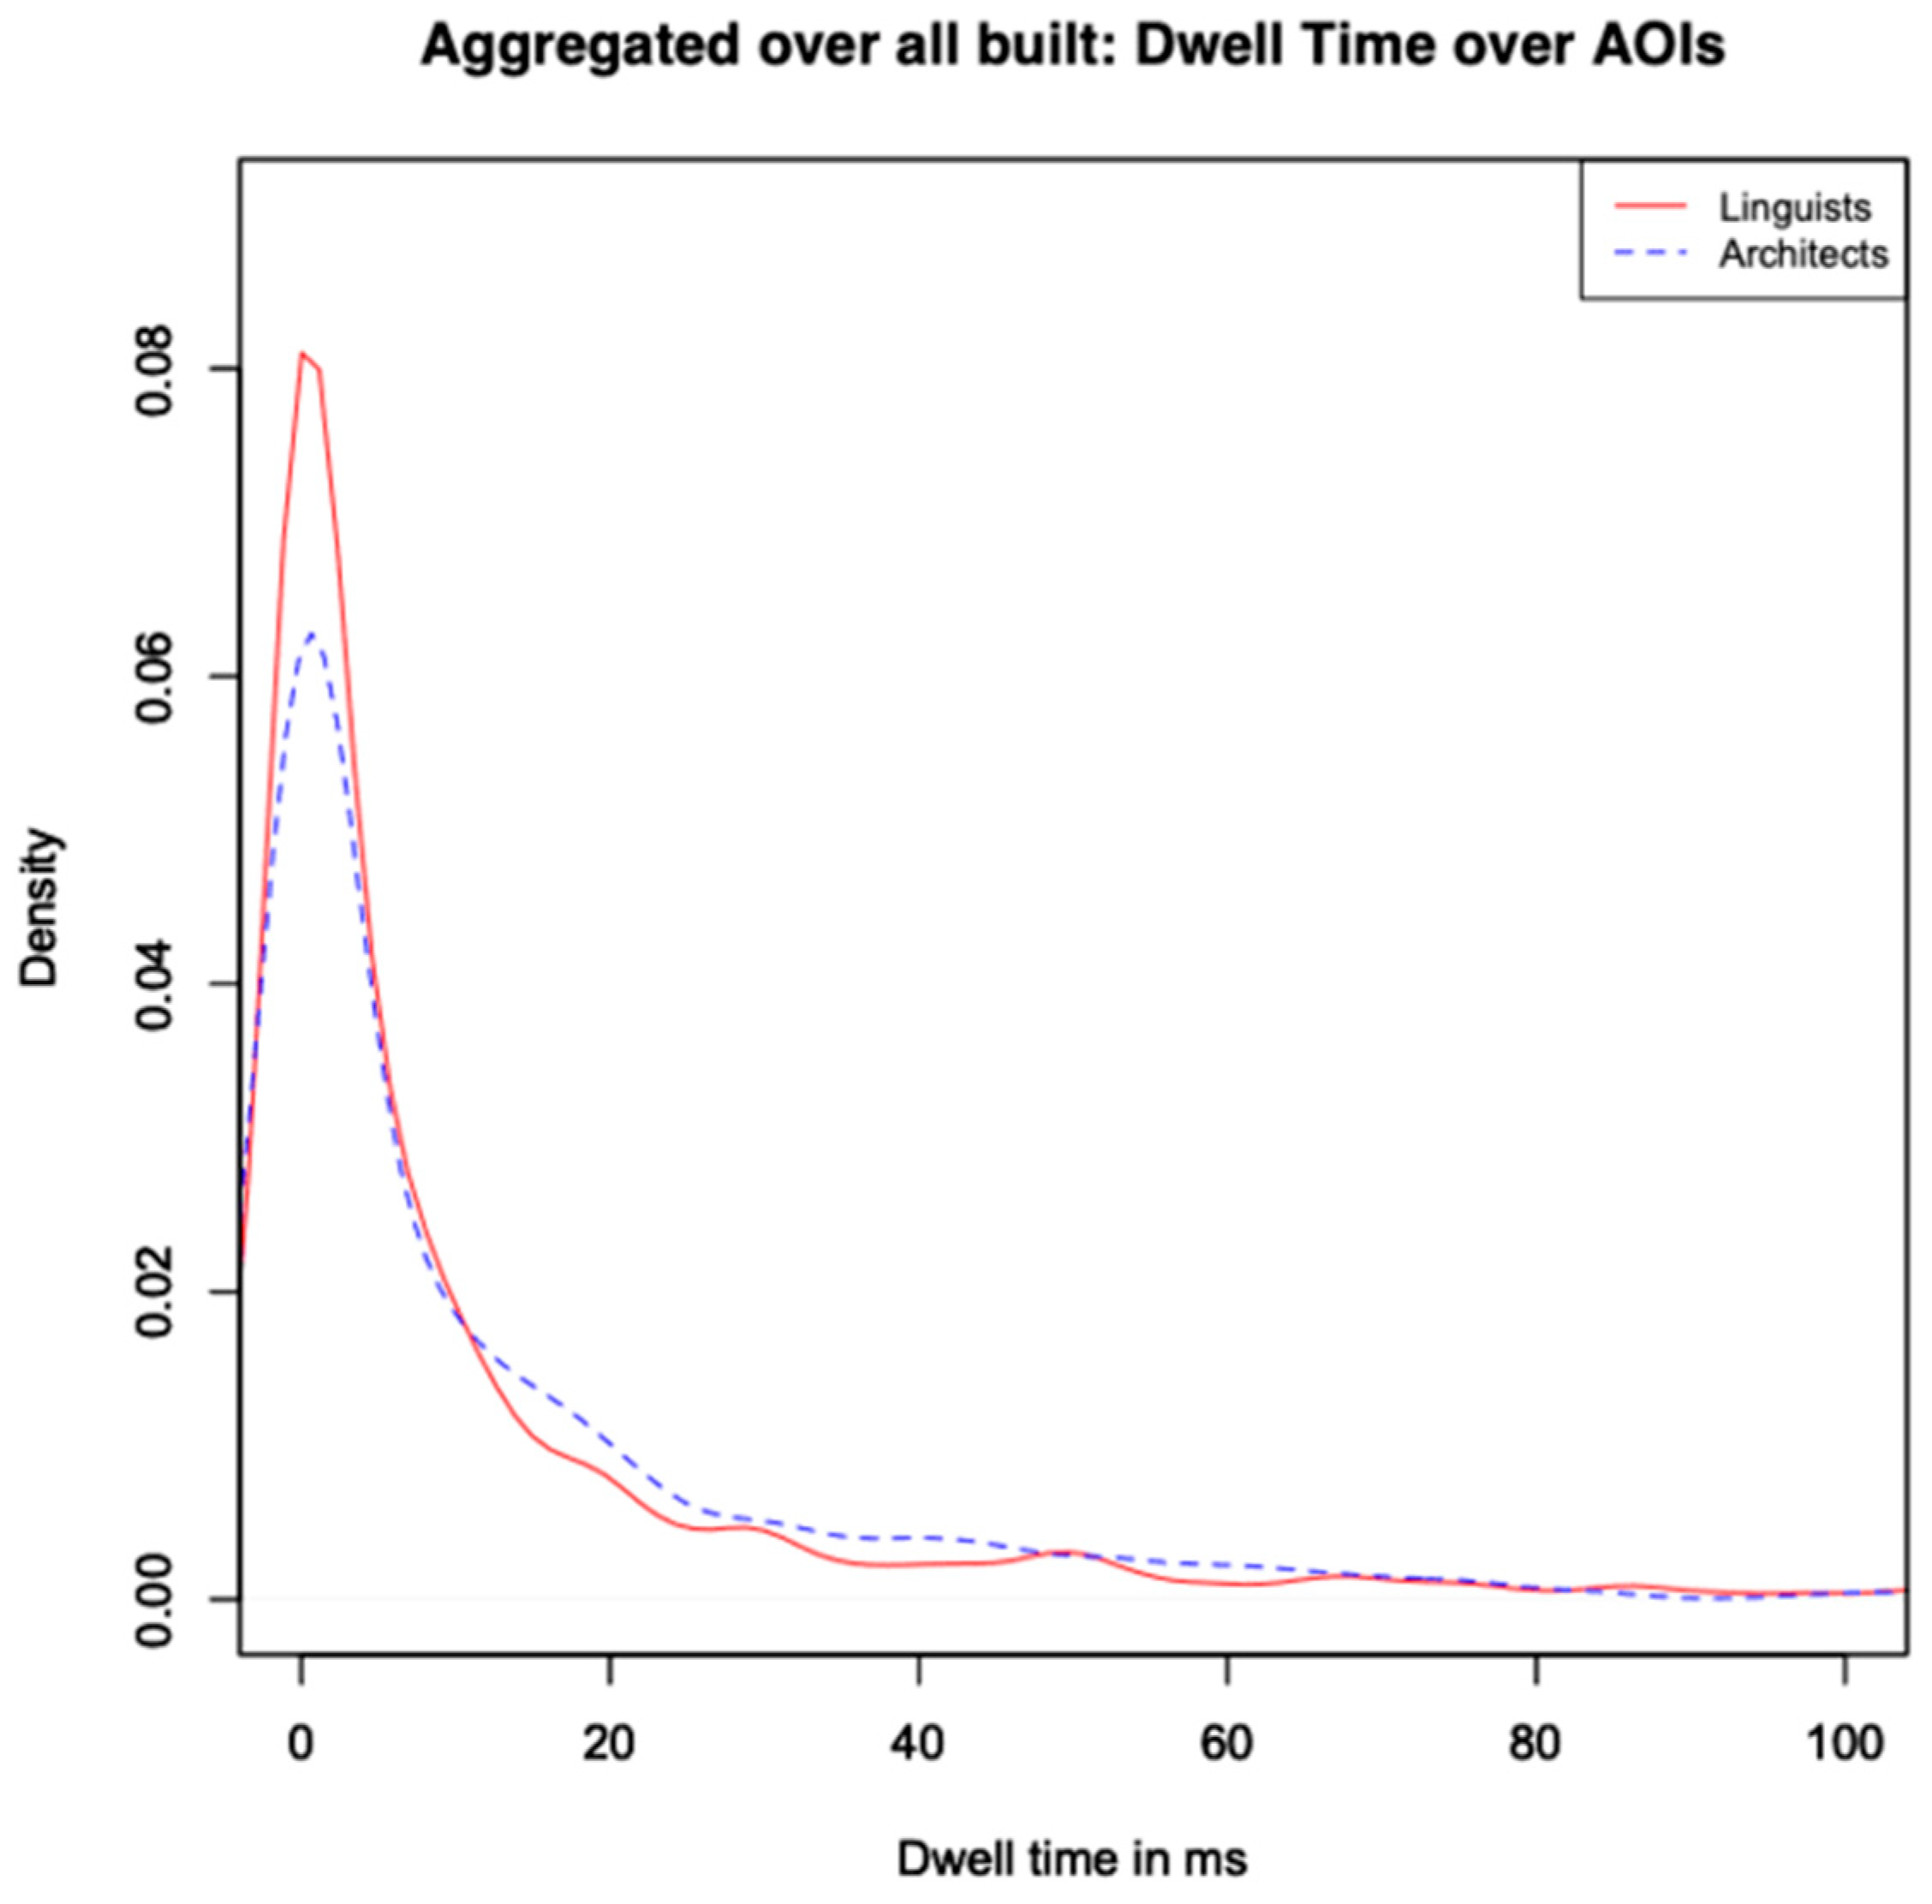
Figure 7.
(a) Stimulus B1 “St. Louis”; (b) the distribution of dwell times; (c-d) heat maps for both groups while viewing the stimulus.
Figure 7.
(a) Stimulus B1 “St. Louis”; (b) the distribution of dwell times; (c-d) heat maps for both groups while viewing the stimulus.
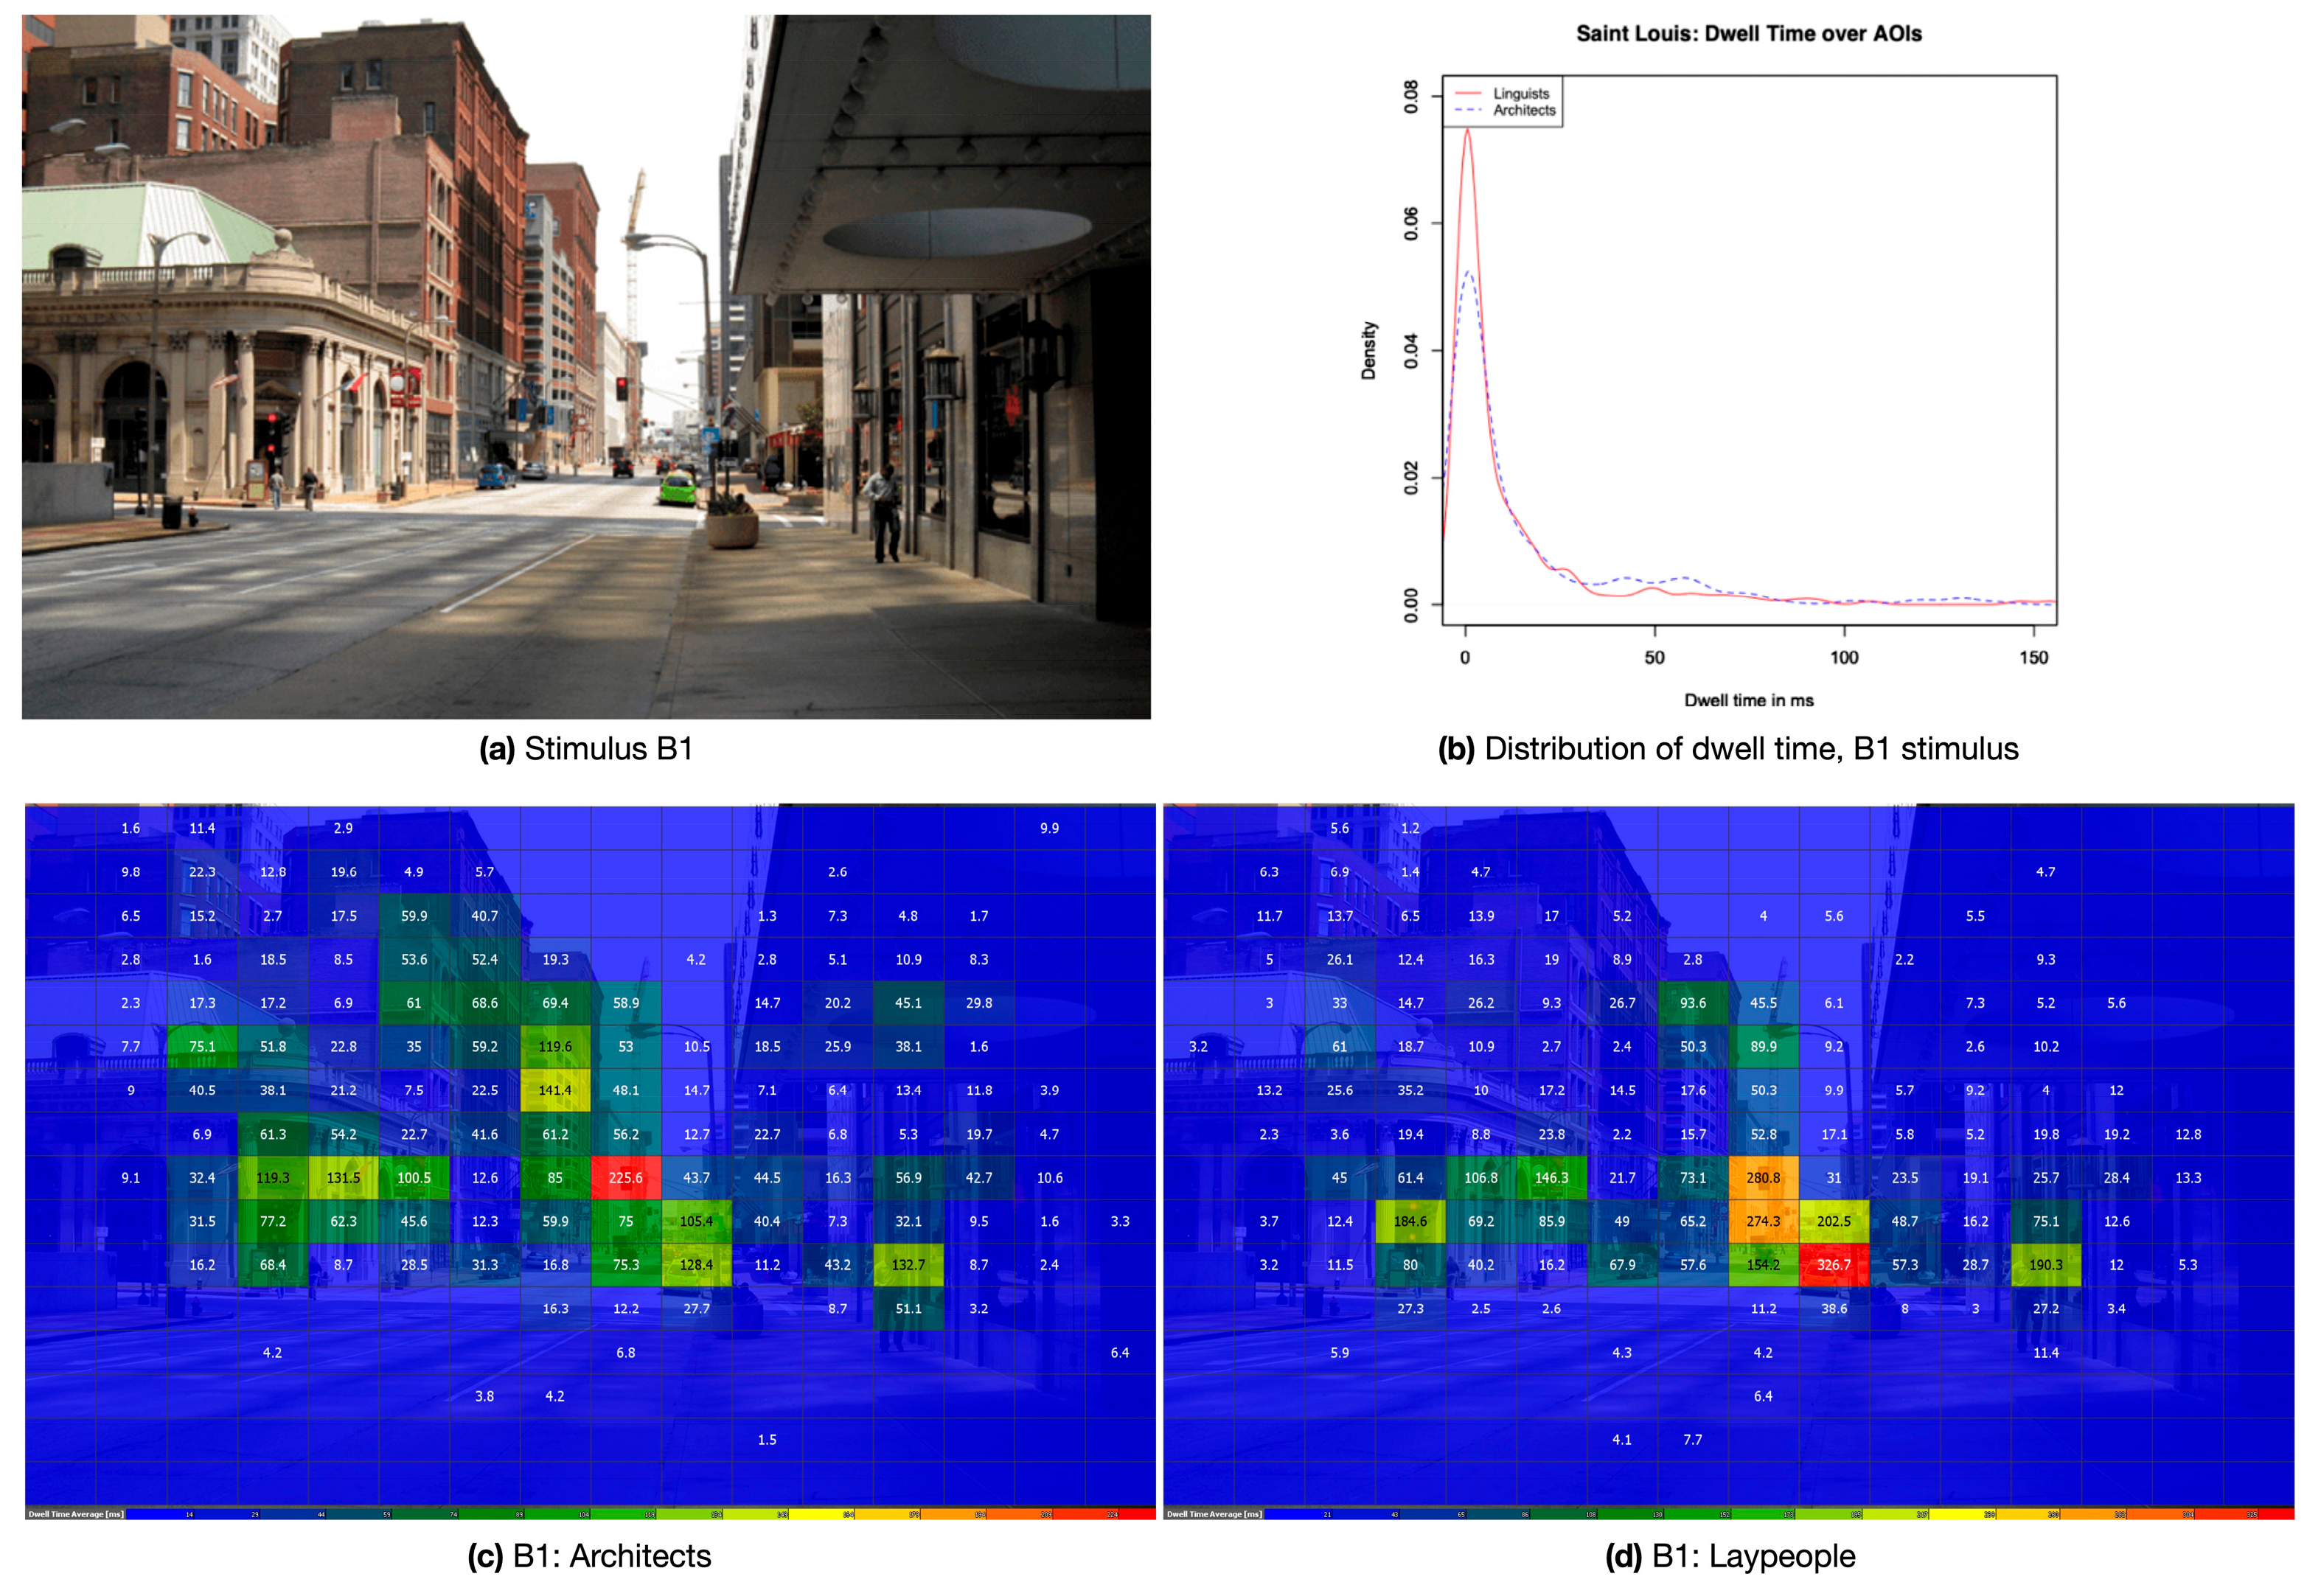
Figure 8.
(a) Stimulus M2 “Scotland“; (b) the distribution of dwell times; (c-d) heat maps for both groups while viewing the stimulus.
Figure 8.
(a) Stimulus M2 “Scotland“; (b) the distribution of dwell times; (c-d) heat maps for both groups while viewing the stimulus.
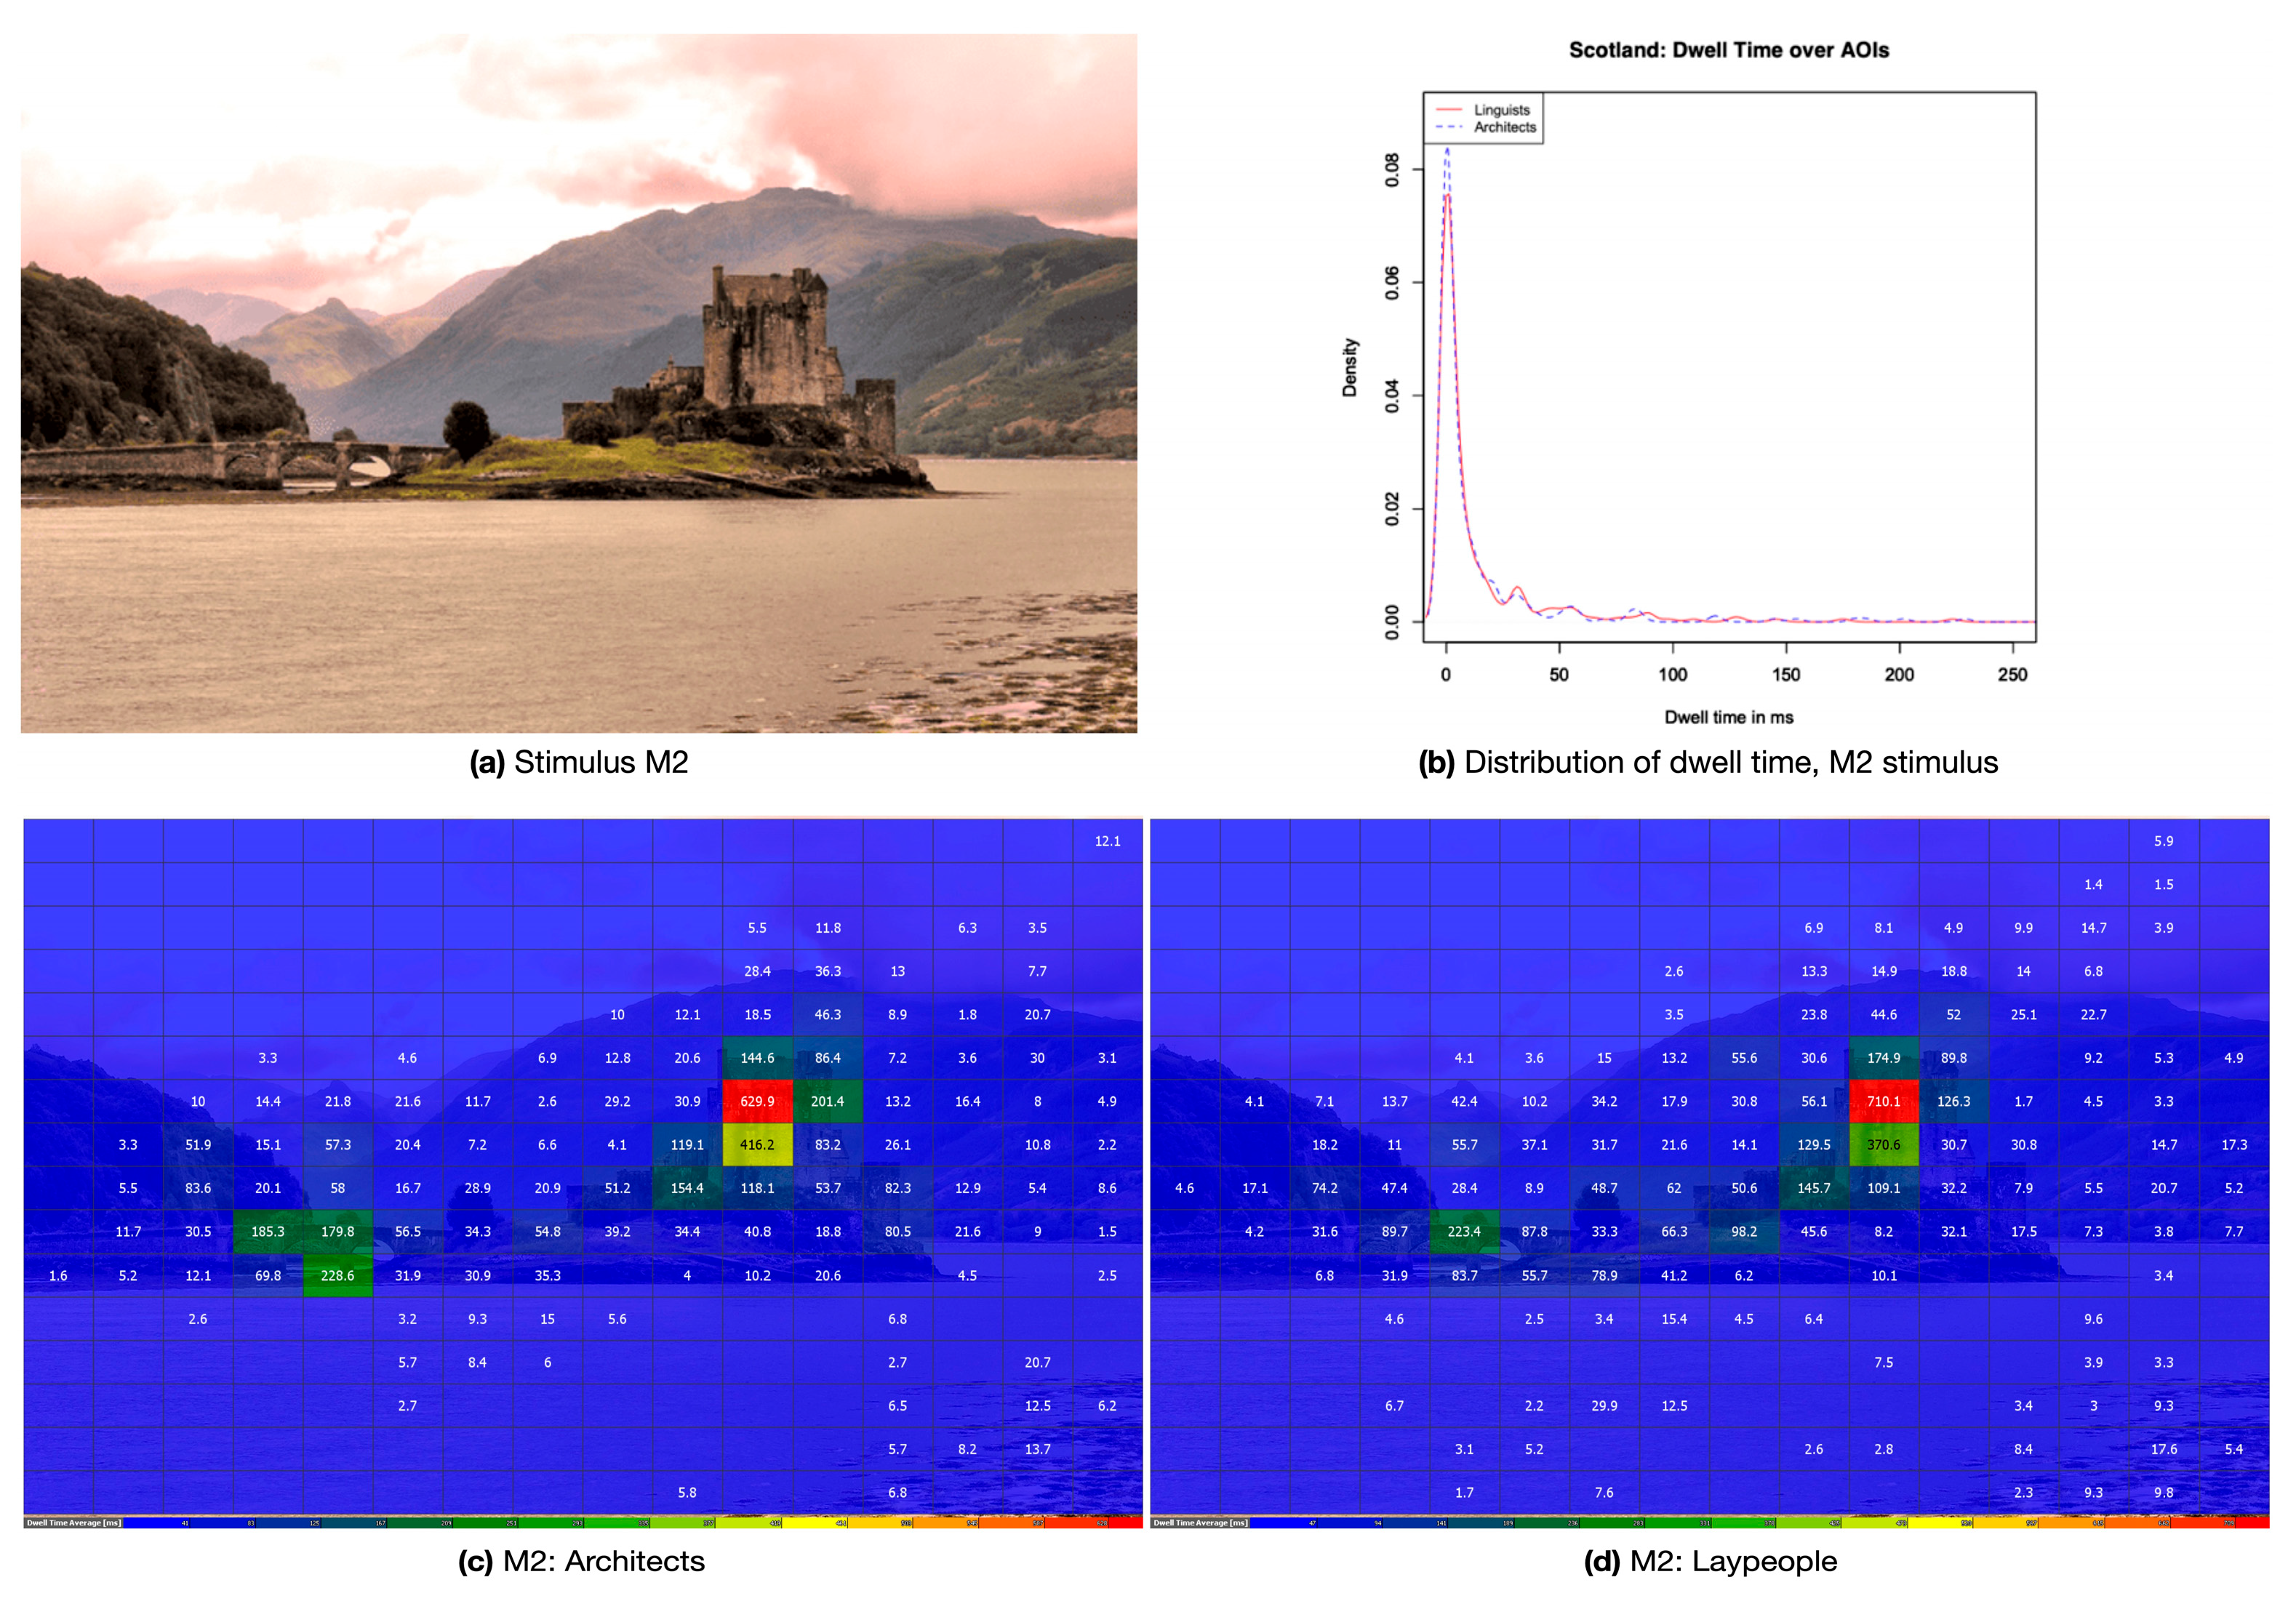
Figure 9.
(a) Stimulus N2 “Canada“; (b) the distribution of dwell times; (c-d) heat maps for each group while viewing the stimulus.
Figure 9.
(a) Stimulus N2 “Canada“; (b) the distribution of dwell times; (c-d) heat maps for each group while viewing the stimulus.
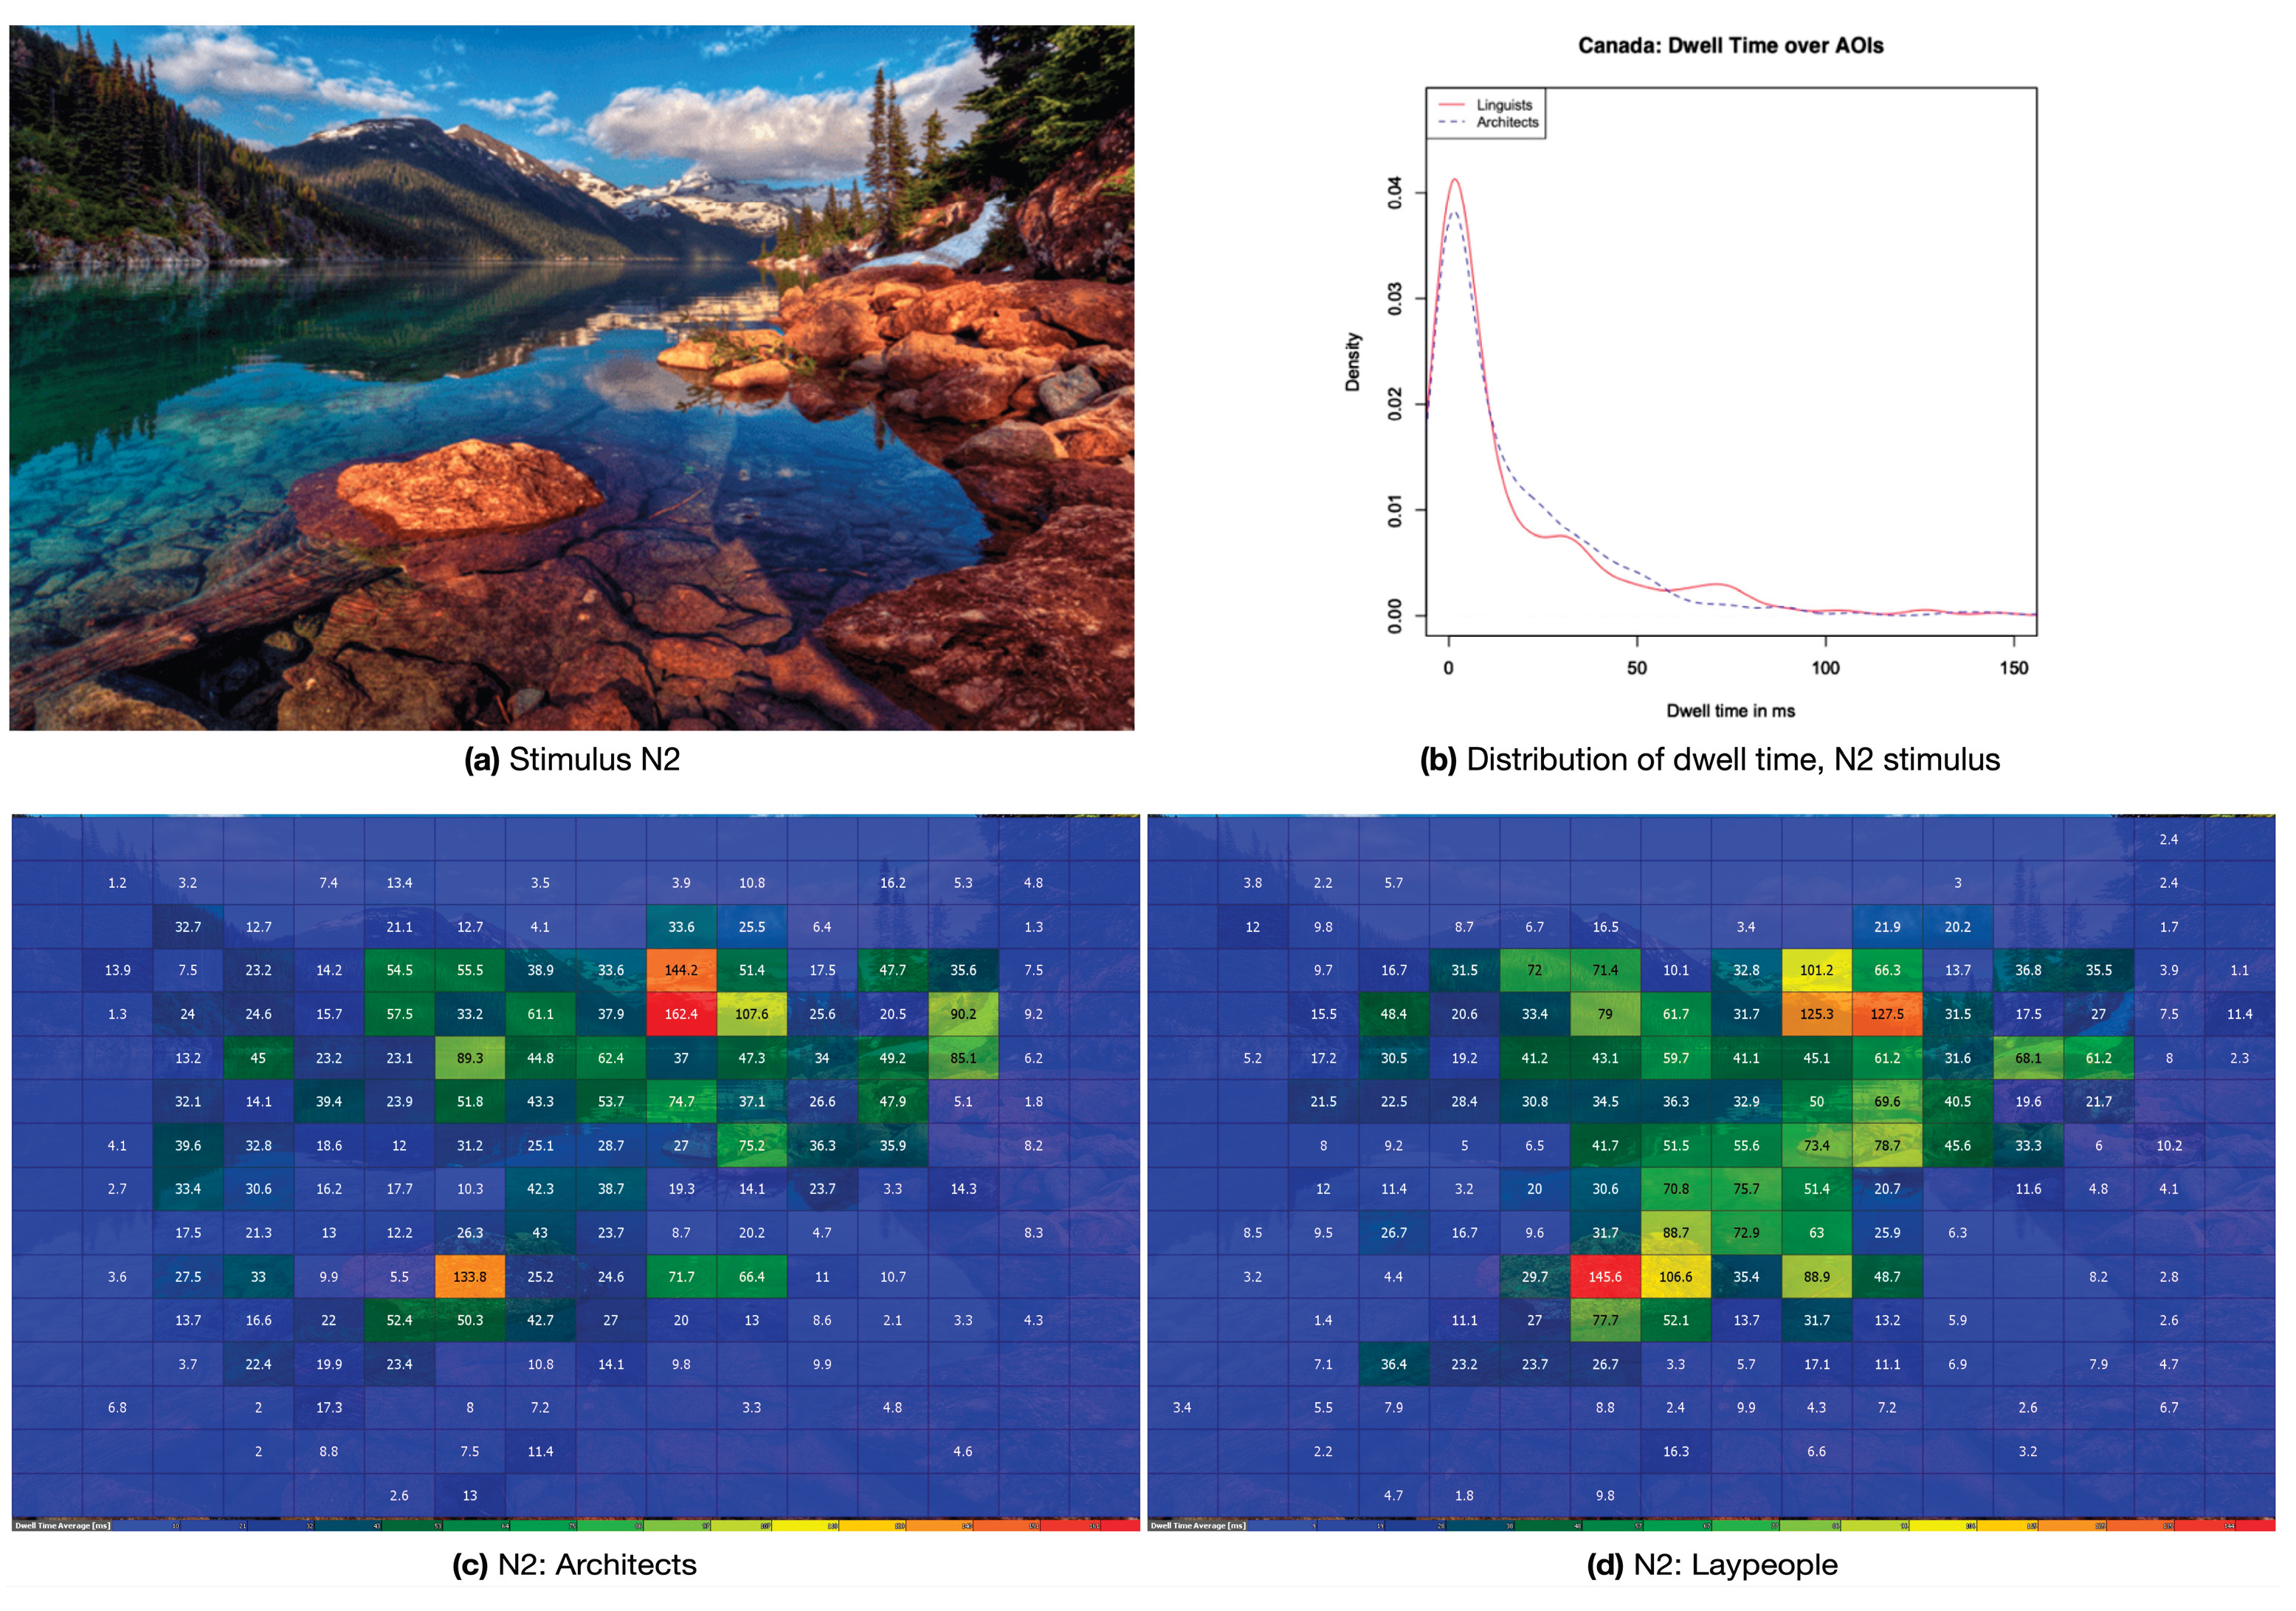

Table 1.
Measures added across all stimuli.
| Measure | Architects | Laypeople |
|---|---|---|
| Entropy | 7.016 | 6.923 |
| Relative Entropy | 87.71% | 86.54% |
| Mean | 816.6 ms | 817.0 ms |
| Standard Deviation | 2100 ms | 2161 ms |
| Median | 192.0 ms | 163.9 ms |
| Skewness | 13.73 | 11.40 |
| Kurtosis | 358.1 | 246.4 |
| Pearson Correlation | 0.896 | |
Table 2.
Diagnostic measures for all stimuli from the category “built environment”.
| Measure | Architects | Laypeople |
| Shannon’s Entropy | 5.796 | 5.581 |
| Relative Entropy | 57.97% | 55.18% |
| Mean | 17.08 ms | 17.15 ms |
| Standard Deviation | 34.38 ms | 44.34 ms |
| Median | 4.1 ms | 3.2 ms |
| Skewness | 4.732 | 5.961 |
| Kurtosis | 33.68 | 48.35 |
| Pearson Correlation | 0.830 | |
Table 3.
Diagnostic measures for the exemplary stimuli B1, M2 and N1 in comparison.
| B1: St. Louis | M2: Scotland | N1: Canada | ||||
|---|---|---|---|---|---|---|
| Measure | Architects | Laypeople | Architects | Laypeople | Architects | Laypeople |
| Shannon’s Entropy | 4.420 | 4.090 | 3.831 | 3.901 | 4.667 | 4.595 |
| Relative Entropy | 55.25% | 51.11% | 47.89% | 48.76% | 58.34% | 57.44% |
| Mean | 17.00 ms | 17.11 ms | 17.72 ms | 17.56 ms | 16.40 ms | 16.76 ms |
| Standard Deviation | 30.54 ms | 42.62 ms | 56.39 ms | 56.80 ms | 24.51 ms | 25.83 ms |
| Median | 2.65 ms | 2.2 ms | 0.0 ms | 0.7 ms | 6.6 ms | 4.75 ms |
| Skewness | 2.88 | 4.47 | 7.08 | 8.45 | 2.62 | 2.13 |
| Kurtosis | 10.99 | 23.20 | 63.15 | 90.34 | 9.35 | 4.91 |
| Pearson Correlation | 0.770 | 0.945 | 0.819 | |||
Disclaimer/Publisher’s Note: The statements, opinions and data contained in all publications are solely those of the individual author(s) and contributor(s) and not of MDPI and/or the editor(s). MDPI and/or the editor(s) disclaim responsibility for any injury to people or property resulting from any ideas, methods, instructions or products referred to in the content. |
© 2025 by the authors. Licensee MDPI, Basel, Switzerland. This article is an open access article distributed under the terms and conditions of the Creative Commons Attribution (CC BY) license (http://creativecommons.org/licenses/by/4.0/).
Copyright: This open access article is published under a Creative Commons CC BY 4.0 license, which permit the free download, distribution, and reuse, provided that the author and preprint are cited in any reuse.


