
Submitted:
28 May 2025
Posted:
28 May 2025
You are already at the latest version
Abstract
Olive mill wastewater (OMW) is an effluent of olive oil production industry that can be a potential source of natural bioactive phenolic polymers. Among others, natural phenolic polymers have agriculture, environmental, food research and human health applications. In this work, column chromatography technique was used for the isolation of a new complex phenolic polymer (named OMW-2000XAD) conjugated with polysaccharides and proteins from OMW by fractionation on Amberlite® XAD16 polymeric adsorbent resin. The procedure developed in this study to isolate OMW-2000XAD is simple and it has proven to be reproducible using OMW from different origins. OMW-2000XAD was further characterized by elemental composition analysis, glycosidic and amino acid composition, acid and basic hydrolysis, mass spectrometry and spectroscopic techniques. The molecular size of the polymer determined by gel filtration chromatography is in the range between 1500-2000 kDa significantly above another phenolic polymers and high-molecular weight complex fractions recovered from OMW or other wastes generated by agro-food industries. OMW-2000XAD is composed mainly of phenolic compounds linked polysaccharides (16.1%) and proteins (10.3%). However, due to its extraordinary complexity and highly heterogeneous composition it was not possible to identify all present compounds either to elucidate a definitive structure. Finally, OMW-2000XAD exhibited antioxidant capacity scavenging of radicals (ABTS•+, DPPH• and peroxyl radicals), but not antiproliferative effects, which raise interest in further research.
Keywords:
antioxidant capacity
; ATR-FTIR analysis
; column chromatography
; complex phenols
; gel filtration
; natural phenolic polymers
; olive mill wastewater
; structural characterization
1. Introduction
In Spain, olive oil production using the two-phase decanter system is implemented in almost all olive oil-mills. However, in other Mediterranean countries (Italy, Greece, Tunisia, Turkey, Morocco, Portugal, and Syria), this technology is still not widely used yet. Thus, it is estimated that between 10-30 million m3 of olive mill wastewater (OMW) are produced annually worldwide [1]. Furthermore, it is very likely that in the future Spanish olive pomace oil extraction plants will return to a three-phase system for processing olive pomace (alperujo), generating more OMW. Some of the major plants already do, because this results in a lower moisture content of the olive pomace.
The physicochemical composition of OMW basically consists of around 83-94% water, 4-16% organic compounds (phenols, proteins, sugars, etc.) and 0.4-2.5% inorganic salts [2]. OMW contains significant concentrations of phenolic compounds (98% of phenols present in olive fruit and 2-15% of the organic fraction). Concentrations have found to vary from about 0.5 g/L to 24 g/L [3]. More than 80 individual phenolic compounds distributed in a dozen of different chemical classes have been identified in OMW depending on factors such as the olive variety, climatic conditions or the olive oil extraction system [4,5]; but, moreover, OMW also contains polymeric phenols such as lignin, tannins, pigments identified as catechol-melanin macromolecules [6] and another high-molecular weight complex phenolic fractions which are responsible for its characteristic dark colour. OMW react easily with atmospheric oxygen. Particularly, phenolic compounds are catalytically oxidized by polyphenol oxidases and peroxidases to coloured o-quinones that further undergo non-enzymatic secondary condensation reactions with the original phenols resulting in various polymers. The large number of compounds contained in OMW and their varied structural diversity unavoidably leads to the interaction (covalent or not) with other molecules and/or macromolecules [7]. These o-quinones are highly reactive electrophiles that can also form adducts with amino acids and proteins [8], or react with sugars or polysaccharides (glycosyl derivatives). The interaction of polyphenols, proteins and polysaccharides may form very complex macromolecular structures [9] and high-molecular weight polymeric substances or brown pigments hard to characterize.
Currently, the economic value of OMW is certainly low; however, there is an increasingly close collaborating relationship between olive oil sector and the sphere of scientific research to improve management, reduce disposal costs, environmental impact and achieve more profitable valorization. It is about developing strategies [10,11], technical innovations [12] and finding solutions to the disposal problems of a pollutant by-product (BDO, 35-110 g/L; COD, up to 400 g O2/L) [3,13] and converting it into a raw material source of high added value products to create a change in the negative perception of this liquid waste (from waste to resource).
Among the possible alternatives, the obtaining of complex phenolic polymers is a potential valorization option for OMW in view of the fact their various and interesting applications. Natural phenolic polymers (NPPs) obtained from agro-food wastes and byproducts can be utilized for remediation and treatment of waters contaminated and/or wastewater, because characterized by excellent sorption capacity of drugs, inorganic anions, organic dyes [14]. In line with this, OMW phenolic polymers show to be efficient sorbents of heavy metals, herbicides, and polycyclic aromatic hydrocarbons [15,16]. Several naturally occurring phenolic polymers have been explored and/or tested in active packaging and film stabilization for food applications [17]. For example, lignin and tannins have been demonstrated to be effective at improving mechanical properties (viscoelasticity, tensility) and providing barrier and protective functions (oxygen permeability, UV resistance, thermal stability, antimicrobial, antioxidant, etc.) when incorporated into biodegradable plastics (PHB, PLA and alginate), starch-based films, and polyethylene or polypropylene. NPPs - and also aggregated or conjugated with polysaccharides and proteins - have also been evaluated for medical and health applications as promoter additives of cell differentiation in tissue engineering [18], as anticoagulants [19], and as in vivo hypolipidemic agents [20].
Existing studies about complex polymers from OMW is limited to a few authors. To this must be added, that the structural characterization of these complexes and polymeric phenolic fractions is scarcely elucidated. [21] are among the first researchers to address the recovery and characterization of a polymeric organic fraction from OMW. They isolated by precipitation with cold methanol so-called “polymerin”, composed of polysaccharides, melanin, and proteins strongly conjugated to each other by a combination of supramolecular interactions. This polymerin with a relative molecular size between 2-500 kDa has proven its potential utilization in environmental technologies and industry [22] and as bio amendment in agriculture [23] since degree of similarity between it and humic acids is remarkable. Polymerin has also been detected in dry olive pomace [24]. Cardinali and co-workers [25] obtained by ultrafiltration of OMW several fractions containing unidentified phenolic polymers (600-5000 Da). The data reported indicate that these fractions be showed to be more efficient antioxidants than hydroxytytrosol. In a previous work [26], we already studied a polymeric phenolic fraction (PPF) – which was extracted with ethyl acetate from steam-treated alperujo hydrolysates - different to that recovered by Capasso and co-workers [21]; so much by its physical properties (for example, solubility), as by its quantitative composition (mostly phenolic compounds), but with a characteristic HPLC-DAD chromatographic profile very similar to those described previously for other phenolic polymers from OMW [24,27]. PPF showed an excellent sorption-desorption capacity of phenolic compounds and an activity against lipidic oxidation comparable with those of the best antioxidants such as hydroxytyrosol and vitamin E. More recently, Khemakhem and co-workers [28,29] have isolated by precipitation with ammonium sulfate and characterized by spectroscopic analyses a protein–polyphenol polymer complex (5-190 kDa) from OMW with similar characteristic to melanin and humic substances and surfactant properties.
The main aim of the work was to isolate a new large molecular size complex phenolic polymer from OMW using a simple method of column chromatography. This separation technique has not been used until now for isolating OMW valuable polymers. The selection of the methodology is essential towards an economic and sustainable valorization of OMW. The new polymer was characterized using spectroscopic analysis and its antioxidant and antiproliferative activity were evaluated.
2. Materials and Methods
OMW sample was extracted from the Picual variety olive fruits (harvested in the province of Granada, Spain) on a laboratory scale by the ABENCOR® System (MC2 Ingeniería y Sistemas, S.L., Sevilla, Spain) which reproduces faithfully the olive oil factory process. OMW was separated from the oily phase by decantation, and then stored at 4 °C until the start of the experiment.
2.1. Isolation and Purification of OMW Complex Phenolic Polymer
The OMW fractionation was performed using AMBERLITE® XAD16 resin (Rohm and Hass, Philadelphia, PA, USA). AMBERLITE® XAD16 is useful for adsorption of organic substances from aqueous system and to separate specifically large organic molecules. The resin was packed into a 4 cm diameter (ID) glass chromatography column x 60 cm bed height. Prior to fractionation, OMW sample was filtered, concentrated 3-fold (from 3.6 L to a final volume of 1.2 L) and defatted with hexane. A-600 mL aliquot of the concentrated OMW was transferred onto the column. After all the OMW aliquot entered the column, eighteen fractions of 250 mL each other were collected by elution with distilled water at a flow rate of 15 mL/min. Thus, the column was washed to remove all individual or unbound compounds. Next, the complex phenolic polymer was then obtained by eluting three 250-mililiter fractions more with 96% ethanol; numbered as 19, 20 and 21. The complex eluted in the latter one. We named the complex polymer OMW-2000XAD. Finally, the OMW-2000XAD fraction (250 mL) was dialyzed for removal of impurities and lower-molecular-weight solutes using a 12,000 molecular weight cut-off cellulose membrane dialysis tubing (D-9402, Sigma Chemical Co., St. Louis, MO, USA). Dialysis tubing was transferred to a 2-liter beaker containing double-distilled water. After 24 h incubation with continuous gentle agitation the solution was replaced by fresh double-distilled water. This step was repeated several times until the membrane-external solution appears uncoloured (a total volume of water of 5 L was required). The OMW-2000XAD dialyzed fraction (no permeated) was then lyophilized, obtaining 4.2 g of dry residue. The same results were achieved when fractionated the other 600 mL aliquot and also, when reproduced the experiment starting from a different OMW sample obtained variety Picual olives picked an experimental olive orchard property of Instituto de la Grasa (CSIC, Seville - Spain) and in different state of ripeness.
2.2. HPLC-DAD Chromatographic Analysis
OMW-2000XAD fraction (20 μL) was analysed by HPLC using a HP Series 1100 liquid chromatograph (Hewlett Packard, Palo Alto, CA, USA) combined with DAD monitoring. A Kinetex EVO C18 LC column (5 μm, 100 Å, 250 x 4.6 mm) (Phenomenex, Torrance, CA, USA) was utilized for the separation at 25 °C and a flow rate of 1 mL/min. The composition of mobile phases was as follows: mobile phase A consisted of 0.01% trifluoroacetic acid in Milli-Q water and mobile phase B consisted of 100% acetonitrile. Detection was performed at 280 nm.
2.3. Multi-Elemental Composition and Protein Content
For the analysis of carbon and nitrogen a LECO CHN828 Series analyser instrument (LECO Corporation, St. Joseph, Michigan, USA) was used. This equipment uses a combustion technique with a vertical quartz furnace to determine carbon and nitrogen. OMW-2000XAD was automatically weighed into a tin capsule and loaded into the analyser. The sample first entering a sealed purge chamber to remove atmospheric gas. After purging, OMW-2000XAD was transferred to the furnace, where it was combusted in an oxygen-rich environment for rapid oxidation. Gases from the furnace were analysed for carbon (CO2) and nitrogen (N2). The protein content was then calculated as % nitrogen using a conversion factor of 6.25, which is a common practice to estimate protein content. Amino acid composition analysis was carried out according to the procedure described by Rodríguez-Martín and co-workers [30].
For the multielement analysis, 50 mg of OMW-2000XAD, accurately weighed, were subjected to a microwave-assisted acid digestion according to the EPA method 3051A. A MARS 1™ microwave digestion system (CEM Corporation, Matthews, NC, USA) was used. The digested samples in duplicate were then filtered through 0.22 μm and conveniently diluted with aqua regia prior to analysis by inductively coupled plasma mass spectrometry (ICP-MS) on an Agilent 7800 Quadrupole ICP-MS (Agilent, Santa Clara, CA, USA) working on He gas mode. Calibration solutions covering the range from 0 to 500 µg/L were prepared from ICP-MS grade multi-element standards in 1% HNO3. The operating conditions of ICP-MS were as follows: plasma gas flow (Ar), 15 L/min, and temperature, 8000 K; RF power, 1.6 kW; pump rate, 13 rpm; replicates, 5; scan per replicate, 10 and spray chamber temperature, 2 °C.
2.4. Estimation of Total Phenolic Content (TPC)
The Folin-Ciocalteu method [31] was used for the analysis of total phenols, but with some modifications. 100 μL of conveniently diluted OMW-2000XAD (0.625 g/L) in 50% (v/v) methanol-water, gallic acid (0-5 μg) as standard, and 50% (v/v) methanol-water blanks were added to triplicate 5-mL test tubes. Next, 200 μL 0.2 M Folin-Ciocalteu reagent and 800 μL of 0.7 M sodium carbonate were added into each test tube, vortex thoroughly, and incubated at room temperature for 10 min. Finally, 200 μL from each assay tube were transferred to a 96-well microplate and the absorbance was read at 655 nm using an iMark™ microplate absorbance reader (Bio-Rad Laboratories, Inc., Hercules, CA, USA). Results were expressed as means (µmol Gallic acid equivalents/g OMW-2000XAD) ± the standard deviation.
2.5. Determination of Sugars by Gas Chromatography (Alditol Acetates)
10 mg of OMW-2000XAD containing approx. 300 μg of sugars (determined by anthrone method) were placed into a glass tube in triplicate. 0.5 mL of 2 N trifluoroacetic acid (TFA) and 50 μg of inositol as internal standard were added. The tubes were incubated using a heating block for 1 h at 121 °C. After this, hydrolysates were evaporated to dryness in a stream of air and washed three times with 1 mL of MeOH. Next, 400 μL of 2 N NH4OH containing 10 mg/mL NaBH4 were added for reducing monosaccharides to alditols and incubating at 40 °C for 1 h. Later glacial acetic acid was dropped to each tube to remove the excess of NaBH4. After that the tubes were washed three times with glacial acetic acid-methanol (1:9, v/v) and then with methanol. The reaction mixture was acetylated adding 120 μL of methylimidazole and 600 μL of acetic anhydride and incubating for 10 min at room temperature. At last, 5 mL distilled water were added to each tube to destroy the excess of acetic anhydride and then 2 mL dichloromethane to extract the alditol acetates. The separation and quantification of the alditol acetates were performed using a gas chromatograph (Hewlett Packard 6890 Series) fitted with a FI detector and a SP®-2330 capillary column (L x I.D. 30 m × 0.25 mm, df 0.20 μm) (Merck KGaA, Darmstadt, Germany). The chromatographic conditions were those described previously by Jaramillo-Carmona and co-workers [32].
2.6. Estimation of Molecular Size by Gel Permeation Chromatography (GPC)
Molecular size estimation of OMW-2000XAD complex polymer was accomplished by using TSKgel G3000PWXL and GMPWXL (both 7.8 mm ID x 30 cm) columns (Tosoh Bioscience LLC, Tokyo, Japan) operating in series at a flow rate of 0.8 mL/min. Void volume and total volume were measured by solutions of Blue Dextran 2000 (2000 kDa) (GE HealthCare, Chicago, IL, USA) and glucose (180 Da), respectively. Dextrans from Leuconostoc spp. with average molecular weight of 500 kDa, 110 kDa, 70 kDa, 40 kDa and 6 kDa (Fluka Chemie AG, Buchs, Switzerland) were used as analytical standards to calibrate the molecular weight of OMW-2000XAD. Refractive index detection was used in this analysis.
2.7. Attenuated Total Reflectance (ATR)-Fourier Transform Infrared (FTIR) Spectroscopy
FTIR spectrum was recorded using a INVENIO X spectrometer (Bruker Optics GmbH & Co. KG, Ettlingen, Germany) fitted with a mid-infrared (MIR) source, a KBr beam splitter and DLaTGS pyroelectric detector. 1 mg of lyophilized OMW-2000XAD was directly placed on the diamond ATR crystal surface. Spectrum was recorded in the range of 4000-400 cm-1 and averaged over 32 scans (scan speed of 20 kHz) at a resolution of 4 cm-1. Such analysis was performed by the Research, Technology and Innovation Centre (CITIUS) in the University of Seville (Spain).
2.8. NMR Spectroscopic Analysis
Analyses were performed with a Bruker Avance III 500 MHz NMR spectrometer. It is equipped with a 5 mm 1H/13C /15N inverse detection probe with Z gradient and lock 2H. 1H and 13C chemical shifts were referenced to DSS (δ = 0 ppm). Longer experiments such as 13C{1H} and 2D HSQC spectra was obtained after 5 days of acquisition. NMR spectra were processed with TopSpin® software (version 3.2.0).
2.9. Acid and Basic Hydrolysis and Analysis of Products by Mass Spectrometry
In order to investigate the composition and structure of OMW-2000XAD, acid and alkali-catalysed degradations with 6 M HCl (at 110 °C for 24 h) and 4 M NaOH (at 120 °C for 4 h) were carried out, respectively, in an atmosphere of nitrogen. Then, hydrolysates produced were neutralized and extracted with ethyl acetate. Analyses of the hydrolysates (both neutralized and not neutralized) and ethyl acetate extracts resulting were performed using mass spectrometry for characterizing the nature of the constitutive compounds that are found in OMW-2000XAD complex.
The hydrolysates were separated in a DIONEX UltiMate 3000 RS UHPLC+ focused (Thermo Scientific, Waltham, MA, USA), equipped with a quaternary pump, autosampler and a photodiode array detection (DAD) system. Chromatographic separation was performed on a mediterranea™ sea18 column (200 x 4.6 mm I.D., 3 µm particle size) (Teknokroma, Barcelona, Spain) at 30 °C. An online pre-column Ultraguard™ sea18 was added to protect the column. The mobile phases consisted of 0.1% (v/v) formic acid in water (A) and acetonitrile (B). The proportion of B was increased from 5% to 25% in 30 min, to 50% in 15 min, to 100% in 2 min and to 25% for 3 min. Initial conditions were reached in 2 min and the equilibrium time was 3 min. The injection volume was 20 µL and the flow rate was 1 mL/min. DAD system was set to scan from 190 to 400 nm, and 280 and 340 nm were used as the detection wavelength for the compounds. A split post-column of 0.4 mL/min was introduced directly on the mass spectrometer for detection. Mass spectrometry was performed on a micrOTOF-Q IITM Ultra-High Resolution Qq-Time-of-Flight mass spectrometer (Bruker Daltonics, Bremen, Germany) equipped with an electrospray ionization (ESI) source operating in negative ion mode. The ESI source conditions were as follows: drying gas flow rate 8 L/min; drying gas temperature, 200 °C; nebulizer pressure, 1.2 bar; capillary voltage, 3.5 kV. Mass spectra were acquired in full scan mode using a scan range of m/z 50-1500 Da. Instrument control and data evaluation were performed with Bruker Daltonics HyStar 3.2 and Bruker Daltonics DataAnalysis 4.2., respectively.
2.10. Antioxidant Capacity Assays (DPPH, FRAP, ORAC and TEAC)
The 2,2-diphenyl-1-picrylhydrazyl radical scavenging capacity (DPPH) assay, the ferric ion reducing antioxidant power (FRAP) assay, and Trolox equivalent antioxidant capacity (TEAC) were carried out as described by Lama-Muñoz and co-workers [33].
On the other hand, oxygen radical absorbance capacity (ORAC) assay was run by the following procedure: 25 μL of adequately diluted OMW-2000XAD sample (0.025 g/L), Trolox standard solutions (ranging from 10 to 140 μM) and 10 mM phosphate buffer (Na2HPO4·12 H2O/NaH2PO4·H2O), as blank, were added in triplicate to 96-well microplates. To all wells, 150 μL of 1 μM fluorescein freshly prepared solution were added. A Fluoroskan Ascent® (Thermo Fisher Scientific, Waltham, MA, USA) microplate fluorometer reader was used for measurements. The microplate was then allowed to equilibrate by incubating for 15 min at 37 °C. Reaction was initiated by the addition of 25 μL of 250 mM 2,2’-Azobis (2-amidinopropane) dihydrochloride (AAPH), also dissolved in phosphate buffer. Excitation was performed at 485 nm and emission was measured at 538 nm. The fluorescence of each well was then measured every 5 min for a total analysis time of 90 min. As the reaction progresses, fluorescein (FL) is consumed and its intensity decreases. In the presence of antioxidant, the FL decay is inhibited [34]. ORAC values were obtained by calculating of the area under the kinetic curve [relative fluorescence intensity (fi) vs time (i = 0, 5, 10…, 90 min)] as follows: A = (0.5 + f5/f0 + f10/f0 + … + f90/f0); and plotting it versus concentration.
All results were expressed as means (µmol Trolox equivalents/g OMW-2000XAD) ± the standard deviation.
2.11. Anti-Proliferative Activity of OMW-2000XAD
2.11.1. Caco-2 Cell Culture
Caco-2 cells were maintained at 37 °C and 5% CO2 in Dulbecco’s Modified Eagle Medium (DMEM) containing 1 g/L glucose, 0.11 g/L pyruvate, and 0.58 g/L glutamine. The medium was supplemented with 10% heat-inactivated fetal bovine serum (at 56 °C for 30 min), 1% non-essential amino acids, 100 U/mL penicillin, and 100 µg/mL streptomycin. Cells were subcultured weekly using trypsin-EDTA, and the culture medium was refreshed once between passages.
2.11.2. Caco-2 Cell Line Proliferation Assay with OMW-2000XAD
Experiments were performed using conventional incubation conditions. The culture medium was substituted with lyophilized OMW-2000XAD, previously dissolved in Hanks’ Balanced Salt solution (HBSS) at a concentration of 100 mg/mL and further diluted with medium culture as needed. Caco-2 cells were seeded in 96-well microplates at a density of 4 × 10⁴ cells per well in 50 μL of medium. Equal volumes of OMW-2000XAD solution were added to achieve final concentrations ranging from 0.08 to 10 g/L. Cells were incubated for up to 3 days and assessed them.
In a parallel set of experiments, the assay was additionally conducted on confluent Caco-2 cells which were seeded in 96-well microplates at a higher density of 14 × 104 cells per well in 100 μL of medium. These cells were allowed to proliferate for two days before being exposed to increasing concentrations of OMW-2000XAD (0.31 g/L – 10 g/L). Confluent Caco-2 cells were evaluated on days 3, 5, 9, and 11.
The neutral red assay was used to assess cell viability of Caco-2 cells in both experiments as described by Borenfreund and Puerner [35]. Cells in 96-well microplates were incubated at 37 °C with fresh culture medium containing neutral red dye (50 μg/mL). After 30 min, cells were washed with HBSS and then solubilized with 75 μL of a glacial acetic acid solution (1% v/v) in 50% (v/v) ethanol in water. Absorbance was then measured at 540 nm on a microtitre plate reader.
3. Results and Discussion
3.1. Chemical Composition Analysis
As shown in Figure 1 OMW-2000XAD presents a characteristic HPLC-UV chromatographic profile with a very broad signal peak approximately in the range 34-46 min. This profile was also observed for other complex polymeric fractions from olive mill wastes [24,26]. Likewise, UV absorption spectrum is very similar to those observed for other complex polymers isolated from OMW [28,36], including other polyphenolic-polysaccharide complexes with different plant origin [20], and it stands out for its featureless shape. The absorbance of OMW-2000XAD decreases rapidly until 260 nm and creates a slight shoulder around 230 nm. Approximately in the range between 260 nm and 290 nm the slope break of the spectrum is produced, attributable to the presence of unsaturation in aromatic structures of phenolic components, quinones or oxidation products [37], and proteins. Finally, continues decreasing softly to the end of the profile.
Once lyophilized, OMW-2000XAD is chemically very stable and non-hygroscopic. Its physical appearance and composition remain unchanged even stored at room temperature exposed to atmosphere. The solubility of OMW-2000XAD in water at 25 °C was determined by saturation until the appearance of insoluble precipitate. The solubility was 5.2 g/100 mL. It is also soluble in ethanol/methanol aqueous solutions (50%, v/v), but in a lower ratio. OMW-2000XAD is insoluble in most organic solvents (acetone, acetonitrile, chloroform, dichloromethane, ethanol, ethyl acetate, hexane, methanol, tetrahydrofuran), except to DMSO. In this aspect, OMW-2000XAD differs from a polymeric phenolic fraction previously isolated by the authors that was completely soluble in ethanol and only slightly soluble in water [26]. With regards to the polymerin [21] and OMWW-ASP [28], a comparison cannot be made because these researchers do not report water solubility data, but they only indicate “very soluble polymerin” and “a water-soluble polymer complex”, respectively.
OMW-2000XAD showed to be a complex natural substance mainly composed of phenols (89.8%) linked to polysaccharides (16.1%) and proteins (10.3%; calculated on the basis of nitrogen content, 1.64%) (Table 1). The discrepancy in the value of TPC is due to the fact that Folin-Ciocalteu reagent is unspecific and can react with other molecules, such as sugars and proteins [38], present in OMW-2000XAD, overestimating the content of phenols. The phenolic content of OMW-2000XAD differs significantly compared with those of other complex fractions isolated from OMW, which was much higher than of polymerin recovered by Capasso and co-workers [21] (13.3%) or that the polymer complex (OMWW-ASP) separated by Khemakhem and co-workers [28] (1.6%). This difference can be explained by the fact that both researchers and their colleagues used selective precipitation by cold methanol, which favours precipitation of carbohydrates (polymerin has 52.4%), and ammonium sulphate, which favours precipitation of proteins (OMWW-ASP has 31.1%), respectively, while OMW-2000XAD was separated by a column chromatography technique.
Total measured concentration of metals in OMW-2000XAD was 1.29% (w/w). However, polymerin contains 11.06%. The metal composition found in OMW-2000XAD includes, in decreasing order, K (0.73%, w/w), Ca (0.34%), and Mg (0.13%), and to a lesser extent Na, Fe and Cu have same concentration (0.03%). Other elements that occur in smaller amounts are Mn and Zn. K element reported in weight percentage is also the major metal in the polymerin.
The quantitative assay of the neutral sugars produced by hydrolysis of OMW-2000XAD revealed the presence of polysaccharides with a glucose percentage of 12.25% followed by arabinose (1.11%), rhamnose (0.91%), galactose (0.76%), mannose (0.58%), and xylose (0.49%) (Table 2). This quantitative order contrasts with Capasso and co-workers’ results, who found that the main sugar of polymerin was arabinose (20.9%). However, conversely, Nadour and co-workers [39] also have reported that glucose was the main monosaccharide in OMW, followed by the rest of sugars in the same order measured herein. This difference can be explained by the fact that the procedure used is distinct from those other authors. On the other hand, colorimetric analysis of uronic acids gave a negative indication of their presence in OMW-2000XAD.
The amino acid composition of OMW-2000XAD is also presented in Table 2. It is similar to found in the polymerin. Glutamic acid (1.27%), Aspartic acid (1.13%), Glycine (1.08), Serine (0.75%), and Alanine (0.58%) showed the higher content, which are also among the major amino acids in polymerin. However, there is an important difference between both – the content of Cysteine is 1.71%, while it is the minor amino acid of polymerin (0.1%).
3.2. Gel Filtration Chromatography
OMW-2000XAD was analysed by gel permeation chromatography, where show to have a high molecular weight and being a single substance of supramolecular character and neither simply a mixture of phenolic compounds, polysaccharides, protein, and metals because of all these components coelute at the same position, indicating that they are bound. As Figure 2 shows, the gel-filtration chromatogram of OMW-2000XAD complex has only one peak (tr = 11.84 min), which overlaps with the Blue Dextran 2000 peak (tr = 11.70 min). The approximate molecular weight of the OMW-2000XAD complex was estimated by analysing standard solutions of dextrans of known molecular weight as references and comparing their retention times with the result of OMW-2000XAD. It can be seen that the dextran-soluble polymer compounds are eluted from the column in descending order of molecular weight. The plot log Mw vs tr (R2 = 0.9987) gives the molecular weight calculated for OMW-2000XAD at 1960 kDa. This molecular weight is considerably higher than those of polymerin (2-500 kDa) described by Capasso and co-workers [21] and the melanin and humic acid-like polymer complex OMWW-ASP (5-190 kDa), and composed mainly of protein, reported by Khemakhem and co-workers [28].
3.3. FTIR Analysis of OMW-2000XAD
Figure 3 shows the mid-infrared (MIR) spectrum for the OMW-2000XAD polymer. FTIR spectroscopy is not known for being specific. Besides, OMW-2000XAD is a particularly complex substance, hence strong spectral overlapping makes it difficult to identify all its components or functional groups and to determine the chemical structure. The FTIR spectrum interpretation of OMW-2000XAD and a tentative assignment of the observed bands are based on the FTIR analyses of OMW fractions [21,28,36,40], as well as of complexes and conjugates of phenolic compounds, polysaccharides and proteins. The data suggests the presence of multiple functional groups, indicating a structurally diverse compound.
FTIR spectrum of OMW-2000XAD shows a very strong broad stretching absorption signal centred at 3349 cm-1, common in aromatic and aliphatic hydroxyl groups (ν O-H) and characteristic of polysaccharides and phenolic compounds which functional groups are found forming intermolecular and intramolecular hydrogen bonds. These extensive molecular interactions lead to a wider band shape. Primary and secondary amines stretching absorption bands (ν N-H) of amino acids in the 3300-3500 cm-1 range are generally shaper and less intense than hydroxyl bands, thus if present they are not observed. The single-bond region (4000-2500 cm-1) also includes stretching vibrations of C-H bonds. Two much less intense bands than preceding ones appears at 2923 cm-1 and 2880 cm-1, and they are indicative of aliphatic groups (-CH2 and -CH3, respectively), typical mainly from cellulose and hemicelluloses [41], as well as of a polyphenolic network [42].
The double-bond region (2000-1500 cm-1) exhibits strong absorptions that suggest the presence of highly polar bonds attributable to ν C=O stretching vibrations of carbonyl groups in ketones, aldehydes, esters, or carboxylic acids at 1708 cm-1 and 1629 cm-1 of ν C=C stretching in conjugated systems and described as characteristic in biopolymers [43]. However, these bands may also be due to the amide I band for the protein secondary structure [44] since signals of proteins are observed in the range 1550-1700 cm-1. MIR spectrum also shows an absorption at 1506 cm-1, usual of C=C-C stretching in aromatic structures of phenolics associated or linked to sugars by ester bonds [18,41], as well as C=N of secondary amides [36]. The fingerprint region (1500-500 cm-1) contains a complex absorption pattern due to overlapping peaks. It includes two moderate peaks at 1436 cm-1 and 1376 cm-1 typically related to C=O and C=C elongation vibrations, O-H, C-O, COO-, and C-H bending vibrations of methylene [28]. The bands detected at 1272 cm-1 and 1205 cm-1 can be identified as stretching vibrations ν (C-O-C) of phenolic moieties and O-H deformation of carboxyl groups. The group of strong absorptions at 1160 cm-1, 1070 cm-1 and 1039 cm-1 can be assigned to C-O stretching vibration of phenolic compounds, C-NH2 stretching of basic amino acids, as well as alcoholic groups of polysaccharides and to the inorganic fraction of OMW-2000XAD [41]. Finally, the weak triad of peaks at 856 cm-1, 815 cm-1, and 769 cm-1 correspond to out-of-plane (δ Aryl-H) bending vibrations and support again the presence of aromatic compounds and suggest the formation of C-C bond due to polymerization [45] because normally they are much stronger bands.
3.4. NMR Analysis of OMW-2000 XAD
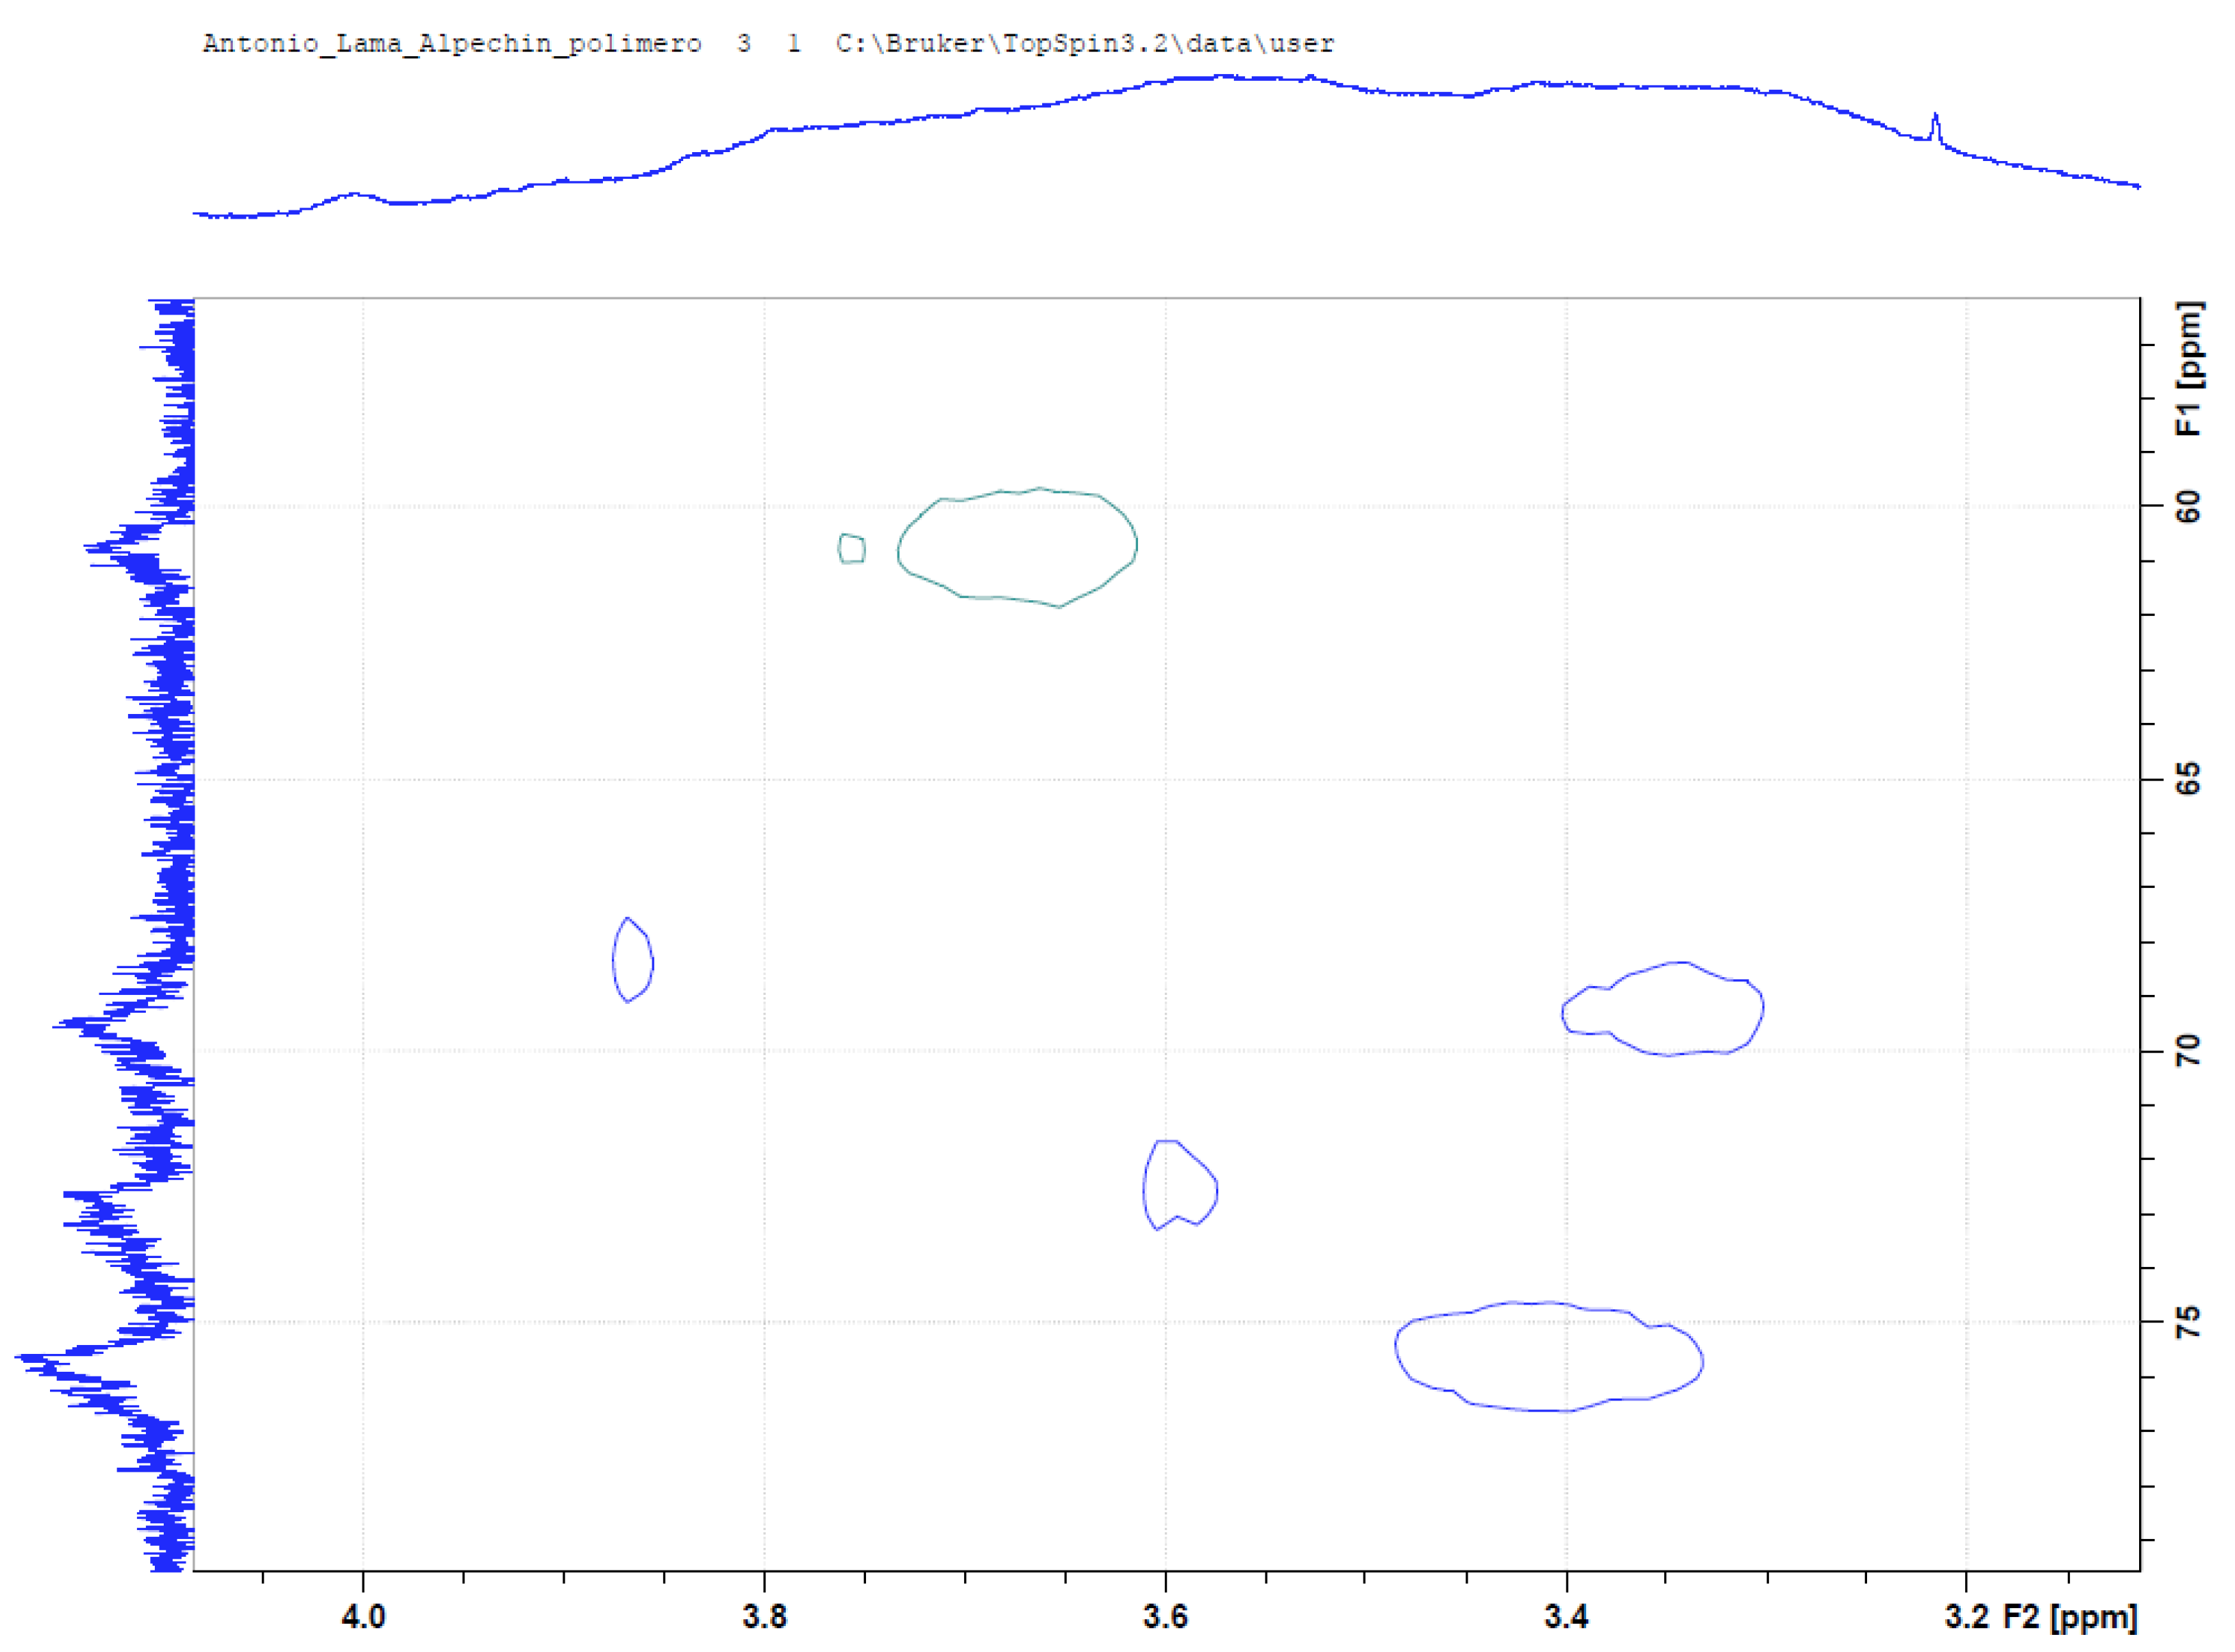
The NMR spectra provide very little information with respect to the structure of OMW-2000XAD; in the 1H-NMR spectrum the only notable signals found are between 3 and 4 ppm, very probably assignable to protons H2-6-CO of polysaccharides and groups such as -O-CH3 [46] (the high content of glucose suggests that it could be a hemicellulose-rich complex), and between 6 and 8 ppm (signals at 6.7 and 7.4 ppm) which corresponding to aromatic rings of phenolic compounds (Figure 4a) [47], but all of them very broad. This can be attributed to protein signals [28]. On the other hand, the presence of anomeric protons could be hidden by the strong water signal at around 4.5-5 ppm. In the 13C-NMR spectrum (Figure 4b), signals are mainly observed at 60-70 ppm (chemical shifts of C2-C6), which confirm the presence of HC-O of polysaccharides and is corroborated by the HSQC experiment (Figure 4c) and correlations 1H/13C observed in it (cross peaks at 3.35/69.4 ppm; 3.40/75.5 ppm; 3.59/72.5 ppm; 3.67/60.8 ppm and 3.87/68.5 ppm). However, chemical shifts for the aryl C (110-145 ppm), O-aryl C (145-165 ppm), and carboxyl C (165-190 ppm) assignment of phenolic and amide functional groups were not observed or they are very weak (130.4, 146.5 and 175.8 ppm). These results are limited by a low-resolution NMR equipment and because of OMW-2000XAD was not very soluble in water (spectra were recorded in a volume of 600 µL of water and 50 mg of OMW-2000XAD did not dissolve completely).
Figure 4a.
1H-NMR spectrum of OMW-2000XAD.
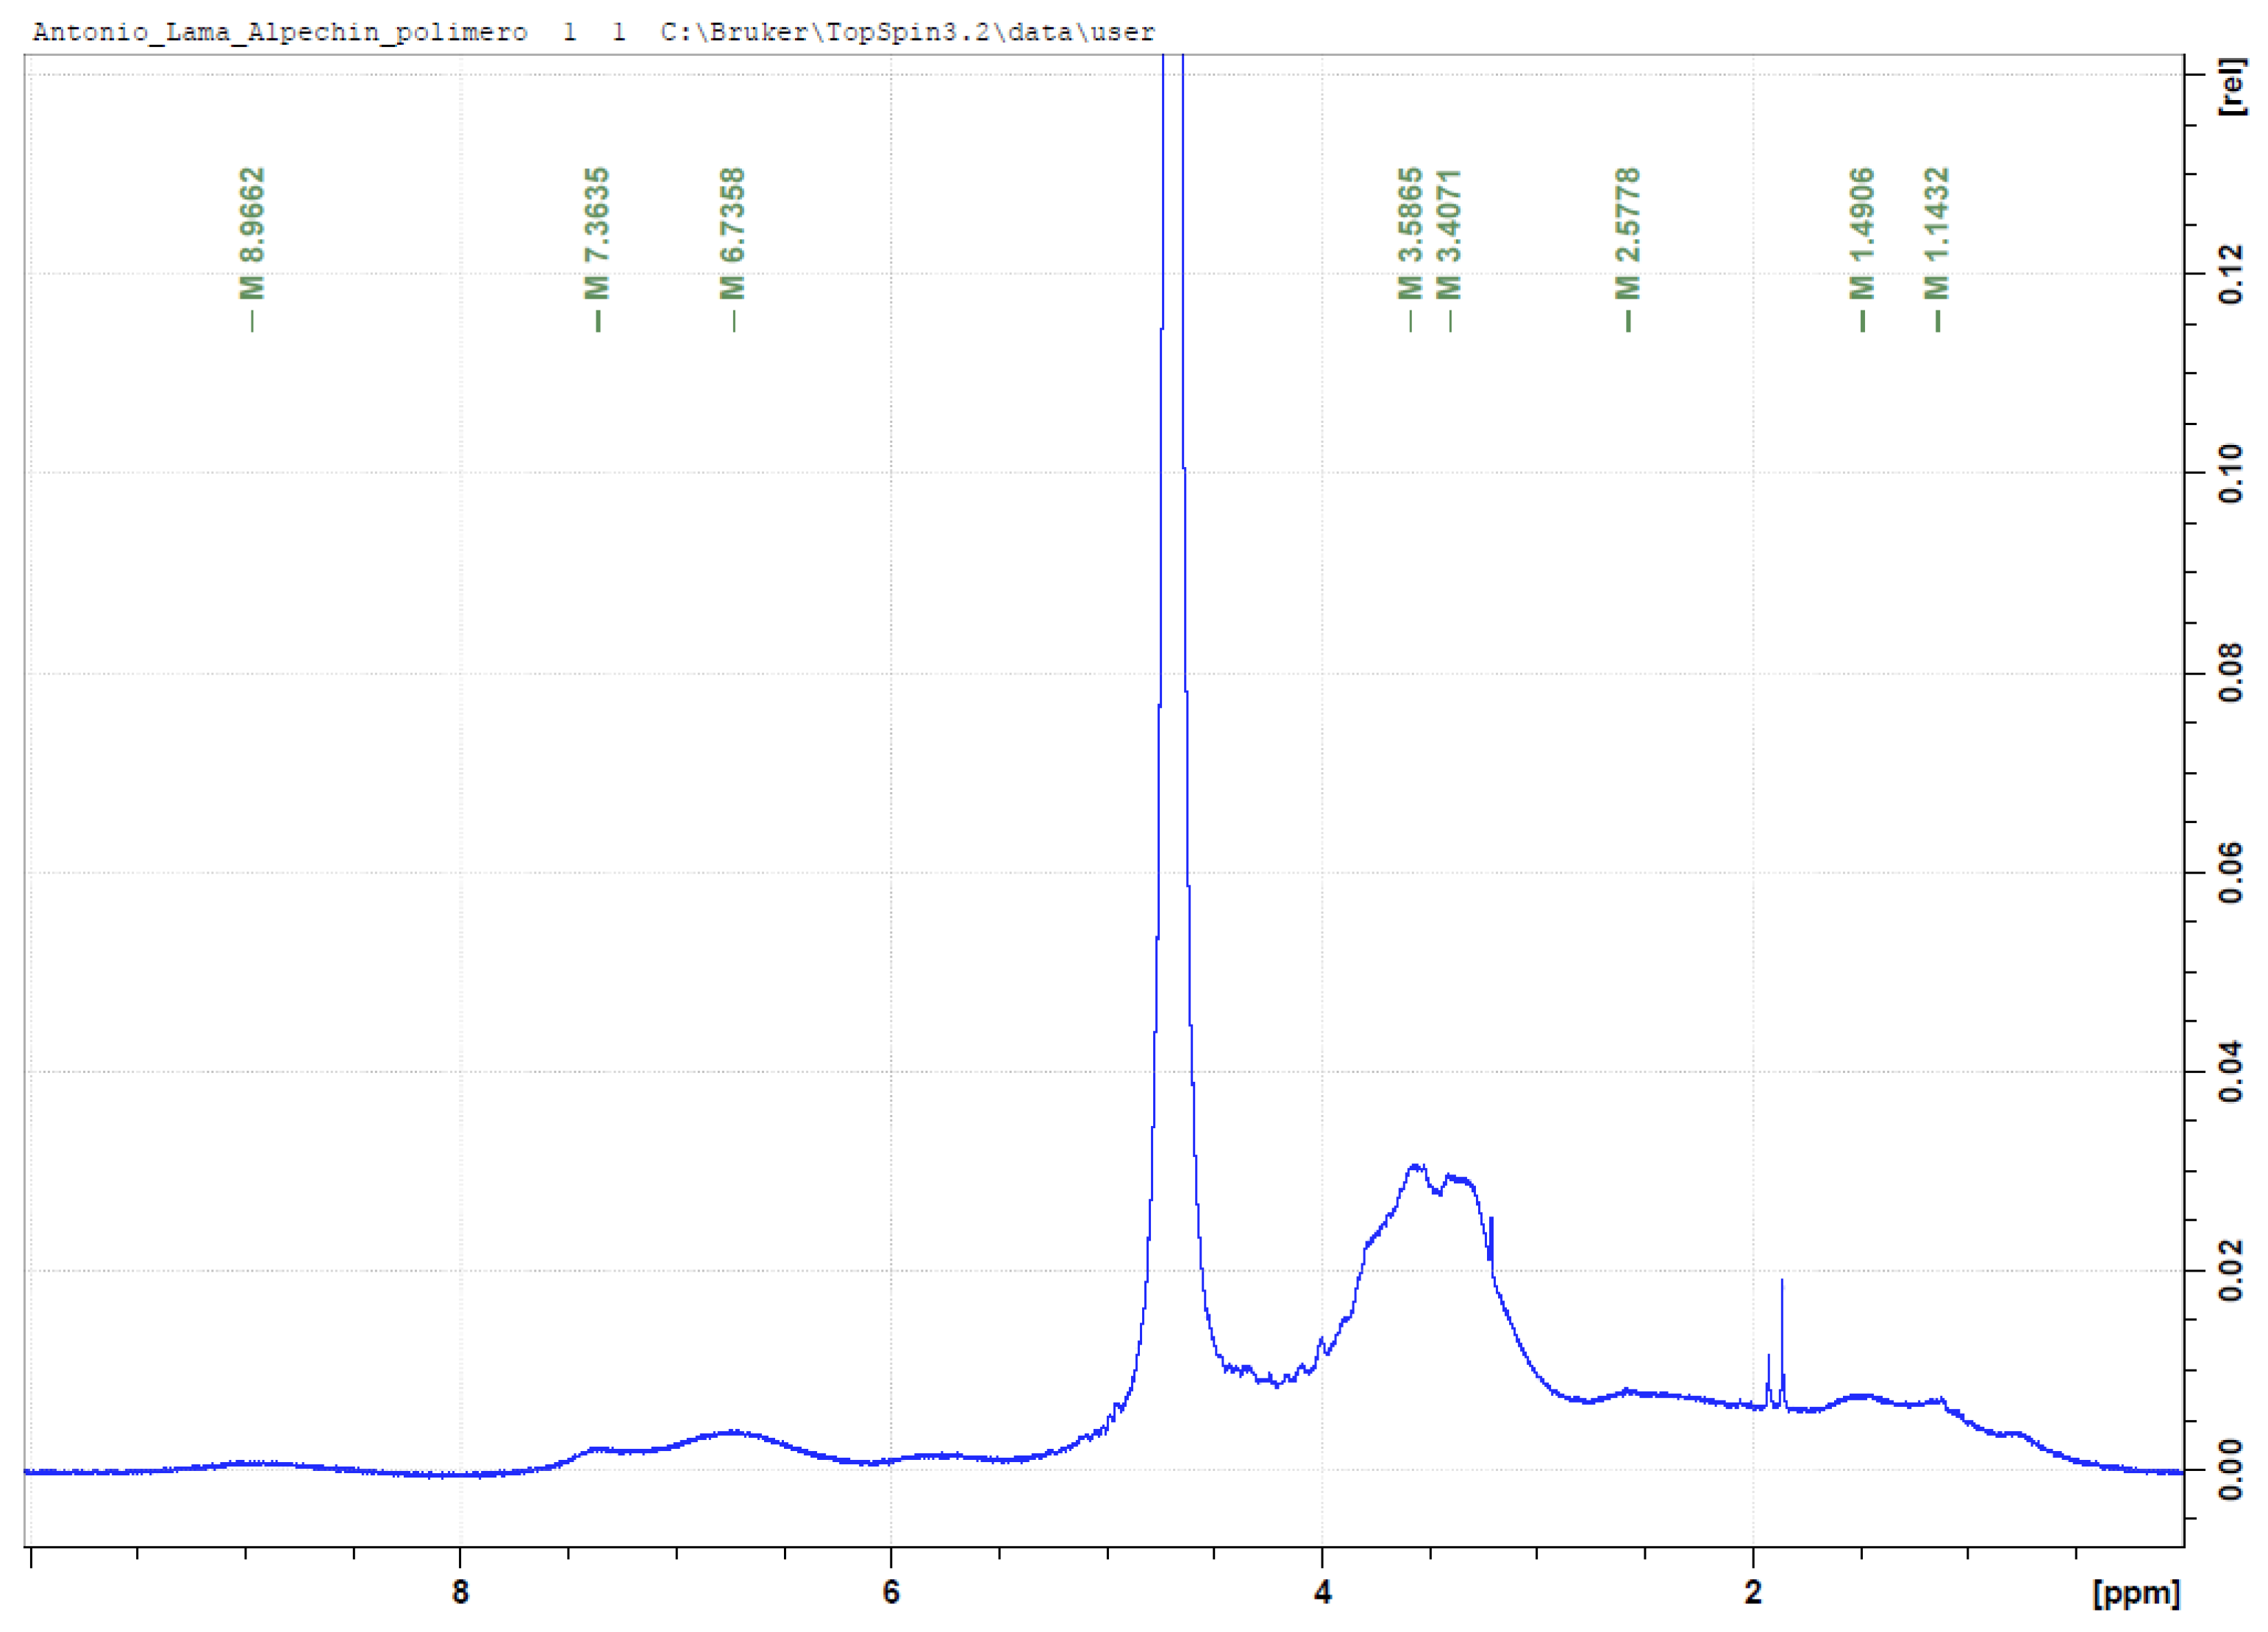
Figure 4b.
13C-NMR spectrum of OMW-2000XAD.
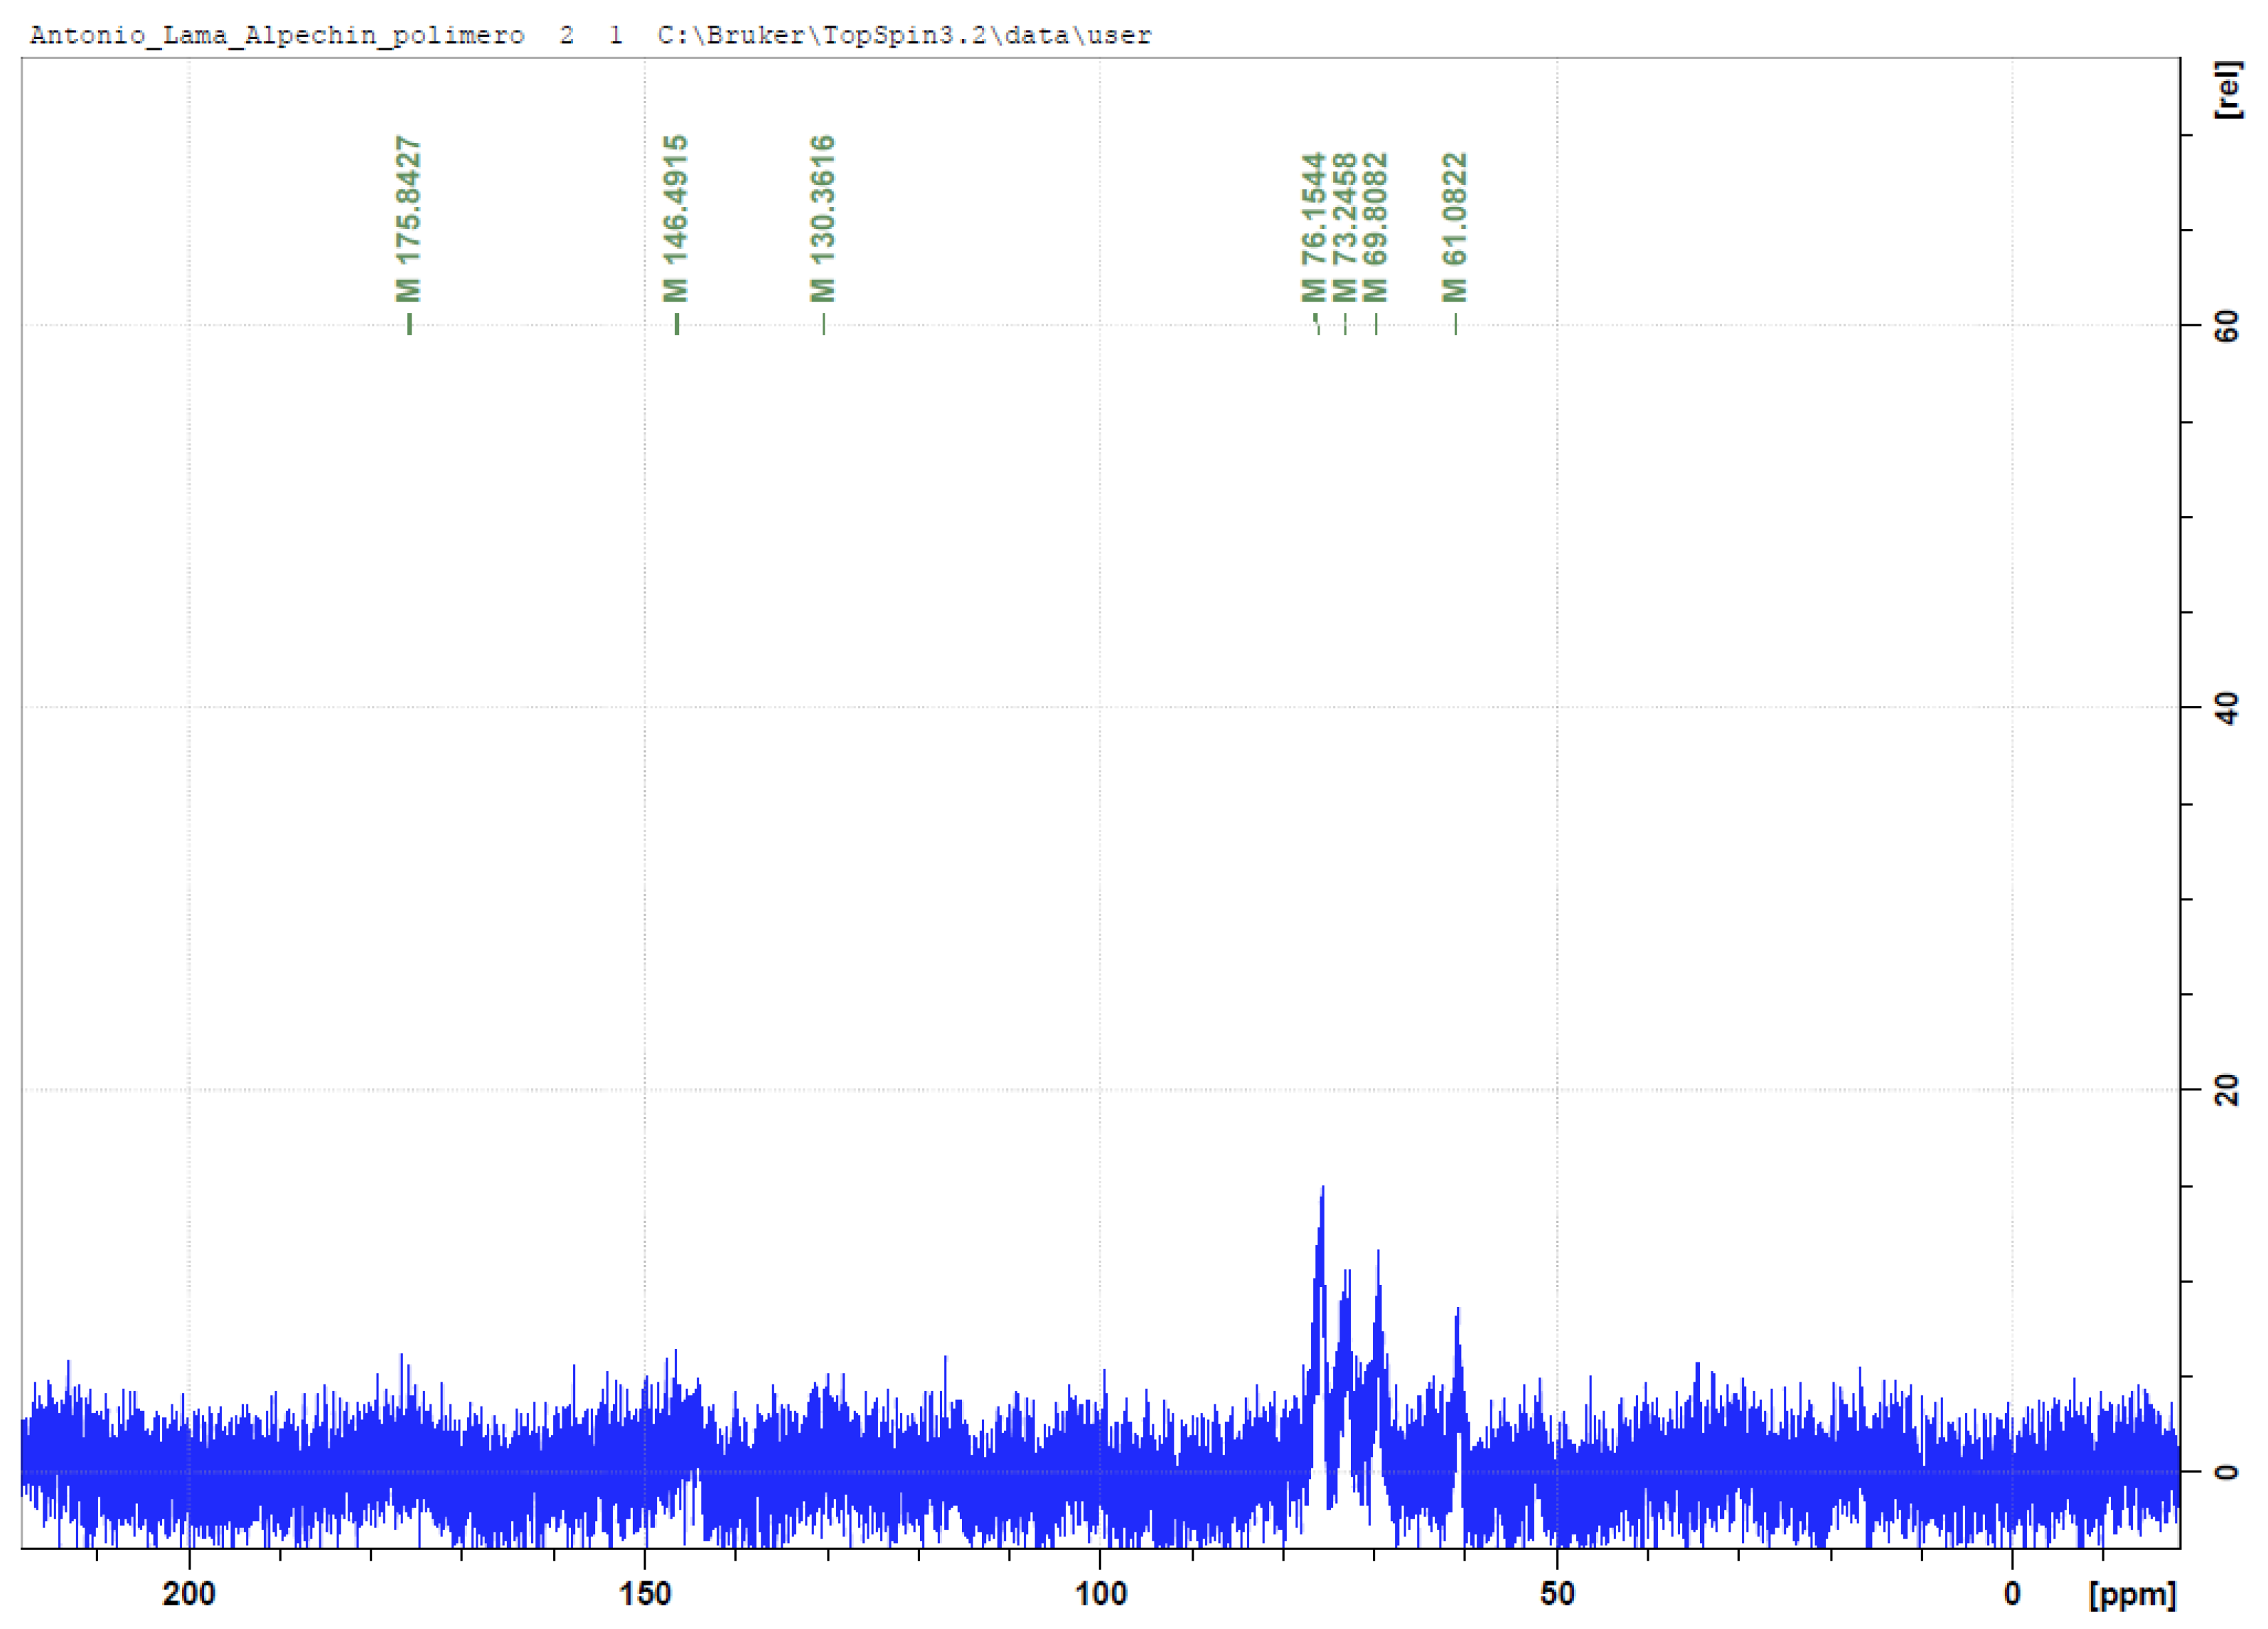
Figure 4c.
1H/13C-HSQC spectrum of OMW-2000XAD.
3.5. Mass Spectrometry for Qualitative Analysis of Compounds in OMW-2000 XAD Hydrolysates
OMW-2000XAD was subjected to acid and alkali hydrolysis. These treatments were applied to disrupt the phenolic structure and linkages between this and polysaccharides and proteins in order to identify the individual phenolic compounds by mass spectrometry. Figure 2 (GPC chromatogram) shows a clear decrease in the molecular weight of OMW-2000XAD after hydrolytic degradation. It is observed a significant shift in the retention time from 11.84 min to 18.10-20.13 min.
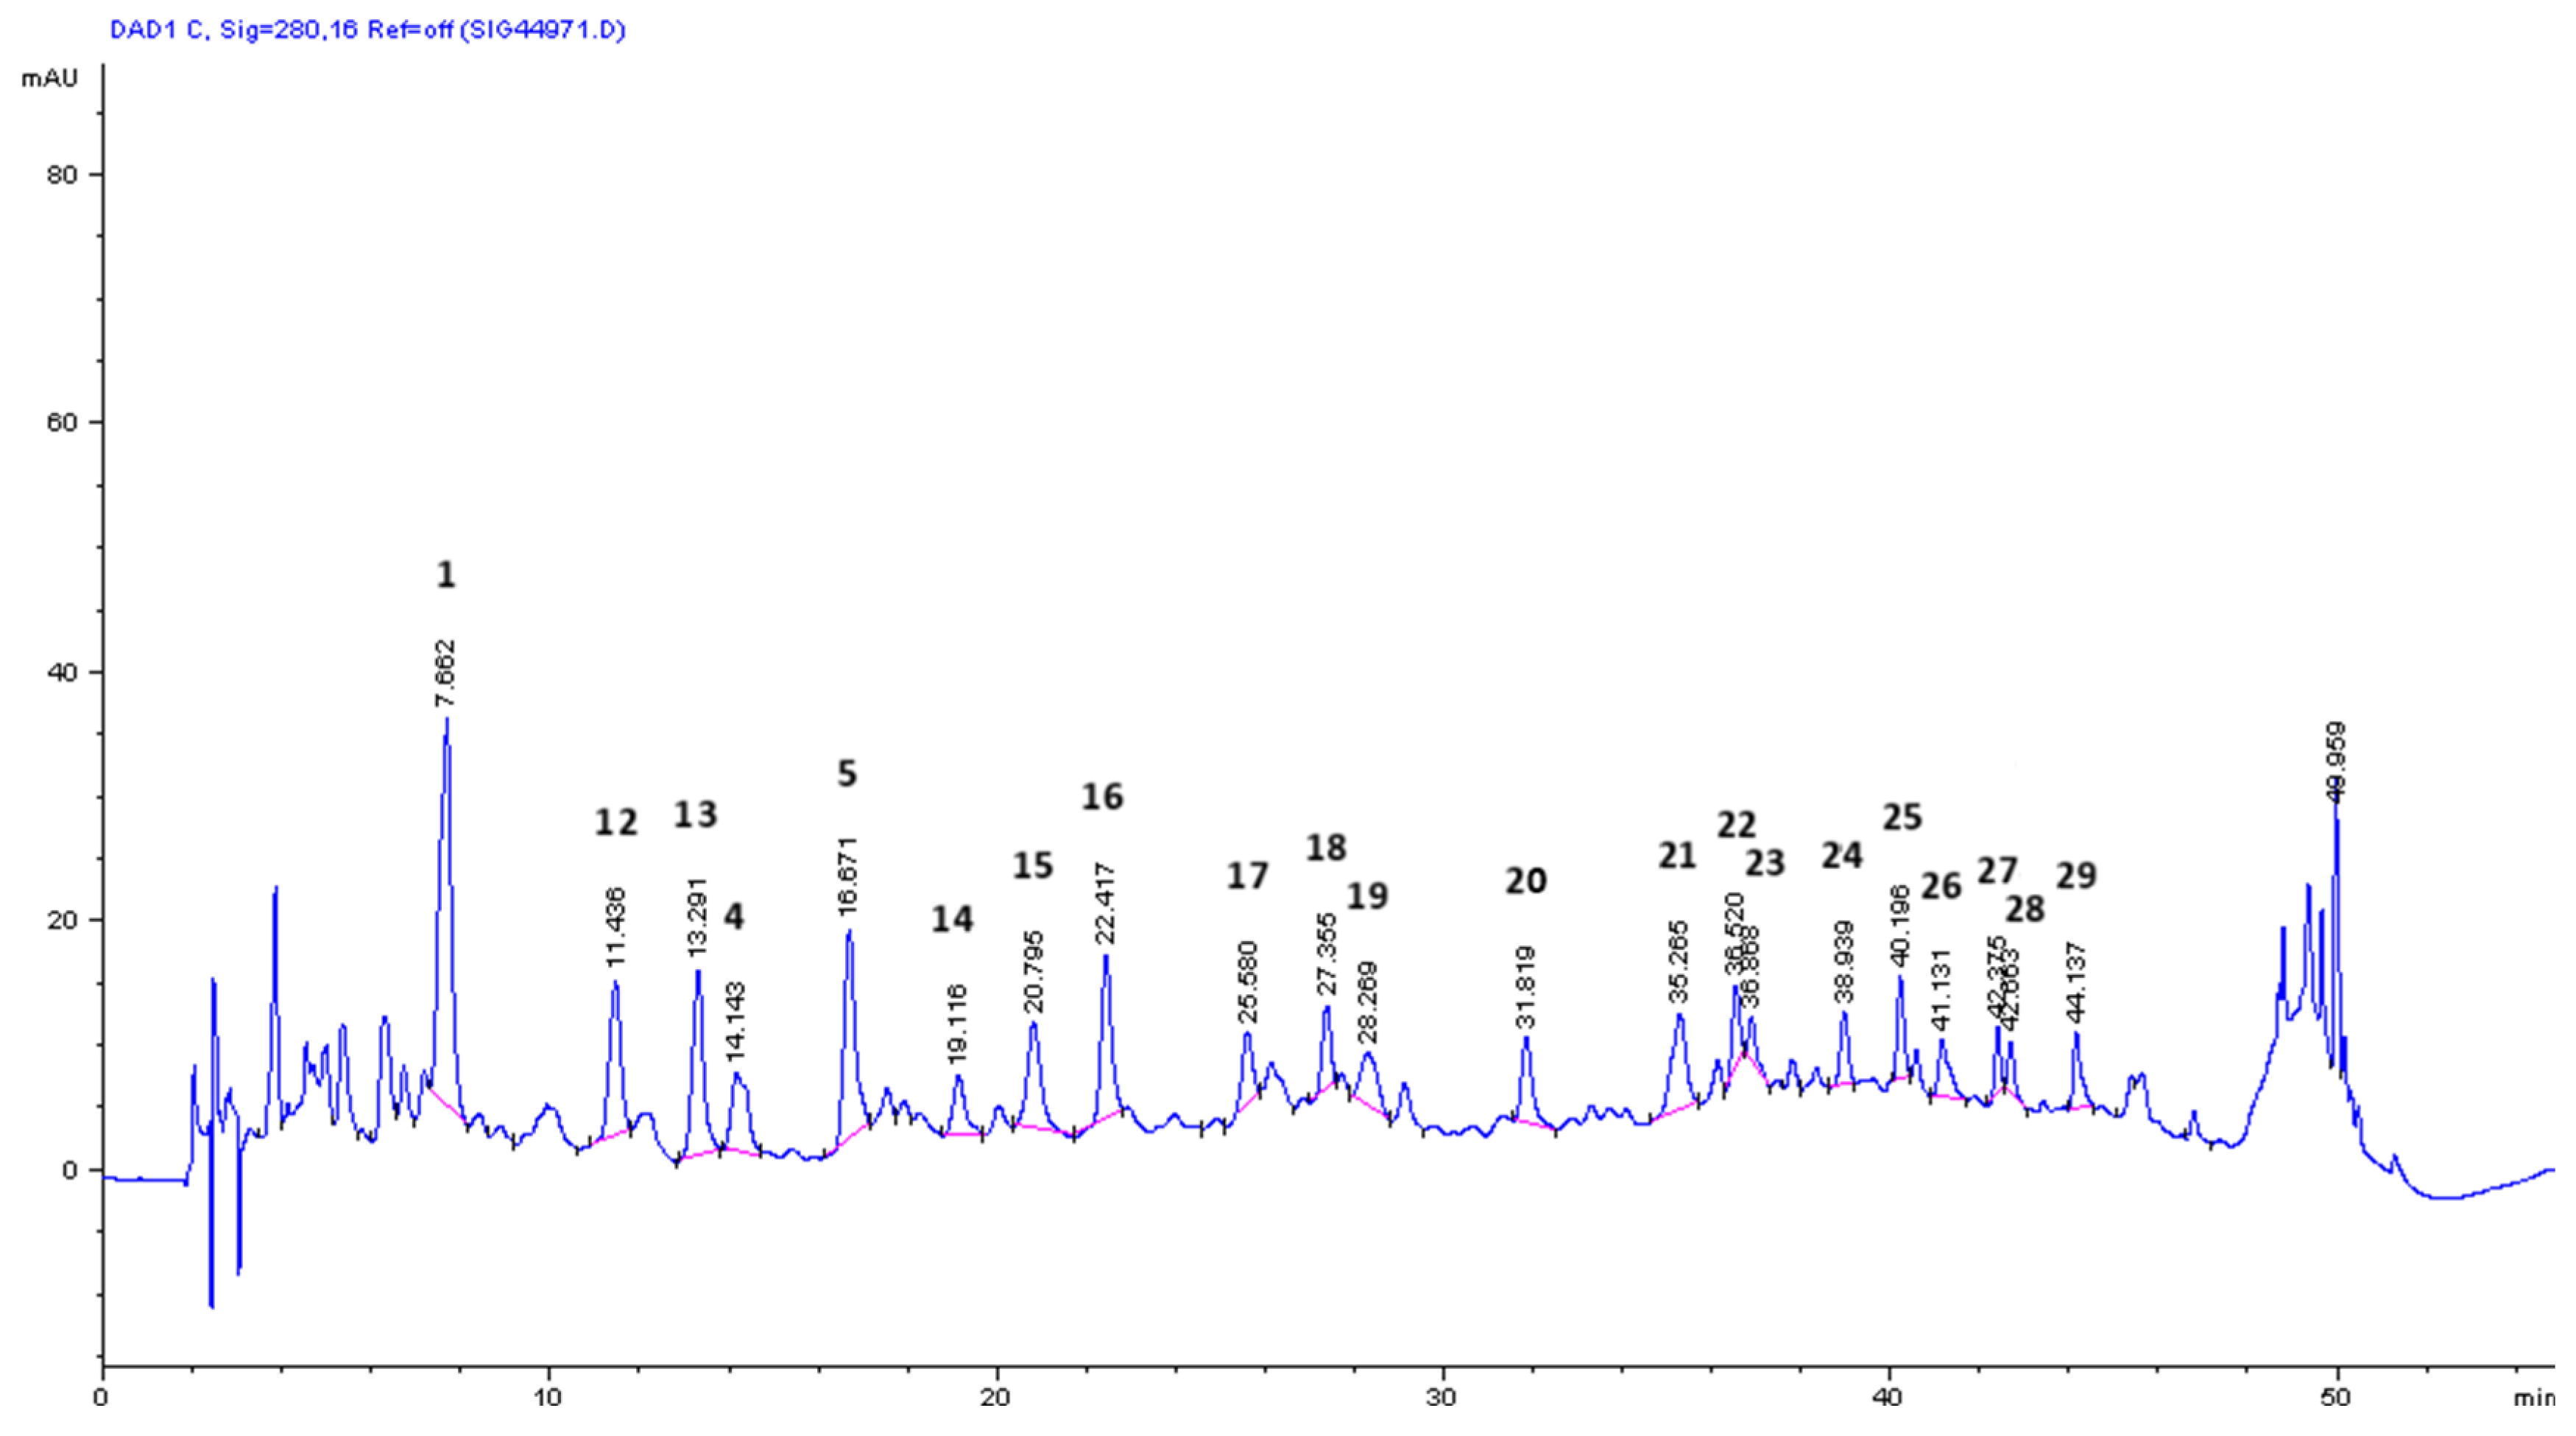
The phenolic profile of each of the hydrolysates was analysed using LC-MS (ESI-Qq-TOF). The chromatograms obtained through this analysis are shown in Figures 5a and 5b. On the other hand, the compounds tentatively identified are presented in Table 3 along with the m/z of each peak [M-H]-, as well as the resulting fragments for that respective m/z, besides other information. In Figures 5a and 5b the 29 most prominent peaks are pointed out. Although some of the usual phenols from OMW are detected, primarily tyrosol, phenolic acids (caffeic, p-coumaric, and ferulic), and some elenolic acid derivative, the remaining peaks could not be assigned to any known phenolic compound originally present in OMW or any other olive-derived product, despite an extensive literature review. In other cases, the fragments of base peak do not match those reported in the literature. The authors hypothesize that these unknown compounds arise from phenolics that have been transformed because many of the masses found can be associated with the fragmentation of other OMW known phenolic compounds. This hypothesis is based on the fact that the spectra of hydrolysates (mainly with NaOH) also show some masses and fragments what they are signs of compounds resulting from the oxidation and the polymerization of phenols such as covalent dimers, trimers or tetramers of caffeic acid (tr = 20.08 min, m/z 313.0741, 269.0867, and 179.0358 or 147.0113; (AH)2, dimers C–O type or C-C type, respectively), p-coumaric acid (tr = 34.54 min, m/z 651.1514, 325.0703, 281.0802 and 237.0911; 4AH – 4H, tetramer), dihydrocaffeic acid (tr = 35.67 min, m/z 495.1769; [2AH + A] − 2H), and hydroxytyrosol (tr = 26.11 min, m/z 455.1347, 303.0822; [2AH + A] − 2H) [48].
Figure 5a.
HPLC chromatogram at 280 nm of the hydrolysate with 4 M NaOH of OMW-2000XAD. A tentative identification of the peaks by ESI-Qq-TOF mass spectrometry can be seen in Table 3.
Figure 5a.
HPLC chromatogram at 280 nm of the hydrolysate with 4 M NaOH of OMW-2000XAD. A tentative identification of the peaks by ESI-Qq-TOF mass spectrometry can be seen in Table 3.
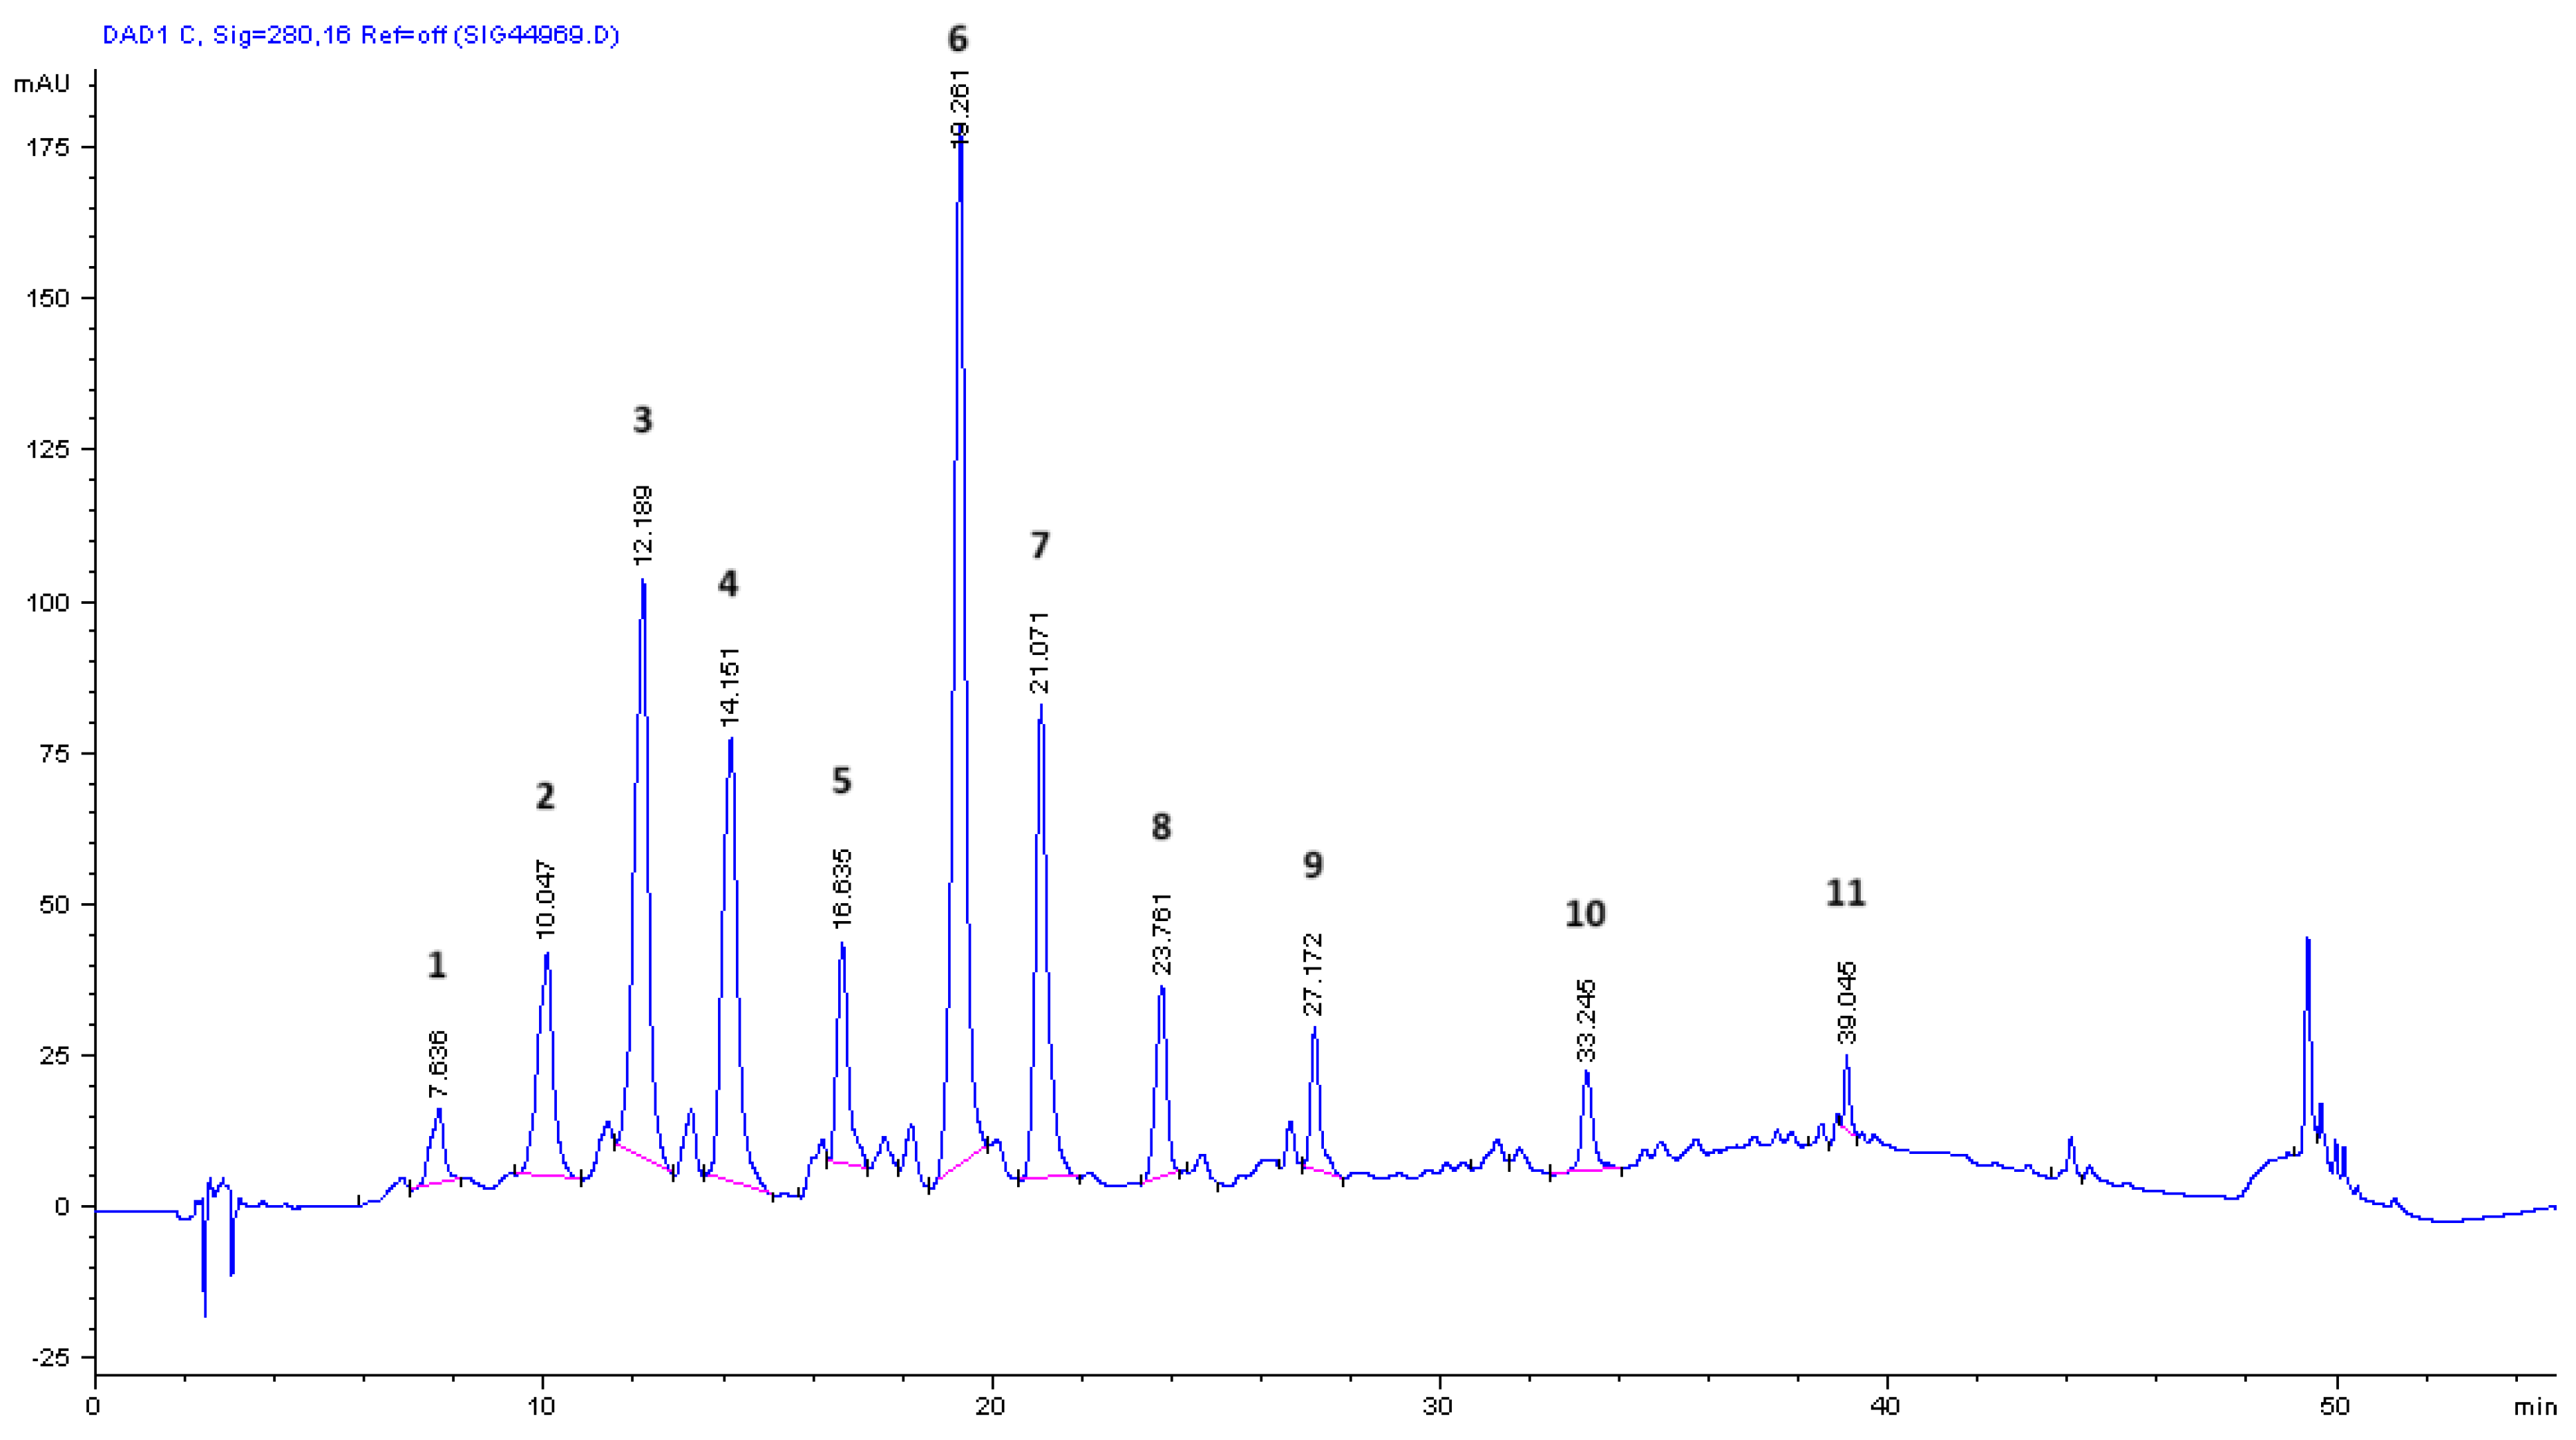
Figure 5b.
HPLC chromatogram at 280 nm of the hydrolysate with 6 M HCl of OMW-2000XAD. A tentative identification of the peaks ESI-Qq-TOF mass spectrometry can be seen in Table 3.
Figure 5b.
HPLC chromatogram at 280 nm of the hydrolysate with 6 M HCl of OMW-2000XAD. A tentative identification of the peaks ESI-Qq-TOF mass spectrometry can be seen in Table 3.
3.6. Antioxidant Capacity of OMW-2000XAD
Overall antioxidant capacity of OMW-2000XAD was evaluated by several antioxidant assays, representing different antioxidant mechanisms. TPC by Folin-Ciocalteu reagent, TEAC (based on the inhibition of the ABTS•+ radical cation), FRAP and DPPH are assays by electron-transfer reactions that can be used to measure the reducing and radical scavenging capacity, while ORAC assay involves hydrogen atom transfer reactions and be used to quantify peroxyl radical scavenging capacity. OMW-2000XAD turned out to be an effective free radical scavenger. Total antioxidant capacities of OMW-2000XAD ranged from 701 to 3783 µmol Trolox equivalent/g as assessed by the TEAC, DPPH, FRAP and ORAC methods (Table 4). This table also includes for comparison purposes values of hydroxytyrosol (HT) and caffeic acid (CA), two of the best antioxidant phenolic compounds found in OMW. When values are expressed as a function of molecular weight calculated (1960 kDa), the antioxidant capacity of OMW-2000XAD is thousands of times higher than those of HT and CA (for example, OMW-2000XAD has a value of 4976 mol Trolox equivalent/mol in TEAC, while HT and CA have only 1.7 and 1.9 mol Trolox equivalent/mol, respectively). It may reasonably be expected, the high phenolic content of OMW-2000XAD appears to be the key factor in determining its raised antioxidant capacity. But besides this, the polymeric character of the complex, which was dialyzed free of unbound compounds, must be no doubt considered. Some authors have suggested that the polymerization of antioxidant phenolic compounds can reproduce and release -OH groups in the reaction products [57] what evidently associates to a higher radical scavenging capacity than those monomeric compounds, which is coherent with the hypothesis that antioxidant capacity is proportional to the degree of polymerization and with the presence of many aromatic structures and oxidizable functional groups [25].
In comparison with other polymeric phenolic fractions from plant extracts, for example, OMW-2000XAD has an antioxidant capacity measured by TEAC method approx. 2-2.5-fold higher than grape stem extracts (> 10 kDa) [58] or mango seed kernel extracts [59] (expressed as mmol Trolox equivalent/g), both rich in tannins and which also are characterized by their ability to form strong complex with macromolecules such as protein and polysaccharides, among other. Although no specific data are provided on the molecular weight of these extracts, the results denote the potent antioxidant capacity of the polymeric phenolic fractions and that exist a clear correlation between the antioxidant capacity and the high molecular weight. When OMW-2000XAD is compared to a reference tannin such as tannic acid, both show a similar value of ABTS•+ radical scavenging capacity (2.5 versus 3.1 mmol Trolox equivalent/g, respectively) [59], but not taking into account that the molecular weight of OMW-2000XAD is much higher than that of tannic acid (1960 kDa versus 1.7 kDa).

Table 4.
Antioxidant capacity (µmol Trolox equivalent/g) and total phenolic content (TPC, µmol Gallic acid equivalent/g) of the OMW-2000XAD complex. As a comparison, values of main olive antioxidant phenolic compounds have been included.
Table 4.
Antioxidant capacity (µmol Trolox equivalent/g) and total phenolic content (TPC, µmol Gallic acid equivalent/g) of the OMW-2000XAD complex. As a comparison, values of main olive antioxidant phenolic compounds have been included.
| Assay | OMW-2000XAD | Hydroxytyrosol | Caffeic acid |
|---|---|---|---|
| TEAC | 2539 ± 381 / (4976)2 | 11322 / (1.7) | 10700 / (1.9) |
| DPPH | 7013 ± 4 / (1374) | 87843 / (1.4) | 71483 / (1.3) |
| FRAP | 1038 ± 35 / (2035) | 5550 / (0.9) | Not found |
| ORAC | 3783 ± 76 / (7415) | 40405 / (6.2) | Not found |
| TPC | 5277 ± 186 / (10343) | - | - |
3.7. Anti-Proliferative Activity of OMW-2000XAD
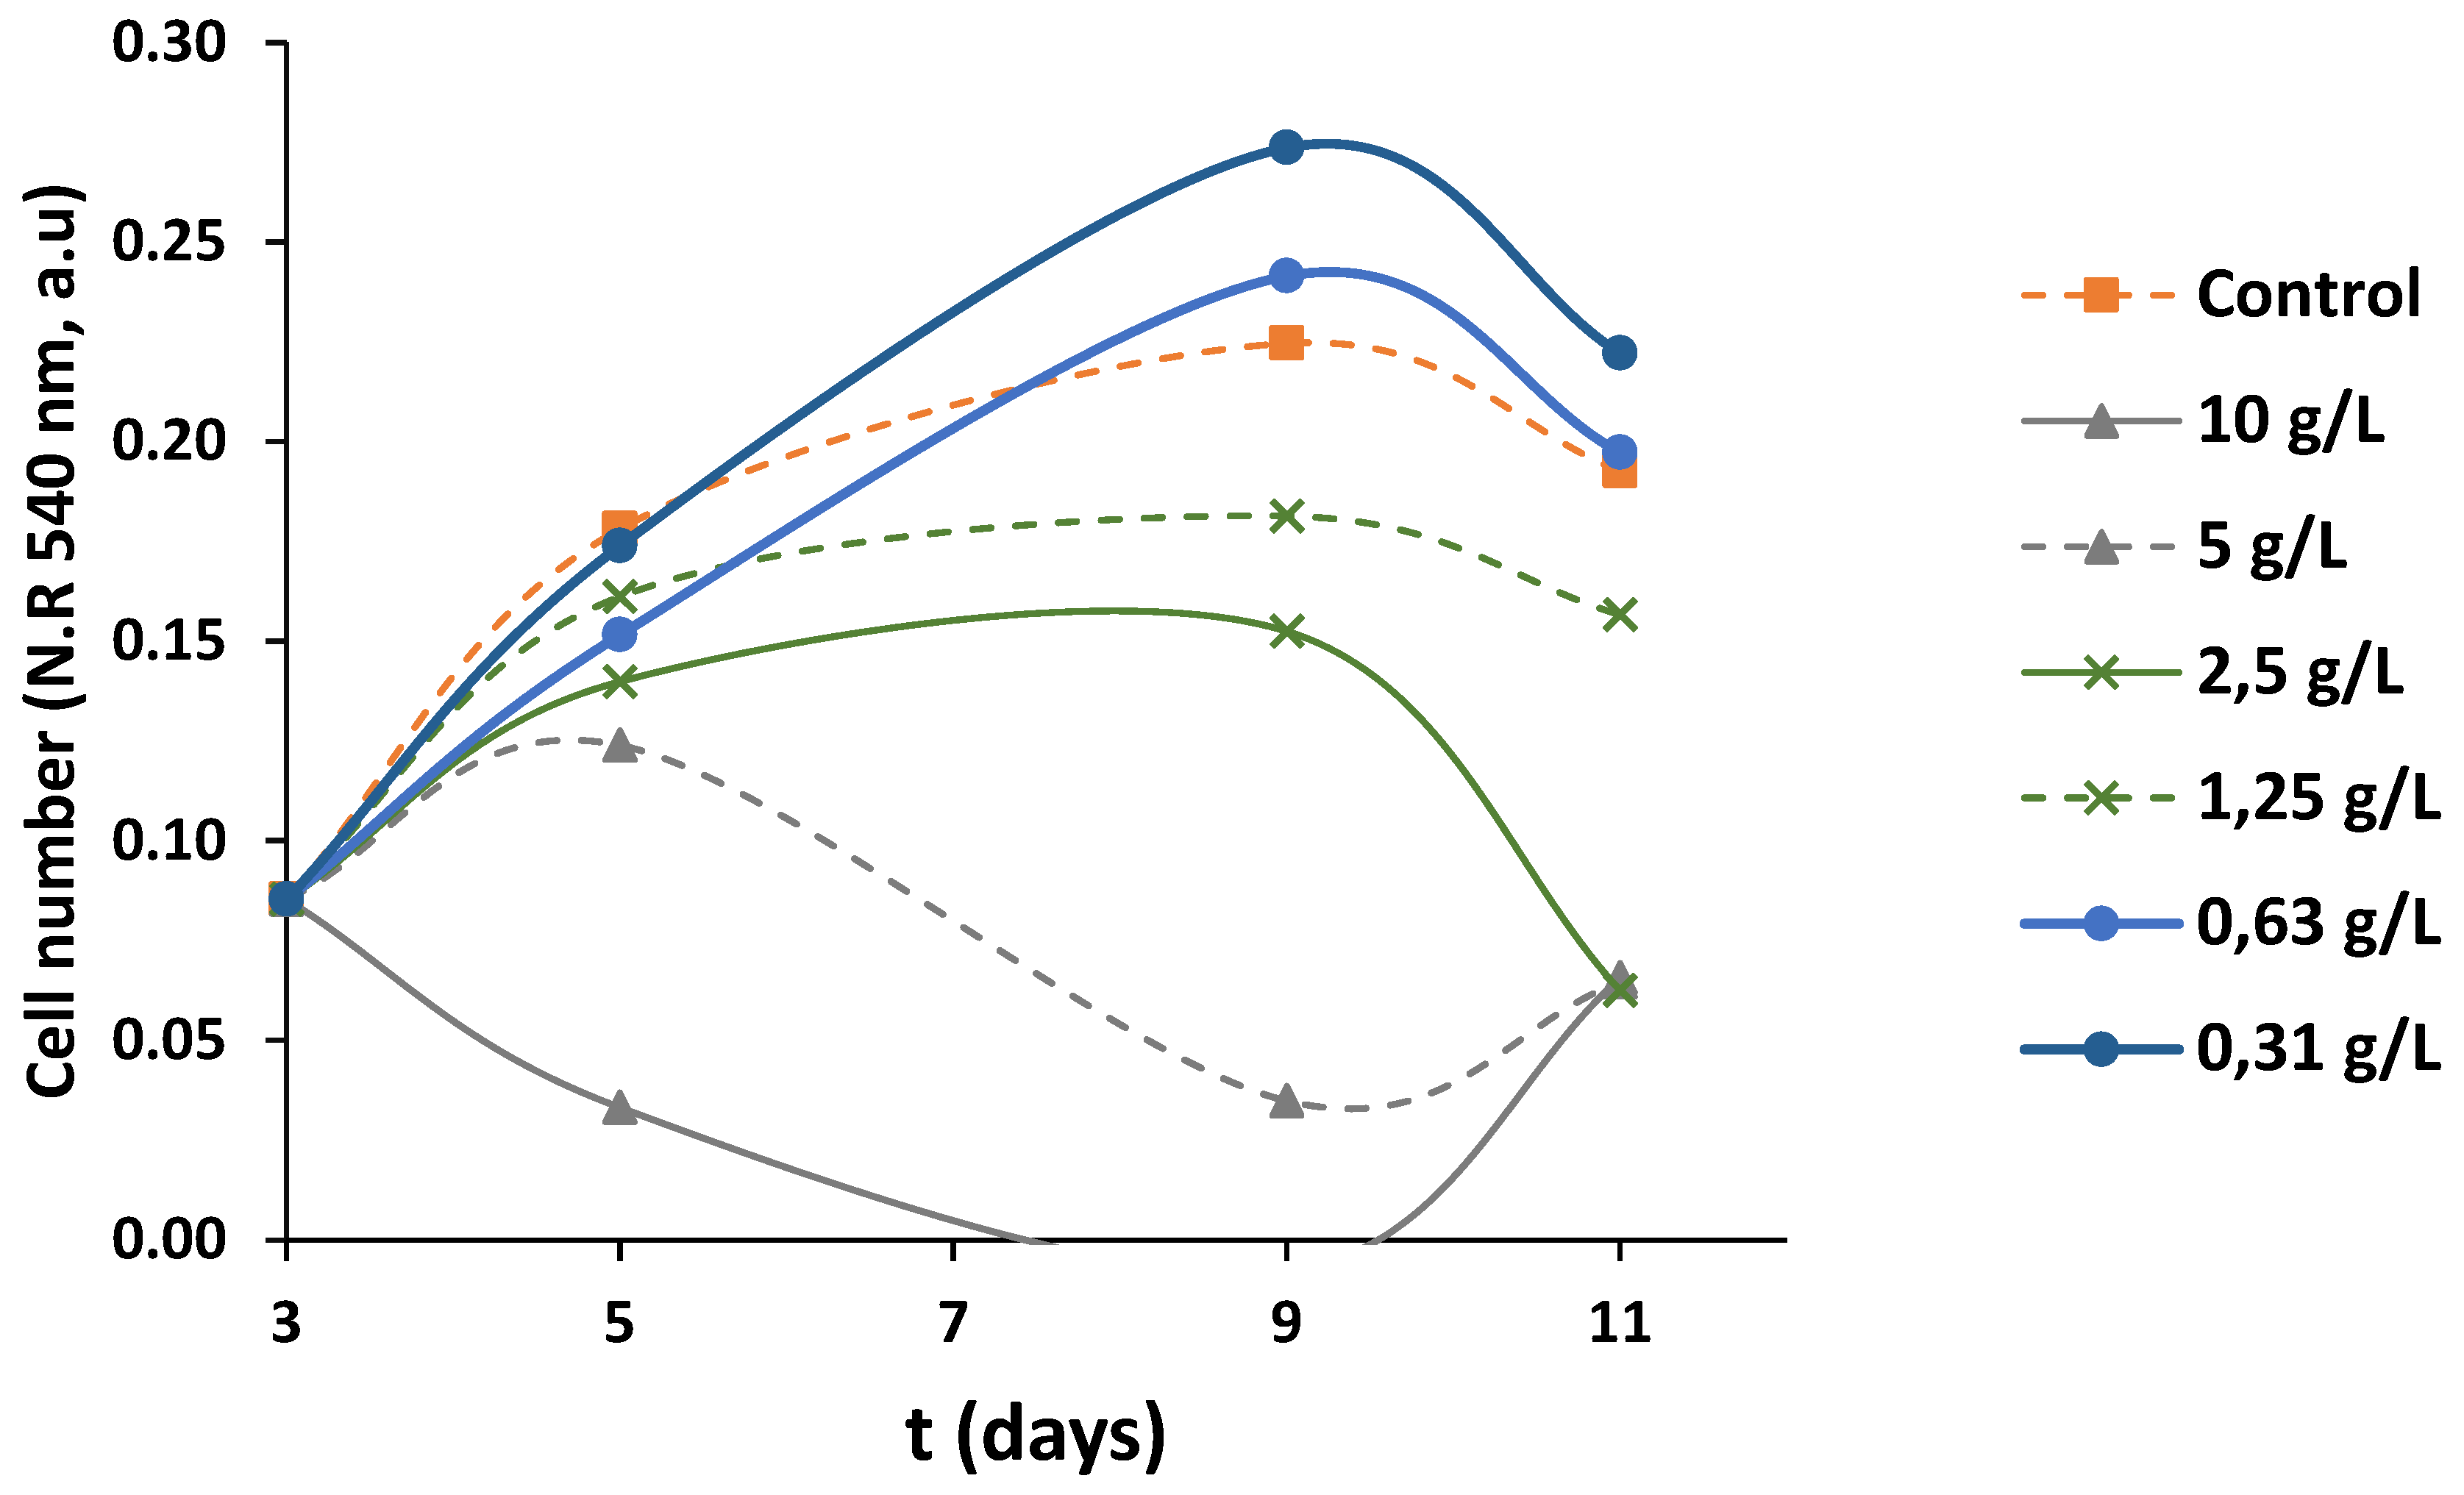
The results of the treatment of Caco-2 cells with OMW-2000XAD (Figure 6a) indicate that it does not exert an antiproliferative effect. After 3 days of exposition to OMW2000-XAD, it was not observed any significant reduction on cell growth with the lower doses (0.08 g/L – 0.63 g/L) compared to control culture. However, at higher concentrations (1.25 g/L – 10 g/L), OMW-2000XAD seems to reduce particularly the growth and to kill Caco-2 cells. Unfortunately, we presume that such effect is not a consequence of the antiproliferative ability but is due to damage caused by toxicity because when the effect of OMW-2000XAD on cell proliferation of confluent Caco-2 cells was evaluated (Figure 6b) similar results were obtained. Caco-2 cells differentiate into an enterocyte-like phenotype when they are allowed to grow as confluent monolayers [62].
Figure 6a.
Effect of OMW2000-XAD on Caco-2 cells proliferation at various concentrations (from 0.08 g/L to 10 g/L). Neutral red uptake was determined after 3 days of incubation. Data are the mean of six replicates ± the standard deviation. Different letters indicate statistically significant differences (data analysed by one-way ANOVA-LSD test, at p < 0.05 significance level).
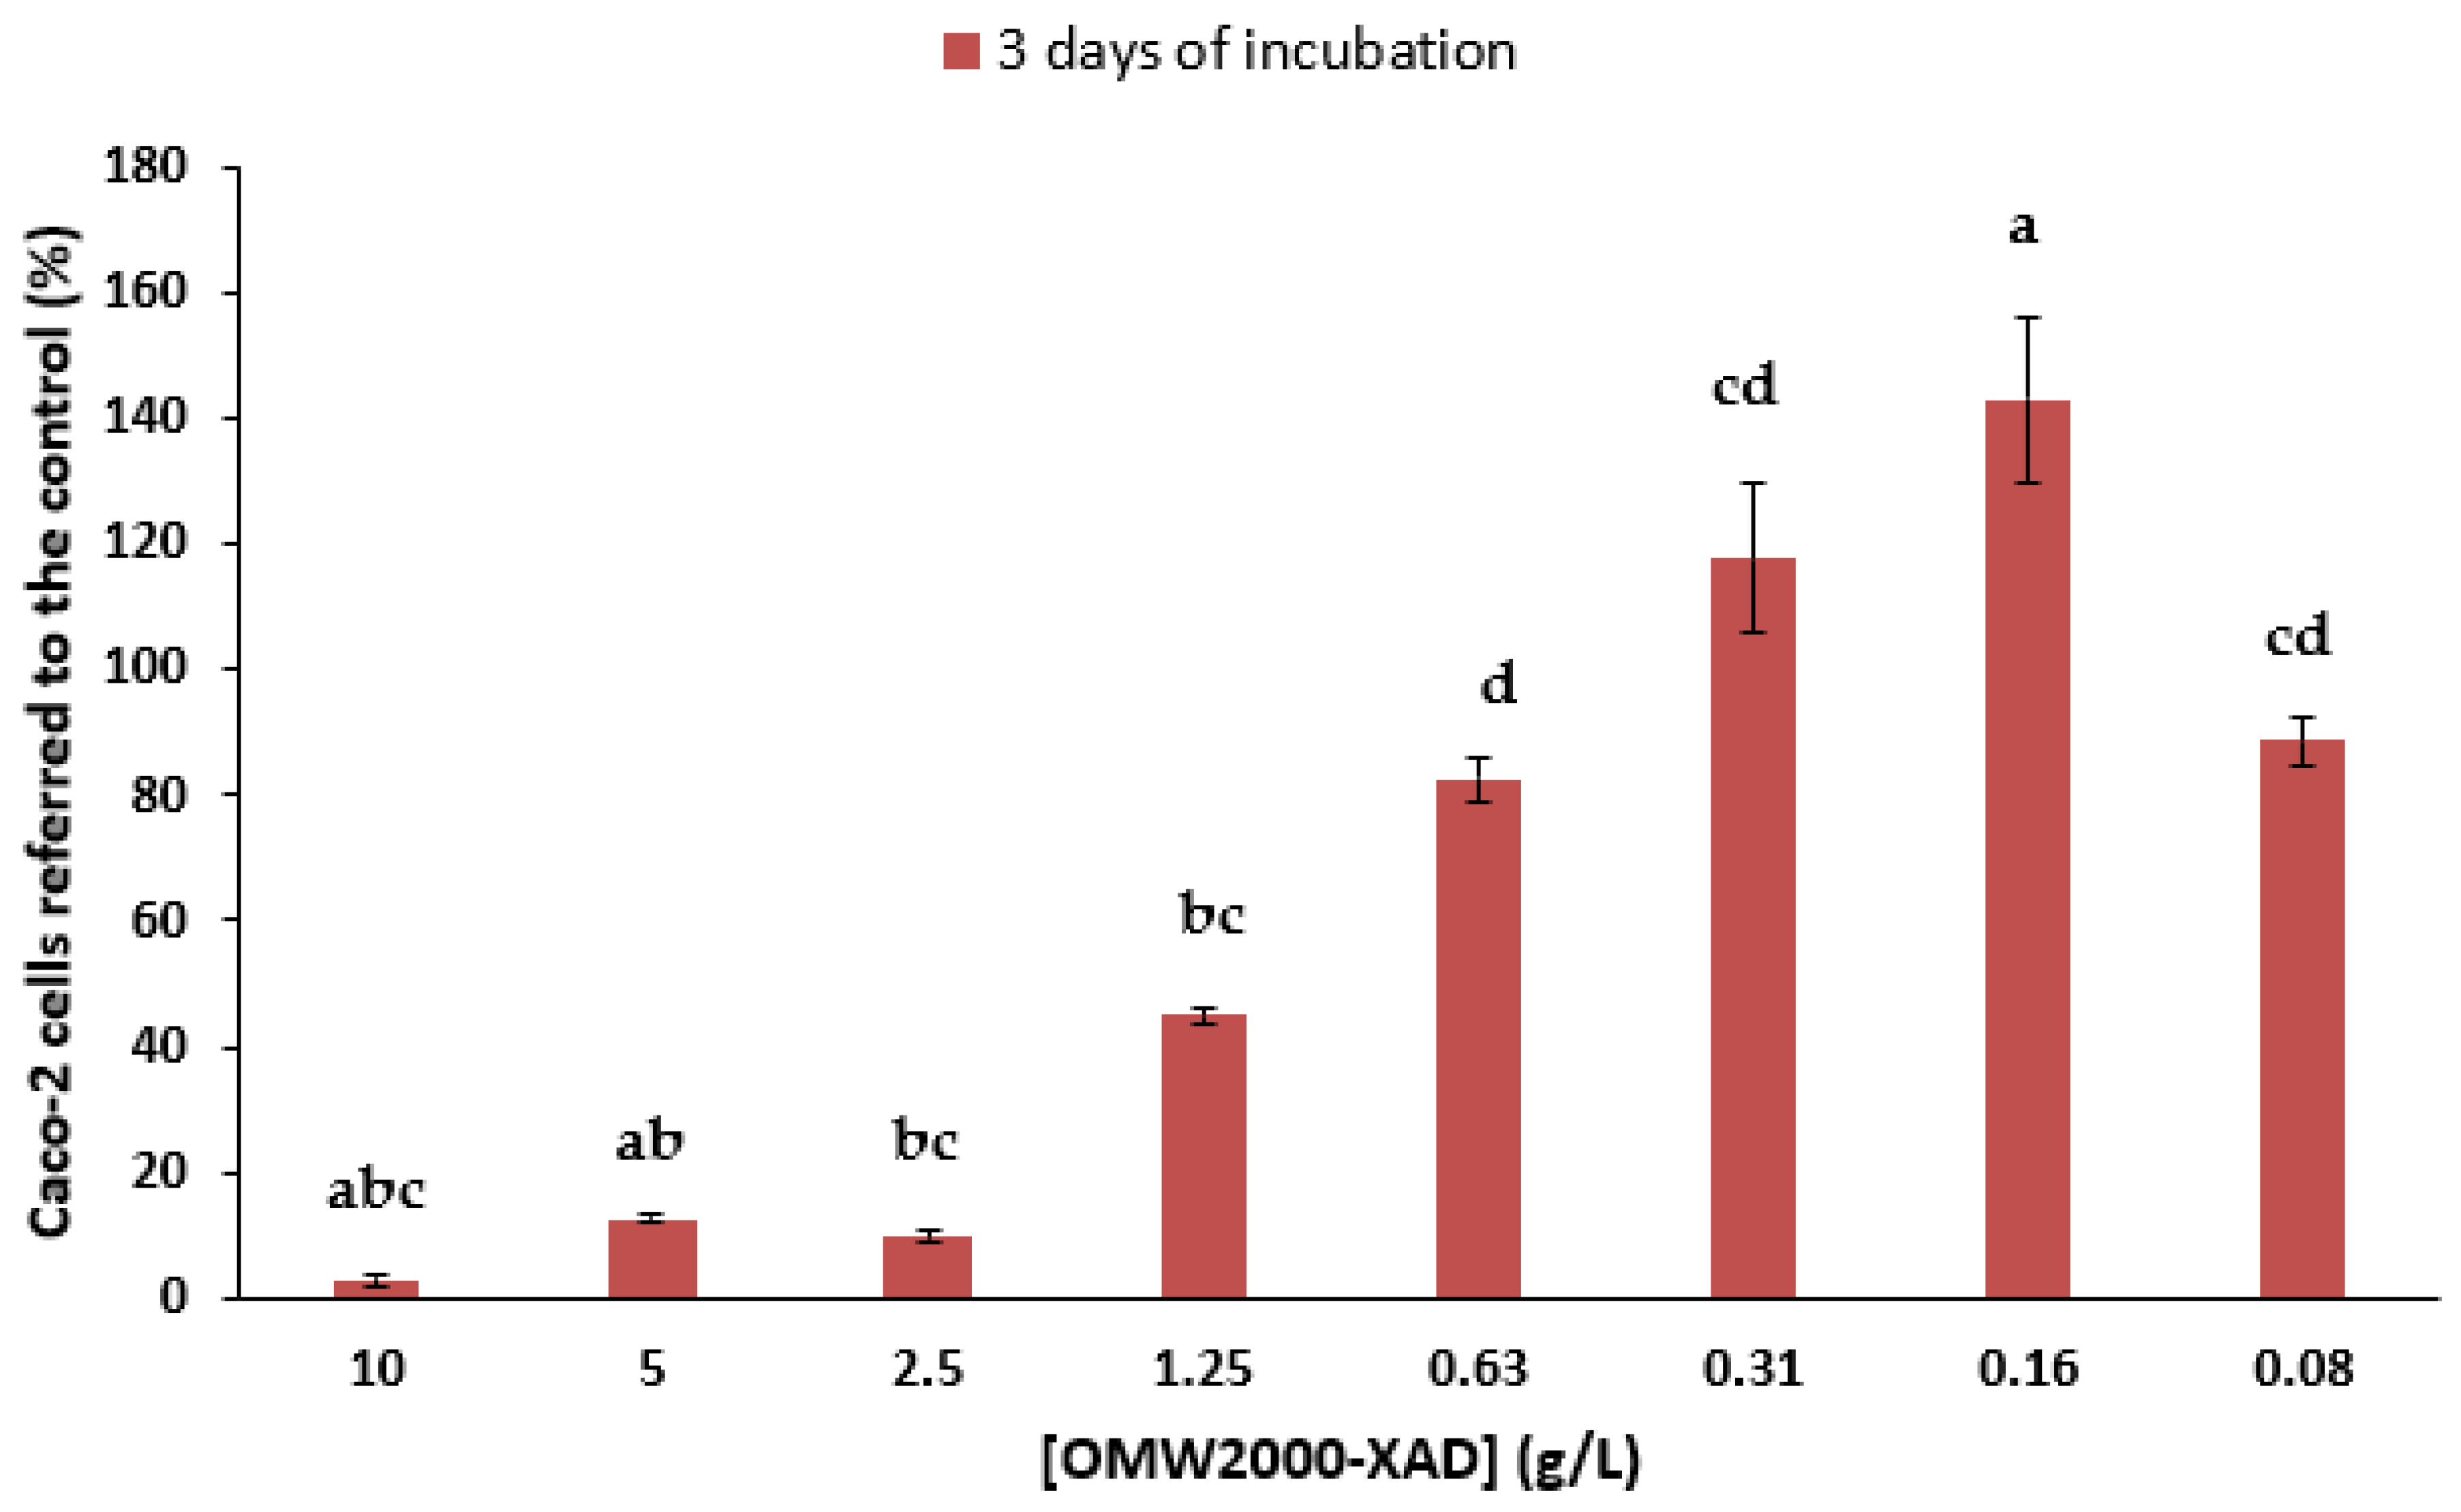
Figure 6b.
Effect of OMW-2000XAD on proliferation of confluent Caco-2 cells. Cell number was estimated by determination of neutral red uptake. Data are the mean of six replicates. Error bars and statistically significant differences are not shown for clarity.
Figure 6b.
Effect of OMW-2000XAD on proliferation of confluent Caco-2 cells. Cell number was estimated by determination of neutral red uptake. Data are the mean of six replicates. Error bars and statistically significant differences are not shown for clarity.
4. Conclusions
Definitely, the results indicate that we are dealing with a completely new complex polymeric fraction from OMW. However, from the observed spectroscopic data can be interpreted that there is not a repeating monomeric unit or moiety, neither enough information available in the obtained spectra with the techniques within reach for authors to propose a possible polymeric structure (linear, branched or network polymer) or a linkage pattern between phenolic compounds, polysaccharides, and proteins. All of it complicated by the multicomponent nature and high molecular weight of OMW-2000XAD. In a next work, authors attempt to fractionate OMW-2000XAD and to separate their components in different lower molecular weight fragments helping to its structural characterization and linkage analysis as well as with the aim to improve its biological properties and to make a more careful investigation of its potential applications. It will also be interesting to study the production of OMW-2000XAD using OMW obtained from other olive varieties and to check whether the procedure described herein can overcome one of the main limitations of using biomass, namely the variability in its composition which might have an important impact on the complex’s activity and applicability.
Author Contributions
A.L.-M. and J.F.-B.: conception and design of the work, analysis and interpretation of data, writing-review and editing; A.L.-M., A.B.-O., F.R.-S.: acquisition of data, investigation and visualization; A.B.-O., F.R.-S. and Á.F.-P.: formal analysis; A.L.-M.: writing-original draft preparation; A.L.-M., J.F.-B. and G.R.-G.: funding acquisition. All authors have read and agreed to the published version of the manuscript.
Funding
This work was supported by the Spanish Ministry of Science, Innovation and Universities (grant number PID2022-142731OB-C21) and the Spanish National Research Council (CSIC) (grant number 2024ICT268).
Acknowledgments
The authors would like to thank Dra. Alicia Sánchez García, Dr. Francisco Javier Hidalgo García and Víctor M. Ramos Muñoz responsible for the Instituto de la Grasa’s mass spectrometry, environmental laboratory (ICP-MS), and nuclear magnetic resonance services, respectively, for performing these analyses. Also, thanks to Dra. María del Carmen Millán Linares for elemental analysis of carbon and nitrogen.
Conflicts of Interest
The authors declare no conflicts of interest.
References
- Azzam, M.O.J.; Hazaimeh, S.A. Olive mill wastewater treatment and valorization by extraction/concentration of hydroxytyrosol and other natural phenols. Process Saf. Environ. Prot. 2021, 148, 495–523. [Google Scholar] [CrossRef]
- Davies, L.C.; Vilhena, A.M.; Novais, J.M.; Martins-Dias, S. Olive mill wastewater characteristics: modelling and statistical analysis. Grasas Aceites 2004, 55, 233–241. [Google Scholar] [CrossRef]
- Niaounakis, M.; Halvadakis, C.P. Olive-mill Waste Management - Literature Review and Patent Survey; Typothito - George Dardanos: Athens, Greece, 2004; pp. 18–34. [Google Scholar]
- Poerschmann, J.; Weiner, B.; Baskyr, I. Organic compounds in olive mill wastewater and in solutions resulting from hydrothermal carbonization of the wastewater. Chemosphere 2013, 92, 1472–1482. [Google Scholar] [CrossRef] [PubMed]
- Abbattista, R.; Ventura, G.; Calvano, C.D.; Cataldi, T.R.I.; Losito, I. Bioactive compounds in waste by-products from olive oil production: Applications and structural characterization by mass spectrometry techniques. Foods 2021, 10, 1236. [Google Scholar] [CrossRef]
- Roncero, A.V.; Durán, R.M.; Constante, E.G. Componentes fenólicos de la aceituna II. Polifenoles del alpechín (Phenolic compounds in olive fruits II. Polyphenols in vegetation water). Grasas Aceites 1974, 25, 341–345. [Google Scholar]
- Schieber, A. Reactions of quinones - Mechanisms, structures, and prospects for food research. J. Agric. Food Chem. 2018, 66, 13051–13055. [Google Scholar] [CrossRef]
- Tilley, A.; McHenry, M.P.; McHenry, J.A.; Solah, V.; Bayliss, K. Enzymatic browning: The role of substrates in polyphenol oxidase mediated browning. Curr. Res. Food Sci. 2023, 7, 100623. [Google Scholar] [CrossRef]
- Xue, H.; Feng, J.; Tang, Y.; Wang, X.; Tang, J.; Cai, X.; Zhong, H. Research progress on the interaction of the polyphenol–protein–polysaccharide ternary systems. Chem. Biol. Technol. Agric. 2024, 11, 95. [Google Scholar] [CrossRef]
- Contreras, M.M.; López-Linares, J.C.; Castro, E. Integrated advanced technologies for olive mill wastewater treatment: a biorefinery approach. In Advanced Technologies in Wastewater Treatment – Food Processing Industry; Basile, A., Cassano, A., Conidi, C., Eds.; Publisher: Elsevier Amsterdam, Netherlands, 2023; pp. 247–273. [Google Scholar] [CrossRef]
- Ochando-Pulido, J.M.; Vuppala, S.; García-López, A.I.; Martínez-Férez, A. A focus on anaerobic digestion and co-digestion strategies for energy recovery and digestate valorization from olive-oil mill solid and liquid by-products. Sep. Purif. Technol. 2024, 333, 125827. [Google Scholar] [CrossRef]
- Fernández-Bolaños, J.; Rodríguez Gutiérrez, G.; Lama Muñoz, A.; Sánchez Moral, P. 2010. Device and method for processing olive-oil-production byproducts. ES Patent 2,374,675, 09 August.
- Amaral, C.; Lucas, M.S.; Coutinho, J.; Crespí, A.L.; do Rosário Anjos, M.; Pais, C. Microbiological and physicochemical characterization of olive mill wastewaters from a continuous olive mill in Northeastern Portugal. Bioresour. Technol. 2008, 99, 7215–7223. [Google Scholar] [CrossRef]
- Wang, T.; Jiang, M.; Yu, X.; Niu, N.; Chen, L. Application of lignin adsorbent in wastewater Treatment: A review. Sep. Purif. Technol. 2022, 302, 122116. [Google Scholar] [CrossRef]
- Sannino, F.; Iorio, M.; De Martino, A.; Pucci, M.; Brown, C.D.; Capasso, R. Remediation of waters contaminated with ionic herbicides by sorption on polymerin. Water Res. 2008, 42, 643–652. [Google Scholar] [CrossRef] [PubMed]
- Capasso, R.; De Martino, A. Polymerin and lignimerin, as humic acid-like sorbents from vegetable waste, for the potential remediation of waters contaminated with heavy metals, herbicides, or polycyclic aromatic hydrocarbons. J. Agric. Food Chem. 2010, 58, 10283–10299. [Google Scholar] [CrossRef]
- Panzella, L.; Napolitano, A. Natural Phenol Polymers: Recent Advances in Food and Health Applications. Antioxidants 2017, 6, 30. [Google Scholar] [CrossRef]
- Karadeniz, F.; Ahn, B.-N.; Kim, J.-A.; Seo, Y.; Jang, M.-S.; Nam, K.-H.; Kim, M.; Lee, S.-H.; Kong, C.-S. Phlorotannins suppress adipogenesis in pre-adipocytes while enhancing osteoblastogenesis in pre-osteoblasts. Arch. Pharm. Res. 2015, 38, 2172–2182. [Google Scholar] [CrossRef]
- Tsirigotis-Maniecka, M.; Pawlaczyk-Graja, I.; Ziewiecki, R.; Balicki, S.; Matulová, M.; Capek, P.; Czechowski, F.; Gancarz, R. The polyphenolic-polysaccharide complex of Agrimonia eupatoria L. as an indirect thrombin inhibitor - isolation and chemical characterization. Int. J. Biol. Macromol. 2019, 125, 124–132. [Google Scholar] [CrossRef]
- Olennikov, D.N.; Chemposov, V.V.; Chirikova, N.K. Polymeric compounds of lingonberry waste: Characterization of antioxidant and hypolipidemic polysaccharides and polyphenol-polysaccharide conjugates from Vaccinium vitis-idaea press cake. Foods 2022, 11, 2801. [Google Scholar] [CrossRef]
- Capasso, R.; De Martino, A.; Arienzo, M. Recovery and characterization of the metal polymeric organic fraction (Polymerin) from olive oil mill wastewaters. J. Agric. Food Chem. 2002, 50, 2846–2855. [Google Scholar] [CrossRef]
- Capasso, R.; De Martino, A.; Pigna, M.; Pucci, M.; Sannino, F.; Violante, A. Recovery of polymerin from olive oil mill waste waters. Its potential utilization in environmental technologies and industry. La Chimica e l’Industria 2003, 85, 1–7. [Google Scholar]
- Capasso, R.; De Martino, A.; Cristinzio, G. Production, characterization, and effects on tomato of humic acid-like polymerin metal derivatives from olive oil mill waste waters. J. Agric. Food Chem. 2002, 50, 4018–4024. [Google Scholar] [CrossRef]
- Aranda, E.; García-Romera, I.; Ocampo, J.A.; Carbone, V.; Mari, A.; Malorni, A.; Sannino, F.; De Martino, A.; Capasso, R. Chemical characterization and effects on Lepidium sativum of the native and bioremediated components of dry olive mil residue. Chemosphere 2007, 69, 229–239. [Google Scholar] [CrossRef] [PubMed]
- Cardinali, A.; Cicco, N.; Linsalata, V.; Minervini, F.; Pati, S.; Pieralice, M.; Tursi, N.; Lattanzio, V. Biological activity of high molecular weight phenolics from olive mill wastewater. J. Agric. Food Chem. 2010, 58, 8585–8590. [Google Scholar] [CrossRef] [PubMed]
- Rubio-Senent, F.; Rodríguez-Gutiérrez, G.; Lama-Muñoz, A.; Fernández-Bolaños, J. Chemical characterization and properties of a polymeric phenolic fraction obtained from olive oil waste. Food Res. Int. 2013, 54, 2122–2129. [Google Scholar] [CrossRef]
- Allouche, N.; FKI, I.; Sayadi, S. Toward a high yield recovery of antioxidants and purified Hydroxytyrosol from olive mill wastewaters. J. Agric. Food Chem. 2004, 52, 267–273. [Google Scholar] [CrossRef]
- Khemakhem, M.; Papadimitriou, V.; Sotiroudis, G.; Zoumpoulakis, P.; Arbez-Gindre, C.; Bouzouita, N.; Sotiroudis, T.G. Melanin and humic acid-like polymer complex from olive mill waste waters. Part I. Isolation and characterization. Food Chem. 2016, 203, 540–547. [Google Scholar] [CrossRef]
- Khemakhem, M.; Sotiroudis, G.; Mitsou, E.; Avramiotis, S.; Sotiroudis, T.G.; Bouzouita, N.; Papadimitriou, V. Melanin and humic acid-like polymer complex from olive mill waste waters. Part II. Surfactant properties and encapsulation in W/O microemulsions. J. Mol. Liq. 2016, 222, 480–486. [Google Scholar] [CrossRef]
- Rodríguez-Martín, N.M.; Márquez-López, J.C.; Cerrillo, I.; Millán, F.; González-Jurado, J.A.; Fernández-Pachón, M.-S.; Pedroche, J. Production of chickpea protein hydrolysate at laboratory and pilot plant scales: Optimization using principal component analysis based on antioxidant activities. Food Chem. 2024, 437, 137707. [Google Scholar] [CrossRef]
- Singleton, V.L.; Rossi, J.A. Colorimetry of total phenolics with phosphomolybdic-phosphotungstic acid reagents. Am. J. Enol. Vitic. 1965, 16, 144–158. [Google Scholar] [CrossRef]
- Jaramillo-Carmona, S.; Rodríguez-Arcos, R.; Guillén-Bejarano, R.; Jiménez-Araujo, A. Hydrothermal treatments enhance the solubility and antioxidant characteristics of dietary fiber from asparagus by-products. Food Bioprod. Process. 2019, 114, 175–184. [Google Scholar] [CrossRef]
- Lama-Muñoz, A.; Romero-García, J.M.; Cara, C.; Moya, M.; Castro, E. Low energy-demanding recovery of antioxidants and sugars from olive stones as preliminary steps in the biorefinery context. Ind. Crops Prod. 2014, 60, 30–38. [Google Scholar] [CrossRef]
- Huang, D.; Ou, B.; Prior, R.L. The chemistry behind antioxidant capacity assays. J. Agric. Food Chem. 2005, 53, 1841–1856. [Google Scholar] [CrossRef] [PubMed]
- Borenfreund, E.; Puerner, J.A. Toxicity determined in vitro by morphological alterations and neutral red absorption. Toxicol. Lett. 1985, 24, 119–124. [Google Scholar] [CrossRef] [PubMed]
- El Hajjouji, H.; Fakharedine, N.; Baddi, G.A.; Winterton, P.; Bailly, J.R.; Revel, J.C.; Hafidi, M. Treatment of olive mill waste-water by aerobic biodegradation: An analytical study using gel permeation chromatography, ultraviolet–visible and Fourier transform infrared spectroscopy. Bioresour. Technol. 2007, 98, 3513–3520. [Google Scholar] [CrossRef]
- Barje, F.; El Fels, L.; El Hajjouji, H.; Amir, S.; Winterton, P.; Hafidi, M. Molecular behaviour of humic acid-like substances during co-composting of olive mill waste and the organic part of municipal solid waste. Int. Biodeter. Biodegr. 2012, 74, 17–23. [Google Scholar] [CrossRef]
- Bonitati, J.; Elliott, W.B.; Miles, P.G. Interference by carbohydrate and other substances in the estimation of protein with the Folin-Ciocalteu reagent. Anal. Biochem. 1969, 31, 399–404. [Google Scholar] [CrossRef]
- Nadour, M.; Laroche, C.; Pierre, G.; Delattre, C.; Moulti-Mati, F.; Michaud, P. Structural characterization and biological activities of polysaccharides from olive mill wastewater. Appl. Biochem. Biotechnol. 2015, 177, 431–445. [Google Scholar] [CrossRef]
- Hafidi, M.; Amir, S.; Revel, J.-C. Structural characterization of olive mill waste-water after aerobic digestion using elemental analysis, FTIR and 13C NMR. Process Biochem. 2005, 40, 2615–2622. [Google Scholar] [CrossRef]
- El Haimer, Y.; Rich, A.; Sisouane, M.; Siniti, M.; El Krati, M.; Tahiri, S.; Mountadar, M. Olive oil mill wastewater treatment by a combined process of freezing, sweating and thawing. Desal. Water Treat. 2022, 257, 158–168. [Google Scholar] [CrossRef]
- Pawlaczyk-Graja, I. Polyphenolic-polysaccharide conjugates from flowers and fruits of single-seeded hawthorn (Crataegus monogyna Jacq.): Chemical profiles and mechanisms of anticoagulant activity. Int. J. Biol. Macromol. 2018, 116, 869–879. [Google Scholar] [CrossRef]
- González-Cabrera, M.; Domínguez-Vidal, A.; Ayora-Cañada, M.J. Hyperspectral FTIR imaging of olive fruit for understanding ripening processes. Postharvest Biol. Technol. 2018, 145, 74–82. [Google Scholar] [CrossRef]
- Wang, B.; Pham, L.B.; Adhikari, B. Complexation and conjugation between phenolic compounds and proteins: mechanisms, characterisation and applications as novel encapsulants. Sustainable Food Technol. 2024, 2, 1206–1227. [Google Scholar] [CrossRef]
- Galeb, H.A.; Eichhorn, J.; Harley, S.; Robson, A.J.; Martocq, L.; Nicholson, S.J.; Ashton, M.D.; Abdelmohsen, H.A.M.; Pelit, E.; Baldock, S.J.; Halcovitch, N.R.; Robinson, B.J.; Schacher, F.H.; Chechik, V.; Vercruysse, K.; Taylor, A.M.; Hardy, J.G. Phenolic Polymers as Model Melanins. Macromol. Chem. Phys. 2023, 2300025. [Google Scholar] [CrossRef]
- Yao, H.-Y.-Y.; Wang, J.-Q. Yin, J.-Y.; Nie, S.-P.; Xie, M.-Y. A review of NMR analysis in polysaccharide structure and conformation: Progress, challenge and perspective. Food Res. Int. 2021, 143, 110290. [Google Scholar] [CrossRef] [PubMed]
- Rao, R.S.P.; Muralikrishna, G. Structural characteristics of water-soluble feruloyl arabinoxylans from rice (Oryza sativa) and ragi (finger millet, Eleusine coracana): Variations upon malting. Food Chem. 2007, 104, 1160–1170. [Google Scholar] [CrossRef]
- Roche, M.; Dufour, C.; Mora, N.; Dangles, O. Antioxidant activity of olive phenols: mechanistic investigation and characterization of oxidation products by mass spectrometry. Org. Biomol. Chem. 2005, 3, 423–430. [Google Scholar] [CrossRef]
- D’Antuono, I.; Kontogianni, V.G.; Kotsiou, K.; Linsalata, V.; Logrieco, A.F.; Tasioula-Margari, M.; Cardinali, A. Polyphenolic characterization of olive mill wastewaters, coming from Italian and Greek olive cultivars, after membrane technology. Food Res. Int. 2014, 65, 301–310. [Google Scholar] [CrossRef]
- Capriotti, A.L.; Cavaliere, C.; Crescenzi, C.; Foglia, P.; Nescatelli, R.; Samperi, R.; Laganà, A. Comparison of extraction methods for the identification and quantification of polyphenols in virgin olive oil by ultra-HPLC-QToF mass spectrometry. Food Chem. 2014, 158, 392–400. [Google Scholar] [CrossRef]
- Alam, M.Z.; Fristedt, R.; Landberg, R.; Kamal-Eldin, A. Soluble and hydrolyzable phenolic compounds in date fruits (Phoenix dactylifera L.) by UPLC-QTOF-MS/MS and UPLC-DAD. J. Food Compos. Anal. 2024, 132, 106354. [Google Scholar] [CrossRef]
- Kıvrak, Ş.; Kıvrak, İ. Ultrasonic-assisted extraction method of phenolic compounds in Extra-Virgin Olive Oils (EVOOs) by Ultra Performance Liquid Chromatography–Tandem Mass Spectrometry (UPLC–MS/MS). Sep. Sci. Technol. 2021, 56, 322–329. [Google Scholar] [CrossRef]
- Grigoletto, I.; Salas, P.G.; Valli, E.; Bendini, A.; Ferioli, F.; Pasini, F.; Villasclaras, S.S.; García-Ruiz, R.; Toschi, T.G. HPLC-MS/MS phenolic characterization of olive pomace extracts obtained using an innovative mechanical approach. Foods 2024, 13, 285. [Google Scholar] [CrossRef]
- Idris, O.A.; Kerebba, N.; Horn, S.; Maboeta, M.S.; Pieters, R. Comparative phytochemistry using UPLC-ESI-QTOF-MS phenolic compounds profile of the water and aqueous ethanol extracts of Tagetes minuta and their cytotoxicity. S. Afr. J. Bot. 2024, 164, 50–65. [Google Scholar] [CrossRef]
- Bongiorno, D.; Di Stefano, V.; Indelicato, S.; Avellone, G.; Ceraulo, L. Bio-phenols determination in olive oils: Recent mass spectrometry approaches. Mass Spec. Rev. 2023, 42, 1462–1502. [Google Scholar] [CrossRef] [PubMed]
- Mattonai, M.; Vinci, A.; Degano, I.; Ribechini, E.; Franceschi, M.; Modugno, F. Olive mill wastewaters: quantitation of the phenolic content and profiling of elenolic acid derivatives using HPLC-DAD and HPLC/MS2 with an embedded polar group stationary phase. Nat. Prod. Res. 2019, 33, 3171–3175. [Google Scholar] [CrossRef] [PubMed]
- Sánchez-Mundo, M.L.; Escobedo-Crisantes, V.M.; Mendoza-Arvizu, S.; Jaramillo-Flores, M.E. Polymerization of phenolic compounds by polyphenol oxidase from bell pepper with increase in their antioxidant capacity. CYTA - J. Food 2016, 14, 594–603. [Google Scholar] [CrossRef]
- Nieto, J.A.; Fernández-Jalao, I.; Siles-Sánchez, M.N.; Santoyo, S.; Jaime, L. Implication of the polymeric phenolic fraction and matrix effect on the antioxidant activity, bioaccessibility, and bioavailability of grape stem extracts. Molecules 2023, 28, 2461. [Google Scholar] [CrossRef]
- Maisuthisakul, P. Antioxidant potential and phenolic constituents of mango seed kernel from various extraction methods. Kasetsart J. (Nat. Sci.) 2009, 43, 290–297. [Google Scholar]
- Bermúdez-Oria, A.; Castejón, M.L.; Rubio-Senent, F.; Fernández-Prior, Á.; Rodríguez-Gutiérrez, G.; Fernández-Bolaños, J. Isolation and structural determination of cis- and trans-p-coumaroyl-secologanoside (comselogoside) from olive oil waste (alperujo). Photoisomerization with ultraviolet irradiation and antioxidant activities. Food Chem. 2024, 432, 140724. [Google Scholar] [CrossRef]
- Rubio-Senent, F.; Bermúdez-Oria, A.; Rodríguez-Gutiérrez, G.; Lama-Muñoz, A.; Fernández-Bolaños, J. Structural and antioxidant properties of hydroxytyrosol-pectin conjugates: Comparative analysis of adsorption and free radical methods and their impact on in vitro gastrointestinal process. Food Hydrocoll. 2025, 162, 110954. [Google Scholar] [CrossRef]
- Bermúdez-Oria, A.; Rodríguez-Gutiérrez, G.; Alaiz, M.; Vioque, J.; Girón-Calle, J.; Fernández-Bolaños, J. Pectin-rich extracts from olives inhibit proliferation of Caco-2 and THP-1 cells. Food Funct. 2019, 10, 4844–4853. [Google Scholar] [CrossRef]
Figure 1.
Representative HPLC chromatogram at 280 nm (above) and UV spectrum (below) of the complex OMW-2000XAD studied herein. Superimposed on the chromatogram, a photograph of the appearance of OMW-2000XAD is included.
Figure 1.
Representative HPLC chromatogram at 280 nm (above) and UV spectrum (below) of the complex OMW-2000XAD studied herein. Superimposed on the chromatogram, a photograph of the appearance of OMW-2000XAD is included.
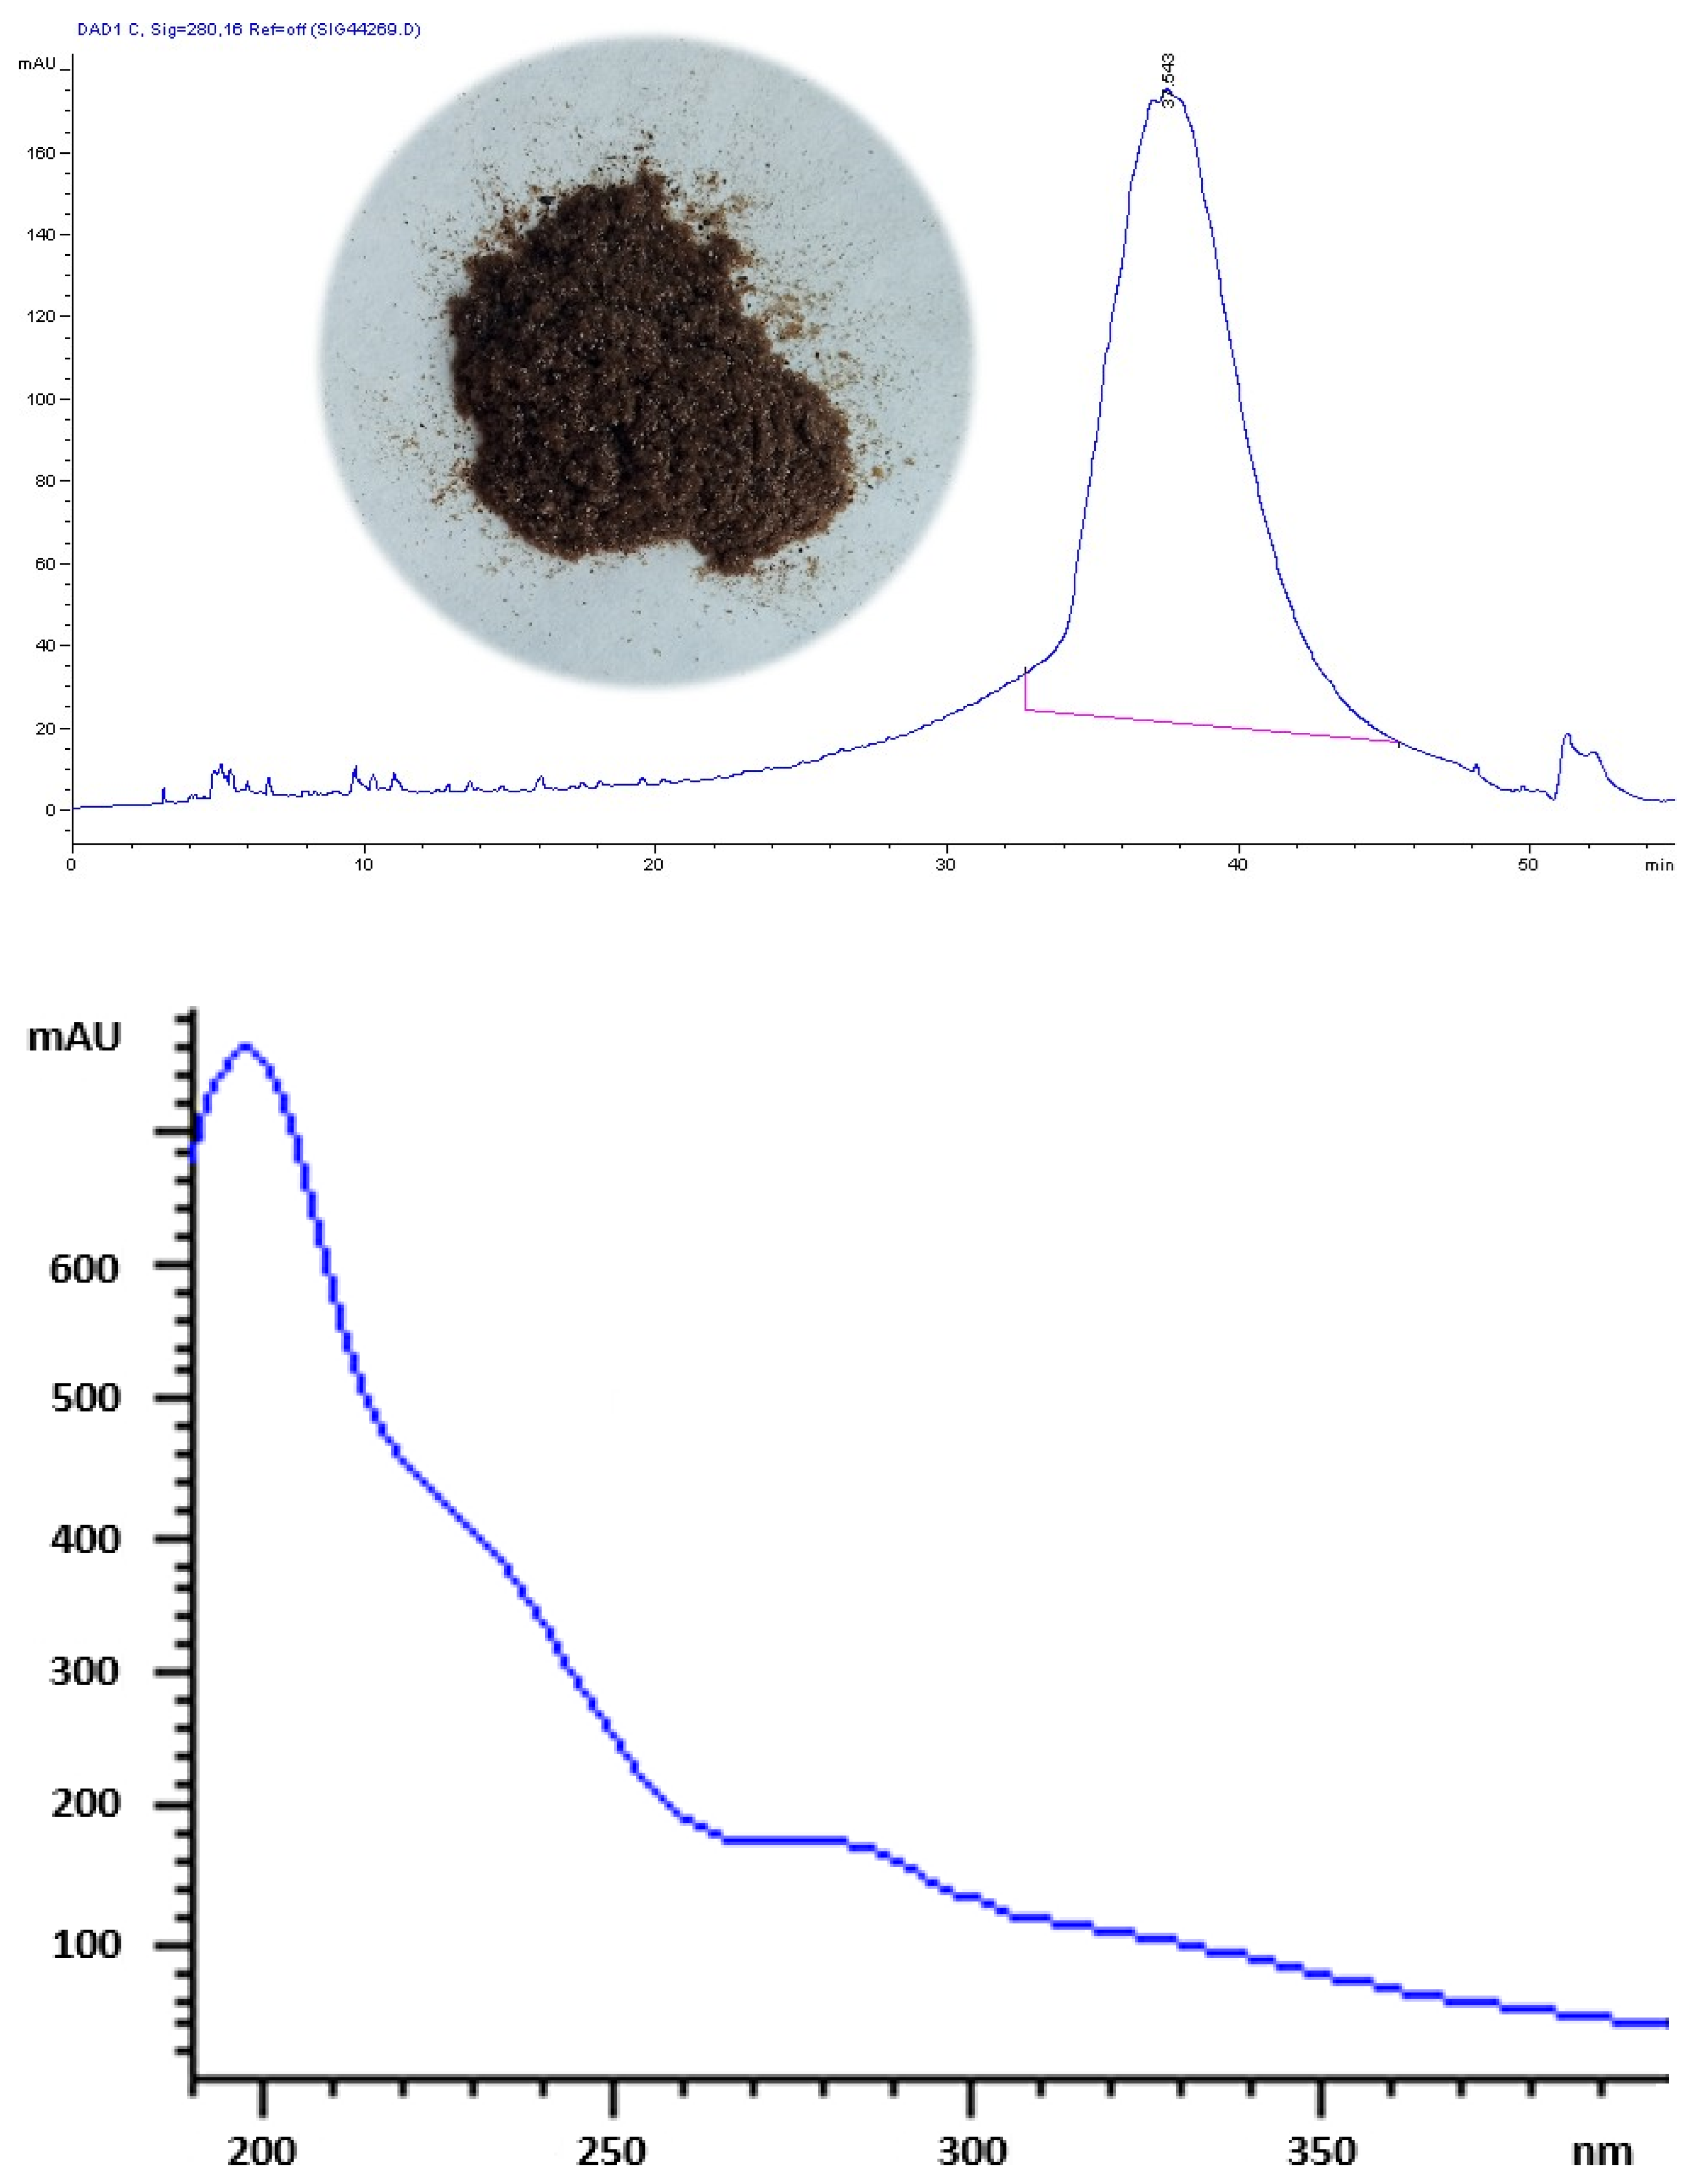
Figure 2.
Gel filtration chromatogram of the OMW-2000XAD complex polymer (tr = 11.84 min) (in green) and its hydrolysate with 4 M NaOH (in red), glucose (tr = 25.08 min) and several dextrans with increasing molecular weight; 6 kDa (tr = 22.80 min), 40 kDa (tr = 20.27 min), 70 kDa (tr = 19.57 min), 110 kDa (tr = 19.09 min), 500 kDa (tr = 18.12 min), and 2000 kDa (tr = 11.70 min) marked with coloured arrows.
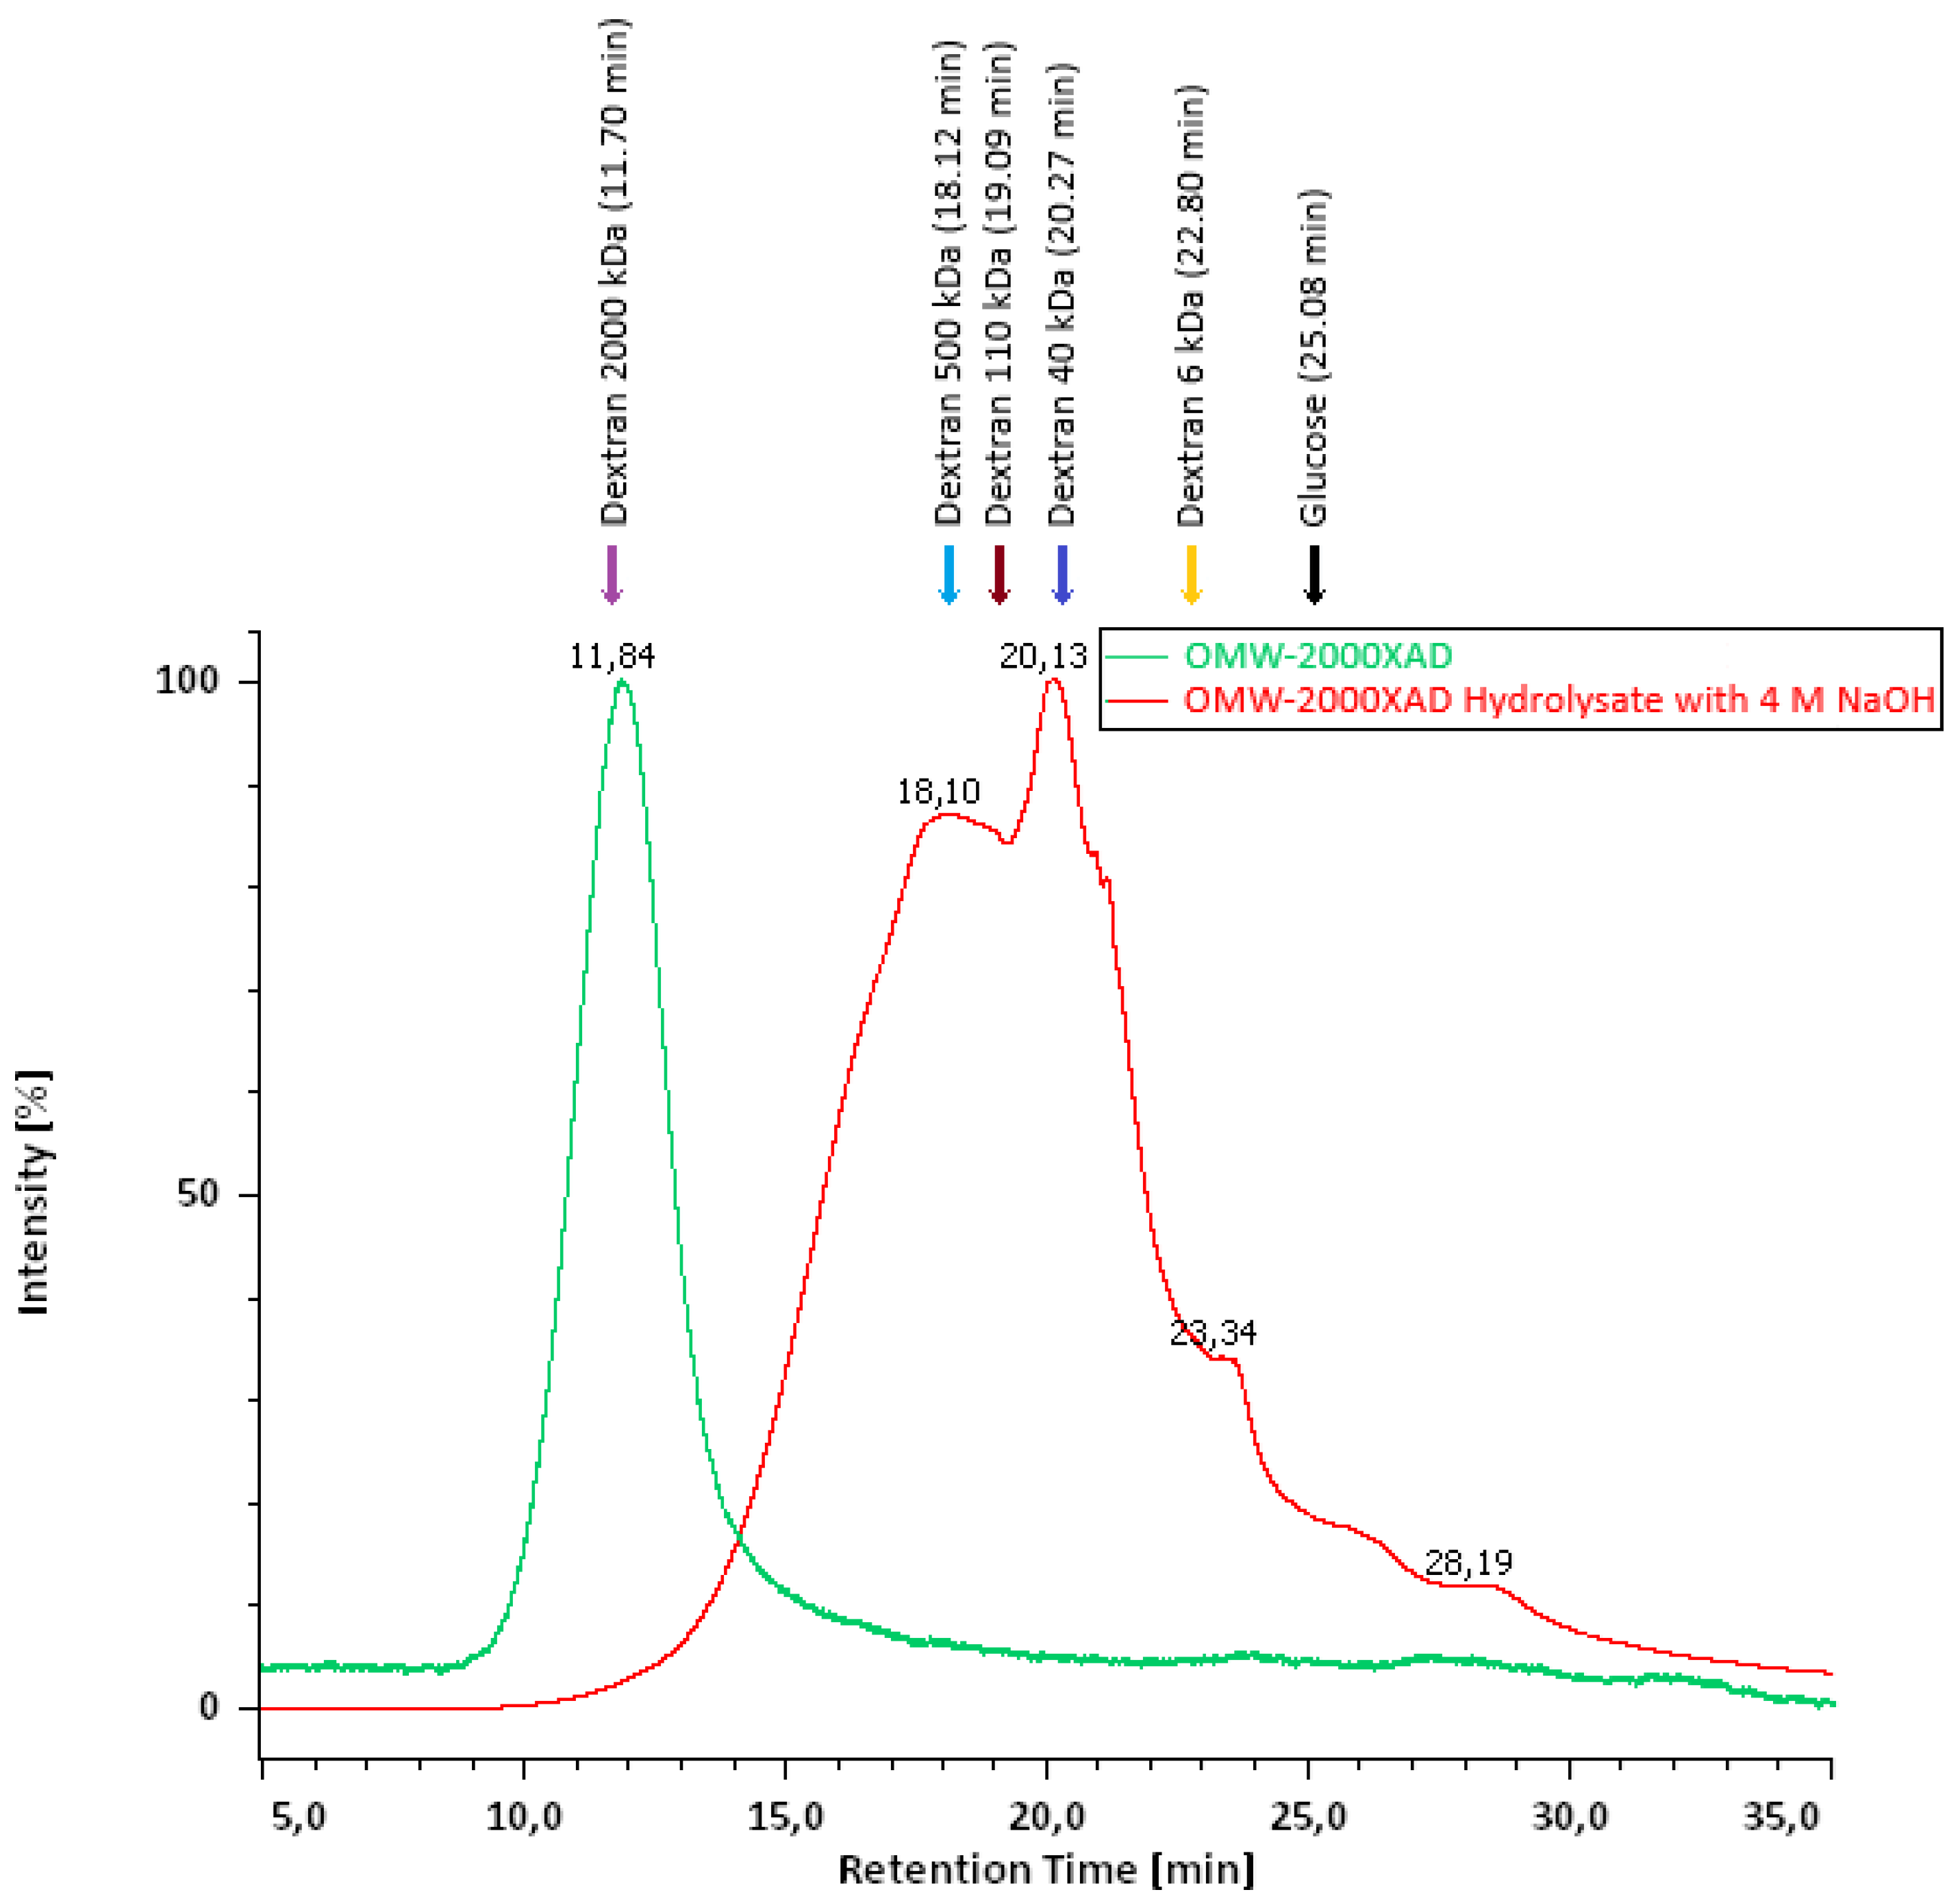
Figure 3.
FTIR spectrum of OMW-2000XAD. The x-axis represents wavenumber (cm-1) in the range 4000-400 cm-1, while the y-axis indicates transmittance (%).
Figure 3.
FTIR spectrum of OMW-2000XAD. The x-axis represents wavenumber (cm-1) in the range 4000-400 cm-1, while the y-axis indicates transmittance (%).
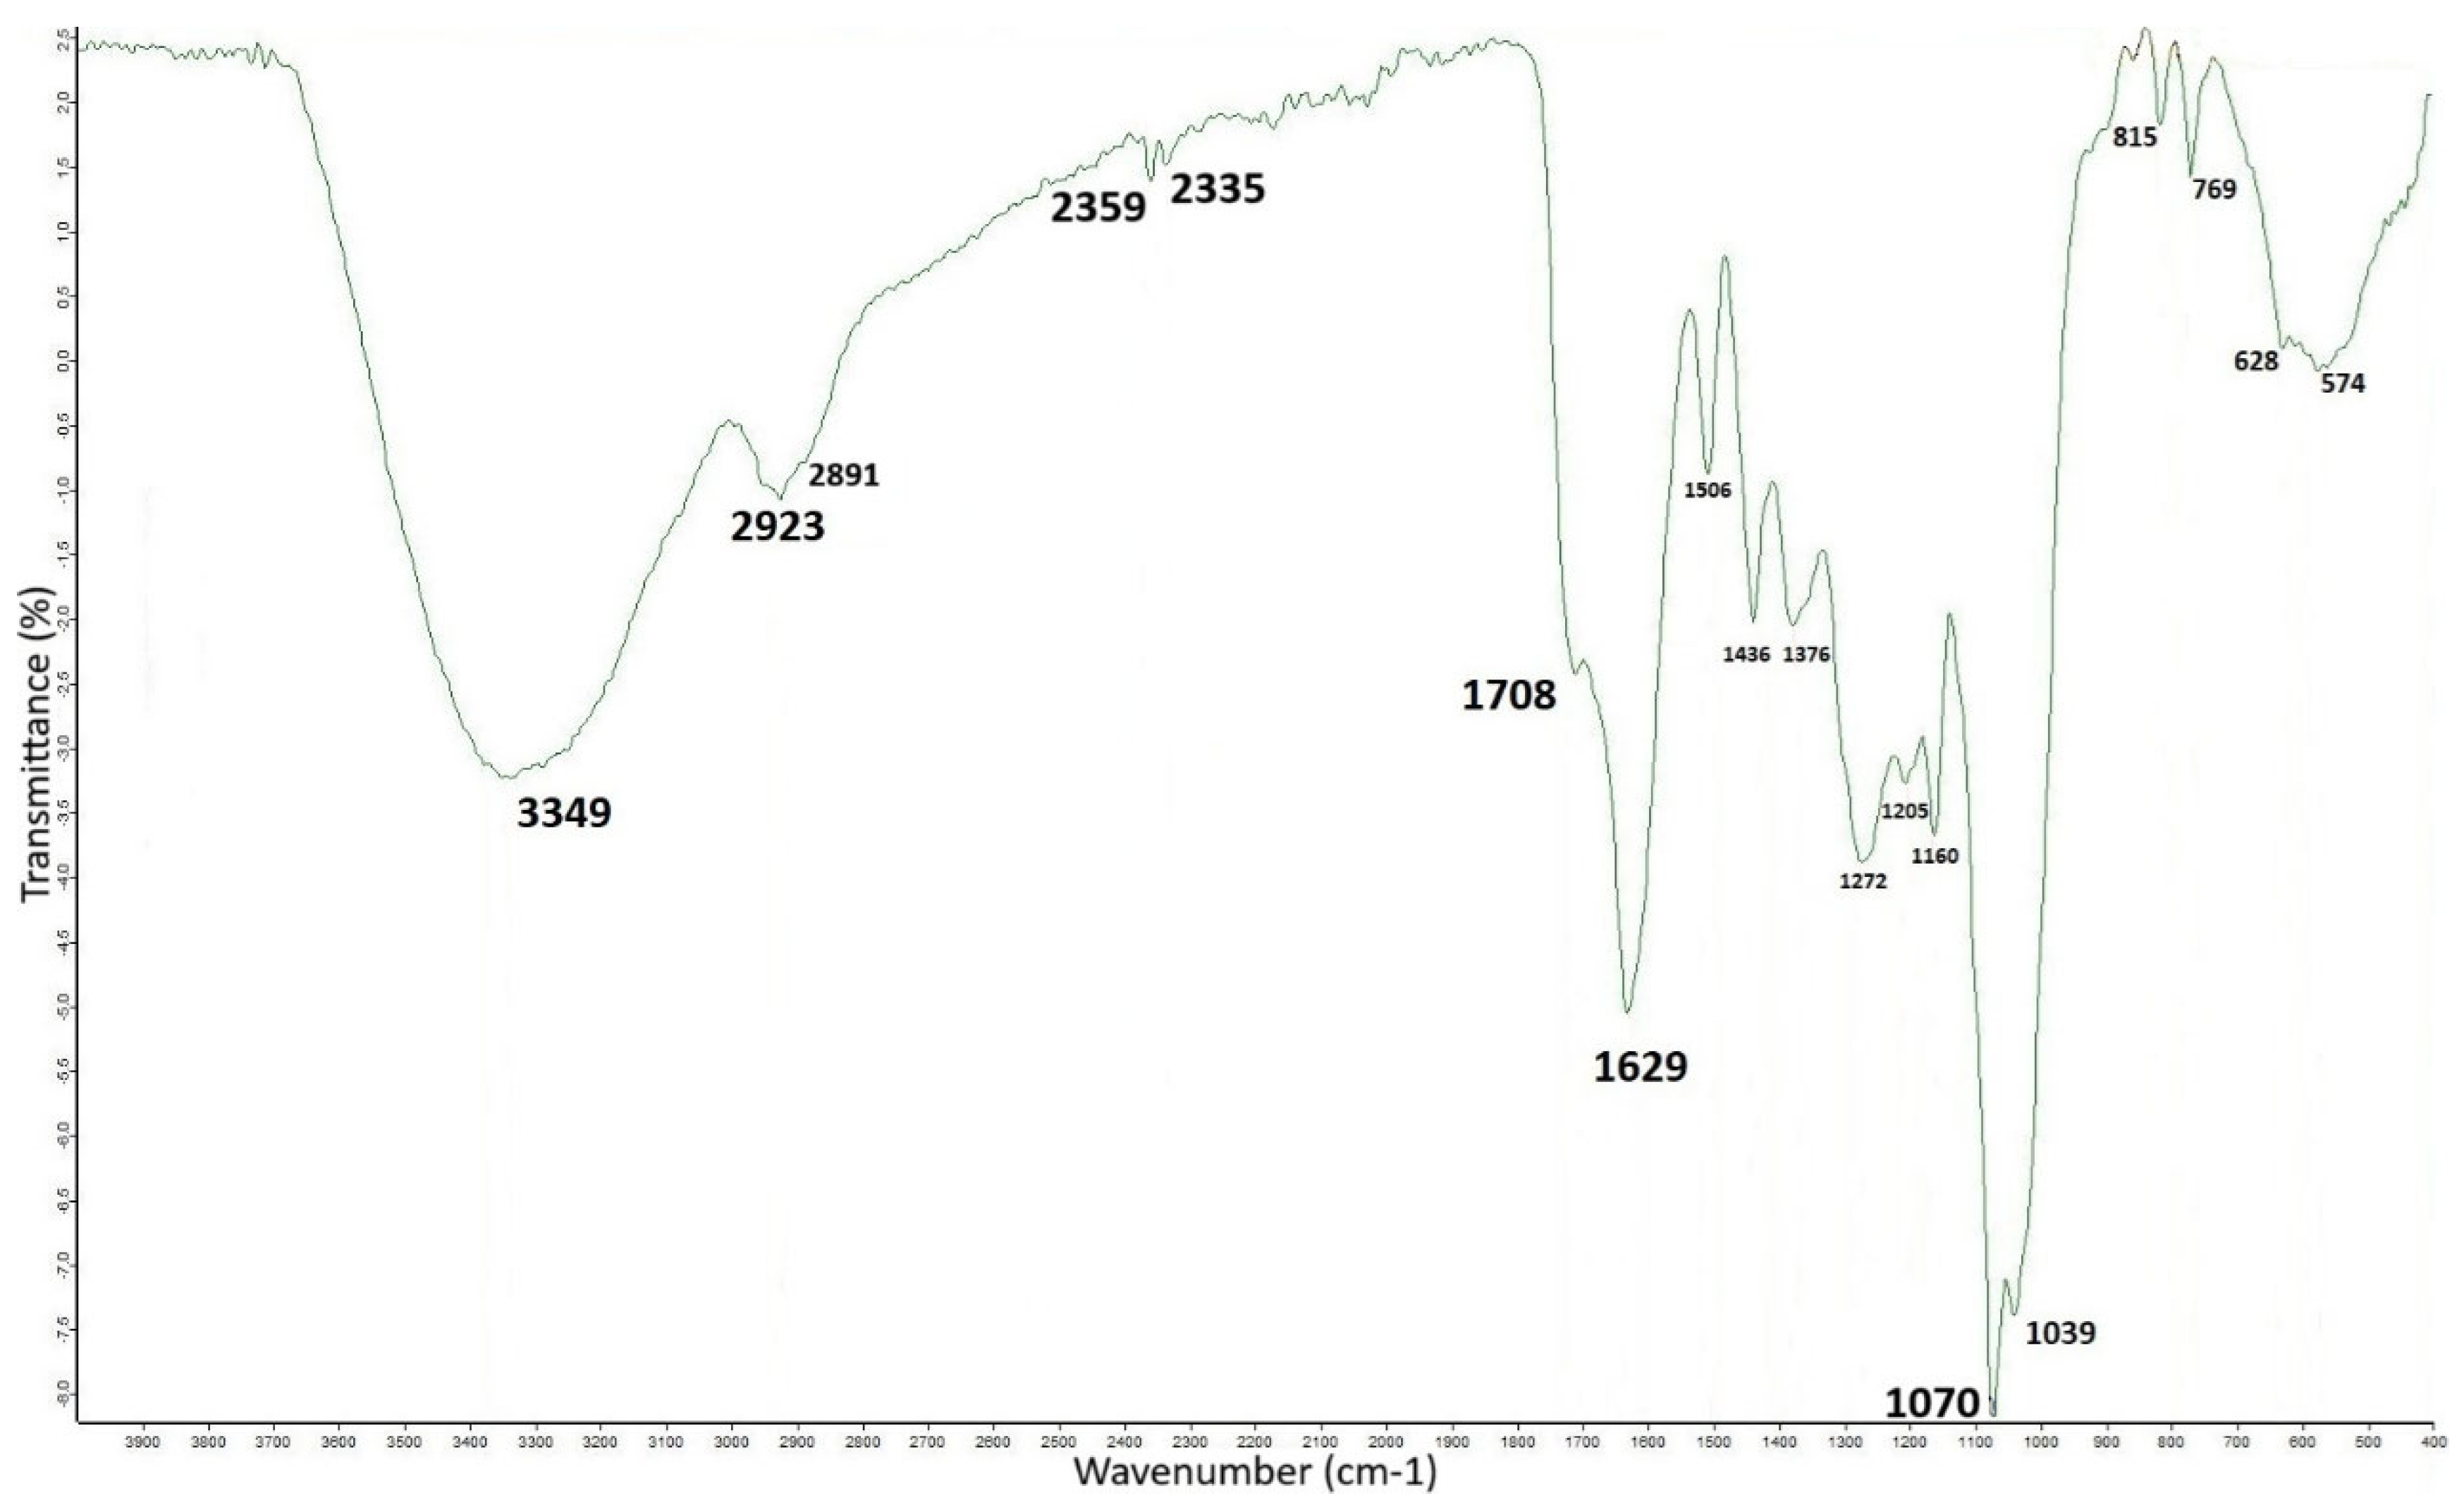
Table 1.
Content expressed in percentage of phenols, polysaccharides, and proteins and elemental chemical composition of the complex polymer OMW-2000XAD.
Table 1.
Content expressed in percentage of phenols, polysaccharides, and proteins and elemental chemical composition of the complex polymer OMW-2000XAD.
| Organic component | Element | % (g/100 g) |
|---|---|---|
| Phenols | 89.8 ± 0.34 | |
| Polysaccharides | 16.1 ± 0.5 | |
| Protein | 10.3 ± 0.1 | |
| C1 | 46.31 ± 0.19 | |
| N | 1.64 ± 0.01 | |
| Na2 | 0.03 ± 0.01 | |
| Mg | 0.13 ± 0.01 | |
| P | 0.03 ± 0.01 | |
| S | 0.75 ± 0.02 | |
| K | 0.73 ± 0.02 | |
| Ca | 0.34 ± 0.01 | |
| Fe | 0.03 ± 0.01 | |
| Cu | 0.03 ± 0.01 | |
| Total metals3 | 1.29 |
1 Determined by a CHN analyser. 2 Determined by ICP-MS. 3 Excluding P and S. 4 Standard error of the mean (n =3).
Table 2.
Sugar and amino acid compositions of OMW-2000XAD determined by GC and HPLC chromatography, respectively.
Table 2.
Sugar and amino acid compositions of OMW-2000XAD determined by GC and HPLC chromatography, respectively.
| Sugar | % (referred to carbohydrate content) |
g/100 g OMW-2000XAD | Amino acid | % (referred to protein content) |
g/100 g OMW-2000XAD |
|---|---|---|---|---|---|
| Glucose | 75.8 | 12.25 ± 0.111 | Cysteine (Cys) | 16.6 | 1.71 ± 0.04 |
| Arabinose | 6.8 | 1.11 ± 0.02 | Glutamic (Glu) | 12.4 | 1.27 ± 0.03 |
| Rhamnose | 5.6 | 0.91 ± 0.02 | Aspartic (Asp) | 10.9 | 1.13 ± 0.01 |
| Galactose | 5.0 | 0.76 ± 0.01 | Glycine (Gly) | 10.5 | 1.08 ± 0.02 |
| Mannose | 3.7 | 0.58 ± 0.01 | Serine (Ser) | 7.3 | 0.75 ± 0.01 |
| Xylose | 3.1 | 0.49 ± 0.01 | Tryptophan (Trp) | 6.9 | 0.71 ± 0.05 |
| Alanine (Ala) | 5.6 | 0.58 ± 0.02 | |||
| Leucine (Leu) | 5.5 | 0.57 ± 0.01 | |||
| Threonine (Thr) | 5.3 | 0.54 ± 0.03 | |||
| Arginine (Arg) | 4.4 | 0.45 ± 0.01 | |||
| Phenylalanine (Phe) | 3.9 | 0.40 ± 0.02 | |||
| Valine (Val) | 3.7 | 0.38 ± 0.01 | |||
| Isoleucine (Ile) | 2.8 | 0.28 ± 0.01 | |||
| Tyrosine (Tyr) | 1.9 | 0.20 ± 0.01 | |||
| Histidine (His) | 1.1 | 0.11 ± 0.01 | |||
| Lysine (Lys) | 0.6 | 0.04 ± 0.01 | |||
| Methionine (Met) | 0.3 | 0.06 ± 0.01 | |||
| Proline (Pro) | 0.3 | 0.03 ± 0.01 | |||
| Total | 100 | 16.1 | Total | 100 | 10.3 |
1 Standard error of the mean (n =3).
Table 3.
Main molecular ions and their fragments detected in the hydrolysates with 4 M NaOH and 6 M HCl of OMW-2000XAD by HPLC-DAD-ESI-Qq-TOF (negative mode). The identification of phenolic compounds was tentatively confirmed by comparison with the data reported in literature.
Table 3.
Main molecular ions and their fragments detected in the hydrolysates with 4 M NaOH and 6 M HCl of OMW-2000XAD by HPLC-DAD-ESI-Qq-TOF (negative mode). The identification of phenolic compounds was tentatively confirmed by comparison with the data reported in literature.
| tr (min) | [M-H]- m/z | Fragment ions m/z | UVmax (nm) | Compound | Hydrolysate 4 M NaOH | Hydrolysate 6 M HCl | Ref. |
|---|---|---|---|---|---|---|---|
| 7.64 | 331.0026 (4.5) | 219.0523 (6.8) 153.0204 (100) 109.0287 (59.2) |
207, 217, 260, 294 | 1* - Unknown | + | + | - |
| 10.05 | 137.0252 (100) | - | 228, 280 | 2 - Tyrosol | + | - | [49] |
| 11.44 | 293.1230 (5.9) | 213.0778 (18.0) 137.0253 (100) |
224, 283, 311 | 12 - Unknown | - | + | [50] |
| 12.19 | 151.0412 (100) | 109.0289 (3.8) | 200, 230, 276, 306 | 3 – Vanillin | + | - | [51] |
| 13.29 | 213.0774 (44.8) | 151.0406 (100) | 207, 228, 275, 306 | 13 - Elenolic acid derivative | - | + | [5] |
| 14.15 | 179.0361 (68.1) | 135.0462 (100) | 218, 323 | 4 - Caffeic acid | + | + | [48] |
| 16.64 | 317.0292 (20.6) | 165.0200 (100) 121.0298 (38.5) |
209 | 5 - Unknown | + | + | - |
| 19.12 | 221.0388 (4.4) | 215.0927 (12.3) 187.0176 (100) 135.0463 (75.9) |
200, 281 | 14 - Unknown | - | + | - |
| 19.26 | 163.0406 (21.8) | 119.0507 (100) | 227, 310 | 6 - p-Coumaric acid | + | - | [52] |
| 20.08 | 313.0741 (11.7) | 269.0867 (45.6) 179.0358 (100) 147.0113 (13.0) |
310 | Caffeic acid (dimers C-C and C-O type) | + | - | [48] |
| 20.80 | 341.1203 (58.9) | 179.0327 (100) 135.0076 (1.5) |
218, 262, 296 | 15 – Caffeoyl hexoside | - | + | [53] |
| 21.07 | 193.0490 (54.0) | 178.0285 (91.0) 134.0379 (100) |
218, 238, 323 | 7 - t-Ferulic acid | + | - | [52] |
| 22.42 | 225.0756 (100) | - | - | 16 - Desoxyelenolic acid | - | + | [5] |
| 23.76 | 359.1110 (5.0) | 203.0354 (100) 159.0460 (84.0) |
232, 333 | 8 - Syringic acid hexoside | + | - | [54] |
| 25.58 | 491.0932 (3.5) | 397.0186 (5.3) 279.0403 (26.9) 203.0289 (37.5) 170.9856 (100) |
208, 270 | 17 – Unknown | - | + | - |
| 26.11 | 455.1347 (45.9) | 303.0822 (4.2) | - | Hydroxytyrosol [(2AH + A) – 2H] | - | + | [48] |
| 27.17 | 325.0701 (11.3) | 283.0618 (14.9) 197.0821 (22.9) 153.0928 (100) |
267 | 9 – Unknown | + | - | - |
| 27.35 | 365.1202 (4.9) | 229.1080 (100) 199.0902 (48.2) 153.0931 (92.6) 123.0802 (35.6) |
- | 18 - Dimethyl acetal of oleacein | - | + | [55] |
| 28.27 | 221.0780 (100) | 161.0246 (16.0) | 205 | 19 – Unknown | - | + | - |
| 31.82 | 411.0476 (2.4) | 329.0993 (35.6) 257.0339 (100) 189.0515 (17.2) 147.0088 (3.4) |
205, 251 | 20 – Unknown | - | + | - |
| 33.25 | 439.1962 (8.5) | 355.0806 (44.0) 325.0703 (79.5) 281.0812 (24.7) 159.0461 (100) |
229 | 10 – Unknown | + | - | - |
| 34.54 | 651.1514 (2.9) | 325.0699 (100) 281.0811 (19.5) 237.0917 (19.2) |
- | p-Coumaric acid (tetramer) | + | - | [48] |
| 35.27 | 569.0031 (4.2) | 411.1591 (10.2) 267.0866 (30.7) 235.0603 (100) 197.0599 (8.4) |
230, 316 | 21 – Unknown | - | + | - |
| 35.67 | 495.1771 (25.7) | - | - | Dihydrocaffeic acid [(2AH + A) – 2H] | + | - | [48] |
| 36.52 | 437.1101 (3.7) | 393.0810 (7.2) 301.0697 (44.2) 249.0753 (100) 225.0541 (29.9) |
226, 280 | 22 - Unknown | - | + | - |
| 36.87 | 949.6636 (2.9) | 549.1617 (100) 473.0985 (2.7) 381.0401 (4.3) 287.0343 (3.0) 257.0800 (9.3) 225.0548 (2.9) |
229, 316 | 23 – Unknown | - | + | - |
| 38.94 | 229.1034 (3.4) | 177.0521 (100) 141.0749 (10.4) 123.0090 (1.0) |
202, 291 | 24 - 3,4-Dihydroelenolic acid (demethylated) | - | + | [56] |
| 39.05 | 519.3151 (4.6) | 351.0863 (100) 295.0261 (8.4) |
230, 310 | 11 - Unknown | + | - | - |
| 40.20 | 437.1204 (6.5) | 377.0486 (2.5) 257.0807 (60.0) 213.0917 (36.3) 181.0657 (100) |
227 | 25 - Unknown | - | + | - |
| 41.13 | 494.0700 (7.8) | 473.0988 (7.8) 347.0385 (19.2) 263.0887 (100) 219.0811 (18.6) 171.0434 (15.6) 113.0862 (4.0) |
240, 280, 303 | 26 - Unknown | - | + | - |
| 42.38 | 507.0619 (23.9) | 383.0416 (10.7) 337.0721 (7.9) 249.0702 (24.3) 205.0826 (100) |
- | 27 -Unknown | - | + | - |
| 42.66 | 257.0814 (38.8) | 225.0556 (2.5) 213.0905 (3.8) 181.0659 (100) 153.0716 (8.5) |
225 | 28 - Hydroxyelenoic acid | - | + | [50] |
| 44.14 | 265.1498 (2.4) | 213.0095 (100) | 208, 231 | 29 - Xanthonic acid | - | + | [50] |
Intensities relative to the base peak are given in parentheses. * Peak number assigned in the chromatograms from Figures 5a and 5b.
Disclaimer/Publisher’s Note: The statements, opinions and data contained in all publications are solely those of the individual author(s) and contributor(s) and not of MDPI and/or the editor(s). MDPI and/or the editor(s) disclaim responsibility for any injury to people or property resulting from any ideas, methods, instructions or products referred to in the content. |
© 2025 by the authors. Licensee MDPI, Basel, Switzerland. This article is an open access article distributed under the terms and conditions of the Creative Commons Attribution (CC BY) license (http://creativecommons.org/licenses/by/4.0/).
Copyright: This open access article is published under a Creative Commons CC BY 4.0 license, which permit the free download, distribution, and reuse, provided that the author and preprint are cited in any reuse.


