Submitted:
28 May 2025
Posted:
28 May 2025
You are already at the latest version
Abstract
Accurate and reliable detection of coal mine gases is the key to ensuring the safe service of coal mine production. However, the baseline of infrared absorption spectrum is easily disturbed by the complex underground environment, while the variety of gas species and uneven distribution of concentrations make it difficult to achieve precise and reliable online analysis using existing quantitative methods. This paper aims at the poor reliability and accuracy of infrared spectroscopy in the detection of coal mine gases. It utilizes the adaptive smoothness parameter penalized least squares method to correct the drifted spectra. Subsequently, based on the infrared spectral distribution characteristics of mine gases, they can be classified into gases with mutually distinct absorption peaks and gases with overlapping absorption peaks. For gases with distinct absorption peaks, three spectral lines including the absorption peak and its adjacent troughs are selected for quantitative analysis. Spline fitting, polynomial fitting, and other curve fitting methods are used to establish a functional relationship between characteristic parameters and gas concentration. For gases with overlapping absorption peaks, a wavelength selection method based on the impact value of variables and population analysis was applied to select variables from the spectral data. The selected variables are then used as input features for building a model with a BP neural network. Finally, the proposed method was validated using standard gases. The experimental results show that the reference error for 10 coal mine gases is less than 3‰F.S., and the relative error is less than 10%. These results demonstrate that the proposed infrared spectral quantitative analysis method can effectively analyze mine gases and achieve good predictive performance.
Keywords:
coal mine gases
; baseline correction
; variables selection
; quantitative analysis
1. Introduction
Coal mine gas exhibits essentiality, disaster-inducing potential, and early-warning characteristics. The accurate and reliable analysis of coal mine gas composition and concentration enables timely early warning of potential safety hazards in coal mines. This provides precise and prompt information regarding environmental explosion risks for rescue operations, fundamentally preventing secondary and derivative disaster incidents. Such analysis holds significant theoretical and practical importance in ensuring the safe production of coal mines [1,2,3,4,5]. Fourier Transform Infrared (FTIR) spectroscopy offers rapid analysis, a wide range of detectable substances, and non-destructive measurement capabilities, making it an essential tool for both qualitative and quantitative analysis across various fields, including pharmaceuticals, chemical engineering, biotechnology, and environmental protection [6,7,8,9,10,11,12]. At present, numerous experts, research institutions, and even governments have devoted significant effort to its research, resulting in a series of important achievements. Goldschmidt et al [13]. employed artificial neural networks to perform quantitative analysis of N2O and CO gases, achieving a coefficient of determination of 0.99997 for N2O concentration prediction and 0.99987 for CO concentration prediction. We have also tried to analyze coal mine gases [14]. Firstly, a Tikhonov regularization was applied to select the spectral variables, and then established models using both BP neural networks and multiple linear regression. Furthermore, an information fusion approach was employed to predict the concentrations of five gases: methane, ethane, propane, iso-butane, and n-butane. Shoukat et al. conducted quantitative analysis of water vapor and carbon dioxide using the partial least squares (PLS) algorithm [15]. The results confirmed that infrared spectroscopy can be effectively used for both qualitative and quantitative analysis of various compounds. In order to tackle the problem of spectral overlap in alkane gases, Zhongbing Li et al. developed a quantitative analysis technique based on adaptive moving window partial least squares (AMW-PLS) modeling and applied it to alkane gas analysis [16]. However, based on preliminary underground trial operations, the current research and application of infrared spectroscopy in the field of online coal mine gas analysis are still in the early stages of development, facing several key difficulties and challenges. Firstly, the underground working environment is characterized by complexity and time variability. In particular, after prolonged operation, the spectrometer is susceptible to environmental influences, leading to spectral baseline drift. Secondly, the wide variety of coal mine gases, uneven concentration distributions, and the presence of cross-interference among gases result in poor accuracy of the analysis results. This study selects methane, ethane, propane, iso-butane, n-butane, sulfur hexafluoride, and carbon monoxide as representative gases characteristic of coal mines to overcome the aforementioned challenges. First, spectral data of underground gases are obtained using an infrared spectrometer. Then, a calibration of the drifted spectra is performed using an adaptive penalty parameter method. Based on the infrared spectral distribution characteristics of mine gases, they can be classified into gases with mutually distinct absorption peaks and gases with overlapping absorption peaks. For gases with distinct absorption peaks, three spectral lines including the absorption peak and its adjacent troughs are selected for quantitative analysis. Spline fitting, polynomial fitting, and other curve fitting methods are used to establish a functional relationship between characteristic parameters and gas concentration. For gases with severely overlapping absorption spectra, a flexible shrinkage variable selection method based on a combination of frequency and regression coefficients was used. The selected variables were then used as input features for constructing a BP neural network model. To validate the proposed method, standard gas samples were used for verification.
2. Method
For multi-component gas analysis, analytical models for each gas must be established using calibration samples prepared by analytical instruments. Initially, a Fourier Transform Infrared Spectrometer (FTIR) is employed to acquire data on coal mine gases, and then the initial data is corrected for spectral baseline shift. Subsequently, based on the distribution pattern of coal mine gas, the gas is categorized into distinct absorption peak intervals and spectral overlapping absorption peak intervals. For gases with distinct absorption peaks, three spectral lines including the absorption peak and its adjacent troughs are selected for quantitative analysis. For the overlapping absorption regions, characteristic variables were extracted. Subsequently, a quantitative analysis model was established for each target gas. Finally, standard gases with known concentrations were used to verify the accuracy of the quantitative analysis models.
2.1. Baseline Drift Correction
Spectral baseline drift occurs in gas analysis using Fourier Transform Infrared (FTIR) spectroscopy due to ambient environmental variations during spectral acquisition. For instance, baseline drift of varying magnitudes will occur when the light source temperature undergoes fluctuations. Similarly, angular deviation of the moving mirror during spectral scanning of the sample will induce baseline drift in the interferogram. If the baseline shifts and distorts, the absorbance values of the corresponding spectral lines will change to varying degrees. The absorbance value of a spectral line is a key factor in the quantitative analysis of mixed gases, which leads to inaccurate or even wrong quantitative analysis. Therefore, it is critical to correct the baseline drift and identify the distorted spectrum. In this paper, the adaptive smoothness parameter penalized least squares method (asPLS) was used to carry out baseline correction for absorption spectra of coal mine gases [17]. The baseline correction process is illustrated in Figure 1.
2.2. Spectral Variables Selection Method
The resolution of the spectrometer was set to 1 cm⁻¹, and the wave number scan range was 400–4000 cm⁻¹, resulting in 3601 spectral lines per sample. Inevitably, these spectral variables include irrelevant or even interfering variables. When performing quantitative analysis of gases with distinct absorption peaks, satisfactory results can be achieved by selecting a single spectral line at the main absorption peak and applying linear or nonlinear fitting methods. However, when there is significant overlap in the absorption spectra between gases, randomly selecting a few variables not only increases cross-sensitivity to other components but may also reduce the prediction accuracy for the target component. Therefore, spectral variable feature selection is crucial for reducing model computation time, improving prediction accuracy, and minimizing cross-sensitivity to other components. In this study, based on the infrared spectral distribution characteristics of coal mine gases, the entire absorption spectrum was divided into regions of distinct absorption peaks and overlapping absorption peaks. For the overlapping absorption regions, variable selection was carried out using a wavelength selection method based on the Impact Value of Variables and Population Analysis (IVPA) [18]. Figure 2 shows the scheme of IVPA algorithm.
The spectral data obtained by scanning is represented by matrix Xn×p, where n is the number of samples and p is the number of spectral lines. yn×m is the analyte concentration information corresponding to n samples. The infrared quantitative analysis model established by PLS can be expressed as follows:
In the aforementioned formula, β denotes the regression coefficient vector defined as β = [β₁, β₂, ..., βₚ]ᵀ, where y represents the concentration vector of the i-th component during analysis (with i ≤ m), and e corresponds to the random error vector. Multiply one of the variables by a coefficient ɑ1 smaller than 1 to obtain a new variable V1, then multiply by a coefficient ɑ2 larger than 1 to obtain a variable V2, and establish PLS models for the obtained new variables respectively to obtain corresponding cross-validation root mean square errors and The process loops p times so that the influence value of each sample variable can be calculated from equation (2):
2.3. Model Analysis
Based on the infrared spectral absorption characteristics of coal mine gases, the entire spectrum is categorized into gases with distinct absorption peaks and gases exhibiting spectral overlap. For the target gas with a distinct absorption peak, three spectral lines at the distinct absorption peak and trough are selected for quantitative analysis, and the function between characteristic quantity and concentration is obtained by spline fitting and polynomial curve fitting methods. Numerous advanced approaches have been developed for analyzing severely overlapped absorption spectra, including Partial Least Squares (PLS) [19], Self-Modeling Curve Resolution (SMCR) [20], Support Vector Machines (SVM) [21], and Neural Networks (NN) [22]. In this paper, the NN with two layers of nodes is adopted as the analysis model for analyzing each component. The wavelength variables selected in Section 2.2 serve as inputs to the Backpropagation (BP) neural network, with the output layer generating concentration predictions for target coal mine gases.
3. Experiment
The instrument utilized to analyze coal mine gases is the Spectrum Two FTIR model manufactured by Spectrum Corporation. wherein the infrared light source is a carbon-silicon rod. And the complete radiation power was measured with a standard deuterated trinitrate triglycine (DTGS) detector. The spectrometer was configured with the following parameters: scanning range of 400-400 cm⁻¹, wave number resolution of 1 cm⁻¹, and absorbance scanning type. To minimize random noise interference, the number of scans per sample was set at 8. Due to its favorable linearity, the selected apodization function is the Norton-Beer medium function.
The experimental protocol is as follows:
Step1, before spectral scanning, the infrared spectrometer is preheated for 30 minutes, waiting for the temperature of the light source to stabilize.
Step2, introduce nitrogen with a concentration of 99.999% into the gas cell for about 3 minutes. At this time, click the scan background button to scan the background (nitrogen) spectrum. When the background spectrum changes little after two scans, stop scanning the background spectrum and store the background spectrum data into the database.
Step3, inject the standard gas to be detected into the gas cell, and keep the gas flow rate at 1.5 L/min by adjusting the knob of the pressure-reducing valve. After waiting 1 minute, click the Scan Sample button in the analysis software. After waiting for 20 seconds, the analysis software completes a measurement and displays the result on the main interface.
Step4, record the analysis results of each measurement, repeat 10 sets of scanning for standard gas, and calculate the repeatability of the analyzer with the analysis results of 10 sets of data. The test results are shown in Table 5-5 and Table 5-6. The significant bit of the analysis result data is reserved to the 0.1 ppm level. The experimental procedure is shown in Figure 3.
4. Results and Analysis
4.1. Spectral Baseline Drift Correction
The absorbance of the five gases methane (CH₄), ethane (C₂H₆), propane (C₃H₈), iso-butane (i-C₄H₁₀), and n-butane (n-C₄H₁₀) is shown in Figure 4. It can be seen from Figure 4 that the absorption peak of the five gases is the highest near 3000 wavenumbers, which is the main absorption peak of alkane gases, and in the range of 1200-1700 cm⁻¹, it is the secondary absorption peak of alkane gases. It can be seen that the spectra overlap between the five gases is serious, whether in the main absorption peak or in the secondary absorption peak.
The spectral baselines of the five gases displayed in the figure above have shifted to different extents. Following prior research findings [16], spectral data underwent baseline correction utilizing a penalized least squares approach, resulting in the presentation of the baseline-corrected spectra in Figure 5.
4.2. Results of Characteristic Variables Extraction
In order to evaluate the performance of the proposed algorithm, the variables selected for the IVPA method are shown in Figure 6.
As can be seen from the figure, IVPA selects fewer variables, and the selected variables cover the main region of the absorption peak of iso-butane. Using the spectra of five alkane gases with a concentration of 0.05% as input variables, a model was established to predict the concentrations of the five gases according to the variables selected by the IVPA method. The prediction results are shown in Table 1. The table indicates that IVPA shows the highest cross-sensitivity to n-butane, which is attributed to the similar molecular structures of n-butane and iso-butane, resulting in similar absorption spectral shapes. On the contrary, since the minimum absorbance of methane is less than 300 cm⁻¹, the cross-sensitivity to methane is relatively low. The variables selected by the IVPA method are mainly within the range of less than 300 cm⁻¹. It is worth noting that IVPA has the most accurate prediction for iso-butane, with a maximum cross-sensitivity of 1.02% and a minimum cross-sensitivity of 0.11% for the other four gases. These results indicate that this method can effectively extract and analyze variables with significant spectral overlap.
4.3. Quantitative Analysis Model of Gases with Distinct Absorption Peaks
For gases with distinct absorption peaks, such as carbon monoxide, carbon dioxide, sulfur hexafluoride, ethylene, acetylene, and propylene, the distinct absorption peaks and troughs are selected for quantitative analysis. The absorbance spectra of the six gases are shown in Figure 7. In the figure, the concentration of sulfur hexafluoride is 0.05%, the concentration of carbon monoxide is 0.7%, the concentration of carbon dioxide is 0.5%, and the concentration of the other three gases is 0.3%.
It can be seen from Figure 7 that distinct absorption peaks can be found for all six gases. It can also be seen that when SF₆ approaches 1000 cm⁻¹, the absorbance value is the largest. At the same concentration, the absorption coefficient of SF₆ is one order of magnitude larger than that of the other five gases. Therefore, among the six gases, the detection limit of SF₆ is the lowest. However, the absorption spectrum of SF₆ overlaps with C2H4 and C3H6 near 1000 cm⁻⁶. Fortunately, SF₆ can find a relatively strong absorption peak at 614 cm⁻¹. Therefore, the absorbance value at 614 cm⁻¹ is selected as the characteristic variable of SF₆. Taking SF₆ as an example, six quantitative methods for gases with distinct absorption peaks are introduced. Three spectral lines at the trough of the distinct absorption peak of SF₆ at 614 were selected as shown in Figure 8.
As can be seen from Figure 7, the selected three spectral lines are exactly equally spaced, so the characteristic variable expression of SF6 is obtained as follows:
In the formula, among them, A represents the absorbance. The subscript of A is wavenumber. For example, A614 represents the absorbance value when the wavenumber is 614 cm⁻¹. It can be seen from Equation (3) that the selected characteristic variables will not be affected by drift phenomena such as baseline horizontal translation and linear tilting, further improving the stability of the system. This is because the distances between the three selected spectral lines are equal. When the baseline moves or tilts, the first term and the second term in Equation (3) have opposite signs and equal amplitudes, which can cancel each other out. If the distances between the three selected spectral lines are not equal, the selected spectral lines are 610, 614, and 616 cm⁻¹, respectively. The following expression can be constructed:
To verify the performance of the eigenvariables selected for SF6, the spectra of 11 target gases with a concentration of 0.05% were substituted into Eq. (4) to obtain the vectors for each concentration: [-0.00024, -0.00009, -0.00001, -0.00017, -0.00004, 0.00033, -0.00022, -0.00025, 0.00004, -0.00016, 0.0676]. The corresponding gases are methane, ethane, propane, n-butane, iso-butane, carbon monoxide, carbon dioxide, ethylene, acetylene, propylene, and sulfur hexafluoride, respectively. It can be seen that the characteristic variable of SF6 has the highest sensitivity to carbon monoxide, which is 0.49%. The maximum cross-sensitivity of SF6 to the other 10 gases is less than 0.5%, which indicates that the cross-sensitivity of the selected characteristic quantity to other gases is low, so this characteristic quantity can be selected to analyze SF6. Meanwhile, the spectra of ten single-component SF6 with volume percentage concentrations of 0.0005%, 0.001%, 0.002%, 0.005%, 0.01%, 0.02%, 0.05%, 0.1%, 0.2% and 0.5% were substituted into formula (4), and the corresponding eigenvalue vectors were obtained as 0.00085, 0.0017, 0.0034, 0.0082, 0.0160, 0.0307, 0.0676, 0.1127, 0.1811, and 0.2246. At this point, curve-fitting methods such as spline fitting, polynomial fitting, etc. can be used to obtain the function between the characteristic quantity and concentration.
Figure 9 shows the results of fitting characteristic quantity and concentration by three methods. It can be seen that the fourth-order polynomial and cubic spline function can be very good curve fitting, but the results obtained by quadratic polynomial fitting are worse than those of the fourth-order polynomial and cubic spline function. Therefore, a polynomial of degree 4 was chosen for quantitative analysis of SF6, and its polynomial function expression of degree 4 is as follows:
The spectrum of the unknown gas is used to extract the characteristic quantity using equation (3), and then the SF6 concentration can be obtained by substituting the characteristic quantity into equation (5). In addition, in the actual analysis, the corresponding concentration information can be obtained according to the characteristic quantity of each gas, and then the obtained characteristic quantity is subtracted from the product of cross sensitivity and gas concentration (i.e., the compensation method), and then the compensated characteristic quantity is substituted into Eqn(5), which can obtain a more accurate analysis result. The repeatability test results for gases with distinct absorption peaks are shown in Table 2.
4.3. Quantitative Analysis of Gases with Severe Spectral Overlap
For gases with severe spectral overlap, such as methane, ethane, propane, iso-butane, and n-butane alkane gases, their spectral data were first feature-selected using the variable selection method mentioned in Section 2.2, and then the selected variables were modeled and analyzed using four methods, namely, PLS, BPNN, SVM, and LSSVM, respectively, and a model with the best prediction performance was selected from them. The results of the gas repeatability test for spectral overlap are shown in Table 3.
As can be seen from Table 2 and Table 3, when the gas concentration is low, the relative standard deviation value obtained by the analyzer is relatively large; for example, when the content of acetylene is 0.0005% in the standard gas, the calculated relative standard deviation reaches 3.54%. This is because when the gas concentration is low, the average concentration of the gas obtained will also be very low, and the relative standard deviation is the ratio of the standard deviation to the average value, so the relative standard deviation will be larger when the concentration of the gas is measured at a lower level. The relative standard deviation will be larger for lower gases. It can also be seen that the standard deviation of the 10 gases is less than 10 ppm except for carbon dioxide. The standard deviation for carbon dioxide is 77.07 ppm. This is because the standard gas has the highest concentration of carbon dioxide at 20,000 ppm (2%). 77.07 ppm is a very small value in relation to 20,000 ppm, and the relative standard deviation of carbon dioxide is only 0.36%. Thus, these test results indicate excellent repeatability performance of the analyzer. In addition, the errors in the indicated values of the 10 characteristic gases were calculated, and it can be seen that the quoted errors of the 10 characteristic gases are less than 3‰, while the relative errors are less than 10 percent.
5. Conclusion
When using Fourier Transform Infrared (FTIR) spectroscopy to quantitatively analyze alkane gases, the large variety of analytes and severe spectral overlap limit the accuracy and computational efficiency of the quantitative analysis results significantly. Based on the types of gases found in coal mines and their infrared spectral distribution characteristics, this paper proposes a quantitative analysis method for coal mine gases. The method was validated using standard gases, and the experimental results show that it can effectively extract variables from severely overlapping spectra, demonstrating practical application value.
5. Conclusion
In this study, the origins of the spectral baseline drift and distortion were analyzed and simulated using MATLAB. The results show that when the light source temperature and moving mirror tilt angle changed constantly, the spectral baseline drifted, whereas when they changed randomly, the spectral baseline was distorted. The change in reflectance of the beam splitter caused the baseline to shift upward or downward. The change in laser wavelength and the missing interference signal also caused the baseline distortion. To address the problem of spectral baseline drift, a baseline correction method based on BTM was also proposed. The results of experiments performed on the methane spectrum confirm that the proposed method outperformed the improved modified multi-polynomial fitting and IA methods. An identification and treatment approach based on the shape and distribution of the baseline has been reported in our previous work to address the problem of spectral baseline distortion [19].
Author Contributions
For research articles with several authors, a short paragraph specifying their individual contributions must be provided. The following statements should be used “Conceptualization, F.Z. and Y.Z.; methodology, F.Z.; software, Y.Z.; validation, C.C. and L.L.; formal analysis, S.Z.; investigation, L.L.; resources, Y.Z.; data curation, Y.Z.; writing—original draft preparation, Y.Z.; writing—review and editing, F.Z.; visualization, X.Z.; supervision, C.C.; project administration, Y.Z.; funding acquisition, C.C. All authors have read and agreed to the published version of the manuscript.
Funding
This research was funded by the National Natural Science Foundation of China (Grant No. 62303367) and Key Research and Development Program of Shaanxi (Program No. 2024GXZDCYL-03-06).
Informed Consent Statement
Not applicable.
Conflicts of Interest
The authors declare no conflict of interest.
References
- Liang, Y.; Tian, F.; Feng, W.; Shao, Z.; Meng, X.; Chen, C. Research progress of coal mine gas detection technology in China. J. China Coal Soc. 2021, 46, 1701–1714. [Google Scholar]
- Zhao, Z.; Liang, Y.; Jin, L.; Song, S.; Wang, J.; Wang, J. Research progress of FTIR detection technology and its application in coal mine. Saf. Coal Mines. 2022, 53, 74–80. [Google Scholar]
- Loof, D.; Thüringer, O.; Zielasek, V.; Pranti, A. S.; Lang, W.; Bäumer, M. In-operando FTIR study of ligand-linked Pt nanoparticle networks employed as catalysts in hydrogen gas micro sensors. Nanoscale Adv. 2024, 6, 1436–1446. [Google Scholar] [CrossRef]
- Li, X.; Cao, Z.; Xu, Y. Characteristics and trends of coal mine safety development. Energy Sources, Part A. 2021, 1–19. [Google Scholar] [CrossRef]
- Peng, Y.; Yang, L.; Ju, X.; Liao, B.; Ye, K.; Li, L.; Cao, B.; Ni, Y. A comprehensive investigation on the thermal and toxic hazards of large format lithium-ion batteries with LiFePO4 cathode. J. Hazard. Mater. 2020, 381, 120916. [Google Scholar] [CrossRef]
- Fahelelbom, K. M.; Saleh, A.; Al-Tabakha, M. M.; Ashames, A. A. Recent applications of quantitative analytical FTIR spectroscopy in pharmaceutical, biomedical, and clinical fields: A brief review. Rev. Anal. Chem. 2022, 41, 21–33. [Google Scholar] [CrossRef]
- Ye, Q.; Meng, X. Highly efficient authentication of edible oils by FTIR spectroscopy coupled with chemometrics. Food Chem. 2022, 385, 132661. [Google Scholar] [CrossRef]
- Hutchinson, G.; Welsh, C. D.; Burés, J. Use of standard addition to quantify in situ FTIR reaction data. The Journal of organic chemistry. 2020, 86, 2012–2016. [Google Scholar] [CrossRef]
- Berisha, S.; Lotfollahi, M.; Jahanipour, J.; Gurcan, I.; Walsh, M.; Bhargava, R.; Nguyen. H. V.; Mayerich, D. Deep learning for FTIR histology: leveraging spatial and spectral features with convolutional neural networks. Analyst. 2019, 144, 1642–1653. [Google Scholar] [CrossRef]
- Yang, H. Yang, S.; Kong, J.; Dong, A.;Yu,S. Obtaining information about protein secondary structures in aqueous solution using Fourier transform IR spectroscopy. Nat. Protoc. 2015, 10, 382–396. [Google Scholar] [CrossRef]
- Zhao, A.; Tang, X.; Wang, E.; Zhang, Z.; Liu, J. Quantitative Analysis of Transformer Oil Dissolved Gases Using FTIR. Spectrosc. Spectral Anal. 2013, 33, 2407–2410. [Google Scholar]
- Shaltout, A. A.; Seoudi, R.; Almalawi, D. R.; Abdellatief, M.; Tanthanuch, W. Quantitative phase analysis and molecular structure of human gallstones using synchrotron radiation X-ray diffraction and FTIR spectroscopy. Spectrochim. Acta, Part A. 2024, 308, 123777. [Google Scholar] [CrossRef]
- Goldschmidt, J.; Nitzsche, L.; Wolf, S. Lambrecht, A.; Wöllenstein, J. Rapid quantitative analysis of IR absorption spectra for trace gas detection by artificial neural networks trained with synthetic data. Sens. 2022, 22, 857. [Google Scholar] [CrossRef]
- Tang, X.; Li, Y.; Zhu, L.; Zhao, A.; Liu, J. On-line multi-component alkane mixture quantitative analysis using Fourier transform infrared spectrometer. Chemom. Intell. Lab. Syst. 2015, 146, 371–377. [Google Scholar] [CrossRef]
- Shoukat, U.; Baumeister, E.; Knuutila, H. K. ATR-FTIR model development and verification for qualitative and quantitative analysis in MDEA–H2O–MEG/TEG–CO2 blends. Energies. 2019, 12, 3285. [Google Scholar] [CrossRef]
- Li, Z.; Pang, W.; Liang, H.; Chen, G.; Zheng, X.; Ni, P. Multicomponent Alkane IR measurement system based on dynamic adaptive moving window PLS. IEEE Trans. Instrum. Meas. 2022, 71, 1–13. [Google Scholar] [CrossRef]
- Zhang, F.; Tang, X.; Tong, A.; Wang, B.; Wang, J.; Lv, Y.; Tang,C. ; Wang, J. Baseline correction for infrared spectra using adaptive smoothness parameter penalized least squares method. Spectrosc. Lett. 2020, 53, 222–233. [Google Scholar] [CrossRef]
- Zhang, F.; Tang, X.; Tong, A.; Wnag, B.; Tang, C.; Wang, J. A Mid-Infrared Wavelength Selection Method Based on the Impact Value of Variables and Population Analysis. Spectrosc. Spectral Anal. 2021, 41, 1795–1799. [Google Scholar]
- Gianella, M.; Sigrist, M.W. Improved algorithm for quantitative analyses of infrared spectra of multicomponent gas mixtures with unknown compositions. Appl. Spectrosc. 2009, 63, 338–3413. [Google Scholar] [CrossRef]
- Tanabe, A.; Morita, S.; Tanaka, M.; Ozaki, Y. Multivariate curve resolution analysis on the multi-component water sorption process into a poly(2-methoxyethyl acrylate)film. Appl. Spectrosc. 2008, 62, 46–50. [Google Scholar] [CrossRef]
- Duan, X.; Wang, M. Quantitative Analysis of Multi-Component Gases in Underground by Improved PSO-SVM AlgorithmSpectrosc. Spectral Anal. 2019, 39, 2883–2888. [Google Scholar]
- Yang, H.; Griffiths, P. R.; Tate, J. D. Comparison of partial least square regression and multi-layer networks for quantification of nonlinear systems and application to gas phase Fourier transform infrared spectra. Anal. Chim. Acta. 2003, 489, 125–136. [Google Scholar] [CrossRef]
Figure 1.
The flowchart of baseline correction by proposed asPLS.
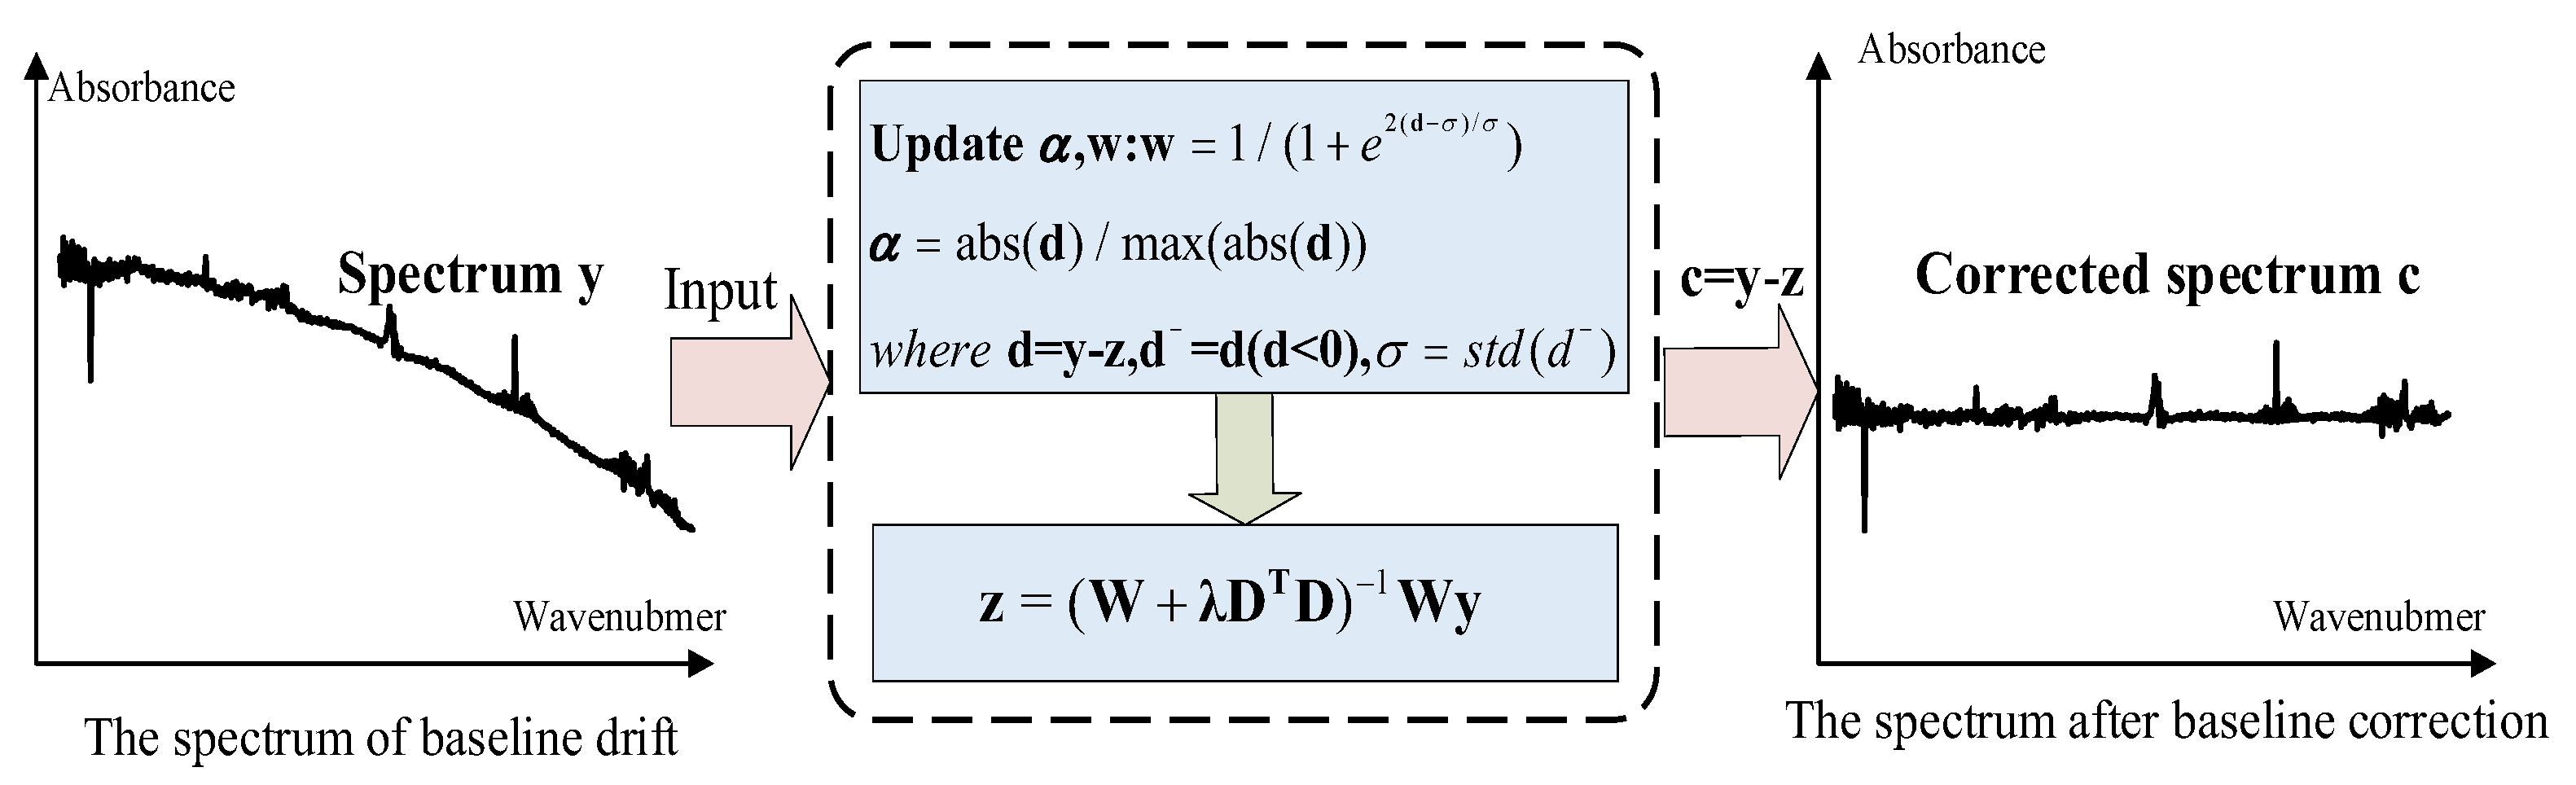
Figure 2.
Flow chart of IVPA algorithm. After N sampling runs, IVPA obtains N subsets of variables and finally choose the subset with the lowest RMSECV value as the optimal one.
Figure 2.
Flow chart of IVPA algorithm. After N sampling runs, IVPA obtains N subsets of variables and finally choose the subset with the lowest RMSECV value as the optimal one.
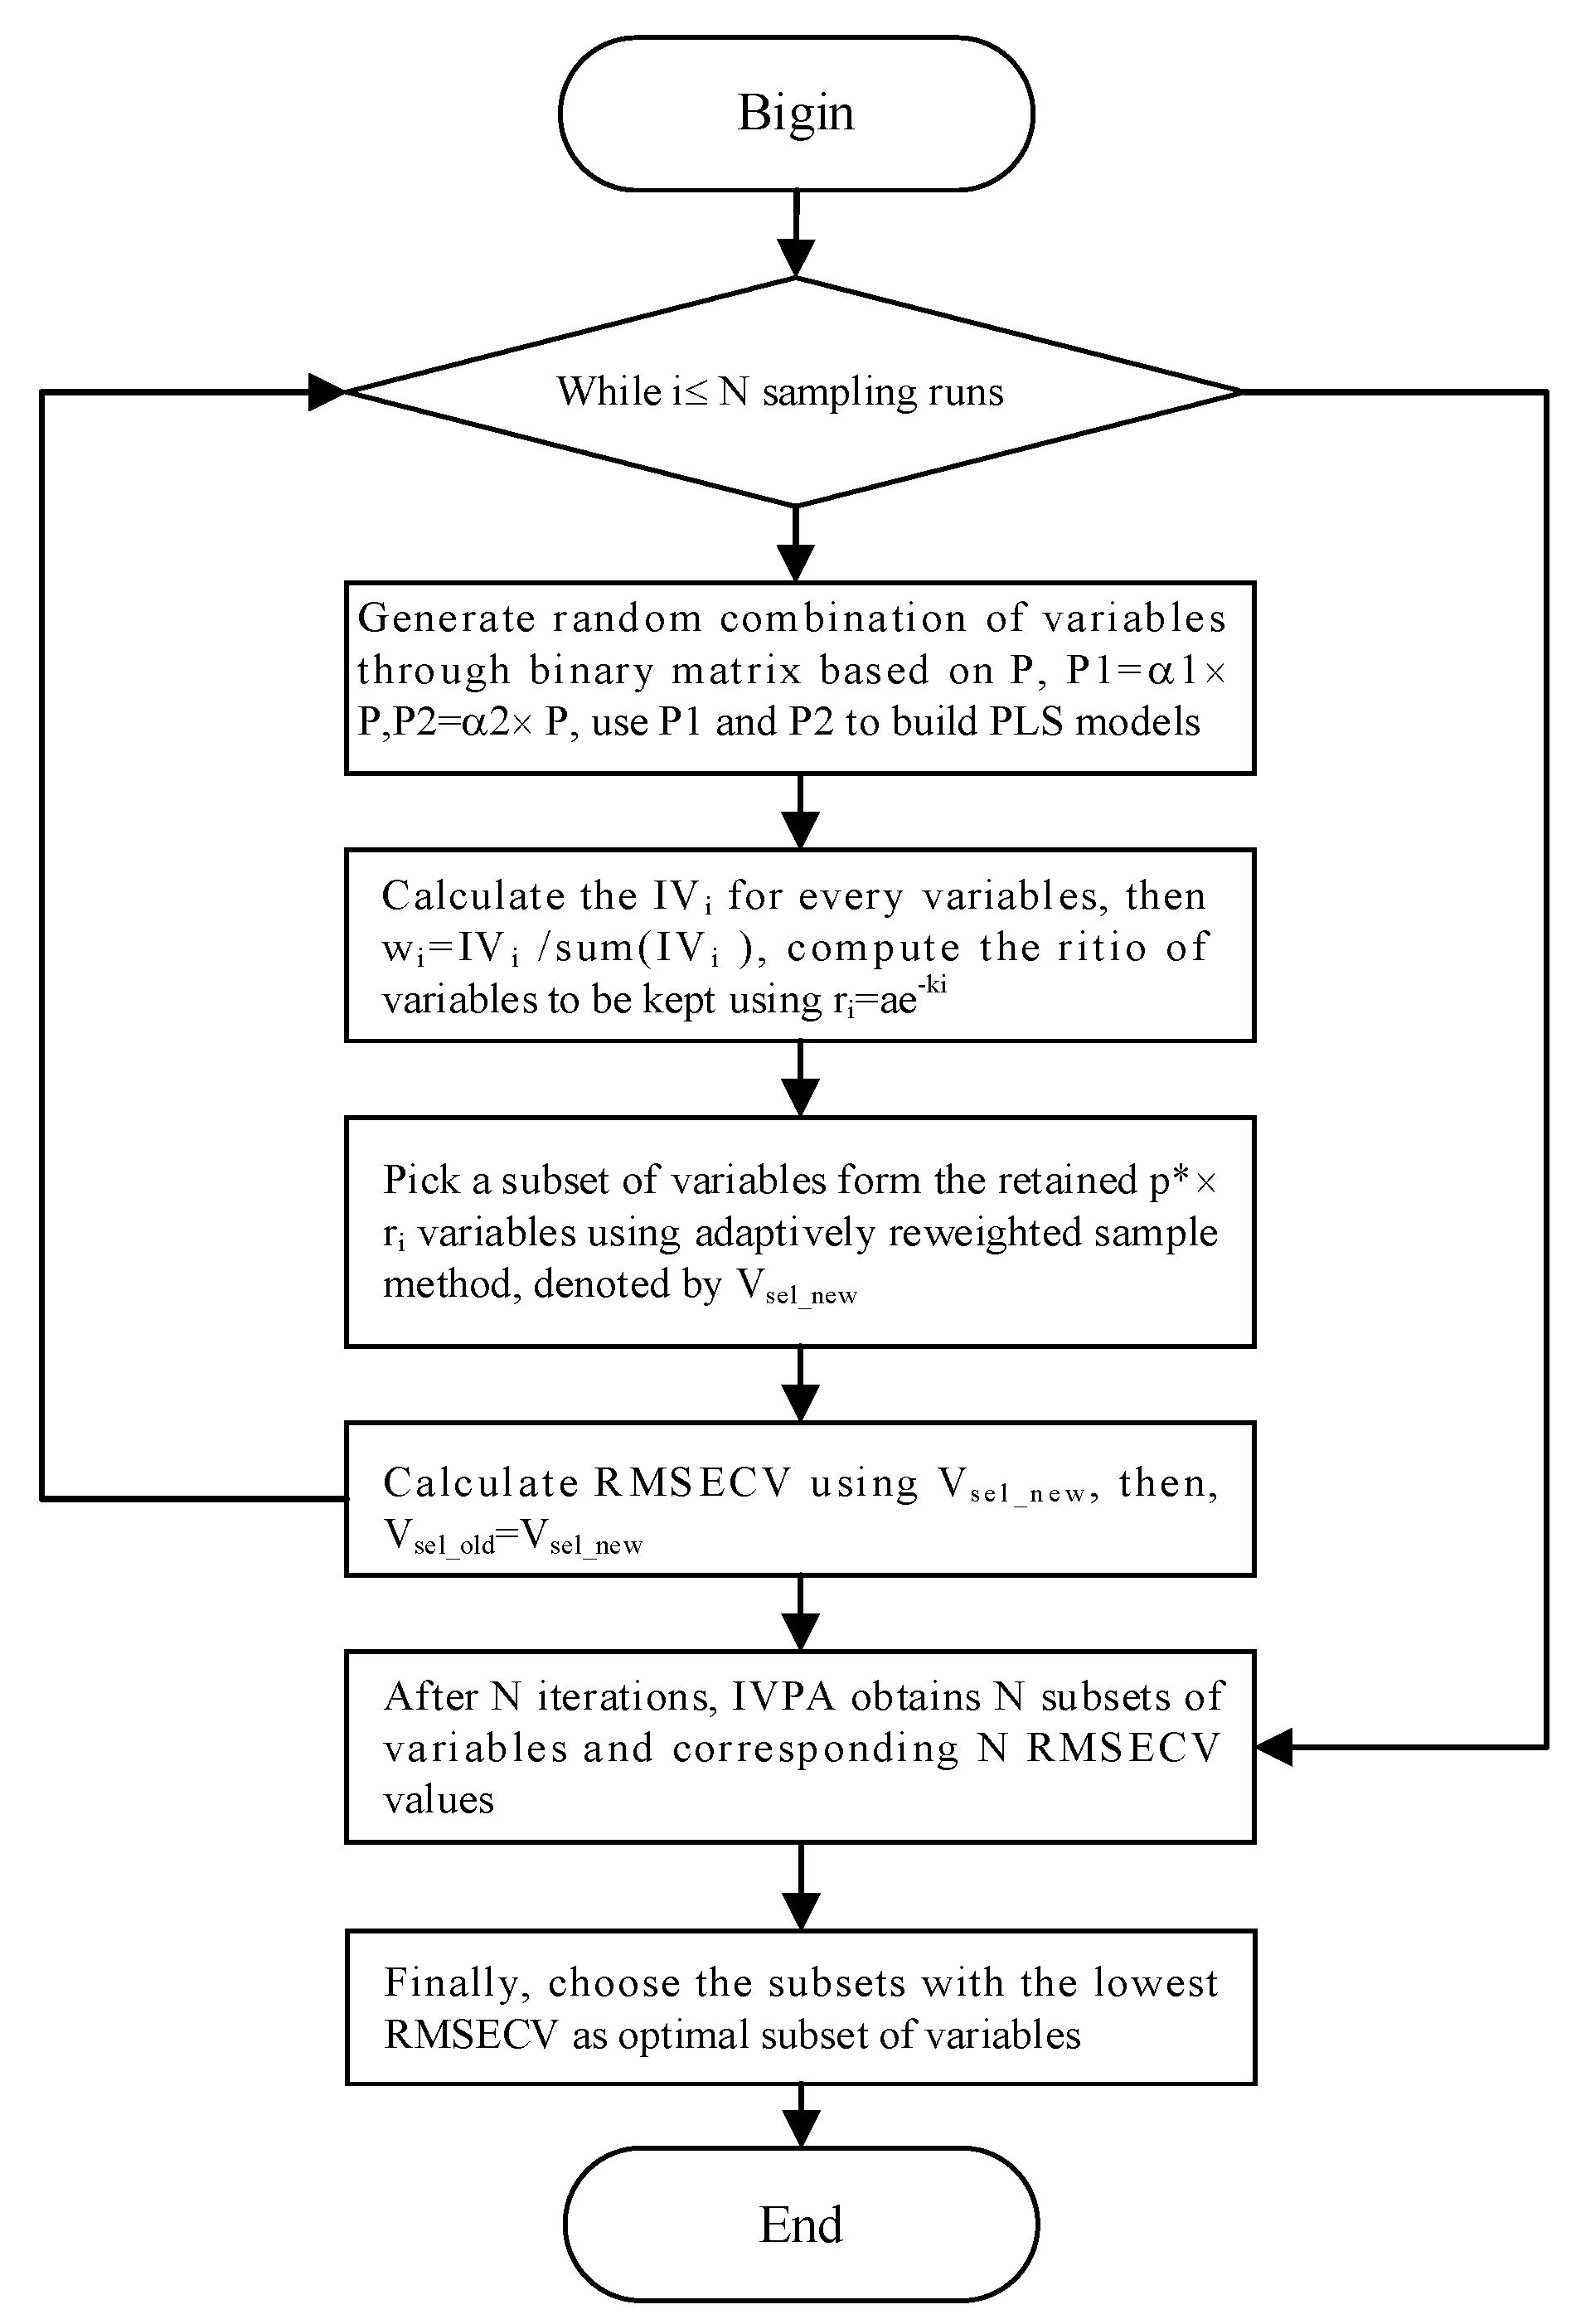
Figure 3.
Flow chart of coal mine gas analysis by FTIR spectroscopy absorption.
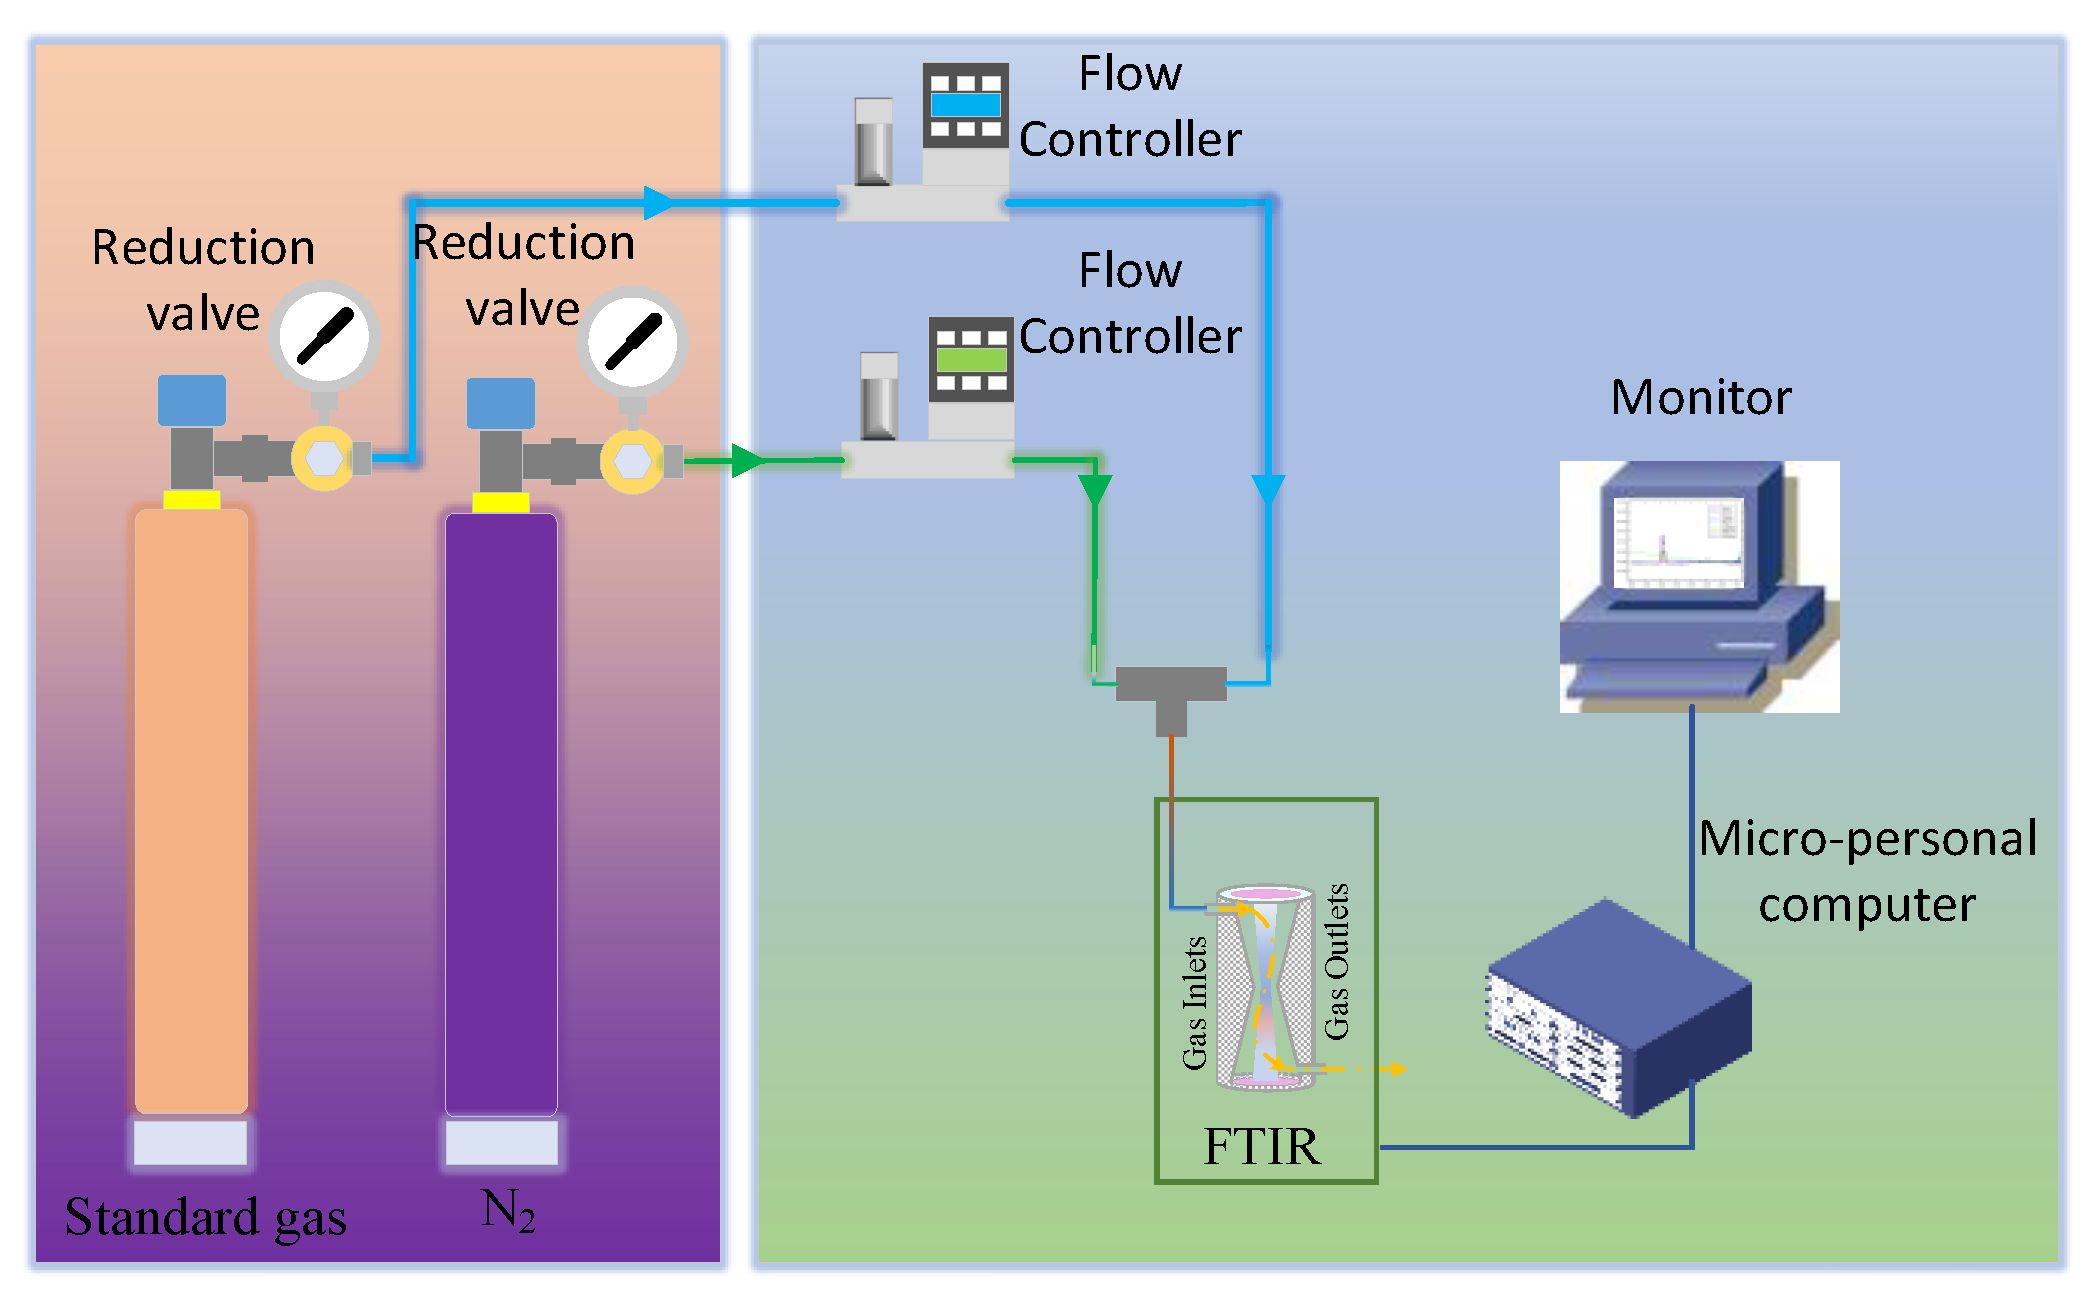
Figure 4.
Five kinds gases absorption spectra of concentration 0.05%.
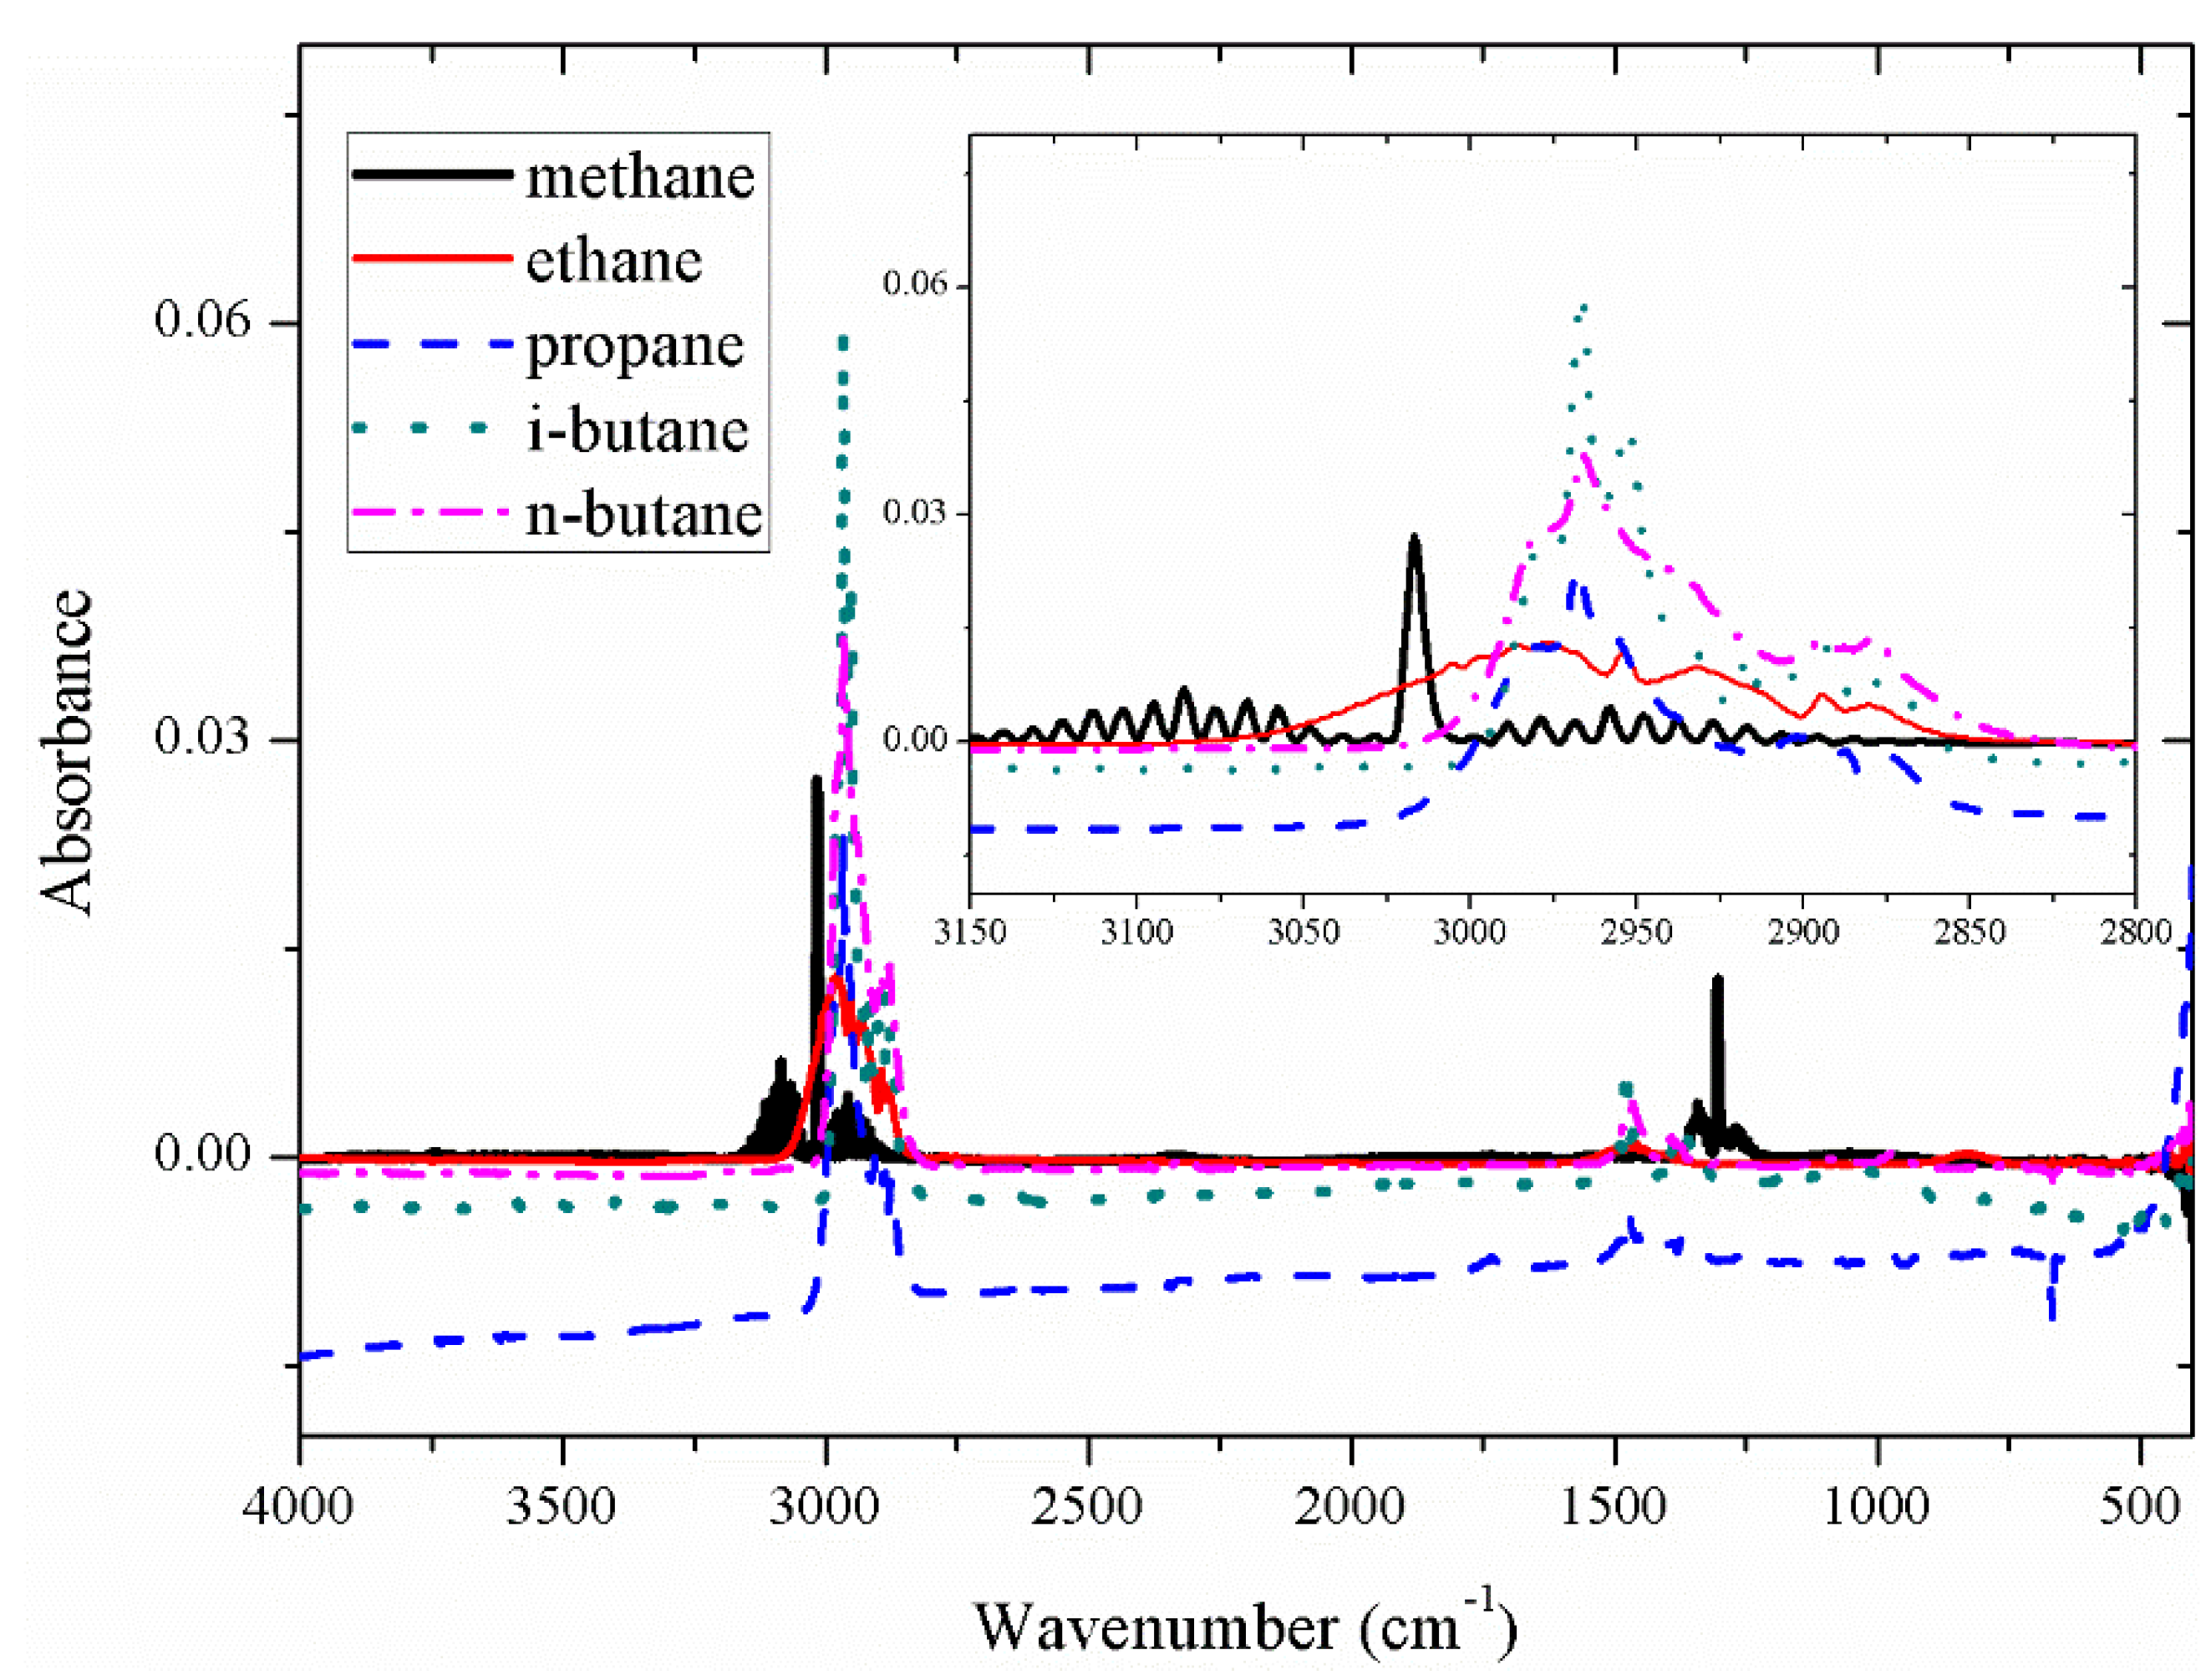
Figure 5.
Absorbance spectra of five gases after baseline correction at 500ppm.
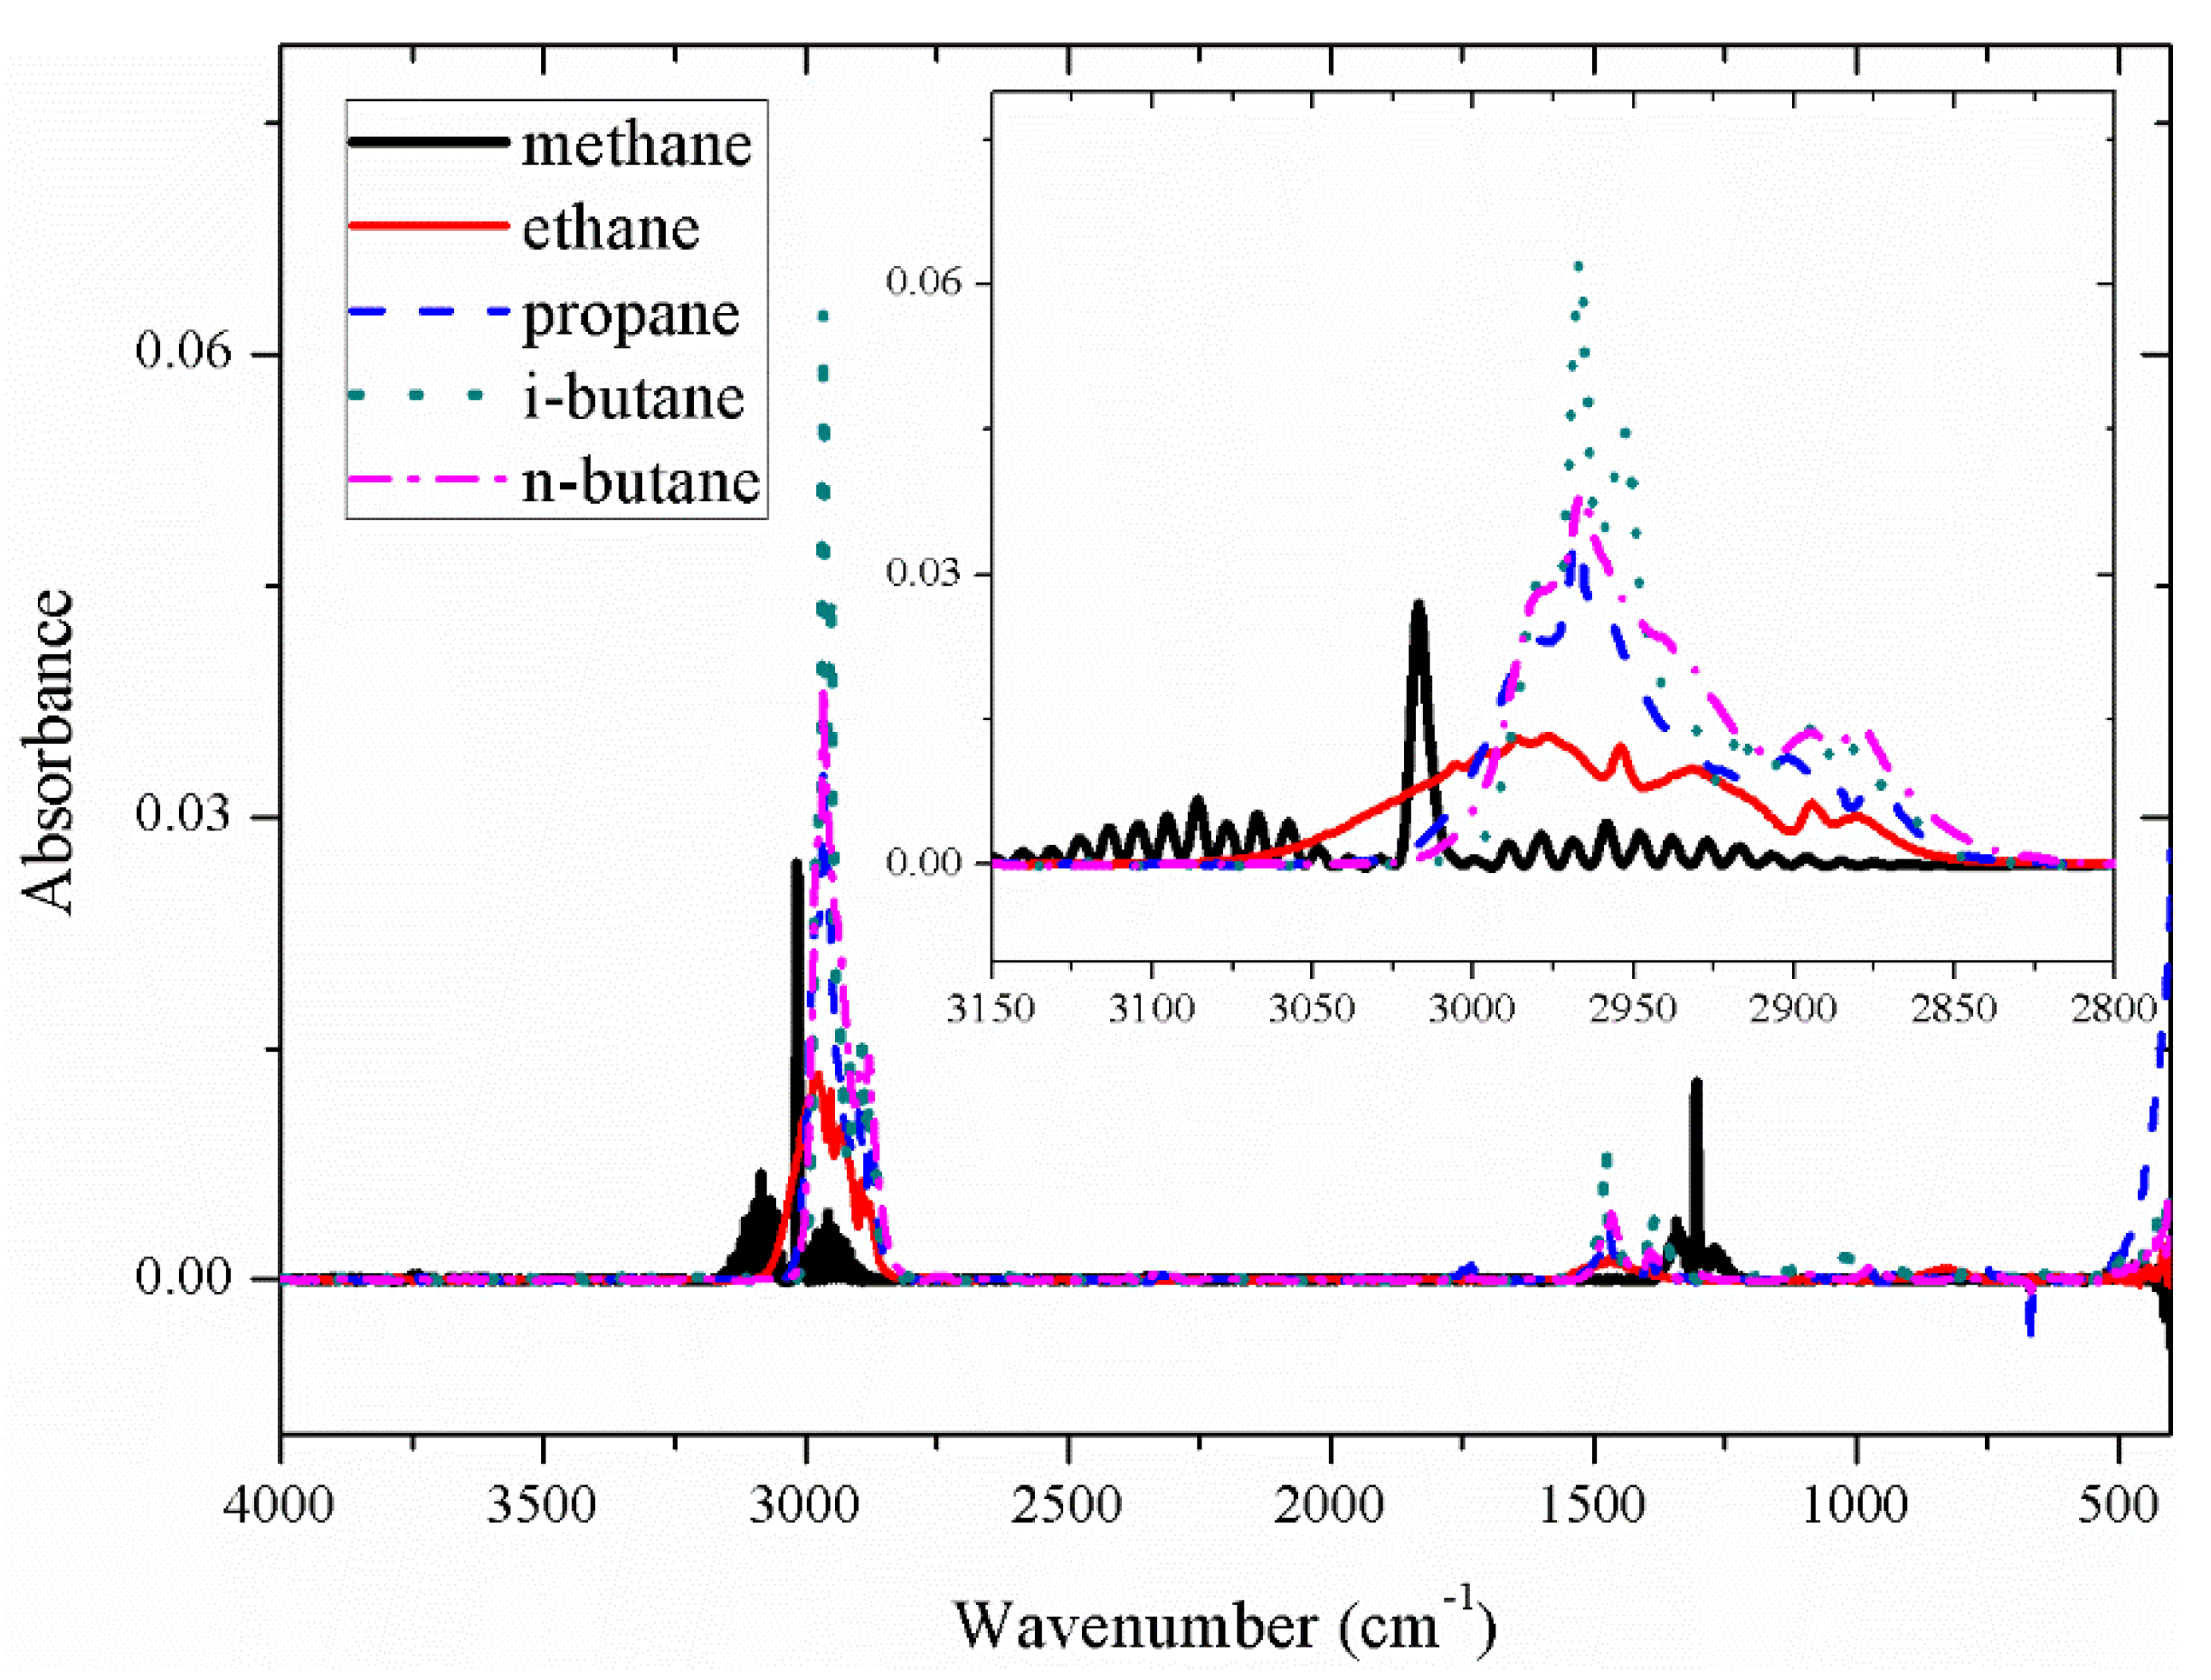
Figure 6.
The selected variables by IVPA.
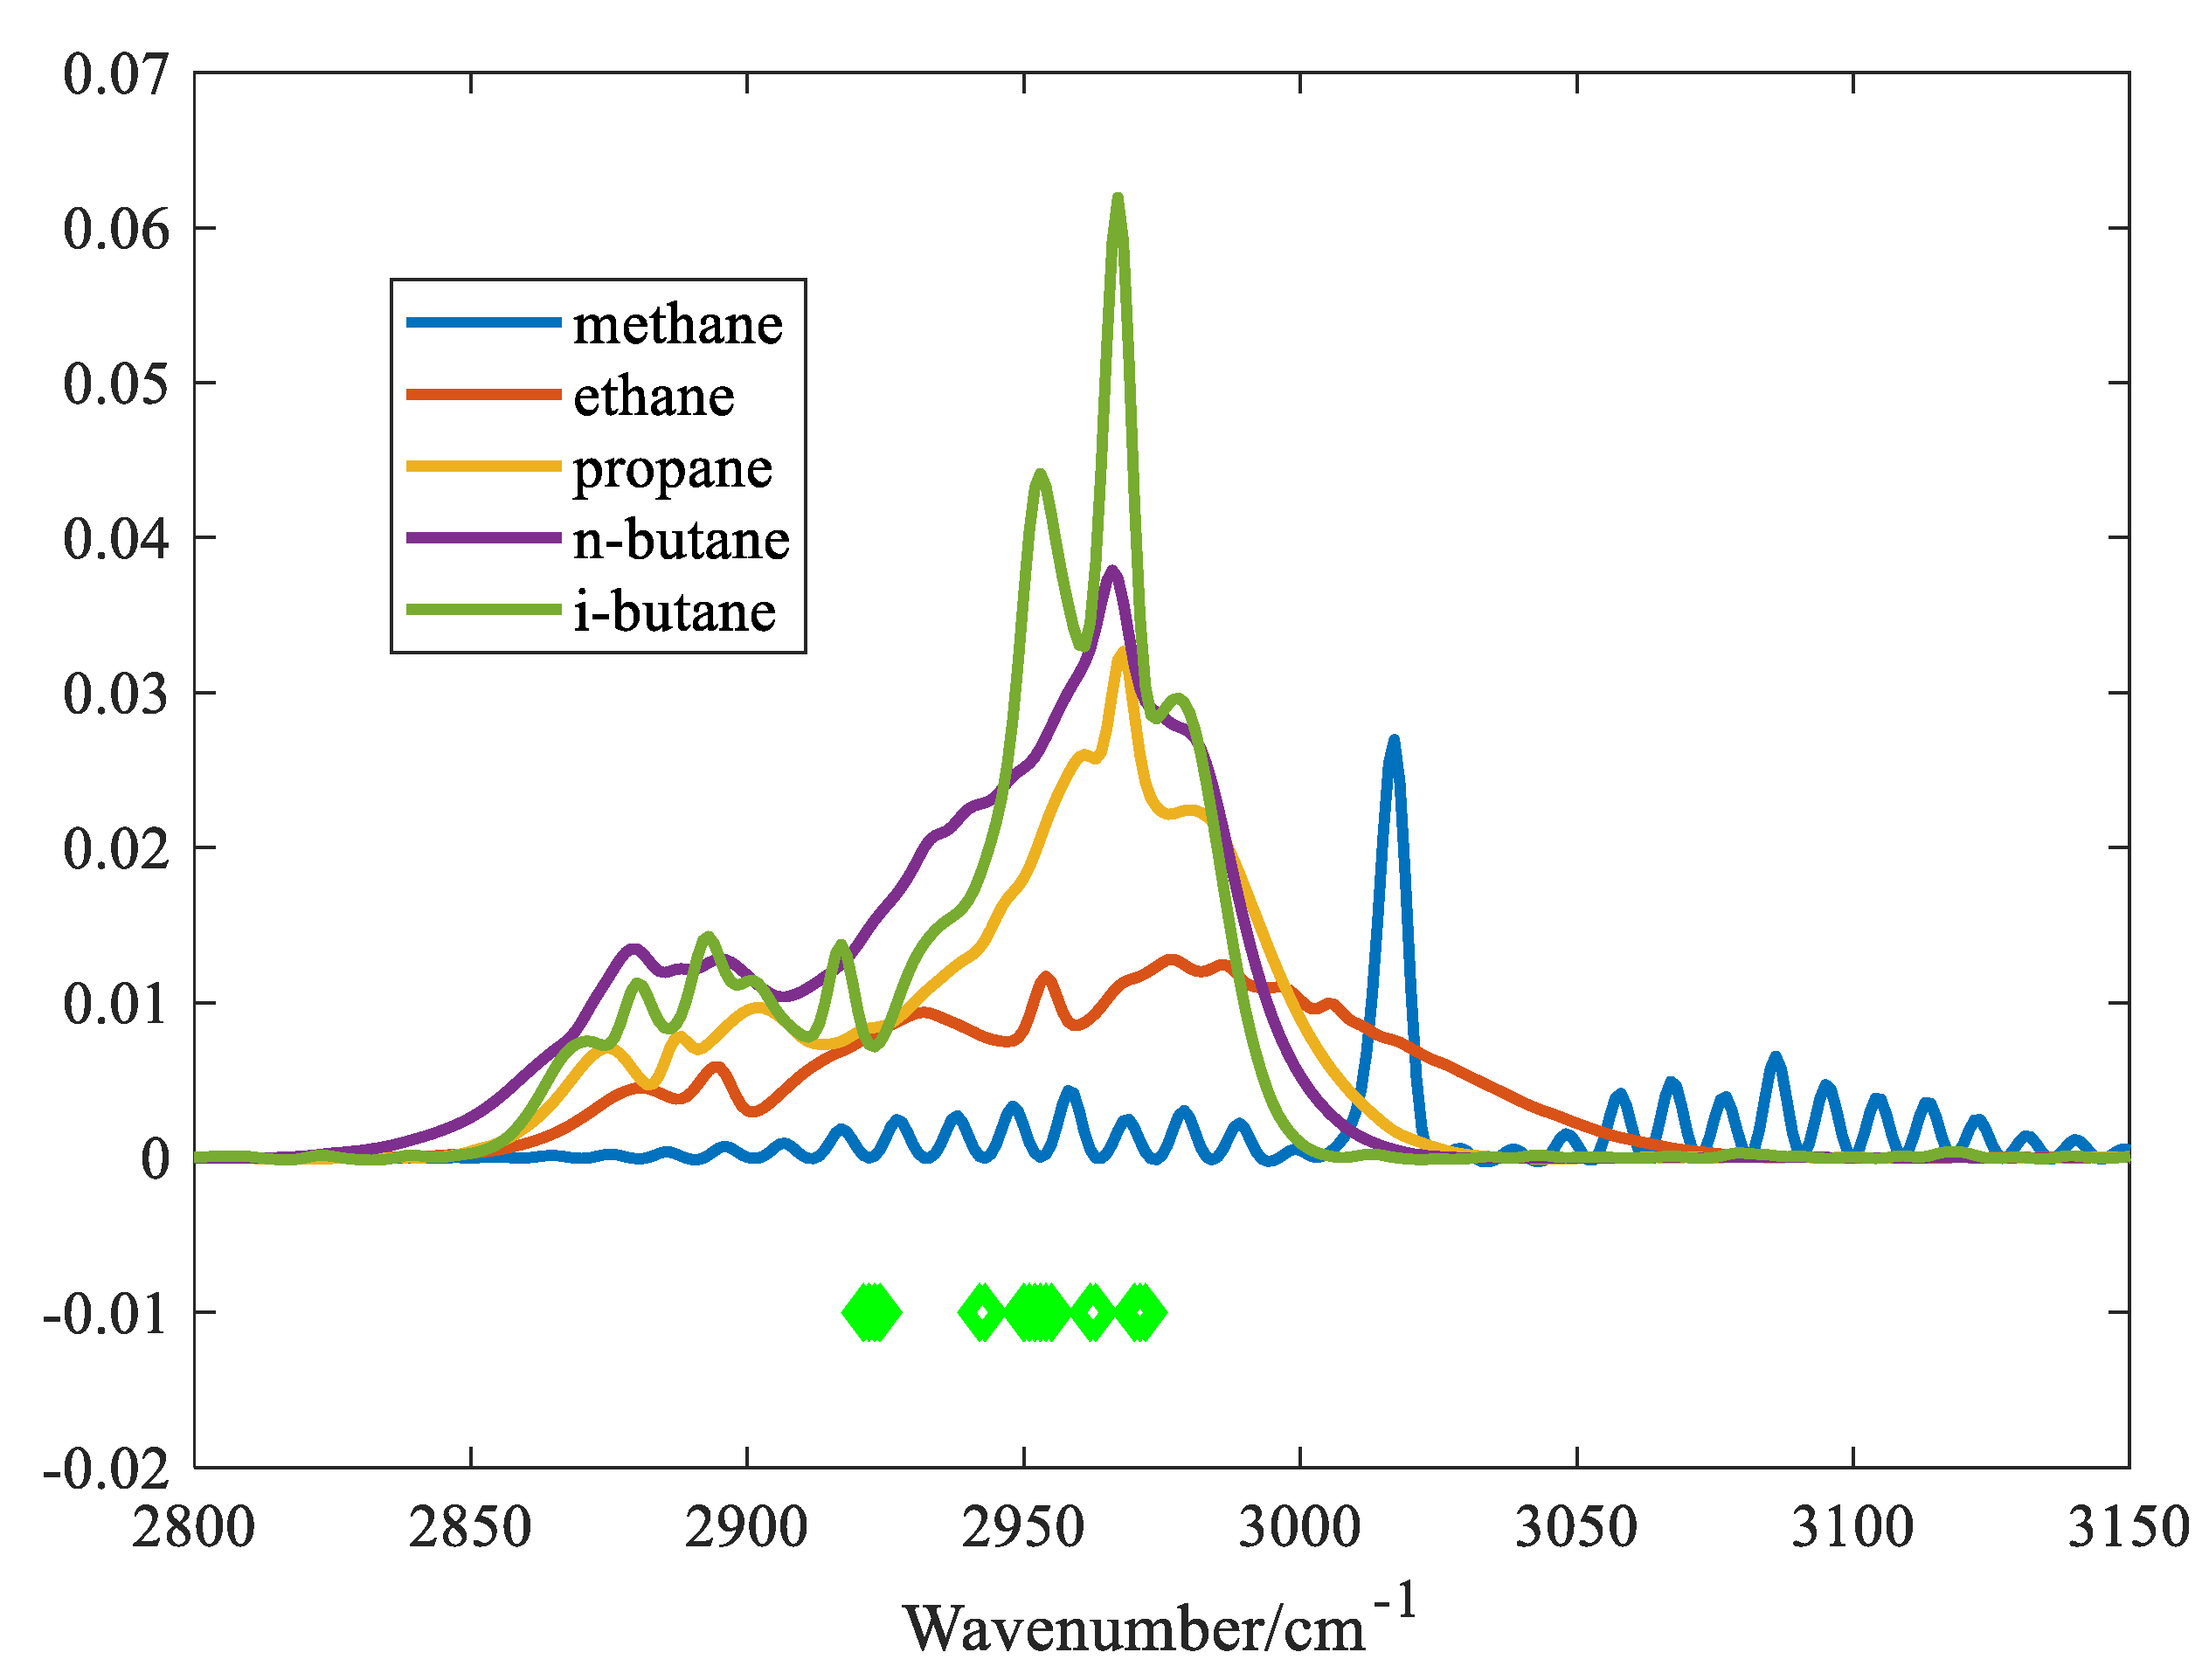
Figure 7.
Infrared spectra of six gases.
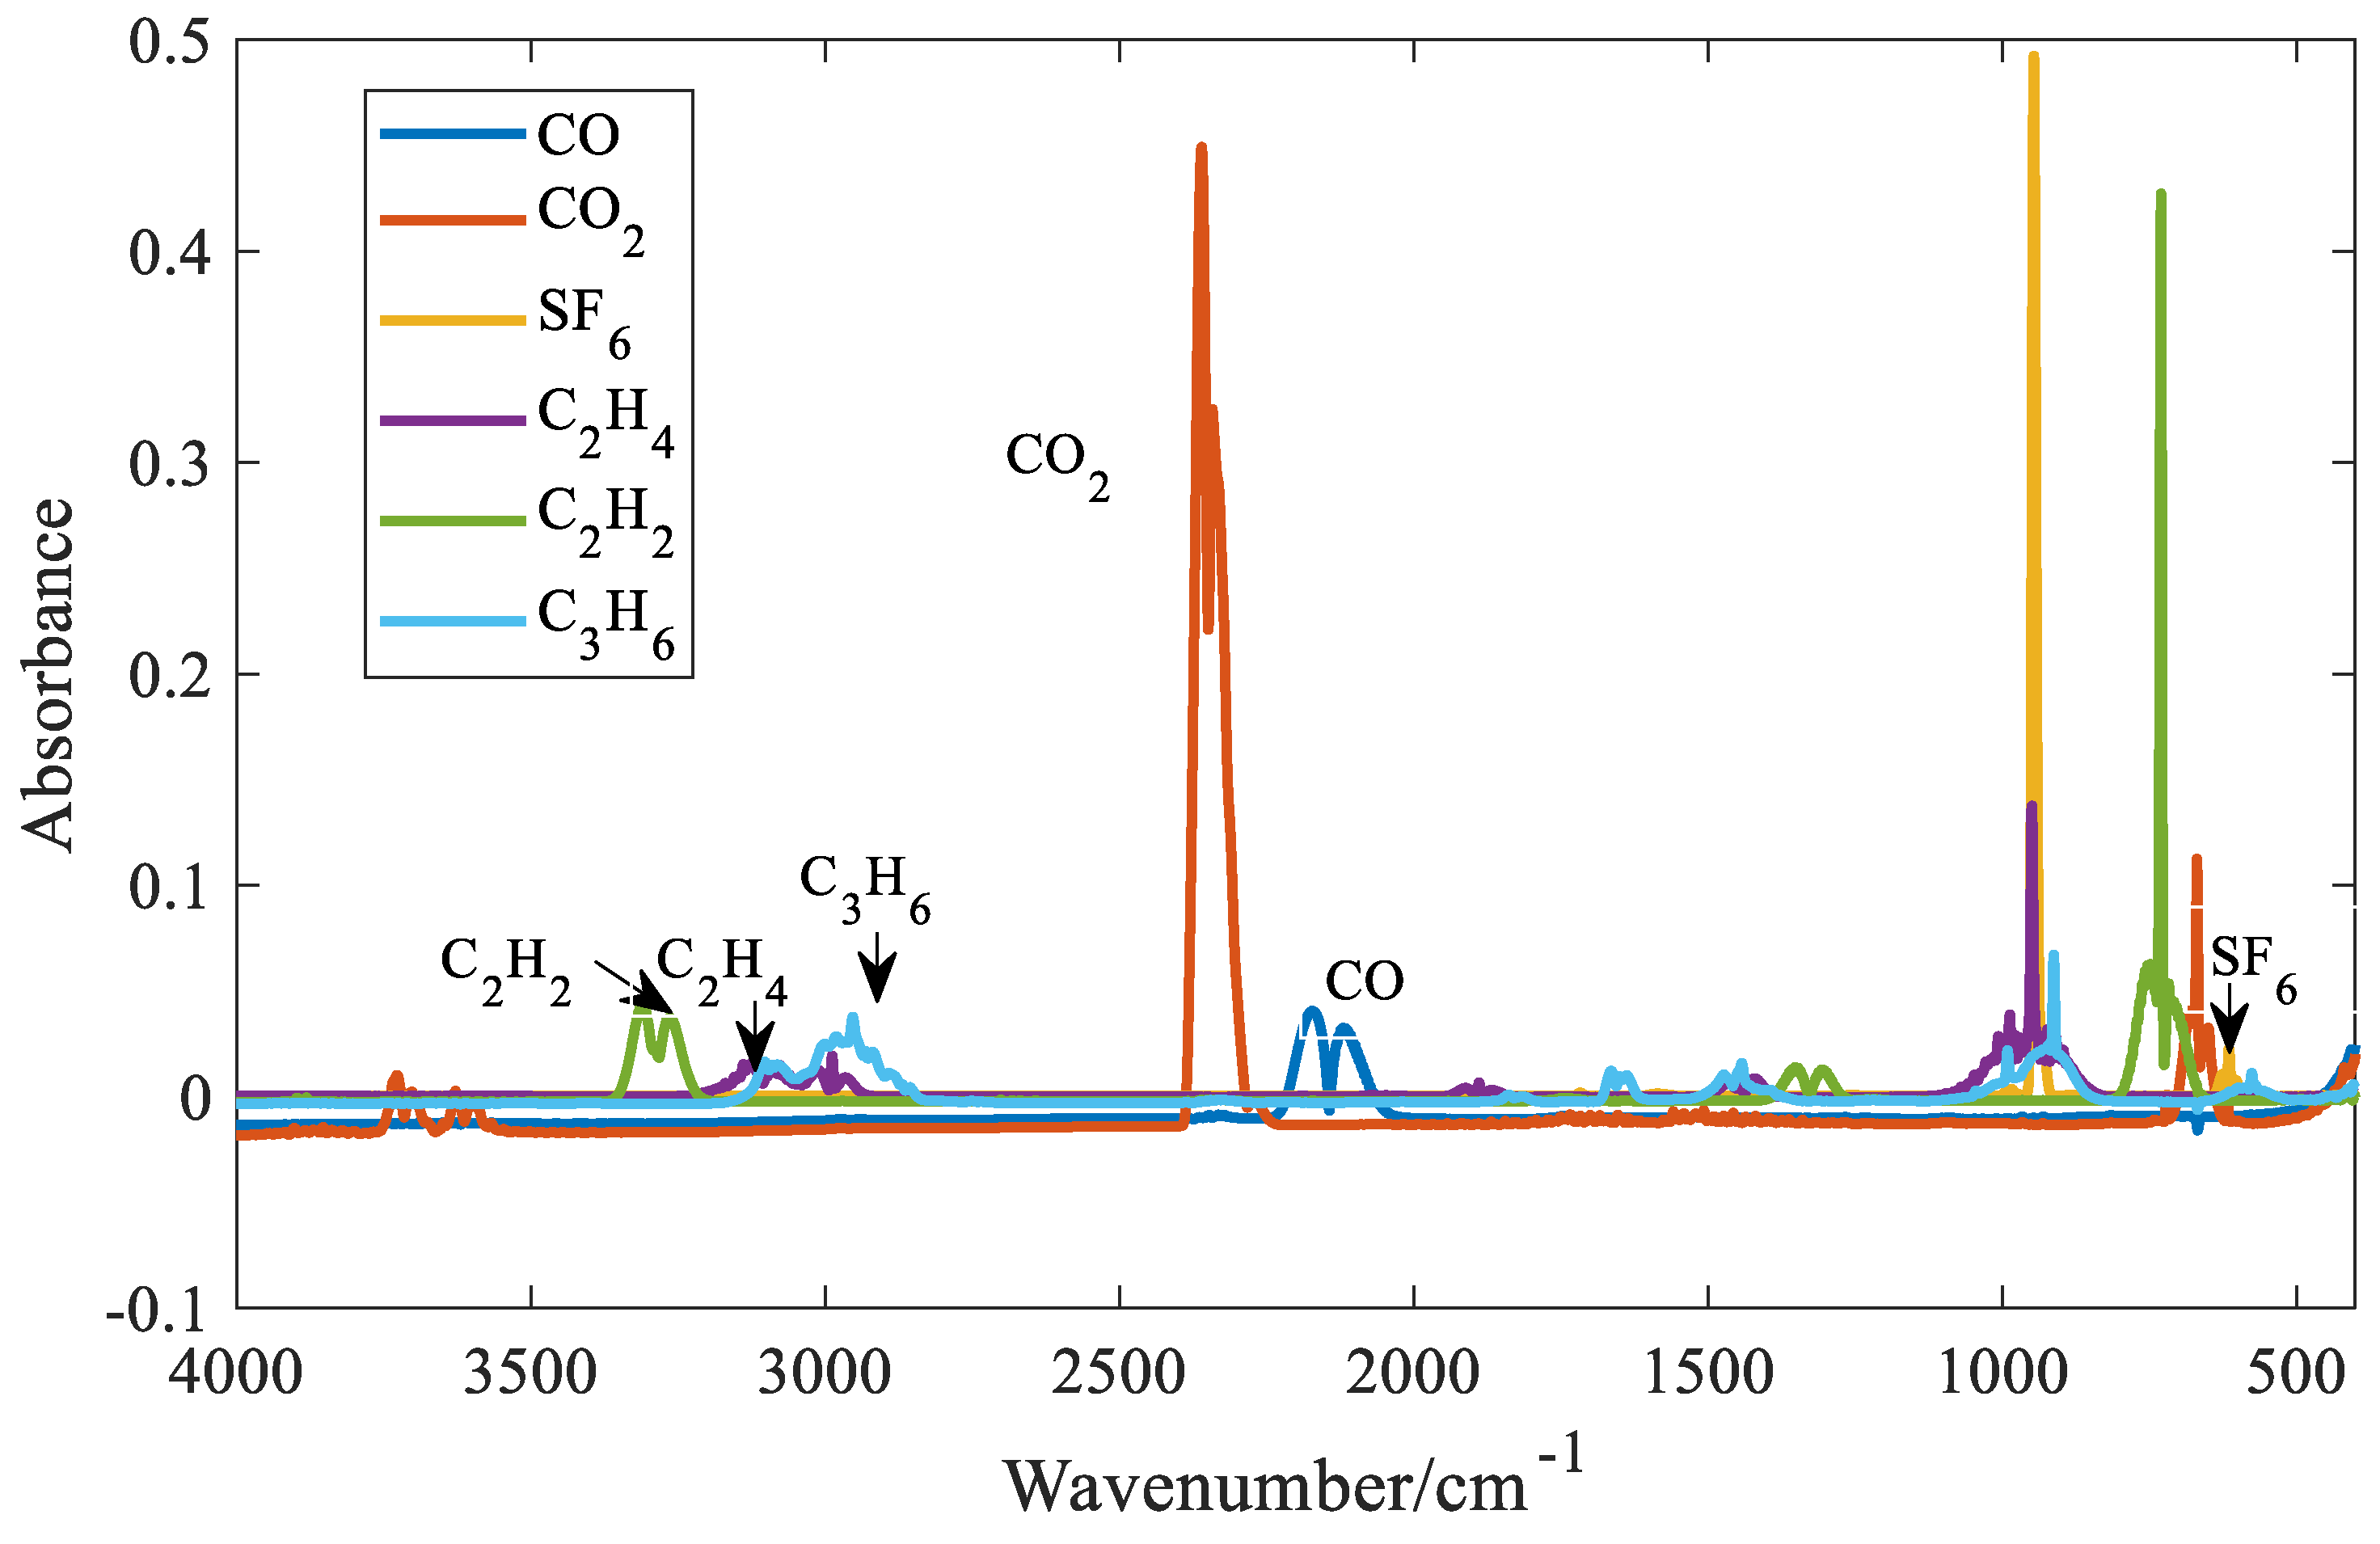
Figure 8.
Schematic diagram of SF6 infrared spectrum variable selection.
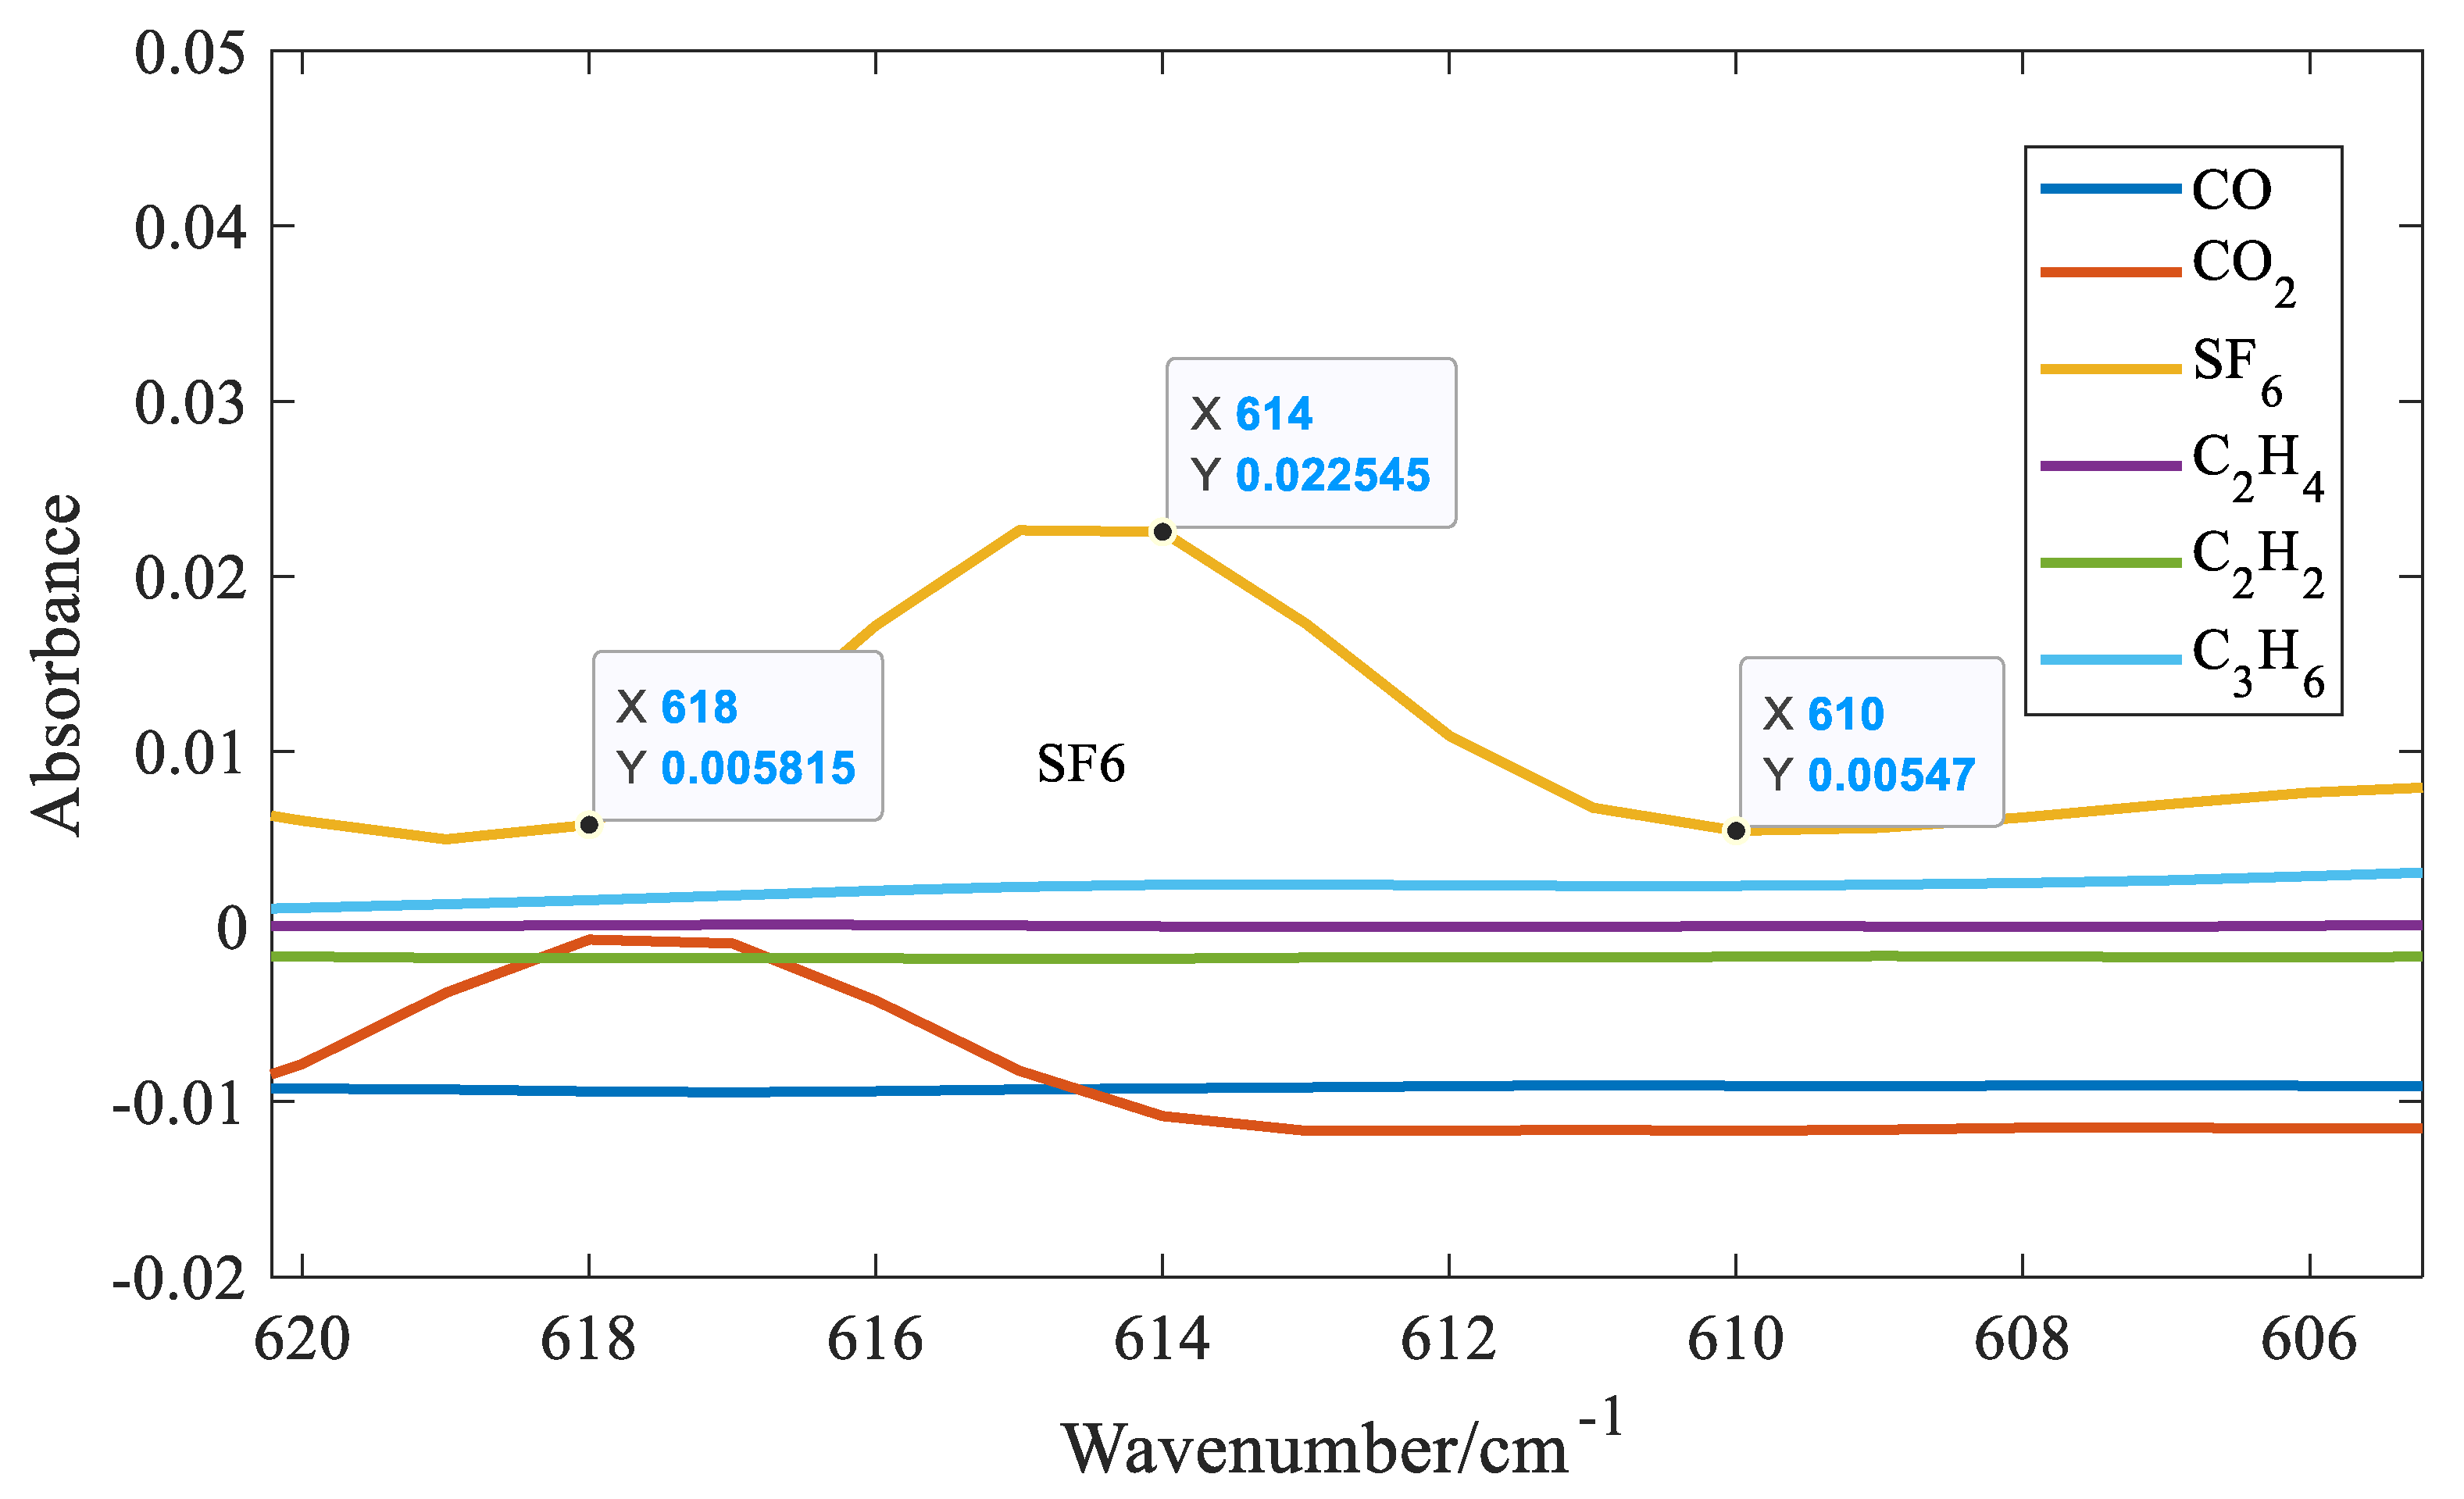
Figure 9.
Fitting diagram of SF6 characteristic quantities.
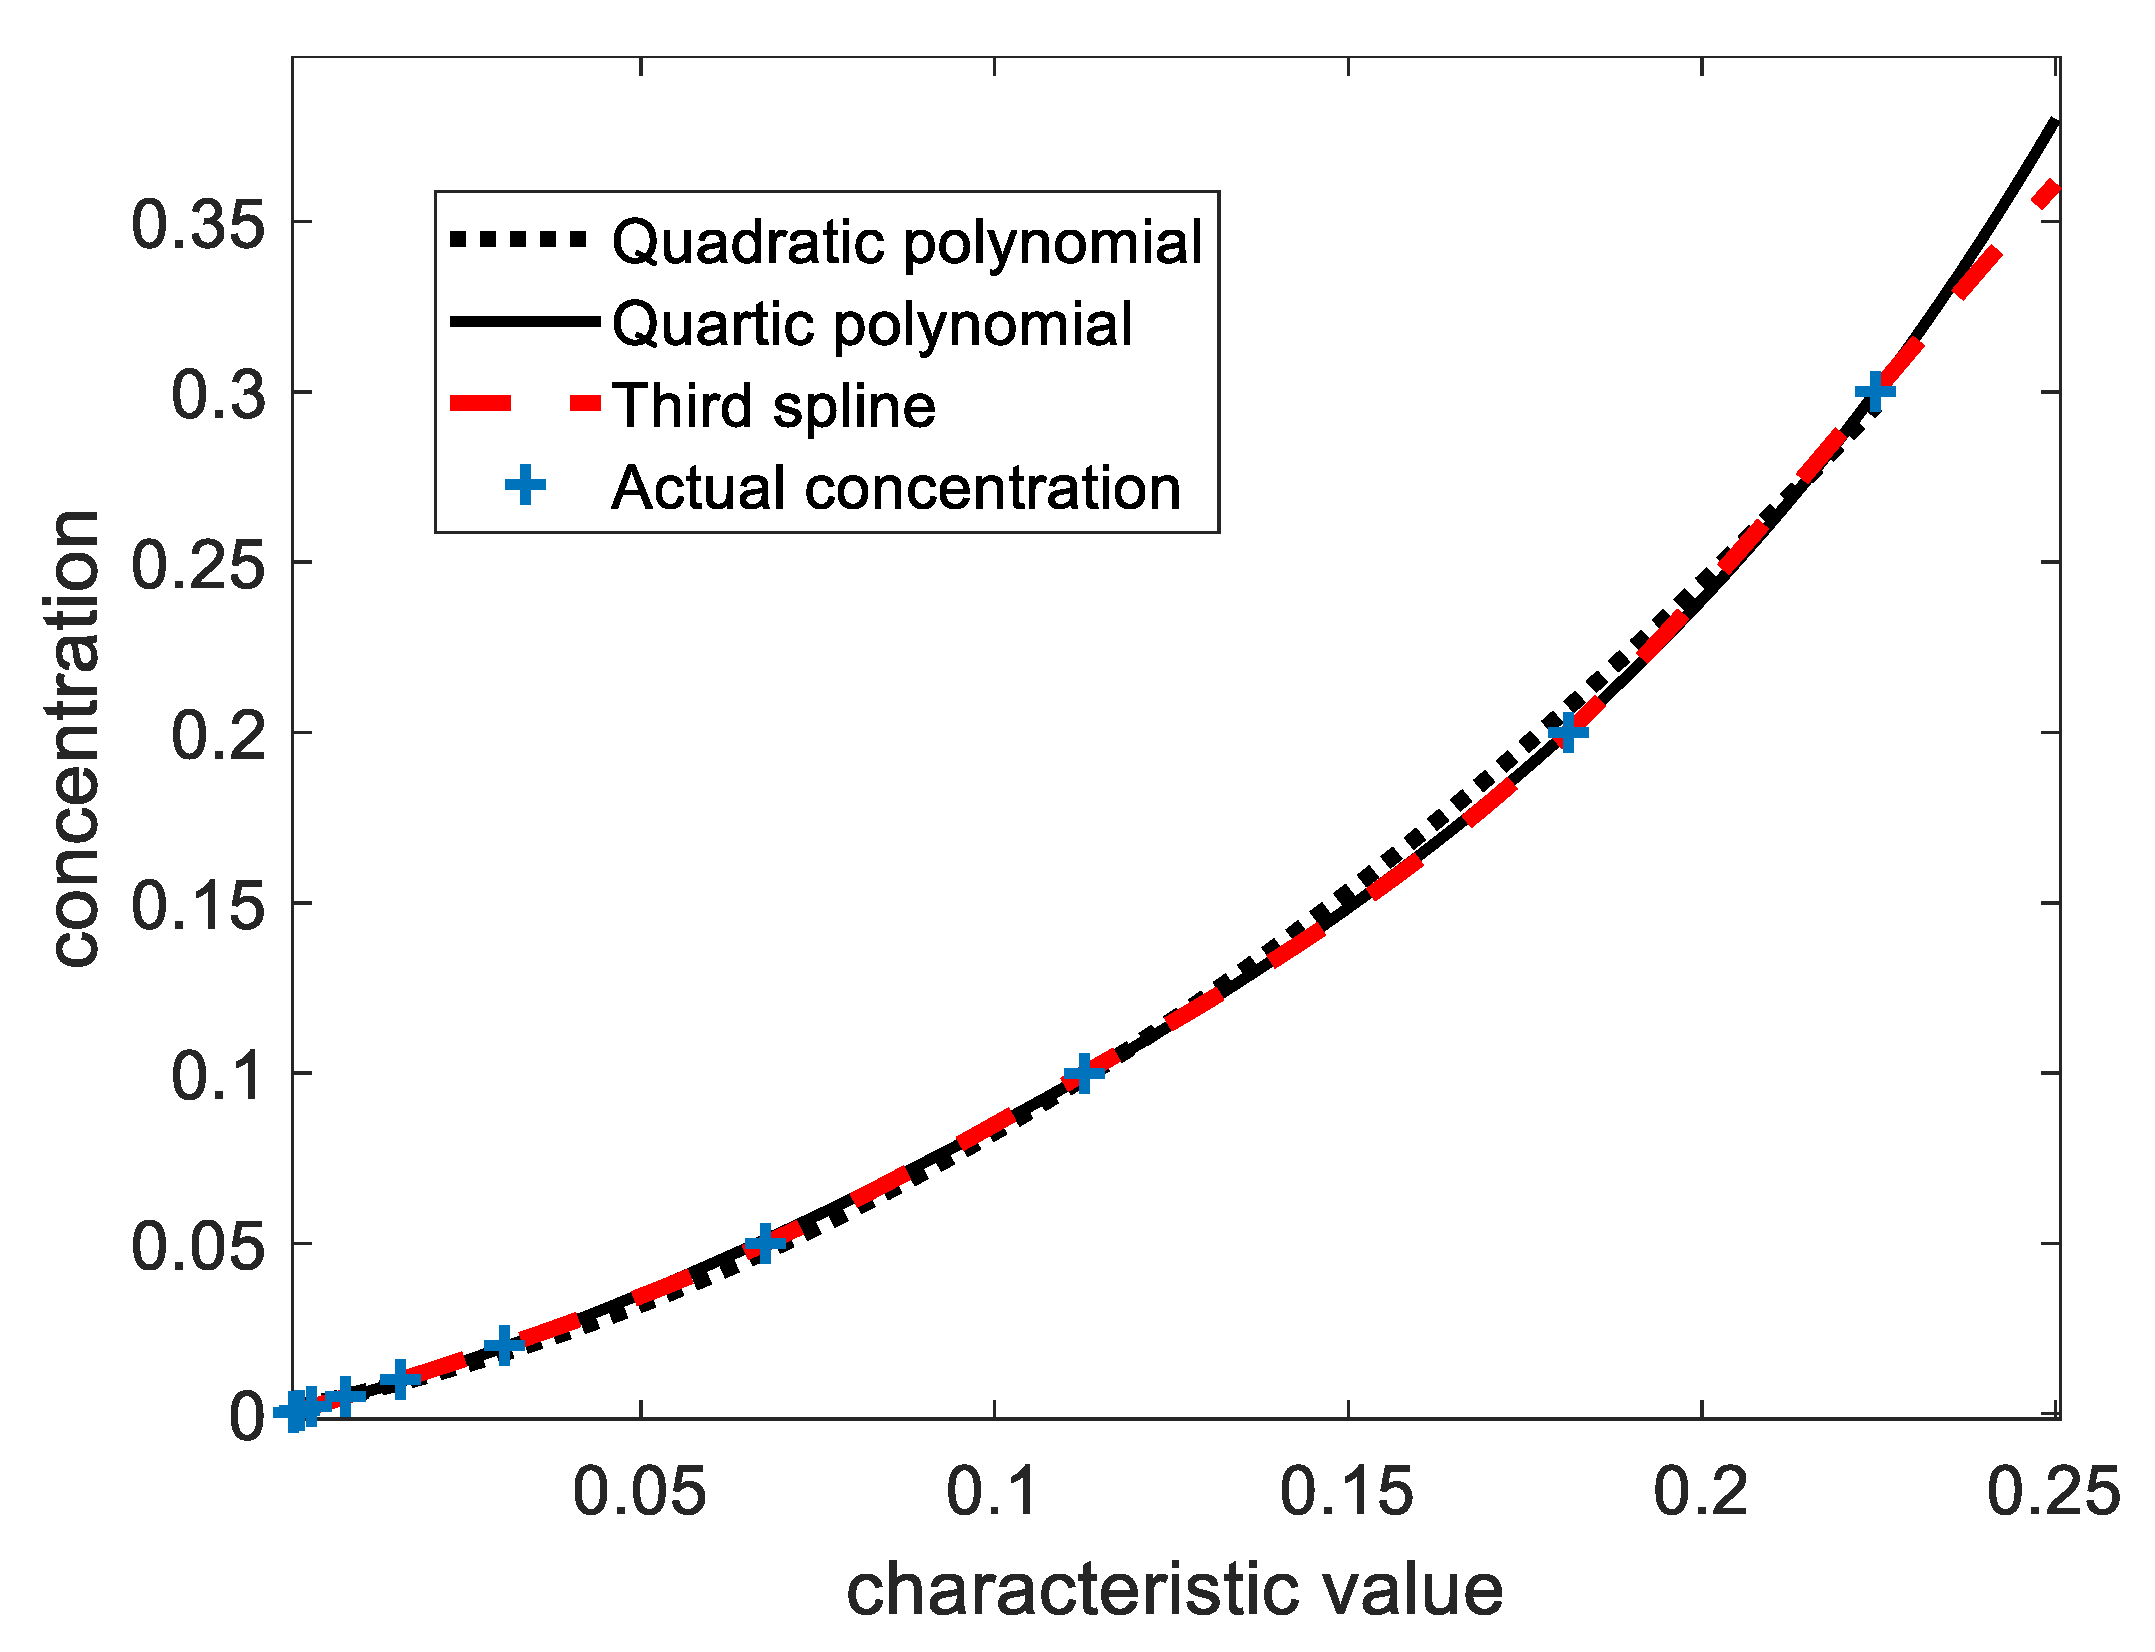

Table 1.
The prediction results of alkane gases with concentration of 500ppm by IVPA methods.
| evaluation index | gas composition | ||||
| Predicted concentration | methane | ethane | propane | n-butane | iso-butane |
| Predicted concentration(ppm) | -0.54 | 3.08 | -1.84 | -5.09 | 497.43 |
| cross sensitivity(%) | 0.11 | 0.62 | 0.37 | 1.02 | − |
Table 2.
Repeatability test results of analyzer (ϕ(⋅)×10-6).
| Number of measurements | Carbon dioxide | Carbon monoxide | Ethylene | Acetylene | Sulphur hexafluoride |
| 20000 | 101.5 | 500 | 5 | 10.1 | |
| 1 | 21450.6 | 89.2 | 499.7 | 4.1 | 9.8 |
| 2 | 21465.0 | 90.0 | 500.0 | 4.2 | 9.5 |
| 3 | 21641.8 | 91.9 | 496.1 | 3.8 | 10.0 |
| 4 | 21533.9 | 94.4 | 500.3 | 3.9 | 9.5 |
| 5 | 21368.6 | 93.8 | 502.1 | 4.0 | 9.8 |
| 6 | 21456.7 | 89.1 | 500.2 | 3.9 | 9.7 |
| 7 | 21517.7 | 93.4 | 501.6 | 4.0 | 9.6 |
| 8 | 21504.3 | 92.8 | 502.3 | 4.2 | 9.9 |
| 9 | 21472.6 | 91.7 | 499.9 | 3.8 | 9.7 |
| 10 | 21389.1 | 92.5 | 501.4 | 4.1 | 9.6 |
| Average value | 21480.0 | 91.9 | 500.4 | 4.0 | 9.7 |
| Standard deviation | 77.07 | 1.89 | 1.78 | 0.14 | 0.17 |
| RSD(%) | 0.36 | 2.05 | 0.35 | 3.54 | 1.71 |
| Error of indication | +7.4% | -0.01‰F.S. | +0.72% | -0.33‰F.S. | -0.13‰F.S. |
RSD: relative standard deviation.
Table 3.
Repeatability test results of analyzer (ϕ(⋅)×10-6).
| Number of measurements | Methane | ethane | propane | n-butane | isobutane |
| 10000 | 1001.2 | 1000 | 100 | 100 | |
| 1 | 9851.2 | 931.3 | 1041.5 | 87.6 | 90.8 |
| 2 | 9845.5 | 934.1 | 1048.7 | 91.1 | 94.9 |
| 3 | 9856.3 | 926.6 | 1055.2 | 89.3 | 96.1 |
| 4 | 9851.2 | 931.2 | 1054.4 | 88.6 | 93.0 |
| 5 | 9852.4 | 925.5 | 1064.6 | 94.2 | 92.6 |
| 6 | 9856.9 | 923.3 | 1045.1 | 90.5 | 95.1 |
| 7 | 9843.8 | 927.8 | 1047.3 | 87.4 | 96.3 |
| 8 | 9847.0 | 924.9 | 1052.5 | 91.8 | 95.5 |
| 9 | 9854.1 | 931.5 | 1043.8 | 89.7 | 91.9 |
| 10 | 9855.7 | 932.6 | 1049.3 | 91.0 | 89.4 |
| Average value | 9851.4 | 929.9 | 1050.2 | 90.1 | 92.8 |
| Standard deviation | 4.63 | 3.37 | 6.74 | 2.06 | 2.21 |
| RSD(%) | 0.05 | 0.36 | 0.64 | 2.29 | 2.38 |
| Error of indication | -0.15‰F.S. | -7.1% | +5.0% | -2.0‰F.S. | -1.4‰F.S. |
RSD: relative standard deviation.
Disclaimer/Publisher’s Note: The statements, opinions and data contained in all publications are solely those of the individual author(s) and contributor(s) and not of MDPI and/or the editor(s). MDPI and/or the editor(s) disclaim responsibility for any injury to people or property resulting from any ideas, methods, instructions or products referred to in the content. |
© 2025 by the authors. Licensee MDPI, Basel, Switzerland. This article is an open access article distributed under the terms and conditions of the Creative Commons Attribution (CC BY) license (http://creativecommons.org/licenses/by/4.0/).
Copyright: This open access article is published under a Creative Commons CC BY 4.0 license, which permit the free download, distribution, and reuse, provided that the author and preprint are cited in any reuse.


