
Submitted:
28 May 2025
Posted:
29 May 2025
You are already at the latest version
Abstract
Background: Neuroinflammation contributes to epileptogenesis across the different etiological categories of epilepsy. Identifying its biomarkers can be important for dis-tinguishing epilepsy patients from healthy individuals and differentiating well-controlled epilepsy from Drug Resistant Epilepsy (DRE).
Methods: An observational case-control study at Malaga’s Regional University Hospital involved epilepsy patients, divided into three groups: Healthy controls (HC), Sei-zure-Free Epilepsy (SFE) and DRE. Demographic and clinical data and plasmatic and/or CSF level of 24 different inflammation-related molecules were collected for each patient and were analysed through a univariate and multivariate analysis.
Results: The study included 68 patients: 38 in the DRE group, 14 in the SFE group, and 16 in the HC group. A new Inflammatory Drug-Resistant Epilepsy Index (IDREI) was created using key variables with significant or trending significance. This index com-bined pro-inflammatory mediators (ICAM-1 and NfL) and anti-inflammatory factors (IL-10 and IL-4), showing statistical significance (p=0.002). ROC curve analysis for the IDREI gave an AUC of 0.731 (95% CI: 0.608−0.854). A multivariate logistic regression model's ROC anaysis resulted in a higher AUC of 0.891 (95% CI: 0.791−0.991).
Conclusions: IDREI is a molecular index that effectively predicts epilepsy and DRE. Further prospective studies are needed to evaluate its clinical utility.
Keywords:
epilepsy
; neuroinflammation
; biomarkers
; epileptogenesis
; drug‐resistant epilepsy
1. Introduction
Epilepsy is the most common chronic neurological disease, affecting over 50 million people worldwide, according to the World Health Organization (WHO). The prevalence in developed countries ranges from 3.2 to 7.8 cases per 1,000 inhabitants [1], whereas it is significantly higher in developing nations, largely due to a greater number of epilepsy cases stemming from infectious causes [2,3,4].
Epilepsy exhibits significant etiological heterogeneity. In the latest ILAE classification of Epilepsies [5] six different etiological categories were recognized: structural, genetic, infectious, metabolic, immune or unknown. Among the structural causes, the most frequent correspond to focal cortical dysplasia, hippocampal sclerosis, slow-growing glial tumours or vascular malformations. On the other hand, less frequent aetiologies, including those of genetic, metabolic or immunity-related origin, have acquired wide recognition in recent times [6,7,8].
Over the past two decades, there has been growing evidence of both clinical and basic studies providing strong support for the conclusion that neuroinflammation is involved in epileptogenesis and that it does so in a transversal way regardless of the underlying aetiology [9,10,11]. Chronic inflammation in the brain can disrupt neuronal excitability, contribute to neuronal damage, and potentially alter drug transport and efficacy [12]
With the development of personalized and precision neurology, it is essential to expand our understanding of the basic mechanisms of epileptogenesis, with special interest in those related to neuroinflammatory mechanisms. This knowledge can lead to the identification of diagnostic or prognostic neuroinflammatory biomarkers and potentially provide therapeutic targets [6].
The identification of reliable neuroinflammatory biomarkers capable of distinguishing individuals with epilepsy from healthy controls, and more crucially, differentiating between patients with well-controlled epilepsy and those with Drug Resistant Epilepsy (DRE), presents substantial clinical potential. Since early detection of DRE allows for prompt consideration of non-pharmacological treatments like neuromodulation or epilepsy surgery, identifying inflammatory biomarkers that indicate refractoriness is essential for the proper management of individuals with this condition [13,14].
Recent studies have aimed to identify these biomarkers, but the findings remain inconclusive. Our recent systematic review identified several molecules as potential biomarkers for clinical use; however, none have achieved a high level of scientific evidence [15]. Therefore, the role of these biomarkers in assessing the degree of refractoriness or diagnosing epilepsy remains unknown.
This case-control study aims to investigate and compare the levels of 24 selected molecules implicated in neuroinflammation across three distinct groups: healthy controls (HC), patients with seizure-free epilepsy (SFE), and patients with DRE. By employing univariate and multivariate statistical analyses, as well as Receiver Operating Characteristic (ROC) curve analysis, we seek to define a potential biomarker profile capable of accurately identifying patients with epilepsy and, crucially, distinguishing those with DRE. The findings of this study could contribute to a better understanding of the role of neuroinflammation in epilepsy progression and provide valuable insights for the development of diagnostic and prognostic tools in this challenging condition.
2. Materials and Methods
2.1. Study Design
An analytical observational case-control study was conducted involving patients with epilepsy from the Epilepsy Unit of the Regional University Hospital of Malaga.
2.2. Patients
Patients were recruited consecutively and were divided into three groups:
- HC group: Individuals with no history of epilepsy or other known chronic neurological or inflammatory diseases.
- SFE group: Patients with a confirmed diagnosis of epilepsy, who exhibited adequate seizure control (absence of seizures in the past 12 months) under pharmacological treatment.
- DRE group: Patients with a confirmed diagnosis of DRE, defined as those who failed to achieve adequate seizure control despite treatment with at least two appropriate antiseizure medications (ASM), used at tolerated doses, for an adequate period (according to the International League Against Epilepsy - ILAE guidelines) [16].
2.3. Patients and Sampling
The inclusion and exclusion criteria for each group were as follows:
- HC group:
- ▪
- Inclusion: Absence of a diagnosis of epilepsy, neurological diseases, chronic inflammatory, autoimmune, or active infectious diseases.
- ▪
- Exclusion: First-degree family history of epilepsy, presence of any significant medical condition that could affect neuroinflammation biomarkers, chronic use of immunomodulatory or anti-inflammatory drugs.
- SFE group:
- ▪
- Inclusion: Confirmed diagnosis of epilepsy according to ILAE criteria, absence of epileptic seizures in the past 12 months.
- ▪
- Exclusion: Presence of progressive epileptic syndromes, evidence of underlying active encephalopathy, significant neurological or inflammatory comorbidities unrelated to epilepsy, recent changes in antiepileptic medication.
- DRE group:
- ▪
- Inclusion: Confirmed diagnosis of DRE according to the ILAE definition, current treatment with at least two antiepileptic drugs.
- ▪
- Exclusion: Presence of progressive epileptic syndromes, evidence of underlying active encephalopathy, significant neurological or inflammatory comorbidities unrelated to epilepsy.
All participants or their legal representatives provided written informed consent before their inclusion in the study, in accordance with the ethical guidelines of the Declaration of Helsinki and approved by the Research Ethics Committee of Málaga.
2.4. Sample Collection and Biomarker Determination
Plasma and cerebrospinal fluid (CSF) samples were collected from each participant under standardized conditions. Blood samples were collected by standard venipuncture in BD Vacutainer® Citrate Tubes containing 0.109 M (3.2%) sodium citrate (9:1 blood to anticoagulant ratio) (BD, Franklin Lakes, NJ, USA). Plasma were isolated within a maximum of two hours post-collection by centrifugation at room temperature for 10 min at 2500 × g. Samples were stored at −80 °C until further analysis. CSF samples were collected via lumbar puncture and transferred into polypropylene tubes. Within a maximum of two hours post-collection, samples were centrifuged at room temperature for 10 minutes at 900 × g. The resulting supernatant was then aliquoted and stored at −80 °C prior to comprehensive assessment.
The levels of the following molecules in plasma were determined:
- Pro-inflammatory biomarkers (20): MIP-1α (Macrophage Inflammatory Protein 1-alpha), IL-1β (Interleukin-1 beta), IP-10 (Interferon gamma-induced Protein 10 or CXCL10), IL-8 (Interleukin-8), IL-12 (Interleukin-12), IL-17A (Interleukin-17A), IL-33 (Interleukin-33), IFN-γ (Interferon gamma), GM-CSF (Granulocyte-Macrophage Colony-Stimulating Factor), TNF-α (Tumor Necrosis Factor-alpha), MIP-1β (Macrophage Inflammatory Protein 1-beta), IFN-α (Interferon-alfa), MCP-1 (Monocyte Chemoattractant Protein-1), P-Selectin (CD62P), IL-1α (Interleukin-1 alfa), ICAM-1 (Intercellular Adhesion Molecule-1), E-Selectin (CD62E), sTNF-RII (soluble tumor necrosis factor receptor TNF-RII), TLR4 (Toll-Like Receptor 4), HMGB1 (High Mobility Group Box 1),
- Anti-inflammatory biomarkers (3): IL-4 (Interleukin-4), IL-10 (Interleukin-10), and IL-13 (Interleukin-13).
- Dual function (2): IL-33, sTNF-RII (depending on the context).
Furthermore, to include a biomarker associated with neurodegeneration and indirectly with neuroinflammation, we opted to determine the levels of Neurofilament Light Chain (NfL) in cerebrospinal fluid (CSF).
The selection of biomarkers included was decided based on data from previous literature.
Inflammatory and Anti-inflammatory factors were evaluated in plasma samples using a ProcartaPlex™ Human Inflammation Panel, 20plex kit (catalogue number: EPX200-12185-901; Thermo Fisher Scientific Inc., Waltham, MA, USA). The sample preparation was conducted in strict accordance with the manufacturer’s protocol. Detection was performed using xMAP® technology on the Luminex MAGPIX® instrument (Diasorin S.p.A., Saluggia VC, Italy) according to the manufacturer's instructions. Acquisition and analyses were performed using xPONENT® 4.3 software (Diasorin S.p.A., Saluggia VC, Italy). Quantification of HMGB1, sTNFR II, and TLR4 was performed using an ELISA kit from ElabScience® (Houston, TX, USA), with catalogue numbers E-EL-H1554, E-EL-H0109, and E-EL-H1539, respectively. Similarly, samples were tested for sTNFR II using a specific ELISA kit (Human sTNF RII/TNFRSF1B Quantikine® ELISA Kit DRT200; R&D Systems, Inc., Bio-Techne Ltd., Minneapolis, MN, USA) according to the manufacturer's instructions.
The UmanDiagnostics NF-light™ ELISA RUO kit (10-7002, Quanterix Corp., Billerica, MA, USA) was used for NfL measurement in CSF.
All ELISA procedures were implemented according to the manufacturer’s instructions. Samples were diluted according to the requirements of the corresponding kits. Duplications were made for each sample.
Analyses were performed following the manufacturers' standard protocols, with appropriate quality controls to ensure the accuracy and reliability of the results.
2.5. Demographic and Clinical Data
Sex, Age, Epilepsy onset, Duration of epilepsy, Type of seizures, Magnetic Resonance Imaging (MRI) findings, EEG findings, Aetiology, Frequency of seizures, Number of anti-seizure drugs, Number of actual Antiseizure medication (ASM) and Mechanism of action of ASM were retrospectively collected for each of the patients referred to the time of sample extraction.
2.6. Statistical Analysis
Statistical analysis was performed using SPSS 25.0 statistical software and included:
- Descriptive Analysis: Descriptive statistics (mean, standard deviation for continuous variables; frequencies and percentages for categorical variables) were calculated to characterize the three study populations. Normality tests (e.g., Shapiro-Wilk) were used to determine the distribution of continuous variables.
- Univariate Analysis: The concentrations of each of the 24 determinations of biomarkers were compared between the three groups (HC, SFE, DRE) using appropriate statistical tests. For continuous variables with normal distribution, analysis of variance (ANOVA) followed by post-hoc tests (Bonferroni) for pairwise comparisons was used. For continuous variables without normal distribution, the Kruskal-Wallis test followed by Dunn's post-hoc tests with Bonferroni correction was used. For categorical variables, the chi-square test or Fisher's exact test was used, as appropriate.
- Index Generation: Molecules that achieved statistical significance in the multivariate analysis, as well as those with results approaching significance, were selected. The index was designed to encompass both pro-inflammatory and anti-inflammatory factors.
- ROC Curve Analysis: To evaluate the diagnostic potential of biomarkers that showed significant differences in the univariate and/or multivariate analysis to discriminate between groups, Receiver Operating Characteristic (ROC) curve analyses were performed. The area under the curve (AUC) with its 95% CI, sensitivity, and specificity for different cut-off points were calculated. The optimal cut-off point was determined using the Youden's index.
- Multivariate Analysis: Multinomial logistic regression models were constructed to identify which biomarkers were independently associated with membership in the epilepsy groups (SFE and DRE) compared to the healthy control group, adjusting for potential confounding variables.
A p-value of < 0.05 was considered statistically significant for all analyses.
3. Results
3.1. Descriptive Analysis
A cohort of 68 patients was enrolled and stratified into three distinct groups: DRE group (n=38), SFE group (n=14), and the HC group (n=16).
Baseline demographic and clinical parameters, including age, sex, epilepsy duration, epilepsy onset, seizure type, MRI findings, aetiology, and the pharmacological mechanisms of action of anti-seizure medications (ASMs), were found to be homogeneous across the groups.
Conversely, statistically significant disparities were identified in interictal electroencephalogram (EEG) findings, seizure frequency, and the number of ASMs (detailed in Table 1).
3.2. Univariate Analysis
A univariate analysis was performed to quantify 23 molecules in plasma and 1 molecule in CSF. Descriptive results, expressed as mean (± SD) and median (IQR), along with statistical significance values, are detailed in Table 2. Statistical comparisons were conducted using ANOVA for normally distributed data and the Kruskal-Wallis test for non-normally distributed data.
While most analyses showed no significant differences, a notable exception was plasma ICAM-1, which exhibited a statistically significant difference (p=0.0305) when comparing medians across the three groups.
3.3. Index Generation
IDREI was constructed using a selection of variables from the univariate analysis that demonstrated either statistical significance or a trend towards significance. This approach is intended to reflect the "inflammatory state" in the patient by incorporating both pro-inflammatory factors, specifically ICAM-1 (p=0.0035) and NfL (p=0.145), and anti-inflammatory factors, namely IL-10 (p=0.116) and IL-4 (p=0.169).
The IDREI was formulated as:
All molecular concentrations were expressed in pg/ml. The newly generated IDREI variable underwent a non-parametric comparison of medians using the Kruskal-Wallis test, which yielded a statistically significant result (p=0.002). Detailed results for the IDREI are presented in Table 3.
To ensure the validity of the constructed index, we assessed multicollinearity among its constituent variables. This was achieved by calculating the Variance Inflation Factor (VIF). An index is generally considered valid if the VIF is less than 5, a condition that was met in our analysis (Table 4).
3.4. ROC Curve Analysis
A ROC curve analysis was performed for ICAM-1 and the newly generated variable (IDREI) using the DRE group as a reference category (Figure 1 &2). The area under the curve (AUC) was 0.706 (CI: 0,581-0,830) for ICAM-1 and 0.731 (CI: 0,608-0,854) for IDREI. Figure 3 displays a box plot illustrating the distribution of IDREI values across the different study groups.
The optimal cut-off point for the IDREI variable, specifically for the DRE category, was determined using the Youden Index. This calculation yielded a value of 34.53, which corresponded to a sensitivity of 63.2% and a specificity of 77.8%.
3.5. Multivariate Analysis
A multivariate logistic regression model was constructed to assess the independent contributions of selected variables. This model incorporated all statistically significant variables identified in preliminary analyses, alongside variables deemed clinically relevant, with particular emphasis on those components of the IDREI. The outcomes of this multivariate analysis are presented in Table 5. The model demonstrated a robust fit, evidenced by a Nagelkerke's Pseudo R-squared value of 0.543, indicating a substantial proportion of explained variance in the dependent variable.
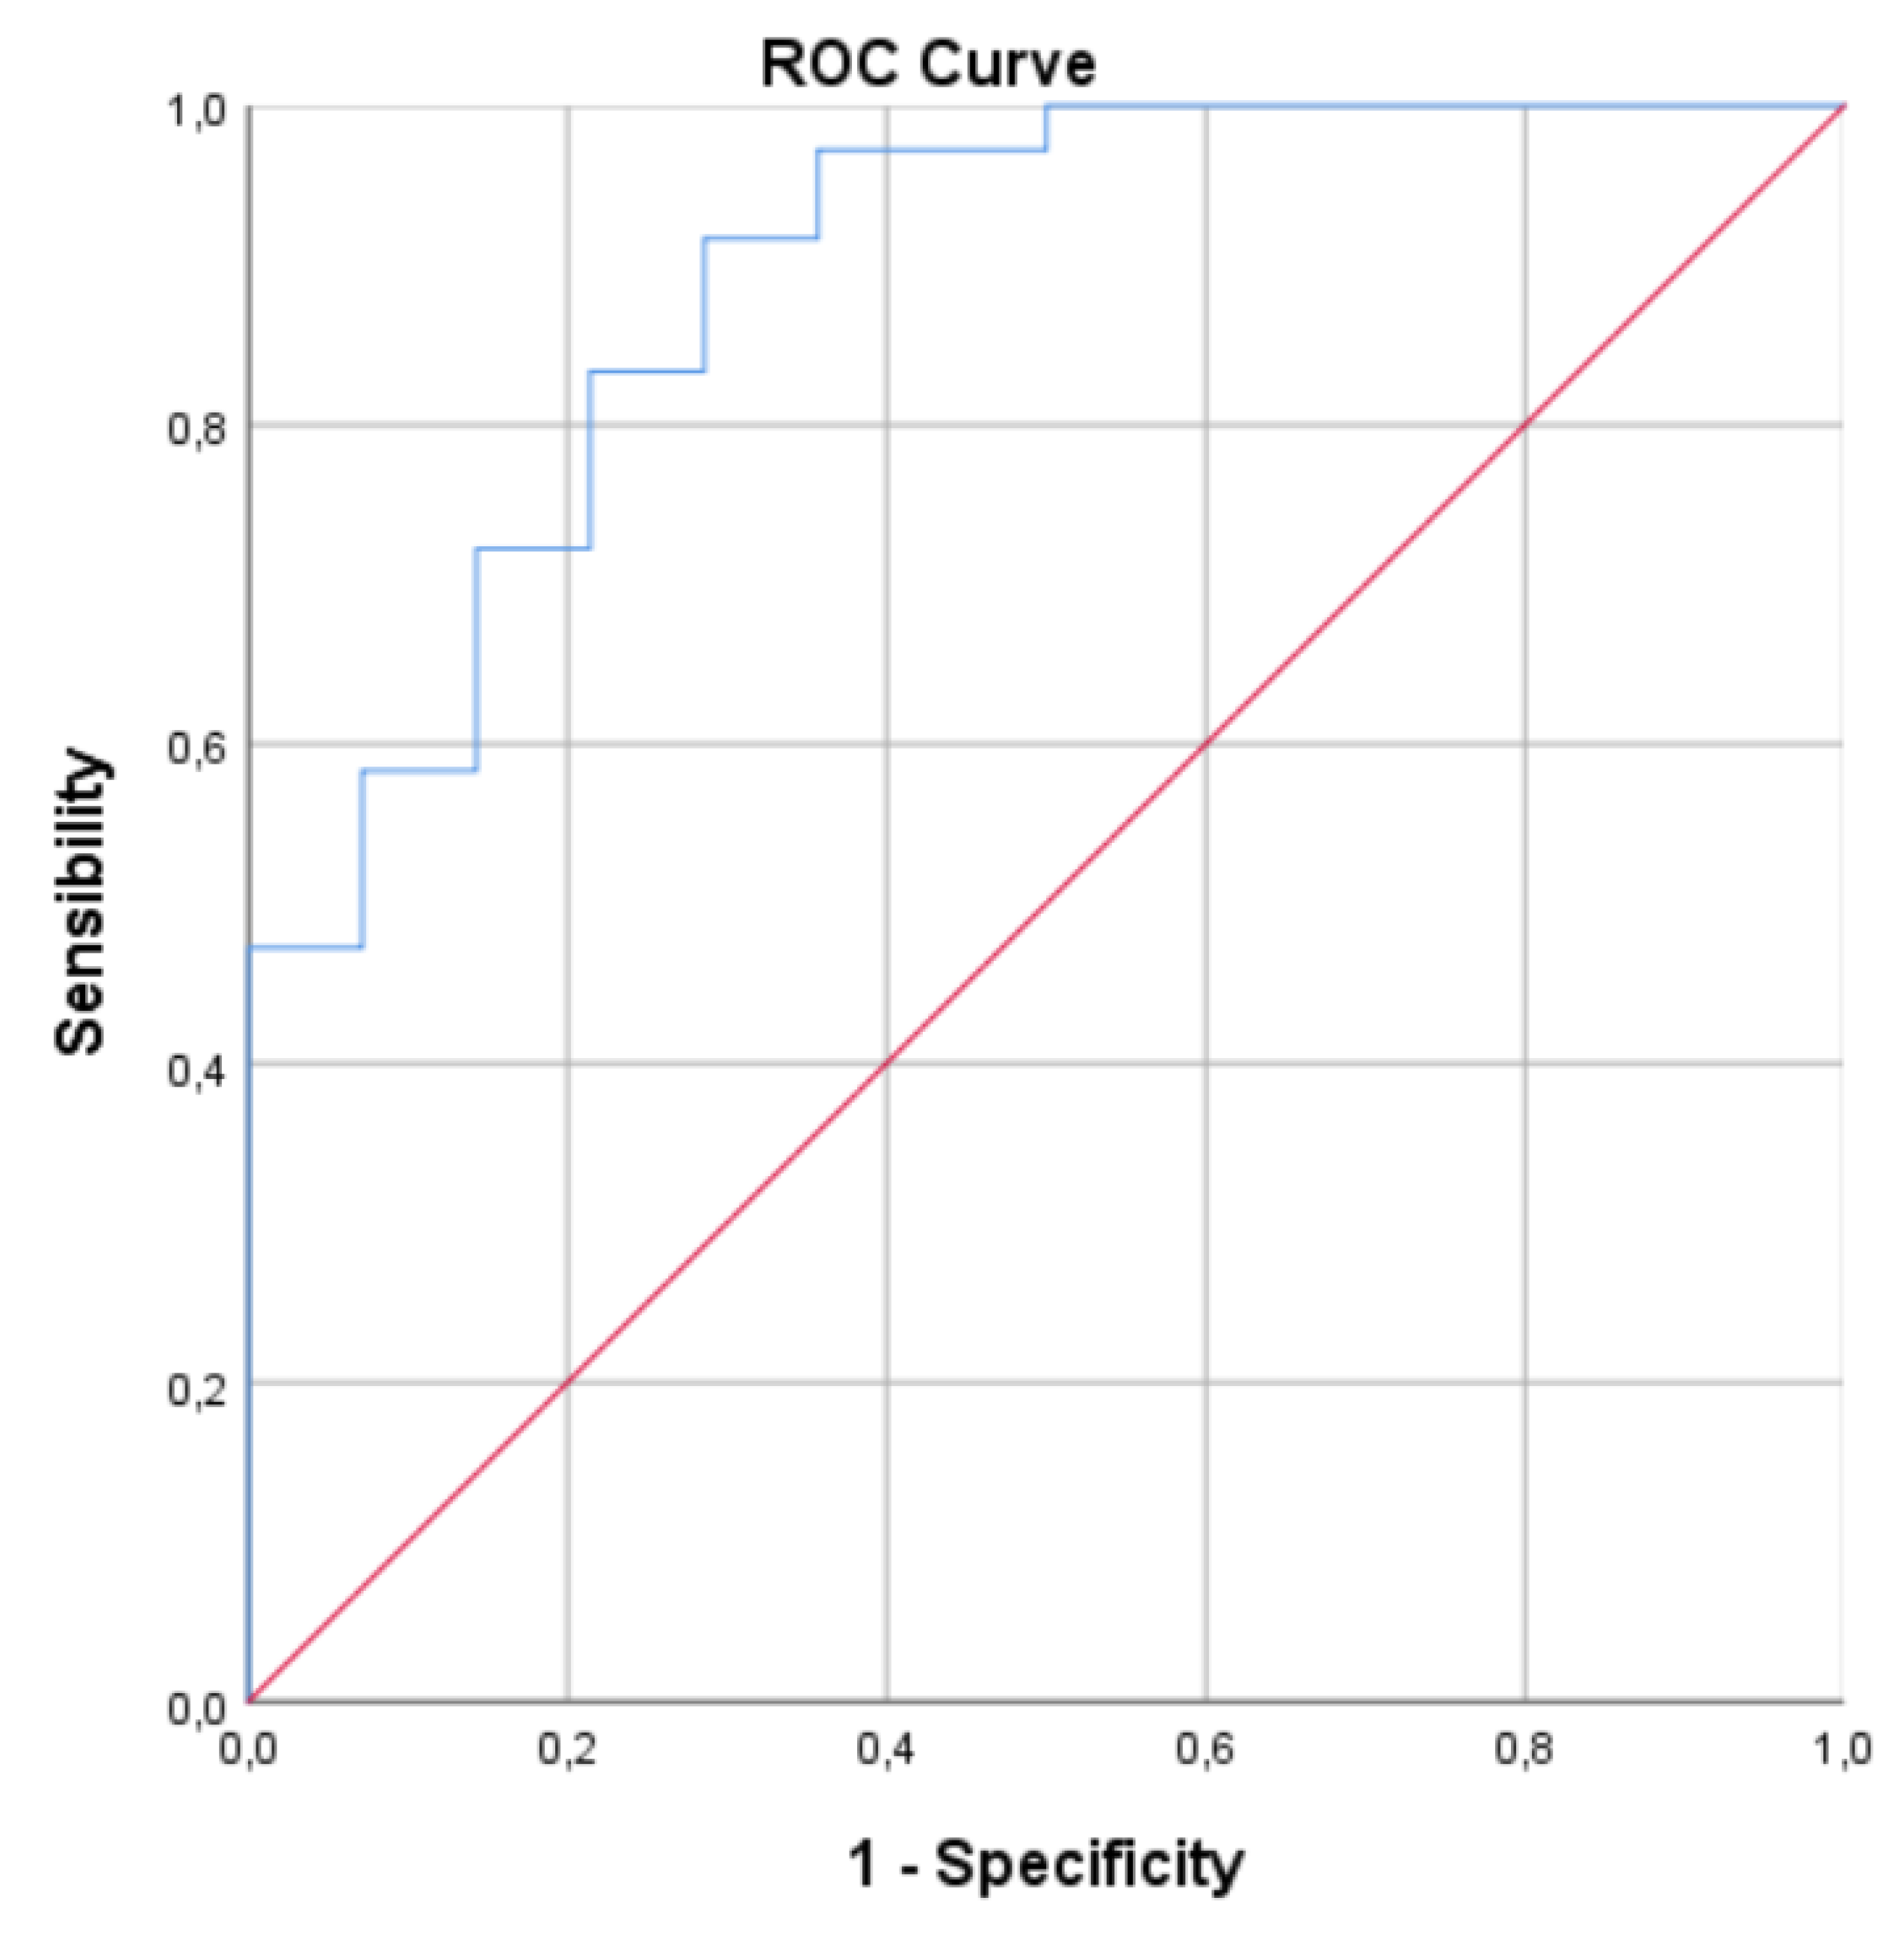
Once the model was built, an ROC Curve was constructed for this model, which obtained an AUC of 0.891 (CI: 0.791-0.991) (Fig. 5)
3.6. Figures, Tables and Schemes

Table 1.
Clinical and demographic variables. MRI: Magnetic Resonance Imaging. EEG: Electroencephalografy. IED: Interictal epileptiforms discharges. SV2A: Synaptic vesicle glycoprotein 2A modulators.
Table 1.
Clinical and demographic variables. MRI: Magnetic Resonance Imaging. EEG: Electroencephalografy. IED: Interictal epileptiforms discharges. SV2A: Synaptic vesicle glycoprotein 2A modulators.
| HC (n=16) | SFE (n=14) | DRE (n=38) | p | ||
|---|---|---|---|---|---|
| Sex (%) | Male | 31,25 (5/16) | 42,85 (6/14) | 39,47 (15/38) | 0,78 |
| Female | 68,75 (11/16) | 57,15 (8/14) | 60,52 (23/38) | ||
| Age (+/-SD) | 47,44 (19,94) | 54,40 (15,70) | 52,08 (14,22) | 0,46 | |
| Clinical onset (+/- SD) | N/A | 37,21 (21,18) | 27,89 (15,35) | 0,09 | |
| Duration of epilepsy (+-SD) | N/A | 16,29 (15,71) | 23,39 (13,44) | 0,11 | |
| Type of seizures (%) | Focal Seizures | N/A | 78,57 (11/14) | 42,10 (16/38) | 0,147 |
| Focal and Bilteral tonico-clonic seizures | N/A | 21,42 (3/14) | 57,89 (22/38) | ||
| MRI findings (%) | Normal | N/A | 78,57 (11/14) | 52,63 (20/38) | 0,083 |
| Abnormal | N/A | 21,42 (3/14) | 47,36 (18/38) | ||
| EEG findings (%) | Focal IED | N/A | 42,85 (6/14) | 65,79 (25/38) | 0,007 |
| Multifocal IED | N/A | 7,14 (1/14) | 23,68 (9/38) | ||
| No IED | N/A | 50 (7/14) | 10,52 (4/38) | ||
| Etiology (%) | Hippocampal sclerosis | N/A | 21,42 (3/14) | 28,9 (11/38) | 0,082 |
| Focal Cortical Dysplasia | N/A | 0 (0/14) | 10,52 (4/38) | ||
| Gliotic lession | N/A | 0 (0/14) | 5,26 (2/38) | ||
| Encephalocele | N/A | 0 (0/14) | 2,63 (1/38) | ||
| Non lessional | N/A | 78,57 (11/14) | 52,63 (20/38) | ||
| Seizure frequency | Daily | N/A | 0 (0/14) | 26,31 (10/38) | <0,001 |
| Weekly | N/A | 0 (0/14) | 36,84 (14/38) | ||
| Monthly | N/A | 0 (0/14) | 21,05 (8/38) | ||
| Annual | N/A | 0 (0/14) | 15,78 (6/38) | ||
| Concurrent ASMs (+-SD) | N/A | 1,57 (0,94) | 2,55 (0,86) | 0,002 | |
| Mechanism of action of ASM (%) | Sodium channel blokers | N/A | 71,42 (10/14) | 89,47 (34/38) | 0,081 |
| Gabaergic | N/A | 28,57 (4/14) | 36,84 (14/38) | ||
| SV2A | N/A | 28,57 (4/14) | 55,26 (21/38) | ||
Table 2.
Comparation of Levels of Biomarkers by group. SD: Standard Deviation. IQR: Interquartile range. All determinations are expressed in pg/ml.
Table 2.
Comparation of Levels of Biomarkers by group. SD: Standard Deviation. IQR: Interquartile range. All determinations are expressed in pg/ml.
| Mean (SD) | Median (IQR) | p | |||||
|---|---|---|---|---|---|---|---|
| HC (n=16) | SFE (n=14) | DRE (n=38) | HC (n=16) | SFE (n=14) | DRE (n=38) | ||
| Plasmatic biomarkers | |||||||
| MIP-1a (CCL3) | 2,37 (3,16) | 6,20 (12,92) | 3,83 (5,87) | 1,12 (2,00) | 2,62 (4,27) | 1,73 (2,39) | 0,318 |
| IL-1b | 9,82 (8,51) | 5,27 (2,78) | 6,98 (4,50) | 6,42 (8,53) | 4,02 (4,22) | 5,85 (6,78) | 0,220 |
| IL4 | 12,37 (9,42) | 7,64 (2,76) | 8,50 (4,15) | 9,11 (7,90) | 7,71 (4,15) | 8,61 (5,48) | 0,169 |
| IP-10 (CXCL10) | 2,28 (1,57) | 3,62 (2,33) | 3,10 (1,99) | 1,89 (2,11) | 3,08 (4,48) | 2,39 (3,50) | 0,161 |
| IL8 (CXCL8) | 1,40 (0,24) | 1,10 (0,53) | 1,24 (0,54) | 1,40 (0,41) | 1,21 (1,18) | 1,23 (0,54) | 0,294 |
| IL10 | 1,97 (1,42) | 1,12 (0,63) | 1,43 (0,90) | 1,55 (1,65) | 0,97 (0,97) | 1,31 (1,34) | 0,116 |
| IL12 | 40,60 (29,96) | 20,72 (14,24) | 28,59 (21,69) | 39,53 (37,46) | 13,43 (27,46) | 27,38 (33,89) | 0,095 |
| IL13 | 9,42 (5,65) | 9,55 (4,79) | 8,73 (4,99) | 6,08 (7,15) | 11,29 (8,46) | 7,24 (6,60) | 0,636 |
| IL17A | 6,94 (3,34) | 7.06 (3,15) | 6,98 (2,75) | 6,40 (4,44) | 6,52 (5,19) | 6,19 (2,15) | 0,971 |
| IL33 | 4,73 (2,85) | 3,53 (1,15) | 4,42 (2,87) | 3,90 (4,06) | 3,50 (1,89) | 3,49 (3,35) | 0,663 |
| IFN-g | 2,87 (3,91) | 6,64 (5,51) | 5,41 (5,79) | 1,05 (1,59) | 8,02 (10,73) | 1,50 (33,56) | 0,181 |
| GM-CSF | 54,20 (31,67) | 34,50 (24,57) | 42,47 (31,49) | 48,88 (38,58) | 23,16 (48,54) | 36,50 (43,18) | 0,160 |
| TNF-a | 13,81 (6,24) | 14,80 (6,84) | 15,65 (6,84) | 12,76 (9,02) | 13,32 (9,00) | 14,99 (8,80) | 0,504 |
| MIP1-b | 11,96 (4,60) | 12,04 (4,63) | 14,45 (11,56) | 10,50 (8,63) | 10,02 (7,02) | 11,00 (5,90) | 0,375 |
| IFN-a | 1,03 (0,84) | 1,42 (0,80) | 1,20 (0,73) | 0,72 (1,25) | 1,32 (1,28) | 0,95 (1,06) | 0,422 |
| MCP-1 | 10,34 (6,08) | 17,95 (11,08) | 13,96 (8,26) | 9,64 (8,14) | 18,34 (17,40) | 11,42 (11,49) | 0,145 |
| P-SELECTINE | 16005,10 (39258,50) | 17186,03 (9084,97) | 23688,20 (46499,29) | 10260,24 (12498,80) | 20237,49 (18099,64) | 13435,29 (14714,05) | 0,538 |
| IL1-a | 0,57 (0,37) | 0,41 (0,24) | 0,68 (1,14) | 0,48 (0,54) | 0,32 (0,34) | 0,50 (0,31) | 0,285 |
| ICAM-1 | 35193,99 (118445,28) | 50128,29 (34555,28) | 351519,10 (983829,16) | 33781,59 (92659,30) | 43290,99 (40665,20) | 67975,41 (170840,08) | 0,035 |
| E-SELECTINE | 5442,02 (3718,05) | 6659,13 (4264,43) | 6268,81 (4044,53) | 5913,69 (5589,29) | 6946,73 (7445,26) | 5560,47 (7085,13) | 0,809 |
| rsTNF-RII | 2083,04 (789,64) | 2370,70 (476,90) | 2368,34 (767.92) | 1719,94 (845,10) | 2424,01 (759,34) | 2420,43 (1089,06) | 0,271 |
| TRL4 | 2323,72 (1404,43) | 2777,24 (3053,35) | 2421,90 (2070,78) | 2043,52 (1963,93) | 1705,35 (1236,20) | 1883,44 (1384,76) | 0,804 |
| HMGB | 9919,10 (11223,93) | 9385,59 (7822,42) | 6870,22 (3727, | 6586,39 (7592,98) | 6635,64 (4578,25) | 6121,22 (3891,71) | 0,442 |
| CSF biomarker | |||||||
| NfL | 391,61 (317,45) | 683,09 (693,19) | 596,82 (617,01) | 236,10 (343,15) | 398,99 (501,51) | 462,77 (415,50) | 0,145 |
Table 3.
Comparation of IDREI values by group.
| Variable | Tolerance | VIF |
| IL4 | 0,611 | 1,636 |
| IL10 | 0,603 | 1,657 |
| ICAM-1 | 0,981 | 1,020 |
| NfL | 0,997 | 1,003 |
Table 4.
Collinearity analysis for variables included in IDREI.
| Chi-square | P | |
| Concomitant ASM | 3,357 | 0,067 |
| Clinical onsed | 0,756 | 0,385 |
| IL10 | 1,304 | 0,254 |
| ICAM-1 | 5,047 | 0,025 |
| NfL | 0,530 | 0,467 |
| IL4 | 1,026 | 0,311 |
| EEG findings | 1,692 | 0,429 |
| Type of seizures | 0,014 | 0,906 |
Table 5.
Multivariate model.
Figure 1.
ROC for ICAM-1. AUC: 0.706 (CI: 0,581-0,830).
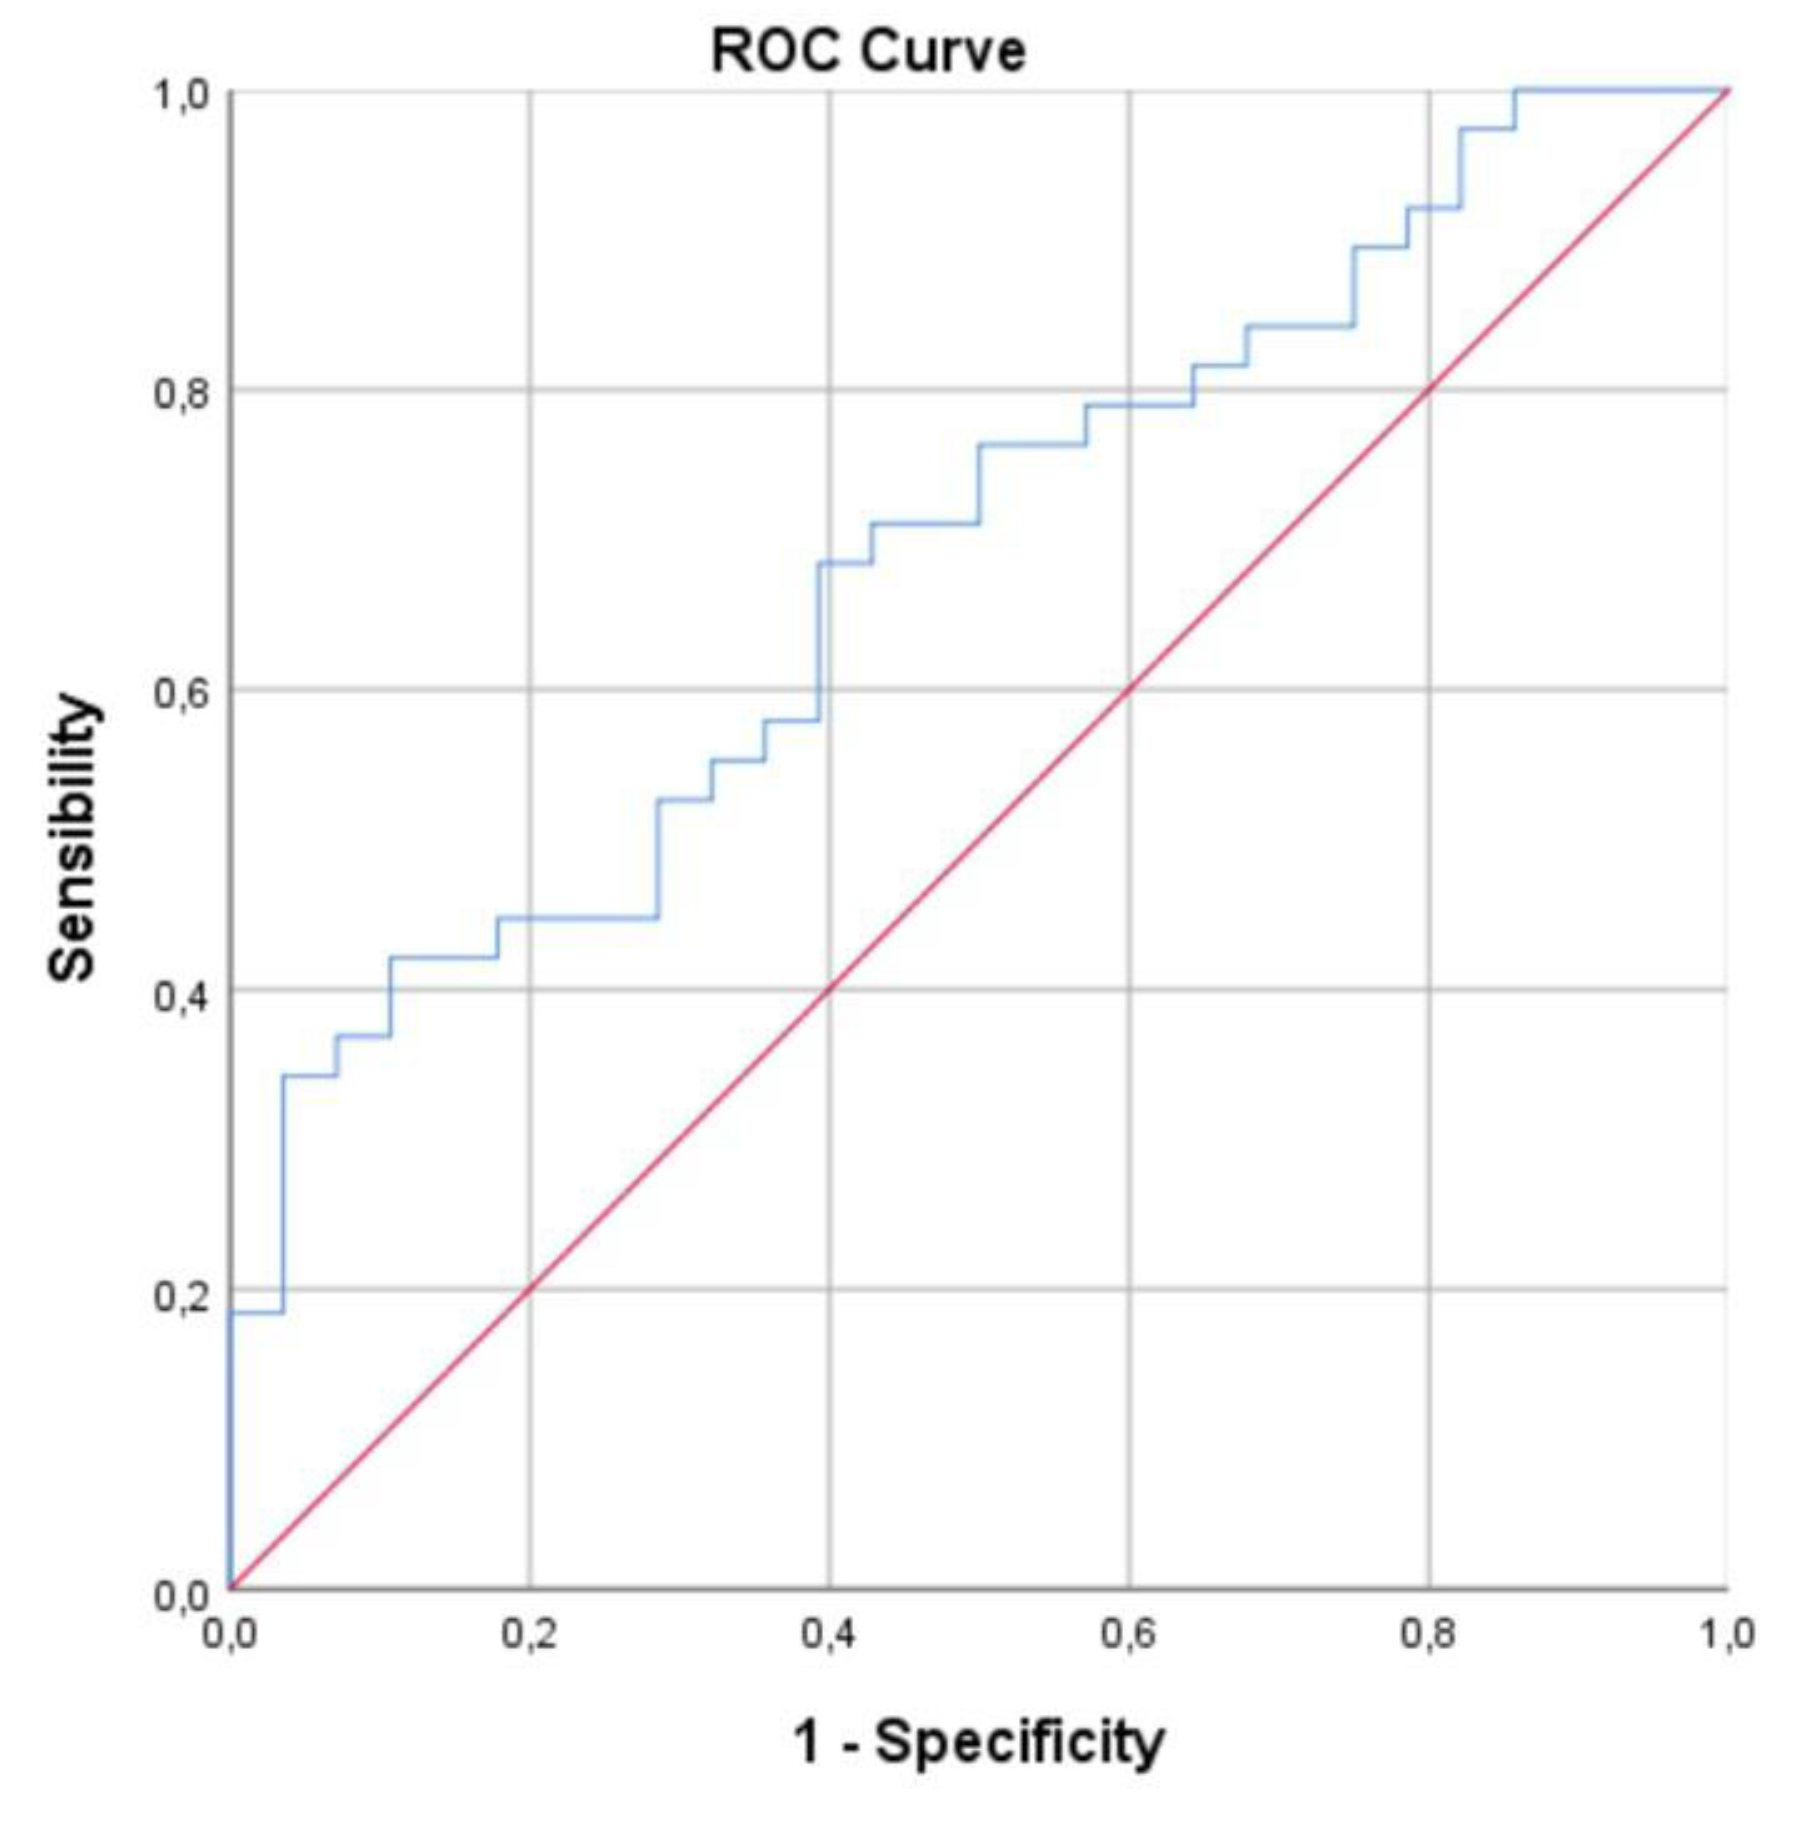
Figure 2.
ROC for IDREI. AUC: 0.731 (CI: 0,608-0,854).
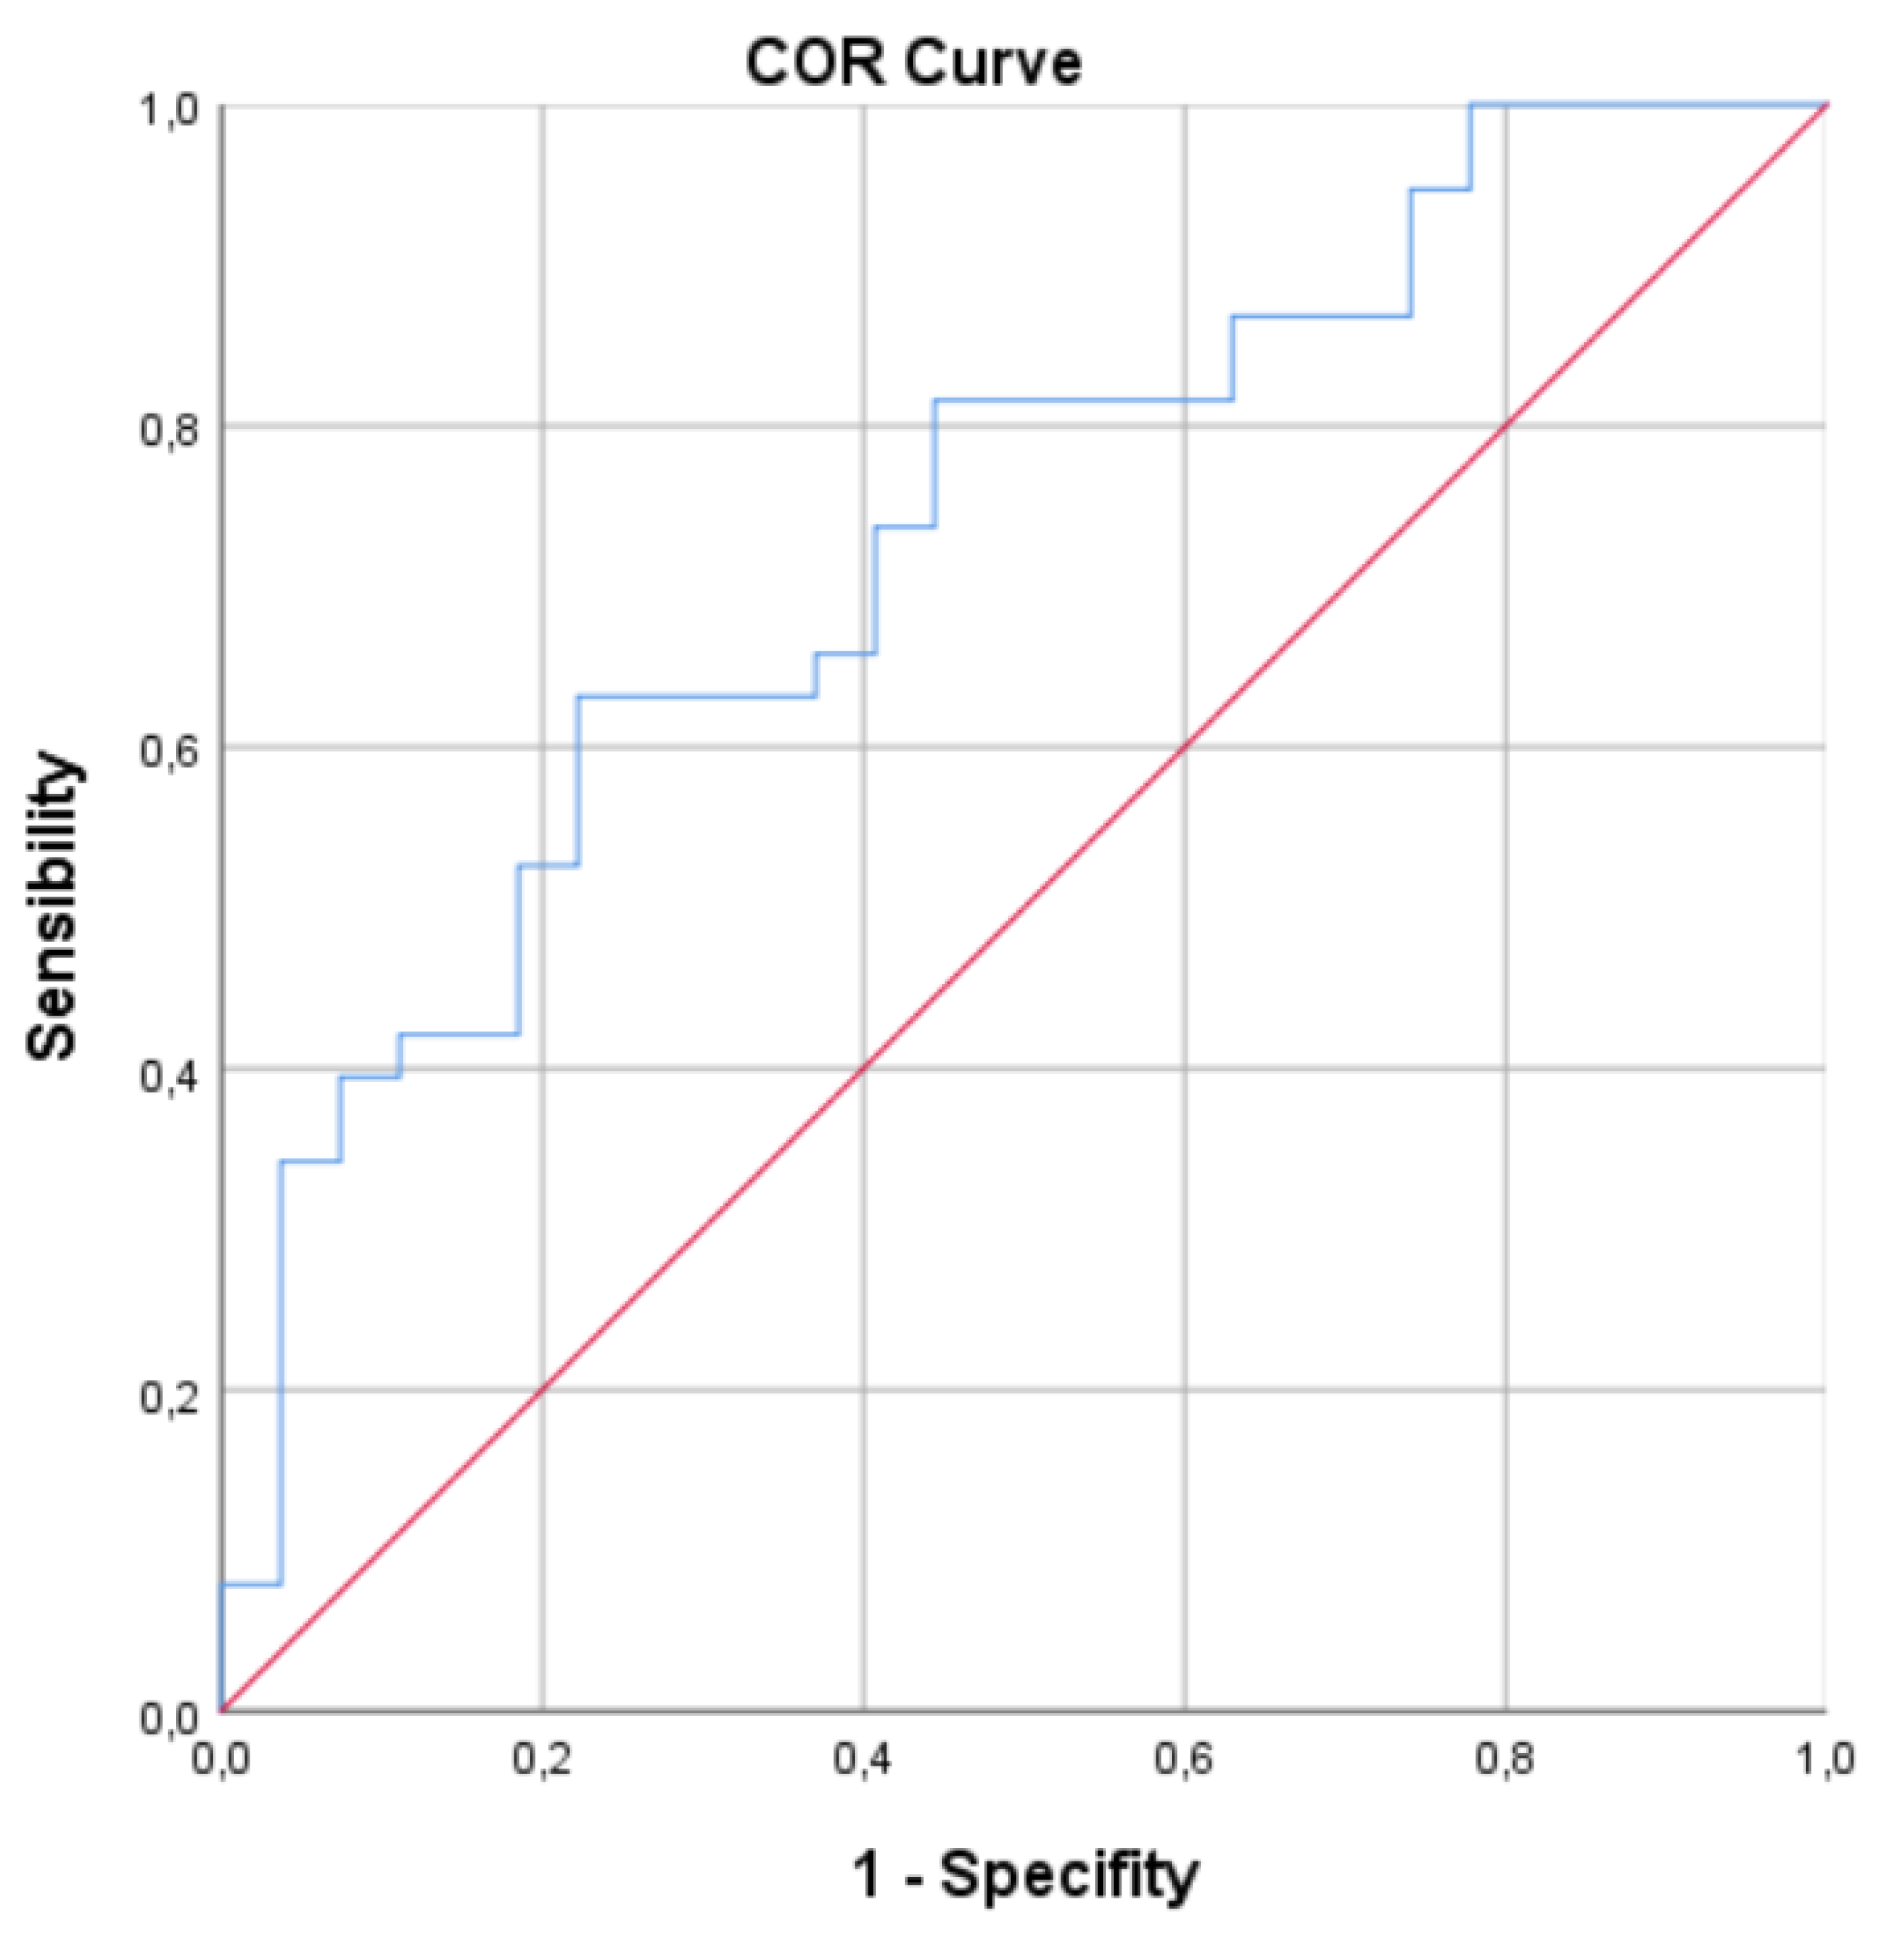
Figure 3.
Box plot illustrating the distribution of IDREI values across the different study groups.
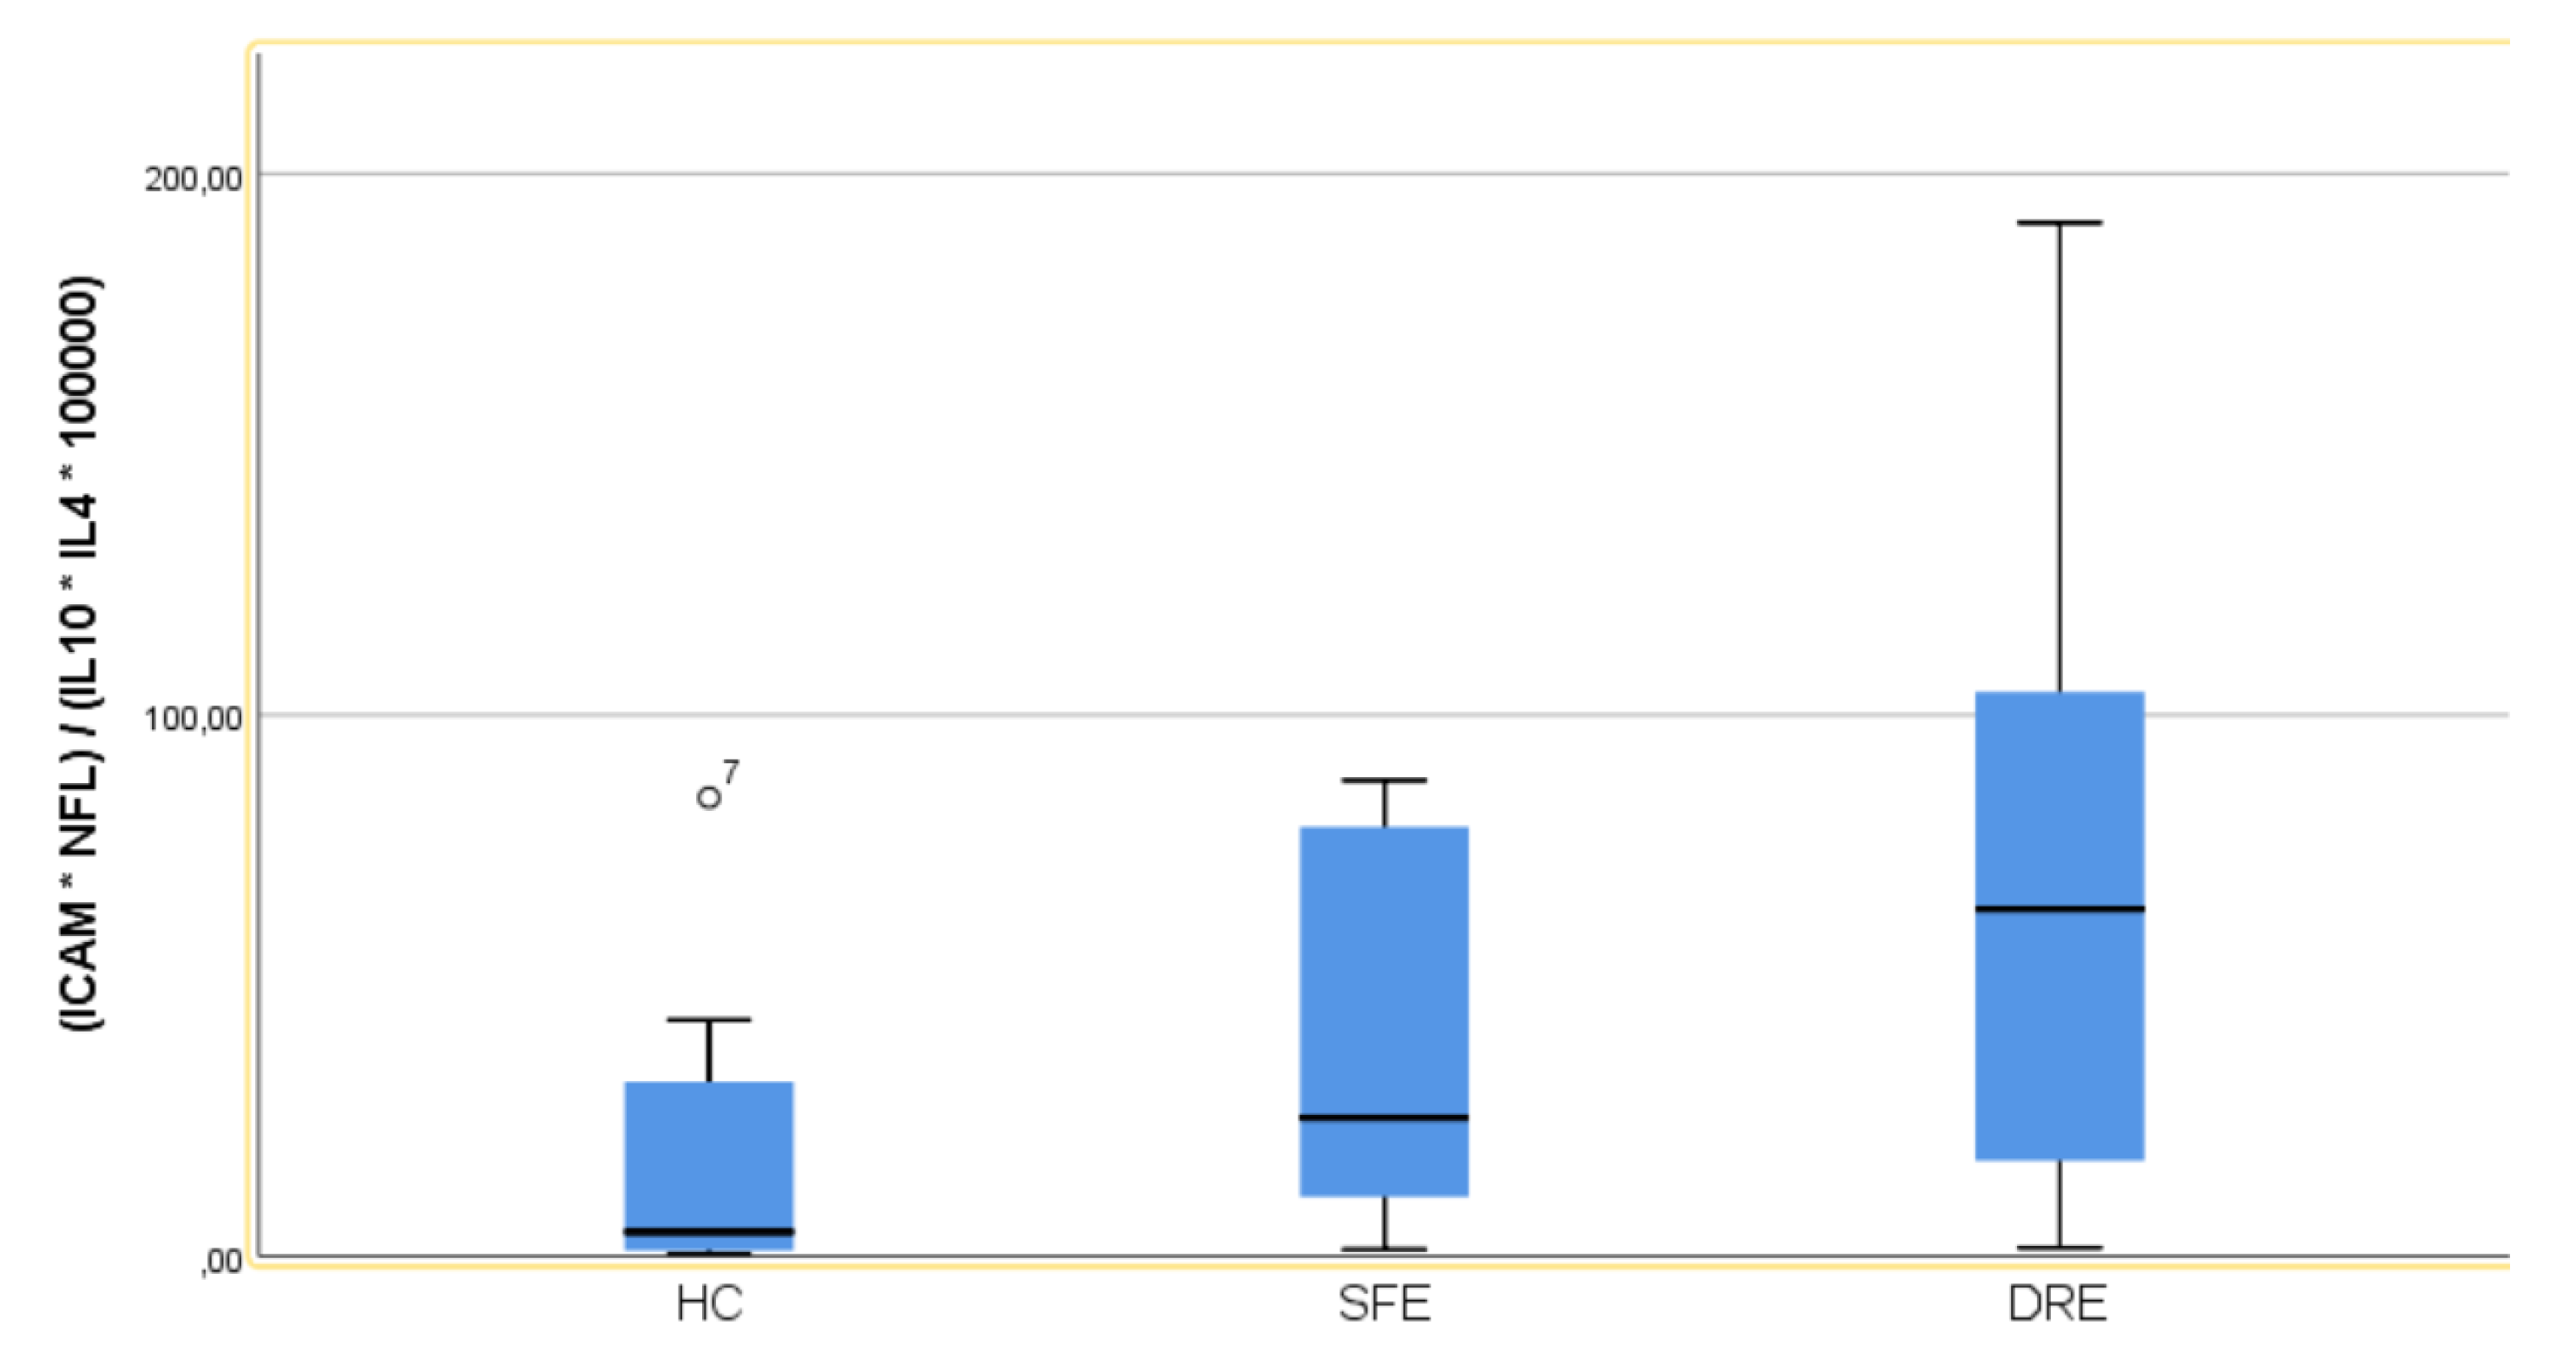
Figure 4.
ROC for Multivariate model. AUC of 0.891 (95% CI: 0.791−0.991).
4. Discusion:
Our investigation reveals that patients diagnosed with epilepsy, and more specifically those with DRE, exhibit a notable imbalance in circulating pro-inflammatory and anti-inflammatory factors. Among the panel of molecules analysed in plasma, ICAM-1 emerged as the sole biomarker demonstrating statistical significance in both univariate and multivariate analyses. This finding underscores the potential centrality of ICAM-1 in the inflammatory dysregulation observed in these patient populations.
ICAM-1, a transmembrane glycoprotein, plays a crucial role in the immune system, particularly in mediating leukocyte recruitment and extravasation to sites of inflammation [17]. Its expression, typically low under basal conditions, is rapidly upregulated on endothelial cells in response to various inflammatory mediators, including cytokines like TNF-α and IL-1β [18]. This increased expression facilitates the adhesion and transmigration of leukocytes across the blood-brain barrier (BBB), a critical step in neuroinflammatory processes [19].
In the context of epilepsy, neuroinflammation and BBB dysfunction are increasingly recognized as key mechanisms contributing to epileptogenesis [20,21]. While some studies have not found significant differences in serum ICAM-1 levels in interictal epilepsy patients compared to controls [22], others suggest an upregulation of ICAM-1 and other adhesion molecules (e.g., VCAM) in epileptic patients, indicating increased BBB permeability [23]. Animal models of epilepsy have further demonstrated that seizures induce elevated expression of vascular cell adhesion molecules and enhance leukocyte rolling and arrest in brain vessels. Importantly, inhibition of these leukocyte-vascular interactions has been shown to reduce seizures and prevent BBB damage, highlighting a pathogenetic link between leukocyte-endothelial adhesion and seizure generation [24]. Thus, ICAM-1's involvement in regulating leukocyte trafficking and potentially influencing BBB integrity positions it as a significant contributor to the complex neuroinflammatory cascade observed in patients with epilepsy, potentially impacting disease progression and severity.
For enhanced diagnostic precision in epilepsy, particularly in DRE, the development of an index reflecting the nuanced inflammatory balance is crucial. Such an index should integrate both pro-inflammatory and anti-inflammatory molecular markers. Based on our findings, we propose an index incorporating molecules with demonstrated pro-inflammatory potential alongside those exhibiting an anti-inflammatory profile that achieved statistical significance or approached it. Specifically, this latter group includes ICAM-1, NfL, IL-4, and IL-10.
NfL is a crucial biomarker of neuronal damage, reflecting axonal injury when released into the CSF and blood [25]. NfL itself, in addition, might contribute to neuroinflammation by activating immune cells like microglia, creating a self-perpetuating cycle of damage and inflammation [26]. Furthermore, NfL might help identify underlying mechanisms in refractory epilepsy, with some studies suggesting a correlation between NfL levels and cognitive impairment in epileptic patients [27].
Combining CSF NfL with specific plasma neuroinflammatory biomarkers could offer a more comprehensive understanding of the disease [28].
Anti-inflammatory cytokines such as IL-10 and IL-4 are key players in mitigating the detrimental effects of neuroinflammation and may offer therapeutic avenues in preventing or ameliorating epilepsy. IL-10, a potent immunoregulator, primarily inhibits the synthesis of pro-inflammatory cytokines, suppresses T-cell proliferation, and modulates microglial activation, thereby limiting neuronal damage and excitotoxicity often associated with seizures [29]. Similarly, IL-4, often associated with a T-helper 2 (Th2) immune response, can shift microglial phenotypes towards an anti-inflammatory, neuroprotective state, promoting tissue repair and reducing oxidative stress, both critical in preventing aberrant neuronal hyperexcitability [30].
The interrelationship between the levels of these 4 biomarkers can offer us an idea of the stage of neuroinflammatory balance higher than that of each molecule separately, thus improving our diagnostic capacity for DRE.
We propose the Inflammatory Drug-Resistant Epilepsy Index (IDREI), a novel biomarker derived from plasma concentrations of ICAM-1, IL-4, and IL-10 and CSF levels of NfL, for the prediction of DRE. Our study findings indicate that the IDREI demonstrates a 73.1% (95% CI: 70.8%-85.4%) probability of accurately classifying patients with DRE. An optimal cut-off point of 34.53 for the IDREI yielded a sensitivity of 63.2% and a specificity of 77.8%, suggesting a moderate-to-good discriminatory capacity.
Furthermore, the predictive power of the model was significantly enhanced through multivariate analysis, incorporating both clinical and demographic data alongside the biological parameters. This comprehensive approach improved the predictive capacity to 0.891 (95% CI: 0.791-0.991), indicating a very good performance of the refined predictive model.
Our study acknowledges several limitations, primarily concerning the small sample size, which may compromise statistical power, and its retrospective design. Furthermore, the integration of both plasma and CSF biomarkers presents a methodological challenge in clinical application. While recent advancements enable reliable plasma NfL determinations, the sustained validity of the index when utilizing plasma NfL requires specific validation.
5. Conclusions
Timely and precise identification of drug resistance is crucial for optimizing therapeutic strategies in the management of epilepsy. Numerous neuroinflammatory molecular biomarkers are intricately involved in the fundamental processes of epileptogenesis, and they hold significant promise as prognostic indicators. These biomarkers may enable the classification of patients based on their anticipated response to ASMs.
Often, the integration of multiple biomarkers can yield superior discriminative capacity compared to individual markers. This enhanced utility stems from their ability to collectively reflect the nuanced balance of neuroinflammation within the patient. The IDREI serves as a compelling example of such types of a composite index. Ultimately, the prospective clinical utility of the IDREI necessitates rigorous corroboration through well-designed prospective investigations.
Funding
This research was funded by Fundación Pública Andaluza Progreso y Salud, grant number PIP-0123-2022 “Personalized medicine in neurological diseases through the application of biomarkers for improving the diagnosis, prognosis and treatment of the patient”.
Institutional Review Board Statement
The study was conducted in accordance with the Declaration of Helsinki, and approved by the Institutional Review Board (or Ethics Committee) of Comité coordinador de ética de la investigación biomédica de Andalucía (protocol code 1228-N-23, date of approval: 25 July of 2023.
Informed Consent Statement
Informed consent was obtained from all subjects involved in the study.
Data Availability Statement
Dataset available on request from the authors.
Conflicts of Interest
The authors declare no conflicts of interest.
Abbreviations
The following abbreviations are used in this manuscript:
| DRE | Drug-Resistant epilepsy |
| SFE | Seizure-free epilepsy |
| HC | Healthy control |
| IDREI | Inflammatory Drug-Resistant Epilepsy Index |
| AUC | Area under the curve |
| ROC | Receiver Operating Characteristic |
| CI | Confidence interval |
| IQR | Interquartile range |
References
- Serrano-Castro, P.J.; Mauri-Llerda, J.A.; Hernandez-ramos, F.J.; Sanchez-alvarez, J.C.; Parejo-carbonell, B.; Quiroga-subirana, P.A.; et al. Adult prevalence of epilepsy in Spain: EPIBERIA, a population-based study. Sci World J. 2015, 2015. [Google Scholar] [CrossRef] [PubMed]
- Sander, J.W. The epidemiology of epilepsy revisited. Curr Opin Neurol. 2003, 16, 165–170. [Google Scholar] [CrossRef] [PubMed]
- García-martín, G.; Serrano-castro, P.J. Epidemiología de la epilepsia en España y Latinoamérica. 2018, 67, 249–262. [Google Scholar] [CrossRef] [PubMed]
- Forsgren, L.; Beghi, E.; Oun a Sillanpää, M. The epidemiology of epilepsy in Europe - a systematic review. Eur J Neurol. 2005, 12, 245–253. [Google Scholar] [CrossRef]
- Scheffer, I.E.; Berkovic, S.; Capovilla, G.; Connolly, M.B.; French, J.; Guilhoto, L.; et al. ILAE classification of the epilepsies: Position paper of the ILAE Commission for Classification and Terminology. Epilepsia. 2017, 58, 512–521. [Google Scholar] [CrossRef]
- Aguilar-Castillo, M.J.; Cabezudo-García, P.; Ciano-Petersen, N.L.; García-Martin, G.; Marín-Gracia, M.; Estivill-Torrús, G.; et al. Immune Mechanism of Epileptogenesis and Related Therapeutic Strategies. Biomedicines. 2022, 10, 716. [Google Scholar] [CrossRef]
- Myers, K.A.; Scheffer, I.E. Precision Medicine Approaches for Infantile-Onset Developmental and Epileptic Encephalopathies. 2021. [Google Scholar] [CrossRef]
- Yu, J.Y.; Pearl, P.L. Metabolic Causes of Epileptic Encephalopathy. Epilepsy Res Treat. 2013, 2013, 1–20. [Google Scholar] [CrossRef]
- Matin, N.; Tabatabaie, O.; Falsaperla, R.; Lubrano, R.; Pavone, P.; Mahmood, F.; et al. Epilepsy and innate immune system: A possible immunogenic predisposition and related therapeutic implications. Hum Vaccin Immunother. 2015, 11, 2021–2029. [Google Scholar] [CrossRef]
- Terrone, G.; Balosso, S.; Pauletti, A.; Ravizza, T.; Vezzani, A. Inflammation and reactive oxygen species as disease modifiers in epilepsy. Neuropharmacology. 2020, 167. [Google Scholar] [CrossRef]
- Webster, K.M.; Sun, M.; Crack, P.; O’Brien, T.J.; Shultz, S.R.; Semple, B.D. Inflammation in epileptogenesis after traumatic brain injury. J Neuroinflammation. 2017, 14. [Google Scholar] [CrossRef] [PubMed]
- Lucas, S.M.; Rothwell, N.J.; Gibson, R.M. The role of inflammation in CNS injury and disease. Br J Pharmacol. 2006, 147, 232–240. [Google Scholar] [CrossRef] [PubMed]
- Brodie, M.J. Diagnosing and predicting refractory epilepsy. Acta Neurol Scand. 2005, 112, 36–39. [Google Scholar] [CrossRef]
- Kwan, P.; Brodie, M. EARLY IDENTIFICATION OF REFRACTORY EPILEPSY. N Engl J Med. 2000, 342, 314–319. [Google Scholar] [CrossRef]
- Aguilar-Castillo, M.J.; Cabezudo-García, P.; García-Martín, G.; Lopez-Moreno, Y.; Estivill-Torrús, G.; Ciano-Petersen, N.L.; et al. A Systematic Review of the Predictive and Diagnostic Uses of Neuroinflammation Biomarkers for Epileptogenesis. Int J Mol Sci. 2024, 25, 6488. [Google Scholar] [CrossRef]
- Asadi-Pooya, A.A.; Farazdaghi, M. Definition of drug-resistant epilepsy: A reappraisal based on epilepsy types. Acta Neurol Scand. 2022, 145, 627–632. [Google Scholar] [CrossRef]
- Miller, M.R.; Landis, H.E.; Miller, R.E.; Tizabi, Y. Intercellular Adhesion Molecule 1 (ICAM-1): An Inflammatory Regulator with Potential Implications in Ferroptosis and Parkinson’s Disease. Cells 2024, 13. [Google Scholar] [CrossRef] [PubMed]
- Vignarajah, M.; Wood, A.J.T.; Nelmes, E.; Subburayalu, J.; Herre, J.; Nourshargh, S.; et al. Regulation of ICAM-1 in human neutrophils. J Leukoc Biol. 2024, 116, 901–908. [Google Scholar] [CrossRef]
- Mizee, M.; van Doorn, R.; Prat, A.; de Vries, H.E. Blood-Brain Barrier Disruption in Multiple Sclerosis. The Blood-Brain Barrier in Health and Disease: Volume 2: Pathophysiology and Pathology. 2015, pp 1–22.
- Soltani Khaboushan, A.; Yazdanpanah, N.; Rezaei, N. Neuroinflammation and Proinflammatory Cytokines in Epileptogenesis. Mol Neurobiol. 2022, 59, 1724–1743. [Google Scholar] [CrossRef]
- Vezzani, A.; French, J.; Bartfai, T.; Baram, T.Z. The role of inflammation in epilepsy. Nat Rev Neurol. 2011, 7, 31–40. [Google Scholar] [CrossRef]
- Bronisz, E.; Cudna, A.; Wierzbicka, A.; Kurkowska-Jastrzębska, I. Blood-Brain Barrier-Associated Proteins Are Elevated in Serum of Epilepsy Patients. Cells 2023, 12. [Google Scholar] [CrossRef]
- Farhang, A.; Javanmard, S.; Mehvari, J.; Zare, M.; Saadatnia, M. Inflammation and endothelium response in epileptic patients: A case-control study. Adv Biomed Res. 2016, 5, 131. [Google Scholar]
- Fabene, P.F.; Mora, G.N.; Martinello, M.; Rossi, B.; Merigo, F.; Ottoboni, L.; et al. A role for leukocyte-endothelial adhesion mechanisms in epilepsy. Nat Med. 2008, 14, 1377–1383. [Google Scholar] [CrossRef] [PubMed]
- Khalil, M.; Teunissen, C.E.; Lehmann, S.; Otto, M.; Piehl, F.; Ziemssen, T.; et al. Neurofilaments as biomarkers in neurological disorders — towards clinical application. Nat Rev Neurol. 2024, 20, 269–287. [Google Scholar] [CrossRef]
- Kahn, O.I.; Dominguez, S.L.; Glock, C.; Hayne, M.; Vito, S.; Sengupta Ghosh, A.; et al. Secreted neurofilament light chain after neuronal damage induces myeloid cell activation and neuroinflammation. Cell Rep. 2025, 44, 10. [Google Scholar] [CrossRef]
- Foiadelli, T.; Santangelo, A.; Costagliola, G.; Costa, E.; Scacciati, M.; Riva, A.; et al. Neuroinflammation and status epilepticus: a narrative review unraveling a complex interplay. Front Pediatr. 2023, 11, 1–12. [Google Scholar] [CrossRef] [PubMed]
- Dingledine, R.; Varvel, N.H.; Ravizza, T.; Vezzani, A. Neuroinflammation in Epilepsy. In: Vezzani A, Scharfman HE, editors. Jasper’s Basic Mechanisms of the Epilepsies. Oxford University PressNew York; 2024, pp 611–32.
- Sun, Y.; Ma, J.; Li, D.; Li, P.; Zhou, X.; Li, Y.; et al. Interleukin-10 inhibits interleukin-1β production and inflammasome activation of microglia in epileptic seizures. J Neuroinflammation. 2019, 16, 1–13. [Google Scholar] [CrossRef]
- Chen, L.; Zhu, L.; Lu, D.; Wu, Z.; Han, Y.; Xu, P.; et al. Interleukin 4 Affects Epilepsy by Regulating Glial Cells: Potential and Possible Mechanism. Front Mol Neurosci. 2020, 13, 1–11. [Google Scholar] [CrossRef]
Disclaimer/Publisher’s Note: The statements, opinions and data contained in all publications are solely those of the individual author(s) and contributor(s) and not of MDPI and/or the editor(s). MDPI and/or the editor(s) disclaim responsibility for any injury to people or property resulting from any ideas, methods, instructions or products referred to in the content. |
© 2025 by the authors. Licensee MDPI, Basel, Switzerland. This article is an open access article distributed under the terms and conditions of the Creative Commons Attribution (CC BY) license (http://creativecommons.org/licenses/by/4.0/).
Copyright: This open access article is published under a Creative Commons CC BY 4.0 license, which permit the free download, distribution, and reuse, provided that the author and preprint are cited in any reuse.


