Submitted:
26 May 2025
Posted:
27 May 2025
You are already at the latest version
Abstract
Deployable thin-film antennas deliver large aperture gains and high stowage efficiency for spaceborne phased arrays but suffer wrinkling-induced planarity loss and radiation distortion. To bridge the lack of electromechanical coupling models for tensioned thin-film patch antennas, we present a unified framework combining structural deformation and electromagnetic simulation. We derive a coupling model capturing the increased bending stiffness of stepped-thickness membranes, formulate a wrinkling-analysis algorithm to compute tension-induced displacements, and fit representative unit-cell deformations to a dual-domain displacement model. Parametric studies across stiffness ratios confirm the framework’s ability to predict shifts in pattern, gain, and impedance due to wrinkling. This tool supports the optimized design of wrinkle-resistant thin-film phased arrays for reliable, high-performance space communications.
Keywords:
step-stiffness structure
; membrane antenna
; thin-film
; electromagnetic performance
; wrinkling analysis
1. Introduction
Spacecraft increasingly demand high-gain, beam-steerable antennas that fit within tight volume–weight budgets. Deployable reflectors fall into three main categories: rigid-surface designs such as Sunflower, MEA, DASIY, and SSDA [1,2,3]. Mesh-surface deployable antennas—one of the primary approaches for large-aperture systems—feature large stowage ratios and low mass, encompassing umbrella-rib, truss, ring-spar mesh, and hoop-column configurations. The latter comprise shell-membrane systems that self-deploy or use umbrella ribs, alongside thin-film approaches—like inflatable paraboloids, planar unfolding, and electrostatic forming—with tensioned thin-film antennas emerging as a particularly lightweight, compact option for next-generation spaceborne communications [4].
Phased-array antennas have seen rapid development in recent years and hold broad application potential in satellite communications, microwave remote sensing, and Earth observation [5]. In the domain of spaceborne SAR (Synthetic Aperture Radar), the need for wider bandwidths, more beams, and higher ground resolution drives the use of large-scale planar active phased arrays. Compared with traditional panel-and-shell structures, flexible thin-film tensioned architectures enable larger apertures and higher stowage ratios [6,7]. Moreover, adopting a flexible thin-film tensioned surface for phased arrays substantially reduces launch mass and stowed volume.
Wrinkling in thin membranes is a ubiquitous phenomenon that can significantly compromise both the mechanical integrity and functional performance of flexible structures [8]. In recent years, researchers have developed a variety of analytical, numerical, and experimental approaches to understand and control wrinkle formation and propagation [9,10,11], the main approaches include stress- and strain-based criterion methods and energy-competition mechanisms [12]. Most researchers have focused on homogeneous films [6,13,14,15]; Yan et al. [16] analyzed the wrinkling behavior of film structures with rigid square. However, the influence of surface patch stiffness has yet to be thoroughly examined.
Antenna electrical-performance sensitivity analysis is a key research area for assessing on-orbit reliability, and many studies have developed electromechanical-thermal coupling models to predict antenna performance [17,18,19]. Recent work has applied topology optimization, multiphysics electromechanical coupling, and finite-element modeling to enhance deployable aperture and phased-array performance [20,21,22]. Compensation schemes using structural–electromagnetic coupling with FFTs and advanced computational-EM methods—such as all-dielectric superstructures and EBG-enhanced designs—have mitigated pattern distortions under mechanical and fabrication errors [23,24,25,26]. Nevertheless, electromechanical coupling models tailored to thin-film patch antennas remain relatively uncommon—most studies emphasize experimental testing—and published work integrating such models with electrical-performance predictions for these antennas is limited.
Thin-film membranes are susceptible to wrinkling, which compromises substrate planarity and, in turn, distorts the radiation pattern and amplitude of patch antennas, degrading communication performance. To quantify this effect, we derive an electromechanical coupling model that incorporates the enhanced stiffness of a stepped-thickness film compared to a uniform membrane [27]. We then establish a wrinkling-analysis framework for the stepped film to compute the resulting displacement field under tension. From this field, representative unit-cell deformation characteristics are extracted and fitted to a dual-domain displacement model for use in electromagnetic simulations. By evaluating antenna performance across varying stiffness ratios, our method enables accurate prediction of electrical behavior in the presence of wrinkling.
2. Wrinkling of Step-Stiffness Structure and Dual-Domain Displacement Mod
2.1. Wrinkling Mechanism of Step-Stiffness Structure
Several methods are widely used to analyze wrinkling in uniform thin films, including stress analysis, initial-imperfection buckling simulations, and energy-competition mechanisms. In this section, the wrinkling deformation of stiffness-stepped film structures is analyzed based on the energy-competition mechanism [12].
To analyze wrinkling deformation induced by buckling, the film should not be treated as a membrane with zero bending stiffness, but rather as a thin plate possessing bending stiffness. Considering the film as a thin-plate (its thickness being much smaller than the other dimensions) and satisfying the Kirchhoff–Love hypotheses and the small-deflection assumption.
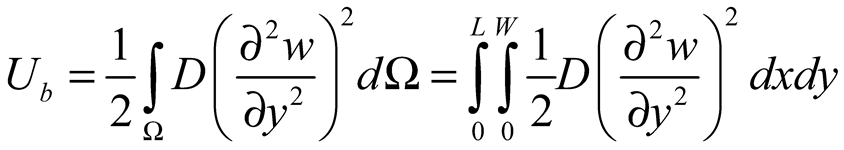
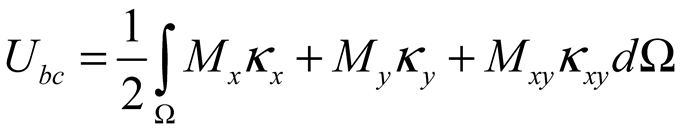
The analysis of a single wrinkle stripe is performed using an energy-based formulation, calculating the energy associated with stretching along the wrinkle direction and bending along the wrinkle wavelength direction.
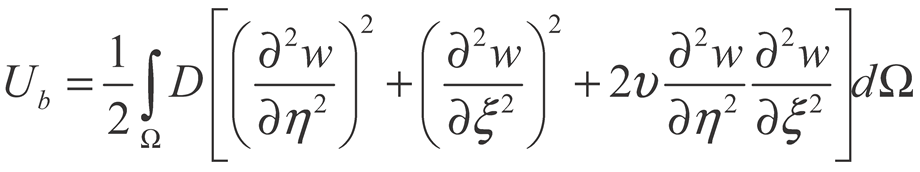
In the equation, denotes the bending energy of the film, denotes the out-of-plane deformation, , represent the coordinates in the two respective directions(x,y), represent the length and width of the wrinkle strip.
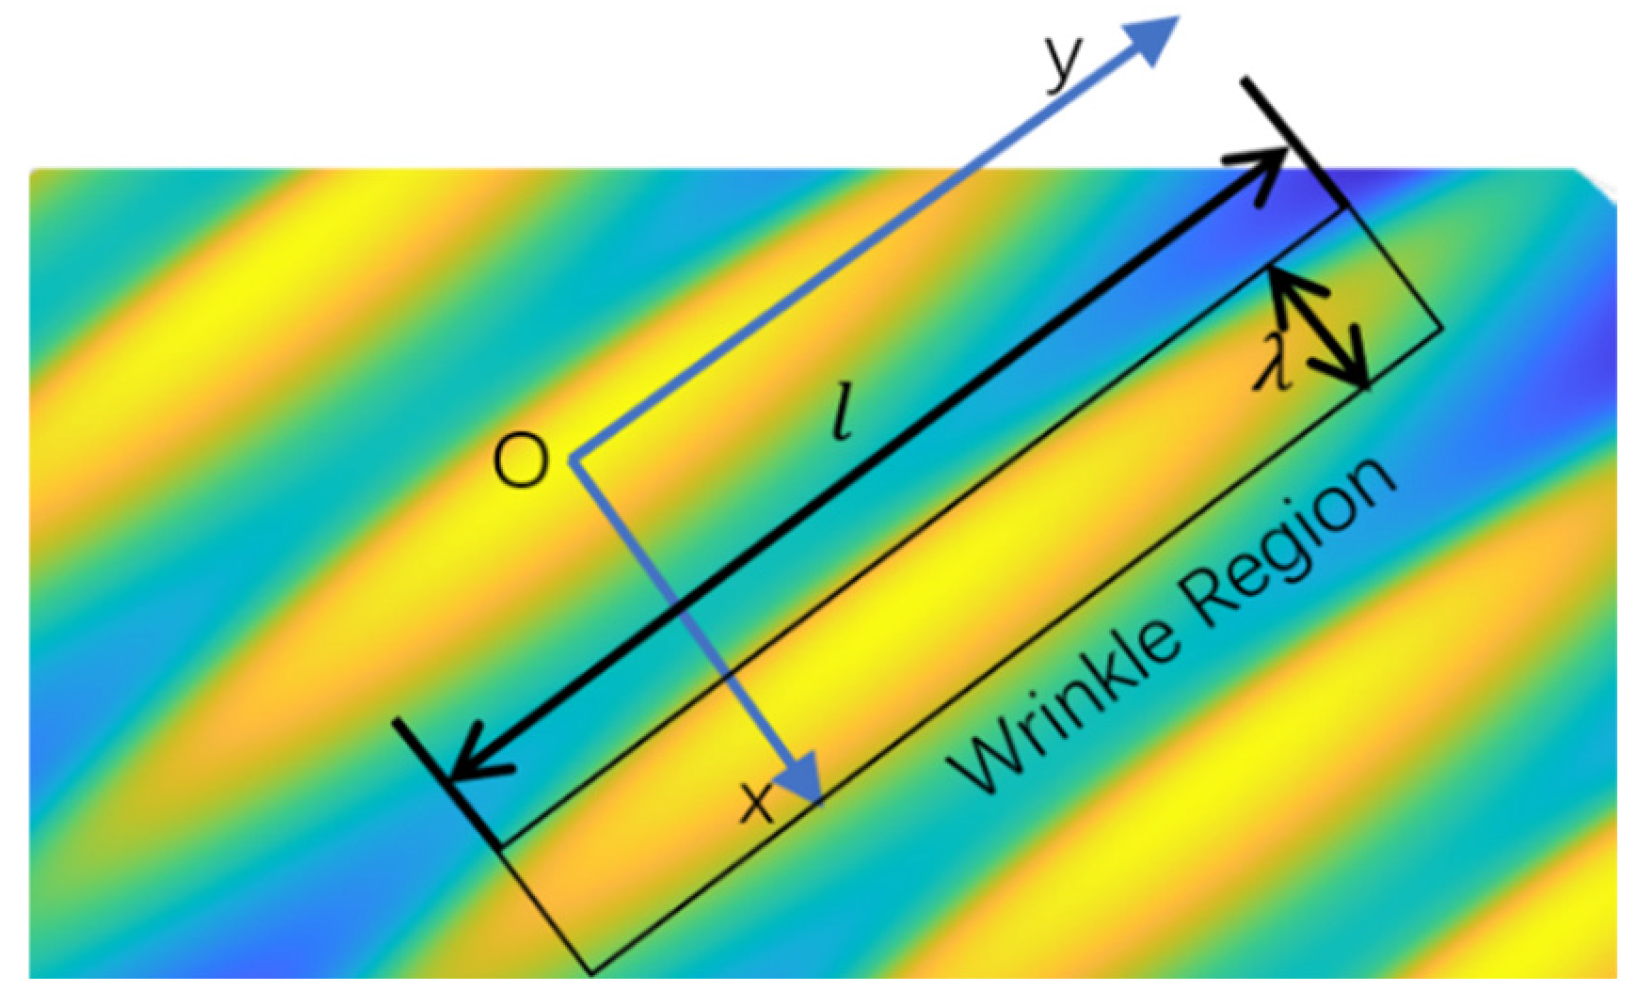
Figure 1.
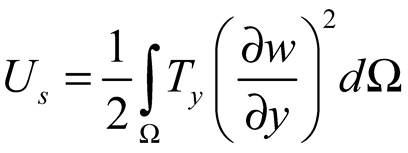
Definition of the wrinkling coordinate system.
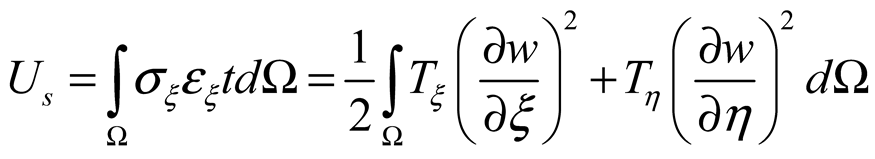
In the equation, represents the bending energy of the film, is the tensile force in the x-direction, is the tensile force in the y-direction.
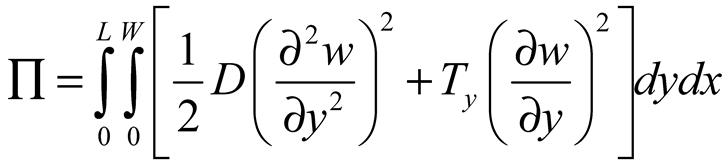
Based on Equations (1) and (2), one obtains:
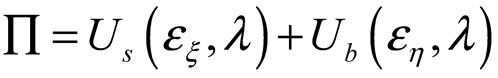
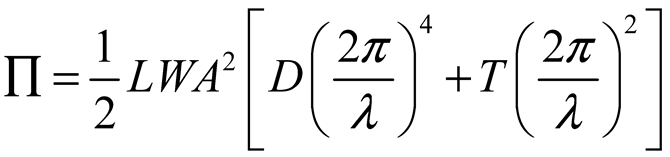
In the equation, ∏ denotes the total potential energy of the film.
Based on the energy method, to solve for the unknowns in the above expression, one takes its partial derivatives and sets them equal to zero. For example: let .
Assume an infinitely long film structure whose wrinkling can be considered as strips of wavelength uniformly distributed along the short-edge direction. The corresponding energy density can then be calculated by the following formula
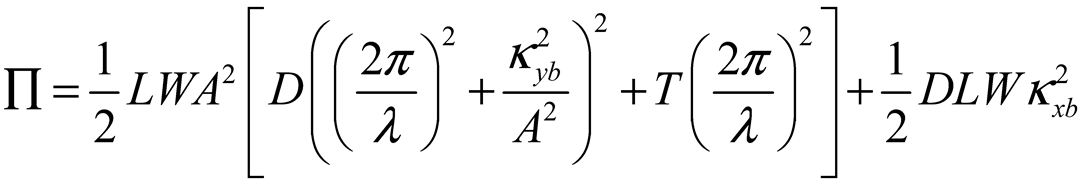
Therefore, the total potential energy can be expressed as:
Because the tensile load in an infinitely long film structure is uniformly distributed, the out-of-plane deformation trial function can be assumed as follows:
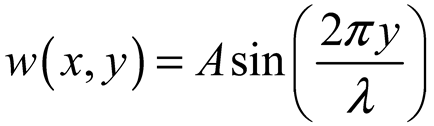
In this expression, A denotes the wrinkle amplitude, denotes the wavelength which can also be written as .
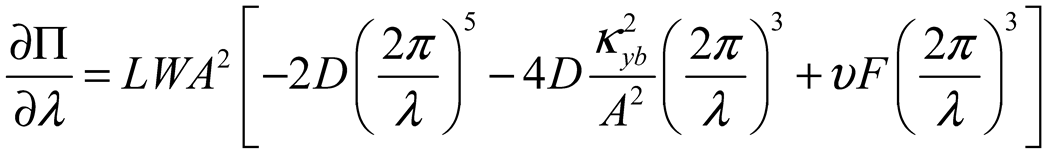
By substituting (7) into (6), one obtains:
To determine the wavelength , it will be:
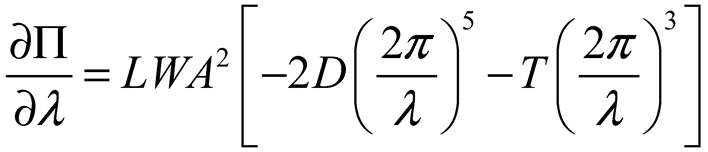
Moreover, the force in the y-direction is generated by the Poisson effect, yielding, If the force in the x-direction is FFF and the Poisson’s ratio of the infinitely long film structure is , then:
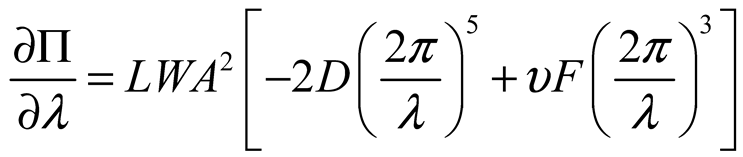
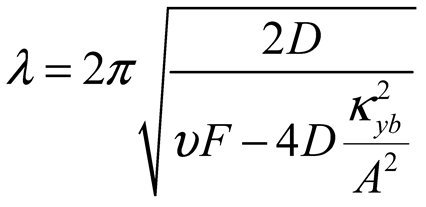
By setting Equation (10) equal to 0, the wavelength is obtained as:
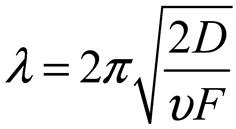
The wavenumber can be determined from the ratio of the film structure’s width to the wavelength.
To validate the analytical results, finite element simulations were conducted. In ABAQUS, a film with a large aspect ratio of 1000:40 was modeled, and the central region of the film was analyzed. As shown in Figure 2, three full wrinkle wavelengths appear at the center. Using the material parameters—film thickness of 50 µm and a tensile load of 58 N—Equation (11) predicts a wrinkle mode number n=3 and a wavelength of 11.89 mm, which matches the simulation results and confirms the validity of the approach(10.96mm in ABAQUS). For an infinitely long film, the amplitude A can only be determined by substituting the deflection profile into the energy expression to find its extremum, since in Equation (8) any choice of A does not affect the derivative’s root.
Because the tensile load on the thin-film antenna is relatively small, the bending moment induced by the copper foil and the tensile load’s effect on the film deformation can be treated independently. In other words, the boundary condition of the film can be represented as a superposition of (1) the bending deformation imposed by the copper foil and (2) the original tensile load acting on the film. Summing these two effects yields the wrinkle-analysis model for the stiffness-stepped film structure.
The generation of the bending moment can then be derived from the copper foil’s structural parameters as follows:
In the equation, represents the bending strain energy introduced by the copper foil , and denote the bending moments and curvatures in the respective directions. The curvature can be obtained from the thin-plate deflection formula in elasticity theory, i.e., by taking the second derivative of the assumed deflection function.
In summary, the energy-based wrinkling analysis model for the stiffness-stepped film structure can be expressed as follows:

In the above equation, denotes the out-of-plane deflection distribution function arising from bending. For the stiffness-stepped film, the copper foil is effectively subjected only to bending moments, while the four edges carry asymmetric in-plane loads, so the bending-moment magnitudes at each edge differ. This spatial variation in moment makes numerical solution of the model challenging. For such complex cases, the finite element method is recommended for analysis.
For an infinitely long film, assuming that the bending moment M induces curvature deformations,, the new strain energy can be expressed as:
By taking the partial derivatives, one obtains:
By setting Equation (15) equal to zero, the wrinkle parameter for the wrinkled region of an infinitely long film under the influence of a bending moment is given by:
In the above expression, denotes the curvature in the y-direction obtained from the independent bending–coupled strain calculation. The amplitude A is determined by substituting the deflection function ω into the potential-energy expression for an infinitely long film without bending moments and finding its extremum. Analysis of Equation (16) shows that as the denominator decreases, the wavelength λ increases; when the denominator reaches zero, wrinkle deformation disappears and the structural response degenerates to a pure bending, biaxial coupled deformation mode without wrinkling. Assuming an infinitely long film is subjected to a uniform 1° rotation deformation about the x-axis, the resulting wrinkle wavelength can be calculated as 14.3 mm. The finite element simulation results yielded an approximate wavelength of 15.9 mm, demonstrating the validity of the model.
2.2. Surface Deformation of STMA
A typical shape of Space Tensioned-Membrane Antenna(STMA) is composed of two layers, phased array patches are set on the up layer, ground patch is set on the down layer. The stiffness step structure would cause out-of-plane deformation easily, such as wrinkling deformation and bending deformation, both the deformation would lead to changes on the spacing of two layers. Spacing of two layers is a design parameter of required electromagnetic performance, so to what extend the deformation would influence to electromagnetic performance is essential for tensioned-membrane antenna.
Figure 3 shows the possible deformation types of up layer, as the membrane antenna is stretched at corners, stress concentration would easily lead to wrinkling deformation. What’s more, the fabrication errors would cause changes too. To offer reliable results of out-of-plane deformation of STMA, simulation and experiment are carried out.
Because the effectiveness of the finite-element approach was confirmed in the previous section, we employ finite-element analysis to compute the surface deformation of the more complex structure. The model was built in ABAQUS 2020. To ensure numerical accuracy, the 7 × 3 suspension-cable configuration uses the following mesh counts: the array-layer film has 105974 elements and the radiator layer has 100252 elements; the supporting frame has 66474 elements; each support beam has 6534 elements × 2 beams; and each connection flange has 4629 elements × 4 flanges. The 5 × 3 suspension-cable configuration uses 104211 elements for the array-layer film and 99886 elements for the radiator layer; its supporting frame again has 66474 elements, each support beam 6534 × 2, and each flange 4629 × 4. The tension cables are modeled with connector elements, and the copper-foil antenna on the film is implemented via a composite lamination.
We apply a post-buckling finite-element analysis based on the initial buckling-mode defect method. First, a stress analysis is performed; next, the buckling modes are computed; finally, the primary buckling mode is introduced into the model as an initial imperfection. This procedure yields the wrinkling pattern of the thin-film structure.
Figure 4 shows the simulation results of wrinkle patterns of different patch’s size under corner loading. Three typical wrinkle patterns appear when patch size increase.
Based on existing references, it can be determined that different thickness of membrane are set to analyze material parameter’s influence to out-of-plane deformation. Both thickness and patch’s size are essential to out-of-plane deformation types.
Figure 4 shows the out-of-plane displacement contours for the 7×3 suspension-cable configuration. On the left is the array-layer film contour: as the prestress increases, the zones of maximum deformation expand from the four corner tension points to all tension points. The deformation in the copper-foil plated area of the array antenna becomes progressively more pronounced, with its peak value rising from 0.05 mm to 0.19 mm. Near the boundaries, the copper-foil region exhibits even larger displacements, a consequence of the composite structure’s edge constraints. The deformation pattern of the copper-foil patch clearly reflects the growing tension-bending coupling effect under higher tensile loads.
On the right of Figure 4 is the radial-layer film contour: with increasing prestress, the region of maximum deformation consistently occurs at the inner suspension cables, and its extreme value increases from 0.36 mm to 0.66 mm. Deformation in the copper-clad region also becomes more evident, with its peak rising from 0.38 mm to 0.70 mm.
Figure 5 presents the out-of-plane displacement contours for the 5×3 configuration. The left panel (array layer) exhibits a deformation pattern similar to that of the 7×3 case but with larger magnitudes: the copper-foil region’s peak displacement increases from 0.10 mm to 0.30 mm. The right panel (radiator layer) shows that the maximum deformation remains centered on the internal suspension cables, growing from 0.63 mm to 1.10 mm as prestress rises, while the copper-foil region’s peak displacement increases from 0.40 mm to 0.88 mm.
Combining the thin-film antenna deformation characteristics shown in Figure 4 and Figure 5, it can be seen that the upper antenna exhibits more pronounced local deformations with the periodic features of the repeating array units. In contrast, the patch area of the lower antenna shows small-amplitude, uniformly distributed deformations. Therefore, to analyze how structural deformation affects the antenna’s electrical performance, one can focus on a representative unit—namely a single patch element of the antenna. Furthermore, given the deformation magnitude of the upper film, the out-of-plane deformation of the lower film may be neglected for a simplified analysis.
2.3. Dual-Domain Displacement-Driven Function
Considering the out-of-plane deformation characteristics of the upper film and the out-of-plane deformation characteristics of the upper film and the fact that the deformation behavior of the step-stiffness thin-film structure is jointly influenced by both the film’s and the patch’s stiffness [27]. The deformation could be composed of two parts, one is patch area and the other is membrane area. The deformation of patch area shows mainly bending deformation. The deformation of membrane area shows Fourier type. So extracting ABAQUS simulation result data as shows in Figure 4 and Figure 5 with a typical patch area as shown in Figure 6, MATLAB can be used for complex function construction and fitting in a two-region domain.
This treatment is consistent with existing research findings, namely that the material stiffness of the film and patch regions influences the structure’s deformation morphology.
Different material parameters lead to different forms of out-of-plane deformation of stiffness step films, but the overall picture can be abstracted into two variables - film and patch stiffness. Therefore, in this paper, a two-domain displacement model is adopted to approximate characterize the deformation of the stiffness-step thin-film shaped surface.
The antenna unit deformation patterns corresponding to the 20th order fitting results are given in Figure 7 The center patch region deformation and the outer film region wrinkle deformation were controlled independently by two parameters. Using this function, antenna deformation could be approximate estimated. In next sections, The electromechanical coupling modeling of the antenna will be performed based on this function to analyze the electrical properties of unit and phased array antennas.
3. Structural-Electromagnetic Coupling Model
3.1. Electromechanical Coupling Model
The coordinate system for analyzing the far-field electrical performance of the phased array antenna is given in Figure 8 According to the theory of antenna design and analysis, the formula for calculating the field strength at point P is shown in the following equation [18].
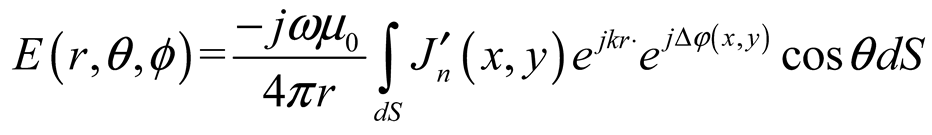
In the equation, denotes the current density of the nth patch, ω is the angular frequency, is the vacuum permeability, is the observation direction at point P in space, k is the propagation constant (wavenumber), is the unit vector in the radial (r) direction.
According to the antenna design theory, the change of patch area displacement will affect the spacing between the radiating patch and ground plane of the thin-film antenna, thus affecting the electrical performance of the antenna. And the effect of fold deformation in the film region represents the deformation in the medium region. From the equation, this deformation has an effect on the antenna performance, but the effect of this deformation on the electrical performance has not been analyzed in previous studies.
The formula for calculating the antenna’s electrical performance accounting for deformation is as follows:
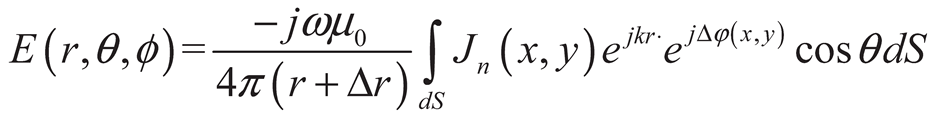
In the formula, and respectively denote the effects introduced by the structural deformation. Here, and represent the deformation errors in displacement and rotation, respectively. and are respectively extracted from the overall antenna displacement function.”
In this paper, the effects of two typical deformations on the electrical properties of the patch antenna unit will be investigated separately by varying the parameters of the two dual-domain displacement patterns.
Since the film scale of thin-film antennas is particularly small compared to the area, direct modeling in simulation software will result in a huge amount of computation. In this paper, we adopt the mode of importing the results of unit calculation by Ansys HFSS into MATLAB for superposition calculation to predict the performance of phased array antenna.
3.2. Patch Electro-Magnetic Performance Simulation
The simulation analysis will first focus on a single antenna unit; the array antenna analysis will then be conducted by exporting the data and performing superposition calculations in MATLAB. For a patch size of 98 mm × 98 mm and a film spacing of 12.7 mm, analysis of a representative patch unit yields the antenna’s reflection coefficient and its E and H plane gain patterns. Simulation is carried out by Ansys HFSS.
The simulation results are shown in Figure 9 It can be seen that the reflection coefficient S11 achieves good matching depth at 1.3 GHz with approximately -12 dB. In both the E-plane and H-plane, the antenna attains a gain level of approximately 7.5 dB.
Next, a hypothetical independent deformation analysis of the film and patch regions is performed, first identifying the extent to which each region impacts the electrical performance of the patch.
From the S-parameter (S11) curves in Figure 10, when = 0 mm the antenna achieves its best match around 1.28 GHz, with the minimum S11 reaching approximately –12 dB, indicating optimal resonance and impedance matching. As is reduced in 0.2 mm steps from 0 to –1 mm, the resonant frequency first shifts downward to 1.24 GHz, then returns to the 1.28–1.30 GHz range. Over this range, the S₁₁ minimum oscillates between –9 dB and –16 dB, showing that matching gradually degrades as the patch is translated downward. Moreover, at = –0.4 mm a small additional dip appears near 1.6 GHz, suggesting the excitation of a parasitic mode and potential multi-band behavior that could interfere with single-band operation in the 1.24–1.30 GHz band.
In the gain radiation patterns shown in Figure 10 = 0 mm yields the highest main-lobe gain of about 6.5 dB with low sidelobe levels and a symmetric pattern. As decreases from –0.2 mm to –1 mm, the main-lobe gain drops noticeably, falling to around 5 dB at = –1 mm and shifting off-axis from θ = 0°. At the same time, the sidelobe levels around θ ≈ ±150° rise by about 0.2 dB and the pattern’s symmetry degrades. This indicates that shifting the patch alters the current distribution and thereby distorts the far-field radiation pattern, affecting both the main and sidelobes. In a phased-array application, such unit-level misalignments can degrade overall beam-scanning accuracy and increase sidelobe interference.
In summary, as the patch position shifts from 0 mm to –1 mm, not only does the resonant frequency oscillate and matching degrade, but the main-lobe gain also falls and the radiation pattern deteriorates. Therefore, in phased-array antenna design and fabrication, patch-position deviations must be tightly controlled to ensure uniform matching and gain across all elements, thereby achieving optimal beam patterns and array performance.
From the S-parameter (S11) curves in Figure 11, as increases, the antenna’s matching characteristics change noticeably. At = 0 mm (no translation), the resonant frequency is near 1.28 GHz with S11 ≈ –12 dB, indicating good matching. However, when increases to –5 mm, the resonant frequency shifts toward 1.30 GHz and S₁₁ becomes smaller. This behavior shows that the film’s vertical position alters the antenna’s effective dielectric constant and electric-field distribution, thereby changing the resonance and matching.
From the gain radiation patterns in Figure 11, at = 0 mm the main-lobe gain is highest and sidelobe levels are relatively low, indicating optimal radiation performance. As increases, the pattern symmetry degrades, exhibiting a double-peak near the main lobe while sidelobe levels remain largely unchanged. This will reduce beamforming resolution.
In summary, translation of the film () significantly affects the antenna’s resonant frequency and matching, and influences the symmetry and sidelobe characteristics of the gain pattern. In phased-array applications, large variations in between elements can lead to pattern distortion and increased beam-scan errors. Therefore, during design and fabrication, film positioning must be tightly controlled to ensure consistent element matching and beamforming accuracy, preventing performance degradation due to film displacement.
4. Discussion
4.1. Dual-Domain Displacement Patch Analysis
Firstly, we perform the analysis of Equation (17) under the condition = , thereby predicting the effect of local deformation of the patch antenna on its electrical performance.
The impact of local film deformation () on antenna performance was analyzed separately via S-parameter (S11) curves and gain radiation patterns. As shown in Figure 2.18, the S11 curves depict how the antenna’s reflection coefficient varies with frequency for different values. Figure 12 shows the antenna gain versus θ at 1.4 GHz under the same conditions.
In Figure 12, changing causes clear shifts in both resonant frequency and matching depth: for certain values, the resonance moves to higher frequencies and the S11 minimum degrades from about –12 dB to –6.7 dB. This indicates that local deformation alters the patch’s effective electrical length and impedance environment, worsening matching or shifting the resonance. At = 0.003, no S11 response appears between 1 GHz and 2 GHz, implying the resonance has moved outside this band or become unmatched.
The gain patterns in Figure 12 illustrate the far-field behavior at 1.4 GHz for each . The blue curve ( = 0.003) shows an unreasonably low main-lobe gain and uneven sidelobe distribution, indicating that this deformation severely distorts the current distribution and polarization, effectively degrading radiation performance. Other cases (e.g., the green and orange curves) maintain smoother patterns, though with a reduced peak gain.
In general, local deformation of the film leads to shifts in the resonant frequency and matching characteristics, and causes varying degrees of distortion or sidelobe increase in the gain pattern. For a phased-array antenna, if such deformation varies significantly between elements, it can degrade beam-forming precision and compromise pattern consistency. Therefore, during design and fabrication, the film’s local deformation must be strictly controlled to ensure each element’s matching and gain remain stable.
Based on the previous section’s analysis, among the three offset errors, the error has the most significant impact on resonant-frequency drift. As the offset increases, the resonant point shifts the furthest and may even fall outside the matching band, preventing the antenna from operating normally at its design frequency and undermining system stability. It also inflicts the greatest direct damage to gain—distorting the pattern and even exceeding the ideal peak—indicating that the form of local deformation represented by is the most severe. In high-precision applications (e.g., satellite communications or phased arrays), such frequency drift can cause element-to-element phase mismatches, thereby degrading overall directivity and gain balance.
By contrast, the error ranks second in severity. It not only shifts the resonant frequency but also significantly worsens matching and reduces far-field gain, leading to lower antenna efficiency and making it a primary contributor to electrical-performance degradation. The error has the mildest effect; as seen in the gain patterns and S11 curves, its main impact appears to be on the system’s radiation uniformity, with little effect on resonance or matching.
In summary, the error has the most direct impact on resonant frequency and should be prioritized to avoid system-level instability caused by frequency drift; the error significantly affects matching and gain, requiring strict control of manufacturing precision; the error poses relatively mild harm but still warrants attention for its effect on far-field radiation. During antenna design and fabrication, the impacts of these errors should be comprehensively considered to ensure system stability and reliable performance.
4.2. Phased Array Antenna Analysis
We now vary the values of and to predict the electrical performance of the phased-array antenna; when = 0.001 and = 0.0012, the resulting structural deformation of the array layer most closely matches that shown in Figure 4.
The unit performance variations are shown in Figure 13. When studying the effects of the structural parameters and on the unit antenna gain, gain-versus-angle curves were plotted for the E-plane (ϕ = 0°) and H-plane (ϕ = 90°) for different – combinations. The analysis indicates that variations in mainly affect the main-lobe level of the radiation pattern; variations in primarily influence the pattern shape and sidelobe levels, with only a minor effect on main-lobe gain.
In Figure 13’s four non-normalized unit-gain plots, the first and third correspond to the E-plane, while the second and fourth correspond to the H-plane. Overall, when or increases, the main-lobe gain typically fluctuates between 5 and 8 dB, but the sidelobe and null depths exhibit significant variation with parameter changes.
In the E-plane (Figure 13, first and third plots), the main-lobe gain at θ ≈ 0° mostly remains at the 6–7 dB level, although in some cases the gain decays more sharply ( = 0.001, 0.002) and the sidelobes are mainly concentrated near θ ≈ ±50° and ±100°. As or increases, some curves exhibit a 2–3 dB gain increase at those sidelobe positions or a shift in null locations, indicating that local film deformation or patch translation leads to uneven current distribution, which in turn affects the E-plane sidelobe characteristics. If significant differences in and exist between elements, array synthesis may suffer amplitude and phase inconsistencies, raising the overall sidelobe level.
In the H-plane (Figure 13, second and fourth plots), the main-lobe gain also lies between 5 and 8 dB, but the curves are more sensitive to changes in and : certain parameter combinations (e.g., = 0.003 or = 0.002–0.003) cause only minor shifts in the main-lobe peak yet produce higher sidelobes near θ ≈ ±70° or deeper nulls near θ ≈ ±100°. Other combinations ( = 0.002) lead to severe fluctuations, blurring the distinction between main and sidelobes. Compared to the E-plane, the H-plane patterns oscillate more strongly, showing that film deformation and local patch displacement more significantly modulate polarization and current distribution in this plane. In phased-array applications, such inconsistencies would accumulate as amplitude and phase errors in beamforming, degrading beam pointing and sidelobe performance.
In summary, variations in and lead to differing degrees of change in the main-lobe, sidelobes, and null depths of the gain patterns in the E- and H-planes. While the main-lobe gain remains generally stable, the sidelobe levels and null depths are more sensitive to film deformation, whereas copper-foil deformation causes more pronounced attenuation of the main lobe. This implies that large and deviations between elements can degrade the phased-array’s overall sidelobe-suppression capability and beam-scanning accuracy. Therefore, in high-precision antenna design and fabrication, and must be strictly controlled or calibrated to ensure consistent element gain characteristics and maintain excellent radiation-pattern performance.
From the S-parameter (S111) curves (Figure 14, first plot), when varies between 0, 0.001, 0.002, and 0.003, the antenna’s matching in the 1.2–1.4 GHz band undergoes significant drift and change. Initially ( = 0 mm), the resonant frequency is about 1.28 GHz and the S11 minimum reaches approximately –12 dB; as increases to 0.003, the resonant point oscillates. Meanwhile, the S₁₁ matching depth also changes markedly, indicating that local film deformation shortens the effective electrical length and degrades matching. Furthermore, at = 0.003 three resonant points appear, the strongest near 1.6 GHz, suggesting excitation of parasitic modes. At = 0.002, a possible parasitic mode with about –5 dB depth is also seen, though it has limited impact on the main operating band.
From the S-parameter curves (Figure 14, second plot), as increases from 0 to 0.003, the antenna’s resonant frequency and matching shift sequentially. According to the color legend, = 0 (red line) shows a main matching dip of about –12 dB near 1.28 GHz; at = 0.0012 (orange line), the resonance shifts to ≈1.32 GHz with a minimum of ≈–11 dB; at = 0.002 (blue line), the resonance shifts most severely to ≈1.45 GHz with a lowest point of ≈–9 dB; and at = 0.003 (green line), the main resonance shifts back to ≈1.28 GHz with a minimum of ≈–8.5 dB. Secondary dips near 1.63, 1.83, and 1.95 GHz (≈–6 dB, –7 dB, –10 dB) appear at = 0.0012 and 0.003, indicating that local patch deformation excites new parasitic modes. Overall, increasing causes resonant-frequency oscillation, secondary dips, and a gradual weakening of matching.
From the gain radiation patterns (Figure 14, third plot), at = 0 the main-lobe gain peaks at 7.9 dB with low sidelobe levels; when increases to 0.003, the main-lobe gain amplitude changes little, but the angle of maximum gain shifts away from θ = 0°, and sidelobes near θ ≈ ±50° rise by about 2–3 dB, reducing pattern symmetry. This shows that local deformation alters the current distribution, boosting radiation at certain angles while causing sidelobe rise or shallower nulls. If such variations occur between phased-array elements, amplitude and phase inconsistencies in beamforming may result, degrading overall beam pointing accuracy and sidelobe suppression. When = 0.001 mm and 0.002 mm, the gain curve shows significant attenuation at θ = 0°, with the peak gain still near θ = 0°, leading to poorer directivity.
In the gain radiation pattern (Figure 14, fourth plot), the curves for different values show main-lobe gains at θ = 0° of roughly 5–7 dB: when = 0.0012 and 0.002 (orange and blue lines), the main-lobe gain still reaches about 7 dB; but when = 0.003 (green line), the main-lobe gain only reaches 5–6 dB, and the sidelobes near θ ≈ ±50° and θ ≈ ±100° rise by 2–3 dB, causing noticeable distortion and null shifts in the pattern. This indicates that further increases in not only degrade matching but also alter the far-field current distribution, enhancing radiation at certain angles and increasing sidelobe energy. In a phased-array antenna, if errors vary significantly between elements, amplitude and phase errors will accumulate during beamforming, degrading overall beam pointing accuracy and sidelobe suppression.
In summary, as increases from 0 to 0.003, the resonant frequency begins to oscillate around 1.28 GHz and the matching performance degrades slightly, while the gain radiation pattern shows a modest increase in main-lobe level accompanied by elevated sidelobes. During this increasing of , the resonant point oscillates, the primary matching dip shifts from –12 dB to –8 dB, and additional parasitic modes appear at the high-frequency end; at the same time, the main-lobe gain rises slightly but sidelobes also climb, degrading the antenna’s directivity to some extent. In high-precision antenna or phased-array applications, it is therefore critical to tightly control the -induced local patch deformation and to employ matching-compensation techniques to minimize cumulative errors, thereby preserving the antenna’s operational bandwidth and radiation-pattern stability.
Adjustments of the structural parameters and primarily affect the antenna’s resonant frequency, input matching characteristics, and the sidelobe structure of the far-field radiation pattern. has a relatively small impact on main-lobe gain, whereas exerts a significant influence on it. In phased-array applications, such variations can alter the phase relationships between elements and degrade beam-forming performance. Therefore, during the antenna design process, and — that is, the stiffness matching between the copper patch and the film — must be judiciously tuned to optimize sidelobe behavior while preserving good matching, ensuring element-to-element consistency and enhancing overall array performance.
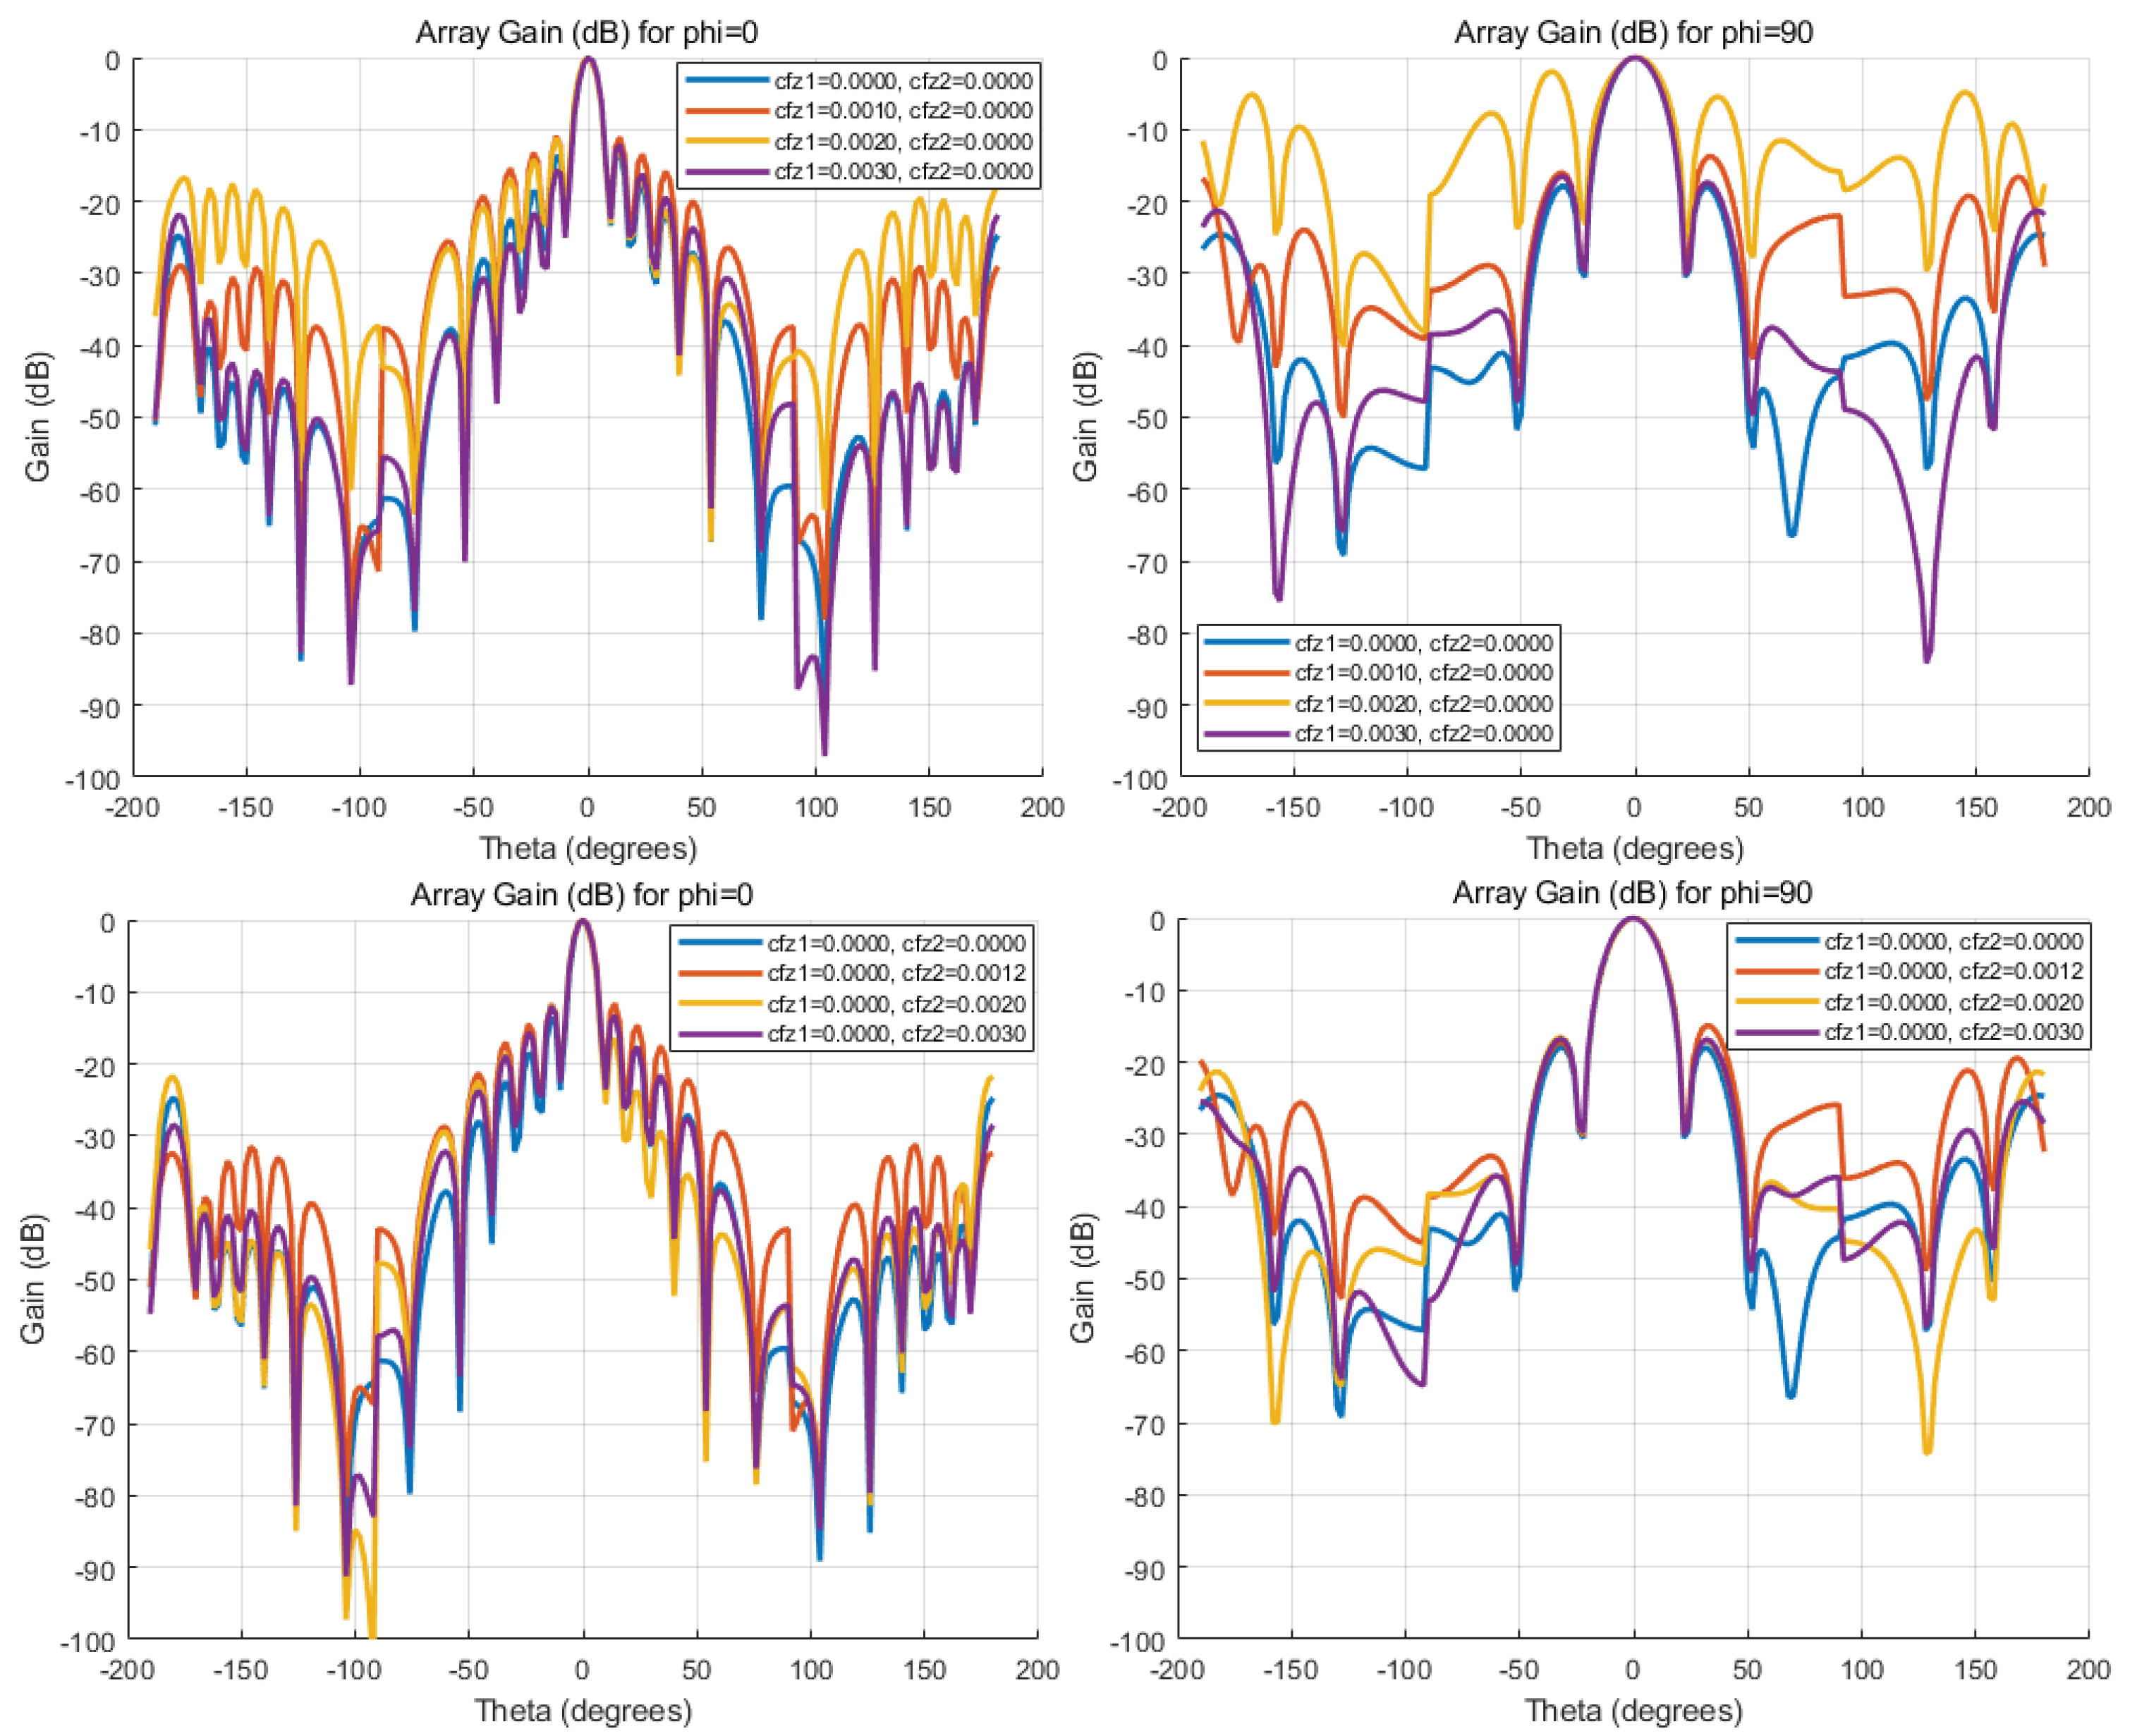
In phased-array antenna systems, element errors have a significant impact on the array’s overall gain and radiation-pattern characteristics. To investigate how variations in structural parameters and affect the phased-array gain, simulations were performed and the effects of different error values were analyzed in both the E-plane (ϕ = 0°) and the H-plane (ϕ = 90°), as shown in Figure 15. The results indicate that, although individual element gains do not always change dramatically under these errors, the array’s overall sidelobe levels, null depths, and main-beam direction are nonetheless influenced to some extent.
In the four phased-array gain plots—showing the ϕ = 0° and ϕ = 90° planes for various values of and —we observe the following: in the ϕ = 0° plane, as or increases, the main-beam gain around θ ≈ 0° remains largely unchanged, but sidelobe levels at θ ≈ ±60° and θ ≈ ±100° rise and some nulls become shallower, reflecting cumulative phase and amplitude inconsistencies during array synthesis. In the ϕ = 90° plane, these fluctuations are even more pronounced: increasing or not only raises sidelobes near θ ≈ ±60° but also introduces additional peaks or dips around θ ≈ ±120°, indicating that local deformation of the patch or film has a greater impact on the high-off-axis radiation.
Overall, the greater the deviation of and from their ideal values, the more prone the array’s sidelobe distribution and null-positioning are to distortion—a phenomenon that can degrade beam pointing accuracy and interference suppression in large-scale phased arrays. Therefore, to maintain both main-beam gain and sidelobe suppression, manufacturing and assembly processes must tightly control element deformation and patch-position offsets, and where necessary employ amplitude-and-phase correction algorithms to mitigate the errors’ impact on the overall radiation pattern.
Combining the above analyses, we conclude that out-of-plane deformation of the copper/film patch antenna has a marked effect on electrical performance, making wrinkle suppression essential. Variations in and affect the phased-array’s matching characteristics, resonant frequency, and pattern stability: influences the main-beam most strongly, whereas changes in have a larger effect on sidelobe structure and far-field radiation, potentially causing beam distortion and scan errors. Hence, to ensure stable phased-array operation, structural deformation—particularly out-of-plane wrinkling—must be rigorously controlled to prevent radiation-pattern distortion and gain degradation.
5. Conclusions
This study presents an electromechanical coupling model for space-tensioned membrane antennas with copper/membrane patch elements, aiming to analyze the direct impact of surface accuracy on electromagnetic performance. A dual-domain displacement model was developed to establish the electromechanical coupling framework for phased array patch antennas. Through systematic simulations, the effects of different structural parameters ( , ) on antenna element gain characteristics, return loss, and array radiation patterns were evaluated. The key findings can be summarized as follows:
- A comprehensive electromechanical coupling model was developed, incorporating angular distortions, displacement errors, and current density variations, enabling efficient performance evaluation of deformed copper/membrane patch antennas. The model provides a rapid simulation approach for analyzing the phased array antenna performance under structural deformations.
- The analysis of surface accuracy under different numbers of catenary lines and pre-tension levels revealed that structural deformations impact the antenna’s displacement field, which in turn affects its electromagnetic characteristics. The dual-domain displacement-based electromechanical coupling model effectively characterizes these deformations and their impact on antenna performance.
- Gain analysis of individual antenna elements indicated that the main lobe gain shifts with variations in structural parameters. Specifically, influences peak gain values, while significantly alters the sidelobe structure and overall radiation pattern. As increases, the main lobe gain decreases, while sidelobes intensify, suggesting that excessive structural modifications may degrade the radiation pattern and introduce undesired interference.
- S-parameter simulations demonstrated that structural deformations cause resonant frequency shifts and impedance mismatches. Increasing and leads to changes in return loss characteristics, particularly at =0.30, where impedance matching significantly deteriorates, potentially compromising the antenna’s operational efficiency at the target frequency of 1.3 GHz.
- Phased array total gain analysis showed that the array exhibits high gain in the main lobe direction (θ≈0∘), but the radiation pattern undergoes significant changes with variations in and . An increase in not only reduces main lobe gain but also amplifies sidelobes, which may enhance interference signals and degrade overall system performance. Furthermore, radiation pattern comparisons across different azimuth angles (ϕ) revealed that the antenna maintains symmetry at ϕ=0∘, while gain deformation is more pronounced at ϕ=90∘, indicating that structural modifications affect radiation characteristics differently depending on the azimuth angle.
The findings of this study highlight the importance of properly selecting and to optimize antenna radiation patterns, enhance radiation efficiency, and minimize sidelobe interference. The proposed electromechanical coupling model provides a theoretical foundation and simulation-based guidance for phased array antenna structural optimization, offering valuable insights for future experimental validation and engineering applications in space-based antenna systems.
Author Contributions
Conceptualization, X.Z. and X.M.; methodology, X.Z.; software, L.Z.; validation, H.L., Y.F. and X.J.; formal analysis, J.Y.; investigation, X.Z.; resources, X.M.; data curation, J.Y.; writing—original draft preparation, Y.F.; writing—review and editing, Y.X.; visualization, L.Z.; supervision, X.M.; project administration, X.M.; funding acquisition, X.M. All authors have read and agreed to the published version of the manuscript.
Funding
This research was funded by National Natural Science Foundation of China, grant number 12494564. This research was funded by CSC Program, grant number 12494564 grant number 202204980008. The APC was funded by Xi’an Institute of Space Ratio Technology.
Data Availability Statement
All data used for the numerical analyses that support the findings of this study are available from the corresponding author upon reasonable request.
Conflicts of Interest
The authors declare no conflicts of interest.
Abbreviations
The following abbreviations are used in this manuscript:
| DASIY | Deployable antenna integralSystem |
| SSDA | Solid surface deployable antenna |
| SAR | Synthetic Aperture Radar |
| STMA | Space-Tensioned Membrane Antenna |
References
- Ma, X.; Li, J.; Ma, J.; Wang, Z.; Shi, C.; Zheng, S.; Cui, Q.; Li, X.; Liu, F.; Guo, H.; Liu, L.; Wang, Z.; Li, Y. China’s Space Deployable Structures: Progress and Trends. Engineering 2020, 17(10), 207–219. [CrossRef]
- Ma, X.; An, N.; Cong, Q.; Bai, J.-B.; Wu, M.; Xu, Y.; Zhou, J.; Zhang, D.; Zhang, T.; Guo, R.; et al. Design, modeling, and manufacturing of high strain composites for space deployable structures. Commun. Eng. 2024, 3, 1–18. [Google Scholar] [CrossRef]
- Duan, B. Large Spaceborne Deployable Antennas (LSDAs) —A Comprehensive Summary. Chin. J. Electron. 2020, 29, 1–15. [Google Scholar] [CrossRef]
- Liu, Z.-Q.; Qiu, H.; Li, X.; Yang, S.-L. Review of Large Spacecraft Deployable Membrane Antenna Structures. Chin. J. Mech. Eng. 2017, 30, 1447–1459. [Google Scholar] [CrossRef]
- Zhou, X.; Ma, X.; Li, H. Research Status and Development Trends of Flexible Tensioned Thin-Film Deployable Space Antennas. China Space Science and Technology 2022, 42(4), 15.
- Shinde, S.D.; Upadhyay, S. Investigation on effect of tension forces on inflatable torus for rectangular multi-layer planar membrane reflector. Mater. Today: Proc. 2022, 72, 1486–1489. [Google Scholar] [CrossRef]
- Li, M.-J.; Li, M.; Liu, Y.-F.; Geng, X.-Y.; Li, Y.-Y. A Review on the Development of Spaceborne Membrane Antennas. Space: Sci. Technol. 2022, 2022. [Google Scholar] [CrossRef]
- Landis, C.M.; Huang, R.; Hutchinson, J.W. Formation of surface wrinkles and creases in constrained dielectric elastomers subject to electromechanical loading. J. Mech. Phys. Solids 2022, 167. [Google Scholar] [CrossRef]
- Mierunalan, S.; Dassanayake, S.P.; Mallikarachchi, H.M.Y.C.; Upadhyay, S.H. Simulation of ultra-thin membranes with creases. Int. J. Mech. Mater. Des. 2022, 19, 73–94. [Google Scholar] [CrossRef]
- Hakim, G.; Abramovich, H. Large Deflections of Thin-Walled Plates under Transverse Loading—Investigation of the Generated In-Plane Stresses. Materials 2022, 15, 1577. [Google Scholar] [CrossRef]
- Yang, P.; Fang, Y.; Yuan, Y.; Meng, S.; Nan, Z.; Xu, H.; Imtiaz, H.; Liu, B.; Gao, H. A perturbation force based approach to creasing instability in soft materials under general loading conditions. J. Mech. Phys. Solids 2021, 151. [Google Scholar] [CrossRef]
- Zhang, J.; Qiu, X.; Wang, C.; Liu, Y. A General Theory and Analytical Solutions for Post-Buckling Behaviors of Thin Sheets. J. Appl. Mech. 2022, 89, 1–28. [Google Scholar] [CrossRef]
- Venkata, S.P.; Balbi, V.; Destrade, M.; Zurlo, G. Designing necks and wrinkles in inflated auxetic membranes. Int. J. Mech. Sci. 2024, 268. [Google Scholar] [CrossRef]
- Hao, Y.-K.; Li, B.; Feng, X.-Q.; Gao, H. Wrinkling–dewrinkling transitions in stretched soft spherical shells. Int. J. Solids Struct. 2024, 294. [Google Scholar] [CrossRef]
- Rammane, M.; Elmhaia, O.; Mesmoudi, S.; Askour, O.; Braikat, B.; Tri, A.; Damil, N. On the use of Hermit-type WLS approximation in a high order continuation method for buckling and wrinkling analysis of von-Kàrmàn plates. Eng. Struct. 2023, 278. [Google Scholar] [CrossRef]
- Yan, D.; Huangfu, D.; Zhang, K.; Hu, G. Wrinkling of the membrane with square rigid elements. EPL (Europhysics Lett. 2016, 116, 24005. [Google Scholar] [CrossRef]
- Zhang, S.-Q.; Lai, W.-J.; Huang, C.-Y.; Cai, C.-S.; Lin, C.-H.; Zhu, Q.-H. Dynamic modeling and control of rigid-flexible-thermo-electrically coupled piezoelectric integrated smart spacecraft. Appl. Math. Model. 2024, 140. [Google Scholar] [CrossRef]
- Li, N.; Duan, B.; Zheng, F. Effect of the Random Error on the Radiation Characteristic of the Reflector Antenna Based on Two-Dimensional Fractal. Int. J. Antennas Propag. 2012, 2012, 1–6. [Google Scholar] [CrossRef]
- Yu, D.; Yang, Y.; Hu, G.; Zhou, Y.; Hong, J. Energy harvesting from thermally induced vibrations of antenna panels. Int. J. Mech. Sci. 2022, 231. [Google Scholar] [CrossRef]
- Li, H.; Lyu, S.; Ma, X.; Lin, K.; Zhang, D.; Zhou, X.; Su, G.; Li, Y.; Jin, X. Topology Design of Modular Unit and Cable Network of On-Orbit Modular-Assembled Antenna. Int. J. Aerosp. Eng. 2024, 2024. [Google Scholar] [CrossRef]
- Xu, P.; Wang, Y.; Xu, X.; Wang, L.; Wang, Z.; Yu, K.; Wu, W.; Wang, M.; Leng, G.; Ge, D.; et al. Structural-Electromagnetic-Thermal Coupling Technology for Active Phased Array Antenna. Int. J. Antennas Propag. 2023, 2023, 1–36. [Google Scholar] [CrossRef]
- Jia, Y.; Wei, X.; Xu, L.; Wang, C.; Lian, P.; Xue, S.; Al-Saadi, A.; Shi, Y. Multiphysics vibration FE model of piezoelectric macro fibre composite on carbon fibre composite structures. Compos. Part B: Eng. 2019, 161, 376–385. [Google Scholar] [CrossRef]
- Wang, C.; Wang, Y.; Zhou, J.; Wang, M.; Zhong, J.; Duan, B. Compensation method for distorted planar array antennas based on structural–electromagnetic coupling and fast Fourier transform. IET Microwaves, Antennas Propag. 2018, 12, 954–962. [Google Scholar] [CrossRef]
- Zhang, S.; Zhang, Y.; Yang, D.; Song, L.; Zhang, X. Second-order sensitivity analysis of electromagnetic performance with respect to surface nodal displacements for reflector antennas and its benefits in integrated structural–electromagnetic optimisation. IET Microwaves, Antennas Propag. 2017, 11, 1530–1535. [Google Scholar] [CrossRef]
- Zeb, B.A.; Afzal, M.U.; Esselle, K.P. Performance analysis of classical and phase-corrected electromagnetic band gap resonator antennas with all-dielectric superstructures. IET Microwaves, Antennas Propag. 2016, 10, 1276–1284. [Google Scholar] [CrossRef]
- Hadarig, R.C.; de Cos, M.E.; Las-Heras, F. High-Performance Computational Electromagnetic Methods Applied to the Design of Patch Antenna with EBG Structure. Int. J. Antennas Propag. 2011, 2012, 1–5. [Google Scholar] [CrossRef]
- Zhou, X.; Li, H.; Ma, X. Analysis of Structural Boundary Effects of Copper-Coated Films and Their Application to Space Antennas. Coatings 2023, 13, 1612. [Google Scholar] [CrossRef]
Figure 2.
Uniform Wrinkling Analysis of an Infinitely Long Thin-Film Structure.
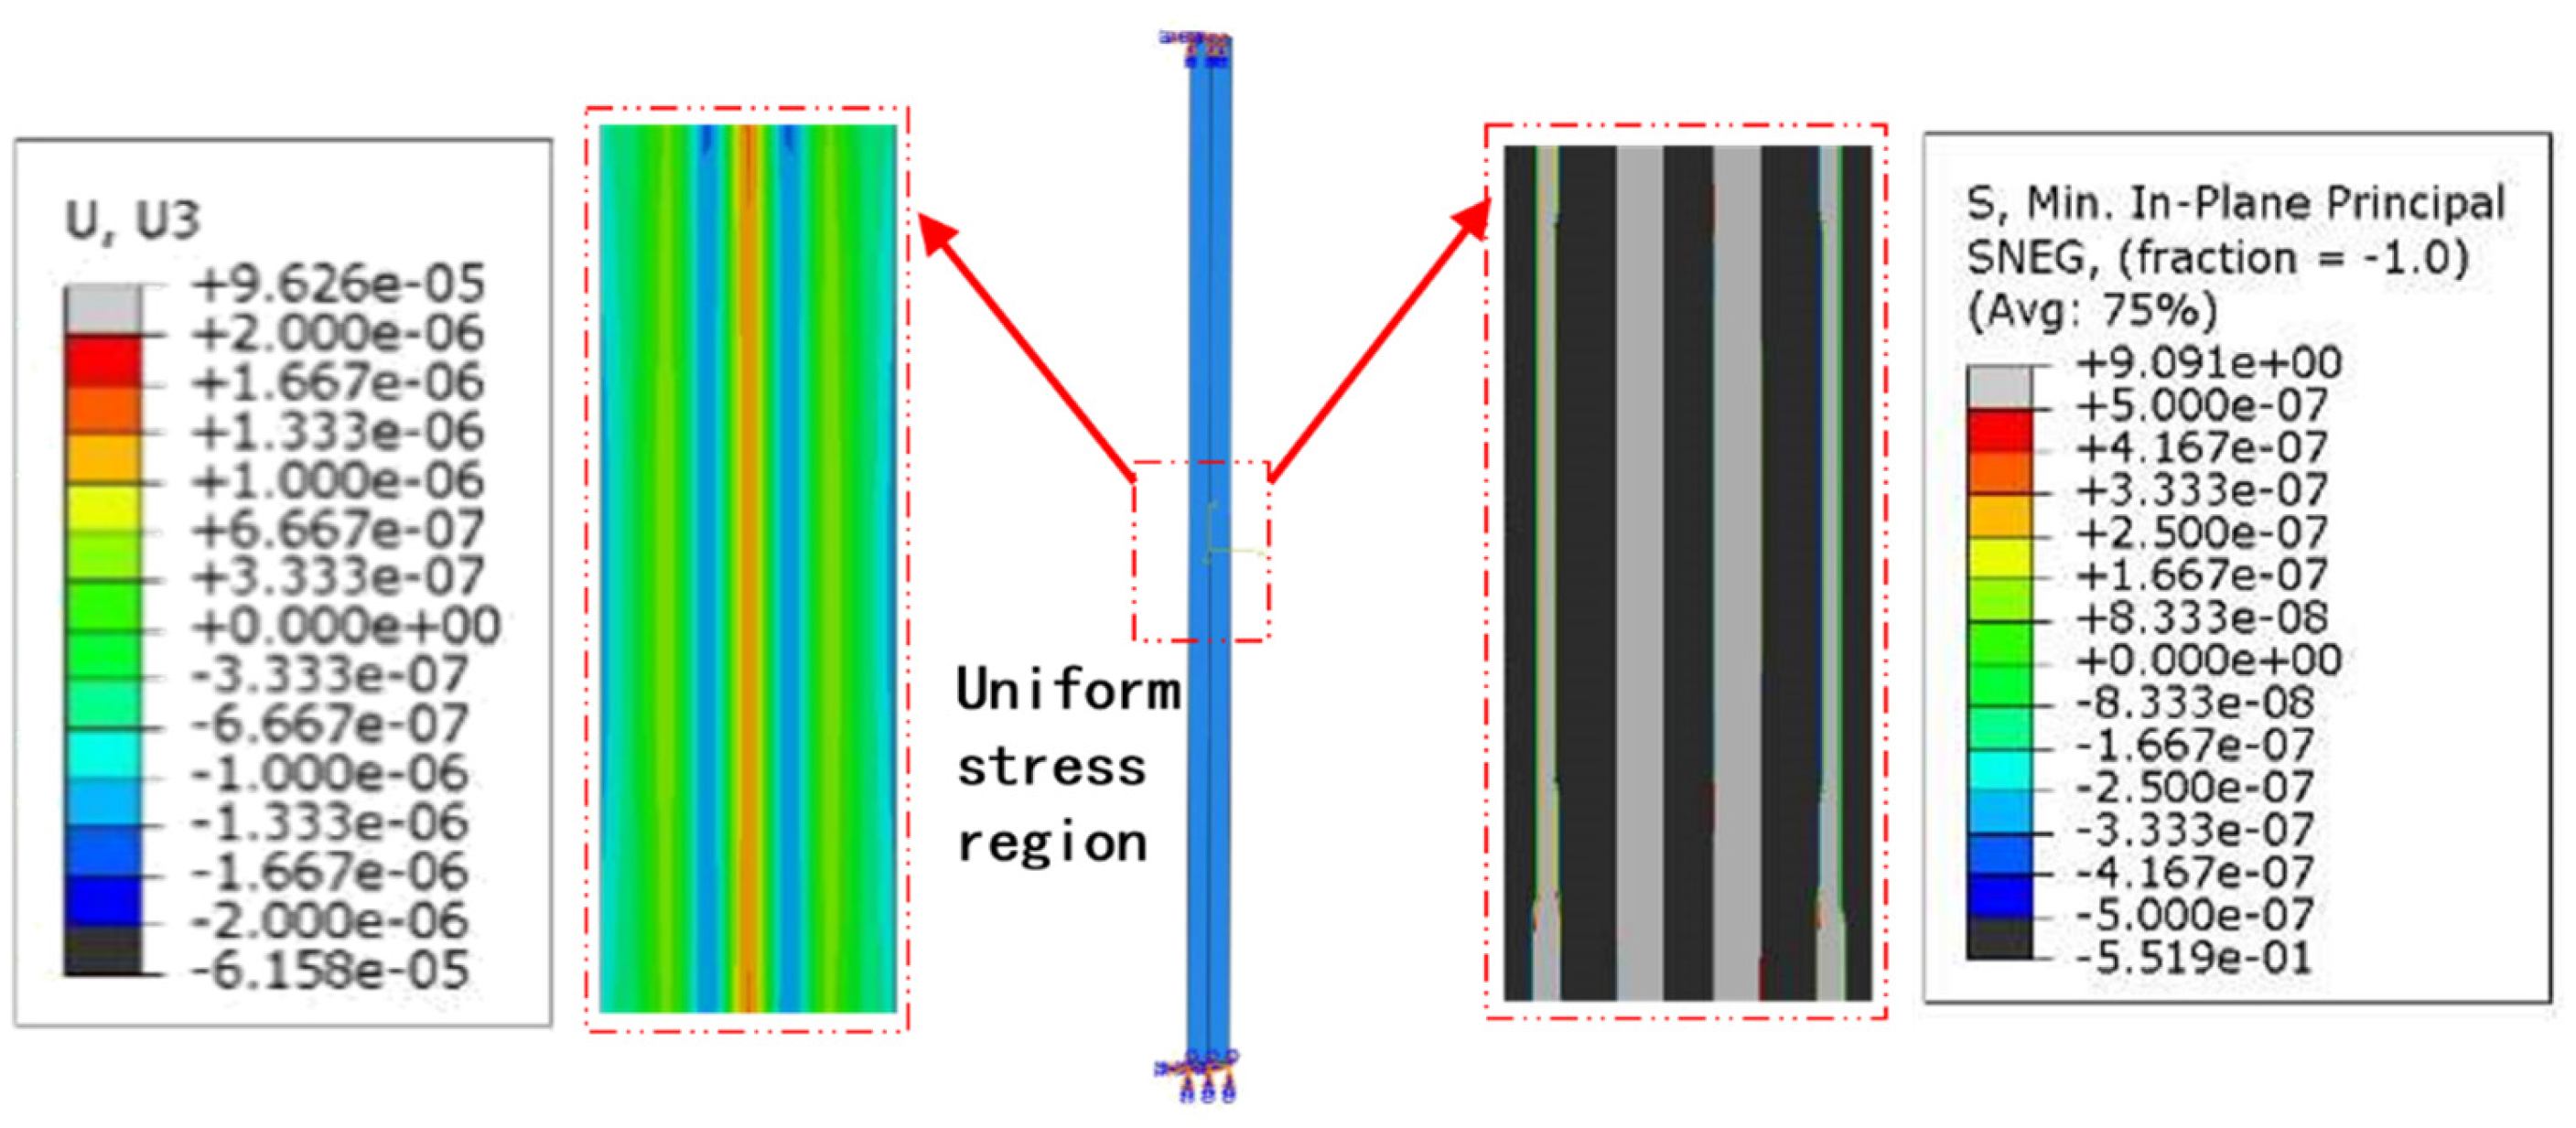
Figure 3.
Possible deformation types of STMA.
Figure 4.
Displacement contour of the thin film with a 7×3 catenary array (Left: upper membrane; Right: lower membrane).
Figure 4.
Displacement contour of the thin film with a 7×3 catenary array (Left: upper membrane; Right: lower membrane).
Figure 5.
Displacement contour of the thin film with a 5×3 catenary array (Left: upper membrane; Right: lower membrane).
Figure 5.
Displacement contour of the thin film with a 5×3 catenary array (Left: upper membrane; Right: lower membrane).
Figure 6.
Possible deformation modes.
Figure 7.
Deformation plots of the equivalent structure under separate dual-domain adjustments (20th-order fitting results).
Figure 7.
Deformation plots of the equivalent structure under separate dual-domain adjustments (20th-order fitting results).
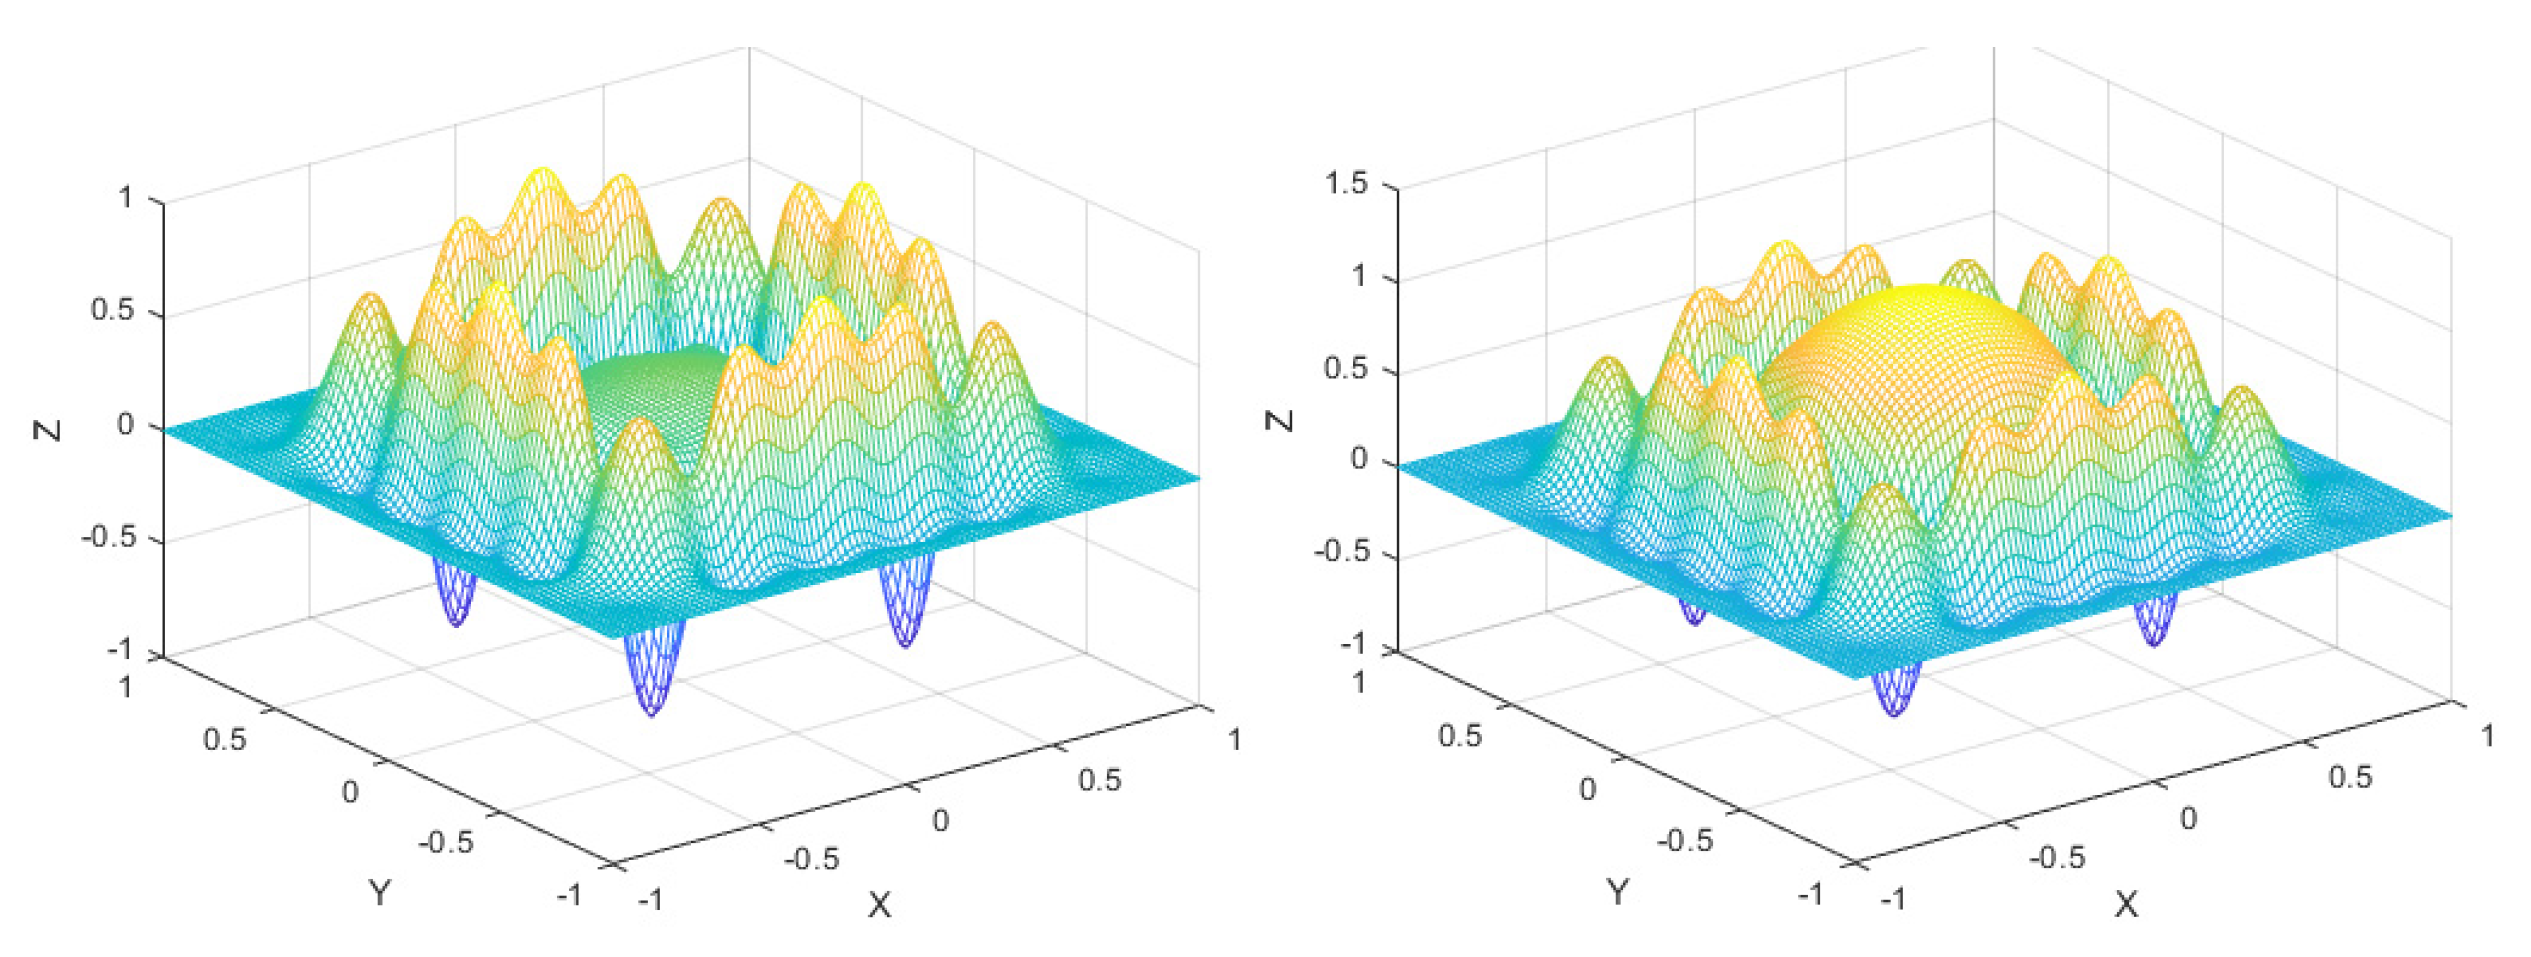
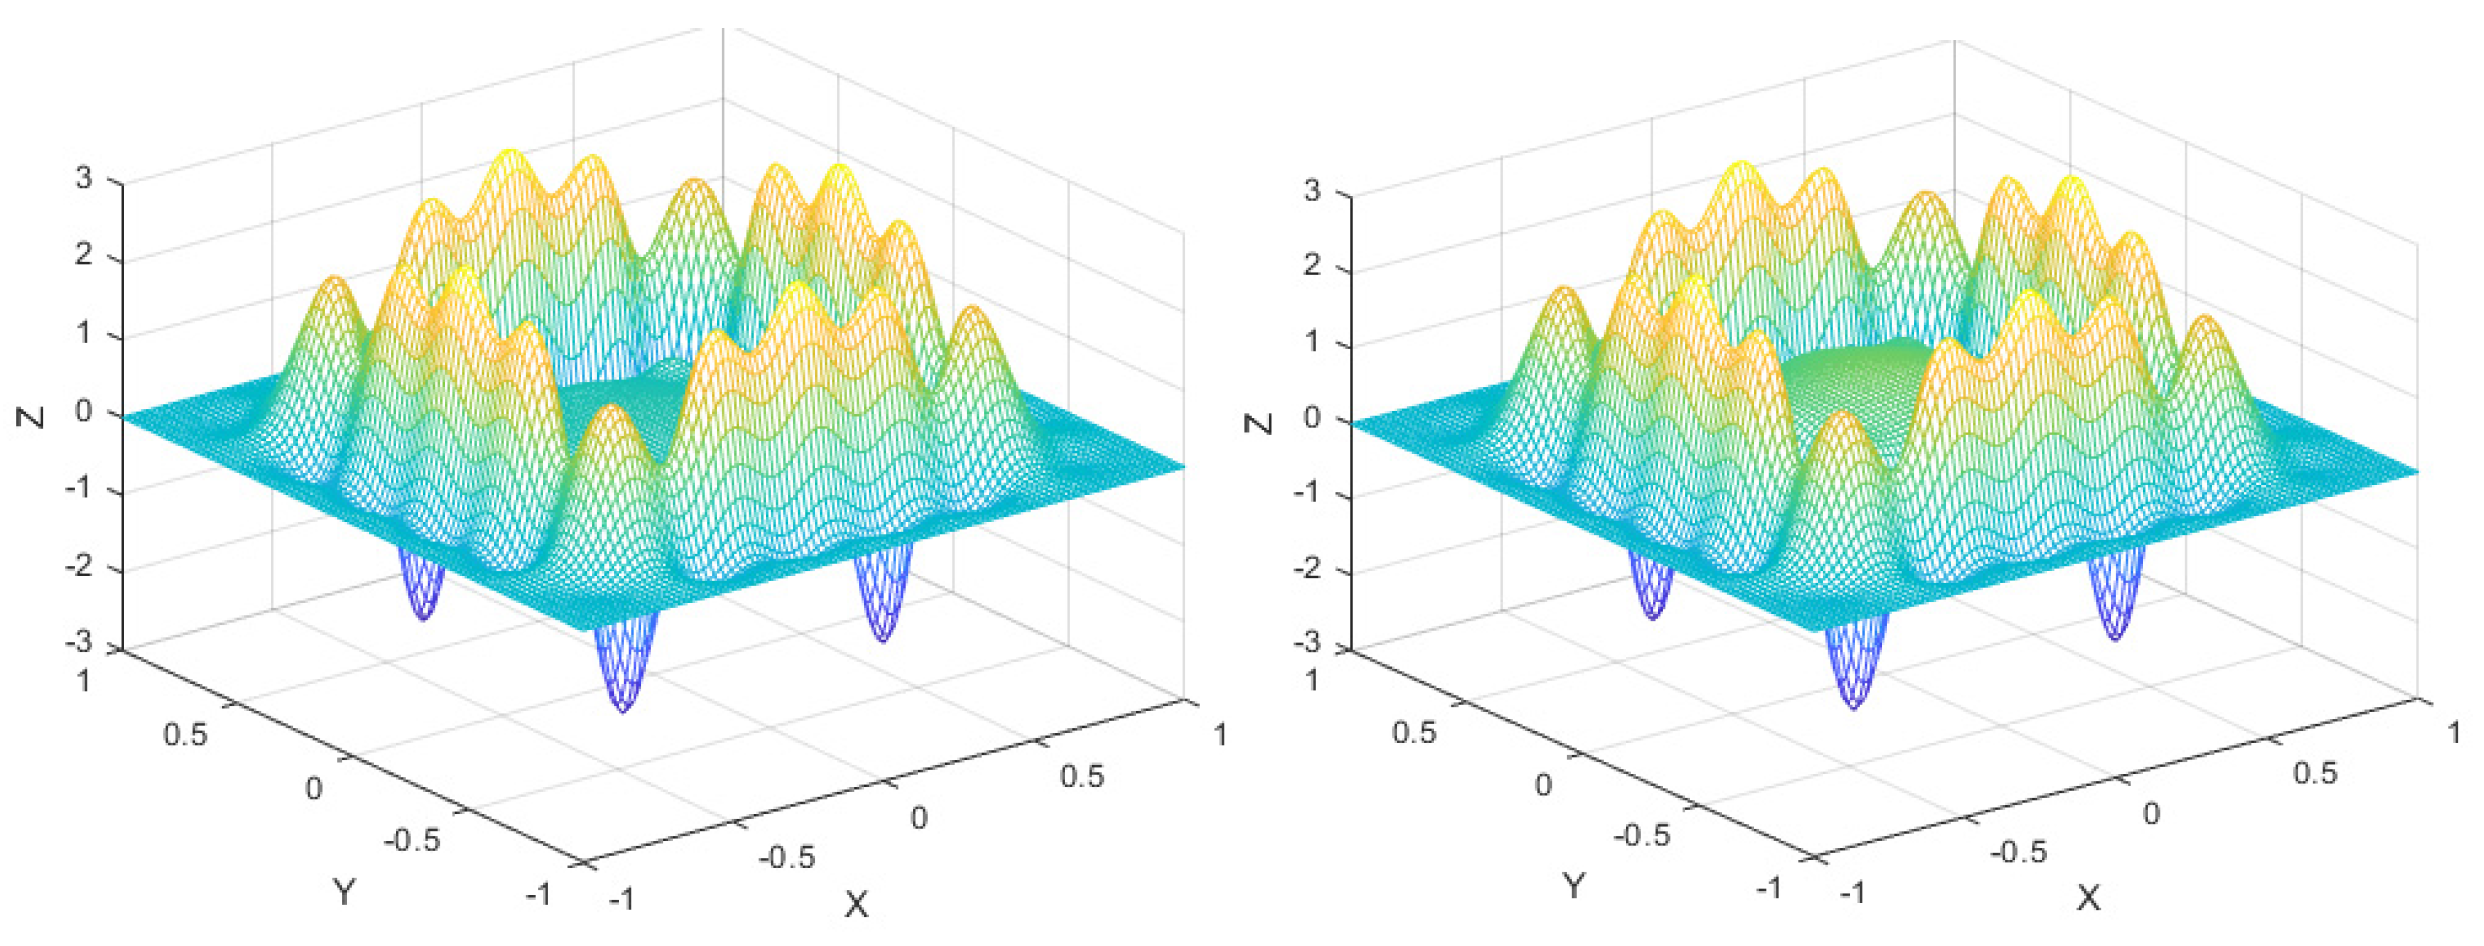
Figure 8.
Geometric Relationships of Far-Field Electrical Performance.
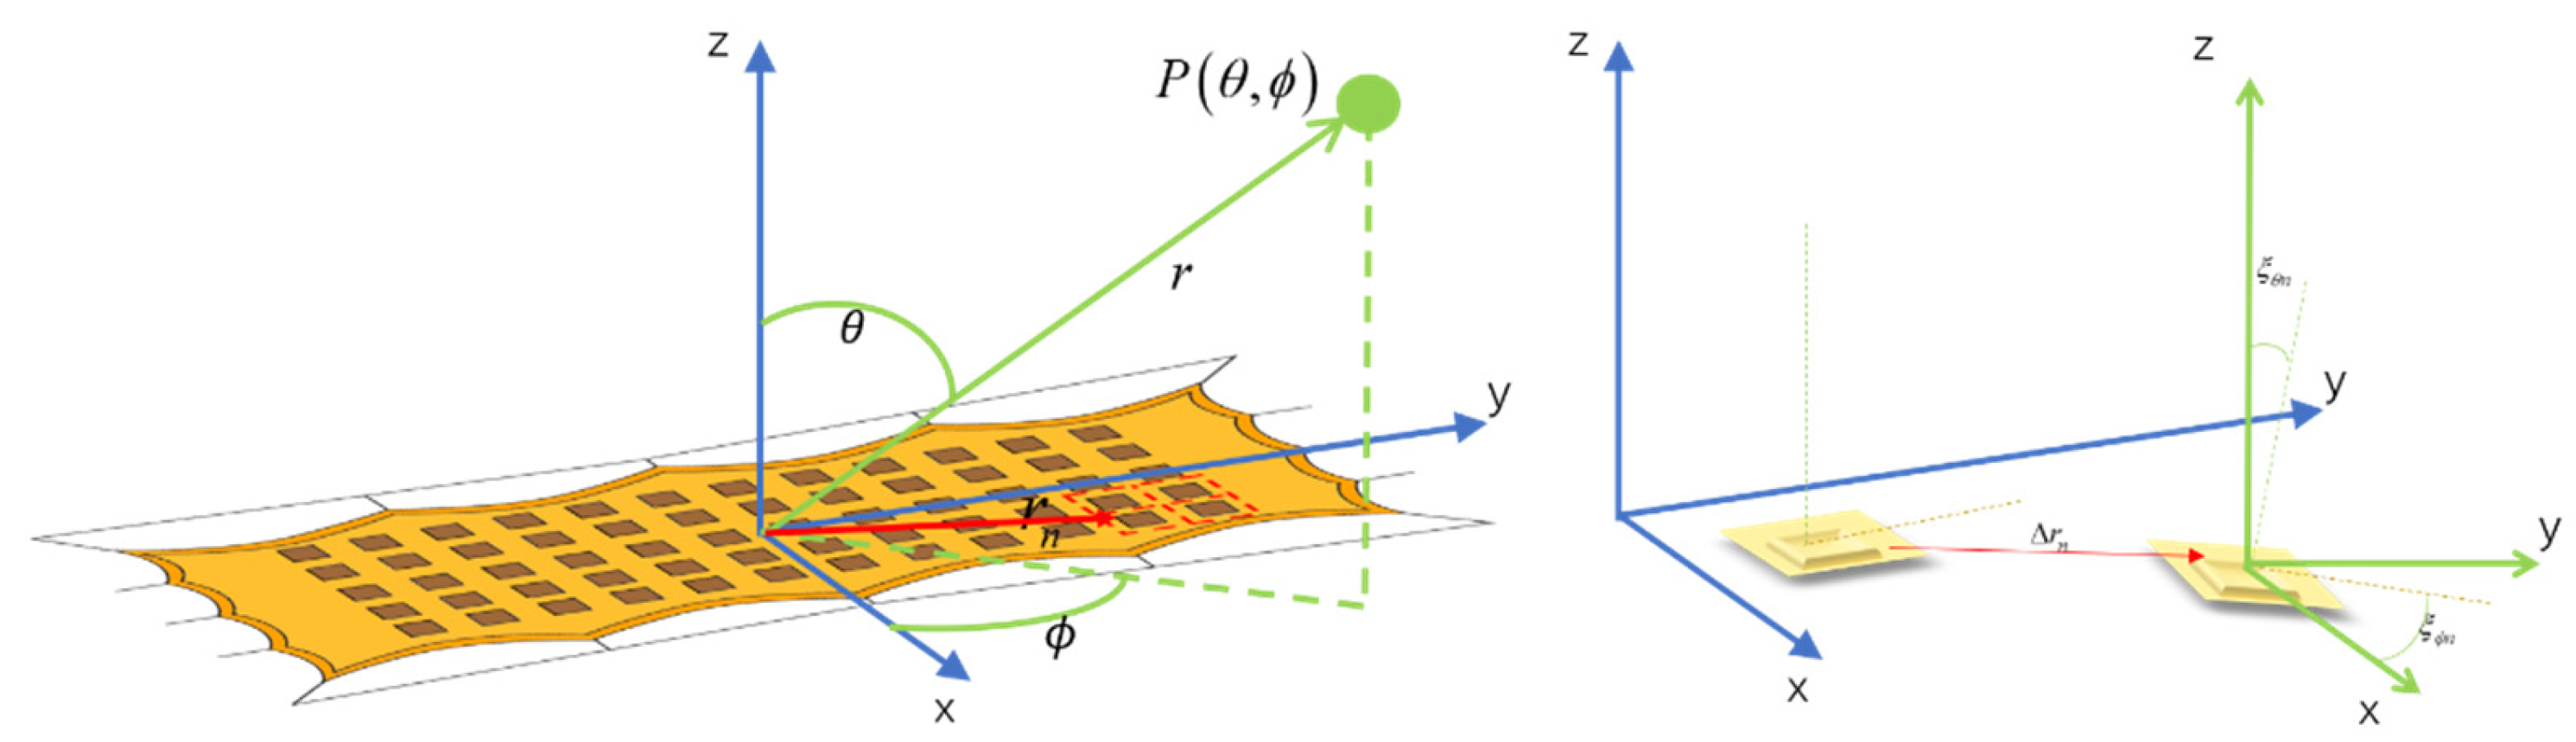
Figure 9.
Electrical Performance of an Ideal Patch Antenna.
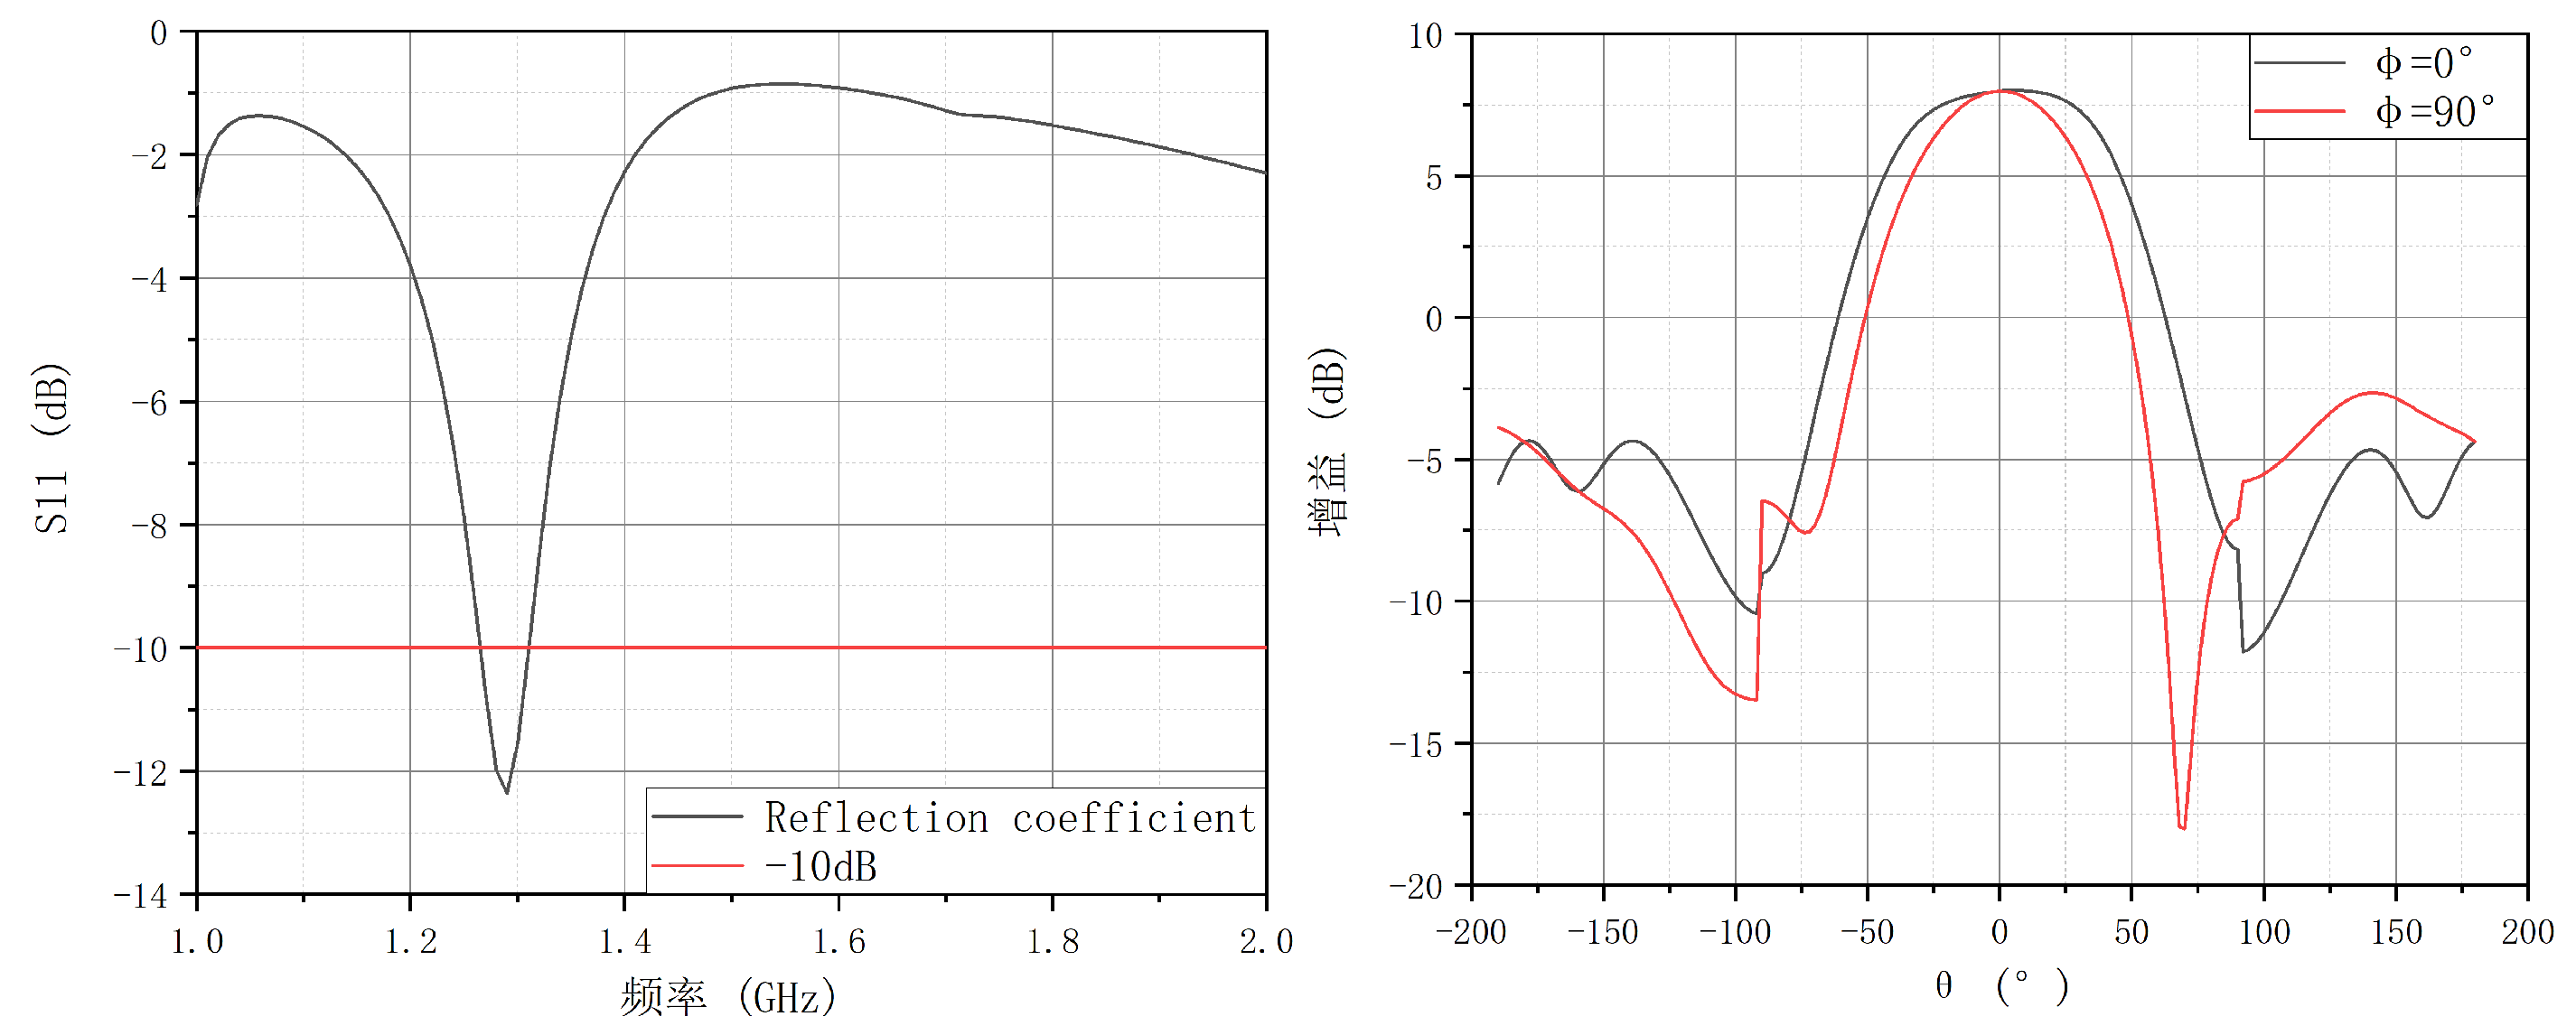
Figure 10.
Effect of patch translation on S11 and gain.
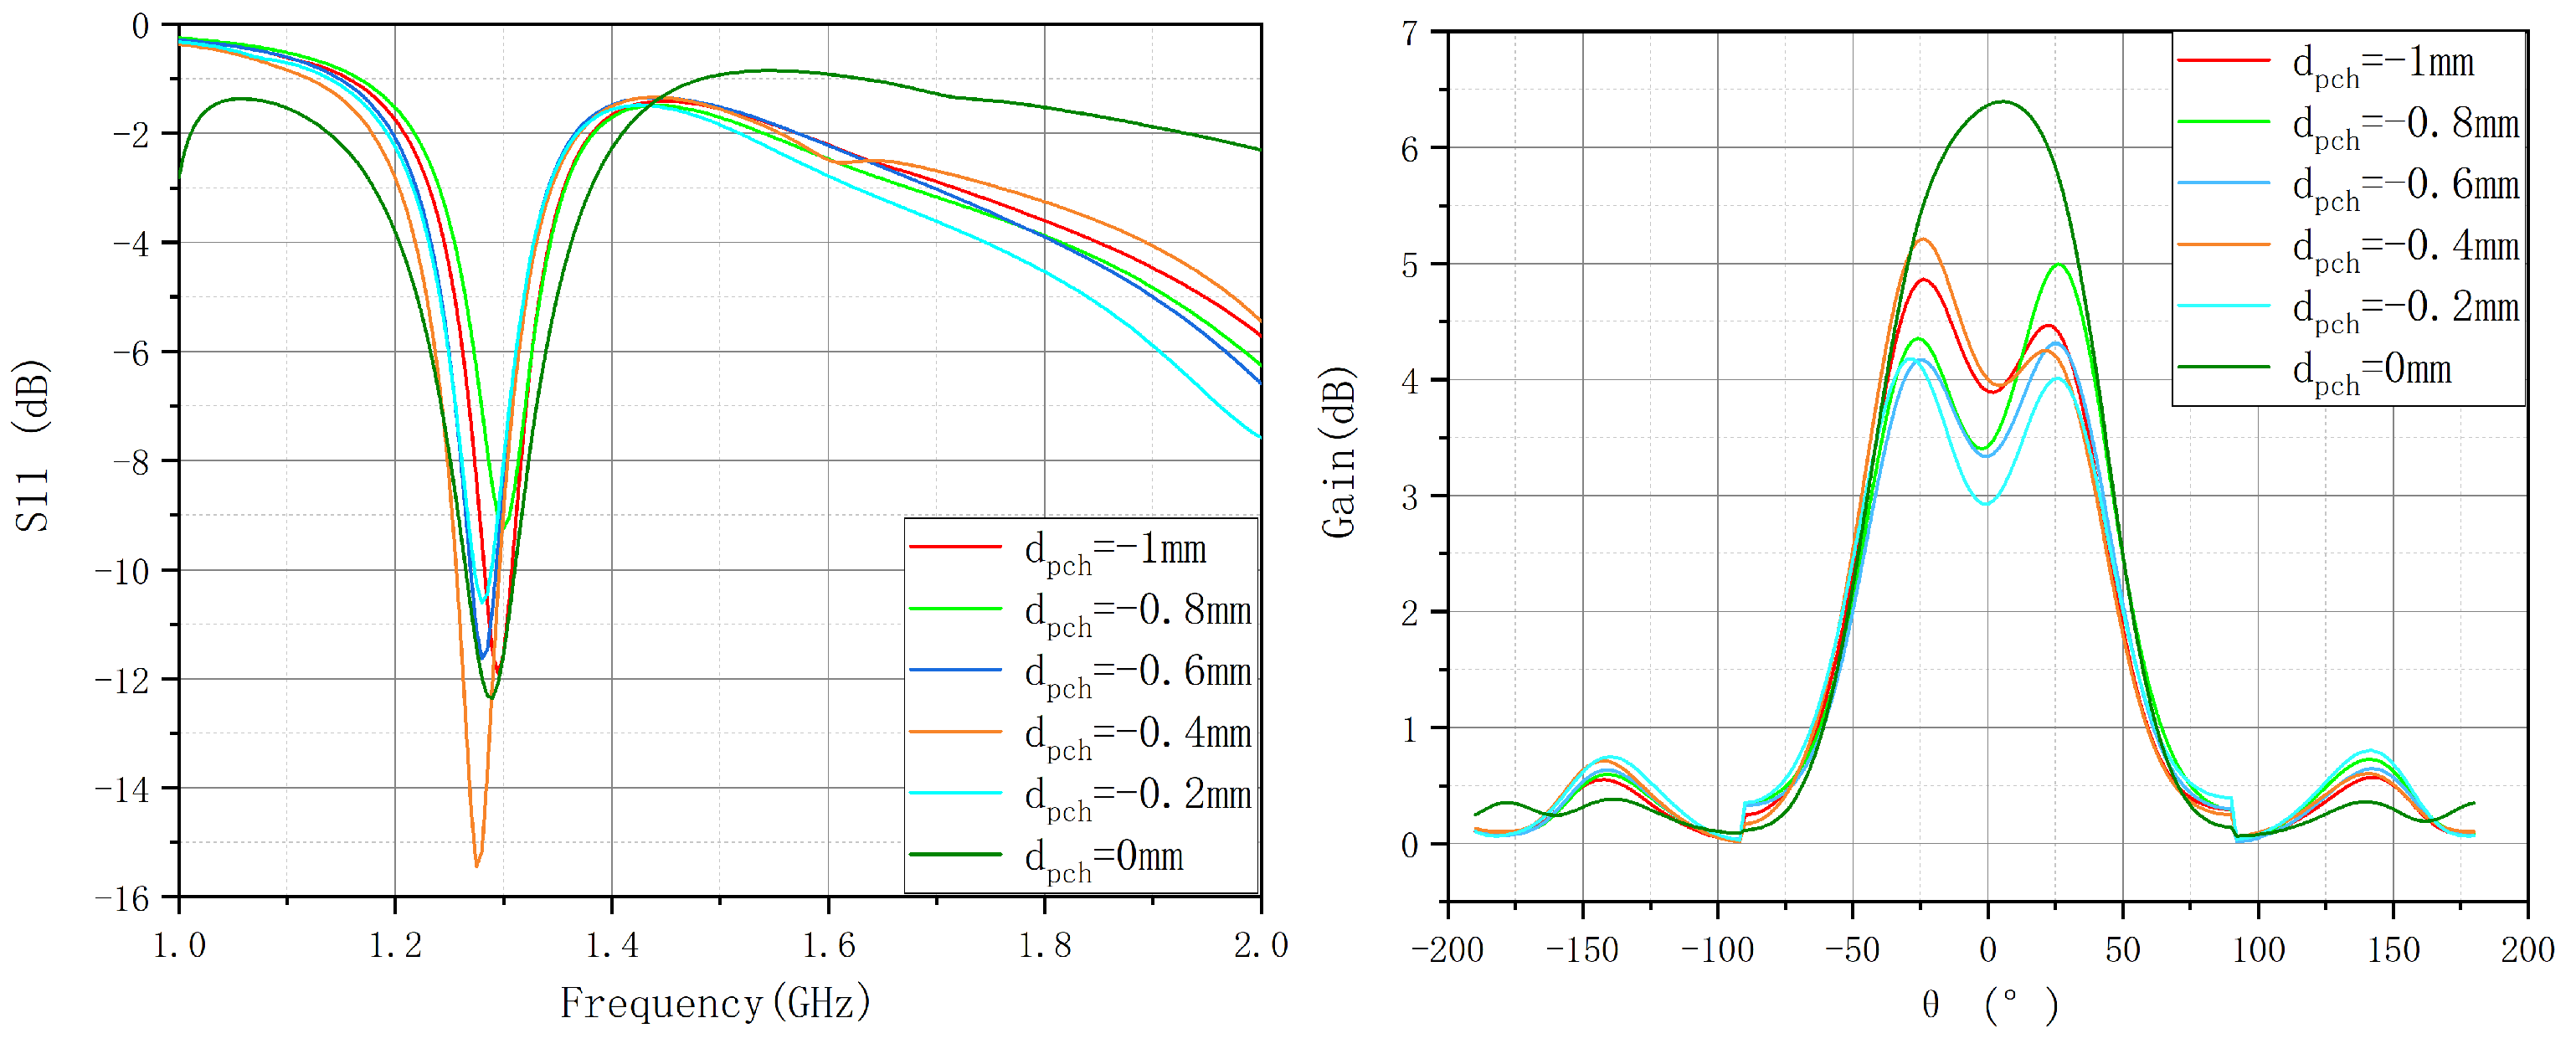
Figure 11.
Effect of film translation on S11 and gain.
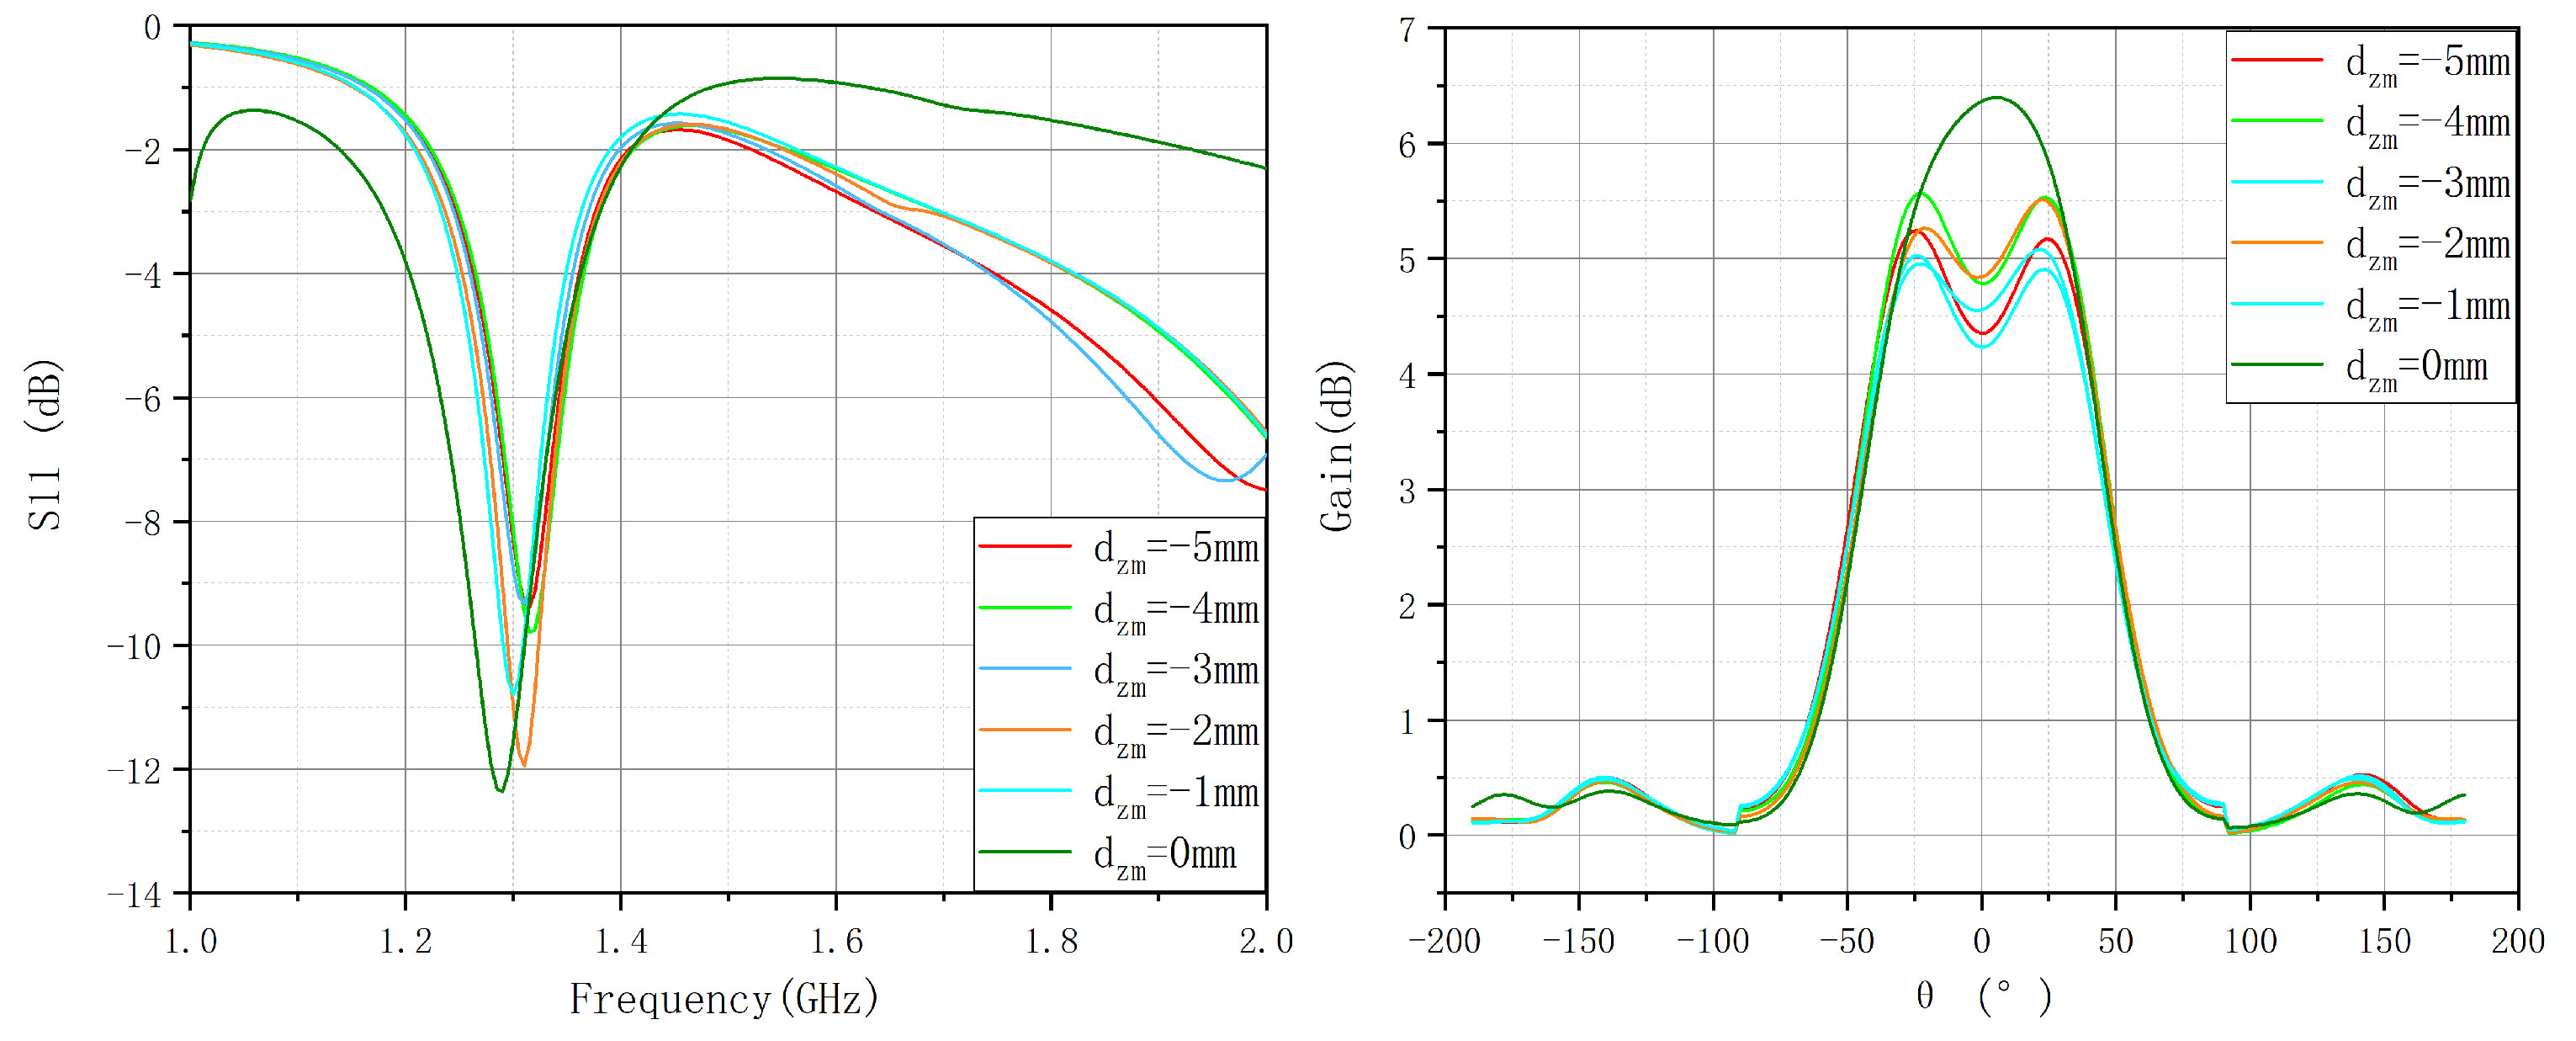
Figure 12.
Effect of local deformation on S11 and gain.
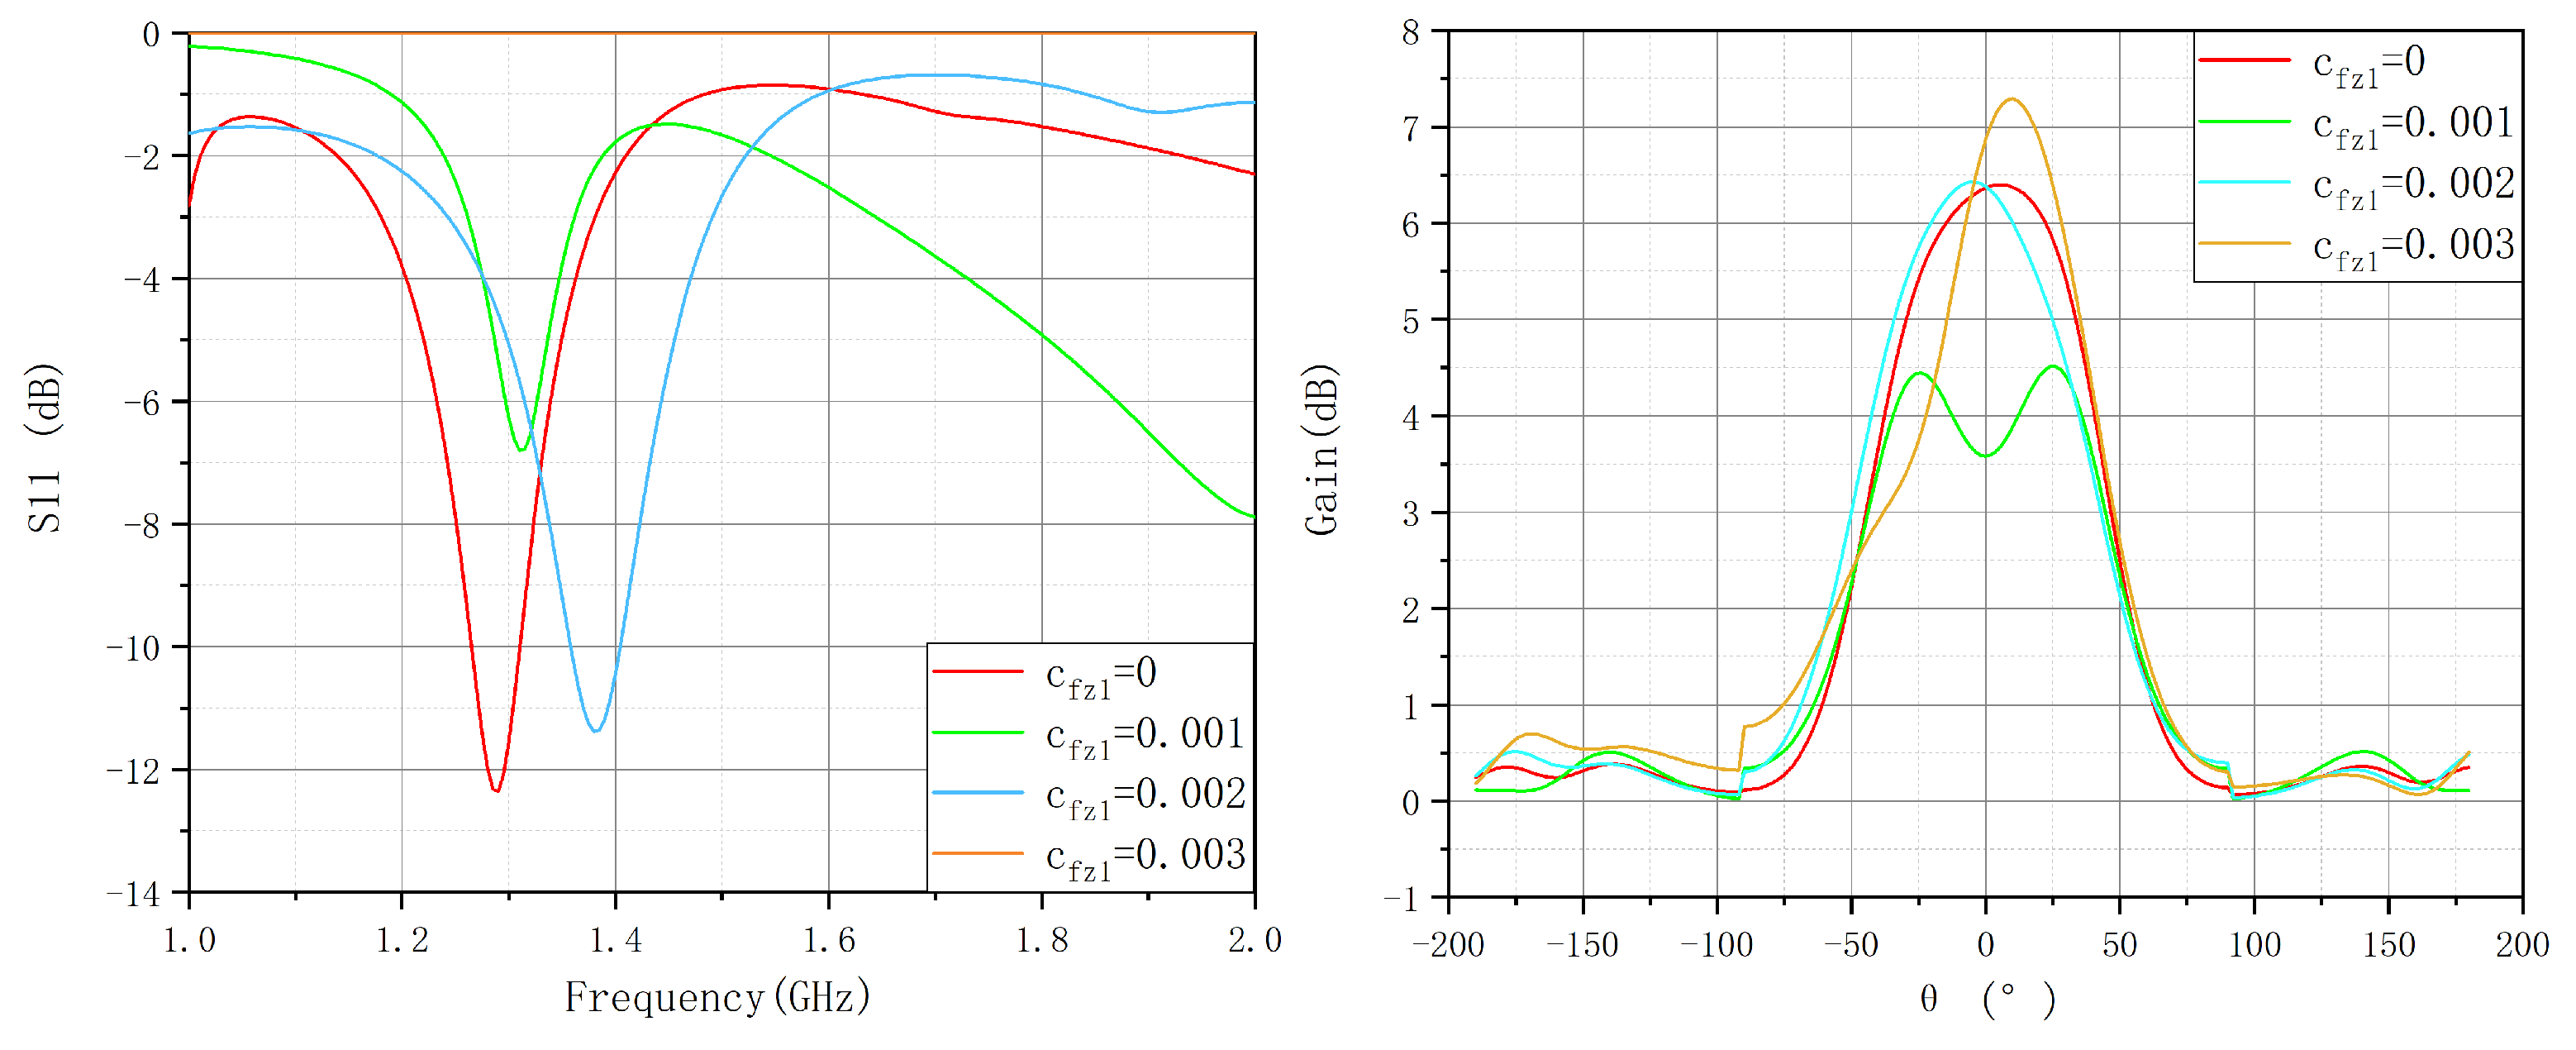
Figure 13.
Variation of gain performance with structural displacement parameters (ϕ = 0°, 90°).
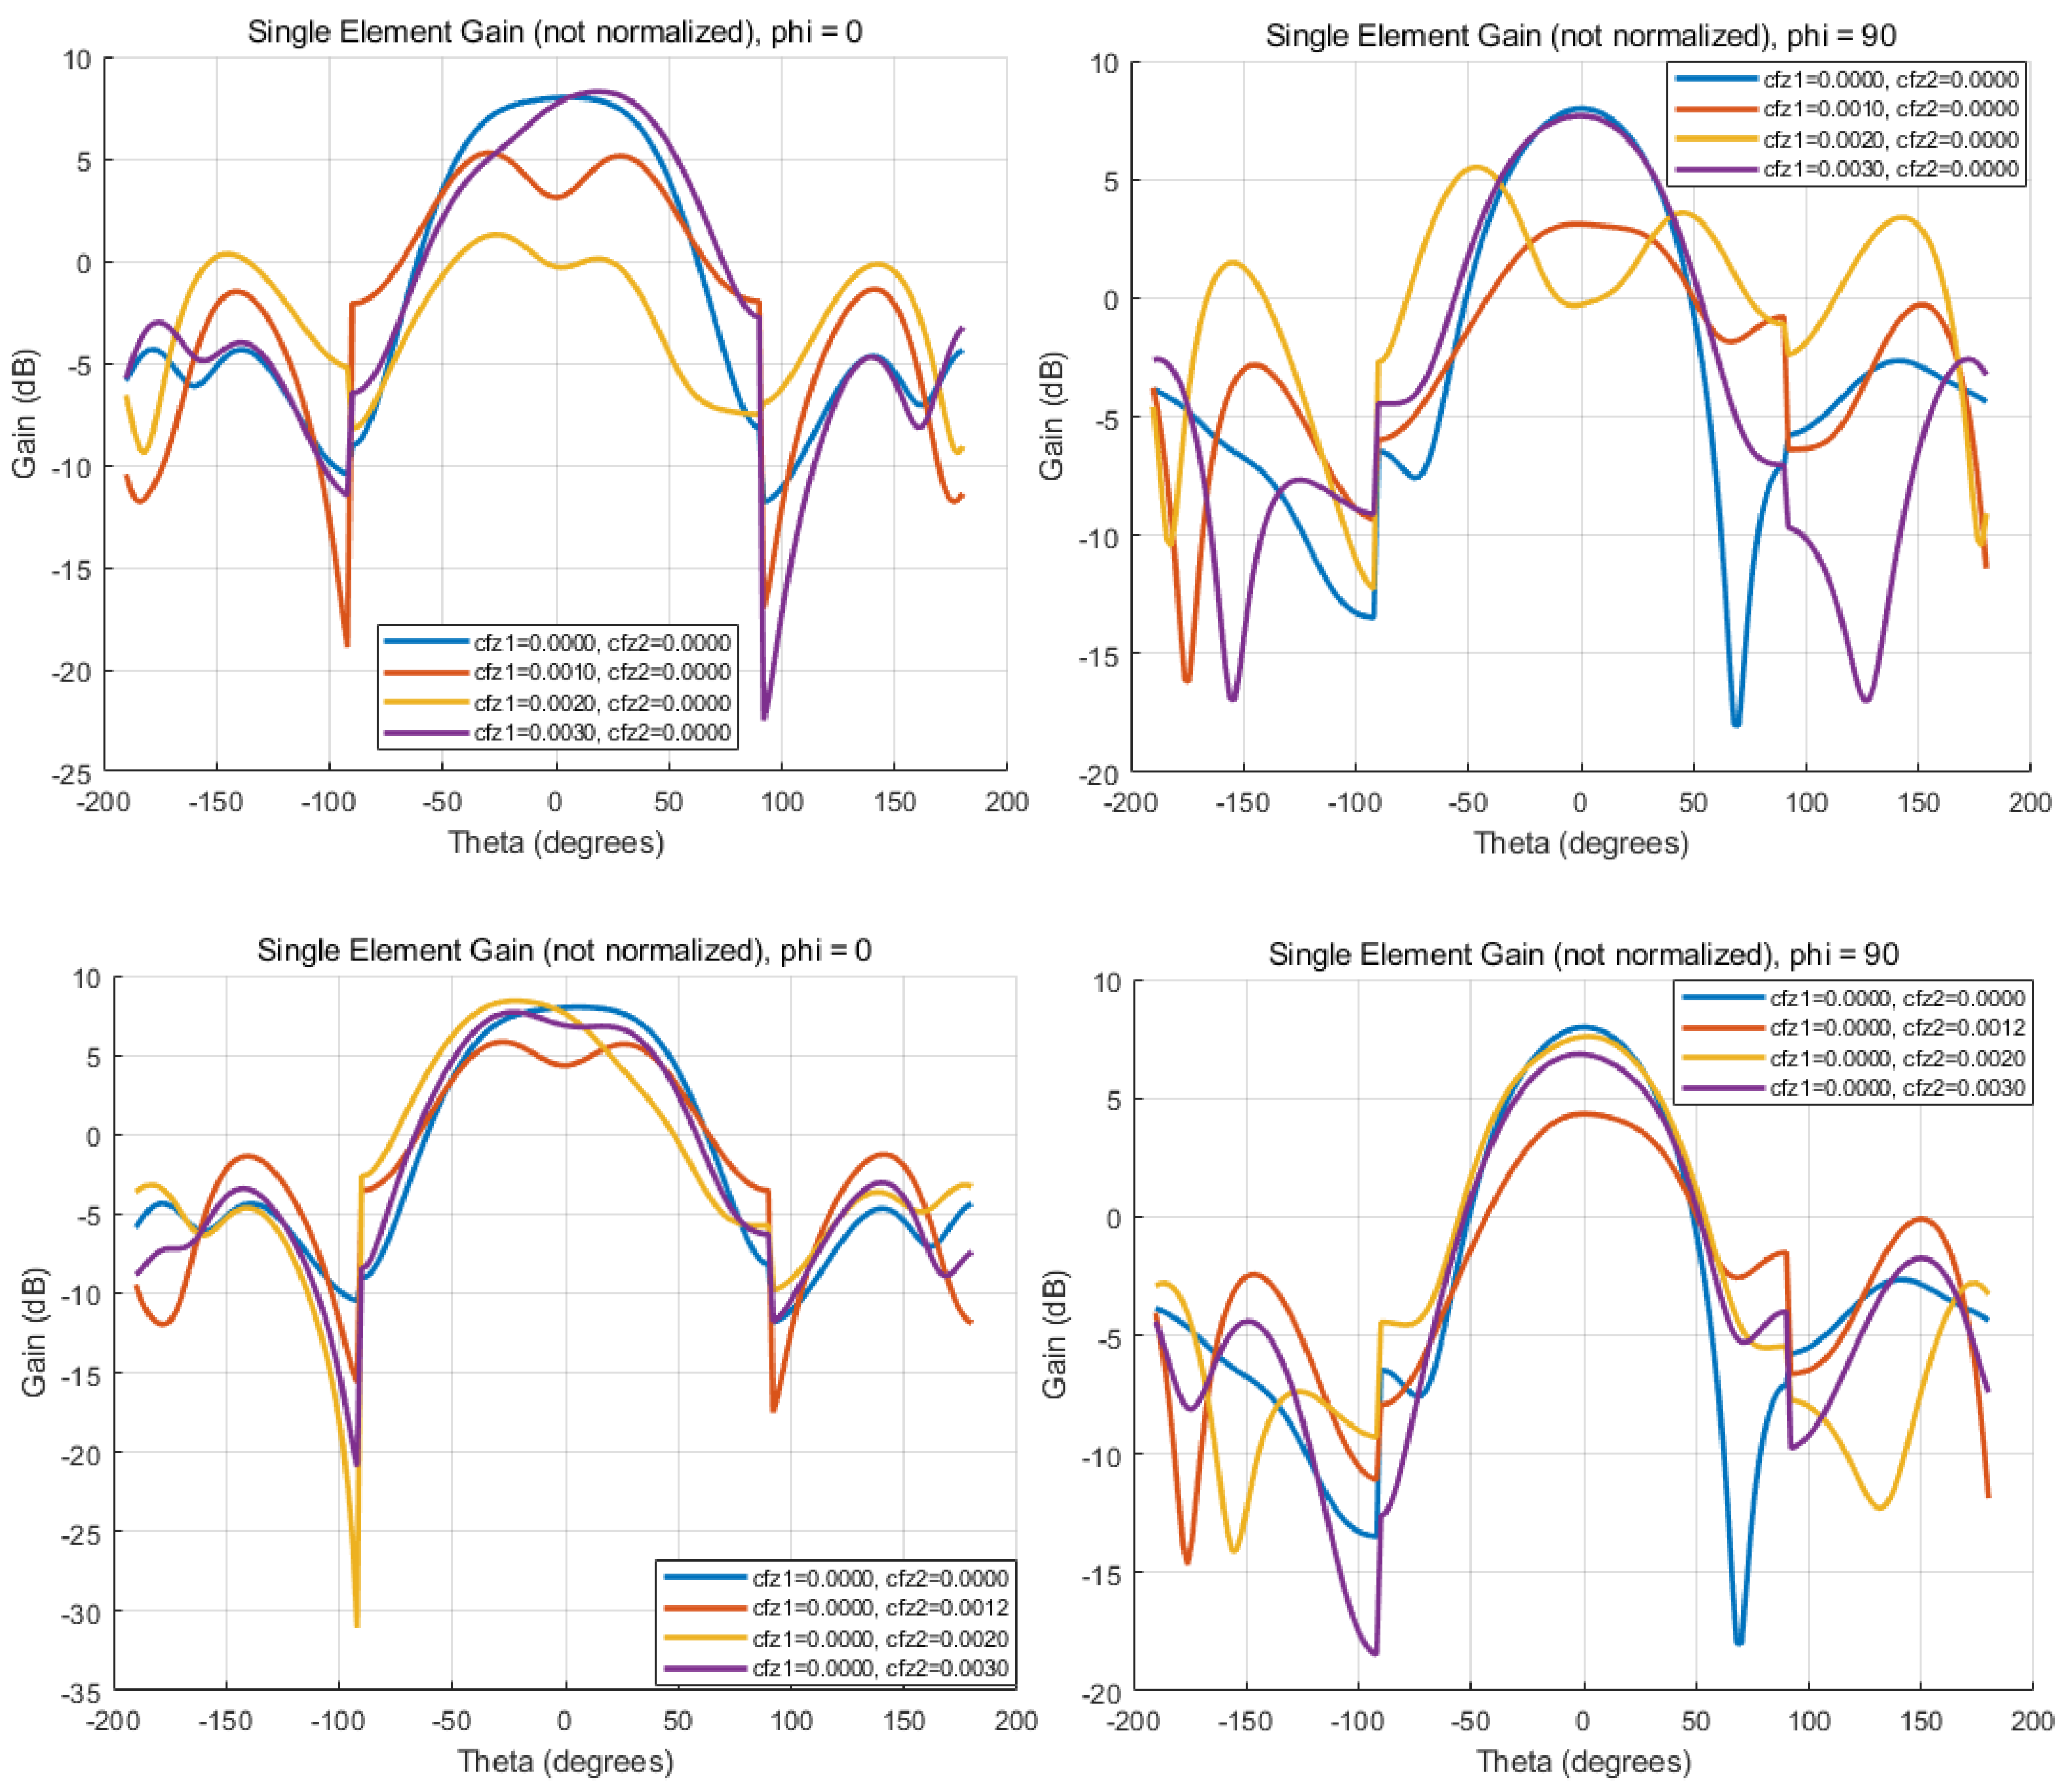
Figure 14.
Variation of the antenna’s input reflection coefficient and E-plane gain with frequency (, variations).
Figure 14.
Variation of the antenna’s input reflection coefficient and E-plane gain with frequency (, variations).
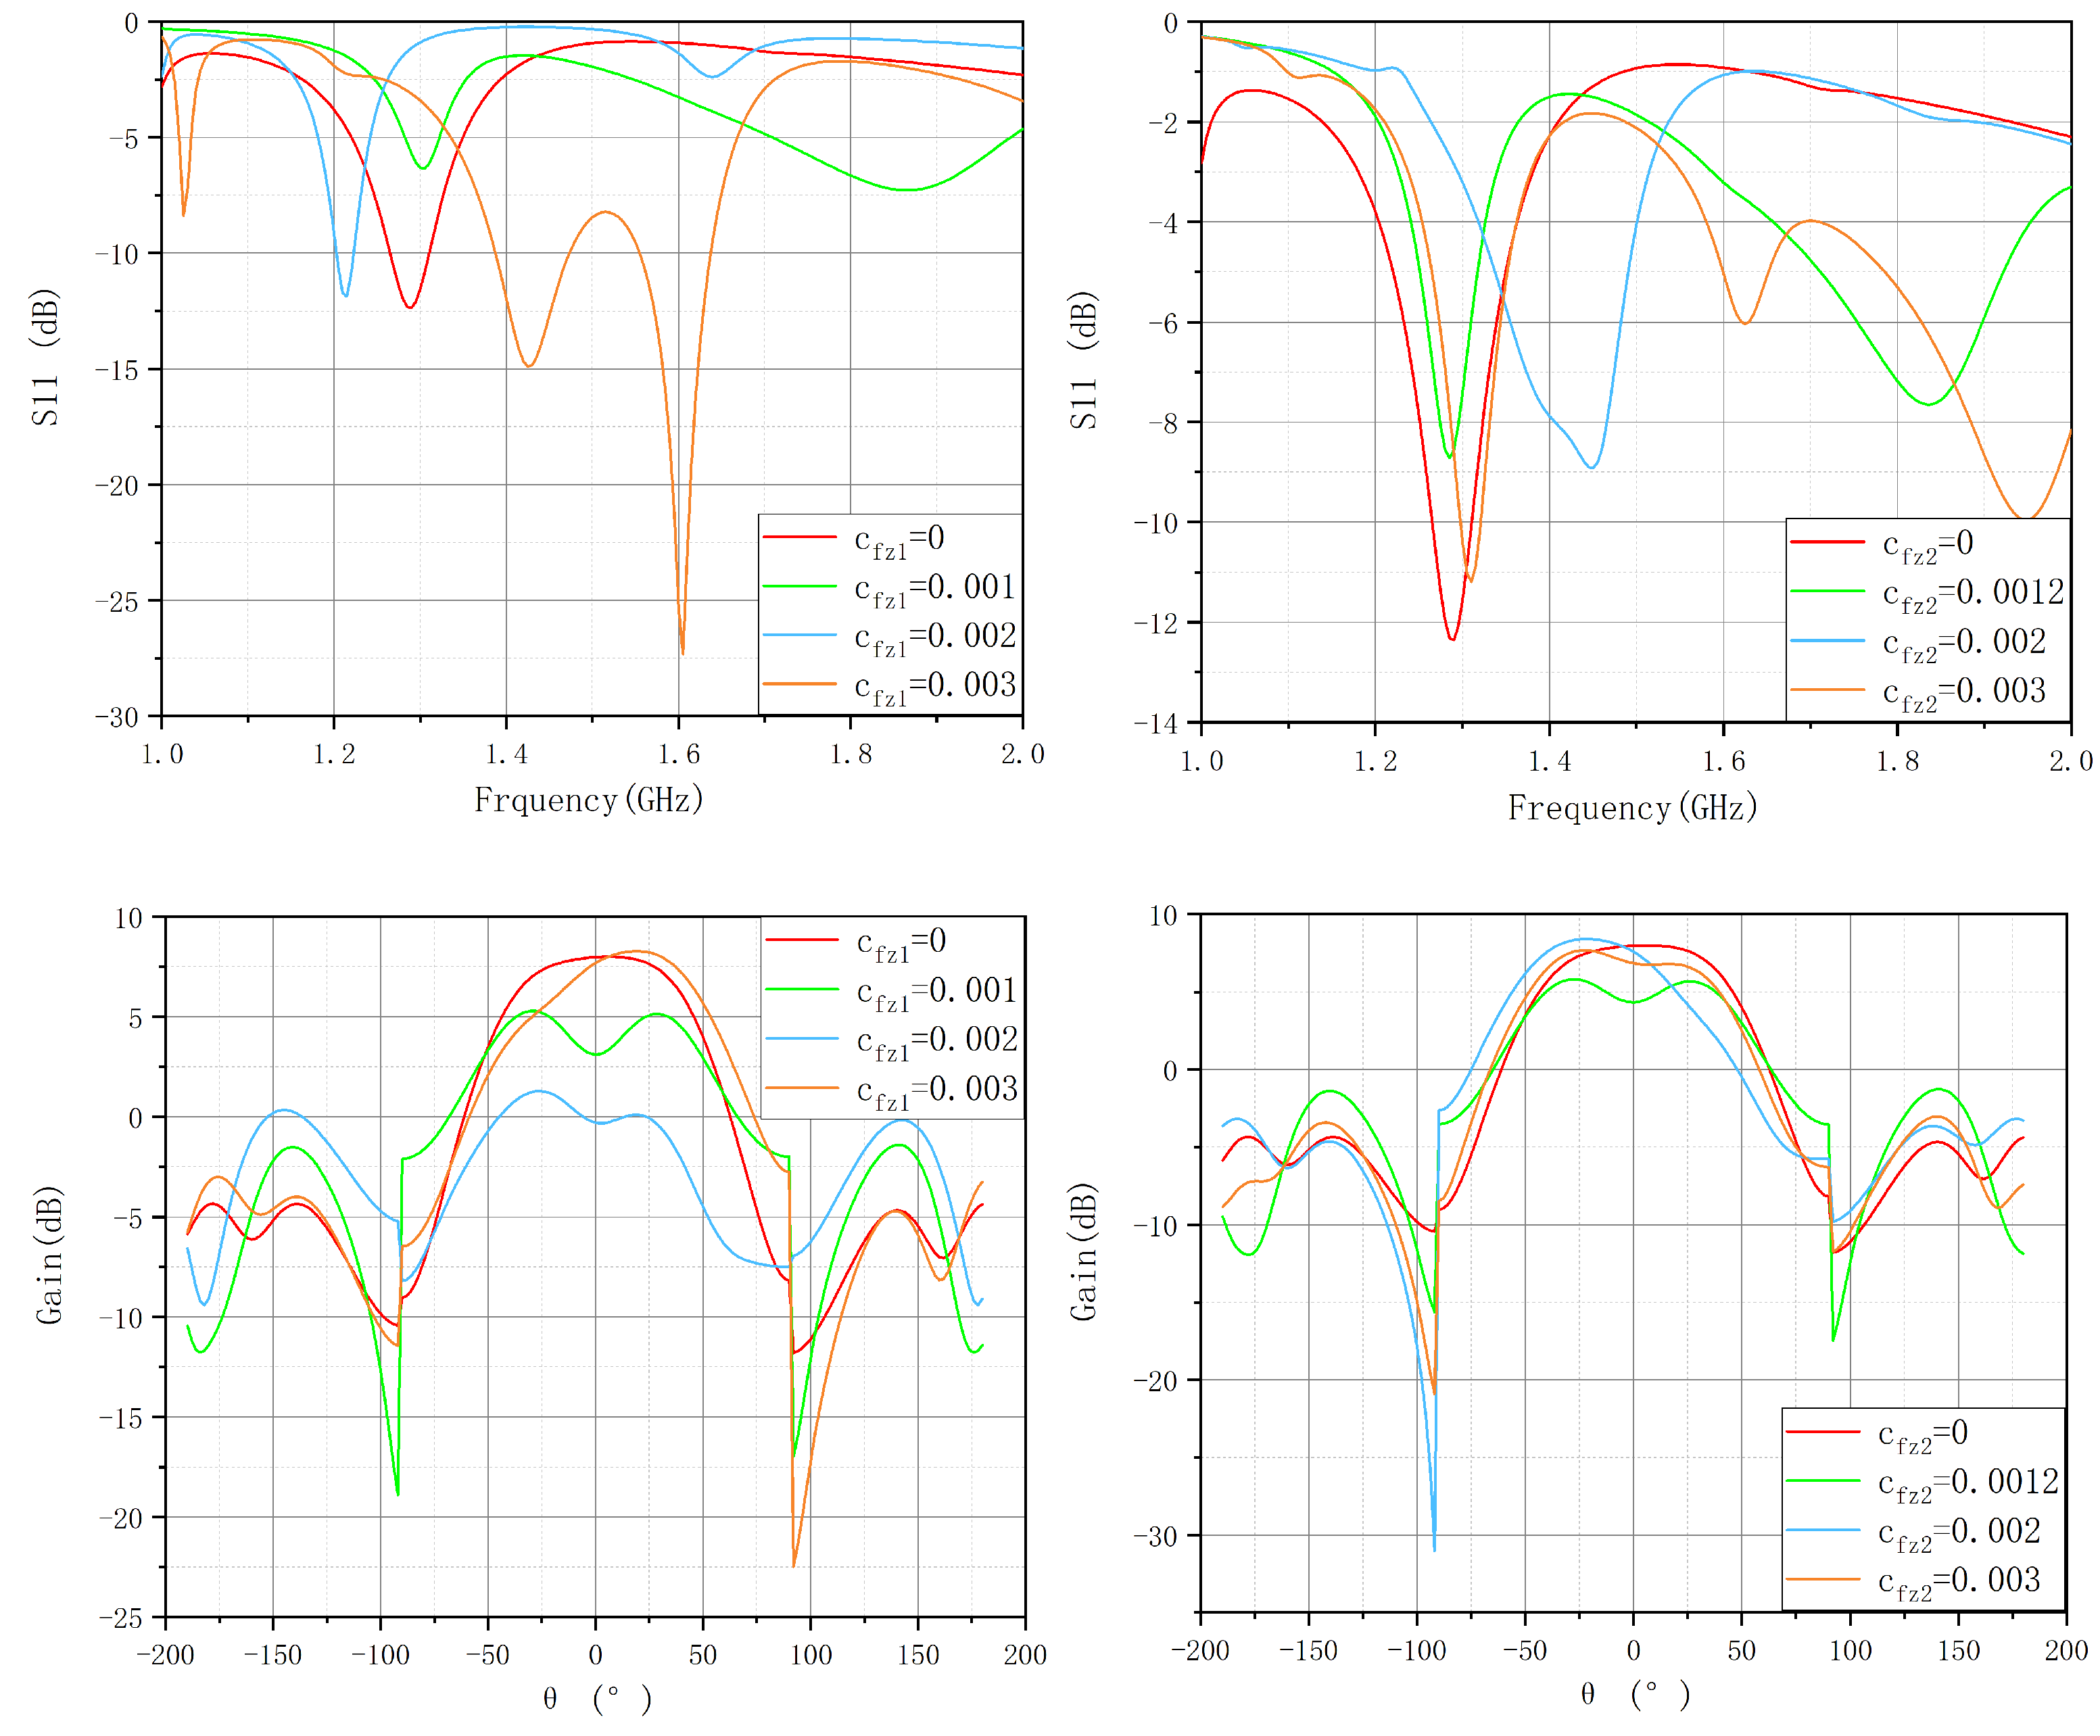
Figure 15.
Prediction of the Phased-Array Antenna’s Electrical Performance (, Variations).
Disclaimer/Publisher’s Note: The statements, opinions and data contained in all publications are solely those of the individual author(s) and contributor(s) and not of MDPI and/or the editor(s). MDPI and/or the editor(s) disclaim responsibility for any injury to people or property resulting from any ideas, methods, instructions or products referred to in the content. |
© 2025 by the authors. Licensee MDPI, Basel, Switzerland. This article is an open access article distributed under the terms and conditions of the Creative Commons Attribution (CC BY) license (http://creativecommons.org/licenses/by/4.0/).
Copyright: This open access article is published under a Creative Commons CC BY 4.0 license, which permit the free download, distribution, and reuse, provided that the author and preprint are cited in any reuse.


