

Submitted:
26 May 2025
Posted:
27 May 2025
You are already at the latest version
Abstract
This study analyzes and compares three Standardized Precipitation and Evapotran-spiration Index (SPEI) prediction models at different time scales: (1) Kalman Filter with Exogenous Variables (DKF-ARX-Pt, FK), (2) Closed Recurrent Units (GRU) and (3) Autoregressive Neural Networks with External Input (NARX). The evaluation was performed on observed data from meteorological stations in the State of Mexico and Mexico City, considering several performance metrics, such as mean absolute error (MAE), mean square error (MSE), root mean square error (RMSE), coefficient of de-termination (R²), Nash-Sutcliffe efficiency coefficient (NSE) and Kling-Gupta efficien-cy (KGE). The results indicate that the FK model with exogenous variables is the most accurate model for SPEI prediction at different time scales, standing out in terms of stability and low variance in prediction error. GRU networks showed acceptable per-formance on long time scales (SPEI12 and SPEI24), but with lower stability on short scales. In contrast, NARX networks presented the worst performance, with high errors and negative efficiency coefficients at several time scales. It is concluded that models based on Kalman filters can be key tools to improve drought mitigation strategies in vulnerable regions.
Keywords:
drought indices
; autoregressive models
; kalman filter
; SPEI
1. Introduction
Droughts are among the most devastating climatic phenomena for human societies and ecosystems, due to their direct impact on water availability, food security, public health and economic development. In the context of climate change, an increase in the frequency, duration and intensity of these events has been observed, particularly in regions of high population density such as the State of Mexico and Mexico City, where pressure on water resources is intensifying [1].
Drought monitoring and forecasting require accurate indicators that are adaptable to different climatic contexts. In this sense, the Standardized Precipitation Evaporative Index (SPEI) has gained relevance due to its capacity to integrate precipitation and potential evapotranspiration (PET), allowing a more comprehensive evaluation of the water balance and its temporal evolution. Unlike other indices such as the SPI, the SPEI allows for the characterization of different types of droughts—meteorological, agricultural, and hydrological—through variable time scales, making it a key tool for water resources planning and management [2,3,4].
In Mexico, several studies have demonstrated the usefulness of SPEI for the retrospective analysis of drought events and its application in the design of public policies. However, its use as a target variable in predictive models still represents an area of scientific development with great potential. Statistical models such as ARIMA, and more recent approaches based on artificial intelligence, such as artificial neural networks (ANN) and support vector machines (SVM), have been successfully applied in SPEI prediction, showing higher accuracy in scenarios of high climate complexity [5].
Forecasting SPEI values using these techniques could substantially improve early warning systems, facilitating informed decision making in sectors such as agriculture, urban water management, and civil protection. In addition, the ability of these models to use accessible meteorological variables such as maximum and minimum temperature and precipitation make them viable and scalable tools for local management [6].
In the search for more accurate methodologies for drought prediction, advanced models such as Artificial Neural Networks (ANN), Kalman Filters and their variants with exogenous variables have been developed. These approaches not only allow the estimation of current conditions but also enable the prediction of drought behavior through time series. Models based on the Kalman Filter with exogenous variables (DKF-ARX-Pt) have proven to be effective in integrating additional climatic information, such as precipitation and temperatures, improving forecast accuracy [7]. Similarly, Recurrent Neural Networks such as GRU and NARX models have shown their ability to identify nonlinear patterns in time series, which is fundamental in modeling extreme weather events [8,9].
The objective of this work is to develop and evaluate forecast models for SPEI in the region of the State of Mexico and Mexico City, using advanced machine learning techniques and statistical methods, to generate reliable predictions at different time horizons. The aim is to contribute to the construction of scientific tools to mitigate the adverse effects of droughts and strengthen climate resilience in highly vulnerable urban and peri-urban areas.
2. Materials and Methods
2.1. Description of the Study Area
In recent years there has been an urban growth reflected in the development of new population settlements and civil works developments. According to the last population census conducted by INEGI, the State of Mexico has an area of 22,351.8 km2, which represents 1.1% of Mexico’s surface area; however, it is the most populated state with 16,992,418 inhabitants and Mexico City (CdMx) has an area of 1,494.3 km2 which represents 0.1% of the country’s surface; Mexico City has 9,209,944 inhabitants. The study area is located between 2,250 and 2,750 meters above sea level, the predominant climate is dry temperate, with an average annual temperature of 15.9 °C and an average annual rainfall of 686 mm with a climate known as sub-humid temperate and extents all the State of Mexico and Mexico City [10].
2.2. Climatological Data
The analysis of 23 meteorological stations across the area of interest over a 42-year period (January 1981 to December 2023) provides a robust dataset for understanding regional climatic trends (Figure 1). Notably, the continued operation of 59% of these stations underscores the challenges of maintaining long-term observational networks. To address gaps and ensure comprehensive data, the geographic coordinates of each station were employed to recover supplementary climatic data via the Climate Engine platform (http://ClimateEngine.org) [11].
The CHIRPS database was selected due to its capacity to provide precipitation data on daily, pentad, and monthly scales, offering critical granularity. Similarly, the DAYMET database contributed valuable daily and monthly data, complementing the CHIRPS dataset. This dual approach ensures greater reliability in climatic trend analysis, particularly for variables such as precipitation and temperature.
The comparative validation of CHIRPS and DAYMET datasets using observed data from station 15170 in Chapingo is a critical step in assessing data reliability. The results are highly encouraging, with coefficients of determination (R²) of 0.8921 for precipitation, 0.9974 for maximum temperature, and 0.9824 for minimum temperature. These high R² values indicate strong correlations, affirming the datasets suitability for climatological analysis [12].
2.3. CHIRPS Satellite Information
The CHIRPS algorithm combines three data sources: (a) the CHPclim precipitation climatology, a 0.05° global climatology based on data from stations, satellite observations, elevation, and coordinates [13]; (b) satellite estimates of infrared thermal precipitation (IRP); and (c) in situ rain gauge measurements. CHPclim differs by using long-term satellite averages to improve its accuracy, especially in mountainous regions [14]. Combining CHIRP with station data uses the estimated correlation between a pixel’s precipitation and nearby stations [15].
Data merging is performed on 5-day (pentad) and monthly scales, adjusting the pentads so that their sum matches the monthly total. A daily version is generated from this data. Preliminary CHIRPS is published 2 days after a pentad, and the final version is in the third week of the following month.
2.4. DAYMET Satellite Data
The Daily Surface Weather Data provides continuous, gridded estimates of daily weather variables by interpolation and statistical modeling. It includes minimum and maximum temperature, precipitation, vapor pressure, shortwave radiation, snow water equivalent, and day length, on a 1 km² grid for North America and Hawaii since 1980, and Puerto Rico since 1950.
The Daymet method estimates meteorological parameters at instrumented sites by interpolation and extrapolation, using weighted data from nearby stations. In the Daymet V4 version, station selection is optimized by eliminating the iterative density calculation, defining instead a fixed search radius based on pre-computed distances. Two workflows generate variables: one for daily temperature and one for precipitation [16].
2.5. Standardized Precipitation Evapotranspiration Index (SPEI)
The Standardized Precipitation Evapotranspiration Index (SPEI) is an extension of the SPI that incorporates both precipitation and potential evapotranspiration (PET) to evaluate drought, considering the impact of temperature increase on water demand.
SPEI is calculated using the water balance (Di = P − ETo) at different time scales (1, 3, 6, 12 and 24 months). Unlike SPI, which only uses precipitation, SPEI provides a more accurate measure of drought severity by including atmospheric evaporative demand.
Initially, the Thornthwaite equation [17] was proposed to estimate evapotranspiration due to its simplicity, but more accurate methods such as the FAO-56 Penman-Monteith equation [18] are preferable if sufficient data are available. Failing this, the Hargreaves equation, which was used in this study, is recommended.
The SPEI calculation was performed in RStudio® with the SPEI.R software version 1.8.1 [19], using data on precipitation, minimum and maximum temperature, and latitude of the study site. The values obtained were analyzed according to the classification of McKee, Doesken & Kleist [20] to identify the evolution of droughts, their intensity, duration and dates of onset and termination.

Table 1.
SPEI categories and classification [20].
Table 1.
SPEI categories and classification [20].
| Index value | Category |
| > 2.00 | Extremely humid |
| 1.50 a 1.99 | Very humid |
| 1.00 a 1.49 | Moderately humid |
| -0.99 a 0.99 | Near normal |
| -1.00 a -1.49 | Moderately dry |
| -1.50 a -1.99 | Very dry |
| < -2.00 | Extremely dry |
2.6. Selection of Representative Weather Stations
For the identification of representative weather stations in the context of climate change and drought assessment, a quantitative approach was implemented based on the nonparametric Mann-Kendall statistical test [21,22], widely used for the detection of monotonic trends in climatic time series [23,24].
Three fundamental climatic variables were analyzed: monthly cumulative precipitation (PCP), maximum temperature (TMAX) and minimum temperature (TMIN), using data from 381 meteorological stations. Z-statistic values were calculated for each variable at each station. Significant trends were considered to be those whose absolute value of the Z statistic was greater than or equal to 1.96 (95% confidence level).
The stations were classified into three levels of representativeness:
- Highly representative: stations with significant trends in two or more variables.
- Moderately representative: stations with only one significant variable.
- Unrepresentative: stations with no significant trends.
This classification approach has been used in similar studies to identify key stations for climate change monitoring. For example, Ahmad et al. [25] applied criteria based on the number of variables with significant trend to select critical stations in a South Asian basin. Similarly, Kousari et al. [26] classified stations according to the magnitude and significance of detected changes in temperature and precipitation, which allowed identifying control points for vulnerability analysis. In addition, Gong et al. [27] proposed a regional pattern recognition methodology that included the hierarchization of stations by their degree of climate response, which is compatible with the classification used in this study.
Additionally, a climate pattern was assigned to each station based on the combination of detected trends, following criteria similar to those employed by recent studies on the classification of local climate responses [27,28,29].
- Dry and warm: significant decrease in precipitation and increase in TMAX or TMIN.
- Dry and cold: decrease in precipitation and decrease in temperature.
- Strong warming: significant increase in TMAX or TMIN without relevant changes in precipitation.
- Climatic stability: no significant trends.
Table 2.
shows an example of the classification of stations with their respective Z-values and assigned weather patterns.
Table 2.
shows an example of the classification of stations with their respective Z-values and assigned weather patterns.
| ID | Name | PCP | TMAX | TMIN | Classification | Weather pattern |
| 9002 | Ajusco | -1.53 | 12.39 | 3.55 | Moderately Representative | High temperature |
| 9004 | Calvario 61 | -1.07 | 11.86 | 3.73 | Moderately Representative | High temperature |
| 9014 | Santa Úrsula Coapa | -1.18 | 4.51 | 3.97 | Moderately Representative | High temperature |
| 9019 | Desierto De Los Leones | -2.35 | 9.95 | 0.79 | Highly Representative | Dry and warm |
| 9022 | El Guarda | -1.67 | 14.1 | 1.22 | Moderately Representative | High temperature |
| 9026 | Morelos 77 | 0.2 | 0.64 | 2.61 | Moderately Representative | Mixed change |
| 9067 | Monte Alegre | -2.23 | 7.42 | -4.04 | Highly Representative | Dry and warm |
| 15001 | Acambay | -1.01 | 6 | 9.11 | Moderately Representative | High temperature |
| 15002 | Aculco (Smn) | -1.56 | 10.44 | 5.45 | Moderately Representative | High temperature |
| 15006 | Amatepec | -1.76 | 8.51 | -6.14 | Highly Representative | High temperature |
| 15007 | Amecameca De Juárez | -1.38 | 8.64 | 3.67 | Moderately Representative | High temperature |
| 15009 | Atlacomulco | -2.23 | 7.74 | 6.29 | Highly Representative | Dry and warm |
| 15023 | Chimalhuacán | 0.02 | 5.5 | 3.59 | Moderately Representative | High temperature |
| 15034 | Ixtapan De La Sal | -2.03 | 9.71 | 1.96 | Highly Representative | Dry and warm |
| 15036 | Ixtlahuaca (Smn) | -1.51 | 8 | 5.45 | Highly Representative | High temperature |
| 15061 | Nezahualcóyotl | 0.68 | 1.02 | 2.04 | Moderately Representative | Mixed change |
| 15062 | Nevado De Toluca | -2.31 | 15.35 | -1.14 | Highly Representative | Dry and warm |
| 15066 | Palizada | -2.58 | 13.07 | 6.88 | Highly Representative | Dry and warm |
| 15118 | Temascaltepec | -2.9 | 9.01 | 3.49 | Highly Representative | Dry and warm |
| 15131 | Villa De Allende | -2.53 | 12.1 | 3.76 | Highly Representative | Dry and warm |
| 15170 | Chapingo (Dge) | -0.19 | 2.35 | 6.62 | Moderately Representative | Humid and warm |
| 15231 | Presa Iturbide | -4.04 | 12.09 | 6.43 | Highly Representative | Dry and warm |
| 15277 | San Miguel Tenochtitlan | -2.48 | 7.43 | 5.25 | Highly Representative | Dry and warm |
This methodology not only allows an objective and reproducible selection of stations for monitoring and analysis of climate change but also facilitates the zoning of areas with homogeneous climate behavior, which is essential for regional drought studies (SPEI) and planning of adaptation measures. Moreover, the approach has been validated in similar research in regions of Mexico and other parts of the world [25,30].
2.7. Drought Forecasting
Anticipating the characteristics of a drought (magnitude, duration and distribution) is key to mitigating its effects [31]. Accurate forecasting improves water resource management and is based on climatic indicators such as precipitation or specialized indices such as SPI and SPEI.
Mishra & Singh [32] discuss various drought forecasting methodologies, including regression, time series, probabilistic models, artificial neural networks (ANNs), hybrid approaches and data mining. In recent years, ANNs have stood out for their machine learning capabilities [33], being applied in hydrology to model rainfall-runoff, flow rates, groundwater and water quality [34]. Their main advantage is to identify nonlinear patterns without the need for predefined mathematical models [35].
The combination of neural networks and Kalman filters has been studied in drought prediction and SPEI calculation. Models such as DKF-ARX-Pt (Kalman Filter with exogenous variables such as precipitation and temperature), GRU (Closed Recurrent Unit) and NARX (Neural Autoregressive Networks with External Input) have been applied.
2.8. Kalman Filter with Exogenous Variables (DKF-ARX-Pt)
The Kalman Filter with Exogenous Variables, known as DKF-ARX-Pt, is an extension of the classical Kalman Filter, used to estimate the state of dynamic systems under uncertainty, but incorporating external or exogenous variables that influence the process. Traditionally, the Kalman Filter is used in linear systems where a model of the system is known, and the state of the system is estimated as noisy observations are received. However, in complex phenomena such as drought, prediction models must consider not only past observations of the system itself (such as drought indices), but also external factors that affect its evolution, such as precipitation and temperature [7].
The ARX (AutoRegressive with Exogenous Input) model is fundamental in the formulation of the DKF-ARX-Pt, since it extends the classical auto-regressive time series model to include inputs from external variables. This model takes the form:
Where:
- y(t) is the dependent variable (e.g., the drought index as SPEI),
- u(t) is the exogenous input (such as precipitation or temperature),
- ai and bj are the autoregressive and exogenous coefficients, respectively,
- e(t) is the model error.
In the context of the Kalman Filter, the DKF-ARX-Pt incorporates these exogenous inputs within the state estimation framework, allowing the model to adjust not only based on system observations, but also to the influences of external climatic variables.
2.9. Gated Recurring Units (GRU)
Gated Recurrent Units (GRU) are a type of recurrent neural network (RNN) that is highly effective in time series modeling, including the prediction of climate variables such as drought. Introduced by Cho et al. [36], RUs have been used for problems where long-term dependence and gradient propagation are critical, such as meteorological data analysis and prediction of climatic phenomena.
Their main advantage over traditional RNNs lies in their ability to mitigate the gradient fading problem, allowing them to capture long-term relationships in temporal data. This is particularly relevant in drought prediction, where current conditions may be influenced by climatic events that occurred months or even years ago [37].
2.10. Autoregressive Neural Networks with External Input (NARX)
Neural Autoregressive Networks with External Input (NARX) have proven to be an effective technique for modeling nonlinear dynamical systems, including drought prediction. Proposed by Lin et al. [38], NARX extends classical autoregressive models by capturing nonlinear relationships between climate variables, differing from traditional approaches such as ARIMA or ARX. In SPEI prediction, they can integrate exogenous variables such as precipitation and temperature to improve accuracy. Hernandez-Vasquez et al. [39] applied artificial neural networks in the Sonora River basin, obtaining an average R² of 0.76 in validation, evidencing its predictive capacity.
2.11. Prediction Model Evaluation Metrics
In the evaluation of time series and weather prediction models, it is essential to use metrics that allow measuring performance in terms of error and adjustment capacity. The metrics used in the comparison of SPEI prediction models are described below.
MAE (Mean Absolute Error), MSE (Mean Squared Error) and RMSE (Root Mean Squared Error) are metrics that measure absolute and quadratic error, with RMSE penalizing larger errors. R² (Coefficient of Determination) and NSE (Nash-Sutcliffe Efficiency Coefficient) assess the model’s ability to explain the variability of the data, with NSE more commonly used in hydrologic models. KGE (Kling-Gupta Efficiency) offers a more complete evaluation of the model, considering correlation, bias and variability, being more useful in climate and hydrological studies.
This set of metrics provides a comprehensive view of model performance, allowing the most appropriate model to be selected for SPEI prediction.
3. Results
Three methodological approaches were applied to forecast the SPEI index in 23 stations in the State of Mexico and Mexico City: the Kalman Filter with exogenous variables (FK or DKF-ARX-Pt), autoregressive neural networks with external input (NARX), and closed recurrent units (GRU). The models were evaluated with predictions at 3 and 6 months, and their accuracy was measured using MAE, RMSE, R², NSE and KGE metrics (Table 3).
The NARX model was the most accurate in absolute terms, with the lowest MAE and RMSE values and the highest R², NSE and KGE. This indicates that it was able to reproduce both the general trend and the internal variability of the SPEI series with a high degree of fidelity. GRU also performed outstandingly well, especially at intermediate scales (SPEI3 to SPEI6), where it offered accuracy comparable to NARX with lower computational demands.
The FK model presented (Figure 2) the best overall performance in predicting the 3-month SPEI3: low average MAE (~0.10), indicating a small average deviation from the observed values. RMSE also low (~0.13), confirming the model’s consistency in prediction. R² ≈ 0.98, implying that the model explains 98% of the observed variability of SPEI3. NSE ≈ 0.98, which is considered excellent by hydrological standards. KGE ≈ 0.85, a sign that the model adequately reproduces the distribution, skewness and variability of the data. It is the most reliable model for short-term SPEI3 prediction, with high accuracy and robustness.
The GRU model showed moderate performance compared to FK: average MAE around 0.17, higher than FK. RMSE also higher (~0.21), indicating higher error dispersion. R² ≈ 0.69, below the threshold of good fit. NSE ≈ 0.69, reflecting an acceptable but not excellent fit. KGE ≈ -3.3, a very negative value evidencing imbalances between the mean, variance and correlation of the predictions with respect to the observed data. Although GRU can capture certain trends, its overall performance is inconsistent and needs optimization.
The NARX model performed similarly to GRU, but with slight improvements in some metrics: average MAE ≈ 0.17, comparable to GRU. RMSE around 0.21, not much improvement over GRU. R² ≈ 0.69, like GRU and well below FK. NSE ≈ 0.69, indicating adequate but not outstanding performance. KGE ≈ -0.51, better than GRU but still negative, suggesting that the model does not adequately reproduce the observed SPEI statistical structure. Although NARX approaches the performance of GRU, it also does not reach the accuracy and stability of the FK model.
FK (Kalman Filter) clearly outperforms GRU and NARX on all metrics. Both GRU and NARX present difficulties in capturing the SPEI3 structure, reflected in their low NSE and negative KGE. For practical applications, especially early warning systems or water planning, the FK model is the most reliable at this scale and time scale.
The FK was the best performing model in predicting the 3-month SPEI24 (Figure 3). The metrics reflect excellent fit, low MAE (0.0325) and low RMSE (0.049), indicating accuracy and stability. R² and NSE ≈ 0.9975, showing an over-salient ability to replicate temporal variability. KGE ≈ 0.95, meaning that the model not only predicts accurately, but also preserves the statistical properties of the observed index. Ideal for prediction of prolonged droughts such as those captured by SPEI24. High reliability for warning and water management systems.
The GRU model, despite having a good overall fit (R² and NSE ≈ 0.92), presents important limitations, Errors notoriously larger than FK (MAE of 0.10). Negative KGE (-1.13), indicating that the model does not correctly replicate the structure of the index (bias, variability, correlation). This suggests that although the GRU can follow the general trend, its statistical performance is inadequate. Acceptable in trend, but not reliable for operational decisions without additional adjustments.
NARX slightly outperforms GRU in accuracy, MAE ≈ 0.091 and RMSE ≈ 0.117, slightly better than GRU. R² and NSE ≈ 0.935, slightly higher as well. However, KGE is still negative (-0.71), which compromises its use in statistical structure-sensitive applications. Better than GRU, but still not competitive against FK. Potential for improvement if hyperparameters are adjusted.
Kalman Filter (KF) is clearly superior for SPEI24 forecasting 3 months in advance (Table 4). Its ability to maintain accuracy, low error spread, and statistical replication makes it the most reliable model. The GRU and NARX models, although offering acceptable R² and NSE values, fail to correctly reproduce the index structure (evidenced by their negative KGE values), which limits their practical applicability without significant adjustments.
4. Discussion
The results obtained in the present study show significant differences in the performance of the three models evaluated for the forecast of the Standardized Precipitation Evaporative Index (SPEI), especially on medium and long-time scales. Although all models showed high levels of accuracy in terms of R² and NSE (above 0.97), a more detailed analysis of complementary metrics such as MAE, RMSE and especially Kling-Gupta Efficiency (KGE), allows establishing clearer advantages and limitations between the approaches.
FK (Kalman Filter) is the best model at all SPEI scales (Table 5), except at SPEI1 where all models fail. GRU performs acceptably at SPEI9-24 but has significant instability at short scales such as SPEI1-3. NARX is competitive on SPEI9-24, although its negative KGE on many scales suggests that it does not replicate well the statistical structure of the observed SPEI.
The NARX model (Autoregressive Neural Networks with External Input) proved to be the most accurate, with the lowest mean absolute error (MAE = 0.098) and the highest KGE efficiency (0.864). This indicates that NARX not only achieves high correlation with the observed data, but also adequately reproduces the natural variability of SPEI, without notable systematic biases. Its ability to incorporate extemporaneous inputs and maintain long-term memory makes it particularly suitable for predicting cumulative climate indicators such as SPEI, especially at scales such as SPEI6 to SPEI12.
On the other hand, the GRU (Gated Recurrent Unit) model showed a performance very close to that of NARX, with an MAE of 0.101 and a KGE of 0.829. GRU, being a simplified recurrent architecture with respect to LSTM, offers an additional advantage in terms of computational efficiency and lower training complexity. Its good performance, especially at SPEI3 and SPEI6 scales, makes it a viable option for applications where fast response is required or limited computational resources are available.
In comparison, the FK model (Kalman Filter with exogenous variables DKF-ARX-Pt), although achieving an R² of 0.976 and NSE of the same value, showed lower performance on the KGE metric (0.735). This suggests that, although the model can accurately capture the overall trend of the index, it has more difficulty in faithfully re-presenting the dispersion and error structure, especially in short scales such as SPEI1, where its performance was significantly lower (KGE < 0). Nevertheless, the FK model is still useful for long scales (SPEI12 and SPEI24), where its dynamic structure makes it stable and less susceptible to overfitting.
A key aspect in the discussion is the role of the SPEI scale in the performance of the models. It was confirmed that the intermediate scales (SPEI3 to SPEI12) represent the best compromise between sensitivity and predictive stability. The SPEI1 scale, due to its high variability and dependence on very short-term weather events, presented high errors and lower reliability for all models, while SPEI24, although stable, smooths the data too much and may miss critical information on rapid drought events.
In addition, the analysis revealed that models with memory (GRU and NARX) tend to perform better than FK, especially in prediction horizons of 3 to 6 months, which is highly relevant for early warning systems, where changes in water conditions need to be anticipated in time to plan mitigation measures.
5. Conclusions
The present comparative analysis of Standardized Precipitation Evaporative Index (SPEI) prediction models at multiple time scales (SPEI1 to SPEI24) and 3 and 6-month horizons demonstrates that the Kalman Filter (KF) is consistently the most robust, accurate and reliable model for drought forecasting applications in the State of Mexico and Mexico City region.
At practically all scales, the FK model achieved outstanding performance values: coefficients of determination (R²) and Nash-Sutcliffe efficiency (NSE) above 0.99, together with low mean errors (MAE and RMSE) and positive Kling-Gupta coefficients of efficiency (KGE) close to 1, especially at medium and long scales such as SPEI6, SPEI12 and SPEI24. This validates its ability to capture both the trend and the statistical structure of cumulative drought, making it a highly reliable tool for water management and early warning systems.
In contrast, the deep learning-based models -GRU (Gated Recurrent Unit) and NARX (Nonlinear Autoregressive Neural Network with Exogenous Inputs) showed more variable performance. While they achieved acceptable R² and NSE (between 0.84 and 0.93) at some scales and horizons, their consistently negative KGE values evidence important limitations in reproducing the mean, variability and correlation of the real data. This suggests that, although these models can follow the general trend of the index, they do not adequately preserve their integral hydrological behavior, which represents an obstacle for their direct use in operational scenarios.
In addition, SPEI1 was identified as the most difficult scale to predict for all three models, probably due to its high sensitivity to extreme monthly variations and limited hydrologic memory. In contrast, cumulative scales such as SPEI12 and SPEI24 showed greater predictive stability, especially in the FK model.
In conclusion, the Kalman Filter stands out as the most suitable model for drought forecasting in the region studied, offering an optimal balance between accuracy, stability and statistical replicability. The GRU and NARX models, while showing potential, require fine tuning in their architecture and training to achieve similar levels of performance. This analysis supports the use of FK as a robust tool for strengthening climate resilience and improving water resource planning in the face of climate variability and change scenarios.
Author Contributions
Conceptualization, M.C.-C. and L.I.-C.; methodology, M.C.-C.; software, M.C.-C.; validation, L.I.-C., R.A.-R. and G.A.-G.; formal analysis, M.C.-C.; investigation, M.C.-C.; resources, M.C.-C.; data curation, R.A.-R.; writing—original draft preparation, M.C.-C.; writing—review and editing, L.I.-C.; visualization, G.A.-G.; supervision, L.I.-C.; project administration, L.I.-C.; funding acquisition, L.I.-C. All authors have read and agreed to the published version of the manuscript.
Funding
This research was funded by the National Council of Humanities, Science and Technology, CONAHCYT, of Mexico (No. 320262).
Data Availability Statement
The data presented in this study are available upon request from the corresponding author. The data are not publicly available due to privacy.
Acknowledgments
To the National Council of Humanities, Science and Technology, CONAHCYT, of Mexico for the financial support provided in the form of a postgraduate maintenance scholarship for the development of this research.
Conflicts of Interest
The authors declare no conflicts of interest.
References
- Domínguez-Castro, F. (2022). Future Changes in Tropical Cyclone and Easterly Wave Characteristics over Tropical North America. EGU General Assembly 2022, Vienna, Austria, 23–27 May 2022, EGU22-851. [CrossRef]
- Vicente-Serrano, S. M., S. Beguería, and J. I. López-Moreno, 2010: A Multiscalar Drought Index Sensitive to Global Warming: The Standardized Precipitation Evapotranspiration Index. J. Climate, 23, 1696–1718. [CrossRef]
- Hasan, N.A.; Dongkai, Y.; Al-Shibli, F. SPI and SPEI Drought Assessment and Prediction Using TBATS and ARIMA Models, Jordan. Water 2023, 15, 3598. [Google Scholar] [CrossRef]
- Castillo-Castillo, M.; Ibáñez-Castillo, L.; Valdés, J.B.; Arteaga-Ramírez, R. Análisis de sequías meteorológicas en la cuenca del río Fuerte, México. Tecnol. Y Cienc. Del Agua 2017, 8, 35–52. [Google Scholar] [CrossRef]
- Ceballos-Silva, A. , Magaña, V., Montero-Martínez, M., & Pérez, J. (2022). Short-term drought forecast in Mexico using machine learning techniques. Water, 15(18), 3598. [CrossRef]
- Nafii, A.; Taleb, A.; El Mesbahi, M.; Ezzaouini, M.A.; El Bilali, A. Early Forecasting Hydrological and Agricultural Droughts in the Bouregreg Basin Using a Machine Learning Approach. Water 2023, 15, 122. [Google Scholar] [CrossRef]
- Kalman, R. E. (1960). A new approach to linear filtering and prediction problems. Journal of Basic Engineering, 82(1), 35-45.
- Zhang, L. , Ren, D., Yang, X., & Zhang, P. (2016). Application of deep learning in climate prediction: A review. Advances in Meteorology, 2016, 1-11.
- Dastorani, M. T., & Afkhami, H. (2011). Application of artificial neural networks for regional drought prediction using meteorological drought indices. Water Resources Management, 25(2), 407-426.
- INEGI (Instituto Nacional de Estadística, Geografía e Informática). 2020 Censo de Población y Vivienda. México. 2023. Available online: https://www.inegi.org.mx/datosabiertos/ (accessed on 10 September 2023).
- Climate Engine. Desert Research Institute and University of California, Merced. version 2.1. 2024. Available online: http://climateengine.org (accessed on 7 April 2024).
- Carrillo-Carrillo, M.; Ibáñez-Castillo, L.; Arteaga-Ramírez, R.; Arévalo-Galarza, G. Spatio-Temporal Analysis of Drought with SPEI in the State of Mexico and Mexico City. Atmosphere 2025, 16, 202. [Google Scholar] [CrossRef]
- Funk, C. , Peterson, P., Landsfeld, M., Pedreros, D. 2015. The climate hazards group infrared precipitation with stations—A new environmental record for monitoring extremes. Scientific Data, 2, 150066.
- Funk, C. , Verdin, J., Michaelsen, J., Peterson, P., Pedreros, D. and Husak, G. 2015b. A global satellite assisted precipitation climatology. Earth System Science Data Discussions, 7, 1–13. [CrossRef]
- Maidment, R. , Grimes, D., Black, E. et al. A new, long-term daily satellite-based rainfall dataset for operational monitoring in Africa. Sci Data 4, 170063 2017. [CrossRef]
- Thornton, M.M., R. Shrestha, Y. Wei, P.E. Thornton, S-C. Kao, and B.E. Wilson. 2022. Daymet: Daily Surface Weather Data on a 1-km Grid for North America, Version 4 R1. ORNL DAAC, Oak Ridge, Tennessee, USA. [CrossRef]
- Thornthwaite, C. W. 1948. An approach toward a rational classification of climate. Geographical Review, 38, 55-94.
- Allen, R.G. , Pereira, L.S., Raes, D., & Smith, M. 1998. Crop evapotranspiration (guidelines for computing crop water requirements). FAO Irrigation and Drainage Paper 56. Food And Agriculture Organization (FAO), Rome.
- Beguería, S. , & Vicente, S. 2014. Calculation of the Standardized Precipitation-Evapotranspiration Index. Package SPEI.R for R or RStudio Program. https://cran.r-project.org/web/packages/SPEI/index.html. (Recovered on 13 may 2023).
- McKee, T. B. , Doesken, N. J., & Kleist, J. 1993. The relationship of drought frequency and duration to time scales (pp. 179-184). Eight Conference on Applied Climatology. Anaheim, CA, American Meteorological Society.
- Mann, H. B. (1945). Nonparametric tests against trend. Econometrica, 13(3), 245–259.
- Kendall, M. G. (1975). Rank Correlation Methods. Griffin.
- Yue, S., & Wang, C. Y. (2002). Regional streamflow trend detection with consideration of hydrologic alterations. Hydrological Processes, 16(14), 2671–2683.
- Hamed, K. H. (2008). Trend detection in hydrologic data: The Mann–Kendall trend test under the scaling hypothesis. Journal of Hydrology, 349(3–4), 350–363.
- Ahmad, I. , Tang, D., Wang, T., Wang, M., & Wagan, B. (2015). Precipitation trends over time using Mann-Kendall and Spearman’s rho tests in Swat River Basin, Pakistan. Advances in Meteorology, 2015.
- Kousari, M. R., Ahani, H., & Nikseresht, K. (2013). Rainfall trends analysis of Iran in the last half of the twentieth century. International Journal of Climatology, 33(2), 396–409.
- Gong, Z. , Zhang, L., Xie, Y., & Li, Y. (2023). Detecting and classifying regional climate change trends using Mann-Kendall analysis and pattern recognition. Climate Dynamics, 60(1), 33–48.
- Vicente-Serrano, S. M. , Beguería, S., & López-Moreno, J. I. (2010). A Multi-scalar drought index sensitive to global warming: The Standardized Precipitation Evapotranspiration Index. Journal of Climate, 23(7), 1696–1718.
- Son, N. T., Chen, C. F., Chen, C. R., & Minh, V. Q. (2021). Identifying climate change hotspots using trend analysis of temperature and precipitation in Vietnam. Science of the Total Environment, 753, 141770.
- Martínez-Austria, P. , & Patiño-Gómez, C. (2012). Vulnerabilidad de México ante el cambio climático: retos y prioridades. Instituto Mexicano de Tecnología del Agua.
- Castillo-Castillo, M.,Ibáñez-Castillo, L.,Valdés, J.B., Arteaga-Ramirez, R. 2017. Análisis de sequías meteorológicas en la cuenca del río Fuerte, México. Tecnología y Ciencias del Agua: 8(1) 35-52.
- Mishra, A. K. , & Singh, V. P. (2011). Drought modeling—A review. Journal of Hydrology, 403(1–2), 157–175. [CrossRef]
- Tkacz, G. , & Hu, S. (1999). Forecasting GDP growth using artificial neural networks. Bank of Canada.
- ASCE. (2000). Artificial neural networks in hydrology. I: Preliminary concepts. Journal of Hydrologic Engineering, 5(2), 115–123.
- Dastorani, M. T., & Afkhami, H. (2011). Application of artificial neural networks on drought prediction in Yazd (Iran). Desert, 16, 39–48.
- Cho, K. , Van Merriënboer, B., Gulcehre, C., Bahdanau, D., Bougares, F., Schwenk, H., & Bengio, Y. (2014). Learning phrase representations using RNN encoder-decoder for statistical machine translation. arXiv:1406.1078.
- Zaytar, M. A. , & Amrani, C. E. (2016). Sequence to sequence weather forecasting with long short-term memory recurrent neural networks. International Journal of Computer Applications, 143(11), 7-11.
- Lin, T. , Horne, B. G., Tino, P., & Giles, C. L. (1996). Learning long-term dependencies in NARX recurrent neural networks. IEEE Transactions on Neural Networks, 7(6), 1329-1338.
- Hernández-Vásquez, R. , & Ibáñez-Castillo, C. (2021). Aplicación de redes neuronales para la predicción de sequías en la cuenca del río Sonora. Revista de Hidrometeorología Aplicada, 12(3), 45-58.
Figure 1.
Location of the State of Mexico, Mexico City and the 23 weather stations operated by the SMN.
Figure 1.
Location of the State of Mexico, Mexico City and the 23 weather stations operated by the SMN.
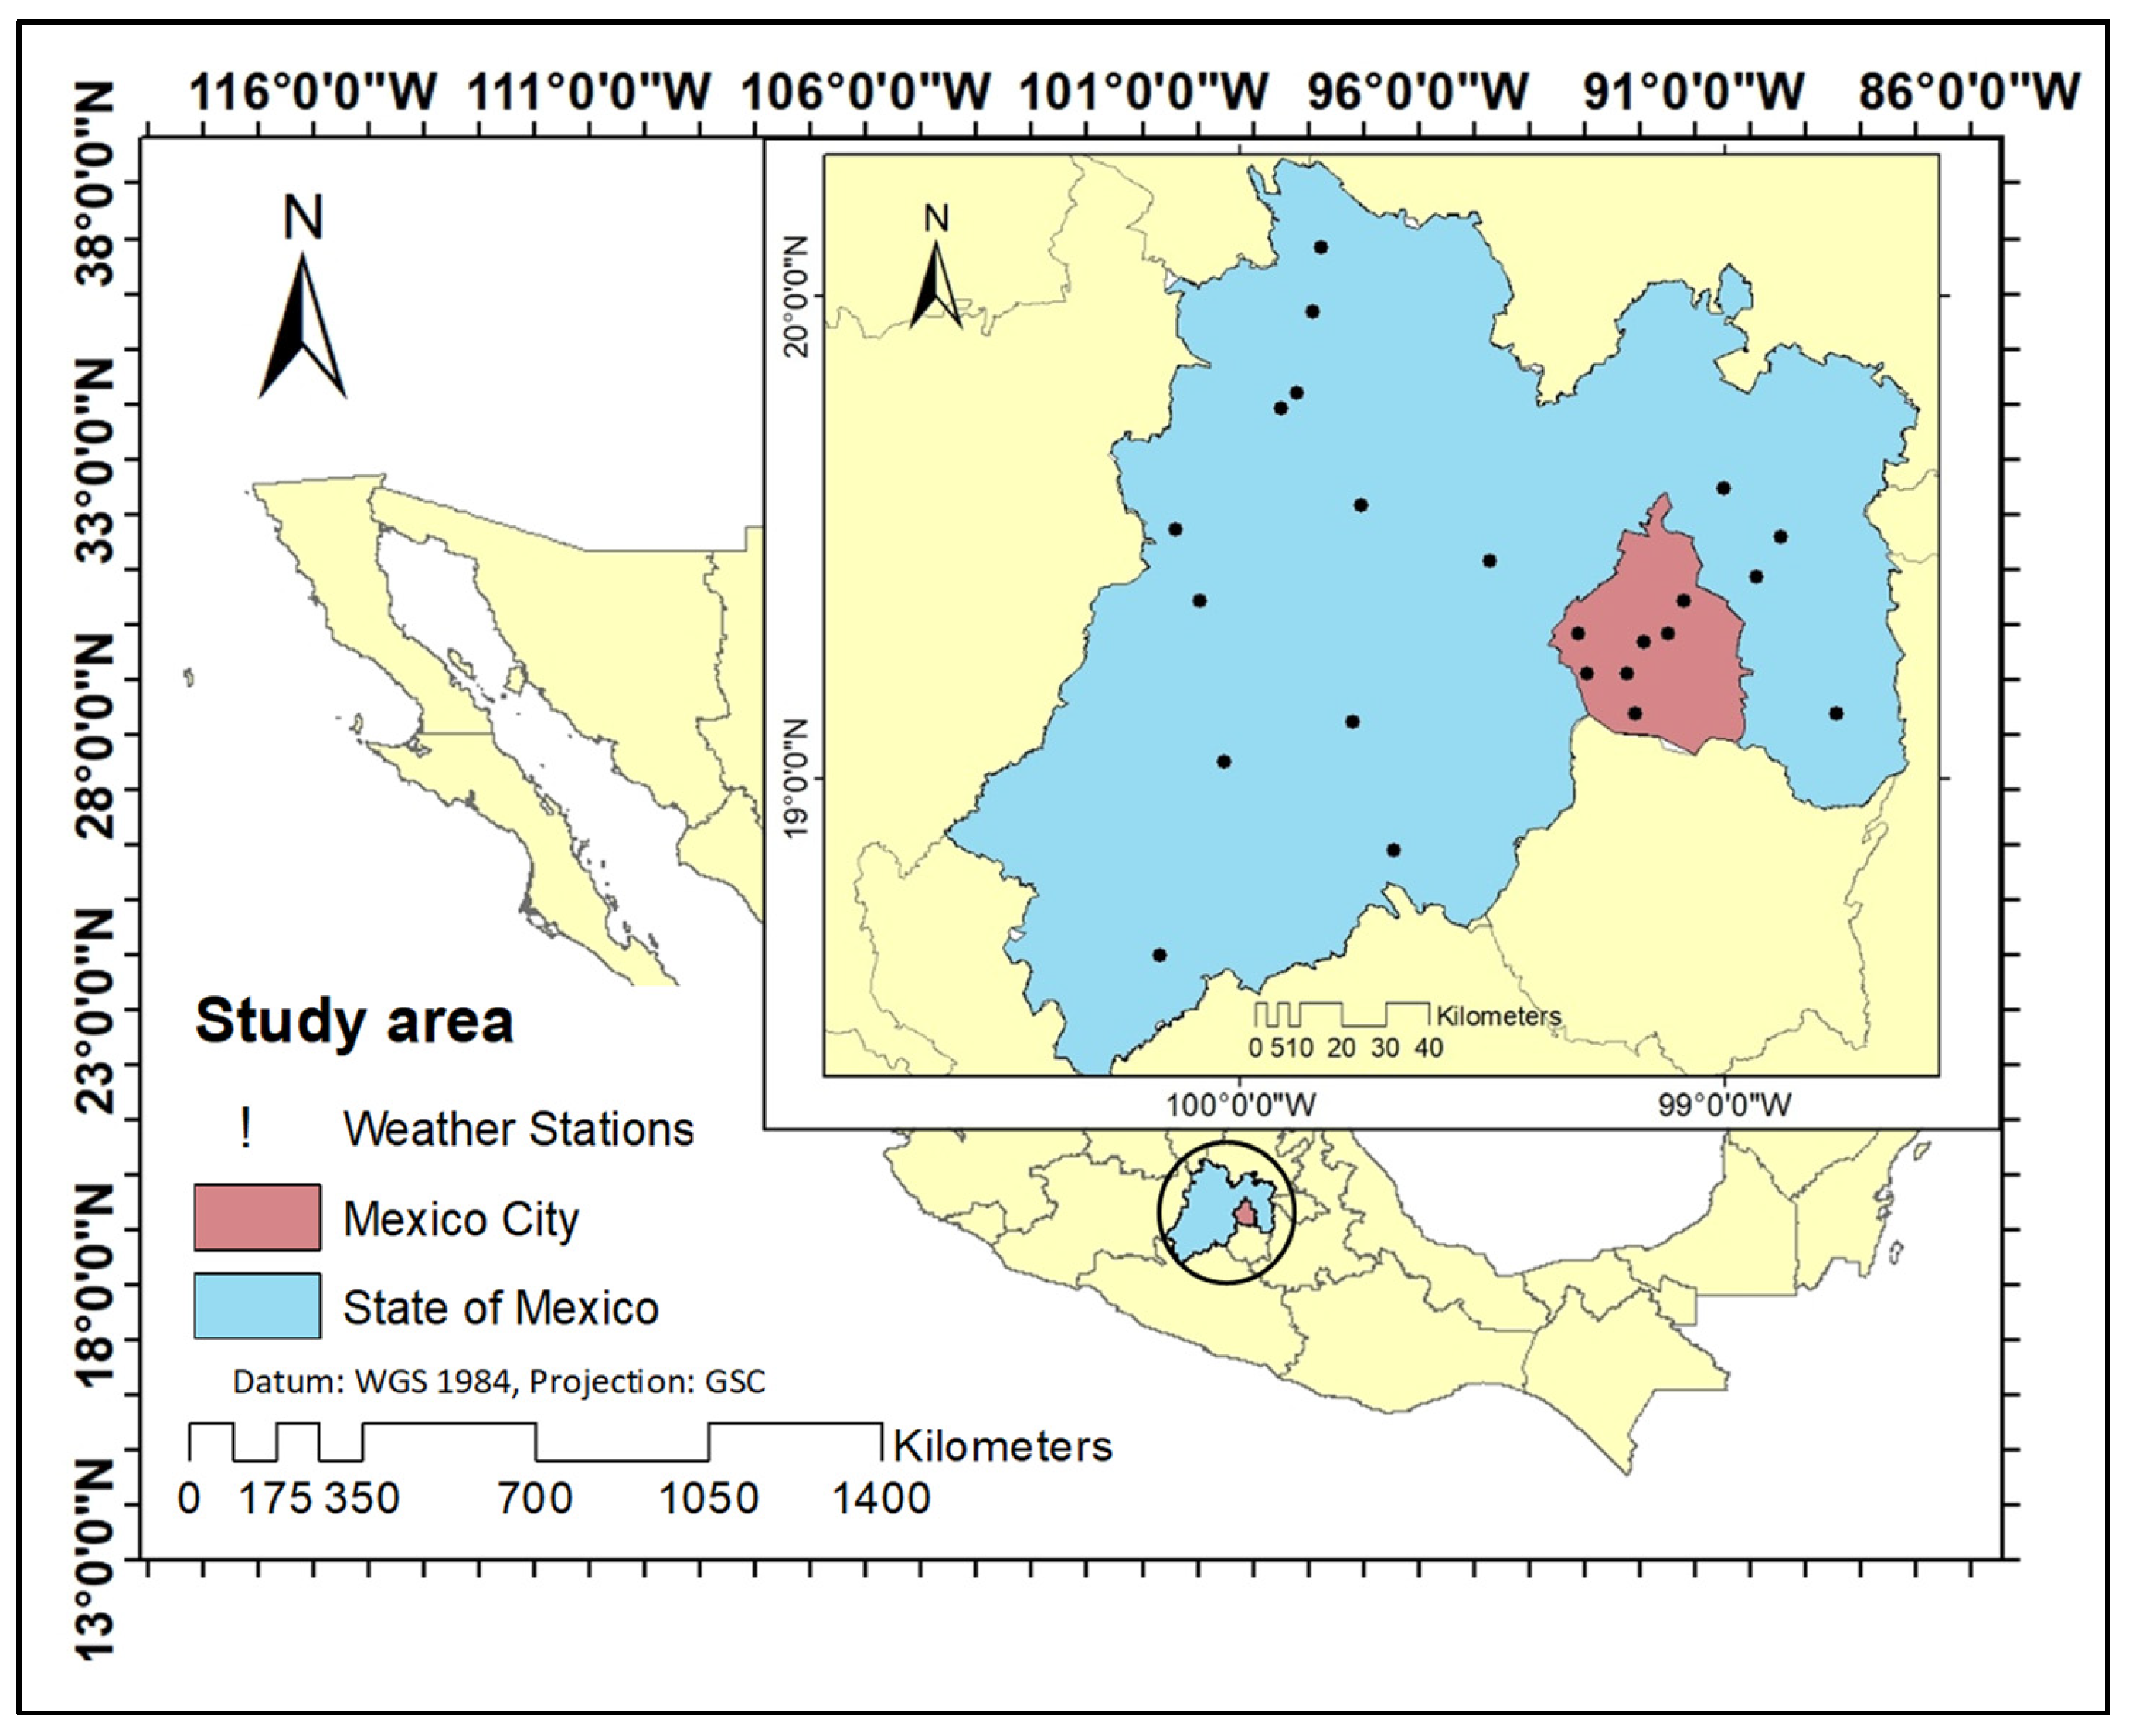
Figure 2.
Spatial distribution of values of SPEI calculated for 3-month time scale (2023): (a)Monthly spatial observed values evolution of SPEI 3-month time scale; (b) Monthly spatial Kalman filter (FK) values evolution of SPEI 3-month time scale (c) Monthly spatial Gated Recurring Units (GRU) values evolution of SPEI 3-month time scale; (d) Monthly spatial Neural Autoregressive Networks with External Input (NARX) values evolution of SPEI 3-month time scale.
Figure 2.
Spatial distribution of values of SPEI calculated for 3-month time scale (2023): (a)Monthly spatial observed values evolution of SPEI 3-month time scale; (b) Monthly spatial Kalman filter (FK) values evolution of SPEI 3-month time scale (c) Monthly spatial Gated Recurring Units (GRU) values evolution of SPEI 3-month time scale; (d) Monthly spatial Neural Autoregressive Networks with External Input (NARX) values evolution of SPEI 3-month time scale.
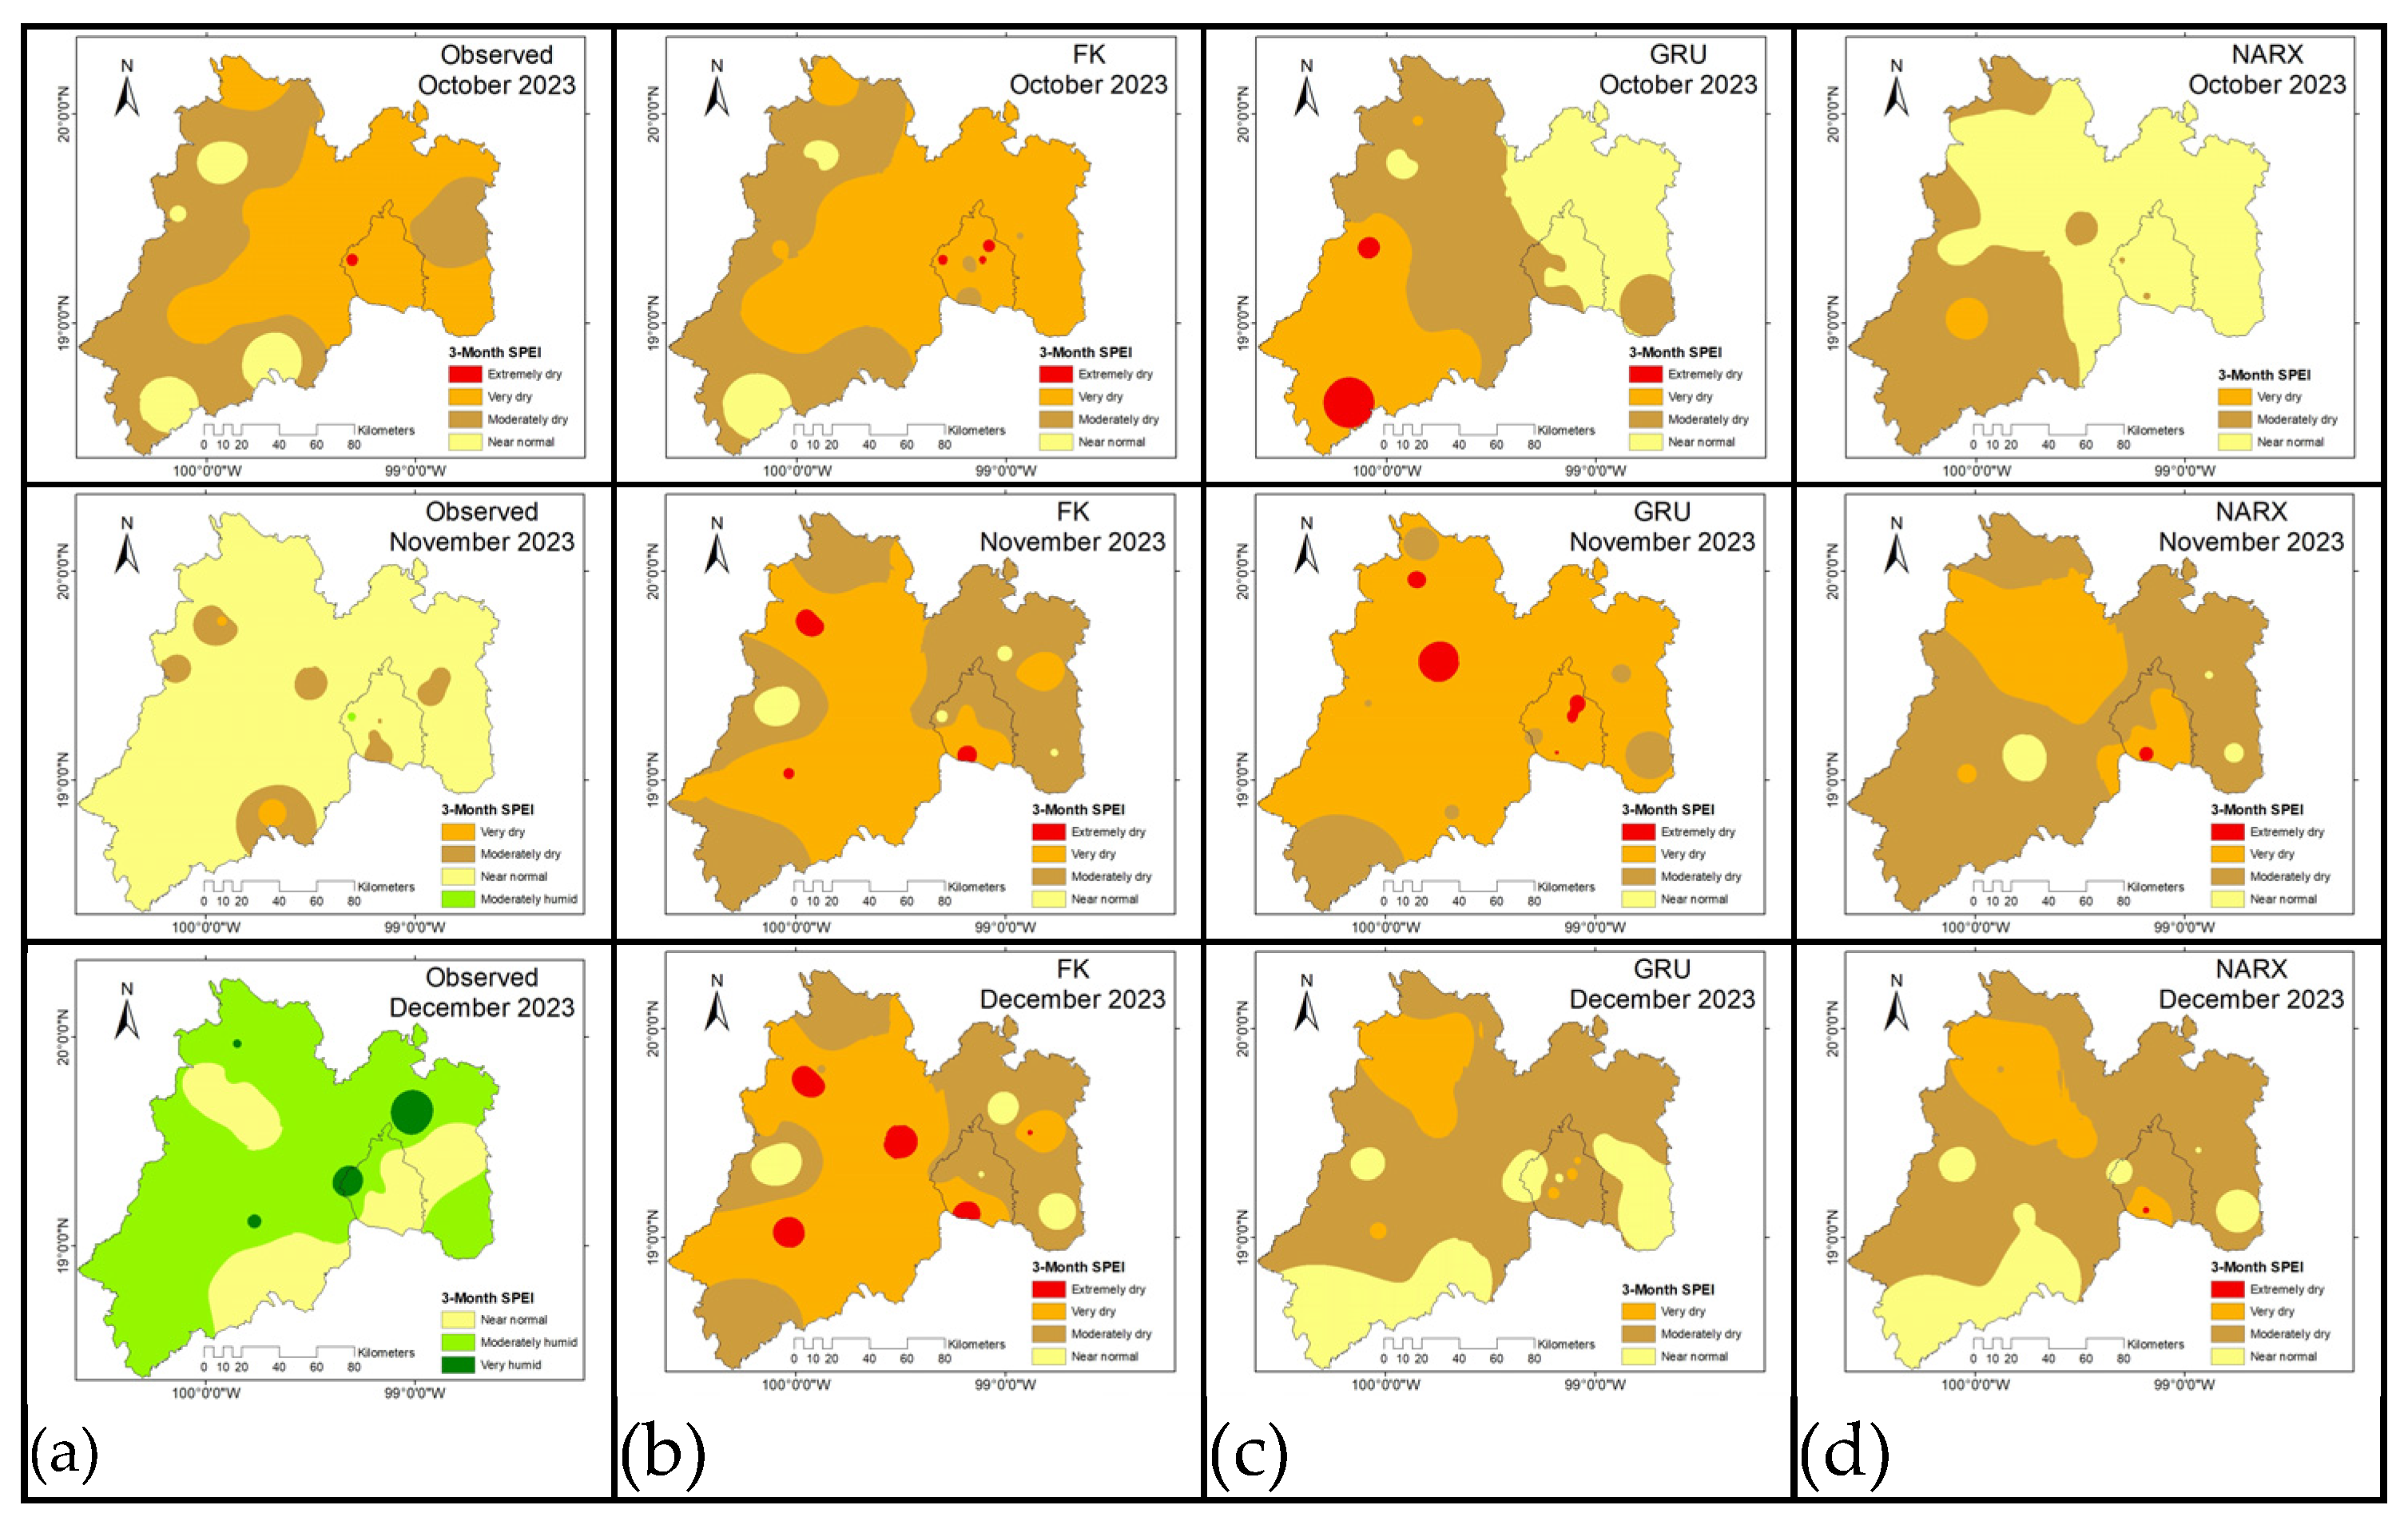
Figure 3.
Spatial distribution of values of SPEI calculated for 24-month time scale (2023): (a) 3 month spatial observed values evolution of SPEI 24-month time scale; (b) 3 month spatial Kalman filter (FK) values evolution of SPEI 24-month time scale (c) 3 month spatial Gated Recurring Units (GRU) values evolution of SPEI 24-month time scale; (d) 3 month spatial Neural Autoregressive Networks with External Input (NARX) values evolution of SPEI 24-month time scale.
Figure 3.
Spatial distribution of values of SPEI calculated for 24-month time scale (2023): (a) 3 month spatial observed values evolution of SPEI 24-month time scale; (b) 3 month spatial Kalman filter (FK) values evolution of SPEI 24-month time scale (c) 3 month spatial Gated Recurring Units (GRU) values evolution of SPEI 24-month time scale; (d) 3 month spatial Neural Autoregressive Networks with External Input (NARX) values evolution of SPEI 24-month time scale.
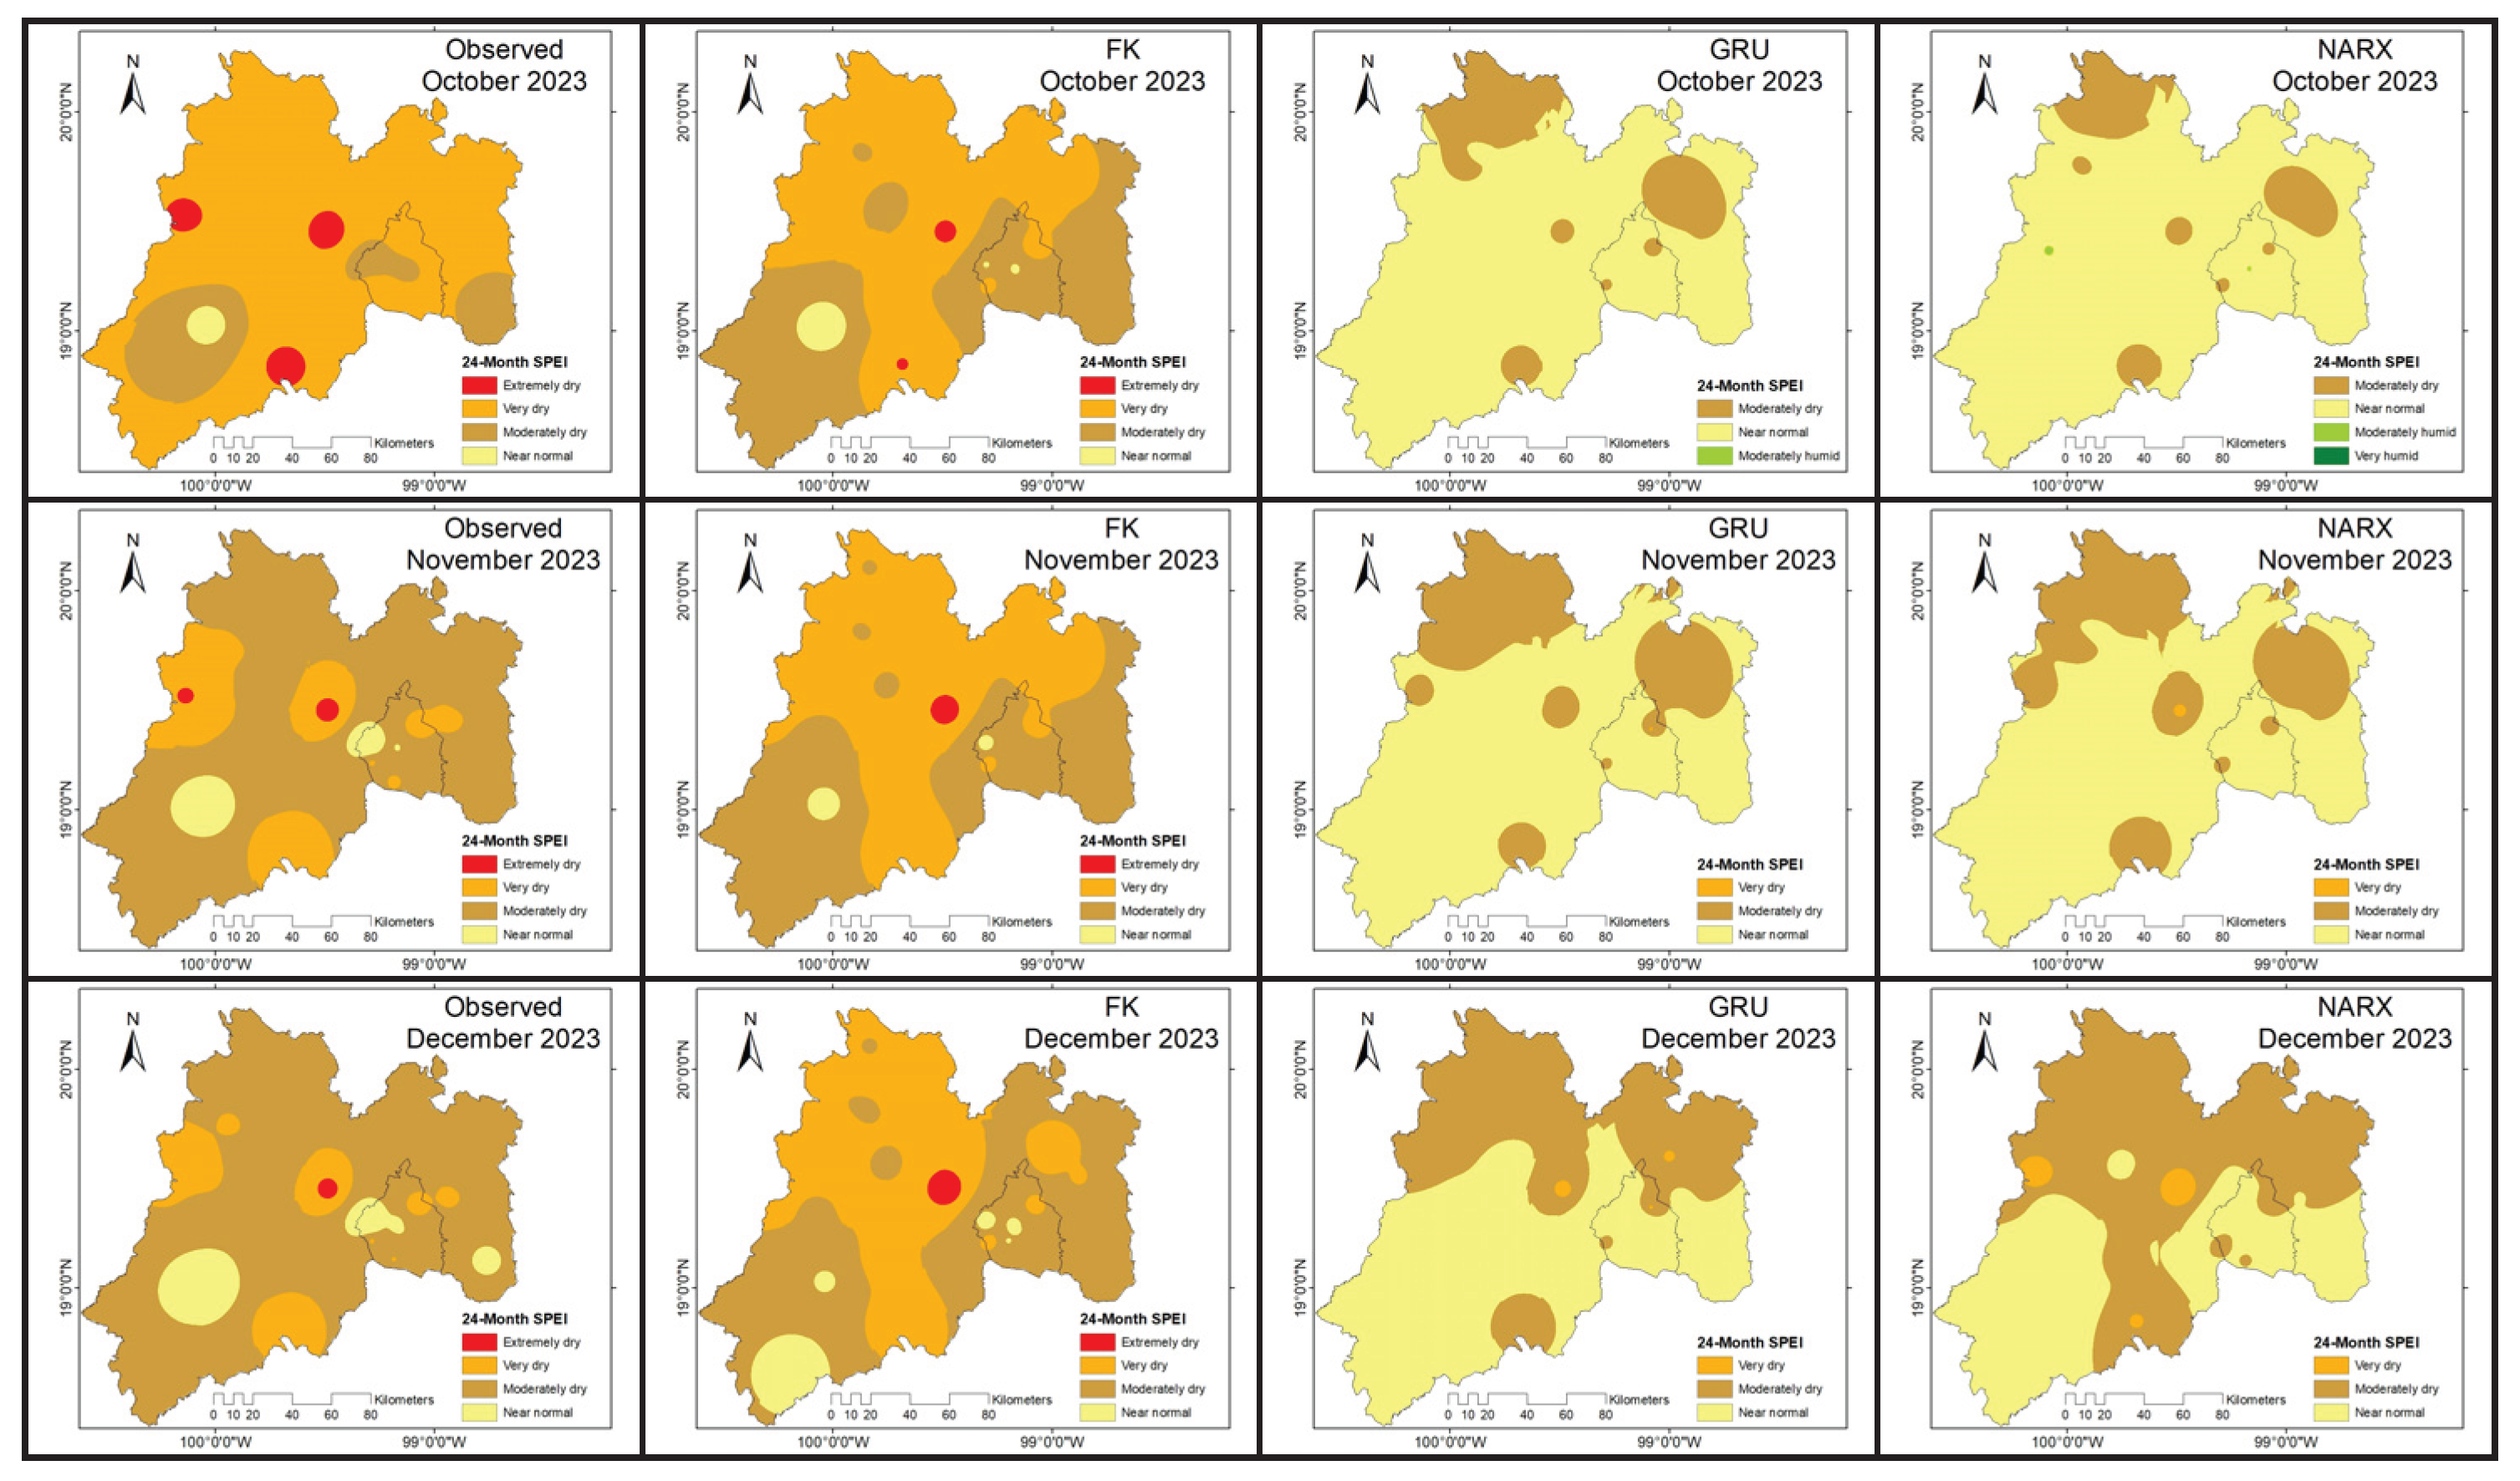
Table 3.
Summary of the averages of each metric for the three models.
| Model | MAE | RMSE | R2 | NSE | KGE |
| FK | 0.117 | 0.159 | 0.976 | 0.976 | 0.735 |
| GRU | 0.101 | 0.140 | 0.980 | 0.980 | 0.829 |
| NARX | 0.098 | 0.136 | 0.982 | 0.982 | 0.864 |
Table 4.
Average metrics of the 23 stations analyzed for a 3-month prediction with SPEI24.
| Model | MAE | RMSE | R2 | NSE | KGE | Global evaluation |
| FK | 0.0325 | 0.0490 | 0.9975 | 0.9975 | 0.95 | Excellent |
| GRU | 0.1003 | 0.1286 | 0.9207 | 0.9207 | -1.13 | Acceptable, but statistically weak |
| NARX | 0.0913 | 0.1170 | 0.9348 | 0.9348 | -0.71 | Moderate, better than GRU but still deficient in structure |
Table 5.
Performance comparison by model for 3-month forecasting (averages over 23 stations).
| SPEI | Model | MAE | RMSE | R2 | NSE | KGE | Global evaluation |
| SPEI1 | FK | 0.403 | 0.513 | 0.728 | 0.728 | -6.02 | Weak |
| SPEI1 | GRU | 0.244 | 0.307 | 0.204 | 0.204 | -0.13 | Very low |
| SPEI1 | NARX | 0.242 | 0.302 | 0.226 | 0.226 | -0.08 | Very low |
| SPEI3 | FK | 0.101 | 0.132 | 0.982 | 0.982 | 0.85 | Excellent |
| SPEI3 | GRU | 0.167 | 0.213 | 0.697 | 0.697 | -3.34 | Unstable |
| SPEI3 | NARX | 0.170 | 0.217 | 0.691 | 0.691 | -0.51 | Could be improved |
| SPEI6 | FK | 0.073 | 0.096 | 0.990 | 0.990 | 0.91 | Very good |
| SPEI6 | GRU | 0.152 | 0.193 | 0.776 | 0.776 | -2.73 | Low |
| SPEI6 | NARX | 0.147 | 0.185 | 0.796 | 0.796 | -0.72 | Moderate |
| SPEI9 | FK | 0.053 | 0.073 | 0.994 | 0.994 | 0.95 | Very good |
| SPEI9 | GRU | 0.128 | 0.166 | 0.844 | 0.844 | -1.39 | Acceptable |
| SPEI9 | NARX | 0.124 | 0.160 | 0.856 | 0.856 | -0.15 | Could be improved |
| SPEI12 | FK | 0.041 | 0.061 | 0.996 | 0.996 | 0.96 | Excellent |
| SPEI12 | GRU | 0.096 | 0.126 | 0.909 | 0.909 | -0.88 | Acceptable |
| SPEI12 | NARX | 0.099 | 0.129 | 0.905 | 0.905 | 0.08 | Moderate |
| SPEI24 | FK | 0.033 | 0.049 | 0.997 | 0.997 | 0.95 | Excellent |
| SPEI24 | GRU | 0.100 | 0.129 | 0.921 | 0.921 | -1.13 | Acceptable |
| SPEI24 | NARX | 0.091 | 0.117 | 0.935 | 0.935 | -0.71 | Moderate |
Disclaimer/Publisher’s Note: The statements, opinions and data contained in all publications are solely those of the individual author(s) and contributor(s) and not of MDPI and/or the editor(s). MDPI and/or the editor(s) disclaim responsibility for any injury to people or property resulting from any ideas, methods, instructions or products referred to in the content. |
© 2025 by the authors. Licensee MDPI, Basel, Switzerland. This article is an open access article distributed under the terms and conditions of the Creative Commons Attribution (CC BY) license (http://creativecommons.org/licenses/by/4.0/).
Copyright: This open access article is published under a Creative Commons CC BY 4.0 license, which permit the free download, distribution, and reuse, provided that the author and preprint are cited in any reuse.


