Submitted:
23 May 2025
Posted:
27 May 2025
You are already at the latest version
Abstract
As global climate change becomes more urgent, carbon dioxide (CO₂) emissions are a key indicator in assessing the effectiveness of the world's energy transition. These emissions are mainly sourced from the energy sector in major countries such as China, the United States and a group of other countries. The research analyzes CO₂ emission trends by sec-tor, including Power, Industry, Ground Transport, and Residential to identify priority sectors that contribute significantly to total emissions. Using international data and a quantitative approach through linear regression and ANOVA, results show that the In-dustry, Power, and Ground Transport sectors experienced significant increases in emis-sions, while the Residential sector remained relatively stable. Significant differences be-tween sectors emphasize the need for specific and focused policy interventions. Geo-graphically, China is the largest contributor to emissions, while some countries such as Brazil and the UK show a decrease in emissions in the Power sector, reflecting the early success of the energy transition. The research offers a new approach by analyzing CO₂ emissions sectorally and spatially, providing a scientific basis for more equitable and effi-cient emissions reduction policies. The findings confirm the importance of international collaboration in achieving carbon neutrality targets in a sustainable way.
Keywords:
CO₂ emissions
; energy transition
; sectoral emission analysis
; climate change mitigation
; international collaboration
1. Introduction
The research was conducted based on the fact that global carbon dioxide (CO₂) emissions continue to increase consistently from year to year, which in turn poses a serious threat to the stability of the Earth's climate [1,2]. While many efforts have been made to reduce these emissions, a quantitative understanding of the contribution of each economic sector to total carbon emissions is still not fully comprehensive. Differences in emission growth rates between sectors such as energy, industry, transportation and residential have not been analyzed in detail, making it difficult to determine the most strategic focus of intervention. The geographical distribution of CO₂ emissions shows significant disparities [3]. Some countries contribute a large portion of the total global emissions, while others have a much smaller contribution. This imbalance raises issues of responsibility sharing and effectiveness in implementing climate change mitigation policies at the global level. However, data on long-term trends in emissions by sector and country are still not available in a complete and integrated manner, even though this information is needed to develop policies based on scientific evidence. In the midst of a global push to shift to renewable energy, an in-depth understanding of which sectors are most urgent to intervene is becoming increasingly important. High dependence on fossil fuels, especially in the energy and industrial sectors, continues to be a major obstacle to decarbonization, despite normative international commitments to reduce emissions [4]. Meanwhile, clean energy policies that have been implemented in various countries have not shown optimal results, which indicates the need to evaluate the effectiveness of these policies based on empirical data. The residential sector actually has great potential in improving energy efficiency, but this potential has not been fully explored due to the lack of adequate long-term data. Therefore, a strong scientific foundation is needed to prioritize appropriate and effective mitigation policies, both at the national and international levels. Moreover, the increasingly extreme climate change conditions encourage the need for more focused and sectoral analysis of carbon emission sources, so that the resulting mitigation response can be faster, targeted and sustainable. This research was conducted as part of this effort, with the hope of making a real contribution to the mapping, understanding and mitigation of carbon emissions globally.
The study aims to analyze the global distribution of carbon dioxide (CO₂) emissions by examining the contributions of major countries as well as other country groups. The main focus of the analysis is on the long-term trend of CO₂ emissions from four main sectors, namely the Power, Industry, Ground Transport and Residential sectors. To identify patterns and trends in emissions over time, a linear regression approach was used. The study also sought to assess whether there were significant differences in average emissions between economic sectors through the analysis of variance (ANOVA) method. An important part of the study was to evaluate the trends in CO₂ emissions from the power generation sector between countries, particularly by comparing the 10 countries with the highest and 10 countries with the lowest levels of emissions. The research interprets the implications of these emissions trends for energy policy and the transition to carbon neutrality, and determines the priority sectors that should be the main focus of future carbon emissions mitigation strategies. The benefits of the research are broad and significant, both at the national and international levels. The results of this study are expected to provide a strong scientific basis for formulating more effective CO₂ emission reduction policies. The research findings can assist the government and other stakeholders in identifying strategic sectors that should be top priorities for achieving carbon neutrality targets. Providing quantitative evidence, the research shows that the Industry, Power and Ground Transport sectors are major contributors to the increase in atmospheric carbon emissions. The research reveals the effectiveness of clean energy policies implemented in certain countries such as Brazil, Japan, the UK, and Spain that have successfully shown a downward trend in emissions. More broadly, the research can encourage investment and innovation in renewable energy technologies, especially in sectors where emissions have increased significantly. As a foundation for comparative research across countries and sectors, the energy transition strategy is expected to be more equitable, scalable and efficient. As such, the research raises public and policy makers' awareness of the urgency of data-driven collective action in the face of an increasingly urgent global climate crisis.
The hypothesis in this study was built on the basis of historical studies and previous research showing that global CO₂ emissions are not evenly distributed between countries [5]. Countries with large economies are assumed to have a much higher proportion of emissions compared to developing countries or small country groups [6]. The electricity generation sector is estimated to be a major contributor to global CO₂ emissions due to a long history of dependence on fossil fuels dating back to the industrial revolution [7]. As the global economy grows, the industrial sector is expected to experience a significant increase in emissions, mainly due to industrial expansion in developing countries and the presence of heavy industry in developed countries [8]. The land transportation sector also contributes a large amount of emissions, influenced by urbanization trends and the increase in motor vehicles [9]. In contrast, the residential sector tends to show stagnant or seasonally fluctuating emission patterns, as household energy consumption is relatively constant over time. It is assumed that there are significant differences in average CO₂ emissions between economic sectors, implying an imbalance in the carbon intensity of each sector. Developed countries are assumed to have shown a downward trend in emissions through the adoption of clean energy policies and renewable energy development that started earlier than developing countries [10]. In contrast, developing countries are likely to still register an increase in emissions because they are still dependent on fossil energy sources in their development process. The implementation of renewable energy policies in some countries is assumed to have started to have an impact on reducing emissions, especially in the electricity generation sector. However, the imbalance of emission contributions between countries and sectors is believed to be one of the main obstacles in achieving global carbon neutrality targets, given the differences in technological capacity, economics and historical responsibilities between global actors.
The limitations of the study lie in the sectoral scope, analysis methodology, and scope of data used. The study only focused on CO₂ emissions from four main sectors, namely Power, Industry, Ground Transport and Residential, leaving out other sectors such as agriculture, aviation and waste management. The statistical approach used was also limited to linear regression and ANOVA, without considering non-linear or machine learning methods that can capture more complex patterns. The data analyzed are mostly global agre-gates or from countries with the highest and lowest emissions, so they are not fully representative of small or developing countries. Reliance on historical data is also a limitation, as the quality and completeness of the data may vary between countries. The study does not integrate social and economic factors such as population growth, industrialization rates, and energy policy in depth, nor does it directly evaluate the influence of energy policy on emissions trends. The time span of observations is limited by data availability, so it may not capture recent changes due to the pandemic or technological developments. The analysis only covers direct emissions from the sector, without considering indirect emissions such as from the energy supply chain. The "Rest of World (ROW)" category, which includes many countries collectively, also limits the interpretation of country-specific contributions. The visualization in this study is still general and does not include spatial maps that can strengthen geographical regional analysis.
While many studies have addressed global carbon dioxide emission trends and the role of renewable energy in energy sector transformation, most of the focus is still limited to macro analyses that incorporate aggregated national or sectoral data without considering the dynamics of heterogeneity and complex interactions between sectors and countries simultaneously. Previous studies such as those conducted by [11] and [12] While these studies do reveal the non-linear impact of renewable energy development on carbon emission efficiency in developed countries, they fall short in describing the pattern of energy transition in developing countries and its linkages to specific economic sectors. Most studies tend to use conventional statistical or econometric models without integrating advanced analytical methods that can capture temporal and spatial patterns more dynamically and adaptively to rapid policy and technological changes. While there are studies that highlight the technical and economic aspects of the energy transition globally [13], and environmental impacts of the electricity sector [14], There are no comprehensive studies linking sectoral and cross-country CO₂ emission trends with real-time data-based policy adaptation strategies or more practical and contextualized simulations of energy transition scenarios. This leaves a gap in understanding how different emissions trends across sectors can contribute differently to total emissions and how renewable energy interventions can be tailored for maximum effectiveness.
2. Methods
2.1. Dataset
The research data used in the study comes from the CO₂ Emissions Dataset, a comprehensive dataset that contains detailed information on carbon dioxide (CO₂) emissions from various countries and economic sectors. The dataset is designed to support the efforts of researchers and policy makers in understanding and addressing the impact of emissions on the global environment.
The main advantage of the dataset lies in its ability to explore and visualize CO₂ emissions by country, sector of activity, and development over time. This makes it a highly effective tool for conducting time series analysis to forecast future emissions trends.
The dataset presents static data, which encourages collaboration between researchers and policy agencies in promoting sustainable development practices. Researchers can observe the significant impact of certain global events, such as the COVID-19 pandemic that caused a drastic decrease in economic activity and directly lowered CO₂ emissions globally, as reported by [15] in a study supported by Carbon Monitor. They found that between January and April 2020, there was a 7.8% reduction in global emissions (938 Mt CO₂ equivalent) compared to the same period the previous year. This decline was most pronounced in the land transportation, electricity and aviation sectors.
2.2. Descriptive Analysis of Global CO₂ Emissions
Total global CO₂ emissions for year t are calculated as:
Total emissions per country i for year t:
Countries with the highest emissions:
Countries with the lowest emissions:
Percentage Contribution of Emissions for Each Country:
2.3. Trend Analysis Using Linear Regression
For each sector, a simple linear regression was modeled [16]:
In the model based on equation (7), ( represents the amount of CO₂ emissions at time t, measured in units such as MtCO₂, while t represents time in discrete units (years or months) expressed as an integer from 1 to n. Parameters ( is the intercept or initial emission value at (t = 0), while ( is a trend coefficient that shows the rate of change of emissions over time, which is positive if the trend is increasing, and negative if it is decreasing. Component ( is an error term that describes the random deviation of the actual value from the model, and is assumed to follow a normal distribution with zero mean and constant variance, namely {. As for estimating ( and ( by minimizing the residual sum of squares:
Analytic solution of OLS estimation:
where ( and ( are the averages of (Yt) and t, respectively. A significance test of the regression coefficients is conducted to determine whether the trend of changes in CO₂ emissions over time can be considered statistically significant. In this case, the null hypothesis (H₀) states that the regression coefficient (, meaning there is no significant trend in emissions over time. In contrast, the alternative hypothesis (H₁) states that (, which indicates a significant trend, either increasing or decreasing. This test is performed by calculating the t-statistic of the estimated trend coefficient, and then comparing it with the t-student distribution to obtain the p-value [17]. If the p-value is smaller than the significance level (0.05), then H₀ is rejected, concluding that the emission trend is statistically significant. Test Statistics:
where is the standard error of (, calculated as:
and:
The p-value is calculated from the t distribution with (n – 2) degrees of freedom. If the p-value < 0.05, then ( is statistically significant. If ( and is significant (p-value < 0.05), then the trend is increasing. If ( and is significant (p-value < 0.05), then the trend is decreasing. If p-value ≥ 0.05 the trend is not statistically significant, although the direction of the trend may be indicated by the sign of (. A t-test is performed by calculating , then testing for significance.
2.4. Test the Difference in Average CO₂ Emissions Between Sectors Using the ANOVA (Analysis of Variance) Method
In conducting an ANOVA test to compare average CO₂ emissions between sectors, there are some basic assumptions that need to be met for the analysis results to be statistically valid. First, the CO₂ emissions data in each sector group must follow a normal distribution. Second, the variance between sector groups is assumed to be homogeneous or equal (known as the homoskedasticity assumption). Third, each observation in the data must be independent, meaning that they do not influence each other.
Mathematically, ANOVA tests for differences in means between groups by comparing the total variation of data [18]. There are k sectors (groups), with each i sector having (ni) observations, and the total number of observations is ( Each CO₂ emission value of the jth observation in the ith sector is expressed as (. The average CO₂ emission for the ith sector is denoted as (, while the overall average CO₂ emission from all sectors is denoted as (. This structure forms the basis for calculating the between-group and within-group variances, which are then used to test the significance of mean differences via the F statistic [19]:
Between-Group Sum of Squares (SSB):
Within-Group Sum of Squares (SSW):
Based on basic identity:
SST = SSB + SSW
F Test Statistics:
In ANOVA analysis, the F statistic value is obtained by comparing the variance between groups (Mean Square Between or MSB) to the variance within groups (Mean Square Within or MSW) [20]. MSB is calculated as:
while MSW is calculated as:
The F value is then obtained from the ratio:
which follows the F distribution with free degrees ( for the numerator and ( for the denominator. The p value from the F distribution is used to test the significance of the difference in means between sectors.
3. Results
3.1. Global CO₂ Emissions Contribution Gap by Sector and Country
Based on the analysis conducted by the study, CO₂ emissions by sector show that global emissions are dominated by contributions from several large countries, with the highest total emissions coming from the entire world in aggregate at 155,540 million tons. China is the largest individual contributor with 48,003 million tons, followed by the Rest of the World (ROW) group of countries with 46,393 million tons and the United States with 21,632 million tons. The European Union and the United Kingdom (EU27 & UK) contributed 14,004 million tons, while India contributed 11,108 million tons. Russia, Japan, and other European countries such as Germany, the UK, Italy, France, and Spain also made significant contributions, albeit smaller than the top three.
As seen in Figure 1, China has the highest total individual CO₂ emissions, followed by other country groups (ROW) and the United States, while European countries contribute relatively lower emissions, emphasizing the imbalance in global emissions contribution that needs to be addressed in the transition to renewable energy.
3.2. Trend Analysis of CO₂ Emissions in the Energy, Industry, Transportation and Residential Sectors
The research found significant trends in CO₂ emissions across the main sectors contributing to total carbon emissions. Based on a linear regression analysis of emissions data from the Power, Industry, Ground Transport and Residential sectors, it was found that the first three sectors experienced a very significant increase in emissions over time. In particular, the Industry sector shows the sharpest increasing trend with a coefficient estimate of 3.36×10-⁸ and a very small p value (p < 0.001), followed by the Power and Ground Transport sectors, with estimates of 3.97×10-⁸ and 1.69×10-⁸, respectively, which are also significant at high confidence levels (p < 0.001). In contrast, the Residential sector shows a negative trend direction with an estimate of -1.88×10-⁹, but is not statistically significant (p = 0.763), indicating no significant change in CO₂ emissions from this sector over the observed time period.
Table 1 shows that CO₂ emissions in the industrial, power generation and land transportation sectors have increased significantly over time, while the residential sector has shown no significant change.
Figure 2 shows the regression trend of CO₂ emissions by sector, which illustrates the contrasting trend dynamics between sectors over the observed time period. Table 2 confirms that efforts towards carbon neutrality should focus on reducing energy, industry and transportation sector emissions with specific and intensive strategies, while the residential sector shows opportunities to maintain and improve household energy efficiency.
In the Power sector, CO₂ emissions show a consistently increasing trend over time. An increasing linear regression line with a fairly steep slope and relatively narrow confidence bands suggests that this increase is significant and steady. This indicates that the electricity generation sector remains a major contributor to carbon emissions, largely due to continued reliance on fossil fuels. A similar trend is observed in the Industry sector, where the increase in emissions is sharper than in other sectors. The steeply rising trend line illustrates that industrial activity is still growing with high carbon emissions, reinforcing previous findings that this sector has the highest regression coefficient. The trend shows the urgency to reform energy and production process efficiency in the industrial sector to curb the rate of emission increase. The Ground Transport sector also shows a significant upward trend, albeit with a slower gradient than industry and power. This indicates that the growth of ground transportation activities continues to contribute to increased carbon emissions, but at a relatively more manageable rate. Low-emission vehicle technology or sustainable transportation policies have started to have an impact, but not enough to reverse the overall trend. The Residential sector shows a very different pattern. The regression line is almost flat and even slightly declining, and the data points are more widely spread with wide confidence bands, reflecting the high variability and greater uncertainty of the trend. The downward trend is statistically insignificant, meaning there is no strong evidence that CO₂ emissions from the residential sector have changed significantly over the observation period. This could be due to a combination of factors such as stagnant energy efficiency, seasonal variations in household energy consumption, or the neutral effect of domestic policies.
3.3. The Significance of Differences in CO₂ Emissions Between Economic Sectors as a Basis for Prioritizing the Renewable Energy Transition
Based on the research conducted, there is a highly significant difference in average CO₂ emissions between economic sectors, obtained through analysis of variance (ANOVA) with a p value of less than 0.05. This means that not all sectors contribute the same carbon emissions, but there are certain sectors that are substantially higher in CO₂ emissions than other sectors. Thus, the study confirms the importance of targeting intervention priorities at the highest-emitting sectors as a strategic step in promoting the transition to renewable energy. Focusing on these sectors will have the most significant impact on reducing total carbon emissions nationally, thus paving a sustainable path towards achieving carbon neutrality. Table 3 summarizes the ANOVA results for the comparison of CO₂ emissions between sectors:
It can be seen that there are significant differences in average CO₂ emissions between sectors with very small p values (<2 × 10-¹⁶). Sectors have statistically different contributions to total carbon emissions, confirming the need to focus interventions on the highest-emitting sectors to support the renewable energy transition and achieve carbon neutrality in a sustainable manner.
Figure 3 shows a comparison of total CO₂ emissions from different sectors. Each bar shows total emissions in millions of metric tons, while the percentage proportion of total national emissions is shown alongside. That sectors dominate CO₂ emissions indicates that the focus of renewable energy development and carbon reduction policies should be directed towards these sectors to effectively and sustainably achieve carbon neutrality targets.
3.4. Dynamics of Global Power Generation Sector CO₂ Emissions and Challenges to the Energy Transition to Carbon Neutrality
Based on the analysis of CO₂ emissions from the power generation sector of various countries, a diverse picture of trends in emissions changes over time is obtained, which is highly relevant in efforts to utilize renewable energy as a sustainable path towards carbon neutrality. The study has focused on the 10 countries with the highest emissions and the 10 countries with the lowest emissions, with some major countries such as China, India, Russia and France showing a significant upward trend in emissions. This indicates that despite their energy transition efforts, their dependence on fossil fuels in the power generation sector is still increasing, posing a major challenge in achieving carbon reduction targets.
In contrast, countries such as Brazil, Japan, the Rest of the World (ROW) region, Spain and the UK are showing a significant downward trend in emissions. This decline means successful implementation of clean energy policies, increased renewable energy-based power generation capacity and improved energy efficiency. It can be seen that Brazil, which has traditionally relied heavily on hydroelectric energy, and Japan, which is transforming with a focus on renewable energy post-Fukushima, show strong downward trends. Some regions such as the European Union (EU27 & UK) and the United States show insignificant trends, which could mean that there is fluctuation or stagnation in the reduction of power generation emissions, so further policy pushes and technological innovations are still needed to achieve carbon neutrality targets.
Globally, the emission trend of the power generation sector shows a significant increase, indicating that the world as a whole still faces major challenges in reducing dependence on fossil energy sources. This underscores the urgency of accelerating the utilization of renewable energy, both in terms of policy, technology, and infrastructure investment. Global efforts towards sustainability and carbon neutrality depend on high-emitting countries alone, and on synergized action from all countries, including those with low emissions, to make the energy transition fair, effective and sustainable.
It can be seen in Figure 4 that the trend of CO₂ emissions from the power generation sector is displayed using a line graph with a smooth trend line (loess) for 20 countries, consisting of 10 countries with the highest emissions and 10 countries with the lowest emissions. It can be seen that while there are countries that have succeeded in reducing power sector emissions through the utilization of renewable energy, globally the emissions trend still shows an increase, confirming the urgent need to expand and accelerate the adoption of clean energy in order to sustainably achieve carbon neutrality targets.
A detailed analysis of carbon emissions from various sectors in a number of key countries and regions shows that emission patterns are highly diverse and point to significant challenges in utilizing renewable energy as a pathway to sustainable carbon neutrality. In particular, the industrial and power generation sectors are the largest contributors to carbon emissions in almost all countries, with China and the Rest of World (ROW) standing out as the two entities with the highest emission figures in these sectors. This indicates that the dominance of heavy industry and fossil fuel-based power generation is still very large, so the transition to renewable energy should focus on transforming these two sectors. The land transportation sector also shows a large contribution to emissions, especially in countries with high mobility and significant population density such as China, India and the United States. Meanwhile, the aviation sector, both domestic and international, while smaller in terms of emissions than industry or power generation, still makes a contribution that cannot be ignored, given the sector's rapid growth and the technological challenges in decarbonization. The data shows that domestic and residential emissions remain substantial, signaling the need for improved energy efficiency and the use of clean energy sources at the household level.
Table 4 represents the distribution of carbon emissions per sector in various countries and the implications for the utilization of renewable energy to achieve carbon neutrality.
3.5. Country Grouping Based on Sectoral CO₂ Emission Patterns in Support of the Renewable Energy Transition to Carbon Neutrality
Research has grouped countries based on sectoral CO₂ emissions related to patterns of emission contributions in various key sectors, which is particularly relevant in the context of renewable energy utilization as a sustainable path to carbon neutrality. Using k-means clustering on robustly scaled data, four groups of countries were obtained, each with significantly different emission characteristics.
The first cluster includes countries with relatively moderate to high emissions in the road transport, industrial and power generation sectors, with average emissions from power generation and road transport in the range of thousands of tons of CO₂, indicating significant reliance on fossil fuels in these sectors. The variability of emissions within this cluster is also quite high, indicating heterogeneity in energy efficiency levels and carbon reduction policies between countries in the group. The second cluster identifies countries with drastically higher emissions, particularly in the industrial and land transportation sectors, where industrial emissions average nearly 48 thousand tons of CO₂, indicating a large concentration of heavy industrial activity and fossil energy use. This implies a major challenge for countries in this cluster to shift to cleaner and more efficient renewable energy sources, given the high carbon intensity of these sectors.
Based on statistical analysis using the Kruskal-Wallis test to test for significant differences in carbon emissions among the clustered groups in the major emitting sectors. The study found that there were significant variations in the distribution of carbon emissions between clusters in most of the sectors analyzed. In particular, the residential sector ranks first with a p value of 0.0232, indicating that carbon emissions from this sector differ significantly between the clusters formed, which represent different regions or energy policy scenarios. Followed by the land transportation sector with a p value of 0.0251 and the industrial sector with a p value of 0.0304, these results indicate that renewable energy transition strategies have different impacts on emission reductions in these sectors, depending on the characteristics of each cluster. The domestic aviation and power generation sectors show significant results with p-values of 0.0355 and 0.0385 respectively, emphasizing that the implementation of renewable energy and energy efficiency in these sectors is not uniform, but is strongly influenced by factors such as the penetration rate of green technologies, national policy regulations, and regional energy consumption levels. Meanwhile, the international aviation sector shows a p value of 0.0610, which is slightly above the conventional significance threshold (p < 0.05), indicating a tendency for differences between clusters although not strong enough to be statistically significant.
In detail, the Kruskal-Wallis test results show that the p values for the five sectors are below the significance threshold (p < 0.05), indicating that there are significant differences in emissions distribution between the clusters. Dunn's post-hoc analysis revealed the most striking and repeated differences between clusters 2 and 3, and between clusters 3 and 4 in almost all sectors, especially in Industry and Power, where the unadjusted p values were below 0.05. Although after correction these p values do not all remain significant, a consistent trend of differences between certain clusters is evident, suggesting a potential systemic link between decarbonization strategies and emissions outcomes in these strategic sectors. The Ground Transport and Domestic Aviation sectors show a similar pattern, with the 3rd cluster (most likely representing a group of countries or regions with high levels of renewable energy adoption or stronger transportation efficiency strategies) showing significant differences against the other clusters. This strengthens the argument that policy interventions aimed at transforming public transportation and fuel efficiency have a real impact on reducing carbon emissions. Residential and Power highlight household electrification and the shift from fossil fuel power generation to renewable energy sources such as solar and wind. The significant differences between clusters within these sectors can be interpreted as empirical evidence that aggressive energy transition strategies contribute to measurable emissions reductions. Table 5 shows the results of the analysis of significant sectors and the interpretation of the Dunn post-hoc test results after the Kruskal-Wallis test:
As can be seen in Table 5, the results of Dunn's post-hoc test on five key sectors show significant differences in carbon emissions by energy strategy cluster. The third cluster consistently shows significant differences against the other clusters, indicating that this group represents regions with higher adoption of renewable energy. Sectors such as industry, road transport and electricity generation were highlighted as being sensitive to differences in decarbonization strategies, showing great potential as a policy focus in the transition to carbon neutrality.
The research approach involves normalizing the total CO₂ emissions data by sector and country with a robust scaling method that considers the median and interquartile range (IQR), to reduce the influence of extremes or outliers that often appear in emissions data that vary widely between developed and developing countries. After normalizing the data, three different methods were used to determine the optimal number of clusters in the K-means analysis, namely the Elbow method, Silhouette method, and Gap Statistic.
As can be seen in Figure 5, which is the Elbow Method, the significant decrease in the within-cluster sum of squares (WSS) value up to the elbow point indicates that the optimal number of clusters is when the addition of further clusters no longer substantially reduces the internal variation. This is indicated by a change in the slope of the curve, and in this case suggests an optimum of between 3 and 4 clusters. The Silhouette Method shows how well each object fits into its cluster compared to other clusters; the peak value of the silhouette gives a strong indication of the optimal number of clusters that produces the best separation and cohesion between country groups. It can also be seen that the Gap Statistic is used as an additional validation method with a statistical approach that compares the internal variation of the actual cluster with the variation from random data that has a similar structure. A large gap between the two indicates that the cluster structure found is indeed significant and not the result of random chance.
As can be seen in Figure 6, with the k-means method and the optimal number of clusters of four, the visualization of the clustering results shows that countries are clearly distributed based on the sectoral characteristics of their emissions. The first cluster defines countries with medium to high contributions in various sectors, especially land transportation, industry, and power, such as India and Japan. The second cluster, which uniquely consists of only one entity, the world aggregate (WORLD), shows extreme values across all sectors, indicating a very high global total scale. The third cluster includes countries with relatively moderate and homogeneous sectoral contributions, while the fourth cluster shows lower and more dispersed emissions characteristics, including countries such as France and the UK.
4. Discussion
Research has found that global CO₂ emissions are highly imbalanced, with China, the ROW and the United States dominating. This finding is in line with Climate Jus-tice theory, which emphasizes that the distribution of emissions responsibilities fairly between developed and developing countries [21]. Countries that contribute heavily to emissions have a greater moral and historical responsibility to fund and lead the transition to renewable energy In theory, a country's carbon footprint interprets the level of fossil energy consumption and energy efficiency in its economic system [22]. Major countries such as China and the US contributing the highest emissions mean a high reliance on fossil fuels for industry and transportation. This strengthens the argument that to achieve carbon neutrality, a systemic shift to renewable energy must start from the top contributing countries [23]. The research conducted has supported previous findings that global structural imbalances in energy production and consumption hinder the achievement of decarbonization targets [24]. Developing countries that fall under the ROW category face technological, investment and infrastructure constraints to adopt renewable energy. This is in line with the literature that suggests that international financing mechanisms, technology transfer and global cooperation will accelerate the energy transition in the Global South [25]. Using quantitative data that shows the dominance of emissions by certain countries, the research supports an evidence-based policy approach in designing decarbonization strategies [26]. The development of solar energy in China or the improvement of energy efficiency in the US industrial sector should be the focus of policy interventions [27]. Countries with relatively low emissions also still need to strengthen energy security and avoid lock-in to fossil fuels. Findings from the research also reinforce the urgency of implementing the Paris Agreement, especially in voluntary nationally determined contributions (NDCs) [28,29]. Emissions inequality means that climate ambition cannot be uniform, but must be tailored to each country's emissions contribution and economic capacity. The research emphasizes the need to strengthen commitments and increase emissions transparency as a foundation for cooperation towards global carbon neutrality.
In the utilization of renewable energy, research has shown diverse sectoral dynamics in the contribution to CO₂ emissions. The industrial sector is the largest contributor to the increase in emissions, with an estimated coefficient of 3.36 × 10-⁸ and a very high significance (p < 0.001). This implies a very worrying trend, where the growth of industrial activity has not been matched by the control of carbon emission intensity. Theoretically, this finding is in line with the Environmental Kuznets Curve (EKC) approach, which states that in the early stages of economic development, emissions tend to increase with industrial expansion, before declining as the country reaches higher income levels and starts adopting clean technologies [30]. However, in this case, the results show that the industrial sector in the studied region is still in the carbon-intensive phase, with no signs of transition towards energy efficiency or electrification of production processes. Previous research conducted by [31] and [32] also indicates that the industrial sector globally accounts for more than 24% of CO₂ emissions, mainly due to the use of fossil fuels in heavy manufacturing processes such as cement, steel and petrochemicals. The research thus reinforces the conclusion that without structural interventions such as the integration of renewable energy and the adoption of low-carbon technologies, the industrial sector will remain a major contributor to the climate crisis. The power generation sector also saw a significant increase in emissions with a coefficient estimate of 3.97 × 10-⁸ and a high significance level (p < 0.001). This finding confirms that the energy transition in this sector still faces major obstacles, mainly due to the dominance of coal and natural gas in the energy mix. Theoretically, the Energy Transition Pathways approach underscores that the shift towards a sustainable energy system depends not only on the availability of technology, but also on incentive policies, infrastructure readiness, and the willingness of poli-tics to change [33]. Study by [34] and [35] mentioned that the electricity sector should be at the forefront of decarbonization because it is the basis for electrification across sectors, such as transportation and industry. Therefore, the increase in emissions in this sector indicates the need to accelerate investment in renewable energy, especially solar and wind, to reduce dependence on fossil fuels and support the achievement of carbon-neutral targets. In the land transportation sector, a significant upward trend in emissions was also detected with a coefficient estimate of 1.69 × 10-⁸ (p < 0.001), despite the adoption of electric vehicles (EVs) and other green technologies. This indicates that the dominance of fossil-fueled motor vehicles is still not significantly replaced, especially in urban areas with rapid vehicle growth. Sustaina-ble Mobility theory suggests that transport decarbonization efforts should include a systemic approach, including the development of low-emission public transport, urban planning control, and fuel subsidy policy reform [36,37]. Data from [38] Supporting this, it shows that even as vehicle efficiency increases, total emissions continue to rise due to the increase in the number of vehicles and the length of daily trips. Emission reduction strategies in this sector therefore require the integration of cross-sectoral policies that rely on vehicle technology, and the transformation of the transportation system as a whole. In contrast, the residential sector shows a flat or even slightly declining emission trend, with a coefficient estimate of -1.88 × 10-⁹ that is statistically insignificant (p = 0.763). Although not showing a significant decline, this result indicates that household energy consumption did not experience a surge that had a major impact on CO₂ emissions. Based on the Energy Efficiency Paradox theory, although energy-efficient devices such as LED lighting, inverter cooling, and smart energy management systems are widely available, mass adoption is still hampered by cost constraints, lack of awareness, and consumer preferences [39]. Research by [40] noted that the residential sector does have a large potential for energy efficiency, but its impact on total emissions is relatively small compared to the industrial, transportation and electricity sectors. Although not a top priority in the decarbonization strategy, strengthening household energy efficiency programs remains relevant in supporting the long-term targets of the energy transition.
The research reveals highly significant differences in average CO₂ emissions between economic sectors, a finding that is in line with previous theories and studies on carbon emissions distribution and renewable energy transition strategies [41,42]. Theoretically, each economic sector has different energy consumption and carbon intensity characteristics [43]. The industrial and transportation sectors are known to have high emission levels due to their dependence on fossil fuels, as explained by [44]. Research findings have found significant variation between sectors supporting the results of the [45] which emphasizes that effective emission mitigation strategies should be sector-based. The research also confirms that prioritizing the sectors with the highest CO₂ emissions is the basis for a renewable energy transition strategy. This concept is in line with the carbon hotspot principle found in the environmental literature, where a few key sectors are the main concentrations of carbon emissions and therefore the main focus of mitigation efforts [46]. By directing policies and interventions to these sectors, emission reductions can be carried out more efficiently and have a significant impact on reducing total national carbon emissions. This approach is also in line with the energy transition model developed by [47] and [48], which proposes a sector-based strategy with a focus on substituting fossil fuels with renewable energy in accordance with the needs and characteristics of each sector. The transportation sector is geared towards electrification and biofuel utilization, while the industrial sector puts more emphasis on energy efficiency and the use of renewable energy such as biomass and green electricity. From the perspective of achieving carbon neutrality, proper prioritization in reducing emissions in key sectors can accelerate national targets in accordance with the Paris Agreement (2015) and the sustainable development agenda (SDGs) [23]. The research reinforces the view that without a clear focus on dominant emitting sectors, energy transition policies will be less effective in delivering significant and sustainable emissions reductions [49]. Based on the results of the research visualization presented in the results section, the dominance of emissions by several major economic sectors emphasizes the need for integrated and focused policies. Such policies can be in the form of fiscal incentives for renewable energy, regulations to improve energy efficiency, and investment in green technology, especially in priority sectors. This sector-specific approach is also consistent with the recommendations of the UNFCCC and various renewable energy research institutions, which state that the success strategy of the energy transition depends heavily on policy focus and adaptation based on different sector characteristics.
5. Conclusions
Theoretical conclusions from the analysis of global CO₂ emissions show a stark imbalance in the distribution of emissions contributions. The vast majority of emissions come from a handful of large countries such as China, the United States, and the "Rest of the World" group of countries, which collectively account for more than 75% of total emissions. This inequality highlights the urgency of a climate justice-based approach to responding to the global warming crisis. From a sectoral perspective, ANOVA results show highly significant differences in average emissions between sectors, indicating that the emissions burden is not borne equally by all sectors. Linear regression further revealed that the industrial, power generation and land transportation sectors experienced a significant upward trend in emissions, with the industrial sector contributing the highest increase. In contrast, the household sector shows stability in its emission trend, even tending to decline, which opens up opportunities for strengthening energy efficiency at the individual consumption level. Globally, emissions from the power generation sector continue to rise, reflecting continued dependence on fossil fuels. On the other hand, the success of countries such as Brazil, Japan, the UK and Spain in reducing emissions shows that clean energy policies can have a real impact if implemented effectively and consistently.
The practical conclusions of this analysis emphasize the importance of prioritizing interventions in sectors with high emission levels. The policy focus should be on the industrial, power generation and land transportation sectors, which show significant upward trends and contribute significantly to total emissions. Major reforms in the power sector should be encouraged through the transition to renewable energy such as solar, wind and hydro to replace dependence on fossil fuels. In the industrial sector, the adoption of low-carbon technologies and improved production efficiency are key to curbing the surge in emissions. Meanwhile, accelerating the adoption of electric vehicles and developing efficient public transportation are strategic steps to reduce emissions from land transportation. Despite its relatively small contribution, the household sector still needs to be kept efficient through energy-saving programs and incentives for the use of environmentally friendly appliances. At the global level, high emission countries such as China, India and Russia should be the main targets of mitigation reforms to make the impact more significant. However, it is not enough to rely solely on these countries to reduce emissions; inclusive global collaboration is also needed for an equitable and sustainable energy transition.
Future research recommendations focus on a more detailed and comprehensive approach to understanding the dynamics of global CO₂ emissions. One important direction is to disaggregate emissions data by sector by country, to identify the dominant emitting sectors in key countries such as China, India and the United States. Furthermore, projections of long-term trends in emissions in sectors such as electricity generation, industry, and land transportation can be made using predictive models such as ARIMA, LSTM, or Random Forest. The study could be complemented with an evaluation of low-carbon energy policies in countries that have shown a downward trend in emissions, such as Brazil, Japan and the UK, to explore the success factors of their energy transition. The research could also include simulating the impact of renewable energy adoption under optimistic, moderate and pessimistic scenarios, especially in the power and industrial sectors of large countries. In addition, comparing emission trends between developed and developing countries is important to understand the different energy transition challenges in each group. The residential sector is also worthy of further research, especially regarding the stagnation or insignificance of its emission trends, by examining household energy consumption patterns and the effectiveness of efficiency incentive policies. Analysis of inter-sectoral relationships through multi-variate regression can provide insights into emissions interdependencies, such as how industrial growth impacts the transportation and electricity sectors. In a global context, an assessment of the disparity in emissions contributions between large and small countries can open up further discussion on climate justice and the principle of common but differentiated responsibilities. Spatial and temporal validation of emission trends through the integration of satellite data such as OCO-2 or Sentinel is also an important method that supports the accuracy of modeling. From the socio-economic side, it is necessary to analyze the impact of low-carbon energy transition on society, especially in developing countries, so that the resulting mitigation strategy is more inclusive and equitable. The potential of renewable energy such as wind, solar, and hydro per country also needs to be mapped for the electricity sector, especially in countries with high emission trends. Equally important, the dynamics of global carbon policies such as carbon pricing, carbon trading, and climate finance need to be studied to assess their influence on emission reductions in lower-middle-income countries.
Supplementary Materials
Data and emissions trends by sector and country were sourced from Carbon Monitor (https://carbonmonitor.org), a real-time monitoring platform for global CO₂ emissions. In addition, references to relevant methodologies and analytical approaches were also obtained from the paper titled "Daily CO₂ Emissions in the First Quarter of 2020 Reflect the Economic Slowdown Due to COVID-19" available on arXiv (https://arxiv.org/abs/2004.13614).
Author Contributions
Conceptualization, M.H.R. and R.C.S.; methodology, M.H.R.; software, R.C.S.; validation, M.H.R., R.C.S.; formal analysis, M.H.R.; investigation, M.H.R.; resources, R.C.S.; data curation, R.C.S.; writing—original draft preparation, M.H.R.; writing—review and editing, R.C.S.; visualization, R.C.S.; supervision, M.H.R.; project administration, M.H.R.; funding acquisition, R.C.S. All authors have read and agreed to the published version of the manuscript.
Funding
Funding will be filled after the research is accepted and at the publication stage.
Institutional Review Board Statement
Institutional Review Board Statement will be filled after the research has been accredited and taghap copy layout.
Informed Consent Statement
Not applicable. This study did not involve human participants.
Data Availability Statement
The data supporting the findings of this study are publicly available. Sectoral and national CO₂ emissions data were obtained from the Carbon Monitor platform (https://carbonmonitor.org), which provides near real-time estimates of global CO₂ emissions across key sectors. Additional methodological references and analysis frameworks were adapted from the publication "Daily CO₂ Emissions in the First Quarter of 2020 Reflect the Economic Slowdown Due to COVID-19", which can be accessed via arXiv at https://arxiv.org/abs/2004.13614. All datasets used are publicly archived and freely accessible for verification and further research. No new proprietary data was generated in this study.
Acknowledgments
The authors would like to express their sincere gratitude to the Indonesian Research Center for Scholarship and Young Researchers for providing guidance and academic support during the preparation of this manuscript. We are also grateful for the valuable input and feedback from the bestarial partners and reviewers who have contributed to the improvement of this study. Data access and technical assistance can be obtained through open access repositories and publicly available emissions datasets from international environmental agencies. The authors have reviewed and edited the results and take full responsibility for the content of this publication.
Conflicts of Interest
The authors declare no conflict of interest. The funder had no role in the design of the study; in the collection, analysis, or interpretation of the data; in writing the manuscript; or in the decision to publish the results.
References
- Nunes, LJ. The rising threat of atmospheric CO2: a review on the causes, impacts, and mitigation strategies. Environments 2023, 10, 66. [Google Scholar] [CrossRef]
- Hansen, J.; et al. Assessing ‘dangerous climate change’: Required reduction of carbon emissions to protect young people, future generations and nature. PloS one 2013, 8, e81648. [Google Scholar] [CrossRef] [PubMed]
- Nassar, R; et al. Improving the temporal and spatial distribution of CO2 emissions from global fossil fuel emission data sets. Journal of Geophysical Research: Atmospheres 2013, 118, 917–933. [Google Scholar] [CrossRef]
- Hermwille, L. Hardwired towards transformation? Assessing global climate governance for power sector decarbonization. Earth System Governance 2021, 8, 100054. [Google Scholar] [CrossRef]
- Semieniuk, G.; Yakovenko, V. M. Historical evolution of global inequality in carbon emissions and footprints versus redistributive scenarios. Journal of Cleaner Production 2020, 264, 121420. [Google Scholar] [CrossRef]
- Galeotti, M.; Lanza, A. Richer and cleaner? A study on carbon dioxide emissions in developing countries. Energy policy 1999, 27, 565–573. [Google Scholar] [CrossRef]
- S. Pirani, Burning up: A global history of fossil fuel consumption. Pluto Press, 2018.
- Jänicke, M.; Binder, M.; Mönch, H. ‘Dirty industries’: Patterns of change in industrial countries. Environmental and resource economics 1997, 9, 467–491. [Google Scholar] [CrossRef]
- Frey, H.; C. Trends in onroad transportation energy and emissions. Journal of the Air & Waste Management Association 2018, 68, 514–563. [Google Scholar]
- Pfeiffer, B.; Mulder, P. Explaining the diffusion of renewable energy technology in developing countries. Energy Economics 2013, 40, 285–296. [Google Scholar] [CrossRef]
- Dong, F.; Li, Y.; Gao, Y.; Zhu, J.; Qin, C.; Zhang, X. Energy transition and carbon neutrality: Exploring the non-linear impact of renewable energy development on carbon emission efficiency in developed countries. Resources, Conservation and Recycling 2022, 177, 106002. [Google Scholar] [CrossRef]
- Hassan, Q.; et al. The renewable energy role in the global energy Transformations. Renewable Energy Focus 2024, 48, 100545. [Google Scholar] [CrossRef]
- Gielen, D.; Boshell, F.; Saygin, D.; Bazilian, M. D.; Wagner, N.; Gorini, R. “The role of renewable energy in the global energy transformation. Energy strategy reviews 2019, 24, 38–50. [Google Scholar] [CrossRef]
- Al-Shetwi, Q. Sustainable development of renewable energy integrated power sector: Trends, environmental impacts, and recent challenges. Science of The Total Environment 2022, 822, 153645. [Google Scholar] [PubMed]
- Z. Liu et al. COVID-19 causes record decline in global CO2 emissions. arXiv preprint arXiv:2004.13614, 2020.
- Zou, K.H.; Tuncali, K.; Silverman, S. G. Correlation and simple linear regression. Radiology 2003, 227, 617–628. [Google Scholar] [CrossRef] [PubMed]
- Louangrath, P. Using pValue to measure significance level of continuous data. International Journal of Research & Methodology in Social Science 2018, 4, 28–48. [Google Scholar]
- Kim, H.-Y. Analysis of variance (ANOVA) comparing means of more than two groups. Restorative dentistry & endodontics 2014, 39, 74. [Google Scholar]
- Rietveld, T.; Van Hout, R. Statistics in language research: Analysis of variance. Walter de Gruyter, 2010.
- Kallner. Resolution of Students t-tests, ANOVA and analysis of variance components from intermediary data. Biochemia medica 2017, 27, 253–258. [Google Scholar] [CrossRef] [PubMed]
- Okereke, “Climate justice and the international regime,” Wiley interdisciplinary reviews: climate change, vol. 1, no. 3, pp. 462–474, 2010.
- Ramanathan, R. A multi-factor efficiency perspective to the relationships among world GDP, energy consumption and carbon dioxide emissions. Technological Forecasting and Social Change 2006, 73, 483–494. [Google Scholar] [CrossRef]
- Chen, L.; et al. Strategies to achieve a carbon neutral society: a review. Environmental chemistry letters 2022, 20, 2277–2310. [Google Scholar] [CrossRef]
- Jayachandran, M.; et al. Challenges in achieving sustainable development goal 7: Affordable and clean energy in light of nascent technologies. Sustainable Energy Technologies and Assessments 2022, 53, 102692. [Google Scholar] [CrossRef]
- Kirchherr, J.; Urban, F. Technology transfer and cooperation for low carbon energy technology: Analysing 30 years of scholarship and proposing a research agenda. Energy policy 2018, 119, 600–609. [Google Scholar] [CrossRef]
- Soares, F.; Silva, M.; Azevedo, I. Urban decarbonization policies and strategies: A sectoral review. Renewable and Sustainable Energy Reviews 2025, 215, 115617. [Google Scholar] [CrossRef]
- Zhang, S.; Andrews-Speed, P.; Zhao, X.; He, Y. Interactions between renewable energy policy and renewable energy industrial policy: A critical analysis of China’s policy approach to renewable energies. Energy Policy 2013, 62, 342–353. [Google Scholar] [CrossRef]
- K. Radunsky and T. Cadman, “Addressing climate change risks: importance and urgency,” in Handbook of climate change management: Research, leadership, transformation, Springer, 2021, pp. 1405–1431.
- Mills-Novoa, M.; Liverman, D. M. Nationally determined contributions: material climate commitments and discursive positioning in the NDCs. Wiley Interdisciplinary Reviews: Climate Change 2019, 10, e589. [Google Scholar] [CrossRef]
- Dasgupta, S.; Laplante, B.; Wang, H.; Wheeler, D. Confronting the environmental Kuznets curve. Journal of economic perspectives 2002, 16, 147–168. [Google Scholar] [CrossRef]
- Bahman, N.; et al. A critical review on global CO2 emission: where do industries stand? Reviews on Environmental Health 2023, 38, 681–696. [Google Scholar] [CrossRef] [PubMed]
- Benhelal, E.; Zahedi, G.; Shamsaei, E.; Bahadori, A. Global strategies and potentials to curb CO2 emissions in cement industry. Journal of cleaner production 2013, 51, 142–161. [Google Scholar] [CrossRef]
- Hassan, Q.; et al. Enhancing smart grid integrated renewable distributed generation capacities: Implications for sustainable energy transformation. Sustainable Energy Technologies and Assessments 2024, 66, 103793. [Google Scholar] [CrossRef]
- Beckmann, J.; Klöckner, K.; Letmathe, P. Scenario-based multi-criteria evaluation of sector coupling-based technology pathways for decarbonization with varying degrees of disruption. Energy 2024, 297, 131248. [Google Scholar] [CrossRef]
- Belova, T. Pospíšilová, T. Stašáková, and J. Osička, “ConneCting the Dots”.
- Gallo, M.; Marinelli, M. Sustainable mobility: A review of possible actions and policies. Sustainability 2020, 12, 7499. [Google Scholar] [CrossRef]
- Wimbadi, R.W.; Djalante, R.; Mori, A. Urban experiments with public transport for low carbon mobility transitions in cities: A systematic literature review (1990–2020). Sustainable Cities and Society 2021, 72, 103023. [Google Scholar] [CrossRef]
- Schafer, A.; Victor, D.G. Global passenger travel: implications for carbon dioxide emissions. Energy 1999, 24, 657–679. [Google Scholar] [CrossRef]
- L. Mäntylä, “Energy Efficiency as a Driver of Value Creation in Commercial Real Estate Strategies,” 2025.
- Nejat, P.; Jomehzadeh, F.; Taheri, M. M.; Gohari, M.; Majid, M. Z. A. A global review of energy consumption, CO2 emissions and policy in the residential sector (with an overview of the top ten CO2 emitting countries). Renewable and sustainable energy reviews 2015, 43, 843–862. [Google Scholar] [CrossRef]
- Friedl, B.; Getzner, M. Determinants of CO2 emissions in a small open economy. Ecological economics 2003, 45, 133–148. [Google Scholar] [CrossRef]
- Hamit-Haggar, M. Greenhouse gas emissions, energy consumption and economic growth: A panel cointegration analysis from Canadian industrial sector perspective. Energy Economics 2012, 34, 358–364. [Google Scholar] [CrossRef]
- Xu, S.-C.; He, Z.-X.; Long, R.-Y.; Chen, H. Factors that influence carbon emissions due to energy consumption based on different stages and sectors in China. Journal of Cleaner Production 2016, 115, 139–148. [Google Scholar] [CrossRef]
- Johnsson, F.; Kjärstad, J.; Rootzén, J. The threat to climate change mitigation posed by the abundance of fossil fuels. Climate Policy 2019, 19, 258–274. [Google Scholar] [CrossRef]
- Schmidt, J.; Helme, N.; Lee, J.; Houdashelt, M. Sector-based approach to the post-2012 climate change policy architecture. Climate policy 2008, 8, 494–515. [Google Scholar] [CrossRef]
- Liu, M.; Chen, Y.; Chen, K.; Chen, Y. Progress and hotspots of research on land-use carbon emissions: A global perspective. Sustainability 2023, 15, 7245. [Google Scholar] [CrossRef]
- Fais, B.; Sabio, N.; Strachan, N. The critical role of the industrial sector in reaching long-term emission reduction, energy efficiency and renewable targets. Applied Energy 2016, 162, 699–712. [Google Scholar] [CrossRef]
- Vorwerg, F. C.; Ebadi Torkayesh, A.; Venghaus, S. From fossil fuels to alternative fuels: strategy development for a sustainable transport sector in Germany. Energy, Sustainability and Society 2025, 15, 4. [Google Scholar] [CrossRef]
- Lindberg, M.B.; Markard, J.; Andersen, A. D. Policies, actors and sustainability transition pathways: A study of the EU’s energy policy mix. Research policy 2019, 48, 103668. [Google Scholar] [CrossRef]
Figure 1.
Dominance of China, ROW, and the United States in World Carbon Emissions Contribution.
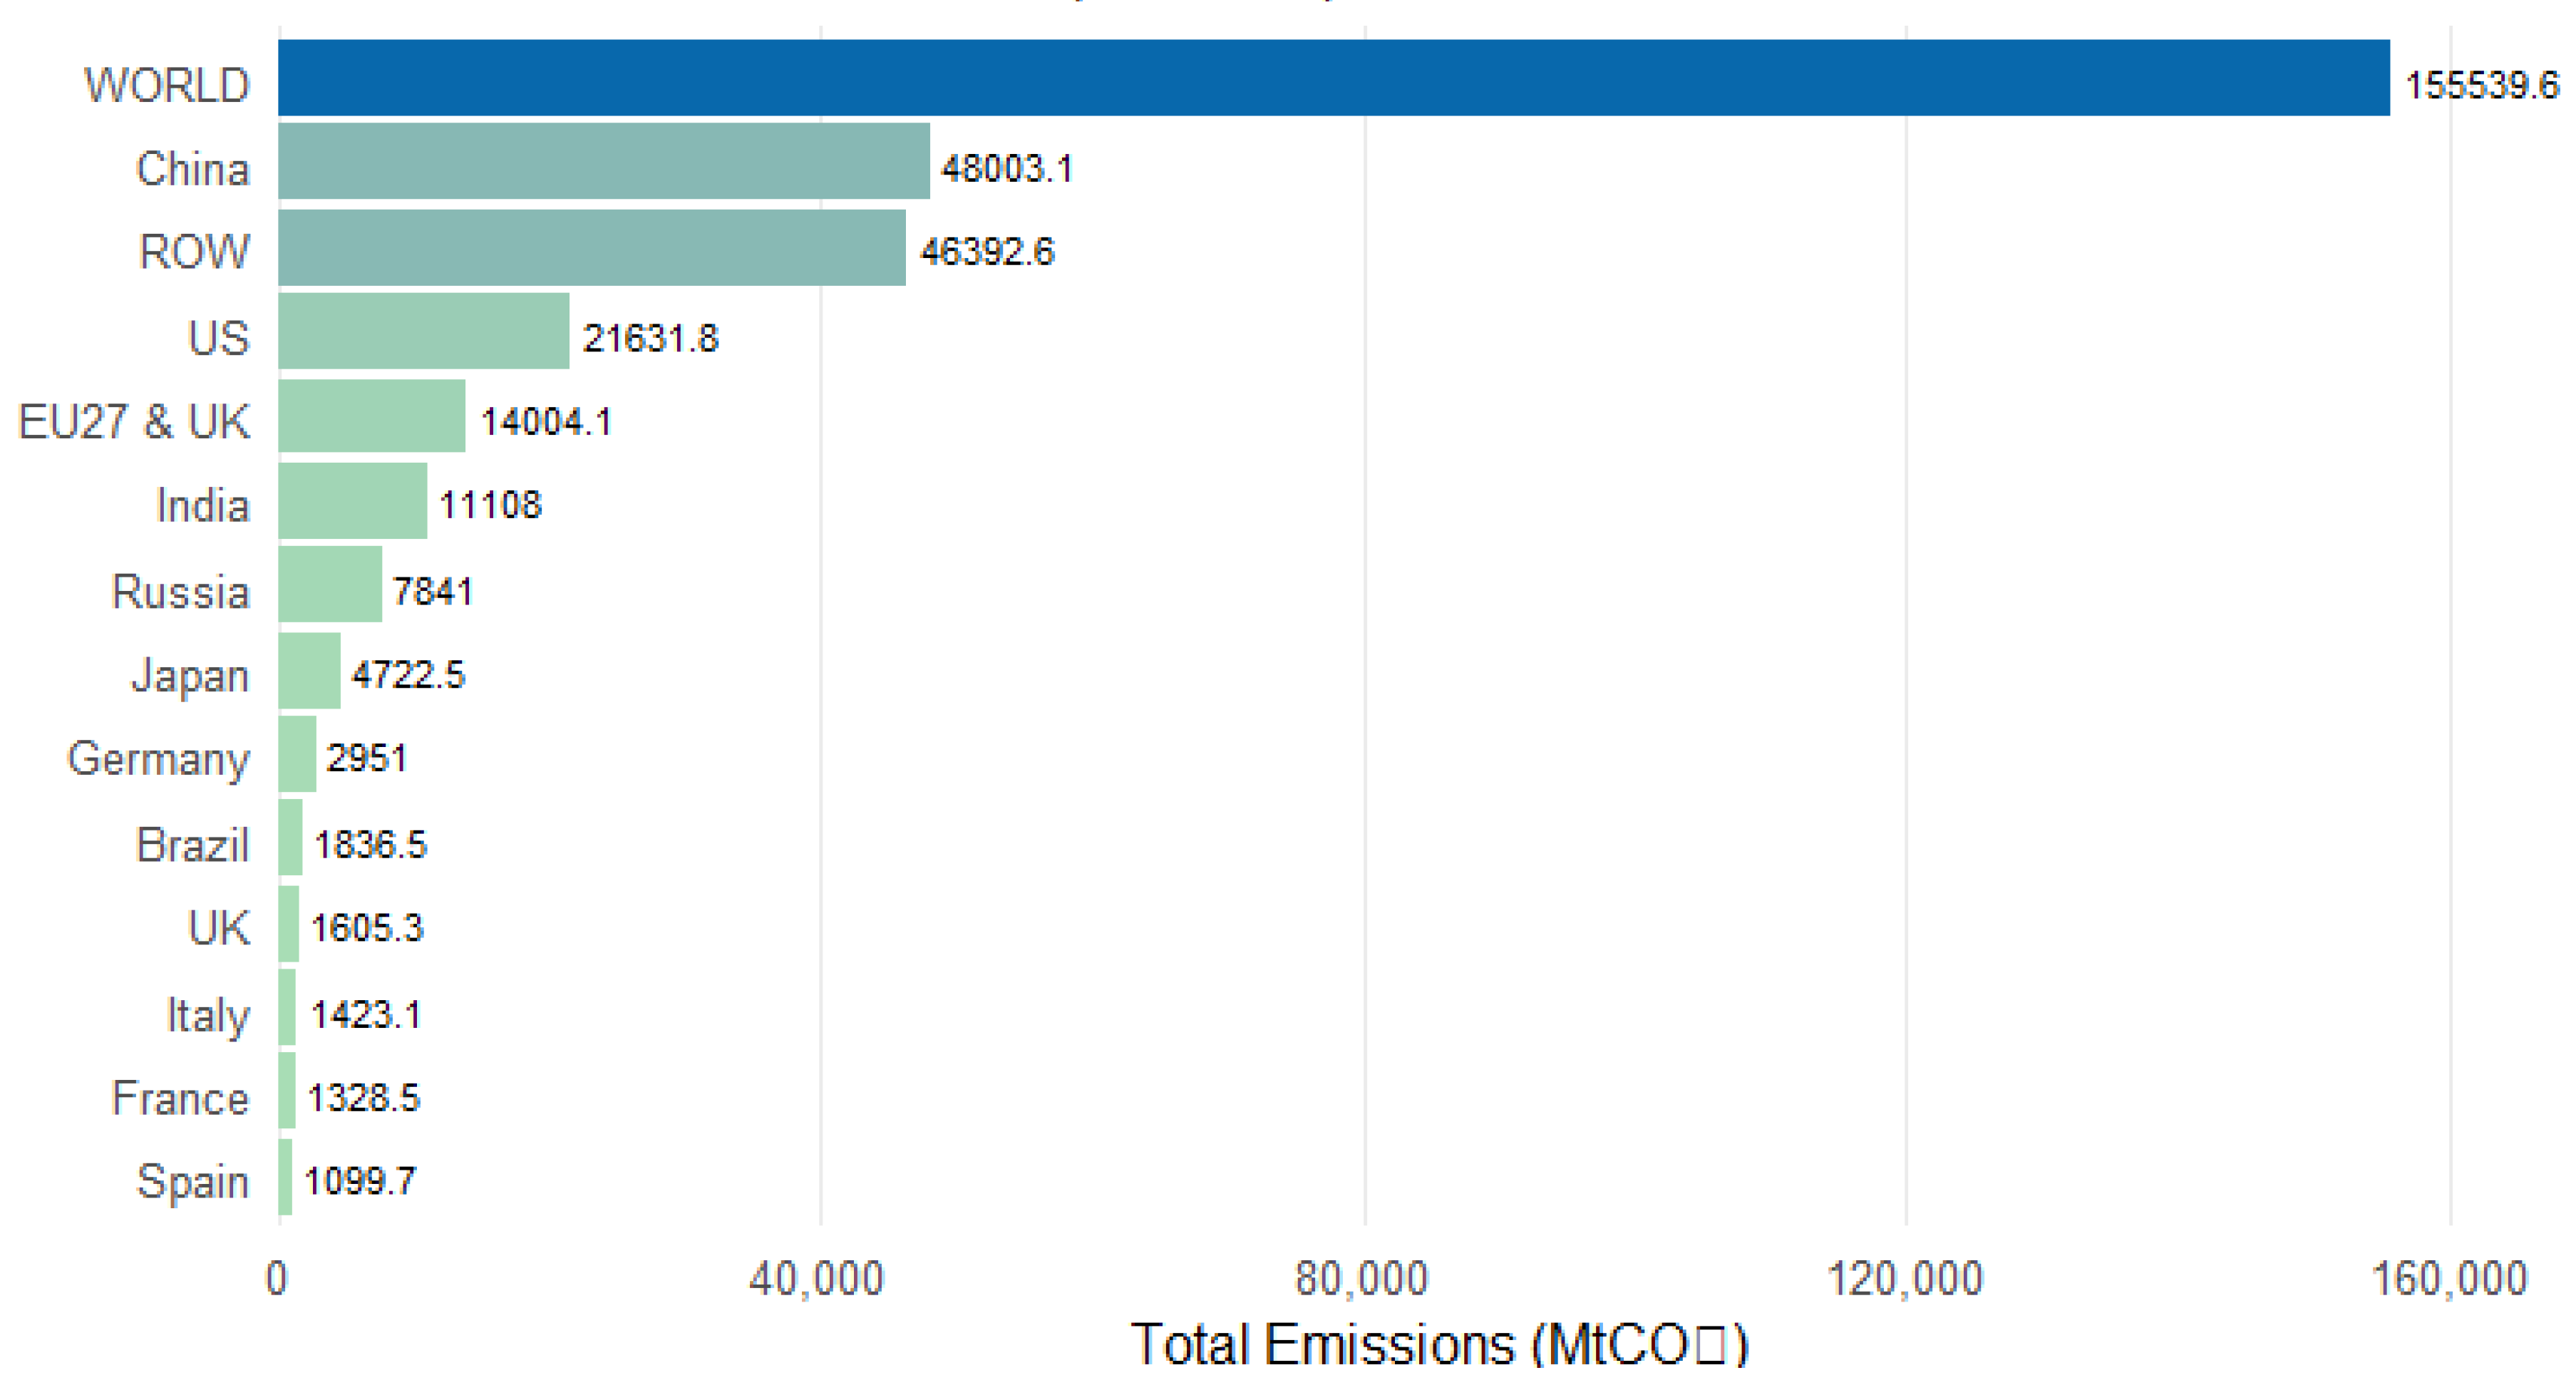
Figure 2.
Comparison of CO₂ Emission Trends between Major Sectors.
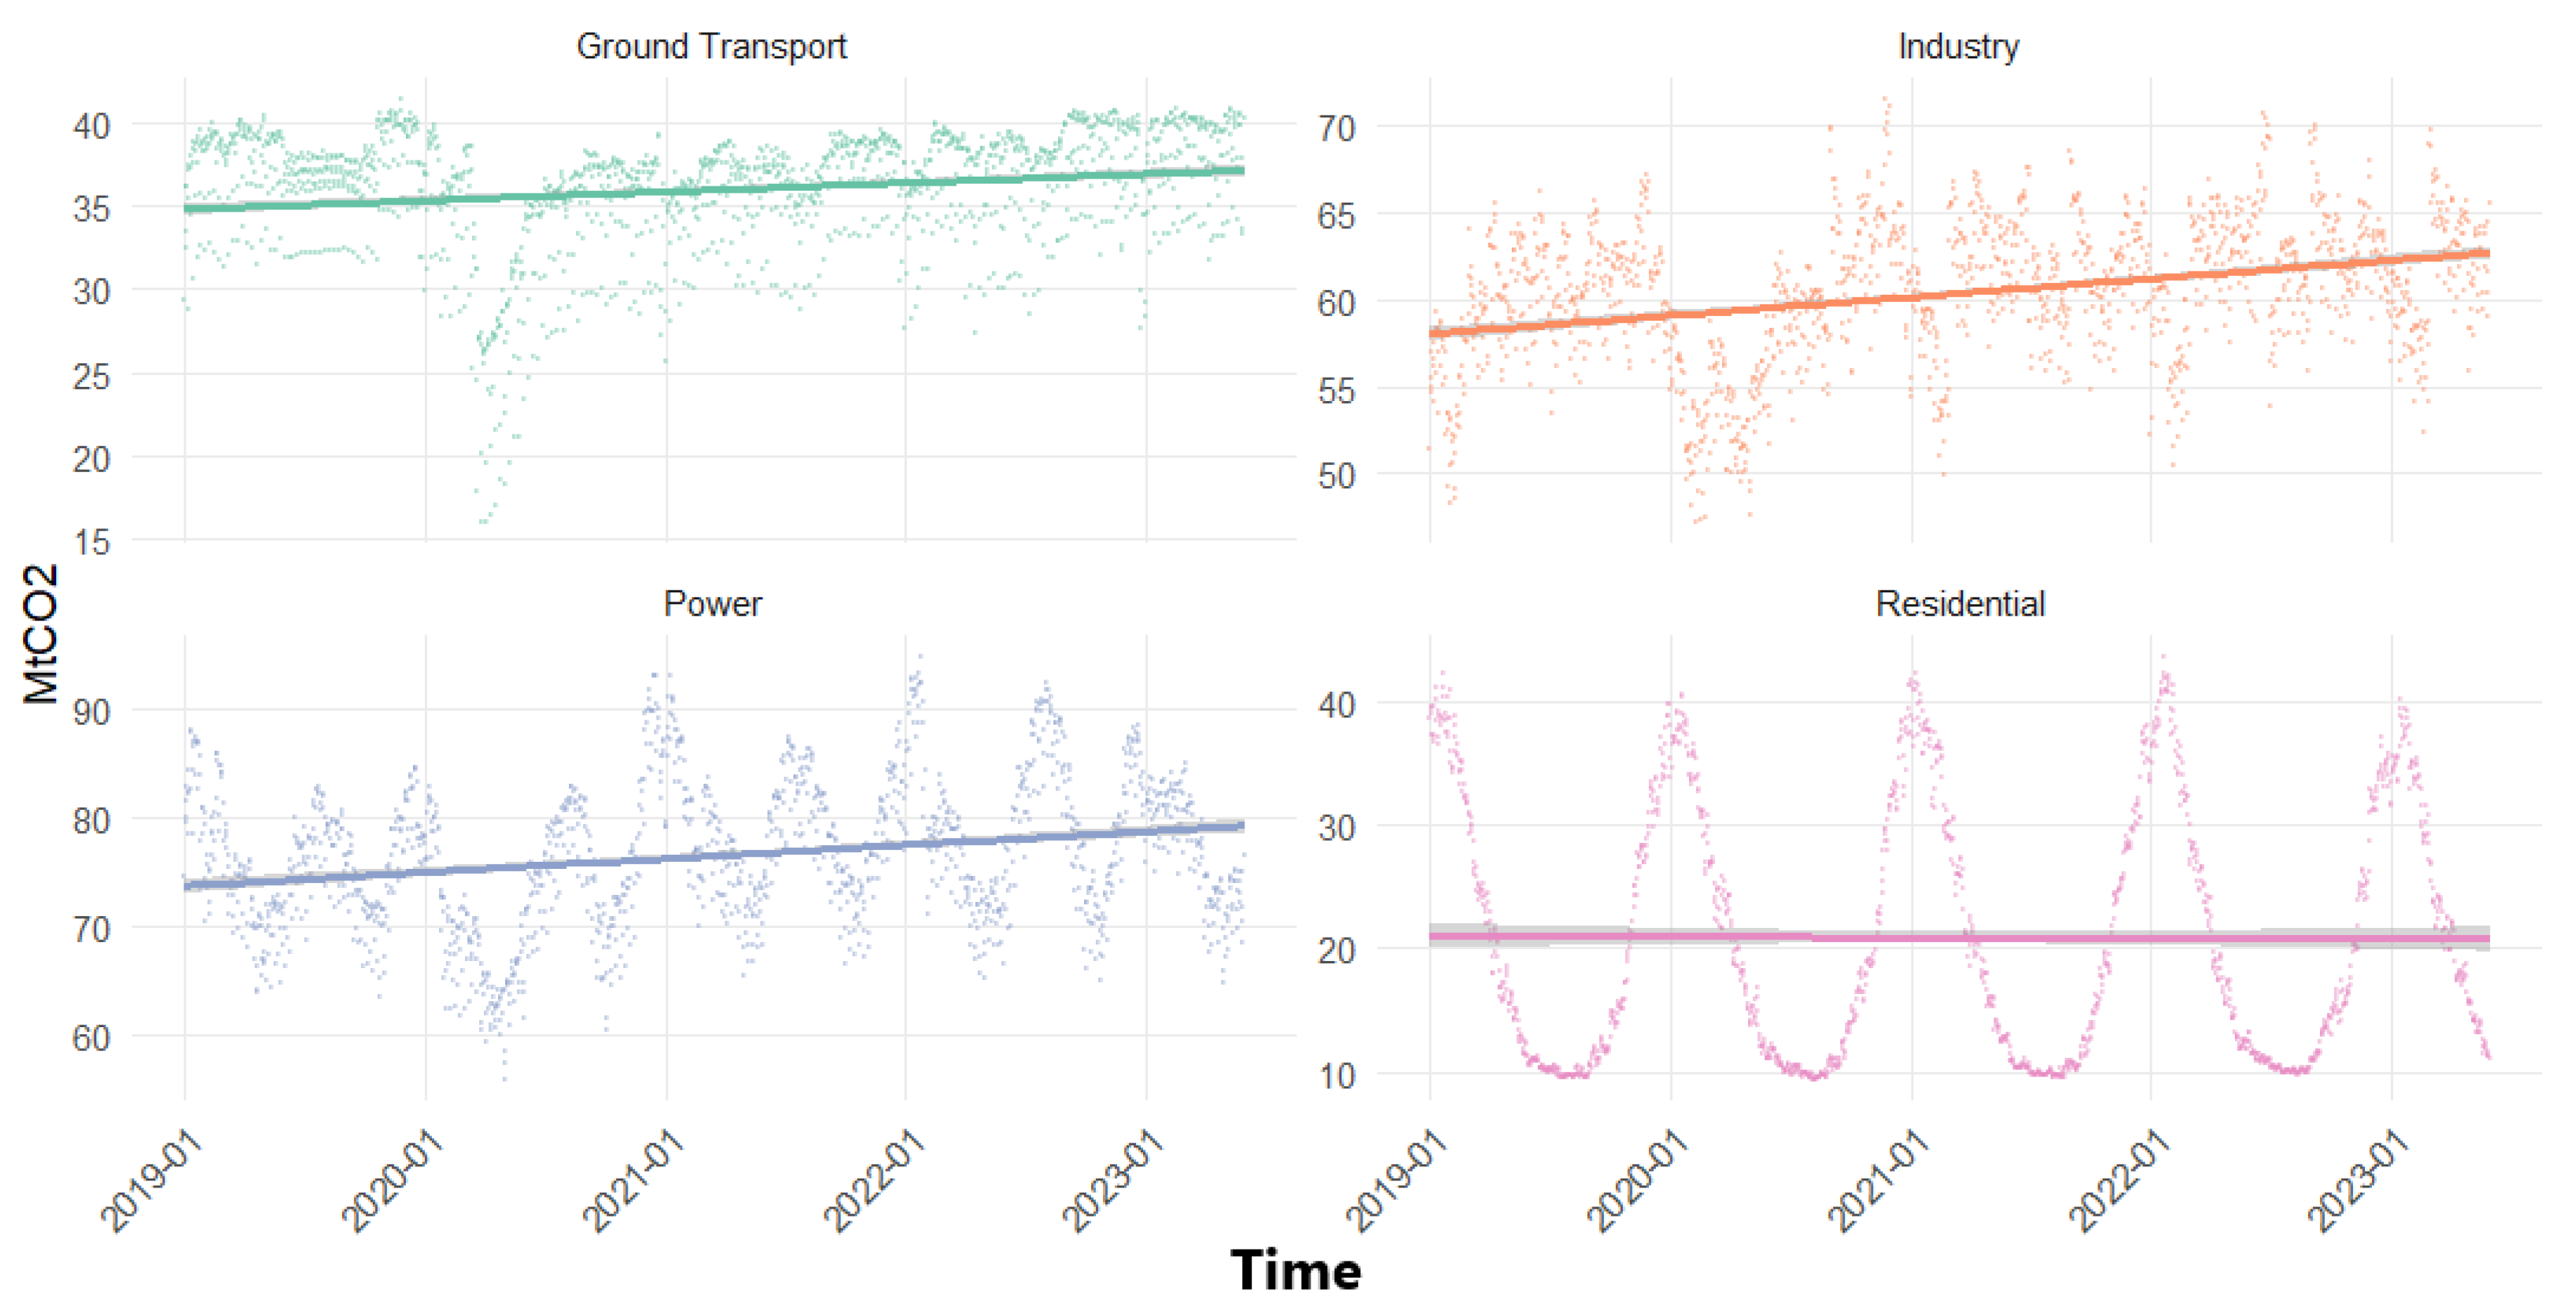
Figure 3.
Comparison of Total CO₂ Emissions across Economic Sectors and their Proportion to National Emissions.
Figure 3.
Comparison of Total CO₂ Emissions across Economic Sectors and their Proportion to National Emissions.
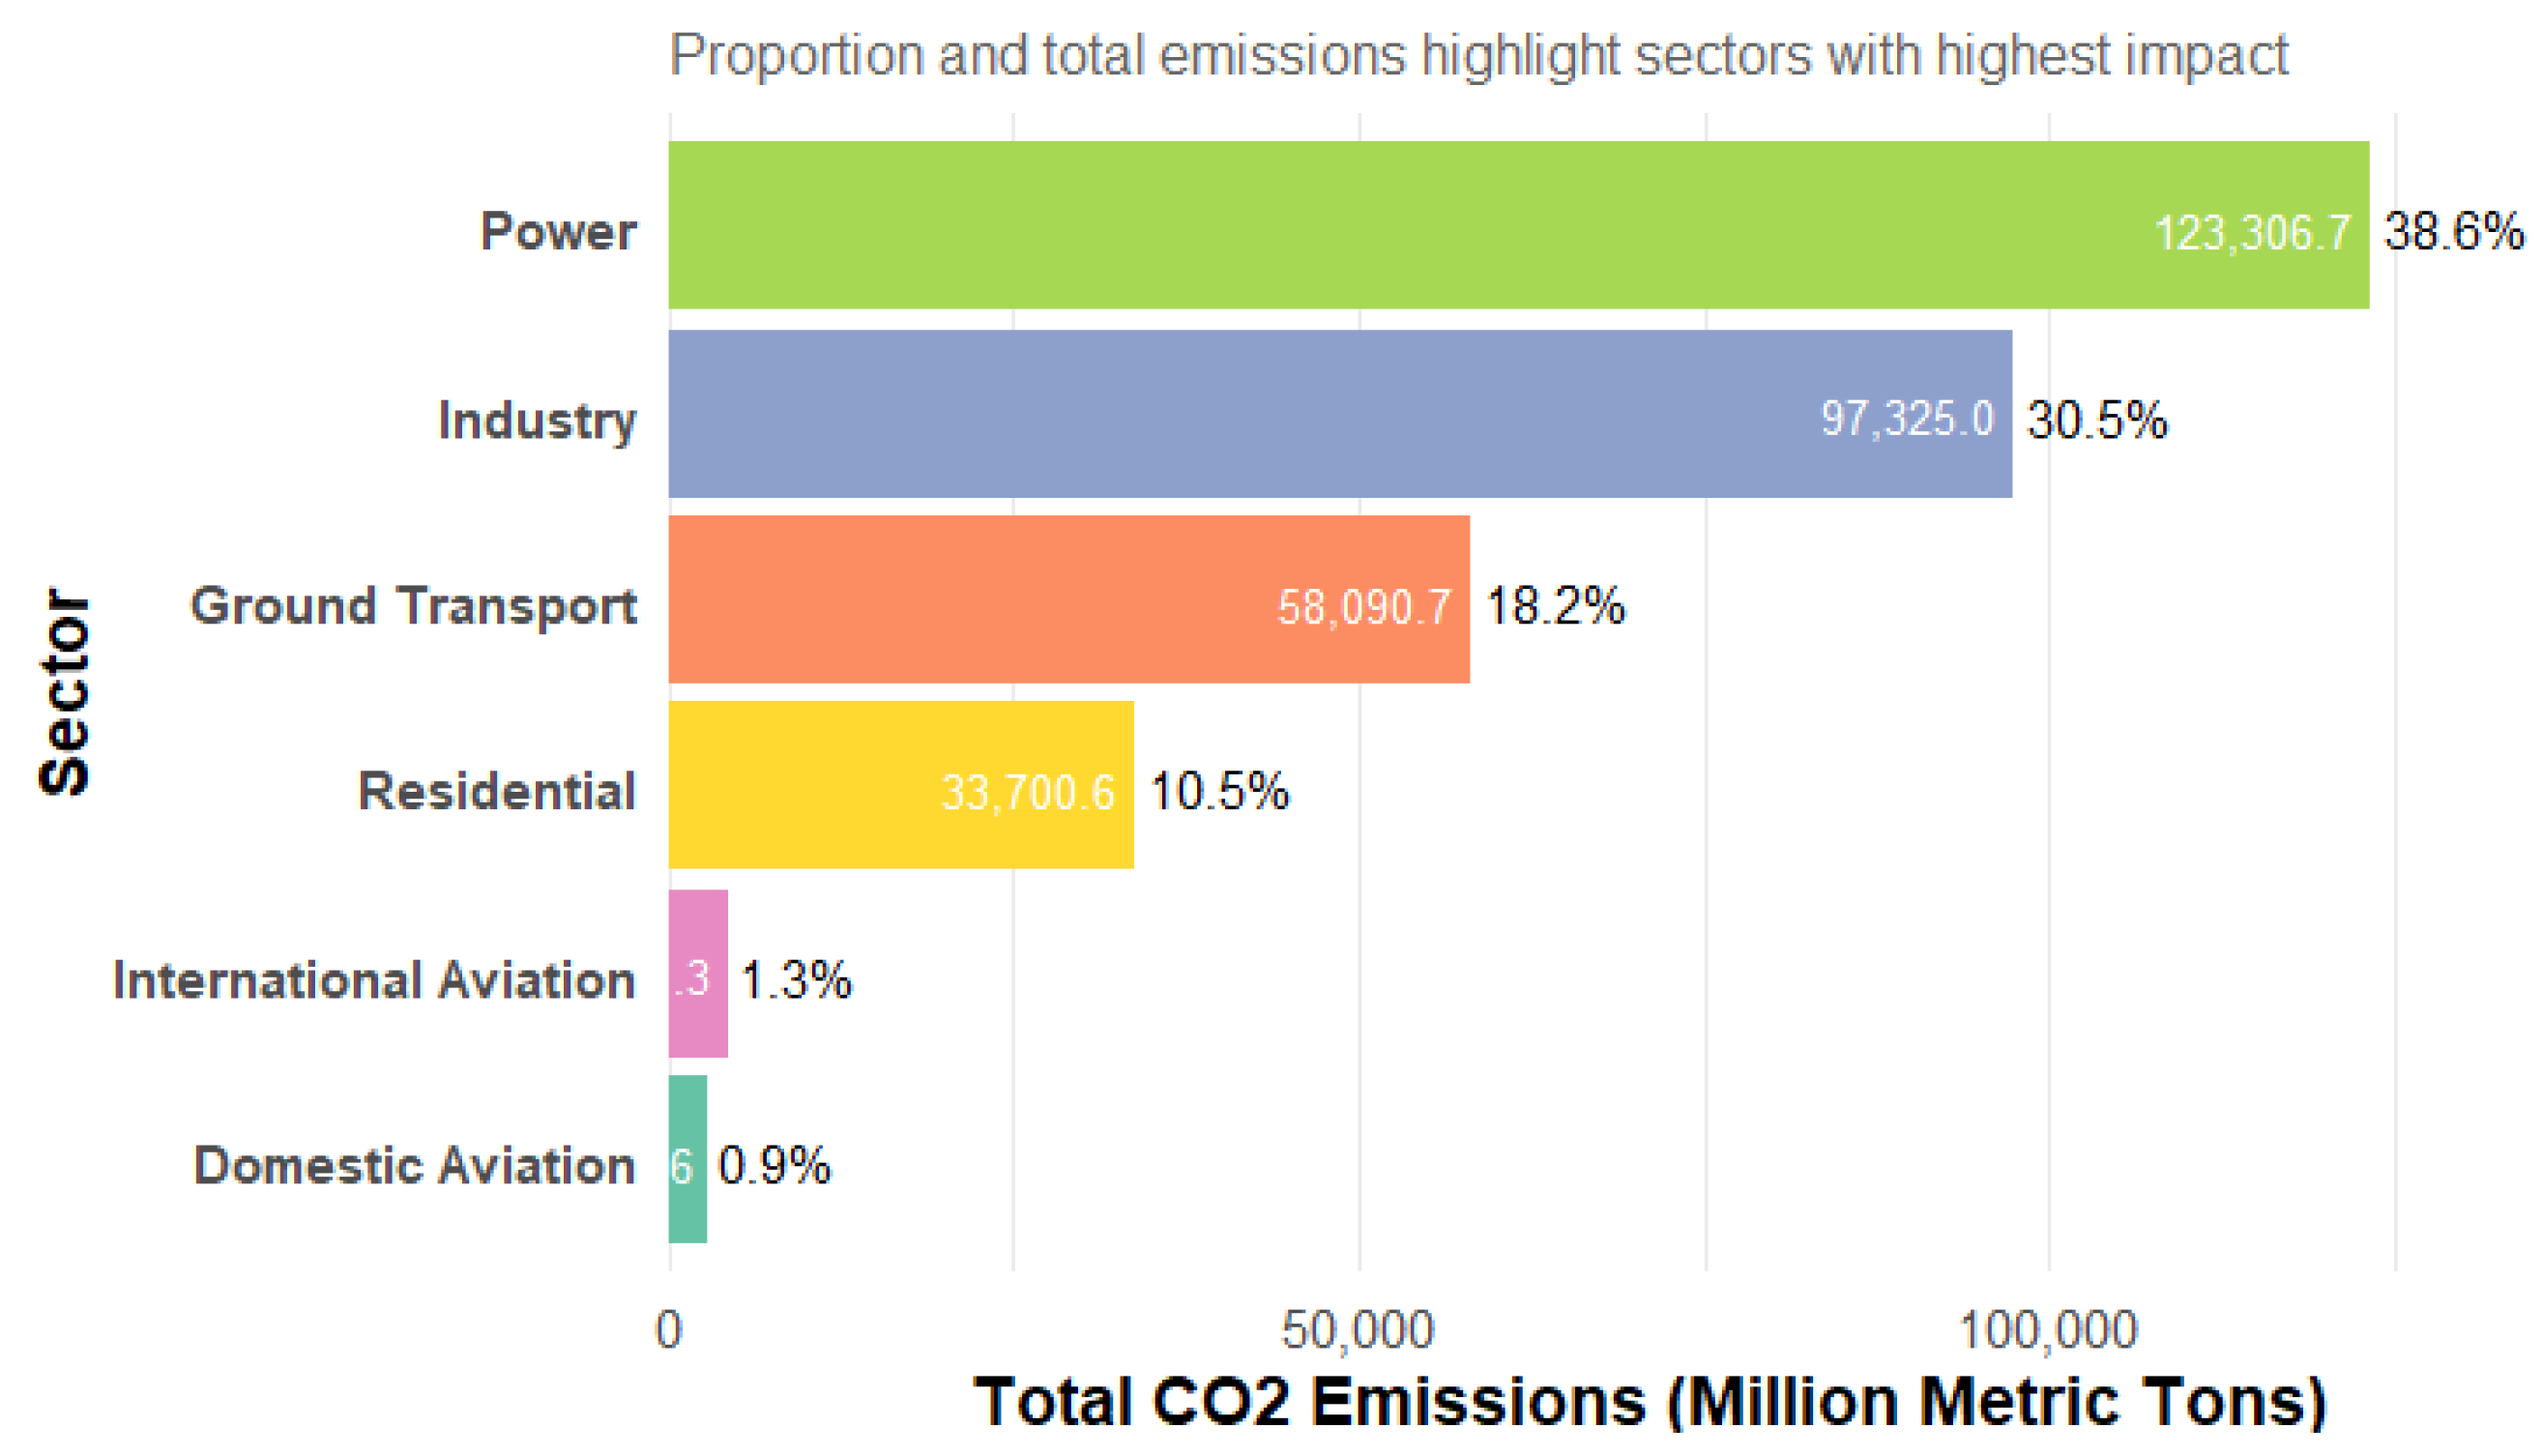
Figure 4.
Comparison between Highest and Lowest Emitting Countries (Loess Trend Line).
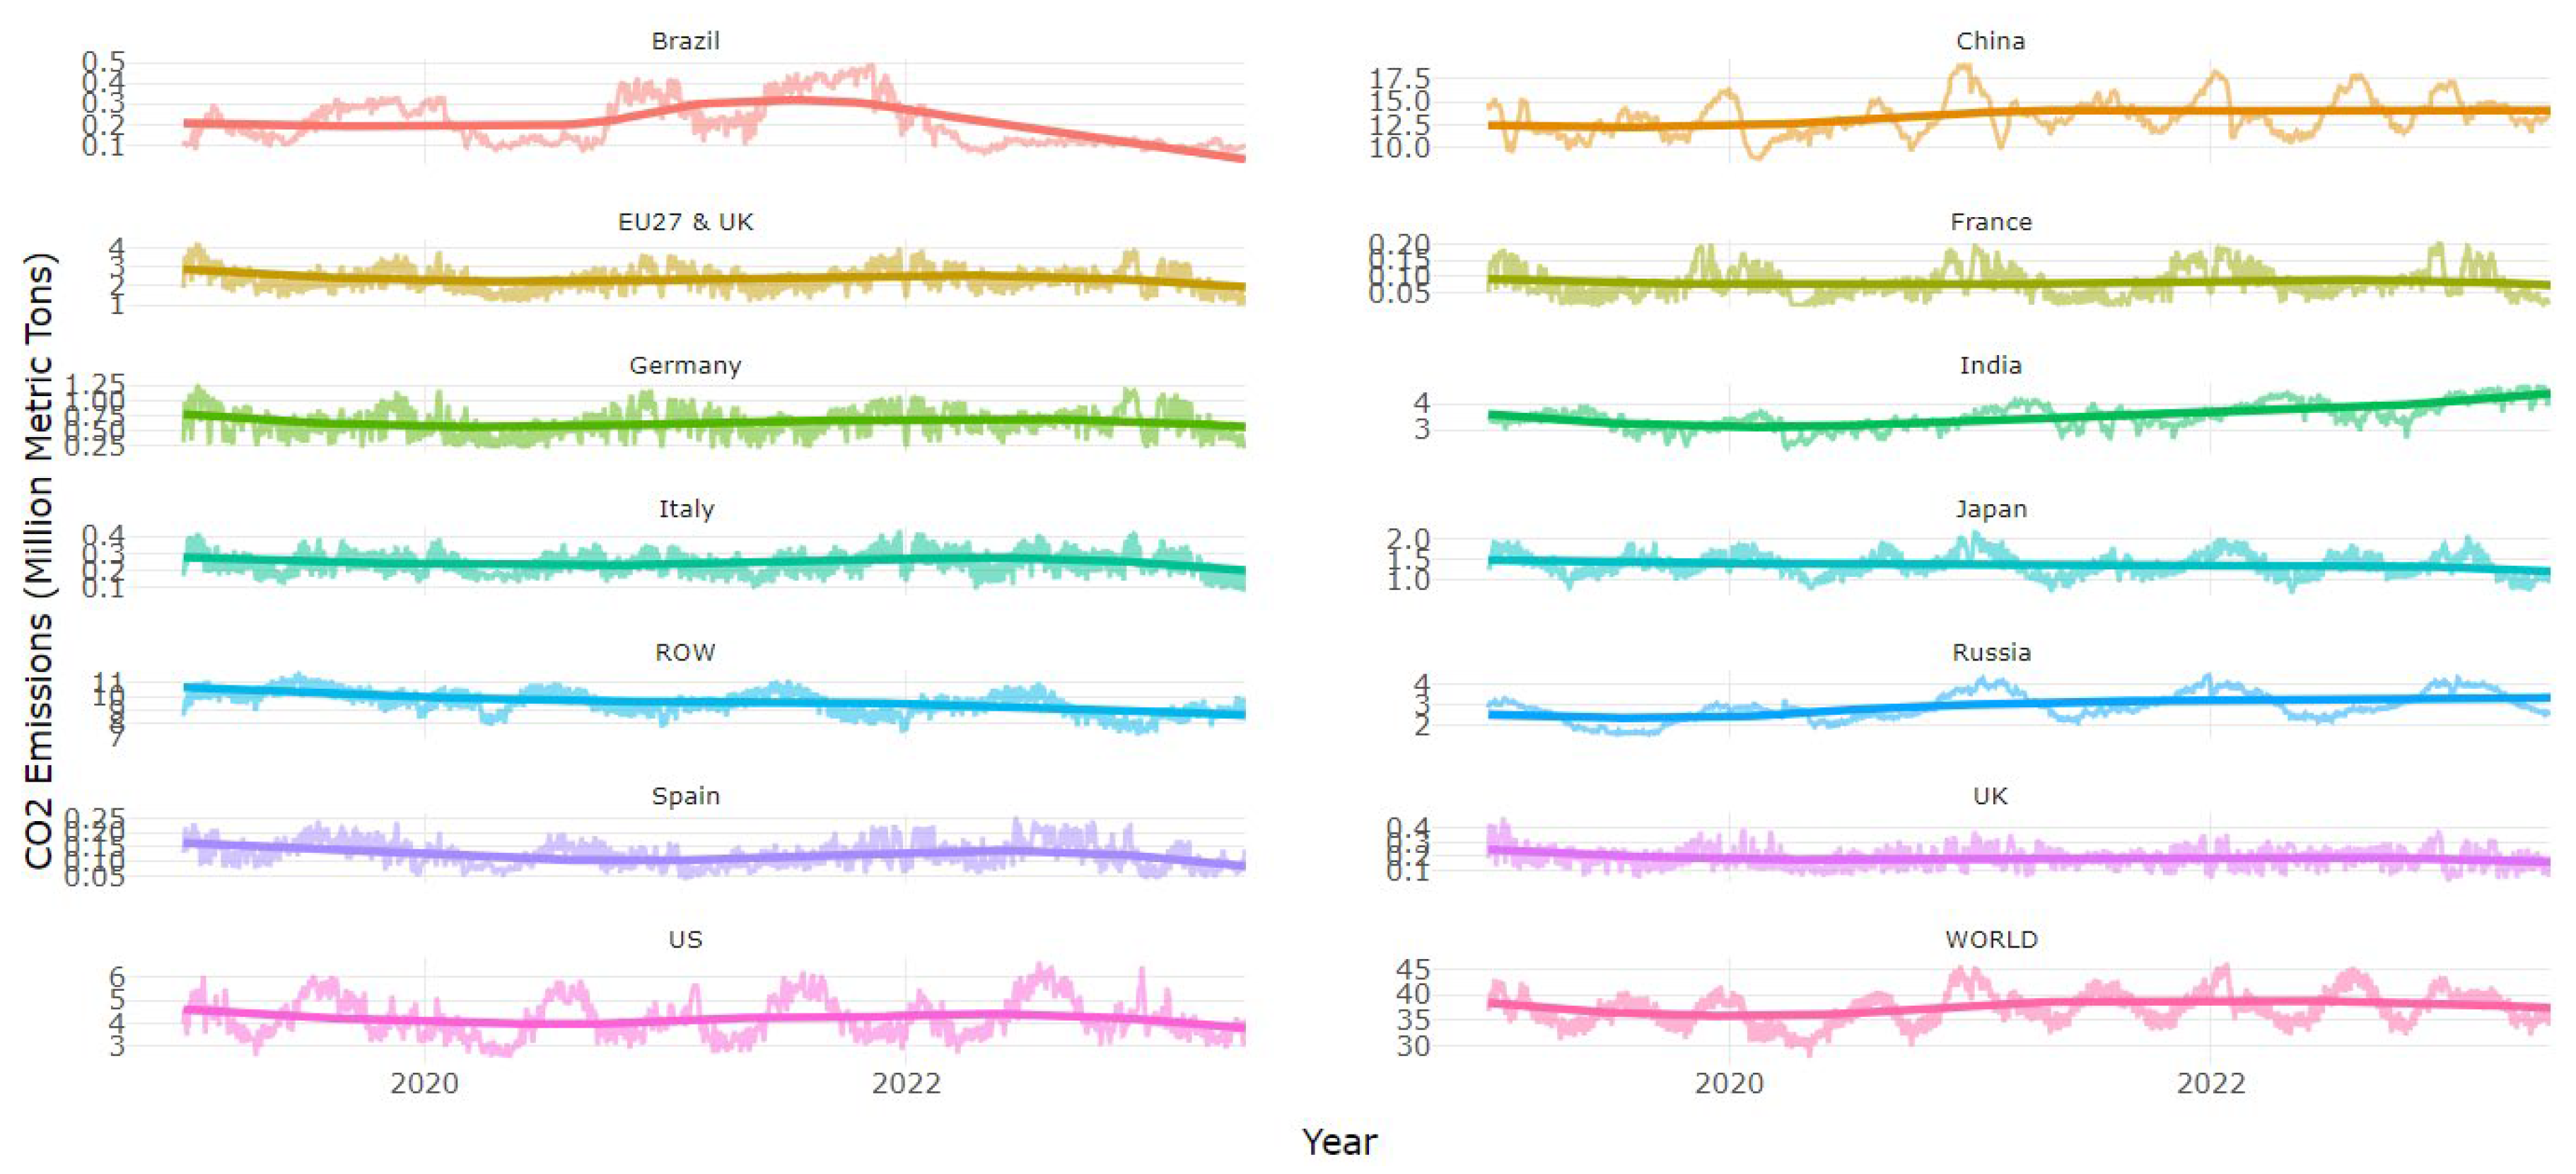
Figure 5.
Results of Dunn's Post-Hoc Test on Differences in Carbon Emissions between Clusters in Five Major Sectors.
Figure 5.
Results of Dunn's Post-Hoc Test on Differences in Carbon Emissions between Clusters in Five Major Sectors.
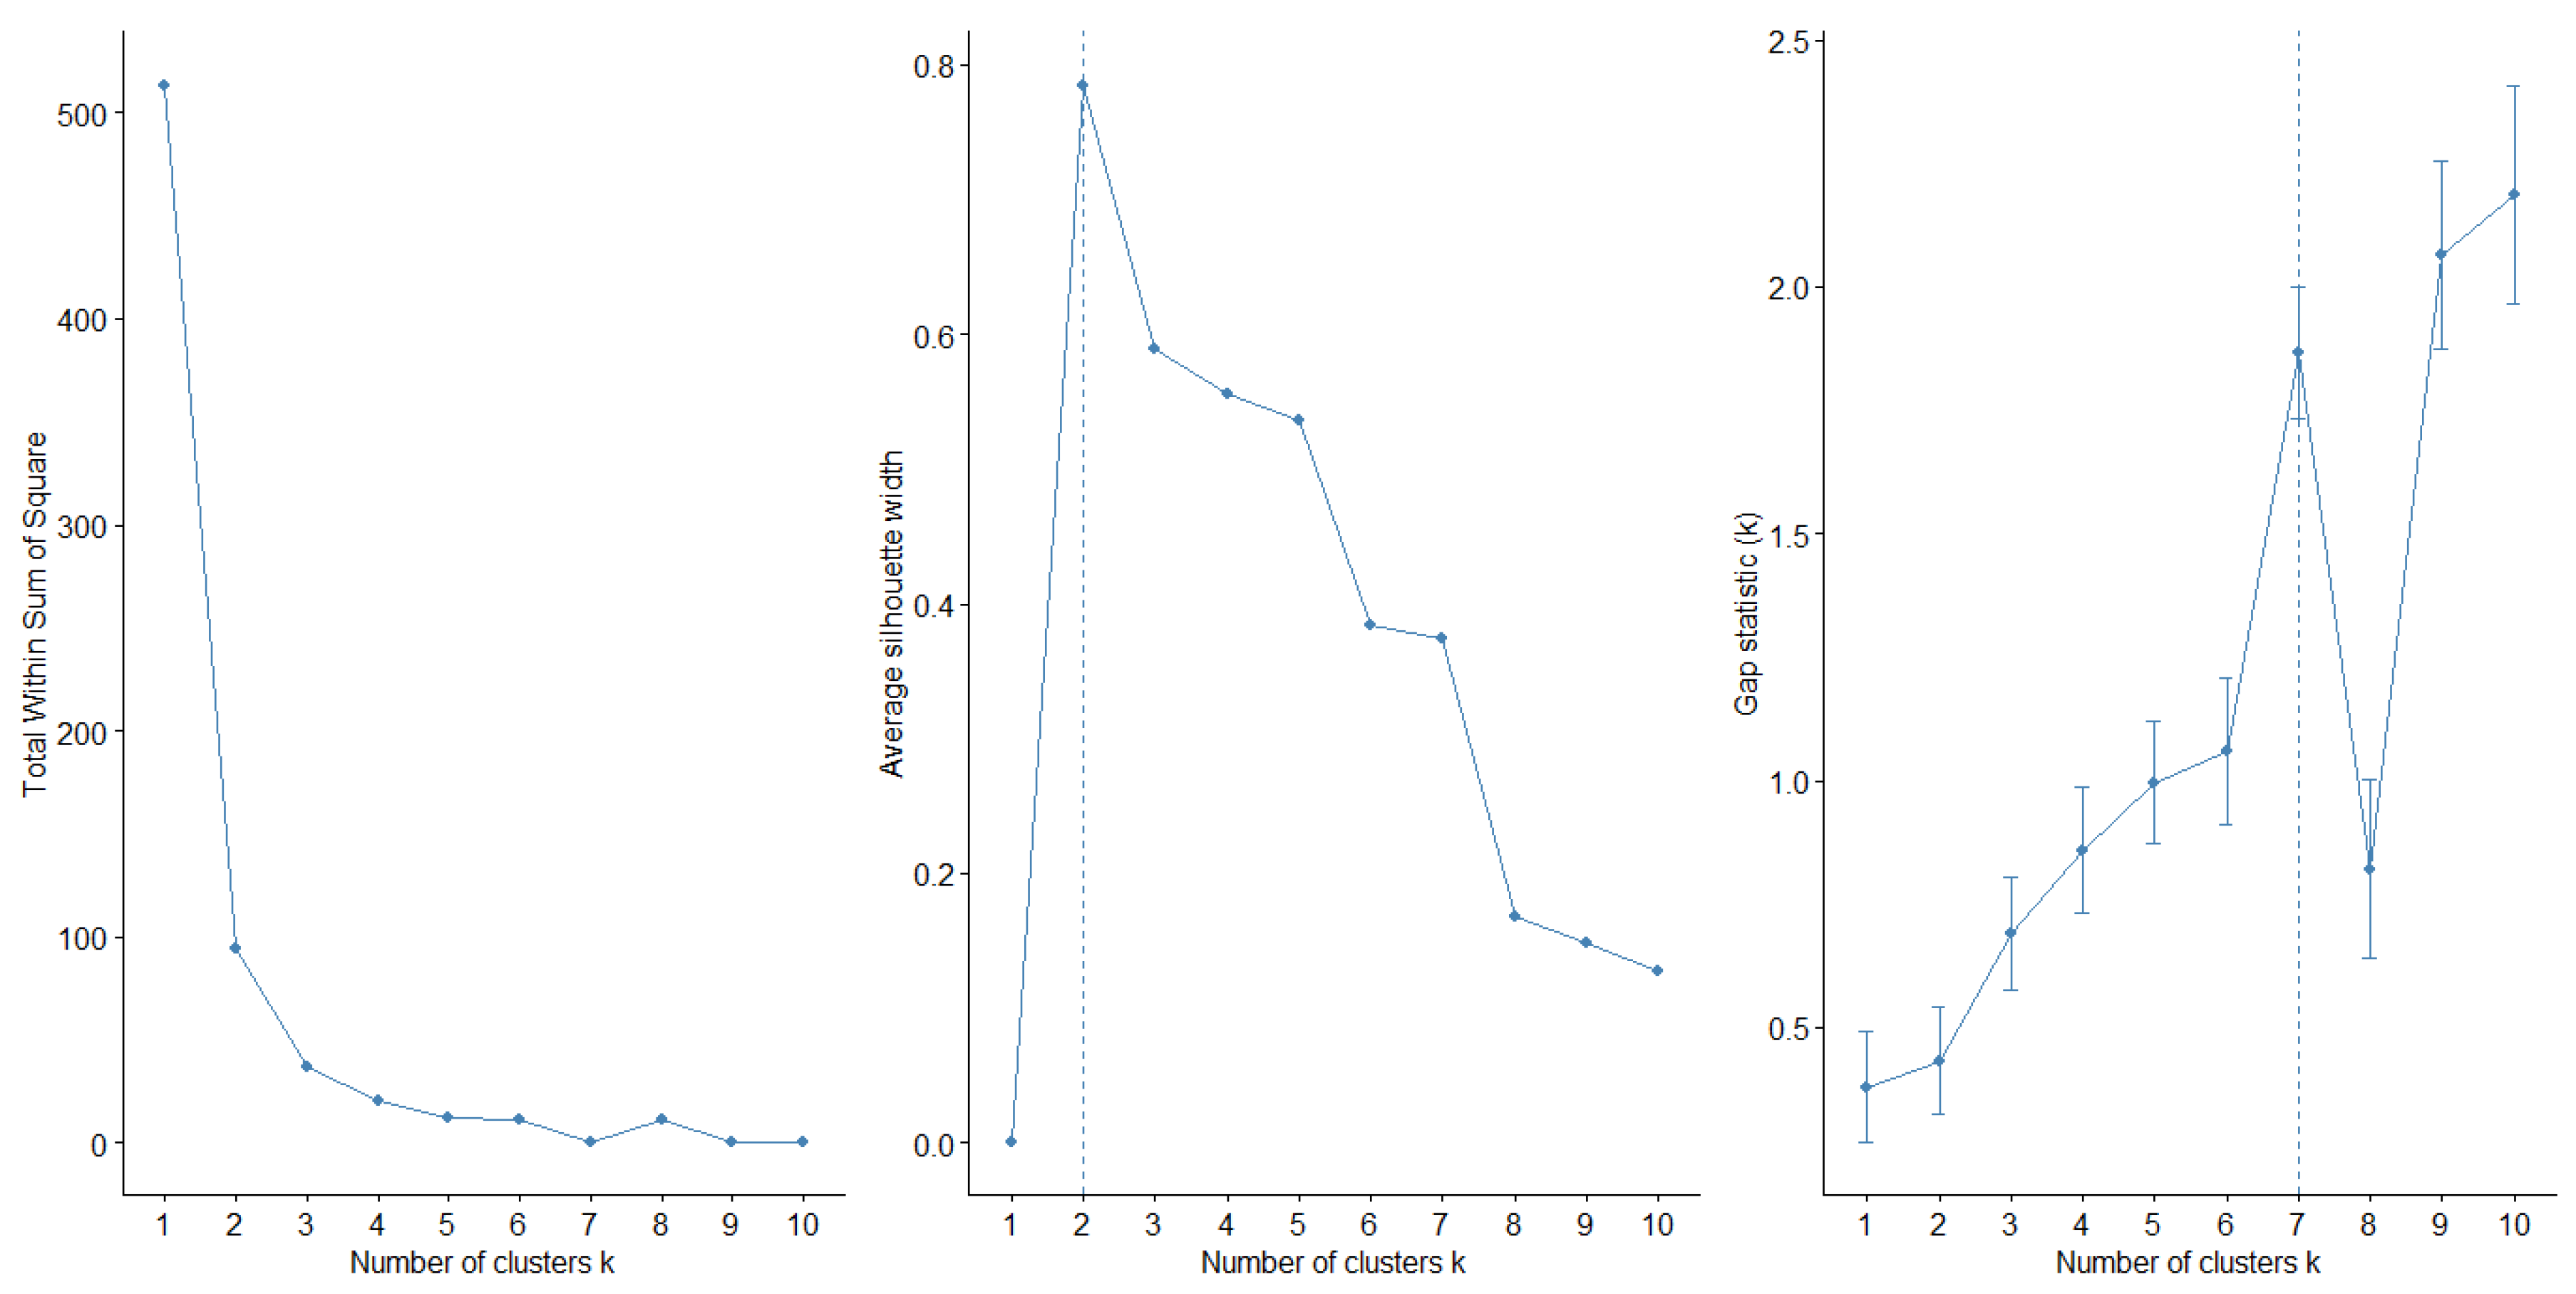
Figure 6.
Clustering Countries Based on Sectoral CO₂ Emission Patterns Using the K-Means Method with Four Optimal Clusters.
Figure 6.
Clustering Countries Based on Sectoral CO₂ Emission Patterns Using the K-Means Method with Four Optimal Clusters.
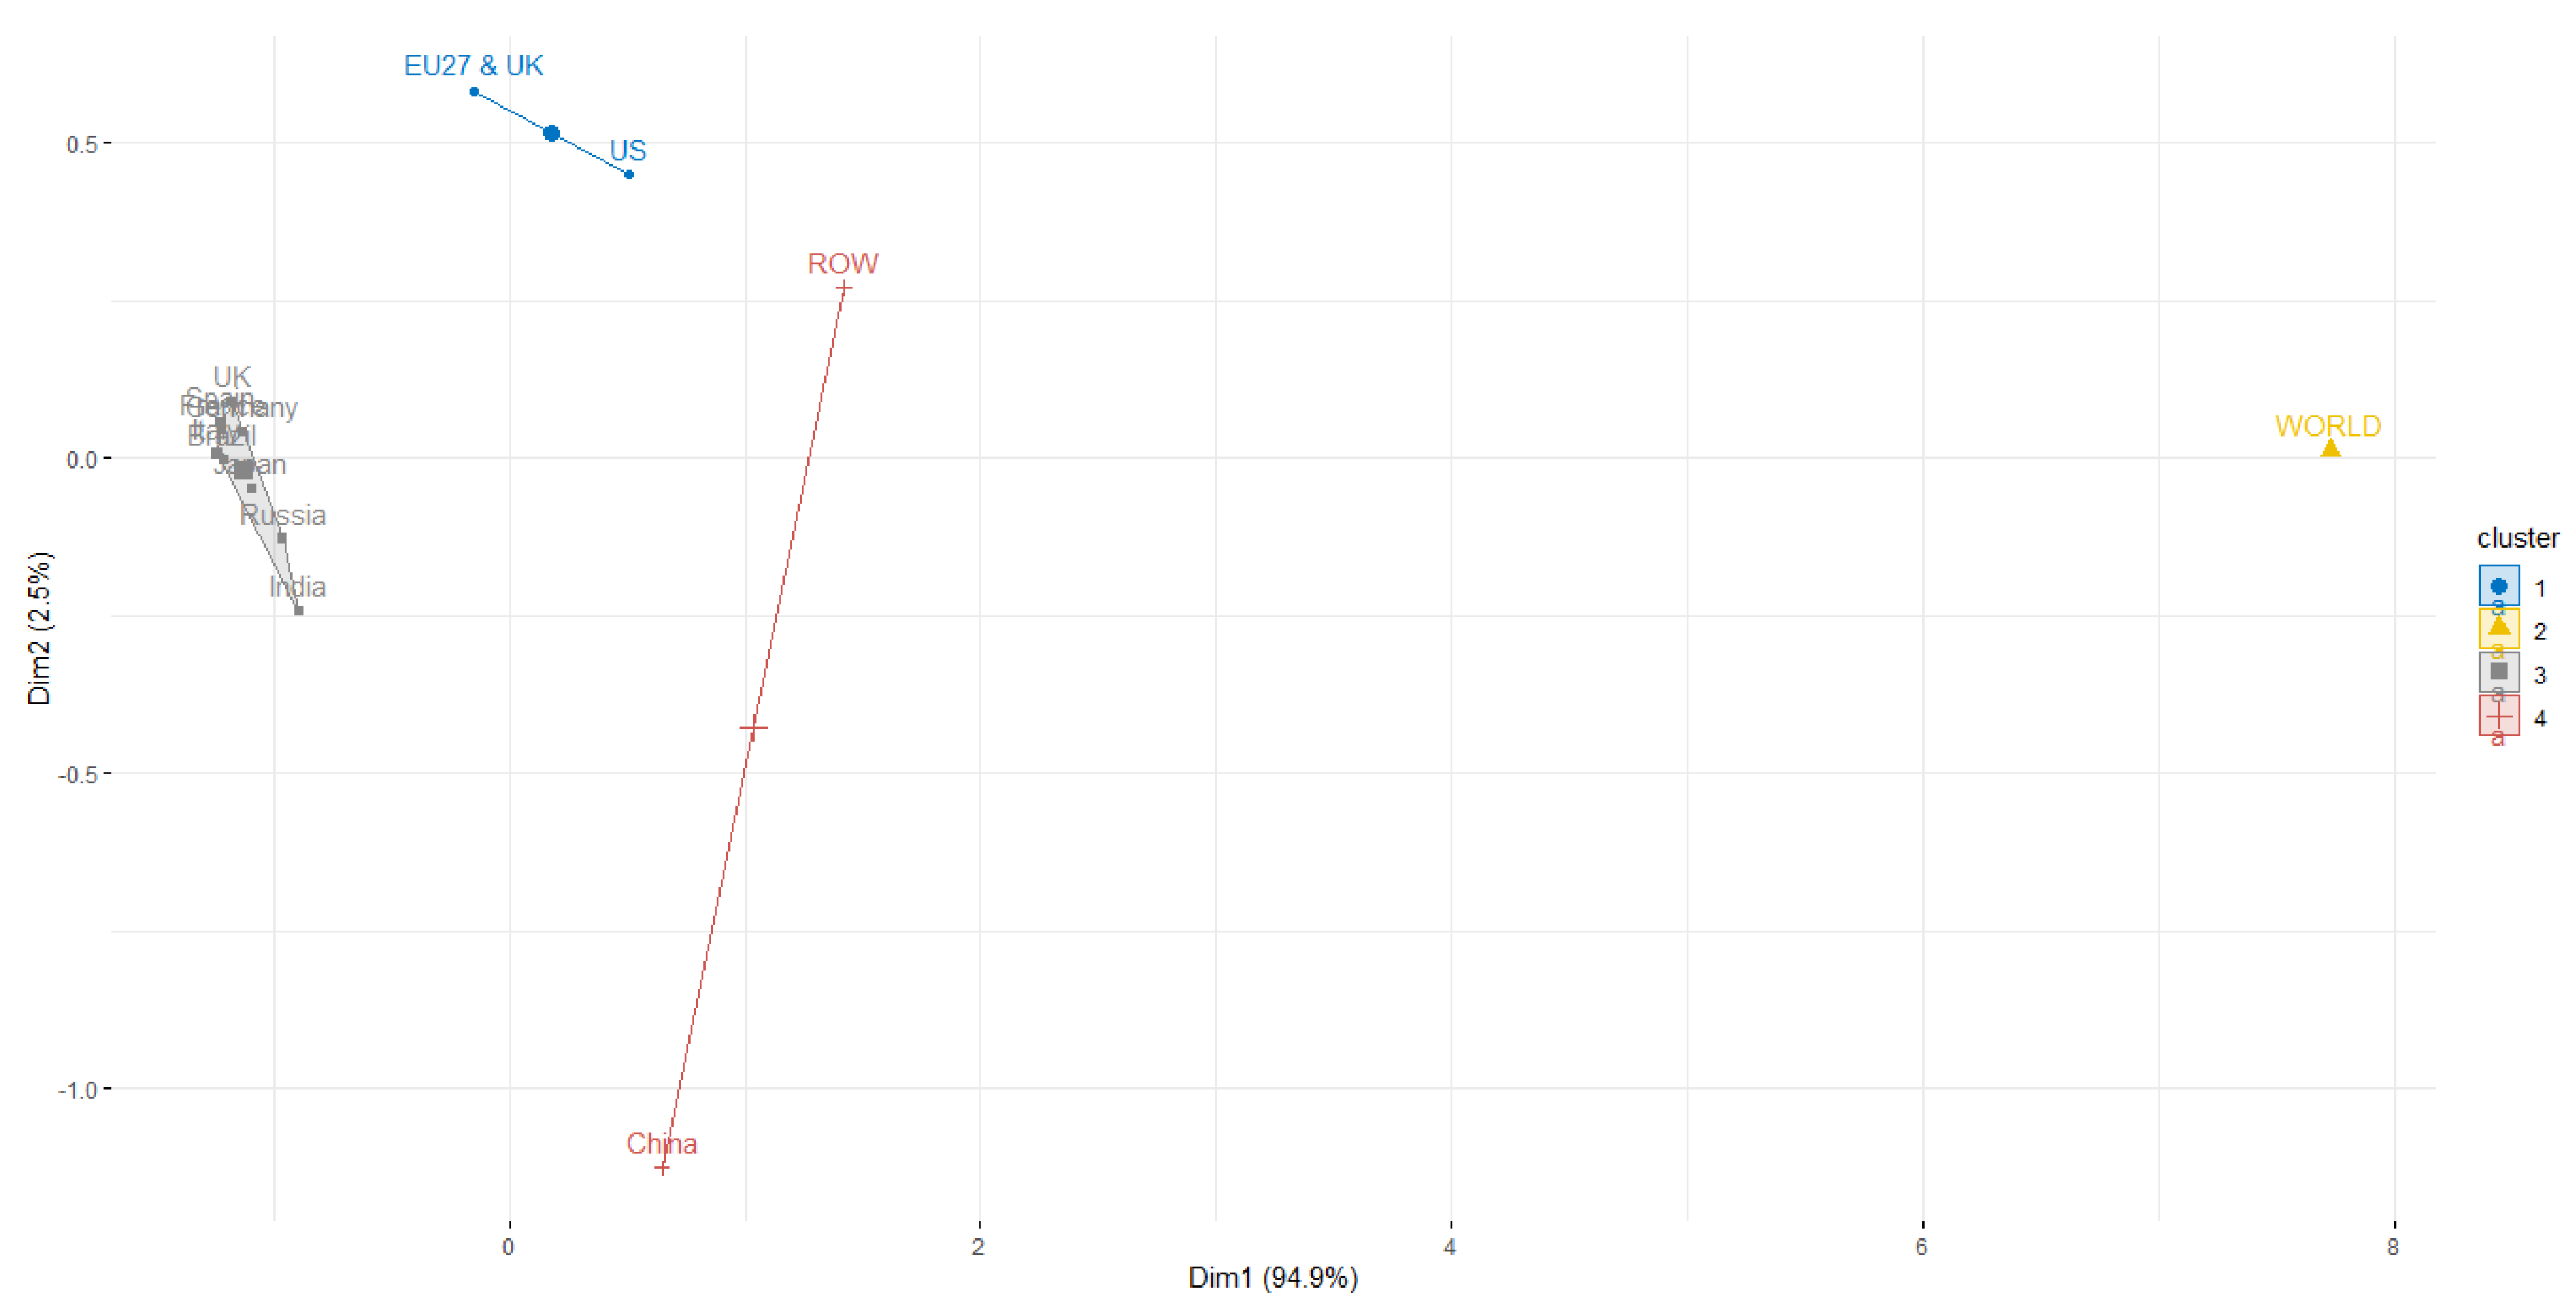

Table 1.
Linear Regression Results of CO₂ Emission Trends by Sector.
| Sector | Coefficient Estimation | Standard Error | Statistics t | P-value | Significance Level |
|---|---|---|---|---|---|
| Ground Transport | 1.69 × 10⁻⁸ | 2.24 × 10⁻⁹ | 7.54 | 8.00 × 10⁻¹⁴ | (p < 0.001) |
| Industry | 3.36 × 10⁻⁸ | 2.37 × 10⁻⁹ | 14.2 | 4.50 × 10⁻⁴³ | (p < 0.001) |
| Power | 3.97 × 10⁻⁸ | 4.02 × 10⁻⁹ | 9.87 | 2.48 × 10⁻²² | (p < 0.001) |
| Residential | -1.88 × 10⁻⁹ | 6.24 × 10⁻⁹ | -0.301 | 0.763 | ns (not significant) |
Table 2.
CO₂ Emission Trends by Sector and Implications for Carbon Neutrality Strategies.
| Sector | CO₂ Emissions Trends | Interpretation for Carbon Neutrality |
|---|---|---|
| Power | Significant increase | Electricity generation sector still dependent on fossil fuels, need for rapid and efficient renewable energy transition. |
| Industry | Significant sharp increase | Industrial activities trigger high emission increases, need energy efficiency and green technology to reduce emissions. |
| Ground Transport | Significant increase | Land transportation contributes to rising emissions, it is important to accelerate the adoption of electric vehicles and sustainable transportation. |
| Residential | Not significant, tends to decrease | Residential sector emissions relatively stable, potential for household energy efficiency to be maintained and improved. |
Table 3.
ANOVA Results for Comparison of Average CO₂ Emissions between Major Sectors.
| Source of Variation | Df | Sum Sq | Mean Sq | F value | Nilai p (Pr > F) | Significant |
|---|---|---|---|---|---|---|
| Sector | 5 | 540,629 | 108,126 | 3,497 | < 2 × 10⁻¹⁶ | Highly significant |
| Residual | 135,402 | 4,186,611 | 31 |
Table 4.
Distribution of Carbon Emissions by Sector across Countries and Implications for Renewable Energy and Carbon Neutral Policies.
Table 4.
Distribution of Carbon Emissions by Sector across Countries and Implications for Renewable Energy and Carbon Neutral Policies.
| Sector/Country | Emissions Dominance | Implications for Renewable Energy and Policy |
|---|---|---|
| Industri | Major contributor to carbon emissions, especially in China and ROW. | Focus on transforming the industrial sector through low-carbon technology and efficiency. |
| Power Generation | Emissions are largest in almost all countries, especially China and the US. | It is necessary to accelerate the development of renewable energy power plants such as wind and solar. |
| Land Transportation | Emissions are significant in countries with high mobility (China, India, US). | The encouragement of electric vehicles and environmentally friendly public transportation is important. |
| Flights (Domestic & International) | Emissions are relatively smaller but growing, the challenge of decarbonization is great. | Sustainable fuel innovation and green aviation technology are needed. |
| Domestic and Residential | Substantial emissions, particularly in China, EU27 & UK, and ROW. | Improved household energy efficiency and use of renewable energy at home. |
Table 5.
Results of Dunn's Post-Hoc Test on Differences in Carbon Emissions between Clusters in Five Major Sectors.
Table 5.
Results of Dunn's Post-Hoc Test on Differences in Carbon Emissions between Clusters in Five Major Sectors.
| Sector | Cluster Pairs with Significant Difference (P.unadj < 0.05) | P.adj | Interpreting |
|---|---|---|---|
| Residential | 3-Feb | 0.1238 | The 3rd cluster is significantly different from the other clusters, suggesting the possibility of more efficient household energy strategies in this cluster. |
| 4-Mar | 0.1309 | ||
| Ground Transport | 3-Feb | 0.1238 | Significant differences show the adoption of low-carbon transportation technologies in the 3rd cluster, such as the use of EVs and green infrastructure. |
| 4-Mar | 0.1939 | ||
| Industry | 3-Feb | 0.1315 | Differences indicate industrial transformation in cluster 3, possibly through energy efficiency or the use of biomass/renewables as substitutes. |
| 4-Mar | 0.1431 | ||
| Domestic Aviation | 3-Feb | 0.2629 | The 3rd cluster tends to have a more efficient domestic air transportation system or has implemented more active carbon mitigation policies. |
| 4-Mar | 0.1522 | ||
| Power | 3-Feb | 0.1396 | The 3rd cluster shows higher adoption of renewable energy in the electricity generation sector, such as solar and wind power. |
| 4-Mar | 0.1563 |
Disclaimer/Publisher’s Note: The statements, opinions and data contained in all publications are solely those of the individual author(s) and contributor(s) and not of MDPI and/or the editor(s). MDPI and/or the editor(s) disclaim responsibility for any injury to people or property resulting from any ideas, methods, instructions or products referred to in the content. |
© 2025 by the authors. Licensee MDPI, Basel, Switzerland. This article is an open access article distributed under the terms and conditions of the Creative Commons Attribution (CC BY) license (http://creativecommons.org/licenses/by/4.0/).
Copyright: This open access article is published under a Creative Commons CC BY 4.0 license, which permit the free download, distribution, and reuse, provided that the author and preprint are cited in any reuse.


