
Submitted:
23 May 2025
Posted:
26 May 2025
You are already at the latest version
Abstract
Background: End-stage kidney disease (ESKD) is a rising global health burden requiring renal replacement therapy, primarily via hemodialysis (HD) or peritoneal dialysis (PD). While both modalities are established treatments, their differential impacts on clinical and biochemical parameters remain underexplored in Gulf region populations. This study aims to provide a comparative evaluation of HD and PD patients after one year of therapy, focusing on anemia management, bone mineral metabolism, and biochemical outcomes.
Methods: This descriptive, observational study included 89 adult ESKD patients un-dergoing either HD or PD for at least one year. Patients with confounding comorbidities or treatment inconsistencies were excluded. Clinical and biochemical data were col-lected at initiation and after one year of dialysis, and subgroup analyses by gender and age were performed. Statistical comparisons included t-tests, Mann-Whitney U, and Pearson correlation.
Results: HD patients had significantly higher hemoglobin levels (10.7 ± 1.7 g/dL vs 9.9 ± 1.8 g/dL, p = 0.038) and bicarbonate levels (p = 0.021), indicating superior anemia and acidosis control. PD patients showed more stable phosphorus levels (p < 0.001), despite higher baseline values in HD patients (p = 0.026). Male and female HD subgroups demonstrated better blood urea nitrogen (BUN) and phosphorus control compared to PD. A significant inverse correlation between age and phosphorus levels was noted in PD patients (r = -0.388, p = 0.023), suggesting age-dependent phosphate metabolism.
Conclusions: This study reveals clinically relevant differences between HD and PD outcomes in a Gulf-region cohort. HD offers advantages in hemoglobin and BUN con-trol, while PD provides better phosphorus regulation. Age and gender influence treatment efficacy, underscoring the importance of individualized dialysis modality selection in ESKD management.
Keywords:
ESKD
; hemodialysis
; peritoneal dialysis
; renal replacement therapy
; anemia
; hyperphosphatemia
; gulf region
1. Introduction
End-Stage Renal Disease (ESRD) represents the most severe form of Chronic Kidney Disease (CKD) [1]. The primary causes of ESRD include renal damage from conditions such as glomerulonephritis, diabetic nephropathy, hypertensive arteriole sclerosis, and polycystic kidney disease, leading to nearly complete and irreversible loss of renal function [3]. This results in the accumulation of metabolic waste and toxins, often causing symptoms such as anemia, uremia, nausea, vomiting, poor appetite, skin itching, ammonia odor, and edema [3]. The estimated incidence of ESRD is currently 373.4 per million per year, posing a significant economic burden on patients and the healthcare system [3]. Hemodialysis (HD) and peritoneal dialysis (PD) are the primary renal replacement therapies used to treat ESRD. In patients undergoing PD, there is a significant decrease in iPTH levels compared to those undergoing HD, although both treatments result in a decrease in iPTH levels after dialysis [1]. Both HD and PD patients experience an increase in albumin levels compared to pre-dialysis values, with HD patients showing significantly higher levels than those on PD, although these levels remain lower than normal [1,3]. Blood pressure management also differs between the two modalities; both HD and PD patients exhibit reductions in systolic and diastolic blood pressure after dialysis, but PD patients tend to have significantly lower blood pressure levels compared to those on HD [1,2]. Fluid overload, a common and serious issue in both HD and PD patients, can lead to severe complications [2]. Cardiovascular diseases remain the leading cause of morbidity and mortality among ESRD patients, with HD patients generally presenting higher blood pressure levels compared to those on PD [2]. Although there are changes in levels of albumin, hemoglobin (Hb), and sodium (Na) in both groups, these differences are not significant [2]. Both HD and PD lead to decreases in serum creatinine, BUN, and PTH levels, but no significant difference is observed between the groups; however, PD patients do experience a significant increase in Glomerular Filtration Rate (GFR) compared to HD patients [3]. While calcium (Ca) and hemoglobin (Hb) levels increase in both groups, these changes do not differ significantly between the two [3]. The impact of ESRD and its treatments on health-related quality of life (HRQoL) is significant, with both dialysis methods presenting limitations [6]. HD remains the most common form of dialysis globally, with PD also being widely used [8]. The choice between HD and PD often depends on various factors, including demographic, medical, and geographic considerations [5]. While both modalities are effective in treating ESRD, they have distinct effects on various clinical parameters, making the choice between them highly dependent on individual patient needs and conditions. Biochemical markers play a critical role in the diagnosis, monitoring, and management of CKD and ESRD. Serum creatinine remains the most commonly used biomarker for estimating renal function, but it is not without limitations, including variability due to muscle mass and tubular secretion [9]. Alternative markers like cystatin C offer potential advantages, especially in patients with reduced muscle mass, though they are not yet widely adopted in routine clinical practice [9]. Moreover, urinary markers such as albumin, kidney injury molecule-1 (KIM-1), and neutrophil gelatinase-associated lipocalin (NGAL) are being explored for their ability to detect early kidney damage before traditional markers such as creatinine or BUN become abnormal [9]. These novel markers, although promising, still face limitations in accessibility, cost, and standardization across labs. Despite extensive research on end-stage kidney disease (ESKD), a thorough review of the literature reveals a paucity of studies comparing peritoneal dialysis and hemodialysis patients with respect to the parameters under investigation in our study. To our knowledge, no prior research has comprehensively examined these ESKD parameters across these two patient groups in the Gulf region. Our study aims to fill this gap by conducting a detailed analysis of these parameters, providing insights into the differences and similarities between peritoneal dialysis and hemodialysis patients.
2. Materials and Methods
2.1. Material and Methods
The study employed a descriptive design to evaluate patient outcomes following one year of dialysis treatment. A comprehensive review of medical records was conducted from the initiation of dialysis, with prospective comparisons made at the one-year follow-up. A total of 155 patients undergoing regular dialysis at our center were initially considered; however, 66 patients were excluded based on predefined criteria, including non-end-stage renal disease (ESRD) status, concurrent hemodialysis and peritoneal dialysis, recent changes in dialysis modality, significant cardiovascular events within the past three months, malignancy, non-adherence to dialysis protocols, and active inflammatory conditions. These exclusions were necessary to ensure a homogeneous study population and minimize potential confounding variables. Consequently, 89 patients met the inclusion criteria and were analyzed. Given the descriptive nature of the study, the sample size was considered adequate for assessing trends and outcomes within this patient cohort. The methodology was designed to provide a comprehensive evaluation of dialysis outcomes while maintaining methodological rigor through strict eligibility criteria and prospective follow-up.
2.2. Patient Selection
To ensure the reliability and accuracy of our study, we began by establishing strict eligibility criteria for participant selection. The screening process was guided by both inclusion and exclusion standards, aimed at identifying a homogeneous group of patients with end-stage renal disease (ESRD) receiving long-term dialysis therapy. This approach allowed us to minimize confounding variables and enhance the generalizability of our findings within the target population. The inclusion criteria required that participants be over 18 years of age and undergo maintenance dialysis—either hemodialysis or peritoneal dialysis—for a minimum duration of one year. In addition, only patients with complete clinical and biochemical data were considered eligible. These parameters were selected to ensure a consistent and comprehensive data set that would support longitudinal comparison and meaningful statistical analysis. Conversely, we established several exclusion criteria to eliminate factors that could potentially bias the outcomes. Patients who were not diagnosed with ESRD, those receiving both hemodialysis and peritoneal dialysis simultaneously, or those who had recently switched dialysis modalities were excluded from the study. Furthermore, individuals with confounding clinical conditions such as pregnancy, recent significant cardiovascular events (within the past three months), active malignancies, or ongoing inflammatory diseases were also excluded. Patients demonstrating non-adherence to their prescribed dialysis regimen were likewise excluded, as their inconsistent treatment could adversely affect the interpretation of biochemical and clinical outcomes. Following this careful screening process, our team developed a Case report form (CRF) to facilitate systematic data collection. This form was designed to capture essential information, including anemia-related parameters, bone mineral metabolism profiles, biochemical markers, and sociodemographic details. Data were collected at two time points: at the time of initiation of dialysis and again after one year of maintenance dialysis. By incorporating both baseline and follow-up data, the CRF enabled a robust analysis of the clinical progression and treatment outcomes in both hemodialysis and peritoneal dialysis patient groups.
2.3. Ethical Consideration
The study received ethical approval from the Institutional Review Board at the College of Medicine, King Saud University (Research Project No. E-24-9100). This approval granted access to patient medical records for the purpose of extracting the necessary clinical and laboratory data.
2.4. Statistical Analysis
Descriptive statistics were presented as means with standard deviations (M ± SD) and medians with interquartile ranges (IQR) for continuous variables, while categorical variables were expressed as frequencies and percentages. Comparative analyses between HD and PD groups were conducted using independent t-tests for normally distributed variables (haemoglobin, Potassium, and HCO3) and Mann-Whitney U tests for non-normally distributed variables. Gender-specific subgroup analyses were performed to identify differential responses to dialysis modalities, with statistical significance set at p < 0.05. Pearson correlation coefficients were calculated to assess associations between age and clinical parameters. The statistical analyses were performed using IBM SPSS v 29.0.0 software, with results considered statistically significant at p < 0.05.
3. Results
3.1. Demographic Characteristics
A total of 89 patients met the inclusion criteria, including 53 males (59.6%) and 36 females (40.4%). Hemodialysis (HD) patients had a higher mean age (58 ± 17 years) compared to peritoneal dialysis (PD) patients (48 ± 20 years), though this difference was not statistically significant (p = 0.499).

Table 1.
Demographic Characteristics and Distribution of Patients Across Dialysis Modalities.
| Hemodialysis | Peritoneal dialysis | Total | p-Value | ||||
| N/Mean | N%/SD | N/Mean | N%/SD | N/Mean | N%/SD | ||
| Gender | |||||||
| Female | 21 | 38.2% | 15 | 44.1% | 36 | 40.4% | 0.579 |
| Male | 34 | 61.8% | 19 | 55.9% | 53 | 59.6% | |
| Age | |||||||
| Years | 58 | 17 | 48 | 20 | 54 | 19 | 0.499 |
3.2. Baseline Biochemical and Hematological Parameters
Hemoglobin, potassium, and bicarbonate levels followed normal distribution, whereas other metabolic parameters showed significant deviation from normality (Kolmogorov–Smirnov p < 0.001).
Table 2.
Normality Assessment of Biochemical Parameters in Dialysis Patients.
| Tests of Normality | |||||||
| Kolmogorov-Smirnova | Shapiro-Wilk | ||||||
| Statistic | df | Sig. | Statistic | df | Sig. | ||
| Hgb | .074 | 97 | .200* | .986 | 97 | .407 | |
| Ferritin | .193 | 97 | <.001 | .699 | 97 | <.001 | |
| Tsat | .240 | 97 | <.001 | .439 | 97 | <.001 | |
| Ca | .124 | 97 | <.001 | .878 | 97 | <.001 | |
| Phos | .518 | 97 | <.001 | .135 | 97 | <.001 | |
| PTH | .168 | 97 | <.001 | .868 | 97 | <.001 | |
| Vit D | .120 | 97 | .002 | .910 | 97 | <.001 | |
| BUN | .286 | 97 | <.001 | .387 | 97 | <.001 | |
| K | .097 | 97 | .025 | .977 | 97 | .085 | |
| HCO3 | .075 | 97 | .200* | .976 | 97 | .072 | |
| Na | .117 | 97 | .002 | .944 | 97 | <.001 | |
3.3. Anemia and Iron Status
At baseline, PD patients had slightly higher hemoglobin (9.5 ± 1.8 g/dL) than HD (9.2 ± 2.0 g/dL), but this was not statistically significant (p = 0.449). After one year, HD patients had significantly higher hemoglobin levels (10.7 ± 1.7 g/dL) compared to PD (9.9 ± 1.8 g/dL; p = 0.038). Iron markers (ferritin and transferrin saturation) remained comparable. See Table 3a and Table 3b.
3.5. Biochemical Markers
HD patients showed significantly lower blood urea nitrogen (BUN) levels than PD (18.7 ± 28.8 vs. 19.0 ± 5.6; p = 0.009) and higher bicarbonate levels (26.2 ± 4.5 vs. 24.3 ± 3.2; p = 0.021). Potassium and sodium remained stable across groups. See Table 3b.
3.6. Subgroup Analysis by Gender
3.7. Age Correlation
In PD patients, age was significantly inversely correlated with phosphorus levels (r = –0.388, p = 0.023). No such correlation was found in HD patients. Other correlations with PTH, calcium, and sodium showed trends but did not reach statistical significance.
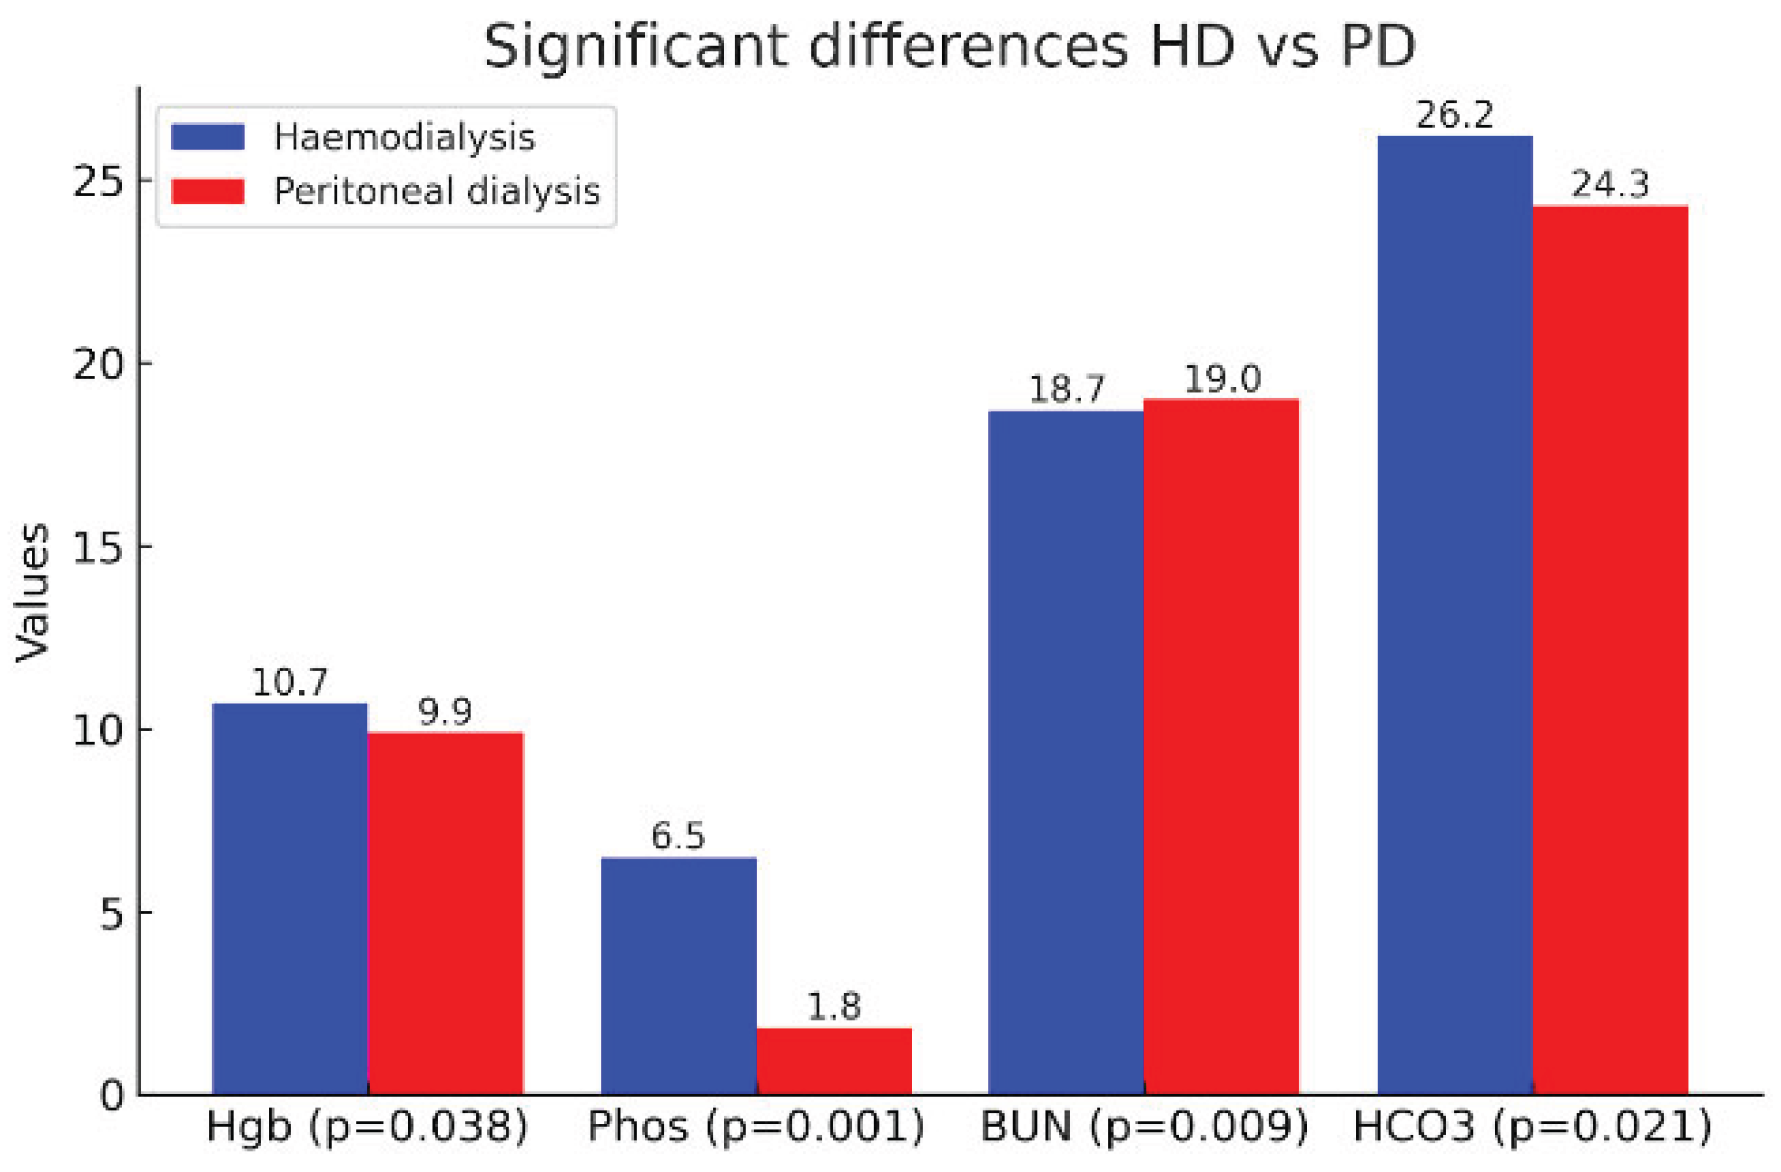
Figure 1.
Comparative bar chart illustrating parameters with statistically significant differences between hemodialysis (HD) and peritoneal dialysis (PD) patients after one year of treatment.
Figure 1.
Comparative bar chart illustrating parameters with statistically significant differences between hemodialysis (HD) and peritoneal dialysis (PD) patients after one year of treatment.
Table 5.
Correlation Analysis Between Age and Clinical Parameters in Haemodialysis versus Peritoneal Dialysis Patients.
Table 5.
Correlation Analysis Between Age and Clinical Parameters in Haemodialysis versus Peritoneal Dialysis Patients.
| Haemodialysis | Peritoneal dialysis | ||
| Age | Age | ||
| Anemia | |||
| Hgb | Pearson Correlation | -.076 | .233 |
| Sig. (2-tailed) | .582 | .184 | |
| Ferritin | Pearson Correlation | .022 | -.008 |
| Sig. (2-tailed) | .878 | .966 | |
| Tsat | Pearson Correlation | -.077 | .044 |
| Sig. (2-tailed) | .590 | .819 | |
| Bone profile | |||
| Ca | Pearson Correlation | .062 | -.306 |
| Sig. (2-tailed) | .656 | .078 | |
| Phos | Pearson Correlation | -.179 | -.388 |
| Sig. (2-tailed) | .190 | .023 | |
| PTH | Pearson Correlation | -.232 | -.352 |
| Sig. (2-tailed) | .098 | .052 | |
| Vit D | Pearson Correlation | .180 | .840 |
| Sig. (2-tailed) | .222 | .160 | |
| Biochemical | |||
| BUN | Pearson Correlation | .109 | -.034 |
| Sig. (2-tailed) | .427 | .850 | |
| K | Pearson Correlation | .080 | .020 |
| Sig. (2-tailed) | .561 | .909 | |
| HCO3 | Pearson Correlation | -.174 | -.033 |
| Sig. (2-tailed) | .209 | .855 | |
| Na | Pearson Correlation | -.189 | .323 |
| Sig. (2-tailed) | .167 | .062 | |
4. Discussion
This study offers a detailed comparative analysis of hemodialysis (HD) and peritoneal dialysis (PD) across a range of biochemical, hematological, and mineral parameters, based on a representative cohort in the Gulf region. The inclusion of gender- and age-specific subgroup analyses allows for more nuanced insights, which are relatively scarce in regional literature. The findings from our cohort generally align with global research, though they also highlight unique local trends that may inform more tailored clinical decision-making.
4.1. Anemia Management
Our results showed that at baseline, hemoglobin (Hb) levels were slightly higher in PD patients than HD patients (9.5 ± 1.8 vs. 9.2 ± 2.0 g/dL), but the difference was not statistically significant (p = 0.449). After one year, HD patients had significantly higher Hb levels compared to PD patients (10.7 ± 1.7 vs. 9.9 ± 1.8 g/dL, p = 0.038). This aligns with data from large-scale comparative studies which report improved anemia control in HD patients, primarily due to routine intravenous iron supplementation and more consistent erythropoietin use [10]. In our gender-based analysis, female HD patients exhibited higher Hb levels (10.8 ± 1.6) than PD females (10.0 ± 1.6), although this was not statistically significant (p = 0.121). A similar trend was observed in male patients. The literature supports this finding: HD patients often receive iron intravenously during dialysis sessions, whereas PD patients usually rely on oral iron, which has lower bioavailability [10]. This contributes to more effective anemia management in HD, especially among females, who are often more prone to iron deficiency. Iron markers such as ferritin and transferrin saturation (Tsat) were higher in PD patients, though the differences were not statistically significant. This contradicts some earlier studies suggesting HD patients generally have higher ferritin due to inflammation and repeated IV iron use [10], but agrees with others that note wide interindividual variability [11]. Our findings reflect this heterogeneity and highlight the need for individualized anemia protocols.
4.2. Bone Mineral Metabolism and CKD-MBD
One of the most striking differences in our study was the significantly higher serum phosphorus levels in HD patients at baseline and after one year (6.48 ± 39.21 mmol/L in HD vs. 1.84 ± 0.43 in PD, p < 0.001). Hyperphosphatemia is a critical concern in ESRD, associated with increased vascular calcification, cardiovascular disease, and mortality [12,13,14]. PD patients benefit from continuous dialysis, which supports better phosphate removal [15]. Interestingly, gender subgroup analysis revealed that female PD patients had significantly higher phosphorus levels (1.82 ± 0.35) than HD females (1.08 ± 0.49, p < 0.001). This difference was also statistically significant in males. These results align with findings from Moldovan et al., who observed that hyperphosphatemia is more pronounced in HD patients and is associated with cardiovascular events and mortality [13]. Interestingly, Sanabria et al. (2008) also reported that PD patients had higher baseline phosphorus levels compared to HD patients (4.6 vs. 4.35 mg/dL, p = 0.01), which contrasts with our findings where HD patients had significantly higher phosphorus levels. This discrepancy may reflect regional dietary practices, differences in dialysis prescriptions, or adherence to phosphate binders Our study found no significant differences in calcium or PTH levels between HD and PD groups. While PTH was higher in PD patients overall (71.29 ± 75.90 vs. 59.37 ± 43.29), this was not statistically significant (p = 0.906). Studies such as those by Abe et al. have emphasized that both high and low PTH levels are independently associated with adverse outcomes, including bone disease and mortality [12]. Additionally, vitamin D levels were lower in PD patients (41.00 ± 18.60) compared to HD (49.05 ± 22.91), although not statistically significant. Vitamin D deficiency is highly prevalent among dialysis patients and is more pronounced in PD due to less frequent supplementation and potential losses in dialysate [14,16]. Tamimi et al. noted widespread vitamin D deficiency and increased osteoporosis risk in PD patients, which supports our results [16].
4.3. Biochemical Parameters
Blood Urea Nitrogen (BUN) levels were significantly lower in HD patients after one year (18.7 ± 28.8 vs. 19.0 ± 5.6, p = 0.009), indicating better uremic toxin clearance. This matches prior studies asserting that HD offers superior clearance of small solutes compared to PD due to higher dialyzer efficiency and intermittent high-volume sessions [17,18]. Bicarbonate (HCO₃) levels were higher in HD patients (26.2 ± 4.5 vs. 24.3 ± 3.2, p = 0.021), which is consistent with known effects of bicarbonate-buffered HD solutions in correcting metabolic acidosis [17]. PD patients are more prone to mild acidosis due to lower bicarbonate transfer efficiency. Potassium (K⁺) and sodium (Na⁺) levels remained within the normal range and were comparable across groups, with no significant differences, aligning with results from studies where electrolyte levels were tightly regulated in both modalities through tailored dialysate [18].
4.4. Gender-Based Insights
Our subgroup analysis offers gender-specific insights not often explored in regional studies. In both males and females, phosphorus and BUN levels were significantly better controlled in HD. Female PD patients showed higher PTH levels than HD females (114.42 vs. 57.90), although not statistically significant, suggesting possible secondary hyperparathyroidism [14,16]. These patterns suggest that HD may provide better short-term metabolic control in both genders, while PD patients—especially women—may require closer monitoring for CKD-MBD markers.
4.5. Age-Related Correlations
In PD patients, a significant negative correlation was found between age and phosphorus levels (r = -0.388, p = 0.023), indicating that older patients tend to have lower phosphorus levels—possibly due to reduced dietary intake or decreased intestinal absorption [15]. A similar trend was observed for PTH and calcium, although these were not statistically significant The DOC study highlighted age as a major determinant of survival, with patients aged 65 or older having nearly twice the mortality risk compared to younger individuals (HR = 2.21, p < 0.001) [19]. This reinforces our findings that phosphorus levels and PTH trends vary with age in PD patients, and it may further support the need for age-tailored dialysis management strategies. This age-related phosphorus trend was also noted by Yavuz et al., who found phosphorus levels to be negatively correlated with age in PD patients [15]. These findings reinforce the idea that dietary counseling and monitoring should be age-sensitive in PD populations.
4.6. Clinical Implications
The clinical relevance of these findings lies in the customization of dialysis modality based on patient profile. For example, HD may be preferable for patients needing tighter control of hemoglobin or BUN, while PD may be more suitable for those with difficulty maintaining phosphorus control. However, gender and age considerations are critical, especially since female PD patients may be at higher risk for bone mineral disturbances and poor phosphorus control. From a guideline perspective, our results affirm the KDOQI recommendations that emphasize individualized management of dialysis adequacy, bone metabolism, and anemia [17]. Our findings are also consistent with the DOC Study from Colombia, which showed that even though peritoneal dialysis (PD) patients had higher comorbidity scores, poorer socioeconomic status, and were more often diabetic, their adjusted survival was not significantly different from hemodialysis (HD) patients. In fact, among patients under 65 years old and non-diabetic, PD showed significantly better survival outcomes (p = 0.021) [19]. This supports our interpretation that modality selection should consider individual risk factors rather than assuming a survival advantage of one modality over the other.
4.7. Strengths and Limitations
Our study’s strengths include detailed subgroup analysis and focus on biochemical parameters over one year—a timeframe adequate to observe clinical trends. However, limitations include the modest sample size and lack of data on dialysis prescription details, dietary intake, and medication adherence, which can all influence outcomes. Additionally, the markedly high standard deviations in phosphorus and BUN may indicate outliers or measurement variability that warrants further investigation.
5. Conclusions
This study adds to the growing body of literature comparing HD and PD, This study highlights key differences in clinical outcomes between hemodialysis (HD) and peritoneal dialysis (PD) in a Gulf-region cohort. HD was more effective in managing anemia and uremic toxins, while PD patients maintained more stable phosphorus levels. Gender-based analysis showed that HD offered better phosphorus and BUN control in both males and females. Age was negatively correlated with phosphorus levels in PD patients, suggesting the need for age-sensitive management. Overall, these findings support a personalized approach to dialysis modality selection. Clinical decisions should account not only for biochemical targets but also for patient-specific factors such as age and gender to optimize outcomes in end-stage renal disease.
6. Patents
This section is not mandatory but may be added if there are patents resulting from the work reported in this manuscript.
Supplementary Materials
The following supporting information can be downloaded at the website of this paper posted on Preprints.org. Figure S1: title; Table S1: title; Video S1: title.
Author Contributions
M.A.A (Meshal Althunayan) performed data analysis, wrote the main manuscript, and prepared all the figures and tables; H.A (Hatem Alnasser) generated thy hypothesis and designed the study. M.A (Mohammad Alsuhaibani), K.A (Khalid Alkublan), M.A. (Mohammed Almajhadi), I.A (Ibraheem Alkanhal), M.A (Mohammed Alquhidan) collected the data, prepared all the figures and tables, organized the data, and edited the manuscript; M.A (Mohammed Almousa), S.A (Sultan Alshehri) recruited patients. All authors have read and agreed to the published version of the manuscript.
Funding
This research received no external funding
Institutional Review Board Statement
The study was conducted according to the guidelines of the Declaration of Helsinki and approved by the Institutional Review Board (or ethics committee) of the College of Medicine, King Saud University (IRB Approval of Research Project No. E-24-9100, 02 October 2024)
Informed Consent Statement
Informed consent was obtained from all patients involved in this study.
Data Availability Statement
Available from the corresponding author upon reasonable request..
Conflicts of Interest
The authors declare no conflicts of interest.
Abbreviations
The following abbreviations are used in this manuscript:
| ESRD | End-Stage Renal Disease |
| CKD | Chronic Kidney Disease |
| HD | Hemodialysis |
| PD | Peritoneal Dialysis |
| HRQoL | Health-Related Quality of Life |
| GFR | Glomerular Filtration Rate |
| PTH | Parathyroid hormone |
| Hb/Hgb | Hemoglobin |
| Na | Sodium |
| Ca | Calcium |
| K | Potassium |
| Phos | Phosphate |
| Vit D | Vitamin D |
| BUN | Blood Urea Nitrogen |
| HCO3 | Bicarbonate |
| Tsat | Transferrin Saturation |
| CRF | Case Report Form |
| SD | Standard Deviation |
| IQR | Interquartile Range |
References
- Yılmaz, Z., Yıldırım, Y., Aydın, F. Y., Aydın, E., Kadiroğlu, A. K., Yılmaz, M. E., & Acet, H. (2014). Evaluation of fluid status related parameters in hemodialysis and peritoneal dialysis patients: Clinical usefulness of bioimpedance analysis. Medicina, 50(5), 269–274. [CrossRef]
- Maruyama, Y., Higuchi, C., Io, H., Wakabayashi, K., Tsujimoto, H., Tsujimoto, Y., Yuasa, H., Ryuzaki, M., Ito, Y., & Nakamoto, H. (2019). Comparison of peritoneal dialysis and hemodialysis as first renal replacement therapy in patients with end-stage renal disease and diabetes: a systematic review. Renal Replacement Therapy, 5(1). [CrossRef]
- Hu, L., Napoletano, A., Provenzano, M., Garofalo, C., Bini, C., Comai, G., & La Manna, G. (2022). Mineral bone Disorders in kidney Disease Patients: The Ever-Current Topic. International Journal of Molecular Sciences, 23(20), 12223. [CrossRef]
- Chuasuwan, A., Pooripussarakul, S., Thakkinstian, A., Ingsathit, A., & Pattanaprateep, O. (2020). Comparisons of quality of life between patients underwent peritoneal dialysis and hemodialysis: a systematic review and meta-analysis. Health and Quality of Life Outcomes, 18(1). [CrossRef]
- Xu, X., Han, X., Yang, Y., & Li, X. (2020). Comparative study on the efficacy of peritoneal dialysis and hemodialysis in patients with end-stage diabetic nephropathy. Pakistan Journal of Medical Sciences, 36(7). [CrossRef]
- Zhao, Y. (2023). Comparison of the effect of hemodialysis and peritoneal dialysis in the treatment of end-stage renal disease. Pakistan Journal of Medical Sciences, 39(6). [CrossRef]
- Bello, A. K., Okpechi, I. G., Osman, M. A., Cho, Y., Htay, H., Jha, V., Wainstein, M., & Johnson, D. W. (2022). Epidemiology of haemodialysis outcomes. Nature Reviews Nephrology, 18(6), 378–395. [CrossRef]
- Jin, H., Fang, W., Zhu, M., Yu, Z., Fang, Y., Yan, H., Zhang, M., Wang, Q., Che, X., Xie, Y., Huang, J., Hu, C., Zhang, H., Mou, S., & Ni, Z. (2016). Urgent-Start Peritoneal dialysis and hemodialysis in ESRD patients: Complications and outcomes. [CrossRef]
- Treacy, O., Brown, N. N., & Dimeski, G. (2019). Biochemical evaluation of kidney disease. Translational Andrology and Urology, 8(S2), S214–S223. [CrossRef]
- Van Lieshout, T. S., Klerks, A. K., Mahic, O., Vernooij, R. W. M., Eisenga, M. F., Van Jaarsveld, B. C., & Abrahams, A. C. (2024). Comparative iron management in hemodialysis and peritoneal dialysis patients: a systematic review. Frontiers in Nephrology, 4. [CrossRef]
- Ewedah, A., Kora, M. E., Zahran, A., & El-Zorkany, K. A. (2019). Hemodialysis versus peritoneal dialysis: a comparative study Menoufia Medical Journal. Menoufia Medical Journal. [CrossRef]
- Abe, M., Okada, K., & Soma, M. (2013). Mineral metabolic abnormalities and mortality in dialysis patients. Nutrients, 5(3), 1002–1023. [CrossRef]
- Moldovan, D., Rusu, C., Kacso, I. M., Potra, A., Patiu, I. M., & Gherman-Caprioara, M. (2015). Mineral and bone disorders, morbidity and mortality in end-stage renal failure patients on chronic dialysis. Medicine and Pharmacy Reports, 89(1), 94–103. [CrossRef]
- Dang, Z., Tang, C., Li, G., Luobu, C., Qing, D., Ma, Z., Qu, J., Suolang, L., & Liu, L. (2019). Mineral and bone disorder in hemodialysis patients in the Tibetan Plateau: a multicenter cross-sectional study. Renal Failure, 41(1), 636–643. [CrossRef]
- Yavuz, A., Ersoy, F., Passadakis, P., Tam, P., Evaggelos, D., Katopodis, K., Özener, Ç., Akçiçek, F., Çamsari, T., Ateş, K., Ataman, R., Vlachojannis, G., Dombros, N., Utaş, C., Akpolat, T., Bozfakioğlu, S., Wu, G., Karayaylali, I., Arinsoy, T., . . . Oreopoulos, D. (2008). Phosphorus control in peritoneal dialysis patients. Kidney International, 73, S152–S158. [CrossRef]
- Tamimi, R., Bdair, A., Shratih, A., Abdalla, M., Sarsour, A., Hamdan, Z., & Nazzal, Z. (2024). Bone mineral density and related clinical and laboratory factors in peritoneal dialysis patients: Implications for bone health management. PLoS ONE, 19(5), e0301814. [CrossRef]
- National Kidney Foundation. KDOQI clinical practice guideline for hemodialysis adequacy: 2015 update. Am J Kidney Dis. 2015;66(5):884-930. [CrossRef]
- Albalawi, A. M., Dera, A. A., Rajagopalan, P., Maqsood, S., Kashif, F. S., & Mansoor, N. (2023). Effect of dialysis on biochemical parameters in chronic renal failure patients: a cross-sectional study. International Journal of Biochemistry Research & Review, 32(2), 32–37. [CrossRef]
- Sanabria, M., Muñoz, J., Trillos, C., Hernández, G., Latorre, C., Díaz, C., Murad, S., Rodríguez, K., Rivera, Á., Amador, A., Ardila, F., Caicedo, A., Camargo, D., Díaz, A., González, J., Leguizamón, H., Lopera, P., Marín, L., Nieto, I., & Vargas, E. (2008). Dialysis outcomes in Colombia (DOC) study: A comparison of patient survival on peritoneal dialysis vs hemodialysis in Colombia. Kidney International, 73, S165–S172. [CrossRef]
Table 3.
a): Comparative Analysis of Baseline Hematological, Bone Mineral, and Biochemical Parameters Between Hemodialysis and Peritoneal Dialysis Modalities. b): Comparative Analysis of 1-Year Hematological, Bone Mineral, and Biochemical Parameters Between Hemodialysis and Peritoneal Dialysis Modalities.
| a) | |||||
| Hemodialysis | Peritoneal dialysis | p-Value | |||
| Variable | Mean (SD) | Median (IQR) | Mean (SD) | Median (IQR) | |
| Anemia | |||||
| Hgb | 9.2 (2.0) | 8.9 (7.8–10.8) | 9.5 (1.8) | 9.4 (8.1–10.8) | 0.449 |
| Ferritin | 429.07 (302.59) | 353.00 (211.90–560.60) | 471.08 (931.59) | 263.00 (136.30–402.00) | 0.077 |
| Tsat | 32.19 (40.36) | 24.10 (17.20–29.00) | 32.28 (24.15) | 26.00 (21.30–37.90) | 0.342 |
| Bone profile | |||||
| Ca | 2.17 (.37) | 2.26 (1.97–2.39) | 2.16 (.21) | 2.19 (2.03–2.33) | 0.618 |
| Phos | 6.79 (38.90) | 1.59 (1.05–1.99) | 1.87 (.50) | 1.78 (1.49–2.20) | 0.026 |
| PTH | 56.82 (39.44) | 46.00 (31.40–79.20) | 66.34 (70.13) | 46.00 (31.00–83.00) | 0.724 |
| Vit D | 46.83 (30.07) | 40.42 (25.87–56.90) | 35.18 (18.14) | 28.00 (26.00–35.90) | 0.468 |
| Biochemical | |||||
| BUN | 39.3 (86.6) | 20.6 (13.0–31.1) | 26.7 (9.0) | 27.0 (20.0–32.0) | 0.060 |
| K | 4.26 (.77) | 4.30 (3.60–4.70) | 4.53 (.57) | 4.50 (4.30–4.90) | 0.061 |
| HCO3 | 22.1 (6.0) | 22.0 (19.0–26.0) | 27.1 (36.4) | 21.5 (19.0–24.0) | 0.324 |
| Na | 135.1 (4.2) | 135.0 (133.1–138.0) | 136.7 (3.6) | 138.0 (134.0–139.0) | 0.082 |
| b) | |||||
| Hemodialysis | Peritoneal dialysis | p-Value | |||
| Variable | Mean (SD) | Median (IQR) | Mean (SD) | Median (IQR) | |
| Anemia | |||||
| Hgb | 10.7 (1.7) | 10.8 (9.4–11.7) | 9.9 (1.8) | 9.8 (8.6–11.4) | 0.038 |
| Ferritin | 381.10 (420.29) | 301.95 (186.05–429.50) | 536.82 (813.42) | 392.00 (183.00–589.00) | 0.303 |
| Tsat | 29.19 (12.63) | 27.80 (19.70–36.90) | 27.73 (13.21) | 27.90 (20.00–35.00) | 0.775 |
| Bone Profile | |||||
| Ca | 2.21 (.29) | 2.19 (2.06–2.33) | 2.20 (.19) | 2.20 (2.05–2.30) | 0.911 |
| Phos | 6.48 (39.21) | 1.26 (.75–1.65) | 1.84 (.43) | 1.84 (1.67–2.03) | <0.001 |
| PTH | 59.37 (43.29) | 47.30 (31.15–79.20) | 71.29 (75.90) | 45.00 (26.00–85.00) | 0.906 |
| Vit D | 49.05 (22.91) | 46.50 (29.75–62.00) | 41.00 (18.60) | 38.50 (29.50–52.50) | 0.562 |
| Biochemical | |||||
| BUN | 18.7 (28.8) | 13.7 (7.8–21.0) | 19.0 (5.6) | 17.6 (15.5–21.0) | 0.009 |
| K | 4.10 (.83) | 4.10 (3.40–4.60) | 4.31 (.48) | 4.25 (3.99–4.53) | 0.135 |
| HCO3 | 26.2 (4.5) | 26.9 (24.0–29.0) | 24.3 (3.2) | 24.0 (22.8–26.0) | 0.021 |
| Na | 136.6 (3.8) | 137.0 (134.0–138.0) | 136.6 (3.9) | 137.5 (134.0–139.0) | 0.879 |
Table 4.
a): Comparison of efficacy of hemodialysis vs peritoneal dialysis in Females at 1 year. b): Comparison of efficacy of hemodialysis vs peritoneal dialysis in Males at 1 year.
Table 4.
a): Comparison of efficacy of hemodialysis vs peritoneal dialysis in Females at 1 year. b): Comparison of efficacy of hemodialysis vs peritoneal dialysis in Males at 1 year.
| a) | |||||
| Hemodialysis | Peritoneal dialysis | p-Value | |||
| Variable | Mean (SD) | Median (IQR) | Mean (SD) | Median (IQR) | |
| Anemia | |||||
| Hgb | 10.8 (1.6) | 10.8 (9.6–11.6) | 10.0 (1.6) | 10.1 (9.0–11.4) | 0.121 |
| Ferritin | 488.57 (614.47) | 354.00 (223.00–538.00) | 453.55 (359.46) | 533.00 (121.00–703.00) | 0.767 |
| Tsat | 29.45 (12.60) | 29.50 (21.90–34.00) | 24.68 (8.83) | 25.60 (19.40–31.10) | 0.412 |
| Bone profile | |||||
| Ca | 2.17 (.22) | 2.17 (2.06–2.30) | 2.21 (.19) | 2.25 (2.11–2.30) | 0.526 |
| Phos | 1.08 (.49) | .99 (.67–1.40) | 1.82 (.35) | 1.84 (1.45–1.97) | <0.001 |
| PTH | 57.90 (27.92) | 47.60 (41.10–80.40) | 114.42 (106.35) | 92.00 (33.50–154.00) | 0.252 |
| Vit D | 47.94 (22.74) | 40.40 (28.90–74.00) | 21.00 (0) | 21.00 (21.00–21.00) | 0.200 |
| Biochemical | |||||
| BUN | 21.0 (45.6) | 10.6 (4.3–16.8) | 15.5 (2.9) | 15.8 (14.0–18.0) | 0.058 |
| K | 4.04 (.84) | 3.80 (3.40–4.60) | 4.32 (.52) | 4.30 (4.00–4.50) | 0.240 |
| HCO3 | 27.5 (4.3) | 28.0 (25.0–30.3) | 24.9 (3.9) | 25.0 (22.0–28.0) | 0.066 |
| Na | 136.2 (5.0) | 137.0 (135.0–138.0) | 137.3 (4.3) | 138.0 (135.0–140.0) | 0.202 |
| b) | |||||
| Hemodialysis | Peritoneal dialysis | p-Value | |||
| Variable | Mean (SD) | Median (IQR) | Mean (SD) | Median (IQR) | |
| Anemia | |||||
| Hgb | 10.6 (1.8) | 10.3 (9.4–11.7) | 9.8 (2.0) | 9.6 (8.3–11.6) | 0.150 |
| Ferritin | 319.22 (241.53) | 297.00 (184.00–391.60) | 585.03 (993.74) | 340.00 (207.00–558.00) | 0.258 |
| Tsat | 29.05 (12.84) | 27.10 (19.70–36.90) | 29.59 (15.23) | 29.00 (20.00–39.70) | 0.708 |
| Bone profile | |||||
| Ca | 2.23 (.33) | 2.20 (2.07–2.33) | 2.19 (.19) | 2.17 (2.05–2.32) | 0.754 |
| Phos | 9.82 (49.86) | 1.34 (.92–1.74) | 1.86 (.49) | 1.83 (1.67–2.11) | 0.001 |
| PTH | 60.22 (50.46) | 44.80 (27.00–69.80) | 44.05 (25.82) | 38.00 (25.00–56.00) | 0.430 |
| Vit D | 49.78 (23.39) | 47.00 (34.20–59.27) | 47.67 (15.89) | 39.00 (38.00–66.00) | 1.000 |
| Biochemical | |||||
| BUN | 17.3 (9.7) | 15.5 (10.2–23.0) | 21.7 (5.8) | 21.0 (16.2–27.0) | 0.019 |
| K | 4.14 (.84) | 4.18 (3.50–4.60) | 4.31 (.47) | 4.20 (3.90–4.60) | 0.341 |
| HCO3 | 25.5 (4.5) | 26.0 (24.0–27.9) | 23.9 (2.5) | 24.0 (23.0–25.0) | 0.116 |
| Na | 136.9 (3.0) | 137.0 (134.0–139.0) | 135.9 (3.5) | 136.0 (132.0–139.0) | 0.356 |
Disclaimer/Publisher’s Note: The statements, opinions and data contained in all publications are solely those of the individual author(s) and contributor(s) and not of MDPI and/or the editor(s). MDPI and/or the editor(s) disclaim responsibility for any injury to people or property resulting from any ideas, methods, instructions or products referred to in the content. |
© 2025 by the authors. Licensee MDPI, Basel, Switzerland. This article is an open access article distributed under the terms and conditions of the Creative Commons Attribution (CC BY) license (http://creativecommons.org/licenses/by/4.0/).
Copyright: This open access article is published under a Creative Commons CC BY 4.0 license, which permit the free download, distribution, and reuse, provided that the author and preprint are cited in any reuse.


