
Submitted:
23 May 2025
Posted:
27 May 2025
You are already at the latest version
Abstract
Protein arginine methyltransferase 3 (PRMT3), a type I family PRMT, regulates the activity of downstream substrates by catalyzing the asymmetric dimethylation of arginine residues. While PRMT3 activity has been reported to be deregulated in many cancers, including glioblastoma (GBM), the underlying signaling mechanisms which contribute to disease progression are largely unknown. Here, we show that expression of the tumour suppressor protein 4.1B, a negative regulator of PRMT3, predicts the response of GBM brain tumour stem cells (BTSCs) to the PRMT3 chemical probe, SGC707. We show that PRMT3 modulates the stability and subcellular localization of the downstream effector, UHRF1, a member of the DNA methylation complex. Together, UHRF1 and DNMT1, may suppress the expression of 4.1B through promoter methylation. These findings show that 4.1B, PRMT3 and UHRF1/DNMT1 function together to promote BTSCs growth. Thus, targeting PRMT3 or UHRF1/DNMT1, especially in tumours with low endogenous 4.1B protein, may have high therapeutic relevance.
Keywords:
brain tumour stem cell
; PRMT3
; UHRF1
; DNMT1
; 4.1B
; RPS2
; glioblastoma
1. Introduction
Arginine methylation is an important post-translational modification which determines the conformation, activity, and subcellular localization of target histone and non-histone proteins1-4. Protein arginine methyltransferase (PRMT) enzymes from three different families catalyze arginine methylation. PRMT3 is a member of type I family PRMTs with a unique Zinc finger domain at its N-terminus for substrate recognition and is localized predominantly in the cytoplasm3, 4. Methylation of ribosomal protein S2 (RPS2), the first reported major substrate of PRMT3, is essential for proper ribosomal maturation of the 80S ribosome4. PRMT3 has been previously reported to modulate the stability of proteins involved in regulation of cell metabolism and drug resistance, through aberrant arginine methylation in different human cancers5-8. However, the driver events responsible for the aberrant enzymatic activity of PRMT3 and consequently deregulation of PRMT3-mediated epigenetic and molecular mechanisms, are unknown.
The tumour suppressor protein 4.1B/DAL-1 has been reported to negatively regulate the enzymatic activity of PRMT39. 4.1B is encoded by the erythrocyte membrane protein band 4.1 like 3 (EPB41L3) gene10. It acts as a scaffold for downstream cytoplasmic effector molecules and regulates their activity in various signaling pathways9-14. 4.1B often loses its expression due to DNA hypermethylation or loss of heterozygosity in many human cancers, including diffuse gliomas11-14. However, whether loss of 4.1B protein is among the driver events which promote the enzymatic activity of PRMT3 in cancer is unknown.
Glioblastoma, a malignant adult brain tumour, displays extensive cellular, molecular, genetic, and epigenetic heterogeneity and continues to have a dismal survival prognosis15-18. PRMT3 has been recently reported to play a role in GBM tumour cell growth using gain- or loss-of-function approaches6. Whether targeting PRMT3 would be an effective therapeutic approach for GBM tumours representing diverse cellular and molecular heterogeneity is unknown. Here, we used a panel of GBM patient-derived BTSCs19-25 to investigate the downstream molecular events mediated by aberrant enzymatic activity of PRMT3.
Using previously published primary/recurrent GBM RNA expression data26, we established that high EPB41L3 RNA expression correlated with longer survival in GBM patients. We further determined that a subset of our cohort of patient-derived GBM BTSCs19-25 display low endogenous expression of 4.1B protein. We report that loss of 4.1B protein results in increased PRMT3 enzymatic activity and promotes PRMT3-mediated molecular mechanisms critical for BTSCs’ growth and tumorigenic potential. We identify UHRF1 as a downstream effector whose sub-cellular localization is modulated by the aberrant enzymatic activity of PRMT3, possibly through asymmetric arginine methylation. In the nucleus, UHRF1 and DNMT1 may be responsible for altering the DNA methylation of the 5′ regulatory regions of the EPB41L3 gene, thus inhibiting its expression in the majority of BTSCs. Our study identifies 4.1B, PRMT3 and UHRF1/DNMT1 as a signaling axis that promotes BTSCs growth. These findings suggest that GBM tumours with low endogenous 4.1B expression may benefit from therapies targeting either PRMT3 or UHRF1/DNMT1.
2. Materials and Methods
2.1. Cell Culture
Patient-derived BTSC lines were cultured from a series of tumour specimens obtained, following written informed consent from patients, including identifying information such as sex and age (Table 1), during surgical resection and approval from the University of Calgary Ethics Review Board, Health Research Ethics Board of Alberta - Cancer Committee (HREBA) and Ethics Board (REB HREBA-CC-160762) (Calgary, AB, Canada) as previously described19-25. All cell lines were cultured in 3D sphere format in stem cell enriched media supplemented with EGF (20ng/ml; Peprotech), bFGF (20ng/ml; R&D Systems Inc) and heparin sulfate (2µg/ml; R&D Systems Inc) and were used within 10 passages after being thawed. Normal human brain tissues were obtained from 12- to 18- week-old fetuses from therapeutic abortions according to the ethical guidelines established by the University of Calgary. Written parental consent was obtained from all tissue donors and the use of these human samples was approved by the institutional Review Board of the University of Calgary (REB14-1789). Tissue was collected from health providers shortly after the procedures, transported to the laboratory under sterile conditions and processed immediately for culture. Human fetal neural (HF-NSCs) stem cells were generated from human fetal tissue, cultured and passaged as previously described20. Authenticated human induced pluripotent stem cells (hiPSCs) were obtained from ATCC (ATCC-ACS-1020) and cultured using similar materials and methods as for human embryonic stem cells as previously described41. HEK293T/17 cells were obtained from ATCC (ATCC 293T/17), and astrocytes derived from HF-NSCs and hiPSCs-NSCs were cultured in Dulbecco’s Modified Eagle Medium (DMEM) with 10% fetal bovine serum (FBS). All BTSC lines were authenticated using short tandem repeat profiling and their profiles were compared to those of the original parental tumour tissue (Calgary Laboratory Services and Department of Pathology and Laboratory Medicine, University of Calgary). Authentication and testing of all the cell lines were performed as per American Association for Cancer Research recommendations. All cell lines used in this study were routinely tested for Mycoplasma using a Vendor™ GeM Mycoplasma PCR-based detection kit (Sigma, MP0025) and they were confirmed to be mycoplasma free.
2.2. Drug Screening and Cell Viability Assays
The PRMT3 chemical probe SGC707, negative probe XY1, and type I family PRMT probe MS023 were obtained from the Structural Genomic Consortium (SGC), University of Toronto, Ontario. BTSC lines (both sphere and adherent cultures) and normal human astrocytes derived from HF-NSCs were seeded in 96-well plates at a density of 1000-2500cells/well (estimated based on the growth rate of BTSCs and normal astrocytes). Twenty-four hours later, cells were treated with the respective drugs at a range of 0-10µM and the concentration of the vehicle was determined based on the highest concentration of each drug used for a period of 14 days. The UHRF1 targeting drugs NSC232003 (cat# E0351) and β-thujaplicin (cat# S4771) were obtained from Selleckchem.
For the EPB41L3 overexpressing and CRISPR-cas9 knockout cell viability assays, cells were seeded at 1000 cells/ well in 96 well plates and treated with either XY1, negative probe or SGC707 for 14 days. Cell viability assays were performed using the alamarBlue™ cell viability reagent (Thermo Fisher Scientific, cat# DAL1025), according to the manufacturer’s protocol, for the desired incubation time of 6-8 hours (hrs) (based on the growth rate of each cell line and to avoid signal saturation) and fluorescence was measured (excitation 540nm and emission 590nm). The results represent means from 3 biological replicates, each consisting of 3-6 technical replicates. Statistical analysis was conducted using nonlinear regression curve fit in GraphPad Prism 8.
2.3. EdU Cell Cycle Analysis
For cell cycle analysis, cells were dissociated and 2.5x10⁵ cells /sample were exposed to 10μM EdU for 2hr at 37ºC. Cells were fixed and stained using the Click-iT™ Plus EdU Alexa Fluor™ 647 Flow Cytometry Assay kit (Thermo Fisher Scientific cat# C10634) as per manufacturer’s guidelines. Cells were then counterstained with propidium iodide (PI) for DNA content using FxCycle™ PI/RNase Staining solution (Invitrogen cat# F10797). Flow cytometry analysis was performed using CytoFLEX LX (Beckman Coulter) at the Flow cytometry core facility (University of Calgary) and results were analyzed using FACSDiva software version 6.1.3 (BD Biosciences).
2.4. CRISPR-cas9 Knockout Procedures
CRISPR-cas9 technique was used to knockout PRMT3, UHRF1 and EPB41L3 in BTSC lines using a previously described protocol20. Briefly, BTSC lines were transduced with a lentiviral vector harboring Cas9, followed by blasticidin selection. The selected cells were then transduced to deliver guide RNAs to target PRMT3, UHRF1 and EPB41L3, followed by puromycin selection. Two independent guide RNAs were used for PRMT3, UHRF1, EPB41L3. AAVS1 was used as a cut control. The knockout efficiency of each guide RNA was validated by western blotting. The gRNA sequences used in this study are listed in Supplementary Table S1.
2.5. Stable Lentiviral Knockdown and Overexpression Methods
Stable knockdown of PRMT3 was performed using three independent shRNA sequences for each gene along with their respective scrambled shRNA controls (GeneCopoeia). Lentiviral particles were generated as previously described20. shRNA sequences targeting PRMT3 were tagged with green- (GFP) as a marker of transduction efficiency. PRMT3 knockdown cells were selected using puromycin, and the knockdown efficiency of each shRNA sequence was validated by western blotting.
Inducible and stable overexpression of EPB41L3 was performed using the Gateway clones Ex-L0088-Lv205-GS and EX-H1865-Lv205 respectively, along with their respective GFP-expressing empty vector control clone (Ex-Neg-Lv205) from GeneCopoeia. Lentiviral particles were generated as previously described20. The EPB41L3+ cells were selected using puromycin. For inducible overexpression, selected cells were treated with different concentrations of doxycycline (2μg, 5μg and 10μg) for 72 hours and overexpression of 4.1B for both inducible and stable overexpression was validated by western blotting.
2.6. RNA-Sequencing and Bioinformatic Analysis
The BTSC line, BT248, was treated with SGC707 and a negative probe, XY1 for 72 hours and pellets were collected from three biological replicates. Total RNA was extracted using the RNeasy Kit (Qiagen, cat# 74104), quantified using Nanodrop, and sent for library preparation and RNA-sequencing (Centre for Health Genomics and Informatics, University of Calgary). Transcripts were aligned using the Rsubread package42. Differential expression was performed using DESeq2 and significantly differentially expressed genes (FDR q<0.05) were used for input into the ReactomePA package43, 44. GSEA was performed using a preranked gene list of differentially expressed genes45, 46.
2.7. Real Time Quantitative PCR
Total RNA was extracted and purified from treated and untreated cell pellets using the RNeasy Kit (Qiagen, cat# 74104) and reverse transcribed to cDNA using the qScript cDNA Synthesis Kit (Quantabio, cat#95047). The cDNA was added to the reaction mixture containing FastStart Essential DNA Green Master Mix (Roche, cat# 06402712001) and 1.0μmol/L forward and reverse primers. RT-qPCR was performed in triplicate using a LightCycler 96 Instrument I (Roche). Relative expression values were obtained using the LightCycler 96 software (Roche, ver. 1.1.10.1320) and normalized to glyceraldehyde 3-phosphate dehydrogenase (GAPDH). All the PCR primers used in this study are listed in Supplementary Table S2.
2.8. PCR Cycling Conditions2.9. Bisulfite Conversion and Promoter/Enhancer Methylation Assay
| Steps | Temperature | Time | Cycles |
| Initial Denaturation | 98 °C | 30 sec | 1 |
| Denaturation | 98 °C | 10 sec | 25-35 cycles |
| Annealing | 55 °C | 20 sec | |
| Extension | 72 °C | 10 min | |
| Final extension | 72 °C | X min | 1 |
| Hold | 4 °C | Forever | |
Genomic DNA was extracted using a Gentra Puregene Cell kit (Cat # 158043, Qiagen) as per manufacturer’s guidelines. Five hundred nanogram of DNA were used for bisulfite conversion using the Epitect Bisulfite Kit (Cat # 59104, Qiagen) according to the manufacturer’s instructions. Methylation-specific (MS-) PCR was performed using 2μl of each Epitect product to determine EPB41L3 promoter/enhancer methylation as previously described9. Thermocycling conditions used for MS-PCR included denaturation at 95°C for 10 min, then 35 cycles of 95 °C for 45 s denaturation, 45 s annealing at 60°C, 72°C for 45 s extension, and a final 10 min extension at 72°C. The MS-PCR primers targeting the two CpG sites located within the 5′ upstream promoter and promoter/enhancer regions of the EPB41L3 gene were designed using the UCSC Genome Browser47 and are listed in Supplementary Table S3.
2.10. Western Blot
Total protein samples were extracted using RIPA buffer and used for western blotting as previously described20, 21, 41. Pellets for total protein extraction were collected from the different experimental treatments. Blots were probed with the target and control antibodies overnight at 4°C, washed and incubated with horseradish peroxidase (HRP)-conjugated secondary antibodies. SuperSignal and Amersham Imager 600 (General Electric) were used to image blots. All antibodies used against the histone and non-histones antigens are listed in Supplementary Table S4.
2.11. Nuclear Versus Cytoplasmic Extraction
Cell pellets were collected after 72 hours treatment with SGC707, MS023 or XY1 probe, snap frozen and processed for nuclear and cytoplasmic extractions using the NE-PER™ Nuclear and Cytoplasmic extraction kit as per manufacturer’s guidelines (Thermo Scientific™ Cat# 78833). Briefly, the cell pellets were resuspended and incubated in cytoplasmic extraction reagent (CER) I for 10 min on ice, followed by 1 min incubation in CER II and centrifugation for collecting the cytoplasmic extract. The nuclear pellet was resuspended and incubated in the nuclear extraction reagent for 40 min with vortexing every 10 min interval. Cytoplasmic and nuclear extracts were further processed for western blotting. All antibodies used are listed in Supplementary Table S4.
2.12. Immunofluorescence Staining
For immunofluorescence staining, cells were cultured on laminin coated 8-chamber slides (0.5% laminin in PBS) in media supplemented with EGF (10ng/ml; Peprotech), bFGF (10ng/ml; R&D Systems Inc), heparin sulfate (2µg/ml; R&D Systems Inc) and bovine serum albumin (BSA, 75µg/ml; Life Technologies). The cells were treated with SGC707 or XY1 negative probes for 48 hours and were fixed in 4% paraformaldehyde. Cells were permeabilized using 0.3% Triton-X PBS solution for 10 min at room temperature followed by blocking with 10% goat serum in 0.3% Triton-X in PBS for 60 minutes at room temperature. Primary antibody incubations were performed overnight at 4°C, followed by washing and incubation with secondary antibody for 1-2 hours at room temperature in the dark. Slides were washed with PBS, cover slipped using the mounting medium containing DAPI and imaged on a high-capacity Olympus VS120 slide scanner at 40X magnification. Alexa Fluor 488 and 555 fluorophores were excited individually with 488 and 543-nm lasers, respectively, using appropriate filter sets. The antibodies used are listed in Supplementary Table 4.
2.13. Co-Immunoprecipitation Assays
EPB41L3 inducible overexpressing and empty vector control BT248, EPB41L3 KO and AAVS1 control cells were collected and crosslinked with dithiobis (succinimidyl propionate)) for 30 minutes20, 21. Crosslinked pellets were snap frozen and stored at -80°C until further use. The cells were lysed in IP buffer (50mM Tris-HCl, pH 8.0. 150mM NaCl, 1.0mM EDTA, 0.5% Nonidet P-40) containing phosphatase and protease inhibitors, and immunoprecipitations reactions (IP) were performed as previously described20, 21. Briefly, 500μg of total cell extract was incubated with 5μg of different antibodies overnight at 4°C. The following day, 50μL of protein G magnetic dynabeads™ (Thermo Fisher Scientific cat# 10003D) were added for 3-4h at 4°C. Beads were then washed, proteins were eluted, and immunoblotting was performed as described earlier20, 21. For sequential-IP the eluted proteins were diluted in IP buffer and incubated with second antibody. An immunoprecipitation reaction was performed with isotype-specific non-related IgG as a negative control to check the nonspecific immunoprecipitation. An immunodepleted (ID) fractions corresponding to each immunoprecipitation reaction was included to test the immunoprecipitation efficiency. The antibodies used are listed in Supplementary Table S4.
2.14. Intracranial Xenografts
All animal procedures were performed as previously described20-25 under the animal ethics protocol (AC21-0162) approved by the Animal Care Committee of the University of Calgary and operating in accordance with the Guide to the Care and Use of Experimental Animals published by the Canadian Council on Animal Care and the Guide for the Care and Use of Laboratory Animals issued by NIH (Bethesda, MD). 6-8 weeks old CB-17 female SCID mice were housed in a Biohazard barrier levels 2 facility at a temperature 25+/-2℃, 45-55% humidity, and a light cycle of 6am on, 8pm off. All animals used were female, and as such no sex-based analysis was performed. Mice were anesthetized and 100,000 BT248 (PRMT3 knockdown and scrambled control, AAVS1 cut control, PRMT3 and UHRF1 KO cells were dissociated and were stereotactically injected into the right cerebral hemisphere of SCID mice (10mice/group) at a depth of 3.5mm using a 10L Hamilton syringe. Endpoint was reached once animals showed any signs of neurological symptoms such as ataxia, >15% weight loss, hunching, kyphosis, paresis and lethargy, poor oral intake and domed heads. Mouse tumours remained intracranial and did not exceed the tumour burden limits determined by the institutional review board. Survival data was analyzed using Log Rank (Mantel-Cox) in GraphPad Prism and plotted as Kaplan-Meier survival curves.
2.15. Statistical Analysis
All experiments were performed using n=3 biological and n=3-6 technical replicates. Descriptive statistical analyses were performed using Microsoft Excel (Version 16) and GraphPad Prism (Version 8) to determine significant differences using unpaired two-tailed Student t-test or ANOVA followed by Dunnett or Tukey’s test for multiple comparisons and data are reported as mean ± SEM. The numbers of independent biological replicates and p values (*p<0.05, **p<0.01, ***p<0.001, ****p<0.0001) are provided in the individual figures. Values of p<0.05 were considered statistically significant. For orthotopic xenograft experiments, median survival was measured according to the Kaplan-Meier method, with a Log Rank Mantle-Cox test to compute the statistical significance for 10 mice per treatment group.
3. Results
3.1. Expression Levels of Tumour Suppressor Protein, 4.1B Predict BTSC Response to the PRMT3 Chemical Probe, SGC707
We used a cohort of GBM patient-derived primary and recurrent BTSC lines with different mutational statuses (Table 1) to investigate molecular mechanisms regulated by the aberrant activity of PRMT3. We first evaluated the response of 9 BTSC lines and normal human fetal astrocytes (HFAs) to a PRMT3 chemical probe, SGC707, a type I family PRMT probe, MS023 and a negative probe, XY1. Both SGC707 and MS023 reduced cell viability at lower concentrations in all BTSC lines compared to XY1 negative control (Figure 1a-b). However, a variable response of different BTSC lines to SGC707 treatment compared to XY1 control was observed (Figure 1a, c). Normal HFAs did not respond to SGC707, MS023 or XY1 treatments (Figure 1a-c).
We next asked whether protein expression levels of PRMT3 or of its negative regulator protein9, 4.1B played a role in predicting the response of GBM BTSCs to SGC707 treatment. We examined the protein levels of 4.1B, PRMT3 and RPS2 in BTSC lines, normal human induced pluripotent stem cells (hiPSCs), normal neural stem cells (NSCs), astrocytes derived from hiPSCs and astrocytes derived from normal human fetal neural stem cells (HF NSCs). Interestingly, the expression of 4.1B was negligible and corresponded with high protein levels of PRMT3 and RPS2 in the BTSC lines tested, compared to astrocytes derived from hiPSCs or HF NSCs (Figure 1d, Supplementary Figure S1a). We observed lower protein expression of RPS2 in the BT143 line, derived from recurrent GBM, compared to other BTSC lines (Figure 1d). We thus examined protein levels of 4.1B in additional BTSC lines derived from both primary (Figure 1e) and recurrent (Figure 1f) GBM patient tumours (Table 1). Though the expression of 4.1B was negligible in most of the BTSC lines tested, three BTSC lines (BT189, BT284 and BT143) had high 4.1B levels (Figure 1e, f). These results support findings from a previous study reporting that an interaction of 4.1B with PRMT3 protein may negatively influence the enzymatic activity of PRMT3 and hence, the arginine methylation of its downstream targets9. Interestingly, the expression pattern of 4.1B protein corelated with the response of BTSCs to SGC707 treatment in the majority of BTSC lines tested (Figure 1a). For instance, BTSC lines, BT189 (IC50, 1.042e-006), BT284 (IC50, 2.048e-006) and BT143 (IC50, 1.057e-006) which have high levels of 4.1B were less responsive to SGC707 treatment than lines with low to negligible 4.1B expression. We also observed that the BT50 BTSC line, which does not endogenously express 4.1B protein was less sensitive to SGC707 treatment which could be due to low protein levels of PRMT3 in these cells compared to the other BTSC lines (Figure 1d). Overall, these findings led us to hypothesize that loss of 4.1B promotes the activity of PRMT3 in a subset of BTSCs and is predictive of their response to PRMT3 inhibition.
PRMT3 has been reported to regulate the activity and stability of its cellular substrates though arginine methylation3-8; we next investigated changes in total asymmetric dimethyl arginine (ADMA) residues following treatment with SGC707 and the XY1 negative probe. We observed a global decrease in the levels of total ADMA (Figure 1g). We further tested the effect of decreased levels of total ADMA on downstream substrates of PRMT3. We treated the resistant and sensitive BTSC lines with IC50 concentrations (0.1 and 1.0μM) of SGC707, MS023 and the negative probe XY1 for 72 hours. BT143 and BT189, which have high 4.1B expression, did not show any changes in protein levels of PRMT3 and RPS2, analogous to their lower response to SGC707 treatment (Figure 1h). Interestingly, the protein levels of PRMT3 and RPS2 decreased with a concurrent increase in the protein expression of 4.1B following treatment of BT248 cells with SGC707 (Figure 1i). No obvious changes were observed with either MS023 or XY1 treatment (Figure 1i). Next, to determine whether these changes are post-transcriptional, we assessed fold changes in the RNA abundance of PRMT3 and RPS2 following treatment with SGC707 and did not observe any obvious changes in the transcript levels (Supplementary Figure S1b). Collectively, these results suggest that inhibition of PRMT3 with the SGC707 probe has dual effects in BTSCs. First, it impacts protein expression of PRMT3, which may, in part, be the result of PRMT3-induced changes in the asymmetric arginine methylation of RPS2 leading to improper ribosomal maturation and protein translation. Second, it restored the expression of its negative regulator protein, 4.1B, which may destabilize and induce proteasomal degradation of PRMT3 protein.
3.2. Hypermethylation of 5′ Regulatory Regions Result in Loss of EPB41L3 Expression in BTSCs
EPB41L3 has low expression in many human cancers including gliomas due to aberrant promoter methylation or loss of heterozygosity10-13. Its loss may influence the enzymatic activity of PRMT39. To investigate whether the low protein expression of 4.1B protein in a subset of GBM BTSCs is due to aberrant promoter methylation, we designed PCR primers targeting two CpG sites located within the 5′ upstream promoter and promoter/enhancer regions of EPB41L3 (Figure 2a). Methylation specific (MS)-PCR data showed increased methylation of these CpG sites in the BT2484.1Blow line (Figure 2b). In contrast, the CpG sites located within the 5′ regulatory regions of EPB41L3 were unmethylated (Figure 2c, d); and thus, the high protein expression observed in the BT189 and BT143 lines (Figure 2e, f). Notably, low EPB41L3 RNA expression correlated to poor survival in IDH-wildtype GBM patients26 (Figure 2e).
We next performed immunofluorescent staining and examined the localization of 4.1B and PRMT3 in BT2484.1Blow and BT1434.1Bhigh cells. We did not observe any positive staining for 4.1B in BT2484.1Blow cells, however, PRMT3 was mostly localized in the cytoplasm (Figure 2f, Top panel). In contrast, the BT1434.1Bhigh cells showed positive cytoplasmic staining for both 4.1B and PRMT3 proteins (Figure 2f, bottom panel). These data thus suggest that aberrant promoter methylation may be the mechanism underlying the reduced gene expression of EPB41L3 and downregulation of 4.1B protein in some GBM BTSCs.
3.3. Inhibition of PRMT3 Activity with SGC707 Impacts the Expression of the Members of the DNA Methylation Complex, UHRF1/DNMT1
Our data above suggest that based on the expression levels of 4.1B, PRMT3 may have a context-specific role in regulating downstream transcriptional programs in GBM BTSCs. We next performed RNA-sequencing following 72 hours treatment of BT248 cells (one of the most responsive BTSC lines to SGC707 treatment) with 0.1μM SGC707 or XY1 probe (Figure 1a). We observed an upregulation of GPCR and interleukin signaling, and downregulation of cell cycle associated pathways (Figure 3a, b). Gene set enrichment analysis confirmed the upregulation of inflammatory pathways (Supplementary Figure S2a, b), including the specific effectors, IL32, CXCL10 and CXCL3 (Figure 3c). Further examination showed downregulation of stem cell marker genes including SOX2, OLIG2 and Prominin 1/CD133 and cell cycle checkpoint regulators such as CDK1/2 and CDKN2C in response to SGC707 treatment (Figure 3c).
Notably, we also observed that the expression of members of the EPB4 family transcripts, such as EPB41 and EPB41L4A was increased following PRMT3 inhibition with SGC707 but not with the XY1 negative probe (Figure 3c). This was accompanied by downregulation of transcripts related to epigenetic regulators including members of the Polycomb repressive complex 2 (PRC2), and of the DNA methylation complex including ubiquitin like PHD and ring finger domain 1 (UHRF1), DNA methyltransferase 1 and 3A (DNMT1, DNMT3A) (Figure 3c). Stem cell marker genes, including SOX2, OLIG2 and Prominin 1/CD133, and cell cycle checkpoint regulators, such as CDK1/2 and CDKN2C, were among the genes downregulated following SGC707 treatment (Figure 3c). We validated the changes in the protein levels of the stem cell marker, CD133; and the cell cycle regulator, p21 in SGC707 treated vs. XY1 treated BTSC samples (Figure 3d). Intriguingly, a reduction in the protein levels of UHRF1 and DNMT1 protein was accompanied by increased expression of the 4.1B protein (Figure 3d). UHRF1 has been shown to control cell cycle progression of stem cells through promoter methylation and transcriptional regulation of the cell cycle regulator, CDKN1A/p2127, 28. These data lead us to propose that the decreased expression of UHRF1/DNMT1 following PRMT3 inhibition may, in part, be responsible for inducing the expression of p21 and 4.1B through promoter demethylation. However, these findings require additional experimental validation.
To validate the relevance of the UHRF1/DNMT1 complex in BTSCs with high- and low-expression of 4.1B, we treated BT143 and BT248 cells with SGC707 and evaluated changes in the protein levels of members of the DNA methylation complex. Interestingly, BT1434.1Bhigh cells had comparatively lower basal protein levels of RPS2, UHRF1, and DNMT1 than BT2484.1Blow cells (Figure 1d, Figure 3e, f). In contrast, the protein levels of DNMT3A were relatively higher in BT1434.1Bhigh cells (Figure 3f). Furthermore, treatment of BT1434.1Bhigh cells with SGC707 did not affect the levels of PRMT3, RPS2, UHRF1, and DNMT1/3A proteins as observed in BT2484.1Blow cells (Figure 3e, f). These data suggest that high 4.1B expression may retain a negative regulatory impact on PRMT3 activity whereas its loss in a subset of BTSCs may modulate the PRMT3-mediated regulation of downstream targets such as UHRF1/DNMT1.
3.4. Induced Expression of 4.1B Impacts the Activity of PRMT3 and Its Downstream Effectors, UHRF1/DNMT1
Our data above show that inhibition of PRMT3 activity with the SGC707 probe increases the expression of 4.1B while decreasing the protein expression of DNA methylation components, UHRF1/DNMT1. We further asked whether overexpression of 4.1B in low expressing BTSC lines would have similar effects on PRMT3 and its downstream targets. We first tested whether the expression of 4.1B would increase following a time-course treatment of BT2484.1Blow cells with a DNA demethylating agent, 5′ Aza-2′-deoxycytidine (5′-Aza). An increase in 4.1B protein levels were observed following 24 hours treatment with 5′-Aza (Supplementary Figure S3a). The BT2484.1Blow cells treated with 5′-Aza showed decreased protein levels of UHRF1 with an increased expression of p21 (Figure 4a). We next validated these findings with a doxycycline inducible system in BT2484.1Blow cells and verified protein overexpression after treatment with different doxycycline concentrations (Supplementary Figure S3b). While there were no changes in the protein levels of PRMT3, reduced levels of RPS2 and UHRF1 were observed in 4.1B overexpressing BTSCs (Supplementary Figure S3b). These findings suggest that overexpression of 4.1B results in decreased enzymatic activity of PRMT3, which in turn induces changes in its downstream targets such as RPS2 and UHRF1. We next investigated whether overexpression of 4.1B would result in resistance to SGC707 treatment in BT2484.1Blow cells, as observed in the BT1894.1Bhigh and BT1434.1Bhigh cell lines, which have high endogenous expression of 4.1B. Thus, we treated 4.1B overexpressing and control BT248 cells with SGC707 or XY1 negative probes and assessed the effects on previously validated protein targets and cell viability. We did not observe any additional effects of SGC707 treatment on the protein levels of RPS2, UHRF1, DNMT1 and p21 in 4.1B overexpressing BT2484.1Blow cells relative to XY1 and SGC707 treated negative control cells (Figure 4b). However, 4.1B overexpression abolished the sensitivity of BT2484.1Blow cells to PRMT3 inhibition (Figure 4c). EdU cell cycle analysis further showed that 4.1B overexpressing BT2484.1Blow cells had a significant decrease in the percentage of cells entering S phase with a corresponding increase in the percentage of cells arrested in the G2/M phase of cell cycle relative to negative control cells (Figure 4d, e).
The effects of 4.1B overexpression on growth and cell cycle progression were corroborated in vivo. Mice orthotopically xenografted with BT2484.1Blow cells stably overexpressing EPB41L3 had a significant improvement in median survival compared to mice xenografted with empty vector-expressing control cells (Figure 4f, g). We next investigated whether overexpression of 4.1B negatively influences the enzymatic activity of the PRMT3 protein through protein-protein interactions as previously reported9. Co-immunoprecipitation showed protein-protein interaction between 4.1B and PRMT3 in doxycycline treated BT2484.1Blow cells with no interaction in the negative control cells (Figure 4h). These data further confirm that the interaction of PRMT3 with 4.1B in a subset of GBM BTSCs with high endogenous expression of 4.1B may negatively influence its enzymatic activity resulting in desensitization to SGC707 treatment.
3.5. EPB41L3 Knockout Increases the Sensitivity of BTSCs to PRMT3 Inhibition
To further explore the functional interplay between 4.1B and PRMT3, we performed CRIPSR-Cas9 mediated KO of EPB41L3 in BT1434.1Bhigh cells with two independent gRNAs and an AAVS1 cut control gRNA. One of the gRNAs was effective in knocking out EPB41L3 and ablated 4.1B protein expression (Supplementary Figure S4). Next, we treated the EPB41L3 KO and AAVS1 cut control BT1434.1Bhigh cells with the SGC707 and XY1 probes to assess whether EPB41L3 KO affected the response of BT1434.1Bhigh cells to PRMT3 inhibition. EPB41L3 KO BT1434.1Bhigh cells had decreased protein levels of PRMT3, RPS2, UHRF1/DNMT1 and p21 similar to what was observed following SGC707 treatment in BT2484.1Blow cells (Figure 5a). There was a significant decrease in cell viability of the EPB41L3 KO cells treated with SGC707 relative to the XY1 treated EPB41L3 KO and AAVS1 XY1 and SGC707 treated cells (Figure 5b). However, KO of EPB41L3 alone did not affect the percentage cell viability of BT1434.1Bhigh cells (Figure 5b).
These findings were further supported by changes in cell cycle phases of EPB41L3 KO and AAVS1 control BT1434.1Bhigh cells following treatment with SGC707 or XY1 probes. Interestingly, there was a significant decrease in the percentage of SGC707 treated EPB41L3 KO BT1434.1Bhigh cells entering S phase of the cell cycle relative to XY1 treated EPB41L3 KO and, XY1 and SGC707 treated AAVS1 control BT1434.1Bhigh cells (Figure 5c, d). Co-immunoprecipitation assays further showed protein-protein interaction between 4.1B and PRMT3, which was decreased in EPB41L3 KO BT1434.1Bhigh cells compared to AAVS1 control cells (Figure 5e). These findings indicate that downregulation of the high endogenous protein levels of 4.1B relieves its negative regulatory impact on PRMT3. Taken together, these data validate the role of 4.1B in regulating the enzymatic activity and function of PRMT3 in BTSCs and indicate its potential as a biomarker for evaluating the response to PRMT3 inhibitors in GBM patients.
3.6. Inhibition of PRMT3 with SGC707 Changes the Subcellular Localization of Downstream Effector Molecules
PRMT3 has been reported to be primarily localized in the cytoplasm, where it catalyzes arginine methylation of its cytoplasmic substrates4-5. Arginine and lysine methylation are catalyzed by different PRMTs and lysine methyltransferases (KMTs) which influence the stability and subcellular localization of their target proteins29-34. For example, the protein stability of UHRF1 has been shown to be regulated by post-translational modifications catalyzed by KMTs, SET7 and SET8, to repair DNA damage and prevent excessive DNA methylation, respectively31, 32. We observed a dramatic reduction in the protein levels of UHRF1 and DNMT1 following PRMT3 inhibition with SGC707 (Figure 3d, f) or through manipulating its negative regulator, 4.1B (Figure 4a, b, Figure 5a). Whether PRMT3 plays a role in regulating the stability or subcellular localization of the UHRF1 protein has not been examined. Intriguingly, a time-course treatment of BT248 cells with SGC707 revealed an accumulation of UHRF1 protein in the cytoplasm and a decrease in the nuclear fraction at 24- and 48-hours post-treatment (Figure 6a). UHRF1 protein was cleared in both the cytoplasmic and nuclear fractions at 72-hours post treatment (Figure 6a). Immunofluorescent staining of BT248 cells with PRMT3 and UHRF1 antibodies after 48 hours treatment with the XY1 negative probe confirmed that PRMT3 expression remained cytoplasmic, whereas UHRF1 protein was primarily localized in the nucleus (Figure 6b). Inhibition of PRMT3 with SGC707 reduced the expression of both PRMT3 and UHRF1, resulting in a change in the subcellular localization of UHRF1, which accumulated in the cytoplasm (Figure 6b). These data indicate that PRMT3-mediated arginine methylation may play a role in regulating the stability and localization of UHRF1 protein in BTSCs.
Post-translational modifications of UHRF1 also regulate its role in DNA methylation maintenance and cell cycle progression in normal and cancer cells33, 34. Recruitment of the UHRF1/DNMT1 complex can modulate the DNA methylation at the 5′ regulatory regions of its cell cycle target genes such as TP53 and CDKN1A34. We observed increased protein expression of p21, which could be a consequence of altered UHRF1-mediated DNA methylation following PRMT3 inhibition (Figure 3d, 4a, b). Next, we evaluated the subcellular localization of p53 and p21 and found no observable change in the expression or sub-cellular localization of p53 in BT248 cells. In contrast, we observed a significant accumulation of p21 in the nuclear fraction of SGC707 treated samples relative to XY1 and MS023 probe-treated samples (Figure 6c). The proapoptotic BCL2 interacting protein (BNIP3), which is a downstream target of p2135, also accumulated in the cytoplasm. Thus, a reduction in UHRF1/DNMT1 proteins may result in promoter demethylation and increased p21 expression. Collectively, these findings suggest a p53-independent-role of p21, which functions through BNIP3 and impacts the viability of BTSCs as previously reported in pancreatic cancer cells35.
To further confirm the role of PRMT3 in regulating UHRF1 and 4.1B proteins, we performed CRISPR-cas9 stable knockouts (KO) of PRMT3 and UHRF1 in BT248 cells. We found a similar effect of PRMT3 KO on UHRF1 and 4.1B proteins (Figure 6d). However, there was no change in the protein levels of PRMT3 in UHRF1 KO cells (Figure 6d). Further, there was significant improvement in the median survival of mice orthotopically xenografted with PRMT3 KO compared to AAVS1 control and UHRF1 KO mice (Figure 6e). These findings were validated by shRNA-mediated knockdown of PRMT3 in BT248 cells. Decreased cell proliferation in vitro and improved median survival of mice orthotopically xenografted with PRMT3 knockdown cells compared to scrambled control mice were observed (Supplementary Figure S5a-d). Knockout of UHRF1 did not affect BTSCs’ growth in vivo; as observed following PRMT3 inhibition (Figure 6e). These data suggest that targeting UHRF1 alone may not be sufficient for these processes in BTSCs. Collectively, these findings suggest that PRMT3-mediated arginine methylation may play a role in regulating the stability and nuclear localization of UHRF1. UHRF1 along with its epigenetic partner, DNMT1, may modulate DNA methylation to suppress the activity of tumour suppressor genes including EPB41L3 and CDKN1A, which, in turn, may contribute to growth and tumorigenic potential in BTSCs.
3.7. Dual Targeting of UHRF1 and DNMT1 Impacts Cell Viability in BTSCs
Our data suggest that UHRF1 may be one of the downstream targets of PRMT3 whose subcellular localization is influenced by PRMT3. Thus, we further investigated whether targeting UHRF1 could be as effective in impacting BTSCs viability as that observed following PRMT3 inhibition. We tested a natural tropolone derivative, β-thujaplicin, which targets the RNA and protein expression of both UHRF1 and DNMT1 and has been reported to display anti-cancer properties in many human cancers36-38 and a UHRF1 inhibitor, NSC23200339. The UHRF1 inhibitor, NSC232003, did not significantly affect the viability of BTSCs, suggesting that targeting UHRF1 alone may not be sufficient in BTSCs (Figure 7a). However, we observed a dose-dependent effect of β-thujaplicin in reducing cell viability in most BTSC lines at nanomolar to low micromolar concentrations (Figure 7b). Notably, increased expression of DNMT1 appeared to be associated with poor survival in primary and recurrent IDH-wildtype GBM patients26 (Figure 7c). Next, we treated BT2484.1Blow and BT1434.1Bhigh cells with β-thujaplicin in parallel with SGC707, MS023 and XY1 probes and evaluated the effect on UHRF1, DNMT1, PRMT3, and 4.1B protein expression. Treatment with β-thujaplicin mimicked the effect of SGC707 in reducing the protein levels of UHRF1, DNMT1, and PRMT3 and increased the expression of 4.1B and p21, in BT2484.1Blow cells (Figure 7d, Supplementary Figure S6a). In contrast, BT1434.1Bhigh cells predominantly showed decreased UHRF1 expression following treatment with β-thujaplicin along with a reduction in DNMT1 and an increase in p21 protein expression (Figure 7e, Supplementary Figure S6b), however, 4.1B expression remained unchanged (Figure 7e). These findings suggest that targeting UHRF1/DNMT1, which appears to function downstream of PRMT3, may has potential as an alternative therapeutic approach for targeting BTSC populations that exhibit high endogenous 4.1B expression (Figure 7f).
4. Discussion
In this study, we found that PRMT3, its negative regulator 4.1B, and the components of the DNA methylation complex, UHRF1/DNMT1, function as a signaling axis that affects cell growth of a subset of GBM BTSCs. We show that PRMT3 regulates the expression of UHRF1 and its sub-cellular localization to the nucleus. The UHRF1/DNMT1-mediated methylation of the promoter regions of EPB41L3 gene may, in part, be playing a role in suppressing the expression of 4.1B (model depicted in Figure 7f). EPB41L3 expression is low in GBM tissues and the majority of BTSC lines have low to no protein expression of 4.1B.
PRMT3 differs from other type I family members due to the presence of a unique C2H2 zinc finger motif at its N-terminus for substrate recognition3-5. Furthermore, PRMT3 is primarily localized in the cytoplasm where it regulates cytoplasmic substrates, such as those involved in ribosomal biosynthesis (RPS2), gene transcription (p53, c-MYC, HIF1-α, and the components of the VHL complex), metabolism (GAPDH, LDHA/B and ALDH1A1) and cytoskeleton stability (4.1B/DAL-1, MYO18B and TUBB4A) through arginine methylation4-8. Here, we show that either inhibition of PRMT3 with SGC707 or overexpression of 4.1B had similar effects in decreasing the expression of the members of the DNA methylation complex, UHRF1 and DNMT1. Our findings suggest that, like the post-translational modifications of UHRF1 catalyzed by SET7/SET8 enzymes31, 32, PRMT3-mediated arginine methylation may play a role in regulating the protein stability and subcellular localization of the UHRF1 protein in BTSCs. These driver events ultimately promote UHRF1/DNMT1-mediated DNA methylation of the 5′ regulatory regions of the EPB41L3 gene. A similar mechanism of PRMT5-mediated symmetric arginine methylation of histone H4 arginine 3 (H4R3me2s) has been shown to play a role in recruitment of DNMT3A resulting in target gene silencing40.
In addition to 4.1B, the expression and subcellular localization of p21 and BNIP3 proteins were also impacted by PRMT3 inhibition. This could also be due to UHRF1/DNMT1-mediated changes in the DNA methylation of 5′ regulatory regions of CDKN1A and BNIP3 genes following PRMT3 inhibition. These findings support the previously reported roles of UHRF1 in facilitating cell cycle progression in cancer cells by modulating the expression of cell cycle genes, including p53/p21 or p73, through DNA methylation33. Furthermore, p21 has been shown to induce cell cycle arrest and apoptosis in pancreatic cancer cells by promoting the expression of BNIP335. We show here that PRMT3 is an upstream regulator of UHRF1/DNMT1, which indirectly affects DNA methylation and hence, may influence the expression of tumour suppressor genes including EPB41L3 and CDKN1A (model depicted in Figure 7f).
Overall, our study identifies a unique context-specific function of PRMT3 in regulating the UHRF1/DNMT1 proteins to promote growth and tumorigenicity in BTSCs; a process that is normally controlled by the upstream negative regulator protein 4.1B. We show here the therapeutic relevance of targeting PRMT3 or UHRF1/DNMT1, in GBM tumours exhibiting low levels of 4.1B.
Supplementary Materials
The following supporting information can be downloaded at the website of this paper posted on Preprints.org.
Author Contributions
R.B., Conceptualization, study design, data collection, analysis and interpretation, validation, manuscript-writing original draft, review and editing. K.H., Bioinformatic analyses, manuscript-review. S.A., Designing of guide RNA sequences and lentiviral particles preparation for CRISPR-cas9 studies, manuscript-review. O.C., Data collection, validation, methodology, manuscript-review. X.H., In vivo experiments and analyses, manuscript-review. R.H., Establishing and maintaining BTSCs cultures, data collection, methodology. P.P., Conceptualization and manuscript review, H.A.L., Conceptualization, supervision, methodology, project administration, manuscript-editing and review. S.W., Conceptualization, resources, supervision, funding acquisition, validation, methodology, project administration, editing and final approval of manuscript.
Funding
This study was supported by a grant from the Canadian Institutes for Health Research (153246 to H.A. Luchman, S. Weiss).
Institutional Review Board Statement
This research complies with all relevant ethical regulations and all experimental procedures were conducted in accordance with the University of Calgary Ethics Review Board, Health Research Ethics Board of Alberta and the Animal Care Committee of the University of Calgary.
Data and material availability
All data used to evaluate the conclusions are in the main text and/or the supplementary materials. The bulk RNA-seq data for BT248 SGC707 treated versus XY1 treated cells are deposited in NCBI’s Gene Expression Omnibus (GEO) repository accession number: GSE281186. Processed primary/recurrence expression data was accessed through http://recur.bioinfo.cnio.es/ (Wang et al (2017).
Acknowledgments
We thank Dr. Wee Yong’s lab at the University of Calgary for providing human fetal brain tissue samples. We thank Yiping Liu Facility staff at The Flow Cytometry core facility (University of Calgary) for EdU cell cycle flow cytometric analysis. We thank the Centre for Health Genomics and Informatics (University of Calgary) for performing the RNA-sequencing and Dr. Paul Gordon, Bioinformatics Manager at Centre for Health Genomics and Informatics for analyzing RNA-sequencing data. We acknowledge our use of the gene set enrichment analysis, GSEA software, and Molecular Signature Database (MSigDB).
Conflicts of interest
The authors declare no potential conflicts of interest.
References
- Gayatri, S.; Bedford, M.T. Readers of histone methylarginine marks. Biochim. Biophys. Acta 2014, 1839, 702–710. [Google Scholar] [CrossRef]
- Wu, Q.; Schapira, M.; Arrowsmith, C.H.; Barsyte-Loveloy, A. Protein arginine methylation: from enigmatic functions to therapeutic targeting. Nature Reviews Drug Discovery, 2021, 20, 509–530. [Google Scholar] [CrossRef]
- Miyata, S.; Mori, Y.; Tohyama, M. PRMT3 is essential for dendritic spine maturation in rat hippocampal neurons. Brain Res. 2010, 1352, 11–20. [Google Scholar] [CrossRef] [PubMed]
- Swiercz, R.; Cheng, D.; Kim, D.; Bedford, M.T. Ribosomal protein RPS2 is hypomethylated in PRMT3-deficient mice. J. of Biol. Chem., 2007, 282, 16917–16923. [Google Scholar] [CrossRef] [PubMed]
- Hsu, S.-H.; Hung, W.-C. Protein arginine methyltransferase 3: A crucial regulator in metabolic reprogramming and gene expression in cancers. Cancer Letters 2023, 554. [Google Scholar] [CrossRef]
- Liao, Y.; et al. PRMT3 drives glioblastoma progression by enhancing HIF1A and glycolytic metabolism. Cell Death & Disease 2022, 13. [Google Scholar]
- Hu, Y.; Su, Y.; He, Y.; Liu, W.; Xiao, B. Arginine methyltransferase PRMT3 promote tumorigenesis through regulating c-MYC stabilization in colorectal cancer. Gene 2021, 791. [Google Scholar] [CrossRef] [PubMed]
- Shi, Y.; et al. PRMT3-mediated arginine methylation of IGFBP1 promotes oxaliplatin resistance in liver cancer. Nature Communications, 1932. [Google Scholar]
- Singh, V.; et al. DAL-1/4.1B tumor suppressor interacts with protein arginine N-methyltransferase 3 (PRMT3) and inhibits its ability to methylate substrates in vitro and in vivo. Oncogene, 2004, 23, 7761–7777. [Google Scholar] [CrossRef]
- Perez-Janices, N.; et al. EPB41L3, TSP-1 and RASSF2 as new clinically relevant prognostic biomarkers in diffuse gliomas. Oncotarget, 2015, 6, 368–380. [Google Scholar] [CrossRef]
- Zeng, R.; et al. EPB41L3 is a potential tumor suppressor gene and prognostic indicator in esophageal squamous cell carcinoma. International Journal of Oncology, 2018, 52, 1443–1454. [Google Scholar] [CrossRef]
- Cai, M.; et al. Expression, DNA methylation pattern and transcription factor EPB41L3 in gastric cancer: a study of 262 cases. Cell Communication and Signaling 2024, 22. [Google Scholar] [CrossRef] [PubMed]
- Bernkopf, D.B.; Williams, E.D. Potential role of EPB41L3 (protein 4.1B/Dal-1) as a target for treatment of advanced prostate cancer. Expert Opin. Ther. Targets, 2008, 12, 845–853. [Google Scholar] [CrossRef] [PubMed]
- Werren, E.A.; et al. Biallelic EPB4.1L3 variants underlie a developmental disorder with seizures and myelination defects. Brain 2024, 147, 4033–4042. [Google Scholar] [CrossRef] [PubMed]
- Wen, P.Y.; Kesari, S. Malignant gliomas in adults. The New England journal of medicine 2008, 359, 492–507. [Google Scholar] [CrossRef]
- Cancer Genome Atlas Research Network Comprehensive genomic characterization defines human glioblastoma genes and core pathways. Nature 2008, 455, 1061–1081. [CrossRef]
- Eisenbarth, D.; Wang, Y.A. Glioblastoma heterogeneity at single cell resolution. Oncogene, 2023, 42, 2155–2165. [Google Scholar] [CrossRef]
- Greenwald, A.C.; et al. Integrative spatial analysis reveals a multi-layered organization of glioblastoma. Cell 2024, 187, 2485–2502.e26. [Google Scholar] [CrossRef]
- Shen, Y.; et al. Comprehensive genomic profiling of glioblastoma tumors, BTICs, and xenografts reveals stability and adaptation to growth environments. Proc Natl Acad Sci U S A 2019, 116, 19098–19108. [Google Scholar] [CrossRef]
- Bahia, R.K.; et al. Epigenetic and molecular coordination between HDAC2 and SMAD3-SKI regulates essential brain tumour stem cell characteristics. Nature Communications 2023, 14, 5051. [Google Scholar] [CrossRef]
- Hao, X.; et al. BI-907828, a novel potent MDM2 inhibitor, inhibits glioblastoma brain tumor stem cells in vitro and prolongs survival in orthotopic xenograft mouse models. Neuro Oncol. 2023, 25, 913–926. [Google Scholar] [CrossRef]
- Luchman, H.A.; Stechishin, O.D.; Nguyen, S.A.; Lun, X.Q.; Cairncross, J.G.; Weiss, S. Dual mTORC1/2 blockade inhibits glioblastoma brain tumor initiating cells in vitro and in vivo and synergizes with temozolomide to increase orthotopic xenograft survival. Clinical cancer research: an official journal of the American Association for Cancer Res. 2014, 20, 5756–5767. [Google Scholar]
- Stechishin, O.D.; et al. On-target JAK2/STAT3 inhibition slows disease progression in orthotopic xenografts of human glioblastoma brain tumor stem cells. Neuro-oncology 2013, 15, 198–207. [Google Scholar] [CrossRef] [PubMed]
- Chesnelong, C.; Restall, I.; Weiss, S. Isolation and culture of glioblastoma brain tumor stem cells. Methods Mol. Biol. 2019, 1869, 11–21. [Google Scholar]
- Cusulin, C.; et al. Precursor states of brain tumor initiating cell lines are predictive of survival in xenografts and associated with glioblastoma subtypes. Stem Cell Reports 2015, 15, 1–9. [Google Scholar]
- Wang, Q.; et al. Tumor evolution of glioma-intrinsic gene expression subtypes associates with immunological changes in the microenvironment. Cancer cell 2017, 32, 42–46. [Google Scholar]
- Blanchart, A.; et al. UHRF1 licensed self-renewal of active adult neural stem cells. Stem Cells 2018, 36, 1736–1751. [Google Scholar] [CrossRef]
- Kim, J.K.; Estève, P.O.; Jacobsen, S.E.; Pradhan, S. UHRF1 binds G9a and participates in p21 transcriptional regulation in mammalian cells. Nucleic Acids Res. 2009, 37, 493–505. [Google Scholar] [CrossRef]
- Sinha, R.; Allemand, E.; Zhang, Z.; Karni, R.; Myers, M.P.; Krainer, A.R. Arginine methylation controls the subcellular localization and functions of the oncoprotein splicing factor SF2/ASF. Mol. Cell Biol. 2010, 30, 2762–2774. [Google Scholar] [CrossRef]
- Kim, K.H.; et al. PRMT5 mediates FoxO1 methylation and subcellular localization to regulate lipophagy in myogenic progenitors. Cell Rep. 2023, 42. [Google Scholar]
- Hahm, J.Y.; et al. Methylation of UHRF1 by SET7 is essential for DNA double-strand break repair. Nucleic Acids Res. 2019, 47, 184–196. [Google Scholar] [CrossRef]
- Zhang, H.; et al. SET8 prevents excessive DNA methylation by methylation-mediated degradation of UHRF1 and DNMT1. Nucleic Acids Res. 2019, 47, 9053–9068. [Google Scholar] [CrossRef] [PubMed]
- Gu, L.; Fu, Y.; Li, X. Roles of post-translational modifications of UHRF1 in cancer. Epigenetics & Chromatin 2024, 17. [Google Scholar]
- Wang, L.; et al. MOF-mediated acetylation of UHRF1 enhances UHRF1 E3 ligase activity to facilitate DNA methylation maintenance. Cell Reports 2024, 43. [Google Scholar]
- Manu, K.S.; Chai, T.F.; The, J.T.; Zhu, W.L.; Casey, P.J.; Wang, M. Inhibition of Isoprenylcysteine Carboxymethyltransferase induces cell-cycle arrest and apoptosis through p21 and p21-regulated BNIP3 induction in pancreatic cancer. Mol. Cancer Ther. 2017, 16, 914–923. [Google Scholar]
- Seno, S.; et al. β-Thujaplicin enhances TRAIL-induced apoptosis via the dual effects of XIAP inhibition and degradation in NCI-H460 human lung cancer cells. Medicines (Basel) 2021, 8. [Google Scholar]
- Lee, Y.S.; et al. Hinokitiol inhibits cell growth through induction of S-phase arrest and apoptosis in human colon cancer cells and suppresses tumor growth in a mouse xenograft experiment. J. Nat. Prod. 2013, 76, 2195–2202. [Google Scholar]
- Zhang, G.; et al. β-Thujaplicin induces autophagic cell death, apoptosis, and cell cycle arrest through ROS-mediated Akt and p38/ERK MAPK signaling in human hepatocellular carcinoma. Cell Death Dis. 2019, 10, 255. [Google Scholar]
- Myrianthopoulos, V.; et al. Tandem virtual screening targeting the SRA domain of UHRF1 identifies a novel chemical toll modulating DNA methylation. Eur. J. Med Chem. 2016, 114, 390–396. [Google Scholar]
- Zhao, Q.; et al. PRMT5-mediated methylation of histone H4R3 recruits DNMT3A, coupling histone and DNA methylation in gene silencing. Nature Structural and Molecular Biology 2009, 16, 304–311. [Google Scholar]
- Kaur, R.; et al. OTX2 exhibit cell-context-dependent effects on cellular and molecular properties of human embryonic neural precursors and medulloblastoma cells. Disease Model Mech. 2015, 8, 1295–1309. [Google Scholar]
- Liao, Y.; Smyth, G.K.; Shi, W. The R package Rsubread is easier, faster, cheaper and better for alignment and quantification of RNA sequencing reads. Nucleic Acids Res. 2019, 47, e47. [Google Scholar] [CrossRef] [PubMed]
- Love, M.I.; Huber, W.; Anders, S. Moderated estimation of fold change and dispersion for RNA-seq data with DESeq2. Genome Biology 2014, 15, 550. [Google Scholar] [CrossRef] [PubMed]
- Yu, G.; He, Q. ReactomePA: an RE/Bioconductor package for reactome pathway analysis and visualization. Molecular BioSystems 2016, 12, 477–479. [Google Scholar] [CrossRef] [PubMed]
- Subramanian, A.; et al. Gene set enrichment analysis: A knowledge-based approach for interpreting genome wide expression profiles. PNAS, 2005, 102, 15545–15550. [Google Scholar] [CrossRef]
- Mootha, V.K.; et al. PGC-1α-responsive genes involved in oxidative phosphorylation are coordinately downregulated in human diabetes. Nature Genetics, 2003, 34, 267–273. [Google Scholar] [CrossRef]
- UCSC Genome Browser (http://genome.ucsc.edu/).
Figure 1.
Expression levels of tumour suppressor protein, 4.1B predict BTSC response to the PRMT3 chemical probe, SGC707. a-c Cell viability of 9 BTSC lines and HFAs for 3 biological replicates following 14 days treatment with a PRMT3 chemical probe, SGC707, a type I family PRMT probe, MS023 and a negative probe, XY1 (0-10 µM). Data represent mean values ± SD, n=3. d Protein levels of 4.1B, PRMT3, RPS2 and UHRF1 in BTSC cell lines relative to hiPSCs and their normal NSCs and astrocyte derivatives (n=3). e, f Protein levels of 4.1B in BTSC lines derived from primary (e) and recurrent (f) GBM representing different genetic backgrounds (n=3). g Changes in the levels of asymmetric di-methyl arginine in BT248 cells following 72 hours treatment with SGC707 (0.1 µM) relative to the vehicle and XY1 negative controls (n=3). h Protein levels of PRMT3 and RPS2 in resistant (BT143, BT189) versus sensitive (BT248) BTSC lines following 72 hours treatment with SGC707 (0.1 µM) and XY1 negative control probe (n=3). i Protein levels of 4.1B, PRMT3 and RPS2 in BT248 cells following 72 hours treatment with SGC707 (0.1 µM) and XY1 negative control probes.
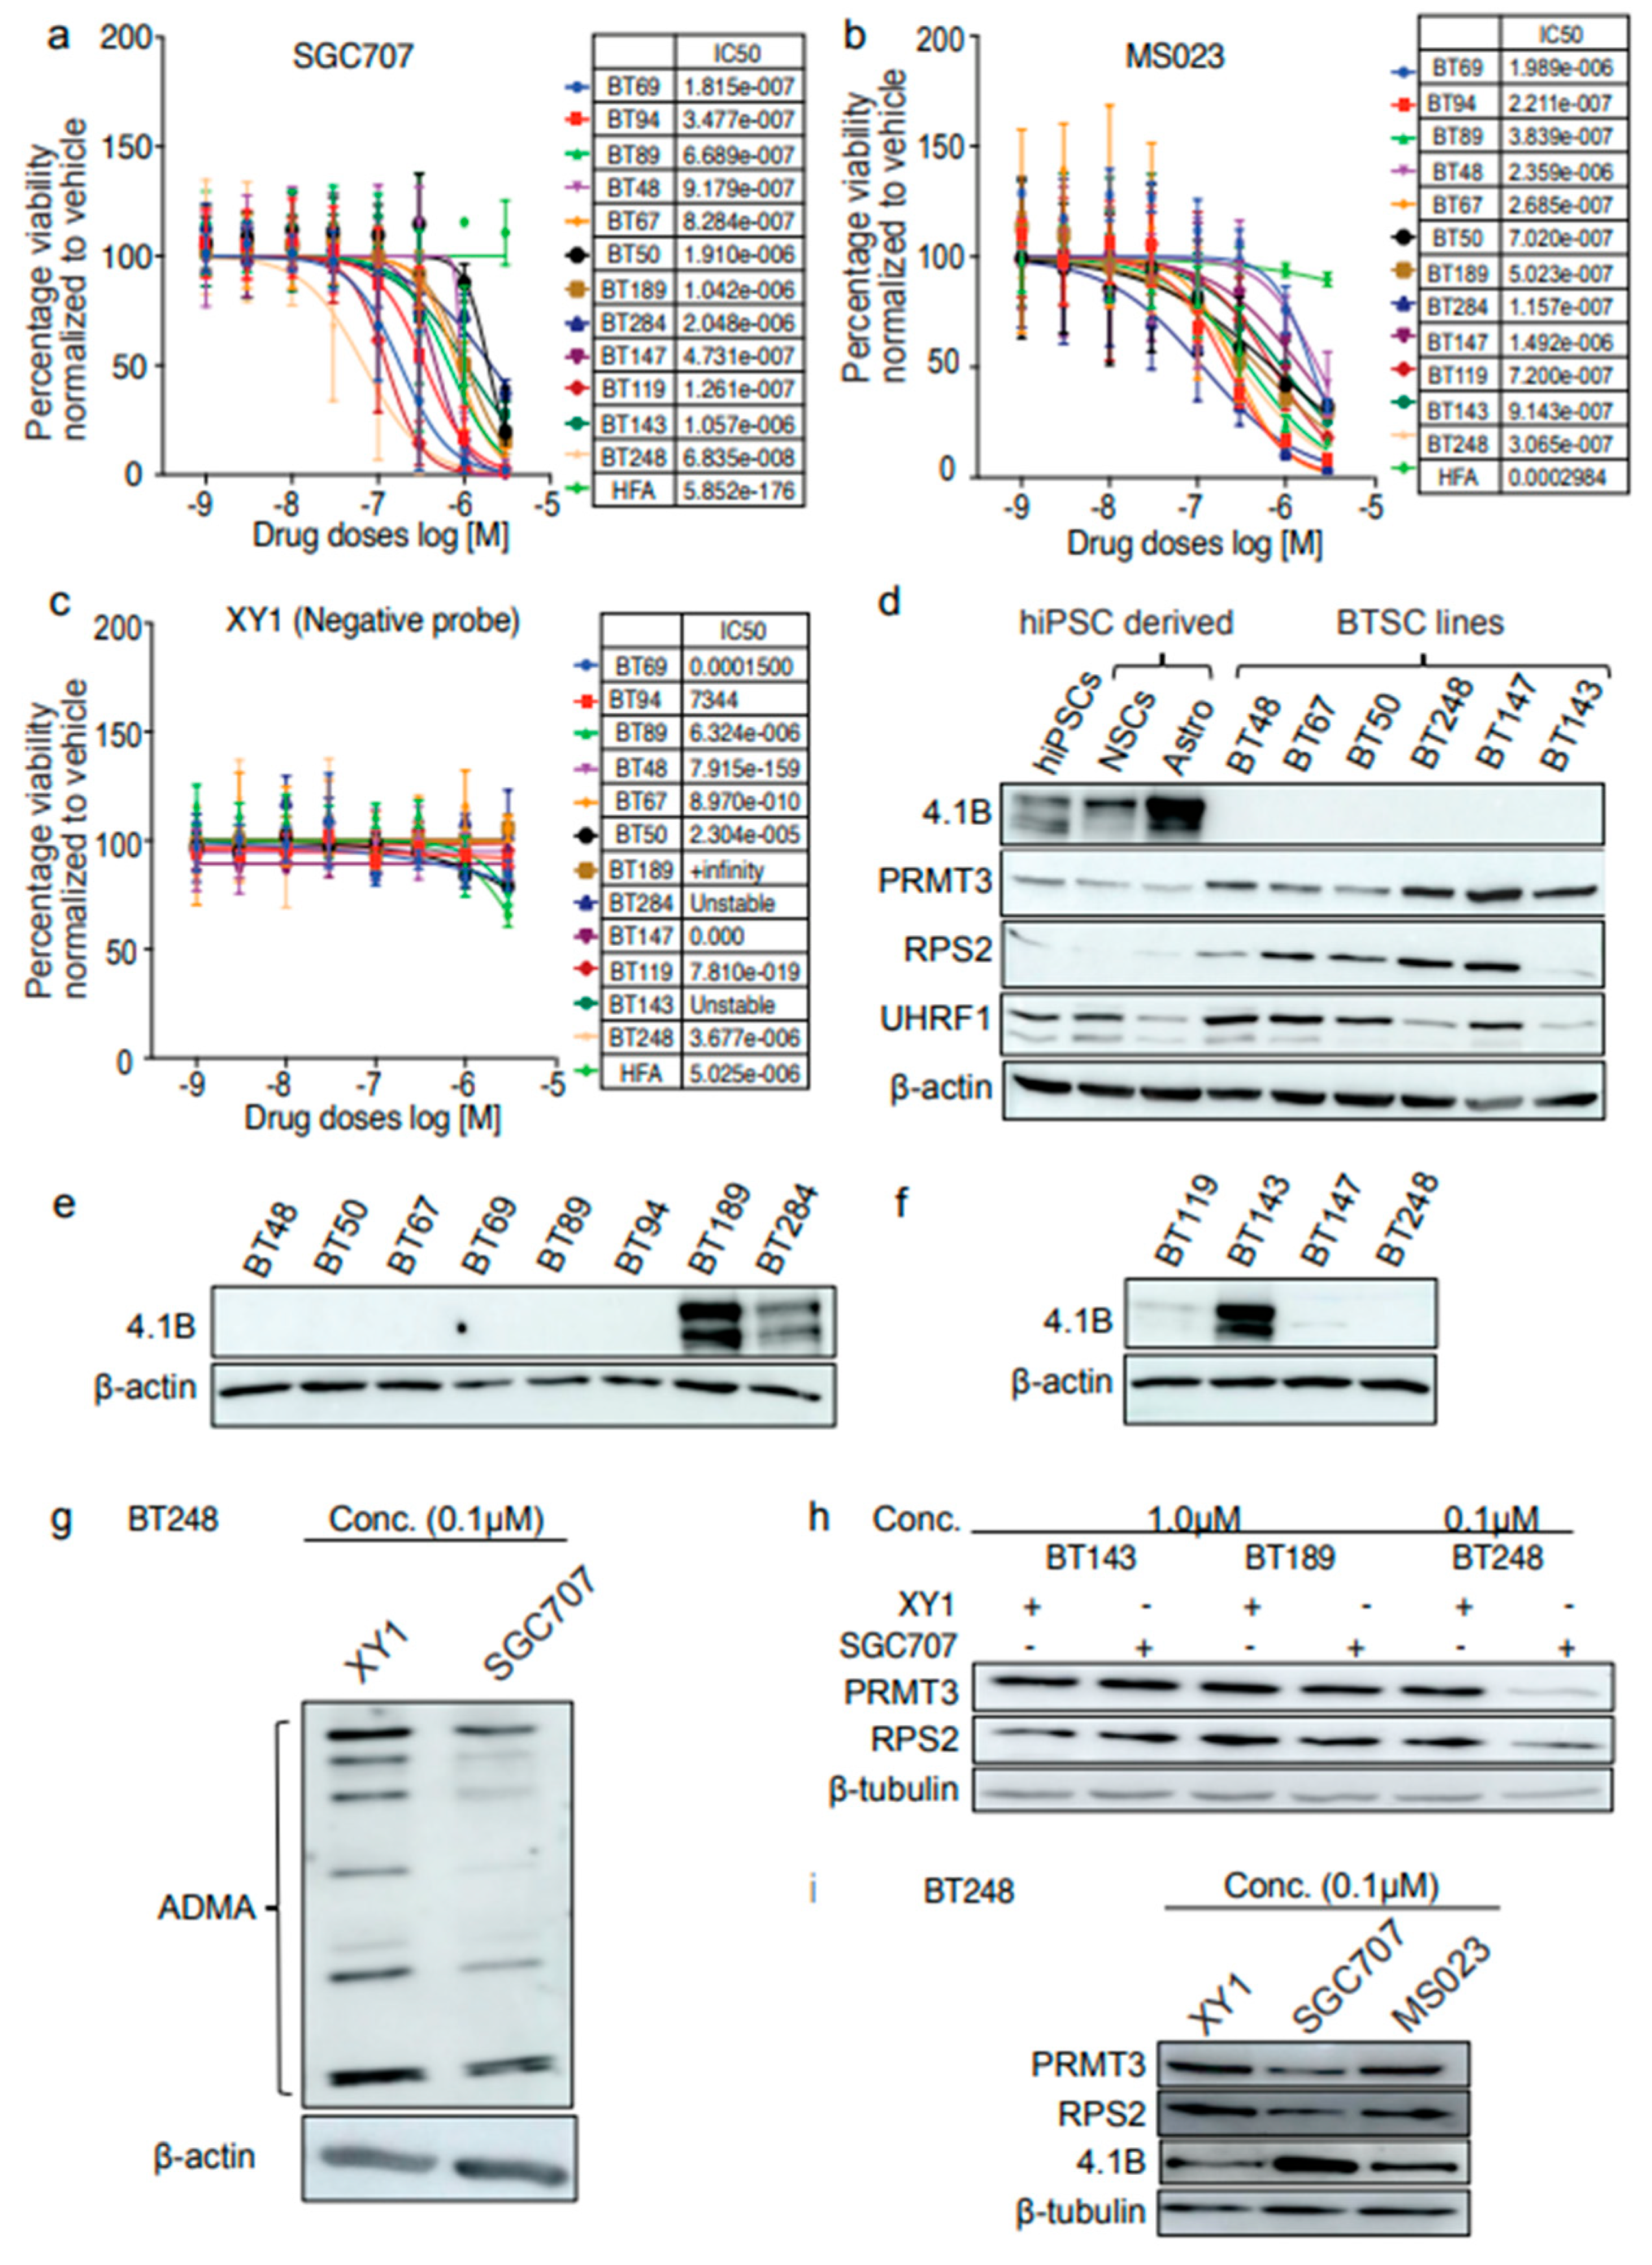
Figure 2.
Hypermethylation of 5′ regulatory regions result in loss of EPB41L3 expression in BTSCs. a Gene track showing the CpG sites within the 5′ upstream regulatory regions of EPB41L3 gene. b-d Methylation specific qPCR showing the methylation status of two CpG sites located within the 5′ upstream promoter and promoter/enhancer regions of the EPB41L3 gene in (b) BT2484.1Blow, (c) BT1894.1Bhigh and (d) BT1434.1Bhigh cells. (n=3). e Survival plot showing correlation of EPB41L3 expression with GBM patient survival (in months) from gene expression datasets obtained from primary and recurrent IDH-wildtype GBM samples26. f Representative immunofluorescence images of 4.1B and PRMT3 staining in BT2484.1Blow and BT1434.1Bhigh cells (n=3). Scale bar (100µM). Nuclei were stained with DAPI (blue).
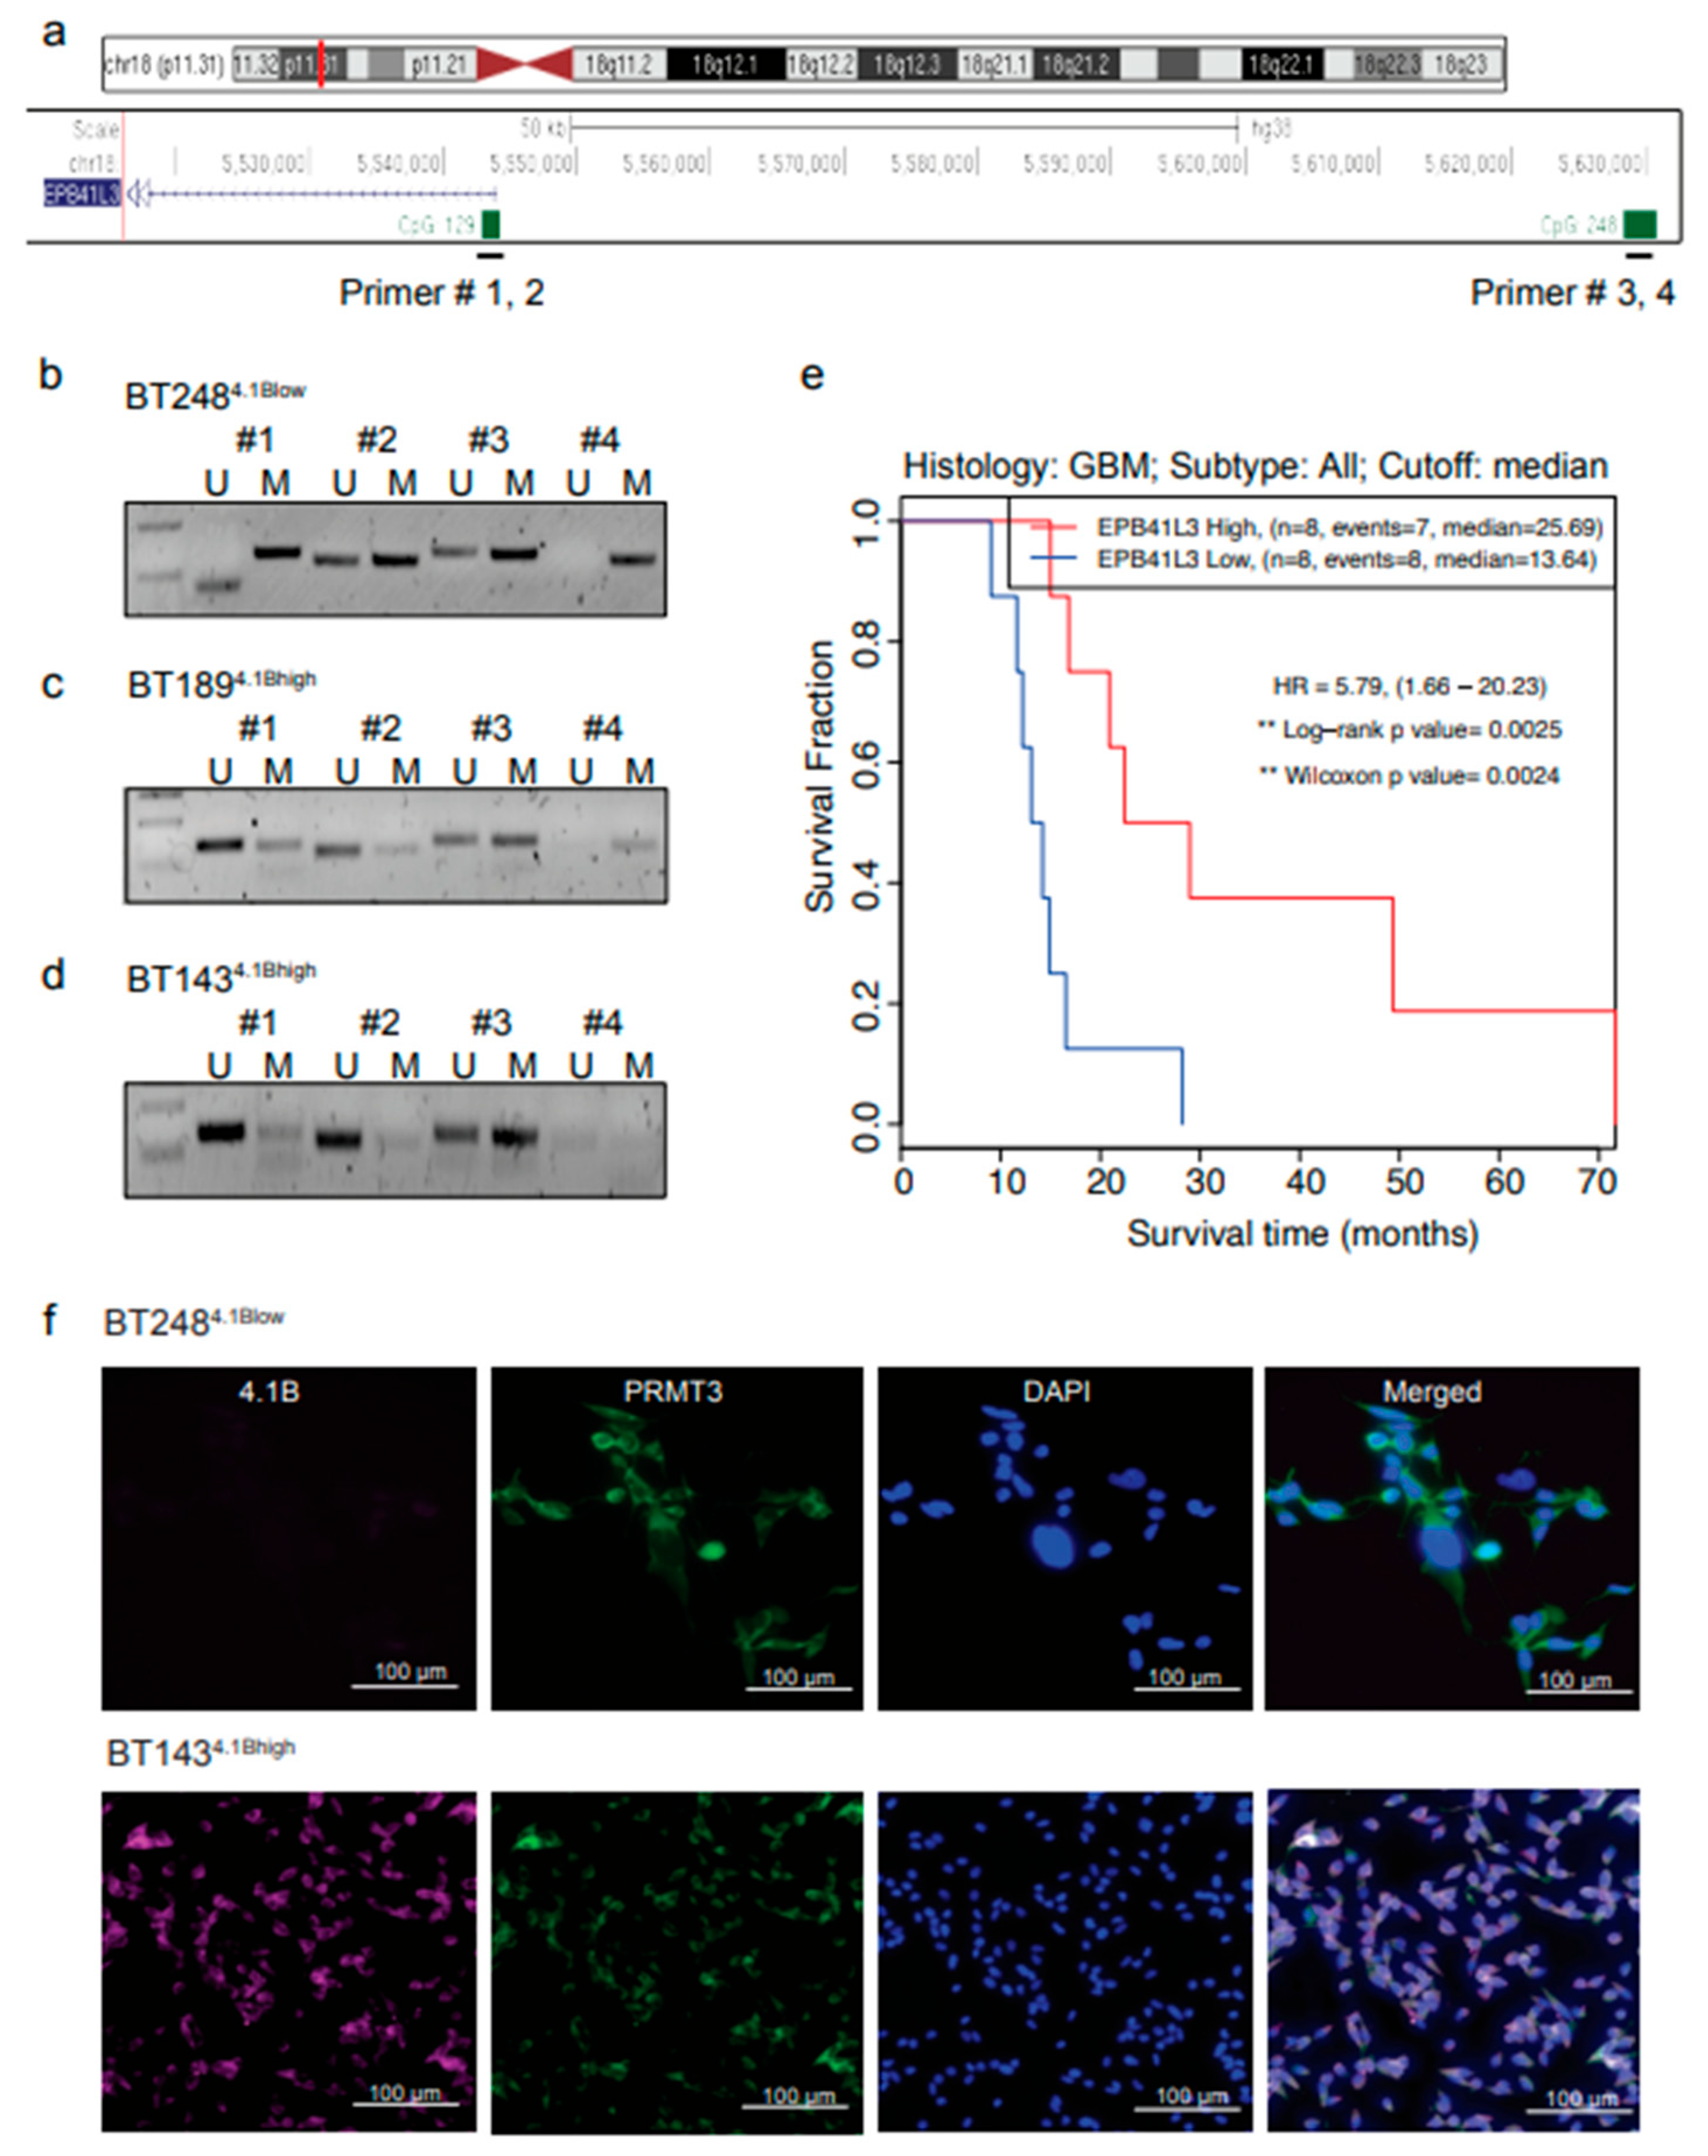
Figure 3.
Inhibition of PRMT3 activity with SGC707 impacts the expression of the members of the DNA methylation complex, UHRF1/DNMT1. a, b Gene set enrichment analysis showing the pathways up- (a) and down- (b) regulated in response to 72 hours treatment with SGC707 relative to the XY1 negative probe (n=3). c Volcano plot depicting the differential expression of transcripts associated with stem cells (SOX2, CD133, OLIG1/2), cell cycle regulation (CDK1/2 and CDKN2C), EPB4 family transcripts (EPB41 and EPB41L4A), inflammatory response (IL32, CXCL10 and CXCL3 and the members of TNF-α and NFK-β signaling pathways) and genes associated with the DNA methylation complex (UHRF1, DNMT1, DNMT3A) in SGC707 treated BT248 cells relative to the XY1 negative control. Blue dots denote transcripts that are significantly downregulated and red dots denote significantly upregulated transcripts in XY1 treated vs. SGC707 treated BT248 samples. *p<0.01 for all genes. n=3 biologically independent. d Western blot validation of the RNA-seq data in SGC707 treated vs. XY1 treated BT248 cells (n=3). e, f Comparative analysis of changes in the protein levels of 4.1B, PRMT3, RPS2, UHRF1 and DNMT1/3A in BT1434.1Bhigh and BT2484.1Blow cells following 72 hours treatment with SGC707 or XY1 negative probe (n=3).
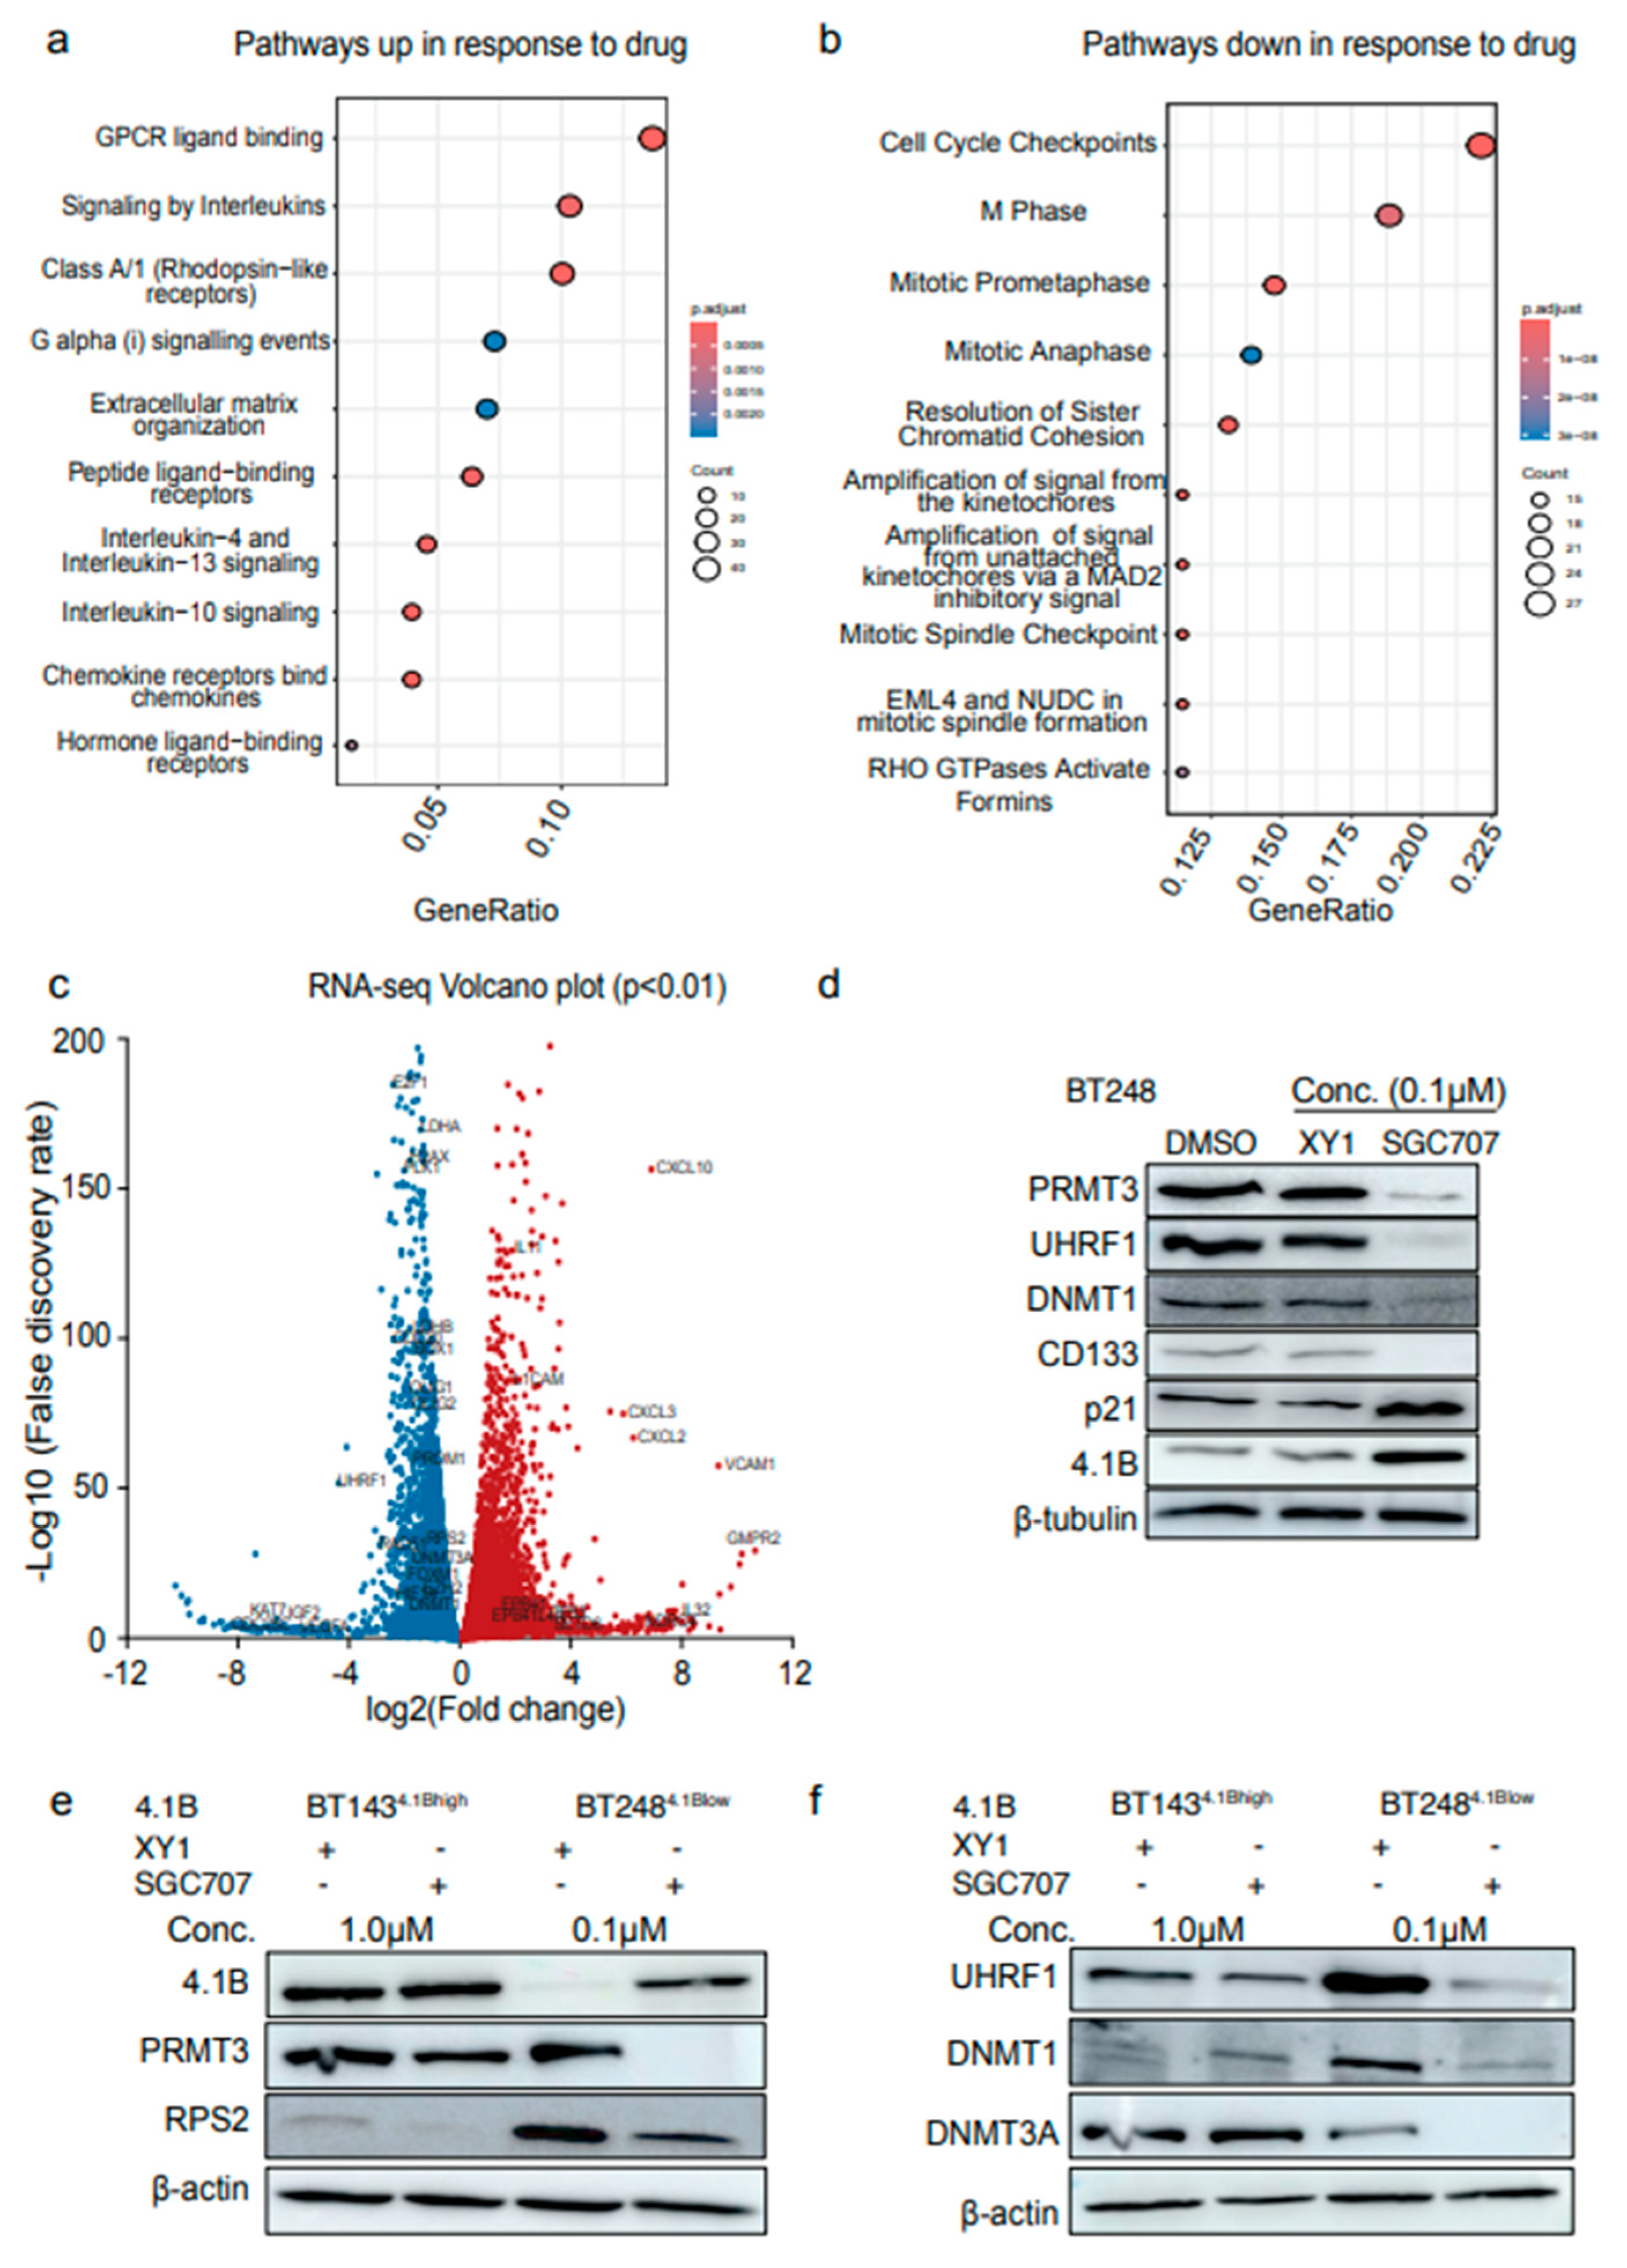
Figure 4.
Induced expression of 4.1B impacts the activity of PRMT3 and its downstream effectors, UHRF1/DNMT1. a Western blot analysis of changes in the protein levels of 4.1B, PRMT3, UHRF1, DNMT1 and p21 following treatment with 5′ Aza-2′-deoxycytidine (5′-Aza). b Protein levels of PRMT3, RPS2, UHRF1, DNMT1 and p21 in doxycycline inducible 4.1B overexpressing BT2484.1Blow cells relative to the negative control cells following 72 hours treatment either with SGC707 or XY1 negative probe. (n=3). c Cell viability for 4.1B overexpressing and negative control BT2484.1Blow cells following treatment with SGC707 or XY1 negative probe. Data represent mean values ± SD, n=3. d EdU assays showing the effect of doxycycline inducible overexpression of 4.1B on different phases of cell cycle relative to negative control BT2484.1Blow cells. Significance was unpaired two-tailed t-test with 95% confidence intervals, **p<0.01, ***p<0.001; data are represented as fold enrichment mean values ± SEM; n=3. e Representative flow plots of EdU incorporation and DNA content (Propidium iodide (PI)) from doxycycline treated 4.1B overexpressing BT2484.1Blow cells relative to negative control cells. Inset shows PI control only. f Western blot validation of stable overexpression of 4.1B in BT2484.1Blow cells relative to empty vector expressing control cells. g Kaplan-Meier survival curves for mice orthotopically xenografted with EPB4.1L3 overexpressing BT2484.1Blow cells compared to negative control mice (Log-rank (Mantel-Cox) method, ****p<0.0001, n=10). h Co-immunoprecipitation assays in dithiobis (succinimidyl propionate)) crosslinked doxycycline inducible 4.1B overexpressing BT2484.1Blow cells relative to negative control cells. (n=3).
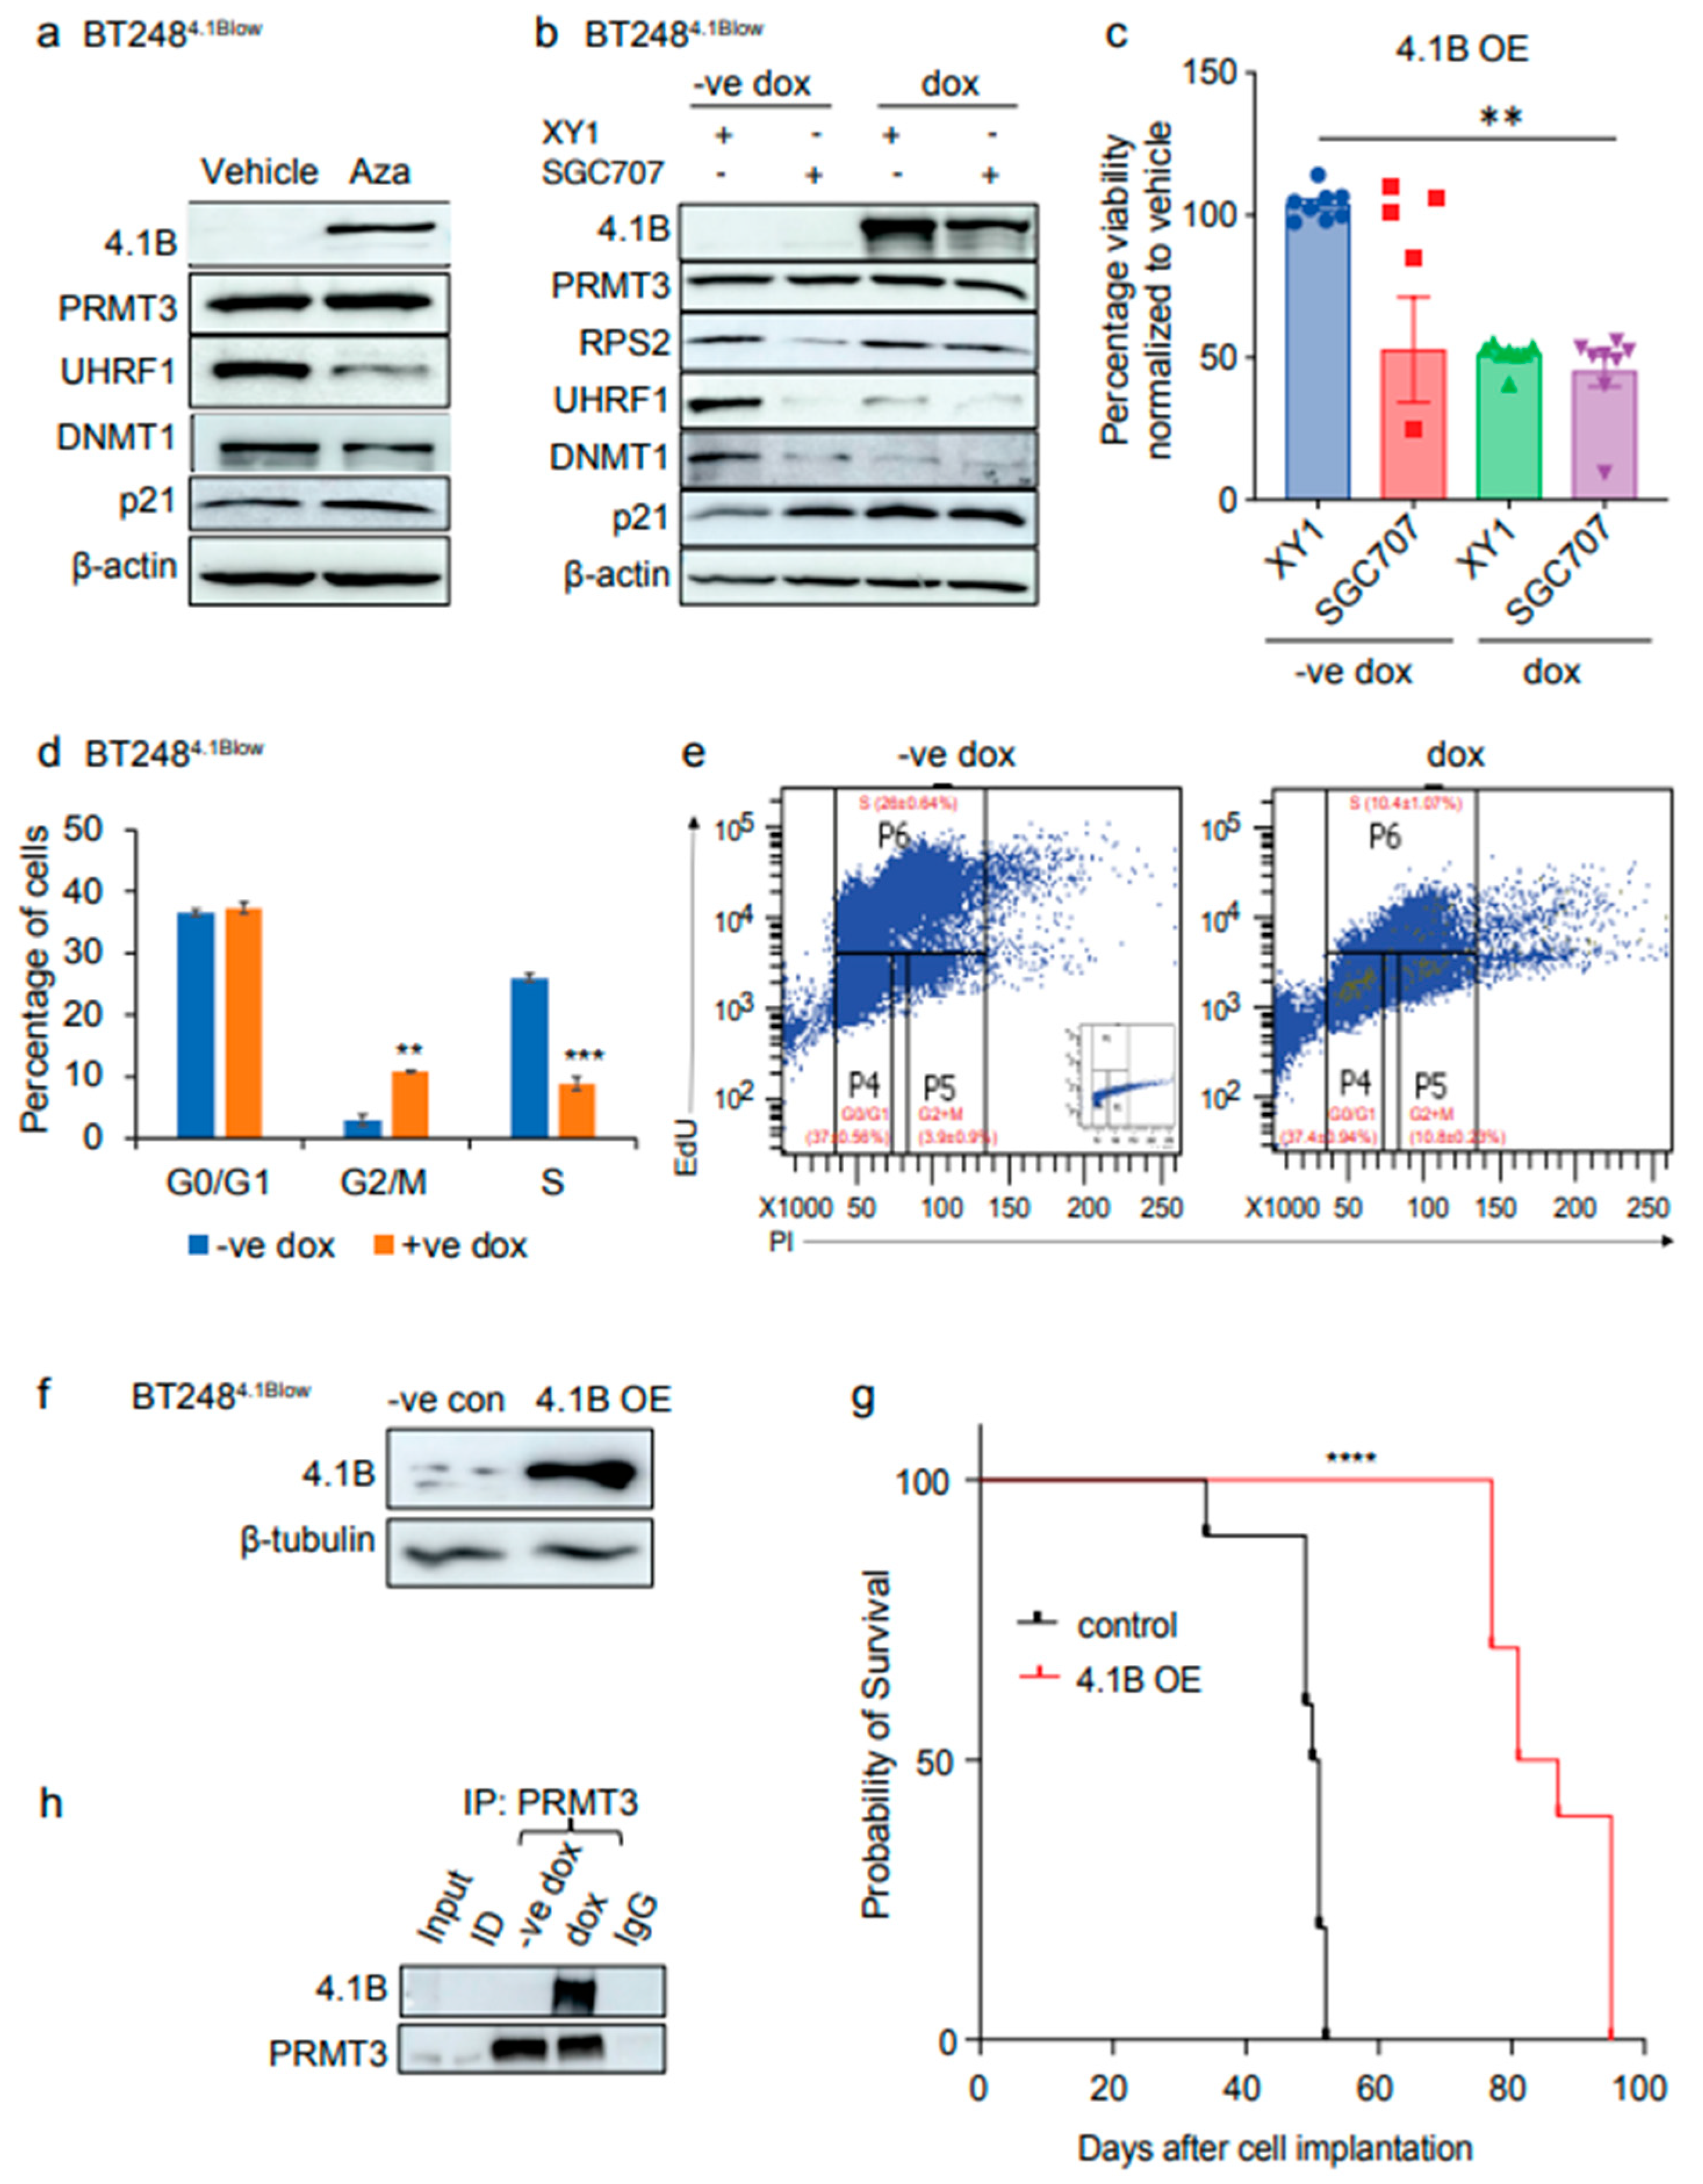
Figure 5.
EPB41L3 knockout increases the sensitivity of BTSCs to PRMT3 inhibition. a Effect of SGC707 treatment in EPB41L3 CRISPR-cas9 KO or AAVS1 control BT1434.1Bhigh cells relative to the XY1 negative probe treatment. (n=3). b Cell viability for EPB41L3 KO and AAVS1 BT1434.1Bhigh cells following treatment with SGC707 or XY1 negative probe. Data represent mean values ± SD, n=3. c EdU cell cycle analysis showing the effect of EPB41L3 KO on different phases of cell cycle in BT1434.1Bhigh cells relative to the AAVS1 control cells following treatment with either SGC707 or XY1 probes. Significance was determined using ANOVA (Dunnett’s test) at 95% confidence intervals, **p<0.01, ****p<0.0001; data are represented as mean values ± SEM; n=3. d Representative flow plots of EdU incorporation and DNA content (Propidium iodide (PI)) from SGC707 or XY1 treated AAVS1 control and EPB41L3 KO BT1434.1Bhigh cells. Inset shows PI control only. e Co-immunoprecipitation assays in dithiobis (succinimidyl propionate)) crosslinked EPB41L3 KO BT1434.1Bhigh cells relative to the AAVS1 control cells. (n=3).
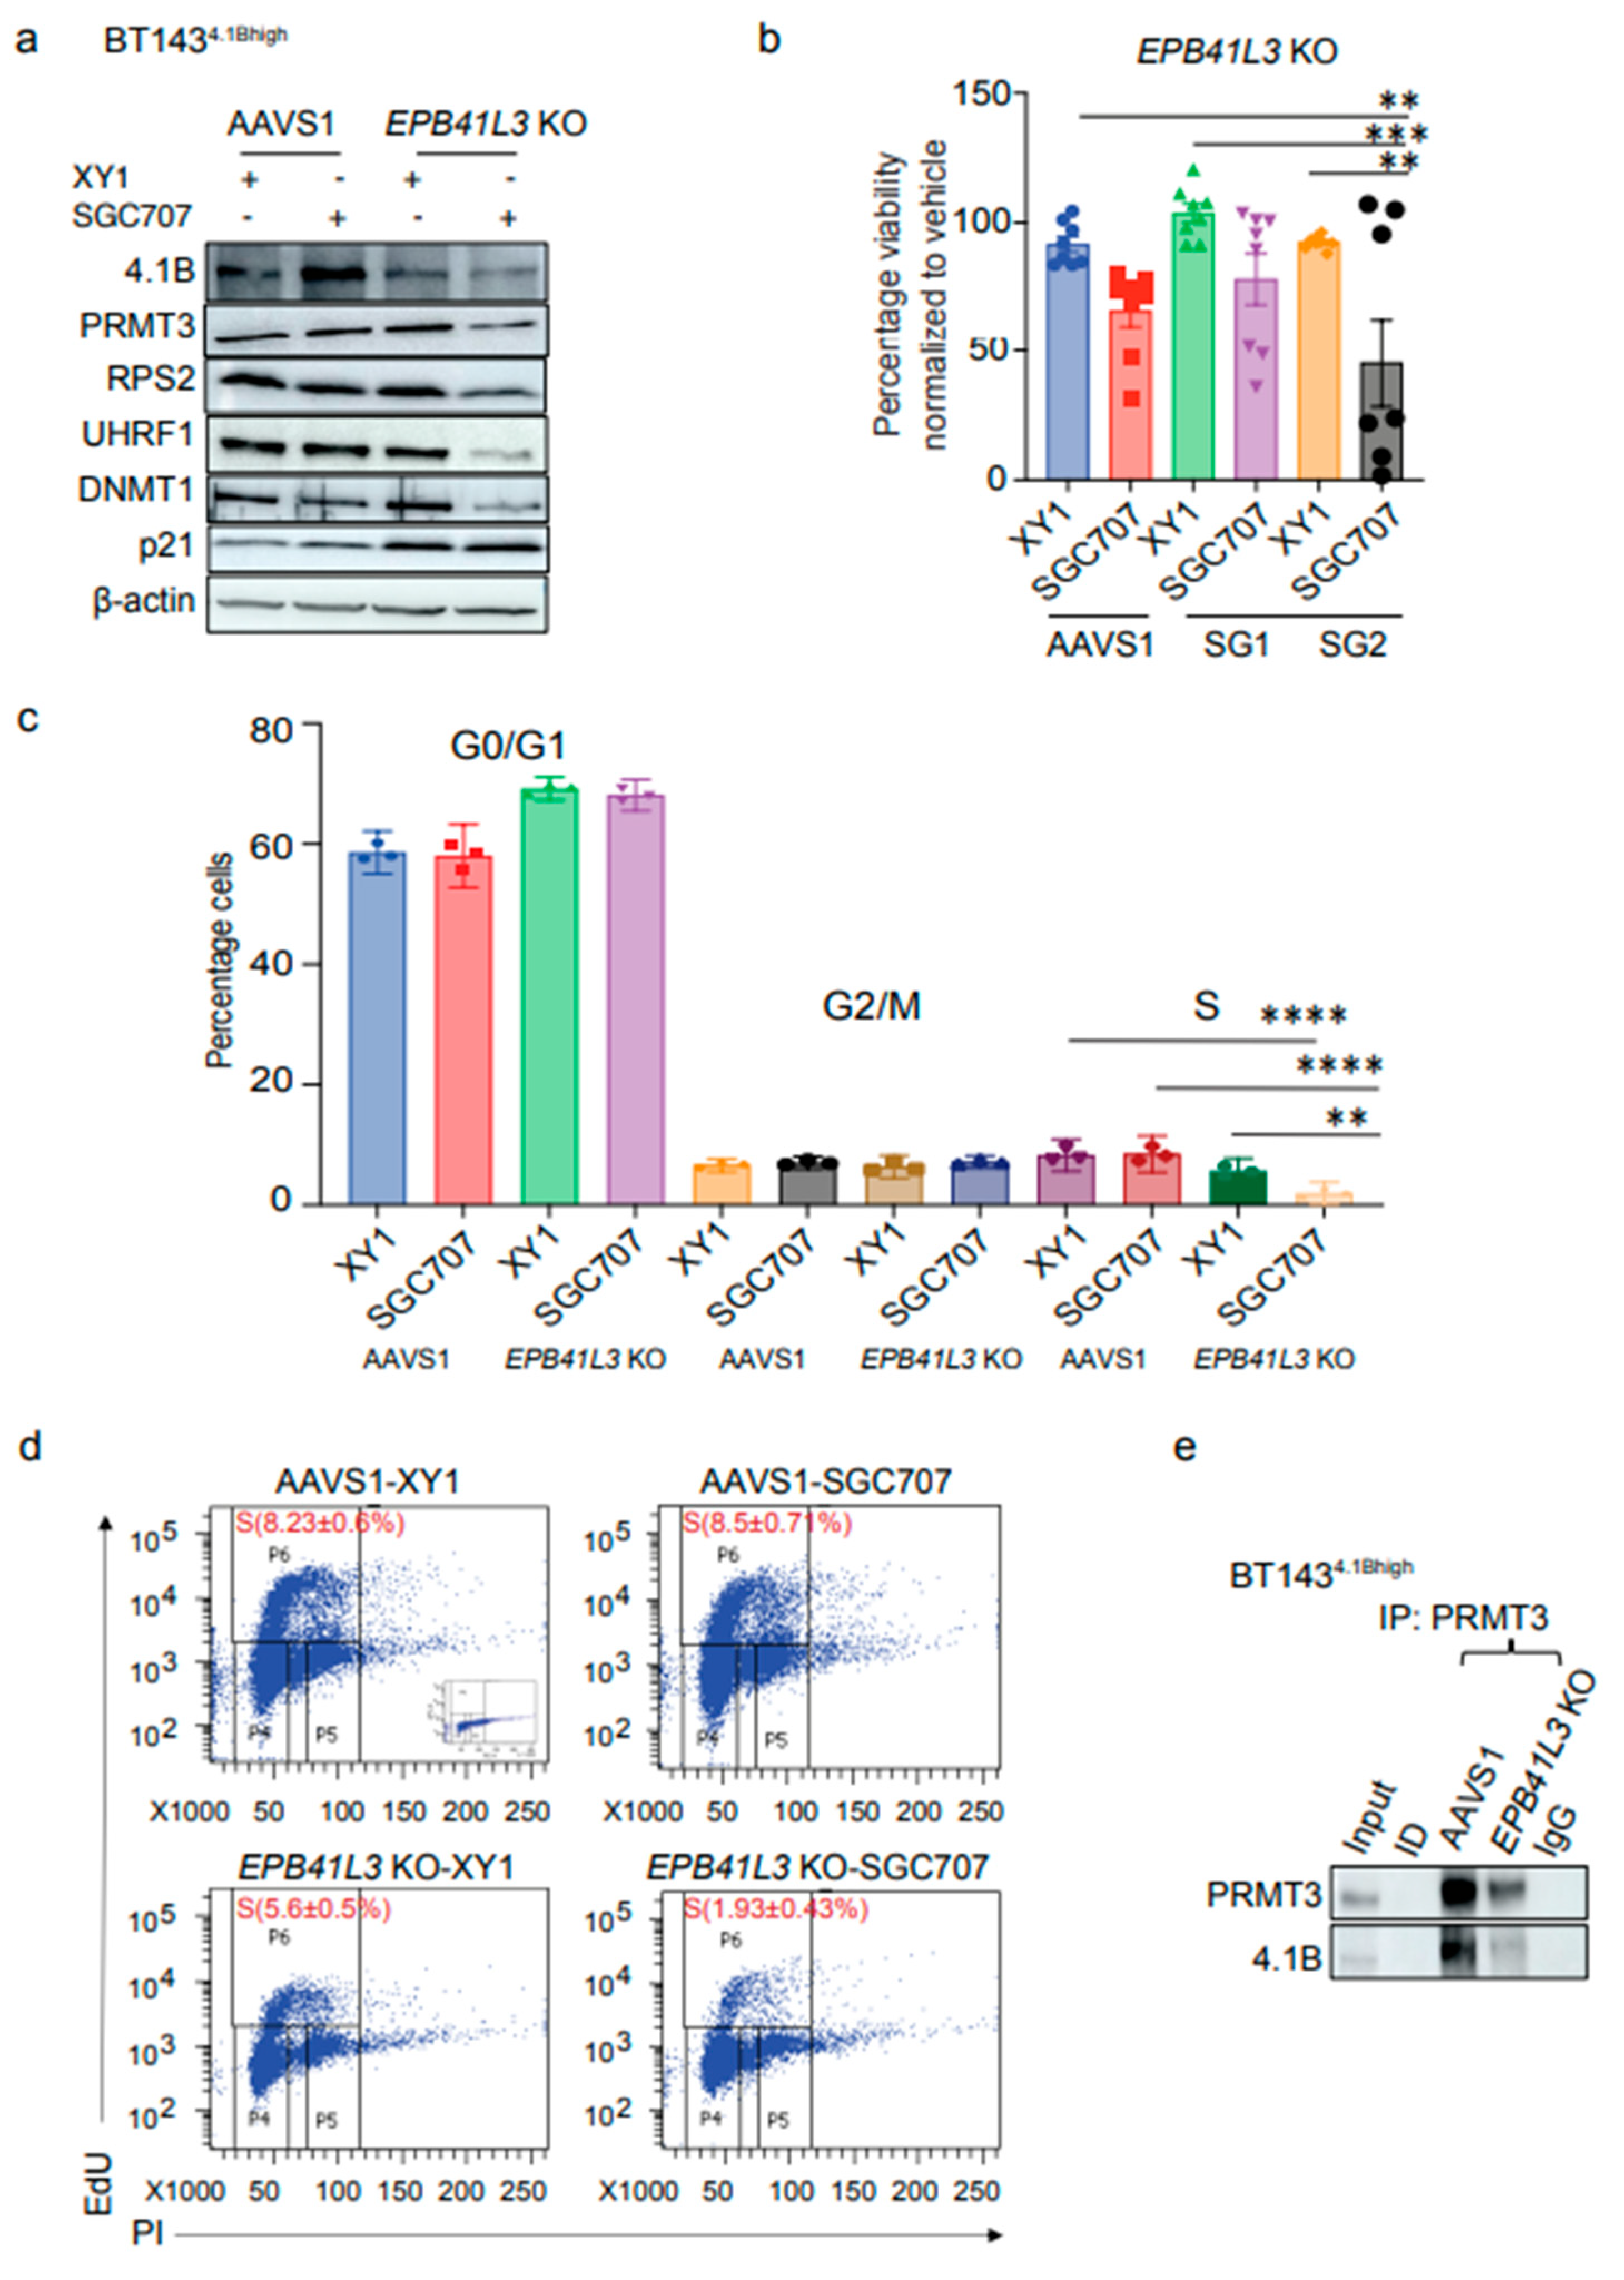
Figure 6.
Inhibition of PRMT3 with SGC707 changes the subcellular localization of downstream effector molecules. a Western blot analysis of changes in cytoplasmic and nuclear fractions of PRMT3 and UHRF1 following a time course treatment with SGC707 in BT248 cells relative to the XY1 negative control (n=3). b Immunofluorescent staining of PRMT3 and UHRF1 in SGC707 treated vs. XY1 treated BT248 cells (n=3). Scale bar (100µM). Nuclei were stained with DAPI (blue). c Western blot showing changes in cytoplasmic and nuclear fractions of PRMT3, p53, p21 and BNIP3 following treatment of BT248 cells with SGC707, MS023 or XY1 negative probe (n=3). d Validation of CRISPR-cas9 mediated KO of PRMT3 and UHRF1 and changes in downstream targets in BT248 cells using two independent guide RNAs for each gene. AAVS1 was used as CRISPR-cas9 cut control. e Kaplan-Meier survival curves for mice orthotopically xenografted with PRMT3 or UHRF1 KO BT248 cells compared to AAVS1 control mice (Log-rank (Mantel-Cox) method, ****p<0.0001, n=10).
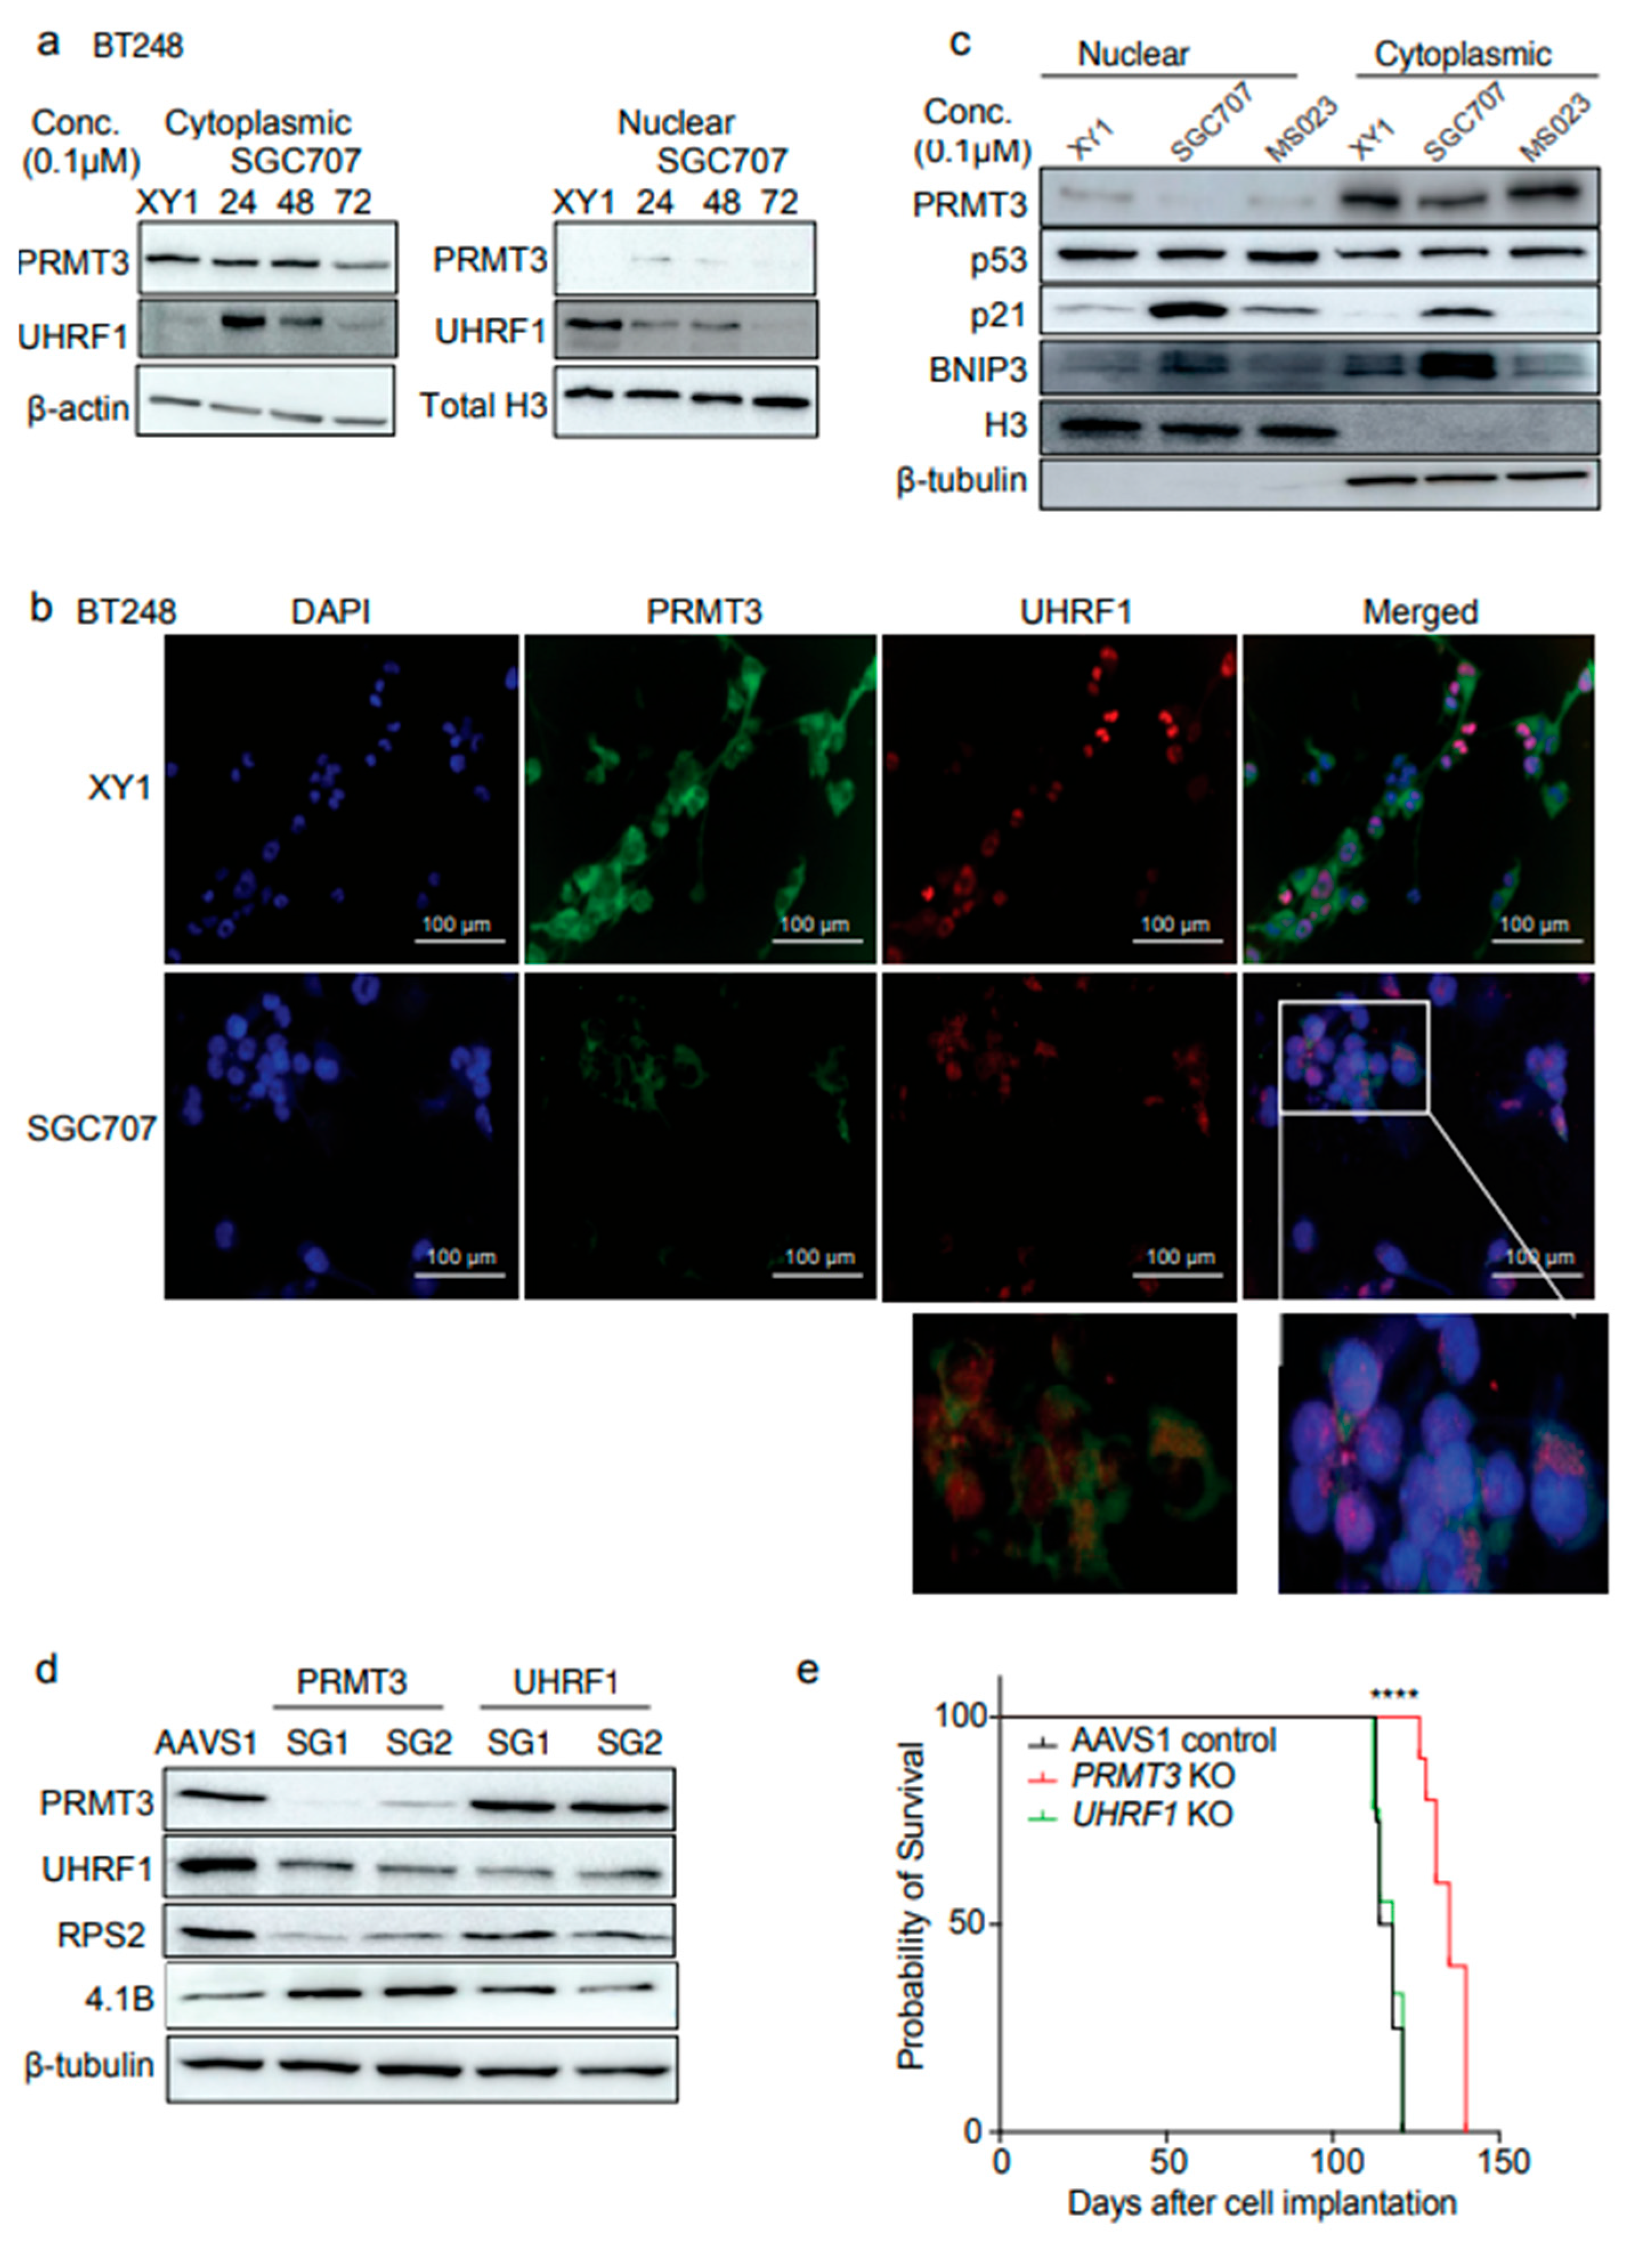
Figure 7.
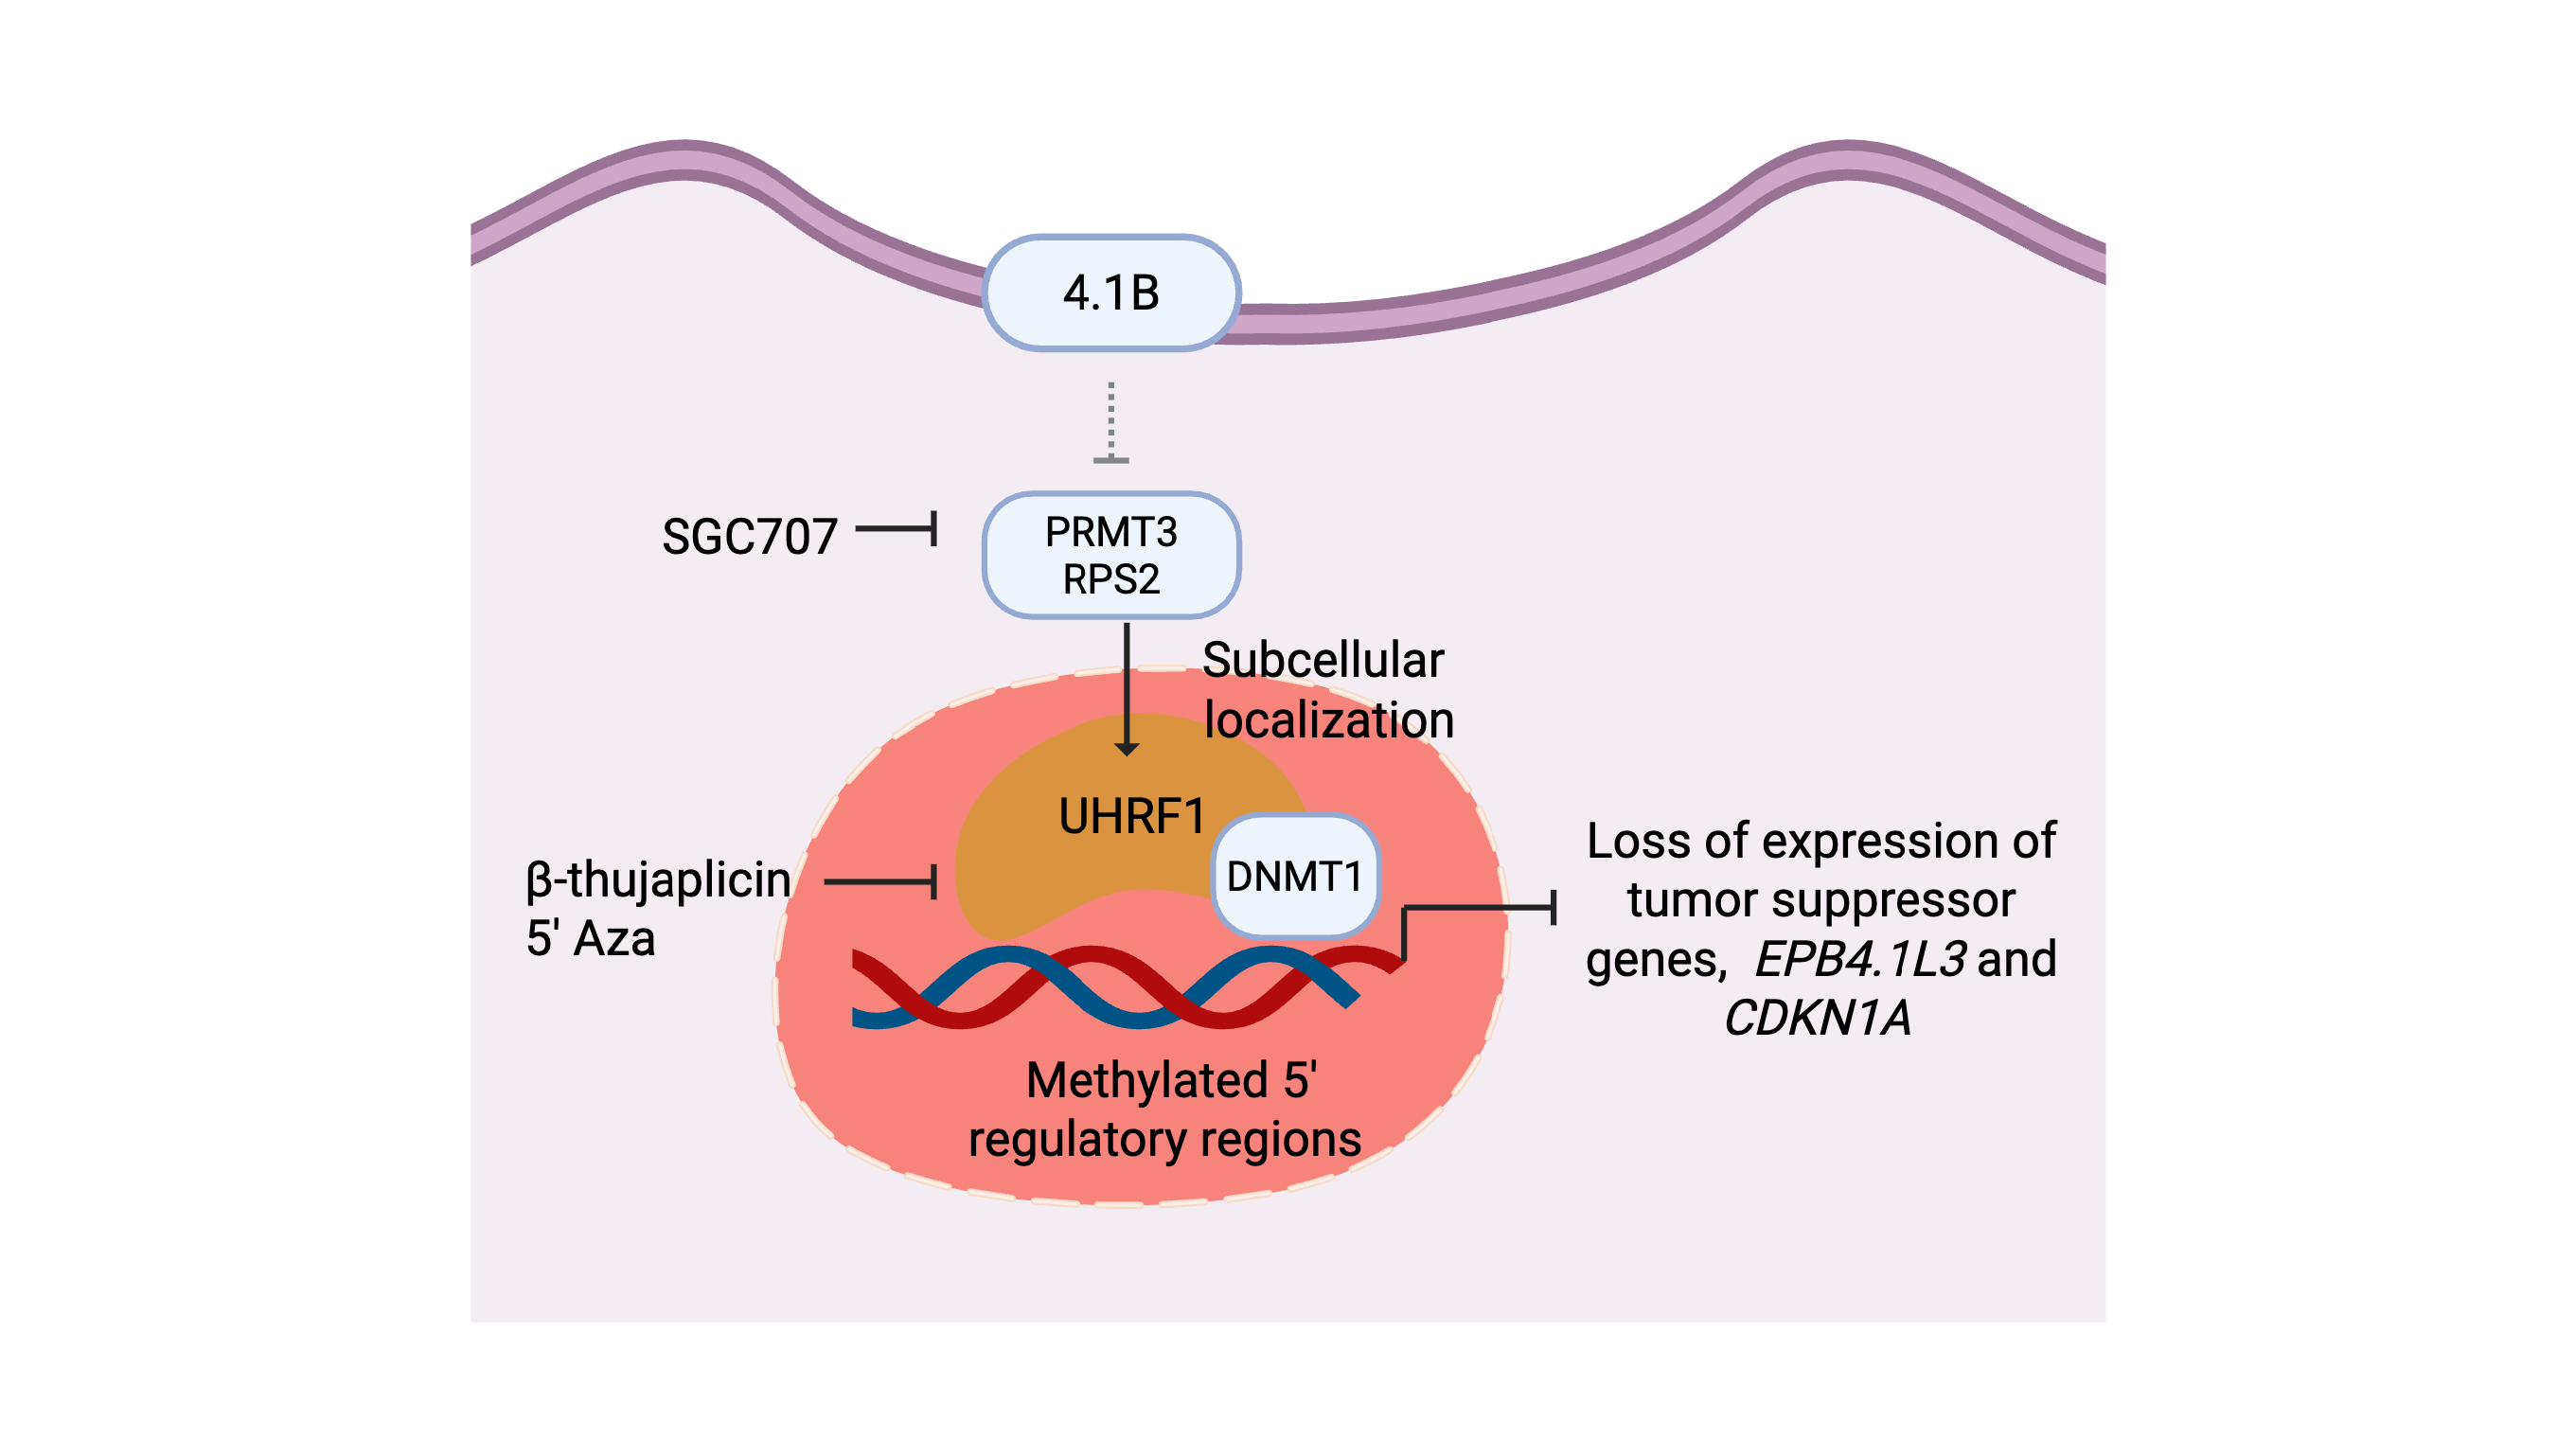
Dual targeting of UHRF1 and DNMT1 impacts cell viability in BTSCs. a, b Cell viability for 9 BTSC lines and HFAs from three biological replicates following 14 days treatment with UHRF1 specific inhibitor, NSC232003 and β-thujaplicin (0-10 µM) (Data represent mean values ± SD, n=3). c Survival plot showing the correlation of DNMT1 expression with GBM patient survival (in months) from gene expression datasets obtained from primary and recurrent IDH-wildtype GBM samples26. d, e Assessment of changes in the protein levels of 4.1B, PRMT3, UHRF1, DNMT1 and p21 following treatment with SGC707, MS023 and β-thujaplicin in (d) BT2484.1Blow cells and (e) BT1434.1Bhigh cells relative to the XY1 negative probe. (n=3). f Proposed model depicting 4.1B-PRMT3-UHRF1/DNMT1 as a critical signaling axis in BTSCs.
Figure 7.
Dual targeting of UHRF1 and DNMT1 impacts cell viability in BTSCs. a, b Cell viability for 9 BTSC lines and HFAs from three biological replicates following 14 days treatment with UHRF1 specific inhibitor, NSC232003 and β-thujaplicin (0-10 µM) (Data represent mean values ± SD, n=3). c Survival plot showing the correlation of DNMT1 expression with GBM patient survival (in months) from gene expression datasets obtained from primary and recurrent IDH-wildtype GBM samples26. d, e Assessment of changes in the protein levels of 4.1B, PRMT3, UHRF1, DNMT1 and p21 following treatment with SGC707, MS023 and β-thujaplicin in (d) BT2484.1Blow cells and (e) BT1434.1Bhigh cells relative to the XY1 negative probe. (n=3). f Proposed model depicting 4.1B-PRMT3-UHRF1/DNMT1 as a critical signaling axis in BTSCs.
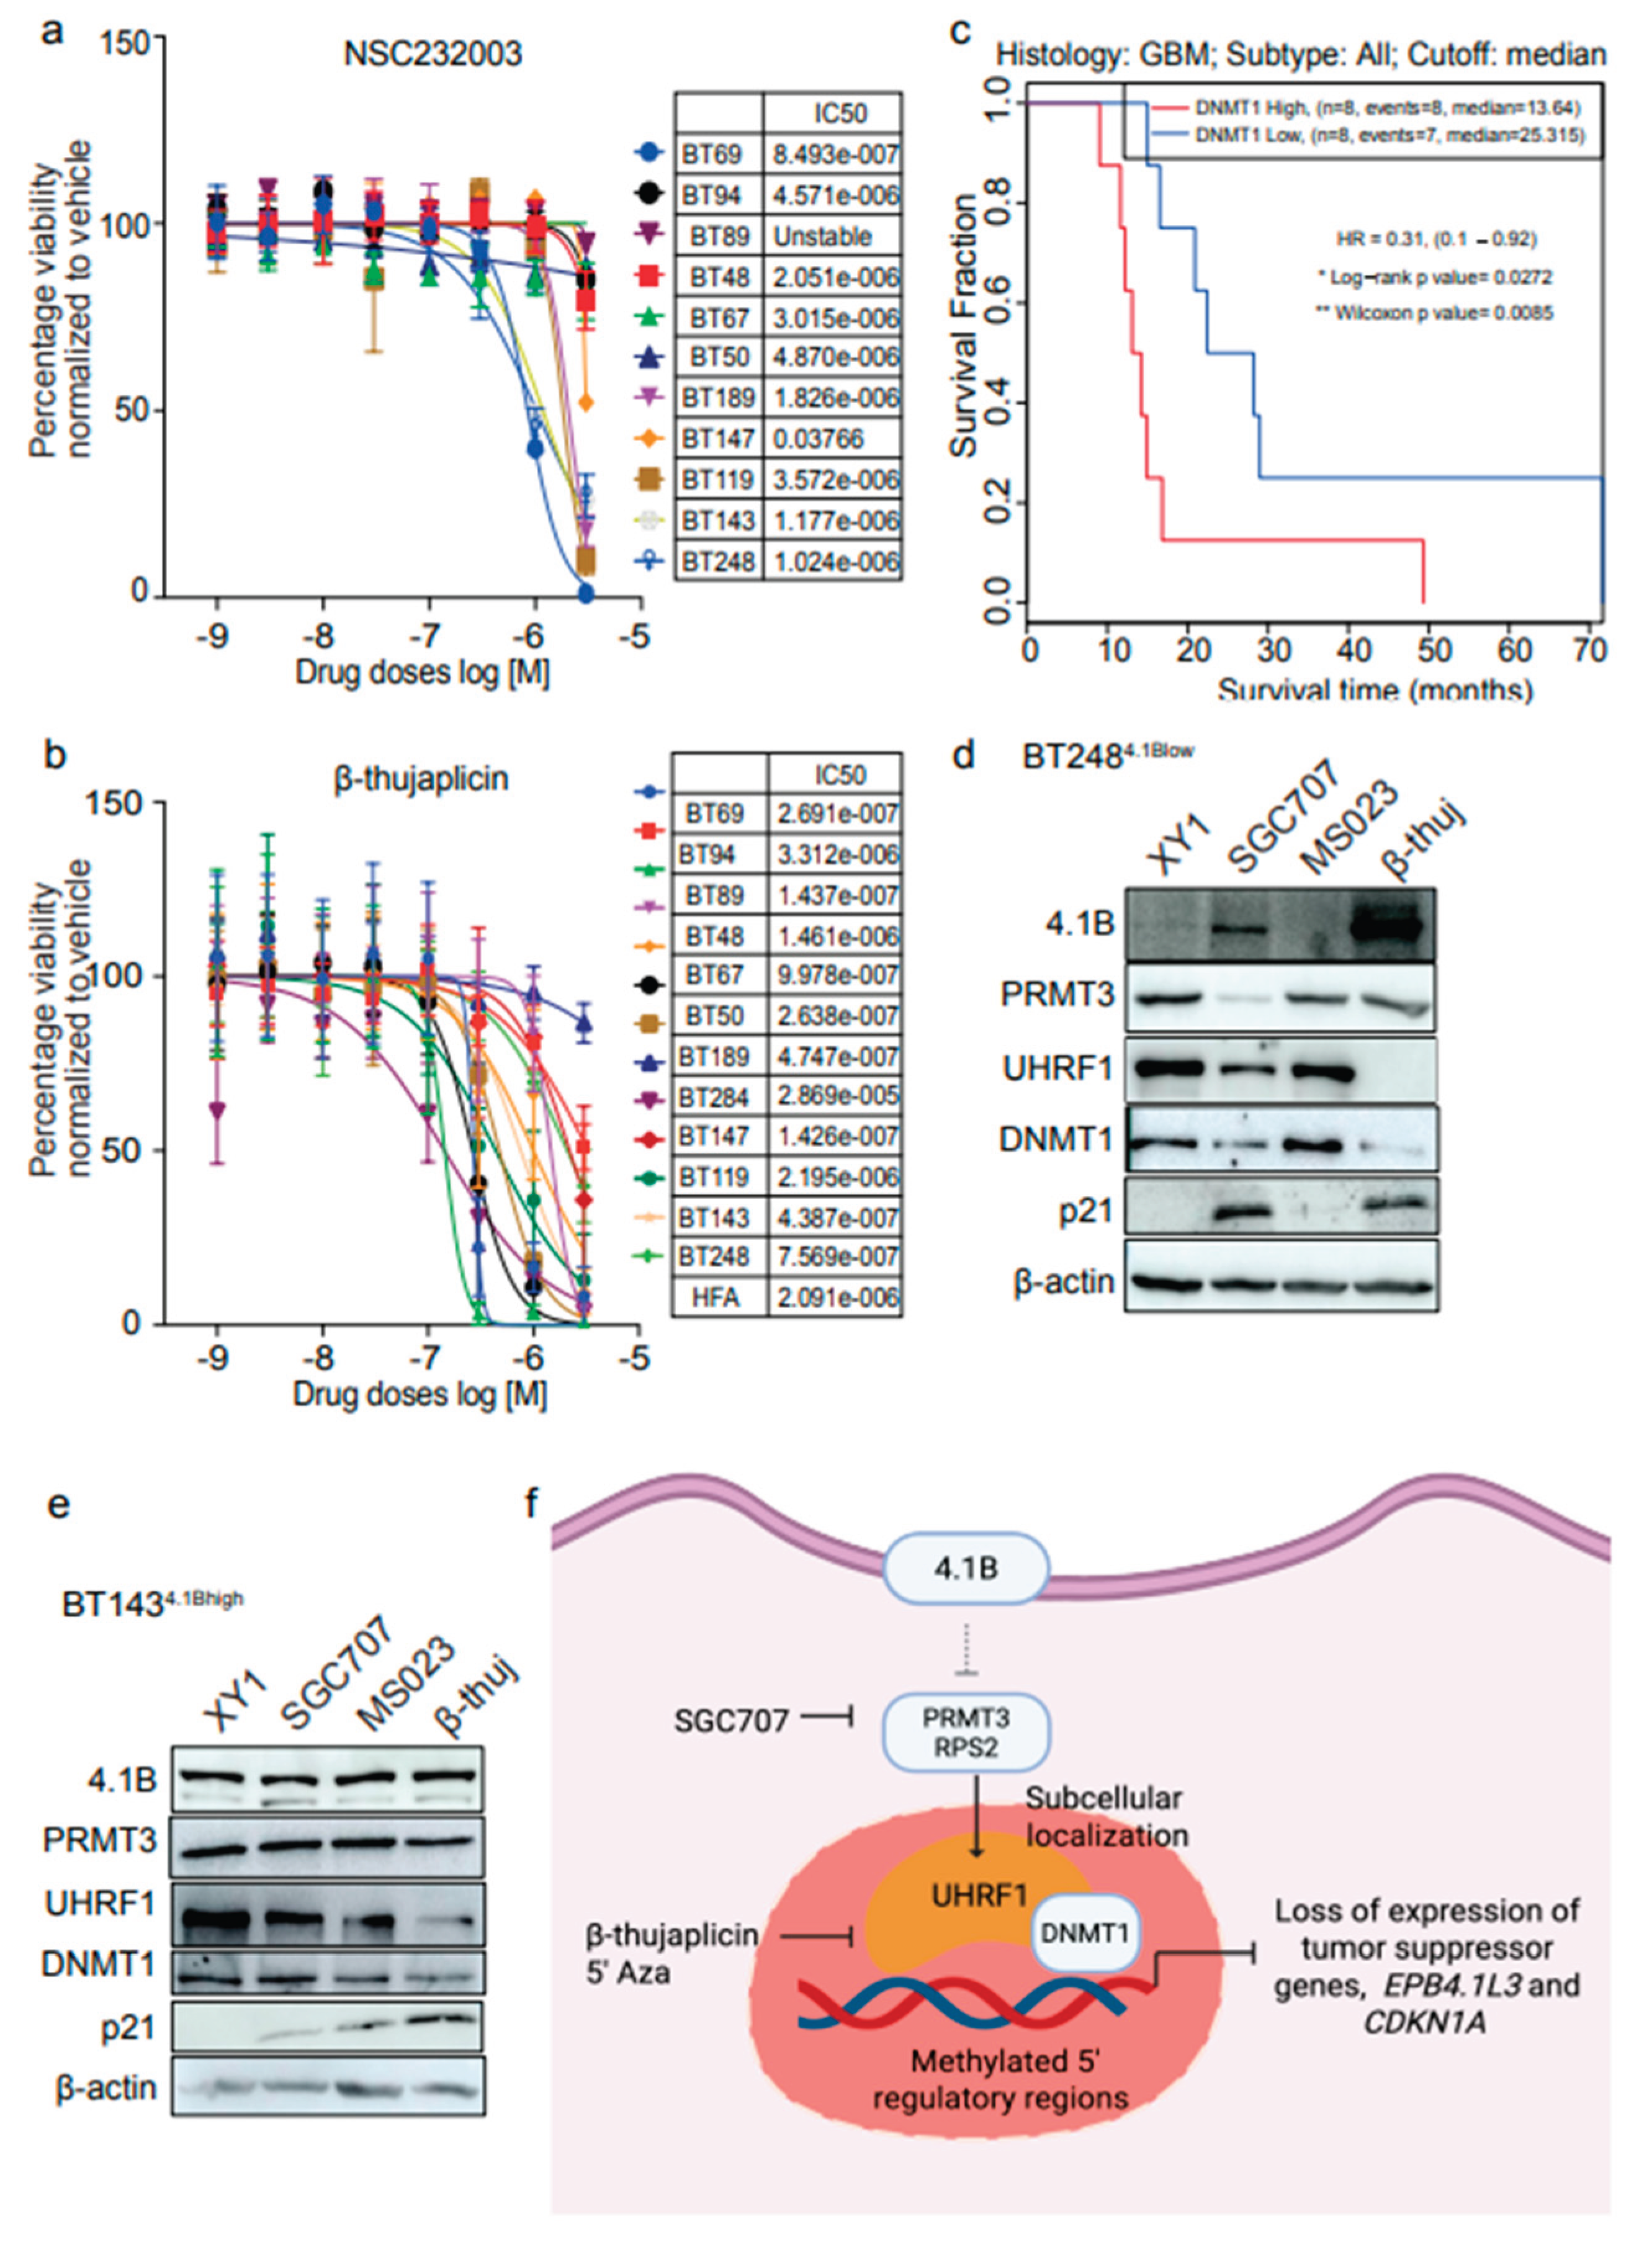

Table 1.
BTSC lines used for drug screening representing genetic variability.
| BTSC ID | Age | Sex | Diagnosis | MGMT status | EGFR status | p53 status | PTEN status | IDH1/2 status |
| BT48 | 68 | male | GBM | M | mt | wt | het | wt/wt |
| BT50 | 61 | male | GBM | um | wt | wt | het | wt/wt |
| BT67 | 44 | male | GBM | M | wt | wt | het | wt/wt |
| BT69 | 50 | male | GBM/GS | um | het | wt | mt | wt/wt |
| BT89 | 59 | female | GBM | M | wt | wt | wt | wt/wt |
| BT94 | 60 | female | GBM | M | wt | wt | mt | wt/wt |
| BT147 | 56 | male | GBM-r | U | vIII | mt | mt | Wt/wt |
| BT189 | 55 | female | GBM | U | wt | mt | wt | wt/wt |
| BT248Z | 56 | female | GBM | M | wt | mt | wt | wt/wt |
| BT284 | - | - | GBM | - | wt | mt | - | wt/- |
| BT119 | - | female | GBM-r | U | mt | mt | Het/Het | wt/wt |
| BT143 | 46 | female | GBM-r | M | wt | mt | het | wt/wt |
GBM-r = recurrent GBM, um = hemimethylated, U = Unmethylated, M = Methylated, mt = Mutated, wt = Wildtype, het = heterozygous, - = Data not available.
Disclaimer/Publisher’s Note: The statements, opinions and data contained in all publications are solely those of the individual author(s) and contributor(s) and not of MDPI and/or the editor(s). MDPI and/or the editor(s) disclaim responsibility for any injury to people or property resulting from any ideas, methods, instructions or products referred to in the content. |
© 2025 by the authors. Licensee MDPI, Basel, Switzerland. This article is an open access article distributed under the terms and conditions of the Creative Commons Attribution (CC BY) license (http://creativecommons.org/licenses/by/4.0/).
Copyright: This open access article is published under a Creative Commons CC BY 4.0 license, which permit the free download, distribution, and reuse, provided that the author and preprint are cited in any reuse.


