
Submitted:
22 May 2025
Posted:
26 May 2025
You are already at the latest version
Abstract
The term “social” relates to human society and its members, social sustainability implies reducing poverty, fair distribution of benefits arising from developmental projects, and that dignity for human life is ensured, among others. The social dimension is one of the three dimensions/pillars of sustainability and needs to be combined with the assessment across the other pillars to arrive at any comprehensive sustainability assessment. Yet, social issues related specifically to gender equity and poverty, two of the Sustainable Development Goals, are still difficult to find and apply. This paper presents a desk-based assessment of social risks on selected criteria for gender and working conditions using databases in key sectors (cereals, wheat and paddy rice) considering agriculture as a sector within the bioeconomy. The selected countries are in East Africa (Burundi, Kenya, Rwanda, Tanzania and Uganda) as these countries are signatories of the East Africa Regional Bioeconomy Strategy. The assessment shows that despite support for women in agriculture there is still a risk for gender inequality and working conditions.
Keywords:
gender
; socio-economic
; bioeconomy
; agriculture
; East Africa
1. Introduction
The concept of “bioeconomy” has gained global attention in research and policy circles in recent years. Many argue that substituting a bio-based, or renewables-based, economy for the fossil fuels-based economy will help to reduce some of the complex challenges of climate change impacts. The term bioeconomy was developed in 1997, but the definition has evolved over time as international organisations have supported it through their various national or regional strategies (e.g. [1,2]). Views on the bioeconomy vary according to the perspective on the capacity of the economy and resources to address global societal challenges [3]. Some definitions of the bioeconomy make the food, health care, chemicals and energy sectors key components. Others focus on driving forces such as sustainability, competitiveness and welfare provision [3]. According to the European Commission Bioeconomy Strategy (2018), the bioeconomy covers all the sectors and systems that depend on biological resources and the functioning of all animals, plants, micro-organisms, derived biomass and organic waste. All those economic and industrial sectors which rely on biological resources and processes to produce food, feedstocks and other bio-based products are also part of the bioeconomy [2].
Current definitions perceive the bioeconomy as a large system that binds together natural resources, technologies, markets, people and policies. In addition to the preservation of natural resources for future generations, the bioeconomy strives to optimally manage environmental resources for current generations [4]. It has been suggested that the transition to a bioeconomy will address pertinent issues related to climate change, food security, health, industrial restructuring and energy security [3].
The transition to sustainable economies will not automatically result in more equal or just societies, furthermore, bioeconomy might have unintended social consequences [5,6]. In fact, if not properly assessed and addressed, many current challenges in the mainstream economy, such as gender and social inequalities and poverty, are likely to continue or even deepen within the bioeconomy [7,8,9]. On the other hand, several positive impacts have been attributed to the use of biomass for bioenergy and to the bioeconomy [10]. Nonetheless, current social impacts are still poorly understood [11].
2. Sustainability in the Bioeconomy
A bioeconomy should enhance a country’s stability through the provision of core resources, such as food, fuel and other material needs, while also creating sustainable industries. It is crucial to assess who has access to and control over the benefits created by the bioeconomy, and how outcomes might benefit some while marginalizing others depending on factors such as gender, class, ethnicity, race, age, religion, sexuality and location. Furthermore, in addition to ensuring environmental sustainability, socio-economic dimensions and social sustainability should also be considered when prioritizing in a sustainable economy [12]. Several factors will influence the future of the bioeconomy, such as global economics, the surrounding, the sustainability of the bioeconomy will depend on the synergies between production of biomass feedstock and conversion procedures [13]. The level of sustainability will also depend on whether the bioeconomy improves, reinforces or deepens existing societal inequalities [10,12,14].
Various frameworks have been proposed for characterizing in the Agenda 2030 Sustainable Development Goals’ interdependencies and cross-cutting issues that will need to be evaluated to make policy a reality [15,16,17,18,19]. These studies have attempted to link methodologies to identify the closest synergies and trade-offs among the Sustainable Development Goals (SDGs). The purpose of these frameworks is to provide scientific analyses of these interactions that were lacking in Agenda 2030 and to stimulate more science-policy exchange.
For instance, Pradhan et al. (2017) used data from the United Nations Statistics Division (in [19]) on 122 indicators for 227 countries’ national-level and country-disaggregated data on gender, age, urban and rural population, and income between 1983 and 2016 to identify significant positive and negative correlations. The study found synergies and negative correlations among various SDGs. There were also positive and negative correlations between the SDG pairs. SDG 1 (no poverty), for instance, expressed synergies with most of the other SDGs, while SDG 12 (responsible consumption and production) and SDG 15 (life on land) demonstrated trade-offs with most of the other SDGs. These are also the SDGs most closely linked to the bioeconomy.
The indicators where most synergies were found were for SDG 1 (no poverty), SDG 11 (sustainable cities and communities) and SDG 13 (climate action). These were all part of the Millennium Development Goals and share international data and development indices. On the other hand, those showing the largest trade-offs were SDG 8 (decent work and economic growth), SDG 9 (industry, innovation and infrastructure), SDG 12 (responsible consumption and production) and SDG 15 (life on land) [19]. According to the authors, these goals are currently in conflict with most of the other SDGs, and thus antagonistic to sustainable development.
The term “social” relates to human society and its members, hence social sustainability implies reducing poverty, fair distribution of benefits arising from developmental projects, and that dignity for human life is ensured, among others. Additional issues to be covered are aspects such as employment rates, equal opportunities, equal treatment of gender and political participation. However, the social dimension is only one of the three dimensions/pillars of sustainability and needs to be combined with the assessment across the other pillars to arrive at any comprehensive sustainability assessment. Several sustainability indicator frameworks have been developed. The United Nations Commission on Sustainable Development has developed indicators for countries to assess their progress towards sustainable development [20]. These indicators provide information on social, economic, environmental and institutional aspects of sustainable development and are also related to the SDGs. These indicators are prepared from a macro perspective and are relevant at national levels rather than for business purposes and at a project level. The Global Reporting Initiative (GRI) framework has over 100 environmental, economic and social indicators divided into the following categories: economic, environment, human rights, product responsibility, product and service, and society [21].
Economic poverty, social protection through decent work, tenure rights and resilience to disasters (economic, social and environmental) should be considered when creating indicators for a sustainable bioeconomy, to enable the voices of the poor. Table 1 shows the four dimensions of the poverty framework and examples of some criteria and indicators to be considered in the bioeconomy that could help to reduce poverty.
Although it is acknowledged that poverty must be understood holistically, as multifaceted and complex, and as affecting women, men, girls and boys in different ways, at different times and on different scales, in this paper we are focusing on two important factors of poverty that are related to wages and living wages (explained in a later section). This does not mean that particularly in Sub-Saharan Africa, other issues such as lack of income or land/tenure rights are not important [12].
Regarding gender, it is essential to consider vulnerable groups, particularly in rural areas where many bioeconomy-related activities take place in developing countries. In many societies, these vulnerable groups are women, girls, youth and the elderly [10]. How these impacts are measured and monitored also provide an effect on gender.
3. Gender, Poverty and Equality Frameworks
The continues transition to a bioeconomy will have big impacts on the wider societal context. These will include gender and social equality concerns, as is demonstrated in a number of studies on gender and the bioeconomy, as well as gender and sustainability certification [7,23,24,25,26]. Furthermore, while women and men have been found to be equally interested in sustainable production, they may not have the same ability to adapt their practices due to differentiated access to resources, knowledge, labour, finances and decision-making processes [25]. It will therefore be crucial to include gender and social equality issues in any indicator framework for ensuring social sustainability.
Gender indicator frameworks are being used increasingly to measure gender inequality. Among the more notable indexes are the UN Gender Inequality Index and the OECD Social Institutions and Gender Index, both of which use various indicators to measure gender inequality at the national level. While this enables international comparison, they do not provide an understanding of regional or sectoral differences [27].
Measuring gender inequality is a complex task and the findings will vary depending on the indicators that are used and whether these are quantitative or qualitative [27,28,29]. Employment and wage issues are covered best in the seven most prominent sustainability standards, but less attention is paid to issues such as resource rights, unpaid care work and access to decision making [12].
In order to address issues of gender inequality, it is important not only to map differentiated access to resources, opportunities and benefits, but also to identify the reasons for this differentiated access, and to ask who the winners and losers would be from the transition to a bioeconomy. It will be important to identify: (a) the structural drivers and social norms that affect who gains and who loses; (b) any new forms of exclusion and vulnerability that are being produced; (c) how sustainability is framed within the bioeconomy by different groups, such as state bodies and private sector companies; and (d) how the bioeconomy leads to trade-offs between environmental sustainability and social well-being [12].
In addition, there are questions about how changes in access to and control over resources, such as land and water rights, technology and knowledge, such as information, discourses and social norms – as well as decision-making processes at various scales and the division of labour or access to and control over jobs – will affect gender and social relations. Finally, income and benefit distribution at all levels from the wider economy to small scale producers – including contributions to local, regional and national economies and welfare, as well as local, rural, urban and Indigenous peoples’ and communities’ development – will all be affected.
There is no guarantee that the bioeconomy will be equally beneficial to all groups in society. It may even reinforce or deepen existing gender and social inequalities. The technocratic approach to the bioeconomy often sidelines the potentially adverse socio-economic, cultural and gendered impacts. A gender and social equality (GSE) lens can help to unpack the power relations that are “benefiting and providing options and resources for some by harming and restricting options and resources for others” [30](p.6), and how this differs among social groups defined by a combination of, for example, gender, class, ethnicity and age [31].
However, it is common for current research that integrates GSE issues to document the various inequalities without discussing the underlying structures and processes that cause those inequalities. These are the structures and processes that need to be understood and transformed in order to unleash the potential of the bioeconomy to contribute to a more equal and just society. It is therefore about shifting power to increase equality among actors at all levels of society, from the household to the international, and in all spheres from the public sector to the private sector, academia and civil society [12].
An important feature of the bioeconomy is the possibility of extending biomass production and processing beyond food, feed and fibre, to include a range of value-added products with potential applications in many sectors, such as the agriculture, forestry, health, tourism and energy sectors. The cascading use principle presents opportunities for the use of biomass in products with added value. There are difficulties attributing some socio-economic indicators to the bioeconomy, as they incorporate synergies with traditional sectors such as agriculture, forestry and industry [12]. Typical indicators include job creation, working conditions, gender, women’s participation, legal issues.
Social, legal and political considerations play a key role with regard to acceptability and market diffusion of new technologies. Evaluating social sustainability first needs an appropriate identification of linkages between the elements of the supply chain and possible social structures followed by identification of suitable indicators to make such linkages measurable and finally their measurement and assessment. Some of the social and economic indicators used have been criticized, for instance, for double counting across sectors, the data is easier to gather and to present meaningfully to stakeholders and decision makers, which means that criteria on having a “good indicator” can be met. The main challenge is to find quantitative or qualitative data that can be used for these purposes that is reliable, and cost-effective and not too time-consuming to collect. Diaz-Chavez et al. (page 85) describe the development of a “consistent and transparent framework or minimum applicable criteria and indicators for sustainability assessment of bioproducts that are transparent and can be adapted to regional-specific conditions” as one of the major challenges connected to the bioeconomy [32].
Some existing indicators and indexes related to gender are explained in Table 2.
These indicators and indexes do not represent the total existing indicators but those used in the Social Hotspot Database. Some of them have their own Annual Reports. They have evolved along the years since their inception. Most are applied at national level and within a pure social context rather than applied to a particular sector or multisectoral approach such as in the bioeconomy.
The most notorious and useful at the moment is the Gender Gap Index from the World economic Forum [37] which currently considers four dimensions Economic Participation and Opportunity, Educational Attainment, Health and Survival, and Political Empowerment.
4. The Agriculture Sector and Bioeconomy in East Africa
The bioeconomy activities involve multi sectors and has different definitions and visions. The East Africa Regional Bioeconomy Strategy[40]aims to foster economic growth and generate employment by utilizing the region’s bioresources to develop sustainable products and services, while enhancing environmental quality and supporting climate change mitigation. It focuses on four thematic areas: 1) Food security and sustainable agriculture; 2) Health and Wellbeing; 3) Biobased Industrial Development; and 4) Sustainable Energy. The agricultural sector is key for any country’s food security. In the case of the bioeconomy the added value for products, waste and residues is the key feature to differentiate it from the agricultural sector as key economic activity.
It is estimated that in Sub-Saharan Africa, around 66% of women’s employment is in agrifood systems and it is their main source of livelihood [41]. Although, some authors have reviewed individual countries and found that the percentage is less to even 24% in Niger and 37% in Nigeria [42]. Figure 1 shows the trends by area and sex from 1995 to 2020. Each line represents a country's male or female population's trend in the agrifood sector in key selected countries in East Africa.
Agrifood systems’ statistics refer not only to the agricultural production but also other activities that involve some added value to the food product. Agrifood systems encompass all actors and interconnected processes involved in adding value to both food and non-food agricultural products. This includes activities across the entire value chain—from production to off-farm operations such as storage, aggregation, post-harvest handling, transportation, processing, distribution, marketing, consumption, and waste management. [41]. Shifting the focus from women’s roles in agriculture to their broader participation within agrifood systems allows to better understand their roles and challenges.
5. Risk Assessment of Gender and Working Conditions in East Africa
There are different definitions of hotspots, but it can be considered as (in a region or within life cycle analysis) processes or activities that may be seen as problematic or where there is a risk or an opportunity, in a social theme [44,45]. A rapid assessment using the Social Hotspot Database [38] was performed on five countries in East Africa (Burundi, Kenya, Rwanda, Tanzania and Uganda) where the Bioeconomy Strategy was developed. Two themes of the HSDB were reviewed. On the Theme of society, the gender equality was assessed under three indicators: Overall gender equality risk, Global gender gap index and Gender Inequality Index. Under the theme of Labour rights and working conditions, the following criteria was analysed: Country sector risk wage below benchmark; Sector average wage below living wage; Workers in poverty and Overall discrimination in workplace. Three sectors related to the Topic 1 of the Bioeconomy Regional Strategy were selected: cereal grains, rice paddy and wheat. These were selected as a proxy of the multisectoral approach of the bioeconomy.
The parameters assessed with the hotspot database used a scale for the risk from low (1), medium (2), high (3) and very high (4). These parameters in the Hotspot Data base used the methodology from Benoit et al. [46]. As the assessment includes more than 50 characterized social issues for 20 Social Themes, the amount of data is difficult to assess for decision-making. For this reason, The UNEP report [45] recommend calculating a Social Hotspot Index for each Country-specific sectors (CSS) and identify hotspots in the supply chain. The authors constructed the Index by weighting the level of risk identified for each Social Issue. In the scale a zero was assigned to social issues with low risk, a 1 was assigned to those that are medium, a 2 to those with high risk, and a 3 for those with very high risk; Nd was used where no data was indicated in the database. Summing across all social issues resulted in a total number of weighted hotspots to be aware of when working in that country and sector. Thus, social issues are not compared against each other. All issues are weighted equally in the sum, and all are considered a risk or negative impact. Positive impacts are not assessed with the Social Hotspot Index.
The three selected sectors were cereal grains (includes maize), wheat and rice paddy as they constitute the staple for most countries in East Africa.
Figure 2 shows the results of the SHDB for gender inequality (Overall gender equality risk, OGER; Global Gender Gap Index, GGGI; and Gender Inequality Index, GEI) for the sectors of cereal grains, wheat and paddy rice. The GEI was consistently high for all countries and all crops.
Burundi scored a medium risk for the overall gender equality risk across the three sectors, while the Global Gender Gap index scored a low risk across the sectors and the Gender inequality risk scored a high risk in the three sectors. Kenya showed for all criteria and all sectors a high risk.
Rwanda scored a low risk for all sectors for the Overall Gender Equality Risk and the Gender Gap Index but for the Gender Inequality Index it scored a high risk. Tanzania and Uganda showed the same scores of medium risks across the three sectors for the Overall Gender Equality Risk and the Gender Gap Index, while they scored a high risk for the Gender Inequality Risk for the three sectors.
To analyse working conditions, only some indicators were considered regarding the minimum national wage which is normally regulated at national level and according to some activities (affecting both women and men); the living wage Is the one that ensures minimum acceptable living standards and may vary from one region to another in the same country (also affecting both women and men). Table 3 shows the minimum wage in the selected countries in East Africa. The living wage (no calculation in the HSDB was included)
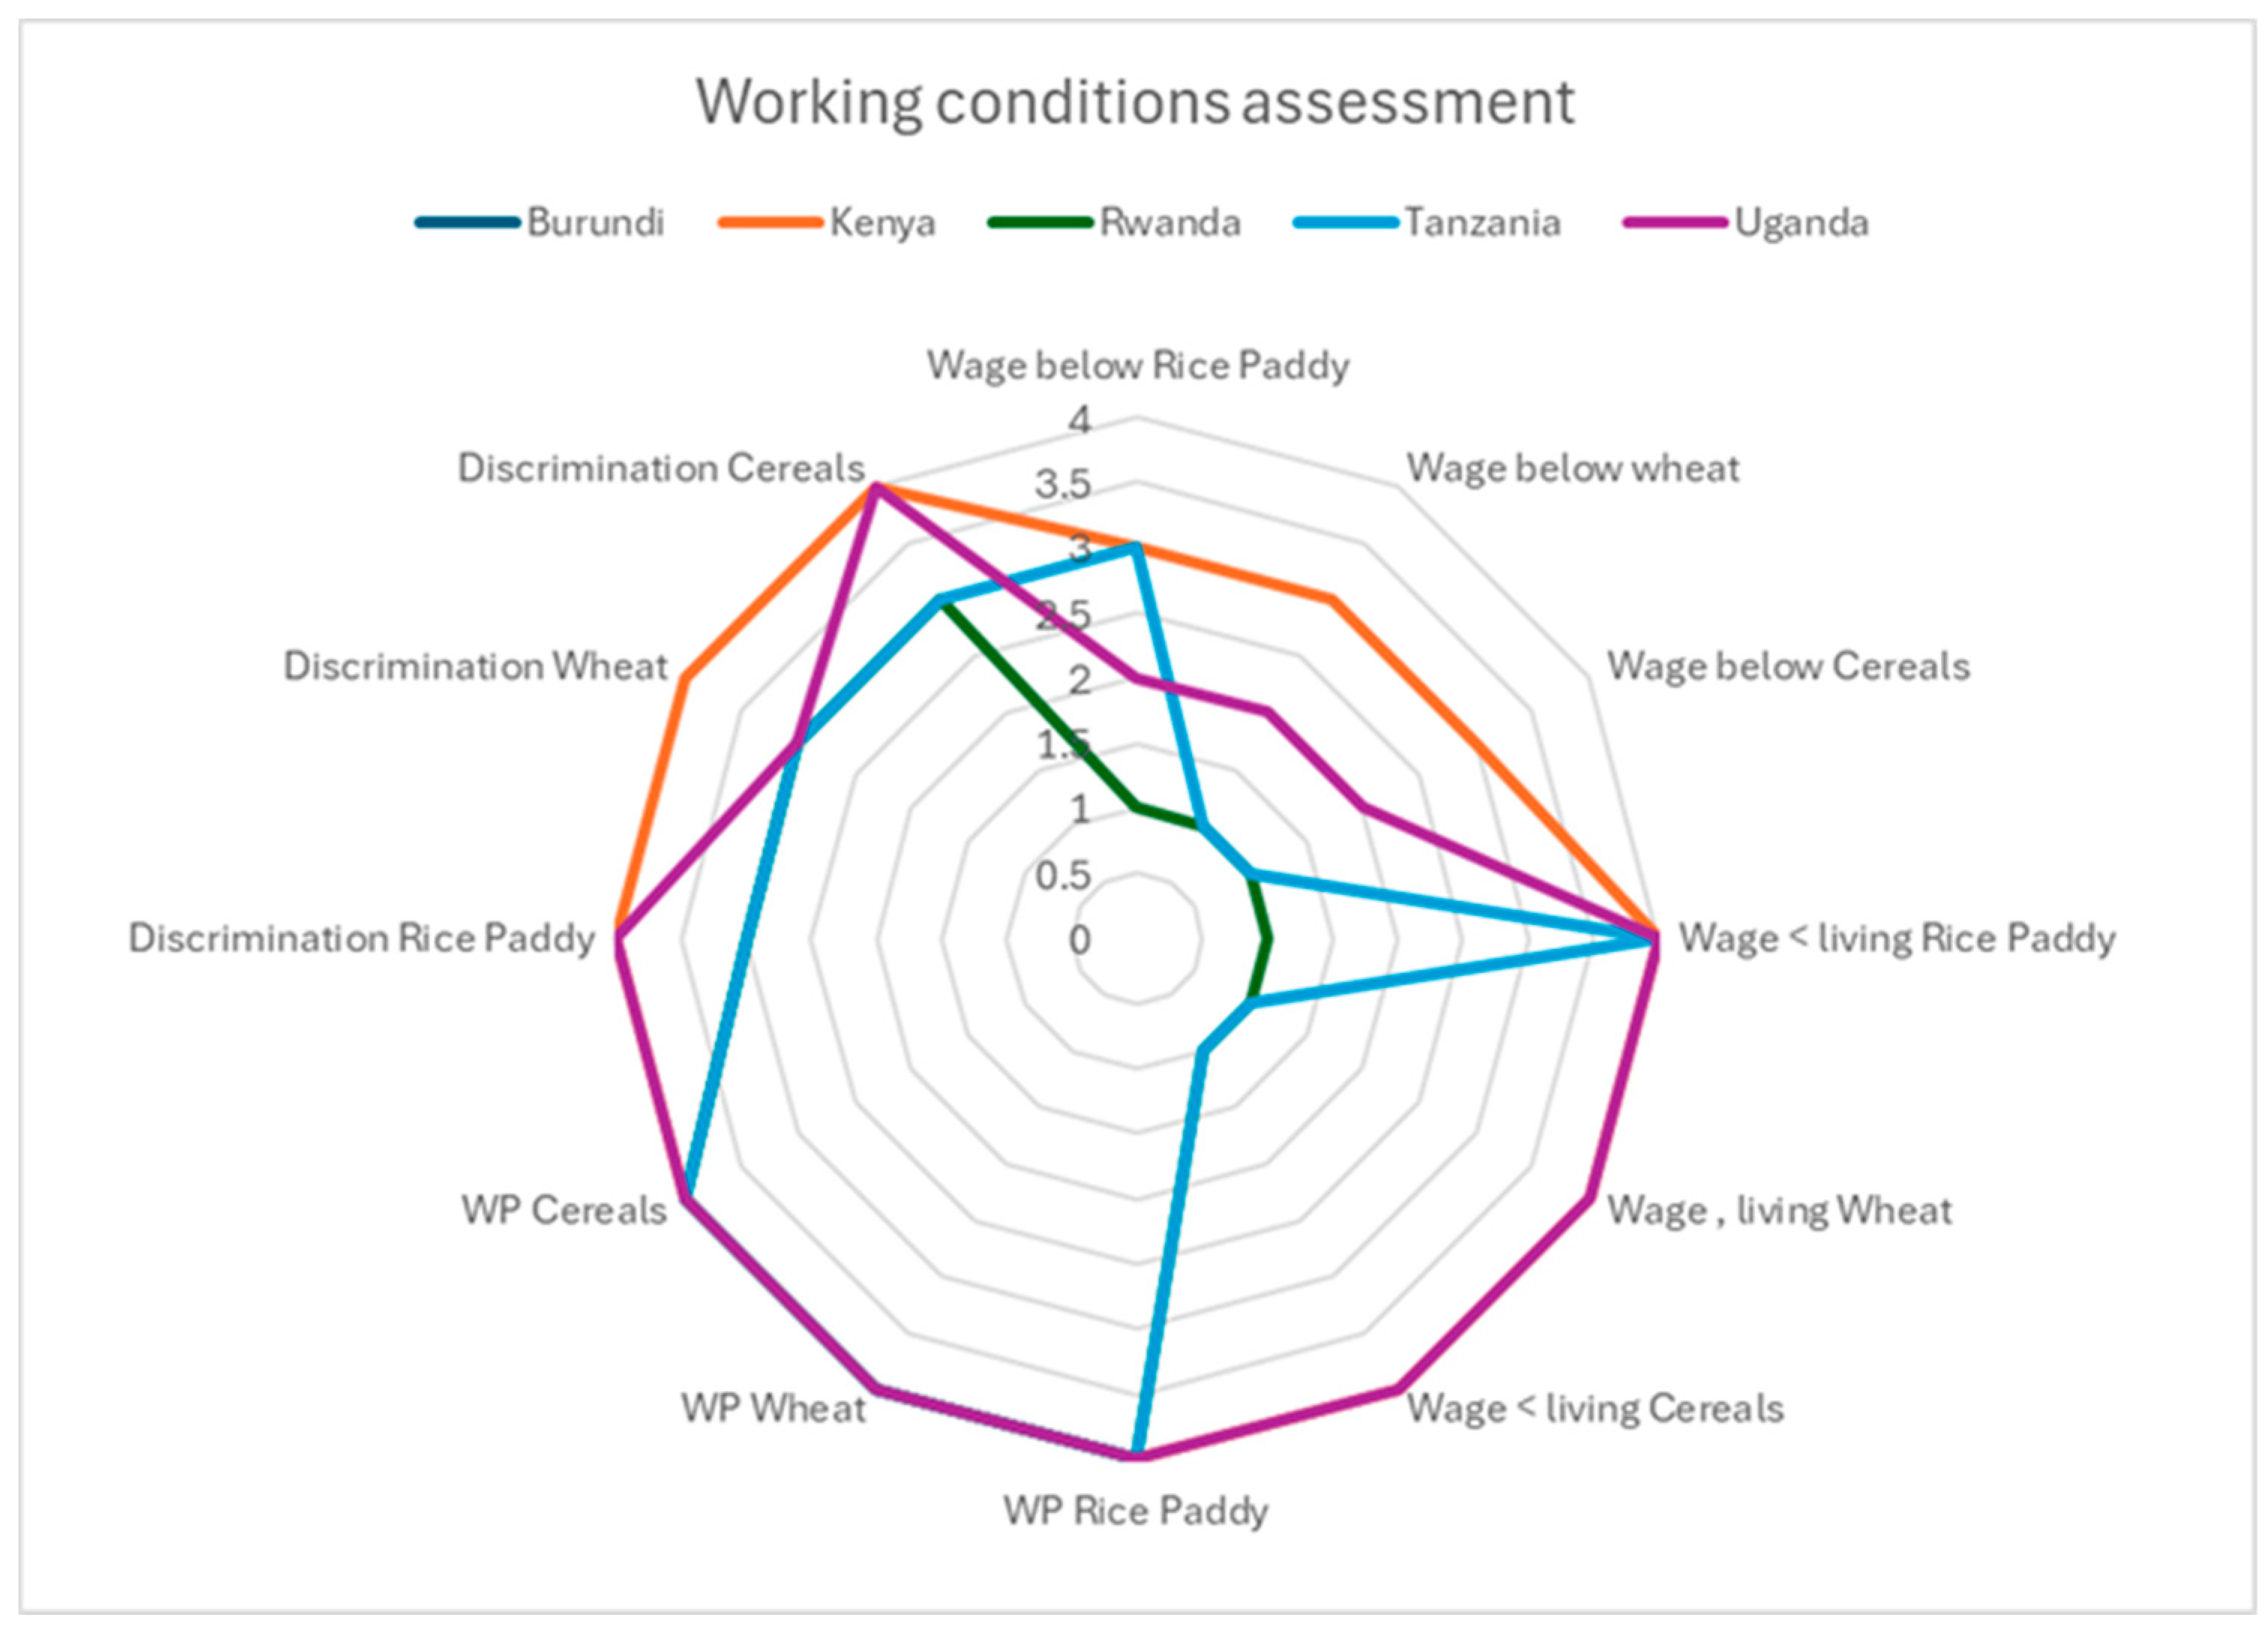
To assess these criteria within the HSDB, Figure 3 shows the assessment on the Societal theme which are related to poverty and inequality. The criteria selected included: Country sector risk of wage below benchmark (e.g. national and living wage); Sector average wage below living wage; Workers living in poverty (under 1.9 USD /day); Overall discrimination in of workers in the workplace. This last criterion was selected because despite it affects both men and women, particularly in the agroindustry the impacts on women are larger.
All countries showed a high risk of workers in poverty for the three sectors, which is living with a daily rate under $1.90 USD. Burundi had no data for the risk assessment for minimum wages and under living wages but as shown in Table 3 the minimum wage is regulated in the country. For overall discrimination showed a high risk. Kenya’s assessment shows a high risk for not having living wages, for workers in poverty and for forms of discrimination in the work. There was no difference between the selected sectors. Only the risk of not complying with minimum wages show a low risk.
Rwanda was the only country with low risk for wages under benchmark and for having wages below the living wages marked for the country, while for discrimination for workers was on low risk. There was no difference shown between the three sectors.
Tanzania was the only country that showed differences across the sectors. For the minimum wage it showed a high risk for the paddy rice sector and a low for wheat and cereals; for the under-living wages, it showed a very high risk for paddy rice and low risk for wheat and cereals. For the overall discrimination against workers, it showed a high risk with no difference across the sectors.
Finally, Uganda’s assessment showed medium high risk for minimum wage in the three sectors and high risk for under living wages an, poverty and discrimination across all sectors except the wheat sector on discrimination which scored high.
6. Discussion
According to the Gender Gap Index report in 2024, Sub-Saharan has increased its collective gender parity score by +5.6 percentage points since 2006, when the Index was created. This demonstrates that there has been some progress on certain areas and certain countries. As the report indicates, some are masked due to the size of the region and their differences. Nevertheless, there has been improvement in the economic gender parity particularly in the Economic Participation and Opportunity subindex [37].
Recent studies such as [42,48] demonstrate that the inequalities on women engaged in agriculture are persistent but with regional differences, showing more increment of inequality in East Africa. These studies recommend policies to support women in agriculture, better financial mechanisms to access credit and land and improved education. Notably, some of the recommendations indicate all issues need to be considered to avoid exacerbating other conditions (e.g. more house labour for women).
Women conditions in the agriculture sector have slightly improved particularly in percentage of participation. Nevertheless, this is due to the male-dominated migration from rural areas and rural economic activities. This has led to the “feminisation of agriculture” which has different challenges particularly on empowerment and roles in the household and communities [41]. Although, this is not further discussed in this paper, the topic is highly relevant for the bioeconomy regarding power over resources and the role of women as discussed in previous section. Furthermore, the working conditions for women in the agriculture sector is still an issue as shown above with the criteria of discrimination and minimum wages. Despite that the HSDB does not differentiate in working conditions between women and men, FAO and ILO have reported that these conditions have not improved significantly. One key indicator particularly in Sub-Saharan Africa is land tenure and how it affects women. Nevertheless, FAO report on agrifoods found that two of the countries in this paper have made progress regarding the legal and policy reforms for land rights (Kenya and Uganda), but the land tenure under men rights continues to be under men property. This is mostly due to lack of enforcement of land rights, but Burundi, Rwanda and Tanzania also showed progress on the share of women among owners of land in the last ten years [41]
Discrimination against women in agriculture persist also in agribusiness. Women still receive less payment, in some cases men are favoured for some works (specially management) and women do not have the same access to financial mechanisms as men, also related to education (
The agriculture sector is important for the bioeconomy as it is the largest production sector. It has multiple benefits from economic, employment to biodiversity [49] It will continue to be a firm basis for bioeconomy along with forestry and fisheries, particularly in the Global South. In East Africa as indicated in the Regional Bioeconomy Strategy [40]and the State of the bioeconomy[50], food production is still an important and clear objective for the region. Adding sustainable social objectives may help the region to achieve a gender parity in a shorter time.
7. Conclusions
Monitoring systems for the bioeconomy are still under development outside the European Union and the proposals use various methodologies and types of indicators. The main message to keep in mind is that the purpose of the bioeconomy is reducing greenhouse gas emissions and develop alternative economic and social opportunities in a new sector, using bioresources as feedstocks or intermediate products. Some of the challenges are to gather data for the assessments. In this paper some few criteria have been used to highlight the current situation of this multi-sectoral activity and the challenges it presents specifically for women. The use of the HSDAB was also shown as part of the case study as there are multiple methodologies and tools to evaluate risks and identify hotspots.
Among the main challenges facing this social sustainability assessments of the bioeconomy are:
- Lack of data and monitoring even from some of the SDG’s indicators hinder the findings in some sectors.
- Some of the indicators and index are not updated in the SHDB. The databases are dynamic and not just the data is updated frequently but also the methodologies. That is the case of the World Economic Forum Global Gender Gap Report. The latest report of 2021 includes impacts of COVID19 which have affected worldwide the economy but has not been possible to update in the HSDB.
- An additional challenge is the recognition that the bioeconomy is multisectoral and therefore it also makes it a difficult to assess gender and poverty at national level only. There is need to combine some primary data even if it is qualitative through surveys and interviews.
- Considering the specific characteristics of the region and local population and stakeholders for the assessment: the bioeconomy is based on biomass and therefore context must be considered.
- One framework does not fit all but that the approaches to deciding on the specific indicators may be a better alternative: this is also related to the contextuality not just in terms of geographical regions, but also of objectives, production, materials, and so on.
- The need for reliable data that fulfils the characteristics of a “good” indicator, such as cost-effectiveness, and time and spatial significance, along with consistent collection methods: this should also be decided in terms of the characteristics of indicators as previously suggested
The biggest challenge continues to be how to unleash the potential of the bioeconomy to contribute to a more equal and just society; this may be difficult to achieve, particularly in the global South where the bioeconomy is still emerging.
In addition, issues of governance must be considered alongside policies, regulations and standards. There is a need to advance the dialogue on synergies between science, policy and the decision-making process.
As a general recommendation, more studies looking at synergies across the sectors of the bioeconomy and how they could help to gather some gender equity will be necessary to be conducted to inform international organisations and development agencies.
Data Availability Statement
Restrictions apply to the datasets: The datasets used in this article are not readily available because the source is the Social Hotspot Database. Requests to access the datasets should be directed to them. Other datasets are publicly available and can be consulted in the website of the organisation (e.g. FAO).
Conflicts of Interest
The author declare no conflicts of interest.
Abbreviations
The following abbreviations are used in this manuscript:
| GEI | Gender Inequality Index |
| GGGI | Global Gender Gap Index |
| OGER | Overall gender equality risk |
| SDG | Sustainable Development Goals |
| SHDB | Social Hotspot Database |
| USD | United States Dollars |
| UN | United Nations |
References
- OECD, “The Application of Biotechnology to Industrial Sustainability,” OECD, Paris, Oct. 2001. [CrossRef]
- European Commission, “Bioeconomy: the European way to use our natural resources: Action Plan 2018.” Accessed: Jul. 19, 2024. [Online]. Available: https://op.europa.eu/en/publication-detail/-/publication/775a2dc7-2a8b-11e9-8d04-01aa75ed71a1.
- Haapala et al., “Bioeconomy potential - focus on Northern Finland,” International Journal of Sustainable Economy, vol. 7, no. 1, p. 66, 2015. [CrossRef]
- Lewandowski, Bioeconomy. Cham: Springer International Publishing, 2018. [CrossRef]
- V. Egenolf and S. Bringezu, “Conceptualization of an Indicator System for Assessing the Sustainability of the Bioeconomy,” Sustainability, vol. 11, no. 2, p. 443, Jan. 2019. [CrossRef]
- G. Piggot, M. Boyland, A. Down, and A. R. Torre, “Realizing a just and equitable transition away from fossil fuels,” 2019. Accessed: Apr. 17, 2024. [Online]. Available: https://www.sei.org/wp-content/uploads/2019/01/realizing-a-just-and-equitable-transition-away-from-fossil-fuels.pdf.
- Alvarez, “Increasing the Gender Gap: The Impacts of the Bioeconomy and Markets in Environmental Services on Women,” Global Forest Coalition, 2013. Accessed: Nov. 20, 2024. [Online]. Available: https://globalforestcoalition.org/wp-content/uploads/2013/06/INCREASING-THE-GENDER-GAP-FINAL.pdf.
- W. Harcourt and I. L. Nelson, Practising Feminist Political Ecologies. London: Zed Books Ltd, 2015. [CrossRef]
- P. Resurrección, “Gender and environment in the global South: From ‘women, environment and development’ to feminist political ecology,” in Routledge Handbook of Gender and Environment MacGregor, S., Ed., Abingdon, Oxon; New York, NY: Routledge, 2017, pp. 71–85. Accessed: Apr. 17, 2025. [Online]. Available: https://www.routledge.com/Routledge-Handbook-of-Gender-and-Environment/MacGregor/p/book/9780415707749.
- R. Diaz-Chavez, H. Stichnothe, and K. Johnson, “Sustainability Considerations for the Future Bioeconomy,” in Developing the Global Bioeconomy, 1st ed., S. E. H. R. and S. H. Lamers Patrick, Ed., Elsevier, 2016, pp. 69–90. [CrossRef]
- T. J. Mattila, J. Judl, C. Macombe, and P. Leskinen, “Evaluating social sustainability of bioeconomy value chains through integrated use of local and global methods,” Biomass Bioenergy, vol. 109, pp. 276–283, Feb. 2018. [CrossRef]
- R. Diaz-Chavez, S. Mortensen, and A. Wikman, Bioeconomy: tapping natural and human resources to achieve sustainability. Stockholm Environment Institute. Pp32, 2019. Accessed: Apr. 15, 2024. [Online]. Available: https://www.sei.org/wp-content/uploads/2020/01/sei-report-2020-bioeconomy-diaz-chavez.pdf.
- T. Buchholz, V. A. Luzadis, and T. A. Volk, “Sustainability criteria for bioenergy systems: results from an expert survey,” J Clean Prod, vol. 17, pp. S86–S98, Nov. 2009. [CrossRef]
- R. A. Diaz-Chavez, “Assessing biofuels: Aiming for sustainable development or complying with the market?,” Energy Policy, vol. 39, no. 10, pp. 5763–5769, Oct. 2011. [CrossRef]
- Schmidt, S. Padel, and L. Levidw, “The bioeconomy concept and knowledge base in a public goods and farmer perspective,” Bio-based and Applied Economics, vol. 1, no. 1, pp. 47–63, 2012. [CrossRef]
- R. Costanza et al., “Modelling and measuring sustainable wellbeing in connection with the UN Sustainable Development Goals,” Ecological Economics, vol. 130, pp. 350–355, Oct. 2016. [CrossRef]
- W. Rickels, J. Dovern, J. Hoffmann, M. F. Quaas, J. O. Schmidt, and M. Visbeck, “Indicators for monitoring sustainable development goals: An application to oceanic development in the European Union,” Earths Future, vol. 4, no. 5, pp. 252–267, May 2016. [CrossRef]
- ICSU, “A guide to SDG interactions: from science to implementation,” International Council for Science, Paris, May 2017. [CrossRef]
- P. Pradhan, L. Costa, D. Rybski, W. Lucht, and J. P. Kropp, “A Systematic Study of Sustainable Development Goal (SDG) Interactions,” Earths Future, vol. 5, no. 11, pp. 1169–1179, Nov. 2017. [CrossRef]
- UN, “Indicators of Sustainable Development: Guidelines and Methodologies,” New York, Dec. 2007. Accessed: Apr. 17, 2024. [Online]. Available: https://sustainabledevelopment.un.org/content/documents/guidelines.pdf.
- GRI, “Consolidated set of the GRI Standards,” 2022. [CrossRef]
- Sida, “Dimensions of Poverty Sida’s Conceptual Framework,” Stockholm, 2017. [Online]. Available: https://cdn.sida.se/publications/files/sida62028en-dimensions-of-poverty-sidas-conceptual-framework.pdf.
- J. Kent, M. Fannin, and S. Dowling, “Gender dynamics in the donation field: human tissue donation for research, therapy and feeding,” Sociol Health Illn, vol. 41, no. 3, pp. 567–584, Mar. 2019. [CrossRef]
- J. Kent and A.-M. Farrell, “Risky Bodies in the Plasma Bioeconomy,” Body Soc, vol. 21, no. 1, pp. 29–57, Mar. 2015. [CrossRef]
- R. Meinzen-Dick, C. Kovarik, and A. R. Quisumbing, “Gender and Sustainability,” Annu Rev Environ Resour, vol. 39, no. 1, pp. 29–55, Oct. 2014. [CrossRef]
- S. Smith, “Assessing the gender impacts of Fairtrade,” Social Enterprise Journal, vol. 9, no. 1, pp. 102–122, May 2013. [CrossRef]
- Permanyer, “The Measurement of Multidimensional Gender Inequality: Continuing the Debate,” Soc Indic Res, vol. 95, no. 2, pp. 181–198, Jan. 2010. [CrossRef]
- N. Kabeer, “Gender equality and women’s empowerment: A critical analysis of the third millennium development goal 1,” Gend Dev, vol. 13, no. 1, pp. 13–24, Mar. 2005. [CrossRef]
- S. Smith, F. Busiello, G. Taylor, and E. Jones, “Voluntary Sustainability Standards and Gender Equality in Global Value Chains Geneva,” 2019. Accessed: May 12, 2025. [Online]. Available: https://dai-global-developments.com/uploads/VSS%20and%20Gender%20Equality%20in%20Global%20Value%20Chains%202019.pdf.
- L. Weber, “Defining contested concepts. In Race, Gender, Sexuality, and Social Class: Dimensions of Inequality and Identity,” S. J. Ferguson, Ed., London: SAGE Publications, 2013, pp. 5–16. Accessed: Apr. 16, 2025. [Online]. Available: https://www.researchgate.net/publication/236028390_Defining_Contested_Concepts.
- S. Arora-Jonsson, “Forty years of gender research and environmental policy: Where do we stand?,” Womens Stud Int Forum, vol. 47, pp. 295–308, Nov. 2014. [CrossRef]
- R. Diaz-Chavez, A. Walter, and P. Gerber, “Socio-economic assessment of the pellets supply chain in the USA,” 2019. Accessed: Jun. 17, 2023. [Online]. Available: https://www.ieabioenergy.com/wp-content/uploads/2019/02/IEA-Bioenergy-Task_-USA-final-January-2019.1.21-FINAL.pdf.
- Cingranelli, R. D, and C. Clay, “The CIRI Human Rights Dataset Version 2014.04.14.” Accessed: Apr. 10, 2024. [Online]. Available: https://dataverse.harvard.edu/dataset.xhtml?persistentId=doi:10.7910/DVN/UKCPXT.
- OECD, “2012 SIGI Social Institutions and Gender Index,” OECD Publishing, Paris, Apr. 2012. [CrossRef]
- G. and T. A. Ferrant, “Measuring women’s economic empowerment: Time use data and gender inequality,” Paris , Mar. 2019. Accessed: Aug. 11, 2024. [Online]. Available: https://www.oecd.org/content/dam/oecd/en/publications/reports/2019/03/measuring-women-s-economic-empowerment_c84d0bb5/02e538fc-en.pdf.
- UNDP, “Gender Inequality Index. United Nations Development Programme.” Accessed: May 01, 2024. [Online]. Available: http://hdr.undp.org/en/content/gender-inequality-index-gii.
- WEF, “Global Gender Gap Report 2021. Insight Report.,” Geneva, Mar. 2021. Accessed: Apr. 07, 2023. [Online]. Available: https://www.weforum.org/publications/global-gender-gap-report-2021/.
- SHDB, “Social Hotspot Data Base.” [Online]. Available: http://www.socialhotspot.org/.
- ILO, “Statistics on Women.” Accessed: Feb. 19, 2025. [Online]. Available: https://ilostat.ilo.org/topics/women/.
- EASTECO, “The East African Regional Bioeconomy Strategy 2021/22- 2031/32 ,” Kigali, 2022. Accessed: May 19, 2023. [Online]. Available: https://www.iacgb.net/lw_resource/datapool/systemfiles/elements/files/2ebdbc71-a097-11ed-9ee4-dead53a91d31/current/document/EAC-Regional-East-Africa-Bioeconomy-Strategy.pdf.
- FAO, “The status of women in agrifood systems,” Rome, Apr. 2023. [CrossRef]
- Palacios-Lopez, L. Christiaensen, and T. Kilic, “How much of the labor in African agriculture is provided by women?,” Food Policy, vol. 67, pp. 52–63, Feb. 2017. [CrossRef]
- FAOSTATS, “Employment Indicators: Agriculture and agrifood systems,” https://www.fao.org/faostat/en/#data/OEA. Accessed: Mar. 22, 2025. [Online]. Available: https://www.fao.org/faostat/en/#data/OEA.
- UNEP, “Hotspots Analysis An overarching methodological framework and guidance for product and sector level application,” Paris , 2017. Accessed: Aug. 30, 2024. [Online]. Available: https://www.lifecycleinitiative.org/wp-content/uploads/2017/07/hotspots-publication-25.7.17.pdf.
- UNEP SETAC, “Guidelines for Social Life Cycle Assessment of Products,” Paris, 2009. Accessed: Nov. 29, 2022. [Online]. Available: https://wedocs.unep.org/bitstream/handle/20.500.11822/7912/-Guidelines%20for%20Social%20Life%20Cycle%20Assessment%20of%20Products-20094102.pdf?sequence=3&%3BisAllowed=.
- Benoît et al., “The guidelines for social life cycle assessment of products: just in time!,” Int J Life Cycle Assess, vol. 15, no. 2, pp. 156–163, Feb. 2010. [CrossRef]
- Wage Indicator, “Minimum wages per country,” https://wageindicator.org/salary/minimum-wage/minimum-wages-per-country. Accessed: Apr. 28, 2025. [Online]. Available: https://wageindicator.org/salary/minimum-wage/minimum-wages-per-country.
- F. Akpa, C. J. Amegnaglo, and A. F. Chabossou, “Women’s engagement in agriculture and income inequality in sub-Saharan Africa,” Social Sciences & Humanities Open, vol. 9, p. 100888, 2024. [CrossRef]
- Nowak, A. Kobiałka, and A. Krukowski, “Significance of Agriculture for Bioeconomy in the Member States of the European Union,” Sustainability , vol. 13, no. 16, Aug. 2021. [CrossRef]
- Virgin et al., “The State of the Bioeconomy in Eastern Africa: 2022.,” 2022. Accessed: Jun. 19, 2023. [Online]. Available: https://easteco.org/policy_strategy/eac-regional-bioeconomy-strategy/.
Figure 1.
Trends in number of people in agriculture by year and gender. (data source FAOstats[10].
Figure 1.
Trends in number of people in agriculture by year and gender. (data source FAOstats[10].
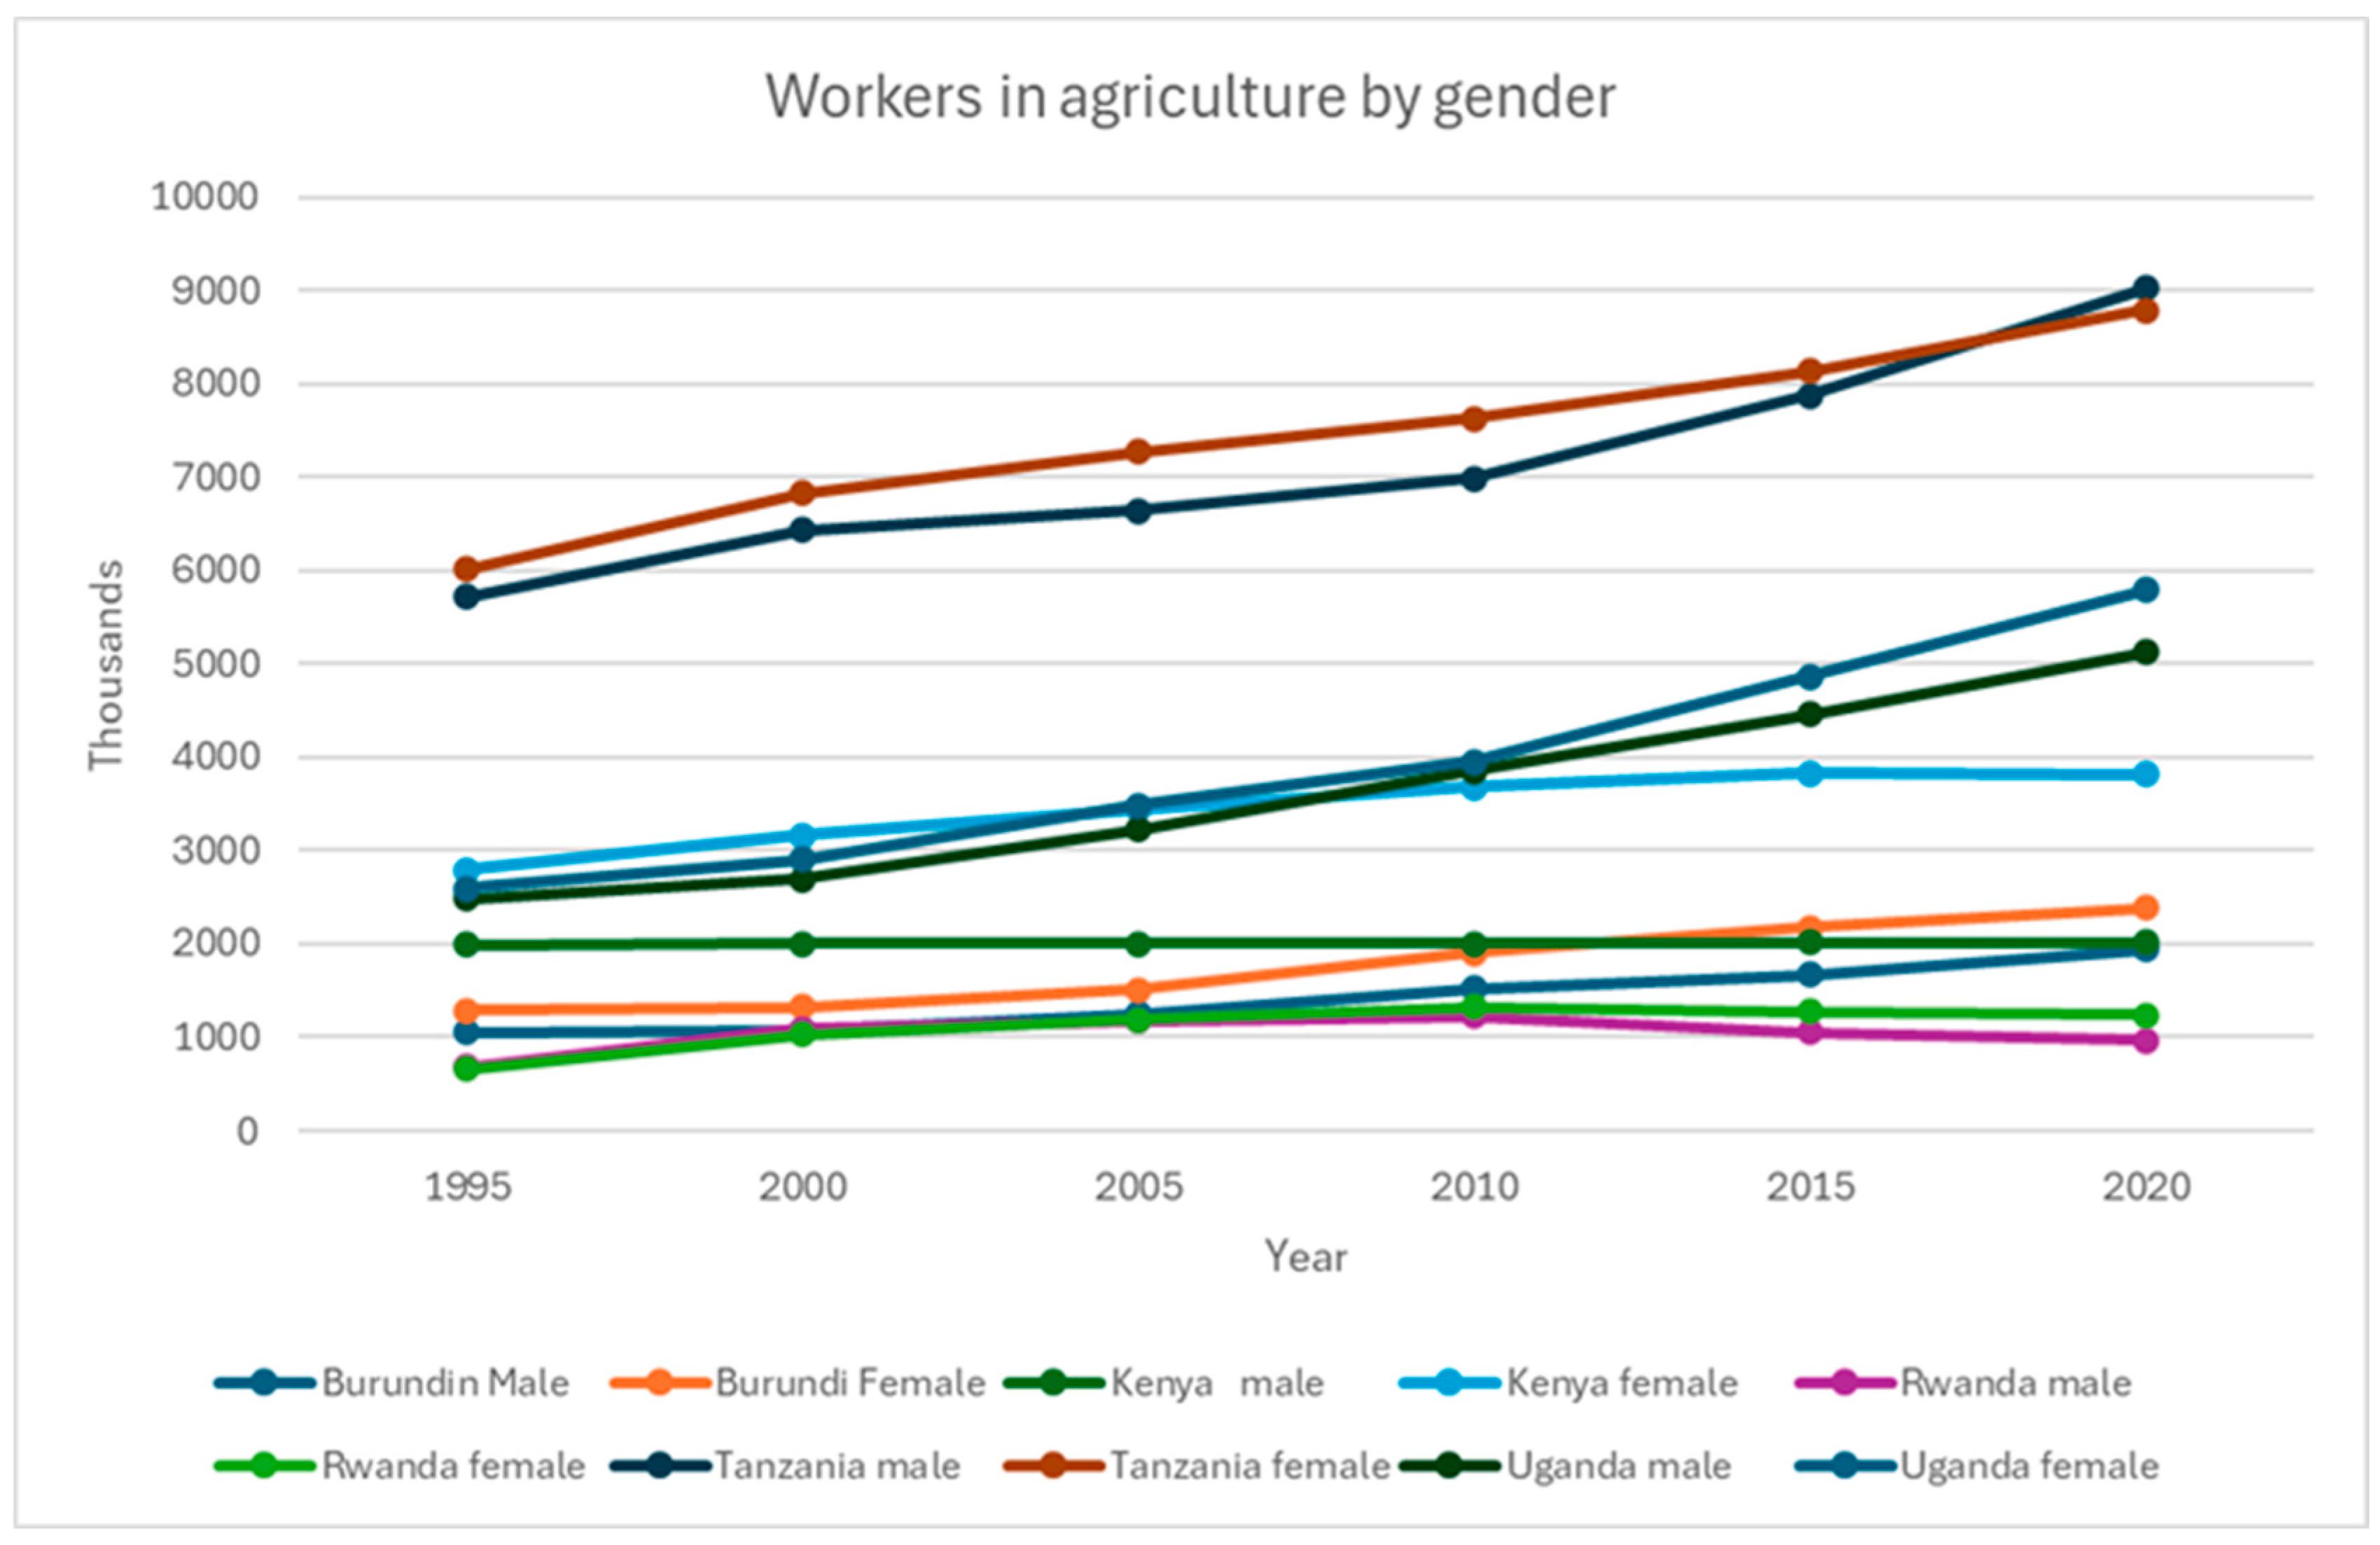
Figure 2.
Gender assessment by country and sector.
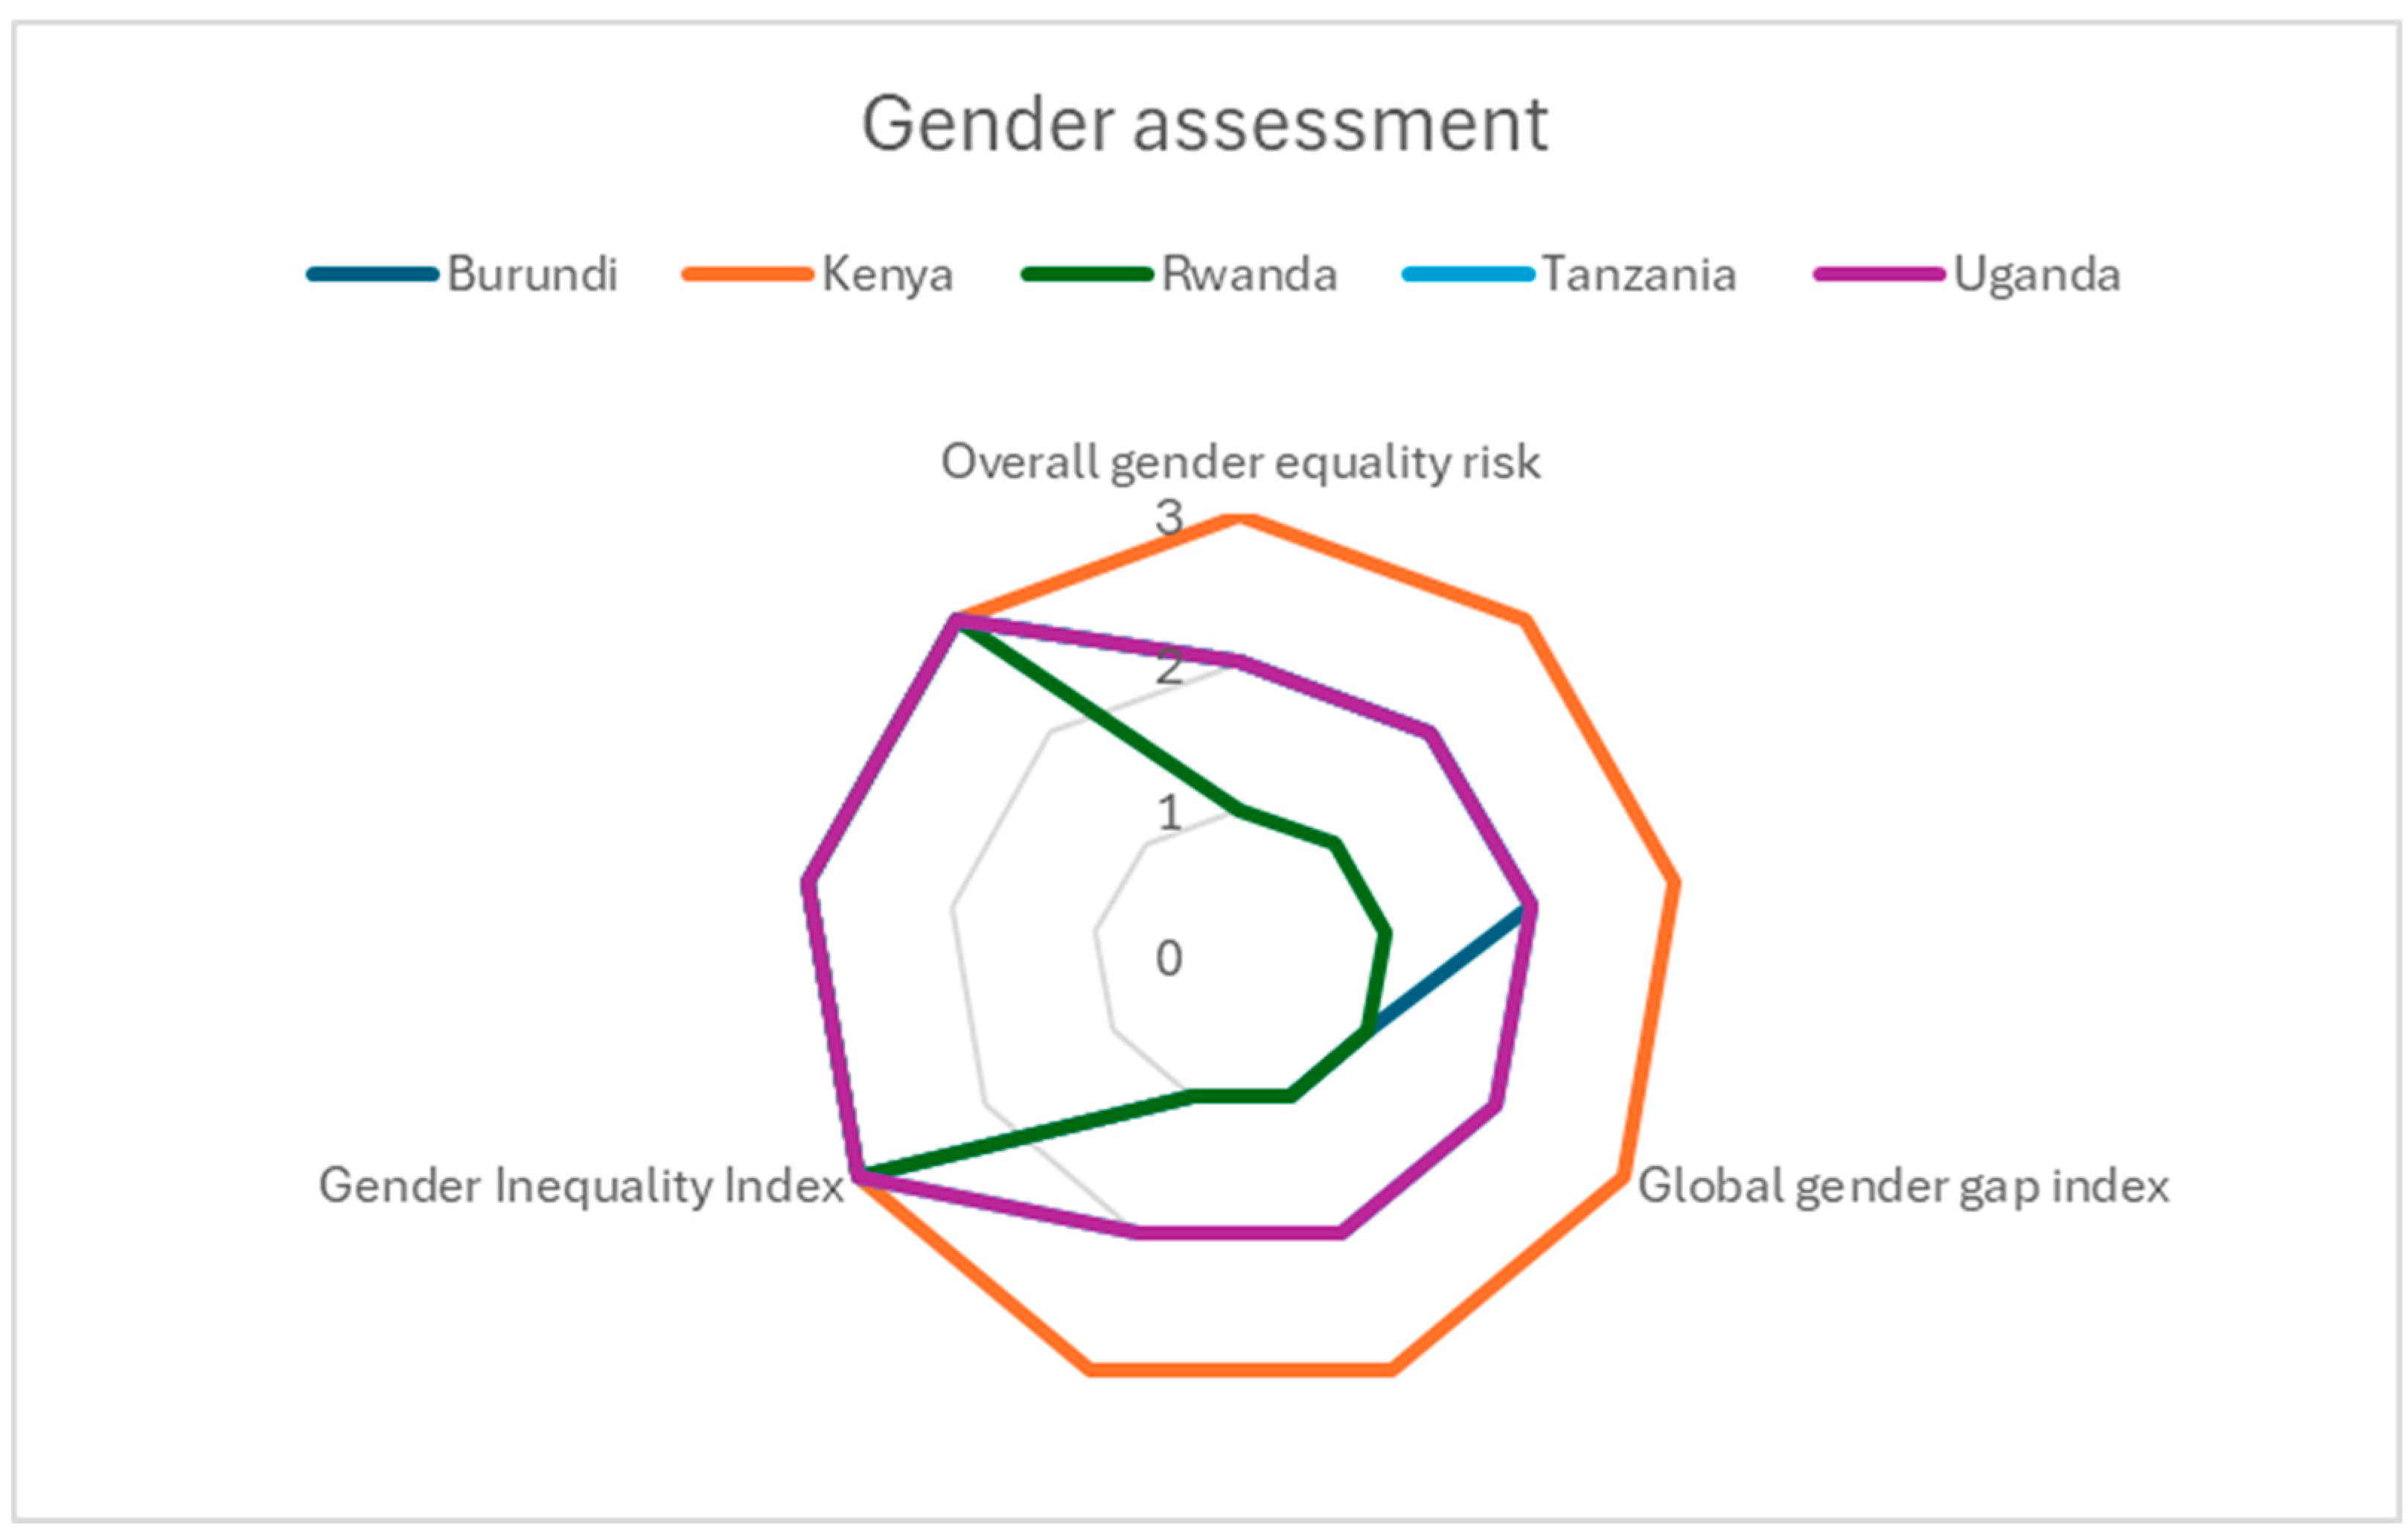
Figure 3.
Working conditions assessment (Data source: [38]).
Figure 3.
Working conditions assessment (Data source: [38]).

| Four dimensions | Examples of indicators |
| (Access to) Resources | Power over resources, both material and non-material Decent income and professional skills Agricultural tools and ecosystem services |
| Opportunities & choice | Access to services Opportunities to use resources to move out of poverty |
| Power & voice | To articulate concerns, needs and rights To participate in private and/or public decision making |
| Human security | Opportunities to exercise human rights Resilience (economic, environmental and social) Conflicts and risks/safety |
Table 2.
Selected indicators and index related to gender equity.
| Name of Indicators/Index | Author/organisation | Year | measurement |
| Human Rights (indicator women’s economic rights) | Cingranelli- Richards [3] | 2013 | Women's economic rights include a number of internationally recognized rights including Equal pay for equal work, Free choice of profession, among others. These are measured by the extensiveness of laws to support women’s economic rights and how the government enforces these laws. |
| Social institutions gender index | OECD [4] | 2012 | Measures how discriminatory social institutions affect the lives of women and girls around the world. Includes several criteria and indicators [5] |
| Gender Inequality Index | United Nations Development Programme [6] | 2021 | It measures gender inequalities in three important aspects of human development: reproductive health, empowerment and economic status. |
| Global Gender Gap Index | World Economic Forum (WEF) | 2021 | It originally covered gender gaps across four dimensions: economic opportunities, education, health and political leadership. It has evolved since 2006 [7]. |
| Overall Gender equality | Social Hotspot Data Base (SHDB) | 2021 | Weighted average of all gender indicators in the SHDB [8] |
| Female representation in the workforce | International Labour Organisation (ILO) [9] | 2021 | Female employment by sector. Risk expressed in %. Gender gap on employment |
Table 3.
Minimum wage and estimated living wage.
| Country | Minimum wage national currency per day | Minimum wage in USD per day | Estimated living wage local currency/month | Estimated living wage in USD/month | Source |
| Burundi | 105 FBu1 | 0,035 | 234400FBU2 | 79.86 | 1https://votresalaire.bi/salaire/salaire-minimum 2https://tradingeconomics.com/burundi/living-wage-individual |
| Kenya | 335.86 KES1 | 2,60 | 30,531 KES2 | 218 | 1https://wageindicator.org/salary/minimum-wage/kenya/2230-agricultural-industry 2 https://www.globallivingwage.org/wp-content/uploads/2023/07/Update-report_Kenya_Rural-Kericho_2023_JUNE.pdf |
| Rwanda | 100 RWF1 | 0,071 | 174,290 RWF2 | 170 | 1https://mywage.org/rwanda/salary/minimum- https://www.globallivingwage.org/living-wage-reference-value%E2%81%A0-rural-rwanda/wages 2 |
| Tanzania | 5,385.00 TSh1 | 2.00 | 357,799 TZS2 | 136 | 1https://mywage.org/tanzania/income/minimum-wage/6185-mainland-agricultural-services 2 https://www.globallivingwage.org/reference-value/living-wage-reference-value-rural-tanzania/ |
| Uganda | 6500 UGX1 | 1,77 | 888,072 UGX2 | 236 | 1https://wageindicator.org/salary/minimum-wage/uganda 2https://www.globallivingwage.org/living-wage-benchmarks/living-wage-for-lake-victoria-basin-uganda/ |
Notes: Wages estimated in rural areas as unskilled worker; Data source: as indicated in table and Wage Indicator [47].
Disclaimer/Publisher’s Note: The statements, opinions and data contained in all publications are solely those of the individual author(s) and contributor(s) and not of MDPI and/or the editor(s). MDPI and/or the editor(s) disclaim responsibility for any injury to people or property resulting from any ideas, methods, instructions or products referred to in the content. |
© 2025 by the authors. Licensee MDPI, Basel, Switzerland. This article is an open access article distributed under the terms and conditions of the Creative Commons Attribution (CC BY) license (http://creativecommons.org/licenses/by/4.0/).
Copyright: This open access article is published under a Creative Commons CC BY 4.0 license, which permit the free download, distribution, and reuse, provided that the author and preprint are cited in any reuse.


