
Submitted:
22 May 2025
Posted:
24 May 2025
You are already at the latest version
Abstract
Background/Objectives: Hepatocellular carcinoma (HCC) is a major cause of cancer-related mortality and often develops in the context of liver cirrhosis (LC). Early detection remains a clinical challenge, particularly with limited sensitivity of current se-rum biomarkers and qualitative imaging tools. This pilot study aimed to evaluate the diagnostic utility of two computed tomography (CT)-derived metrics, Liver Segmental Volume Ratio (LSVR) and Liver Vein to Cava Attenuation (LVCA), as non-invasive im-aging predictors of HCC in cirrhotic patients. Methods: In this observational retrospective pilot study, 36 patients with LC, with or without HCC, were enrolled from a single tertiary care center between 2021 and 2024. Demographic, clinical, biochemical, and imaging data were collected. LSVR and LVCA were calculated from contrast-enhanced CT scans. Predictors of HCC were assessed using conditional inference trees and multivariate logistic regression. Model performance was evaluated using the area under the receiver operating characteristic curve (AUC). P-value < 0.05 was considered statistically significant Results: LVCA and LSVR levels were significantly higher in the HCC group (p< 0.001). In multivariate analysis, LVCA was significantly associated with HCC onset (Odds Ratio=2.88, p=0.0075). The final model incorporating both LVCA and LSVR achieved excellent discrimination (AUC=0.967), with 91% sensitivity and 88% specificity. The combined model outperformed LSVR alone (p=0.030), though not LVCA alone. Conclusions: LVCA and LSVR represent promising quantitative imaging biomarkers for non-invasive HCC detection in cirrhotic patients. External validation in multicenter co-horts and longitudinal studies assessing the temporal evolution of LSVR and LVCA are necessary to confirm their application in clinical practice.
Keywords:
liver cirrhosis
; imaging
; diagnosis
; biomarkers
; scores
; chronic liver disease
1. Introduction
Hepatocellular carcinoma (HCC) is the most common primary malignancy of the liver and represents a major global health burden. It typically arises in the context of chronic liver diseases and advances through a well-characterized sequence from liver injury to fibrosis, cirrhosis, and ultimately neoplastic transformation [1]. The pathogenesis of HCC involves a complex interplay of genetic, epigenetic, and inflammatory mechanisms, often driven by underlying etiologies such as chronic hepatitis B (HBV) or C (HCV) virus infection, alcohol-related liver disease, or non-alcoholic steatohepatitis [2]. Globally, HCC accounts for over 80% of primary liver cancers and is the third leading cause of cancer-related death, with a five-year survival rate of less than 20% in most populations [3]. Its incidence continues to rise in parallel with increasing rates of metabolic-associated steatotic liver disease, further underscoring the need for effective strategies for early detection and risk stratification [4]. Imaging plays a central role in the diagnosis of HCC, particularly in patients with known liver cirrhosis (LC). Ultrasonography is widely used as a first-line surveillance tool due to its non-invasiveness, ubiquitousness, and relatively low cost. However, its sensitivity is limited, especially in detecting small or deep hepatic lesions [5]. Magnetic resonance imaging (MRI) offers excellent soft tissue contrast and high diagnostic accuracy, particularly with hepatobiliary contrast agents, yet its availability, cost, and contraindications limit widespread use. [6] Computed tomography (CT) remains a cornerstone in HCC diagnosis, offering high spatial resolution and rapid acquisition. However, inter-observer variability and challenges in distinguishing benign regenerative nodules from early HCC highlight the need for quantitative, standardized imaging biomarkers [7]. Despite advances in imaging, non-invasive serum biomarkers for HCC such as alpha-fetoprotein (AFP), lack sufficient sensitivity and specificity to be used as standalone diagnostic tool [8]. Emerging laboratory parameters including des-γ-carboxy prothrombin and lens culinaris agglutinin-reactive AFP have shown promise, but their performance varies across populations and disease stages [9]. Currently, no single non-invasive biomarker can reliably detect early-stage HCC or predict its development with high accuracy. The limitations of these latter emphasize the ongoing need for novel predictive tools that can be seamlessly integrated into clinical workflows, particularly in high-risk populations [10-12]. Early diagnosis of HCC is crucial, as it directly influences treatment options and patient outcomes. Tumor detection at an early, potentially curable stage enables access to curative interventions such as surgical resection, ablation, or liver transplantation. [13] Accordingly, there is a growing interest in quantitative imaging features and composite imaging-based scores, that may enhance diagnostic accuracy and serve as early predictors of HCC. These include morphological and perfusion-based parameters derived from routine imaging modalities, which could improve risk stratification and decision-making in at-risk patients [14]. The aim of the present pilot study is to evaluate the combined use of Liver Segmental Volume Ratio (LSVR), a score of regional liver remodeling, and Liver Vein to Cava Attenuation (LVCA), a CT-based perfusion-related parameter, as an imaging-based predictors of HCC.
2. Materials and Methods
2.1. Study Design
This observational retrospective pilot study included 36 patients who were evaluated at the “Renato Dulbecco” University Hospital in Catanzaro, Italy, between January 1, 2021, and December 31, 2024. Eligibility criteria were as follows: (i) age ≥18 years; (ii) confirmed diagnosis of LC based on a combination of clinical findings, laboratory results, imaging findings, and/or histopathological evaluation; and (iii) diagnosis of HCC established through CT [15,16]. Patients who were pregnant or breastfeeding at the time of evaluation were excluded from the study.
2.2. Data Collection
Patient data were extracted from electronic medical records and included demographic information (age and gender), underlying etiology of liver cirrhosis, number of cirrhosis-related complications, presence of esophageal or gastric varices, grading of esophageal varices, presence of hepatorenal syndrome, portal hypertensive gastropathy, portal vein ectasia or thrombosis, and splenomegaly [17-19]. Tumor-related variables included the focality of HCC (monofocal or multifocal), size of the hepatic nodules, total liver volume, spleen volume, right hepatic lobe diameter, and spleen diameter [20]. In addition, the following laboratory parameters were assessed: serum albumin, alkaline phosphatase (ALP), aspartate aminotransferase (AST), alanine aminotransferase (ALT), activated partial thromboplastin time (aPTT), serum creatinine, fibrinogen, γ-glutamyl transferase (GGT), AFP, international normalized ratio (INR), prothrombin time (PT), platelet count, serum potassium, sodium, and total bilirubin levels. At the same time, the Child–Pugh, Model for End-Stage Liver Disease (MELD), and MELD-Na scores were calculated for each patient [21].
2.3. LSVR and LVCA Calculation
The images were obtained with CT Toshiba Aquilion ONE (Canon Medical System Europe B.V., Zoetermeer, Netherlands) using the portal venous phase imaging performed at 76 seconds after intravenous administration of an iodine contrast agent. One-millimeter axial slices were reconstructed with an increment of 1 mm in a liver parenchyma window using a vendor-specific iterative reconstruction algorithm. The evaluations were performed by two radiologists, one with more than 15 years of experience. Portal venous phase CT images were processed using 3D Slicer (version 5.8.2), an open-source software for medical image processing and visualization. Specifically, we utilized Digital Imaging and Communications in Medicine images to facilitate the analysis. The liver and spleen volume measurements were performed using first the module “RVX Liver Segmentation” and then for the number values the “Segment Statistics” extension (Figure 1). The LSVR was calculated as liver volume divided by spleen volume [22]. The LVCA is an ordinal scoring system that evaluates the density of the liver veins located 1 cm before their confluence, in comparison to the inferior vena cava 1 cm below the confluence point. The evaluation is primarily visual, comparing the appearance of the liver veins and the inferior vena cava. When their attenuation appears similar, regions of interest are placed in the liver veins and in the inferior vena cava at the specified locations for precise measurement. If the average density of the three liver veins is within ±20 Hounsfield Units of the vena cava’s density, the veins are categorized as isoattenuating (LVCA score of 2). If the difference exceeds this range, the liver veins are classified as either hyperattenuating (score of 1) or hypoattenuating (score of 3). If the liver veins show no contrast enhancement at all, they receive an LVCA score of 4. The LVCA was assessed by comparing the attenuation of the liver veins to the inferior vena cava, as described previously [23].
2.4. Statistical Analysis
Continuous variables were presented as mean ± standard deviation (SD), while categorical variables were expressed as absolute frequencies and corresponding percentages. Normality of distribution for continuous data was assessed using the Shapiro–Wilk test. Depending on data distribution, comparisons between groups were performed using either the independent samples t-test or the Mann–Whitney U test. Categorical data were analyzed using Fisher’s exact test. To investigate HCC predictors, we employed both exploratory recursive conditional tree regression and traditional generalized linear modeling approaches. Conditional inference trees, as implemented in the party package [24,25], were addressed to explore the association between HCC and a range of imaging-derived variables. Consequently, we conducted multivariate logistic regression analysis to quantify the association between imaging scores and HCC. Stepwise selection was performed using the Akaike Information Criterion (AIC) as the stopping rule to identify a parsimonious model. Model calibration was evaluated via residual deviance and overall model fit by the final AIC value. Odds ratios (ORs) and associated 95% confidence intervals (CIs) were estimated, and statistical significance was assessed using Wald tests. Diagnostic performance of the final logistic regression model was assessed by calculating the area under the receiver operating characteristic (ROC) curve (AUC) with 95% CIs. ROC analyses were also conducted separately for each predictor to compare their discriminative ability. Optimal probability cut-offs for HCC classification were determined using the Youden index. Sensitivity and specificity were reported at this threshold. The association between model-based classification and actual HCC status was tested using Fisher’s exact test, and corresponding ORs with exact 95% CIs were calculated. Comparative performance of predictive models was evaluated using DeLong’s test for correlated ROC curves to determine whether the combined model offered statistically superior discrimination compared to models using LVCA or LSVR alone. All analyses were performed with R software version 4.1.2 (R Foundation for Statistical Computing) and JASP software version 0.19.3.0 (JASP Team) [26], and a two-sided p-value <0.05 was considered statistically significant.
3. Results
Considering our cohort, the most common etiology of LC was alcohol (n=17, 47%), followed by dysmetabolic (n=8, 22%) and infective causes (n=8, 22%), including HBV and HCV infections, each accounting for n=4 (11%) cases, as reported in Table 1. Autoimmune, cryptogenic, and mixed etiologies were less frequently observed. A high proportion of patients (n=33, 92%) presented with at least one cirrhosis-related complication, with a mean of 2±1 complications per patient. Ascites was the most common complication (n=26, 72%), followed by hepatic encephalopathy (n=19, 53%), portal hypertensive gastropathy (n=17, 47%), and splenomegaly (n=22, 61%). Esophageal and gastric varices were identified in a subset of patients: n=12 (33%) had grade F1 esophageal varices, n=7 (19%) had F2, and n=1 (3%) had F3. Likewise, gastric varices were observed in n=4 patients (11%). At the same time, hepatorenal syndrome was present in n=5 patients (14%), portal vein ectasia in n=4 (11%), and portal vein thrombosis in n=3 (8%). Regarding the tumor characteristics, monofocal HCC was present in n=10 patients (28%), while multifocal HCC was identified in only one patient (3%). The mean size of the hepatic nodules was 4±2 cm. About laboratory findings, the mean level of serum albumin was 4±0.5 g/dL, and the mean ALT and AST levels were 38±61 U/L and 48±44 U/L, respectively. ALP averaged 114±54 U/L, and GGT 88±86 U/L. AFP levels showed a high degree of variability, with a mean of 232±1356 ng/mL. Coagulation parameters showed a mean PT of 14±3 seconds, aPTT of 36±10 seconds, and INR of 1.3±0.4. Mean platelet count was 125±66×10³/μL. Serum creatinine averaged 1±0.3 mg/dL. Electrolyte levels were within normal ranges, with mean potassium and sodium levels of 4±0.5 mmol/L and 138±4 mmol/L, respectively. Mean total bilirubin was 1.4±0.9 mg/dL, and direct bilirubin was 0.7±0.5 mg/dL. Inflammatory and metabolic biomarkers showed mean leukocyte, neutrophil, and lymphocyte counts of 5±2, 3±1.5, and 1±0.5×10⁹/L, respectively. Mean glycemia was 120±42 mg/dL, triglycerides 109±64 mg/dL, total cholesterol 132±38 mg/dL, HDL 42±17 mg/dL, and LDL 76±32 mg/dL. Regarding liver disease severity scores, n=12 patients (33%) were classified as Child–Pugh class A, n=21 (58%) as class B, and n=3 (8%) as class C. The mean MELD and MELD-Na scores were 12±4 and 11±6, respectively. Finally, the mean liver volume was 1500±335 cm³, the mean spleen volume was 685±437 cm³, the liver right lobe diameter averaged 15±1.5 cm, and the spleen diameter was 14±3 cm. In this way, the LSVR was 0.5±0.3, and the LVCA was 2±1.
Subsequently, we have stratified the enrolled patients in two different groups based on the presence of LC or HCC (see Table 2). The mean age was comparable between the LC and HCC groups (63±12 vs. 61±10 years; p=0.535), with a similar proportion of male patients (n=18, 72% vs. n=7, 64%; p=0.209). Alcohol-related liver disease was the most prevalent etiology in both groups (n=12, 48% in LC vs. n=5, 45% in HCC; p=0.888), but a significantly higher prevalence of HBV-related cirrhosis was observed in the HCC group (n=3, 26% vs. n=1, 4%; p=0.041), while other etiologies such as autoimmune, cryptogenic, dysmetabolic, and HCV-related disease did not significantly differ between groups. Although complications were highly prevalent in both groups (n=22, 88% in LC vs. n=11, 100% in HCC; p=0.230), the number of complications tended to be higher among patients with HCC (3±1 vs. 2±1; p=0.068). Notably, esophageal and gastric varices were significantly more common in the HCC group (n=4, 36% vs. n=1, 4%; p=0.010). Specifically, grade F2 esophageal varices (n=5, 45% vs. n=2, 8%; p=0.009) and gastric varices (n=3, 27% vs. n=1, 4%; p=0.041) were more frequent in the HCC group. Other complications such as ascites, hepatic encephalopathy, portal vein thrombosis, and splenomegaly were not significantly different between groups. Regarding laboratory measurements, AFP levels were significantly elevated in the HCC group (750±2452 ng/mL vs. 4±3 ng/mL; p=0.013). Although most liver function parameters, including transaminases, bilirubin, and coagulation profiles, were similar between groups, platelet counts were lower in the HCC group (91±40 vs. 140±71×10³/μL; p=0.054), approaching statistical significance. Peripheral blood analysis revealed significantly lower lymphocyte (0.9±0.5 vs. 1.3±0.5×10⁹/L; p=0.030), leukocyte (4±1.9 vs. 6±1.6×10⁹/L; p=0.024), and monocyte counts (0.3±0.1 vs. 0.4±0.2×10⁹/L; p=0.026) in HCC patients. Moreover, total cholesterol (113±23 vs. 140±40 mg/dL; p=0.043) and LDL (60±26 vs. 84±32 mg/dL; p=0.035) levels were significantly lower in the HCC group. No significant differences were observed in Child–Pugh classification (p=0.435), MELD score (13±4 vs. 11±4; p=0.204), or MELD Na score (13±5 vs. 10±6; p=0.133) among the two different groups evaluated. CT-based imaging metrics revealed significant differences between groups. Specifically, spleen volume (1088±552 vs. 507±211 cm³; p<0.001) and spleen diameter (17±3 vs. 12±2 cm; p<0.001) were significantly higher in HCC patients. In this regard, the LSVR was significantly elevated in the HCC group (0.7±0.3 vs. 0.4±0.2; p<0.001), as was the LVCA (3±0.8 vs. 1.3±0.5; p<0.001).
Conditional tree model suggested an association between HCC and both the LVCA and LSVR, as reported in Figure 2.
Logistic regression analysis was performed to evaluate predictors of HCC. In the full model including LSVR, LVCA, gender, and age, only LVCA was significantly associated with HCC (OR=3.19, p=0.018). Stepwise model selection based on AIC identified a reduced model including only LSVR and LVCA. In this final model, LVCA remained a significant predictor (OR=2.88, p=0.0075), while LSVR showed a non-significant trend (OR=3.72, p=0.161). The model showed good calibration, with a residual deviance of 16.24 and an AIC of 22.24. The predicted probability of HCC derived from the final logistic model yielded an AUC of 0.967 (95% CI: 0.920–1.000) using LSVR+LVCA. The individual predictors also showed good diagnostic accuracy: AUC=0.942 (95% CI: 0.878–1.000) for LVCA and AUC=0.818 (95% CI: 0.668–0.968) for LSVR. Using the optimal cut-off (LSVR+LVCA > 0.221), the model achieved a sensitivity of 91% and specificity of 88%, as reported in Figure 3.
The association between predicted classification and actual HCC status was statistically significant, according to Fisher’s exact test (p=1.1×10⁻⁵, OR=59.03, 95% CI: 5.65–3229.82). Finally, comparison of AUCs using DeLong’s test showed that the combined model significantly outperformed LSVR alone (95% CI: -0.283 – -0.014; p=0.030), while the difference with LVCA alone was not statistically significant (95% CI: -0.059–0.008; p=0.146).
4. Discussion
HCC is the most common primary liver cancer and a leading cause of cancer-related mortality worldwide. Its burden continues to rise, particularly in patients with underlying cirrhosis from viral hepatitis, alcohol use, or metabolic liver disease [1,3]. HCC pathogenesis involves chronic hepatic inflammation, progressive fibrosis, and cirrhosis, culminating in genomic instability and hepatocarcinogenesis [27]. Early diagnosis of HCC is crucial, as it significantly improves patient management and long-term survival, particularly in patients identified at an early stage through surveillance programs [28]. In the present pilot study, we evaluated clinical, biochemical, and radiological parameters in patients with LC and HCC to identify potential predictors of malignancy in the cirrhotic population. The most prevalent etiology of LC was alcohol-related liver disease, followed by dysmetabolic and infective causes, findings that align with existing epidemiological data in European populations [11,29,30]. While most baseline characteristics and complications were similarly distributed between groups, HBV-related LC was significantly more frequent in patients with HCC, consistent with prior evidence highlighting HBV infection as a major risk factor for hepatocarcinogenesis [31]. Although most liver function parameters did not differ significantly, AFP levels were significantly elevated in the HCC group, supporting its utility as a traditional biomarker of HCC despite its known limitations in sensitivity and specificity [32]. Notably, inflammatory cell counts, including lymphocytes, leukocytes, and monocytes, were significantly lower in patients with HCC, consistent with an immune evasion phenotype observed in malignancy [33]. Similarly, lower LDL and total cholesterol levels in HCC patients reflect prior findings linking hepatic dysfunction and malignancy to alterations in lipid metabolism [34]. Our analysis provides novel insights into the utility of CT-derived scores, particularly the LSVR and LVCA, to diagnose HCC in a cohort of patients with LC. The LSVR was significantly elevated in patients with HCC compared to those with LC. This finding is consistent with prior studies demonstrating that HCC is often associated with a preserved or even increased liver volume in early to intermediate stages, while spleen enlargement continues to reflect underlying portal hypertension [35]. In this regard, Kwon et al., showed how LSVR can predict hepatic decompensation and transplantation-free survival in patients with HBV-compensated cirrhosis, suggesting its role as potential prognostic score [22]. At the same time, LSVR showed an AUC=0.891 as a predictor of poor native liver prognosis [36]. Regarding its potential association with other complications, this score was independently associated with clinically significant portal hypertension in patients with compensated LC and HCC [37]. LVCA, defined as a semi-quantitative score of parenchymal enhancement during contrast-enhanced CT, was significantly associated with HCC, and demonstrated high discriminative ability in our investigation. This is biologically plausible, as HCC is characterized by neoangiogenesis and arterial hypervascularity, which enhance contrast uptake during the arterial phase [38]. The LVCA score, although relatively simple to calculate, captures these hemodynamic alterations and may serve as a surrogate for tumor-related vascular remodeling. In this context, a recent proof-of-concept study showed that LVCA used in combination with LSVR significantly improved the detection of clinically significant liver fibrosis in a cohort of patients with chronic liver diseases [23]. Importantly, in our study, the combined use of LSVR and LVCA improved the diagnostic performance over either parameter alone, yielding an AUC=0.967 and a sensitivity and specificity of 91% and 88%, respectively, for detecting HCC. Moreover, DeLong’s test confirmed that the combined model significantly outperformed LSVR alone, further reinforcing the added value of vascular imaging metrics. From a clinical point of view, CT imaging is widely accessible and frequently performed in patients with chronic liver disease, especially when MRI is contraindicated [39]. The LSVR and LVCA can be derived retrospectively from routine scans without the need for specialized software, making them feasible for real-world implementation. Their integration into radiological reporting or artificial intelligence-based diagnostic tools could enhance early HCC detection, facilitate risk stratification, and guide decisions regarding surveillance or liver biopsy [40]. In patients with altered levels of LVCA and LSVR, heightened clinical vigilance may be warranted even in the absence of overt radiological lesions. Nonetheless, several limitations warrant consideration. First, the small sample size limits the generalizability of our findings and may have reduced the power to detect additional predictors. Second, external validation in multicenter cohorts and longitudinal studies assessing the temporal evolution of LSVR and LVCA, are necessary to confirm their application in clinical practice.
5. Conclusions
Our pilot study supports the utility of LVCA and LSVR as effective, non-invasive imaging tools for HCC diagnosis. In this context, the final model incorporating both LVCA and LSVR achieved excellent discrimination. The combined model outperformed LSVR alone, though not LVCA alone. For this reason, their use in clinical practice could enhance early tumor detection and complement existing surveillance strategies, especially in resource-limited settings where other advanced imaging modalities may not be readily available.
Author Contributions
Conceptualization, L.A. and D.L.; methodology, G.G.M.S. software, M.L.G. and C.B.; validation, L.A., F.M. and D.L.; formal analysis, G.G.M.S. and M.B.; investigation, M.L.G. and C.B.; resources, F.M.; data curation, G.G.M.S. and M.B.; writing—original draft preparation, G.G.M.S., M.L.G. and C.B.; writing—review and editing, L.A., F.M. and D.L.; visualization, L.A and F.M.; supervision, L.A. and D.L. All authors have read and agreed to the published version of the manuscript.
Funding
This research received no external funding.
Institutional Review Board Statement
The study was conducted in accordance with the Declaration of Helsinki and approved by the Ethics Committee of “Magna Graecia” University of Catanzaro (approval no. 13/31.01.2025).
Informed Consent Statement
Due to the retrospective design of the study, informed consent was not required.
Data Availability Statement
The original contributions presented in the study are included in the article; further inquiries can be directed to the corresponding author.
Conflicts of Interest
The authors declare no conflicts of interest.
Abbreviations
The following abbreviations are used in this manuscript:
| AFP | Alpha-fetoprotein |
| AIC | Akaike Information Criterion |
| ALP | Alkaline Phosphatase |
| ALT | Alanine Aminotransferase |
| aPTT | Activated Partial Thromboplastin Time |
| AST | Aspartate Aminotransferase |
| AUC | Area Under the Curve |
| CI | Confidence Interval |
| CT | Computed Tomography |
| GGT | Gamma-glutamyl Transferase |
| HBV | Hepatitis B Virus |
| HCC | Hepatocellular Carcinoma |
| HCV | Hepatitis C Virus |
| INR | International Normalized Ratio |
| LC | Liver Cirrhosis |
| LDL | Low-Density Lipoprotein |
| LSVR | Liver Segmental Volume Ratio |
| LVCA | Liver Vein to Cava Attenuation |
| MELD | Model for End-Stage Liver Disease |
| MRI | Magnetic Resonance Imaging |
| OR | Odds Ratio |
| PT | Prothrombin Time |
| ROC | Receiver Operating Characteristic |
| SD | Standard Deviation |
References
- Scarlata, G.G.M. , Cicino, C., Spagnuolo, R., Marascio, N., Quirino, A., Matera, G., Dumitrașcu, D.L., Luzza, F., Abenavoli, L. Impact of diet and gut microbiota changes in the development of hepatocellular carcinoma. Hepatoma Res 2024, 10, 19. [Google Scholar]
- Koshy, A. Evolving Global Etiology of Hepatocellular Carcinoma (HCC): Insights and Trends for 2024. J Clin Exp Hepatol 2025, 15, 102406. [Google Scholar] [CrossRef] [PubMed]
- Yang, J.D. , Hainaut, P., Gores, G.J., Amadou, A., Plymoth, A., Roberts, L.R. A global view of hepatocellular carcinoma: trends, risk, prevention and management. Nat Rev Gastroenterol Hepatol 2019, 16, 589–604. [Google Scholar] [CrossRef]
- Phoolchund, A.G.S. , Khakoo, S.I. MASLD and the Development of HCC: Pathogenesis and Therapeutic Challenges. Cancers (Basel) 2024, 16, 259. [Google Scholar] [CrossRef] [PubMed]
- Hu, H. , Zhao, Y., He, C., Qian, L., Huang, P. Ultrasonography of Hepatocellular Carcinoma: From Diagnosis to Prognosis. J Clin Transl Hepatol 2024, 12, 516–524. [Google Scholar] [CrossRef]
- Arif-Tiwari, H. , Kalb, B., Chundru, S., Sharma, P., Costello, J., Guessner, R.W., Martin, D.R. MRI of hepatocellular carcinoma: an update of current practices. Diagn Interv Radiol 2014, 20, 209–21. [Google Scholar] [CrossRef] [PubMed]
- Okada, M.; Aoki, R.; Nakazawa, Y.; Tago, K.; Numata, K. CT and MR Imaging of Hepatocellular Carcinoma and Liver Cirrhosis. Gastroenterol. Insights 2024, 15, 976–997. [Google Scholar] [CrossRef]
- Samban, S.S. , Hari, A., Nair, B., Kumar, A.R., Meyer, B.S., Valsan, A., Vijayakurup, V., Nath, L.R. An Insight Into the Role of Alpha-Fetoprotein (AFP) in the Development and Progression of Hepatocellular Carcinoma. Mol Biotechnol 2024, 66, 2697–2709. [Google Scholar] [CrossRef]
- Liu, Y. , Jiang, W., Li, X., Zhao, H., Wang, S. The Diagnostic Performance of AFP, AFP-L3, DCP, CA199, and Their Combination for Primary Liver Cancer. J Hepatocell Carcinoma 2025, 12, 513–526. [Google Scholar] [CrossRef]
- Schlosser, S. , Tümen, D., Volz, B., Neumeyer, K., Egler, N., Kunst, C., Tews, H.C., Schmid, S., Kandulski, A., Müller, M., et al. HCC biomarkers - state of the old and outlook to future promising biomarkers and their potential in everyday clinical practice. Front Oncol 2022, 12, 1016952. [Google Scholar] [CrossRef]
- Scarlata, G.G.M. , Ismaiel, A., Gambardella, M.L., Leucuta, D.C., Luzza, F., Dumitrascu, D.L., Abenavoli, L. Use of Non-Invasive Biomarkers and Clinical Scores to Predict the Complications of Liver Cirrhosis: A Bicentric Experience. Medicina (Kaunas) 2024, 60, 1854. [Google Scholar] [CrossRef] [PubMed]
- Ismaiel, A.; Katell, E.; Leucuta, D.C.; Popa, S.L.; Catana, C.S.; Dumitrascu, D.L.; Surdea-Blaga, T. The Impact of Non-Invasive Scores and Hemogram-Derived Ratios in Differentiating Chronic Liver Disease from Cirrhosis. J. Clin. Med 2025, 14, 3072. [Google Scholar] [CrossRef]
- Wang, W. , Wei, C. Advances in the early diagnosis of hepatocellular carcinoma. Genes Dis 2020, 7, 308–319. [Google Scholar] [CrossRef] [PubMed]
- Hwang, S.H. , Hong, S.B., Han, K., Seo, N., Choi, J.Y., Lee, J.H., Park, S., Lim, Y.S., Kim, D.Y., Kim, S.Y., et al. A New Reporting System for Diagnosis of Hepatocellular Carcinoma in Chronic Hepatitis B With Clinical and Gadoxetic Acid-Enhanced MRI Features. J Magn Reson Imaging 2022, 55, 1877–1886. [Google Scholar] [CrossRef]
- Yoshiji, H. , Nagoshi S., Akahane T., Asaoka Y., Ueno Y., Ogawa K., Kawaguchi T., Kurosaki M., Sakaida I., Shimizu M., et al. Evidence-based clinical practice guidelines for Liver Cirrhosis 2020. J. Gastroenterol 2021, 56, 593–619. [Google Scholar] [CrossRef]
- European Association for the Study of the Liver. EASL Clinical Practice Guidelines on the management of hepatocellular carcinoma. J Hepatol 2025, 82, 315–374. [Google Scholar] [CrossRef]
- De Franchis, R. , Bosch, J., Garcia-Tsao G., Reiberger T., Ripoll C., Abraldes J.G., Albillos A., Baiges A., Bajaj J., Bañares R., et al. Baveno VII—Renewing consensus in portal hypertension. J. Hepatol 2022, 76, 959–974. [Google Scholar] [CrossRef] [PubMed]
- Tajiri, T. , Yoshida, H., Obara, K., Onji, M., Kage, M., Kitano, S., Kokudo, N., Kokubu, S., Sakaida, I., Sata M., et al. General Rules for Recording Endoscopic Findings of Esophagogastric Varices. 2nd ed. Volume 22. Wiley; Hoboken, NJ, USA: 2010. pp. 1–9.
- Villa, E. , Bianchini M., Blasi A., Denys A., Giannini E.G., de Gottardi A., Lisman T., de Raucourt E., Ripoll C., Rautou P.E. EASL Clinical Practice Guidelines on prevention and management of bleeding and thrombosis in patients with cirrhosis. J. Hepatol 2022, 76, 1151–1184. [Google Scholar] [CrossRef]
- Reig, M. , Forner, A., Rimola, J., Ferrer-Fàbrega, J., Burrel, M., Garcia-Criado, Á., Kelley, R.K., Galle, P.R., Mazzaferro, V., Salem, R., et al. BCLC strategy for prognosis prediction and treatment recommendation: The 2022 update. J Hepatol 2022, 76, 681–693. [Google Scholar] [CrossRef]
- Peng, Y. , Qi X., Guo X. Child-Pugh Versus MELD Score for the Assessment of Prognosis in Liver Cirrhosis: A Systematic Review and Meta-Analysis of Observational Studies. Medicine 2016, 95, e2877. [Google Scholar] [CrossRef]
- Kwon JH, Lee SS, Yoon JS, Suk HI, Sung YS, Kim HS, Lee CM, Kim KM, Lee SJ, Kim SY. Liver-to-Spleen Volume Ratio Automatically Measured on CT Predicts Decompensation in Patients with B Viral Compensated Cirrhosis. Korean J Radiol 2021, 22, 1985–1995. [CrossRef] [PubMed]
- Obmann VC, Marx C, Hrycyk J, Berzigotti A, Ebner L, Mertineit N, Gräni C, Heverhagen JT, Christe A, Huber AT. Liver segmental volume and attenuation ratio (LSVAR) on portal venous CT scans improves the detection of clinically significant liver fibrosis compared to liver segmental volume ratio (LSVR). Abdom Radiol (NY) 2021, 46, 1912–1921.
- Hothorn, T. , Hornik, K, Zeileis, A. Unbiased recursive partitioning: A conditional inference framework. Journal of Computational and Graphical Statistics. 2006, 15, 651–674. [Google Scholar] [CrossRef]
- Hothorn, T. , Hornik, K., Strobl, C., Zeileis, A. party: A Laboratory for Recursive Partytioning. R package version 1.3-13; 2023. Available from: https://CRAN.R-project.org/package=party.
- R Core Team. R: A language and environment for statistical computing. R Foundation for Statistical Computing, Vienna, Austria; 2024. Available from: https://www.R-project.org/.
- Scarpellini, E. , Scarlata, G.G.M., Santori, V., Scarcella, M., Kobyliak, N., Abenavoli, L. Gut Microbiota, Deranged Immunity, and Hepatocellular Carcinoma. Biomedicines 2024, 12, 1797. [Google Scholar] [CrossRef] [PubMed]
- Wang, W. , Wei, C. Advances in the early diagnosis of hepatocellular carcinoma. Genes Dis 2020, 7, 308–319. [Google Scholar] [CrossRef]
- Asrani, S.K. , Devarbhavi, H., Eaton, J., Kamath, P.S. Burden of liver diseases in the world. J Hepatol 2019, 70, 151–171. [Google Scholar] [CrossRef]
- Younossi, Z.M. , Koenig, A.B., Abdelatif, D., Fazel, Y., Henry, L., Wymer, M. Global epidemiology of nonalcoholic fatty liver disease-Meta-analytic assessment of prevalence, incidence, and outcomes. Hepatology 2016, 64, 73–84. [Google Scholar] [CrossRef]
- Tan, Y.J. Hepatitis B virus infection and the risk of hepatocellular carcinoma. World J Gastroenterol 2011, 17, 4853. [Google Scholar] [CrossRef]
- Attia, A.M. , Rezaee-Zavareh, M.S., Hwang, S.Y., Kim, N., Adetyan, H., Yalda, T., Chen, P.J., Koltsova, E.K., Yang, J.D. Novel Biomarkers for Early Detection of Hepatocellular Carcinoma. Diagnostics (Basel) 2024, 14, 2278. [Google Scholar] [CrossRef]
- Oura, K.; Morishita, A.; Tani, J.; Masaki, T. Tumor Immune Microenvironment and Immunosuppressive Therapy in Hepatocellular Carcinoma: A Review. Int. J. Mol. Sci 2021, 22, 5801. [Google Scholar] [CrossRef]
- Pan, G.Q. , Jiao, Y., Meng, G.X., Dong, Z.R., Li, T. The relationship between the serum lipid profile and hepatocellular carcinoma in east Asian population: A mendelian randomization study. Heliyon 2023, 9, e17126. [Google Scholar] [CrossRef] [PubMed]
- Fang, T. , Long, G., Mi, X., Su, W., Mo, L., Zhou, L. Splenic Volume, an Easy-To-Use Predictor of HCC Late Recurrence for HCC Patients After Hepatectomy. Front Oncol 2022, 12, 876668. [Google Scholar] [CrossRef]
- Takase, K. , Ueno, T., Matsuki, K., Todo, M., Iwasaki, S., Deguchi, K., Masahata, K., Nomura, M., Watanabe, M., Kamiyama, M., et al. Liver-Spleen Volume Ratio as a Predictor of Native Liver Survival in Patients with Biliary Atresia. Transplant Proc 2023, 55, 872–877. [Google Scholar] [CrossRef] [PubMed]
- Romero-Cristóbal, M. , Clemente-Sánchez, A., Ramón, E., Téllez, L., Canales, E., Ortega-Lobete, O., Velilla-Aparicio, E., Catalina, M.V., Ibáñez-Samaniego, L., Alonso, S., et al. CT-derived liver and spleen volume accurately diagnose clinically significant portal hypertension in patients with hepatocellular carcinoma. JHEP Rep 2022, 5, 100645. [Google Scholar] [PubMed]
- Shah, S. , Shukla, A., Paunipagar, B. Radiological features of hepatocellular carcinoma. J Clin Exp Hepatol 2014, 4, S63–6. [Google Scholar] [CrossRef]
- Watson, R.E. , Yu, L. Safety Considerations in MRI and CT. Continuum (Minneap Minn) 2023, 29, 27–53. [Google Scholar]
- Najjar, R. Redefining Radiology: A Review of Artificial Intelligence Integration in Medical Imaging. Diagnostics (Basel) 2023, 13, 2760. [Google Scholar] [CrossRef]
Figure 1.
Representation of 3D slicer segmentation of liver and spleen parenchyma in axial view, sagittal view, and coronal view. Green is the color of the liver, and orange is the color of the spleen. Under the visual segmentation, there is the analysis of images using the extension “Segment statistics” and the volume values (cm3).
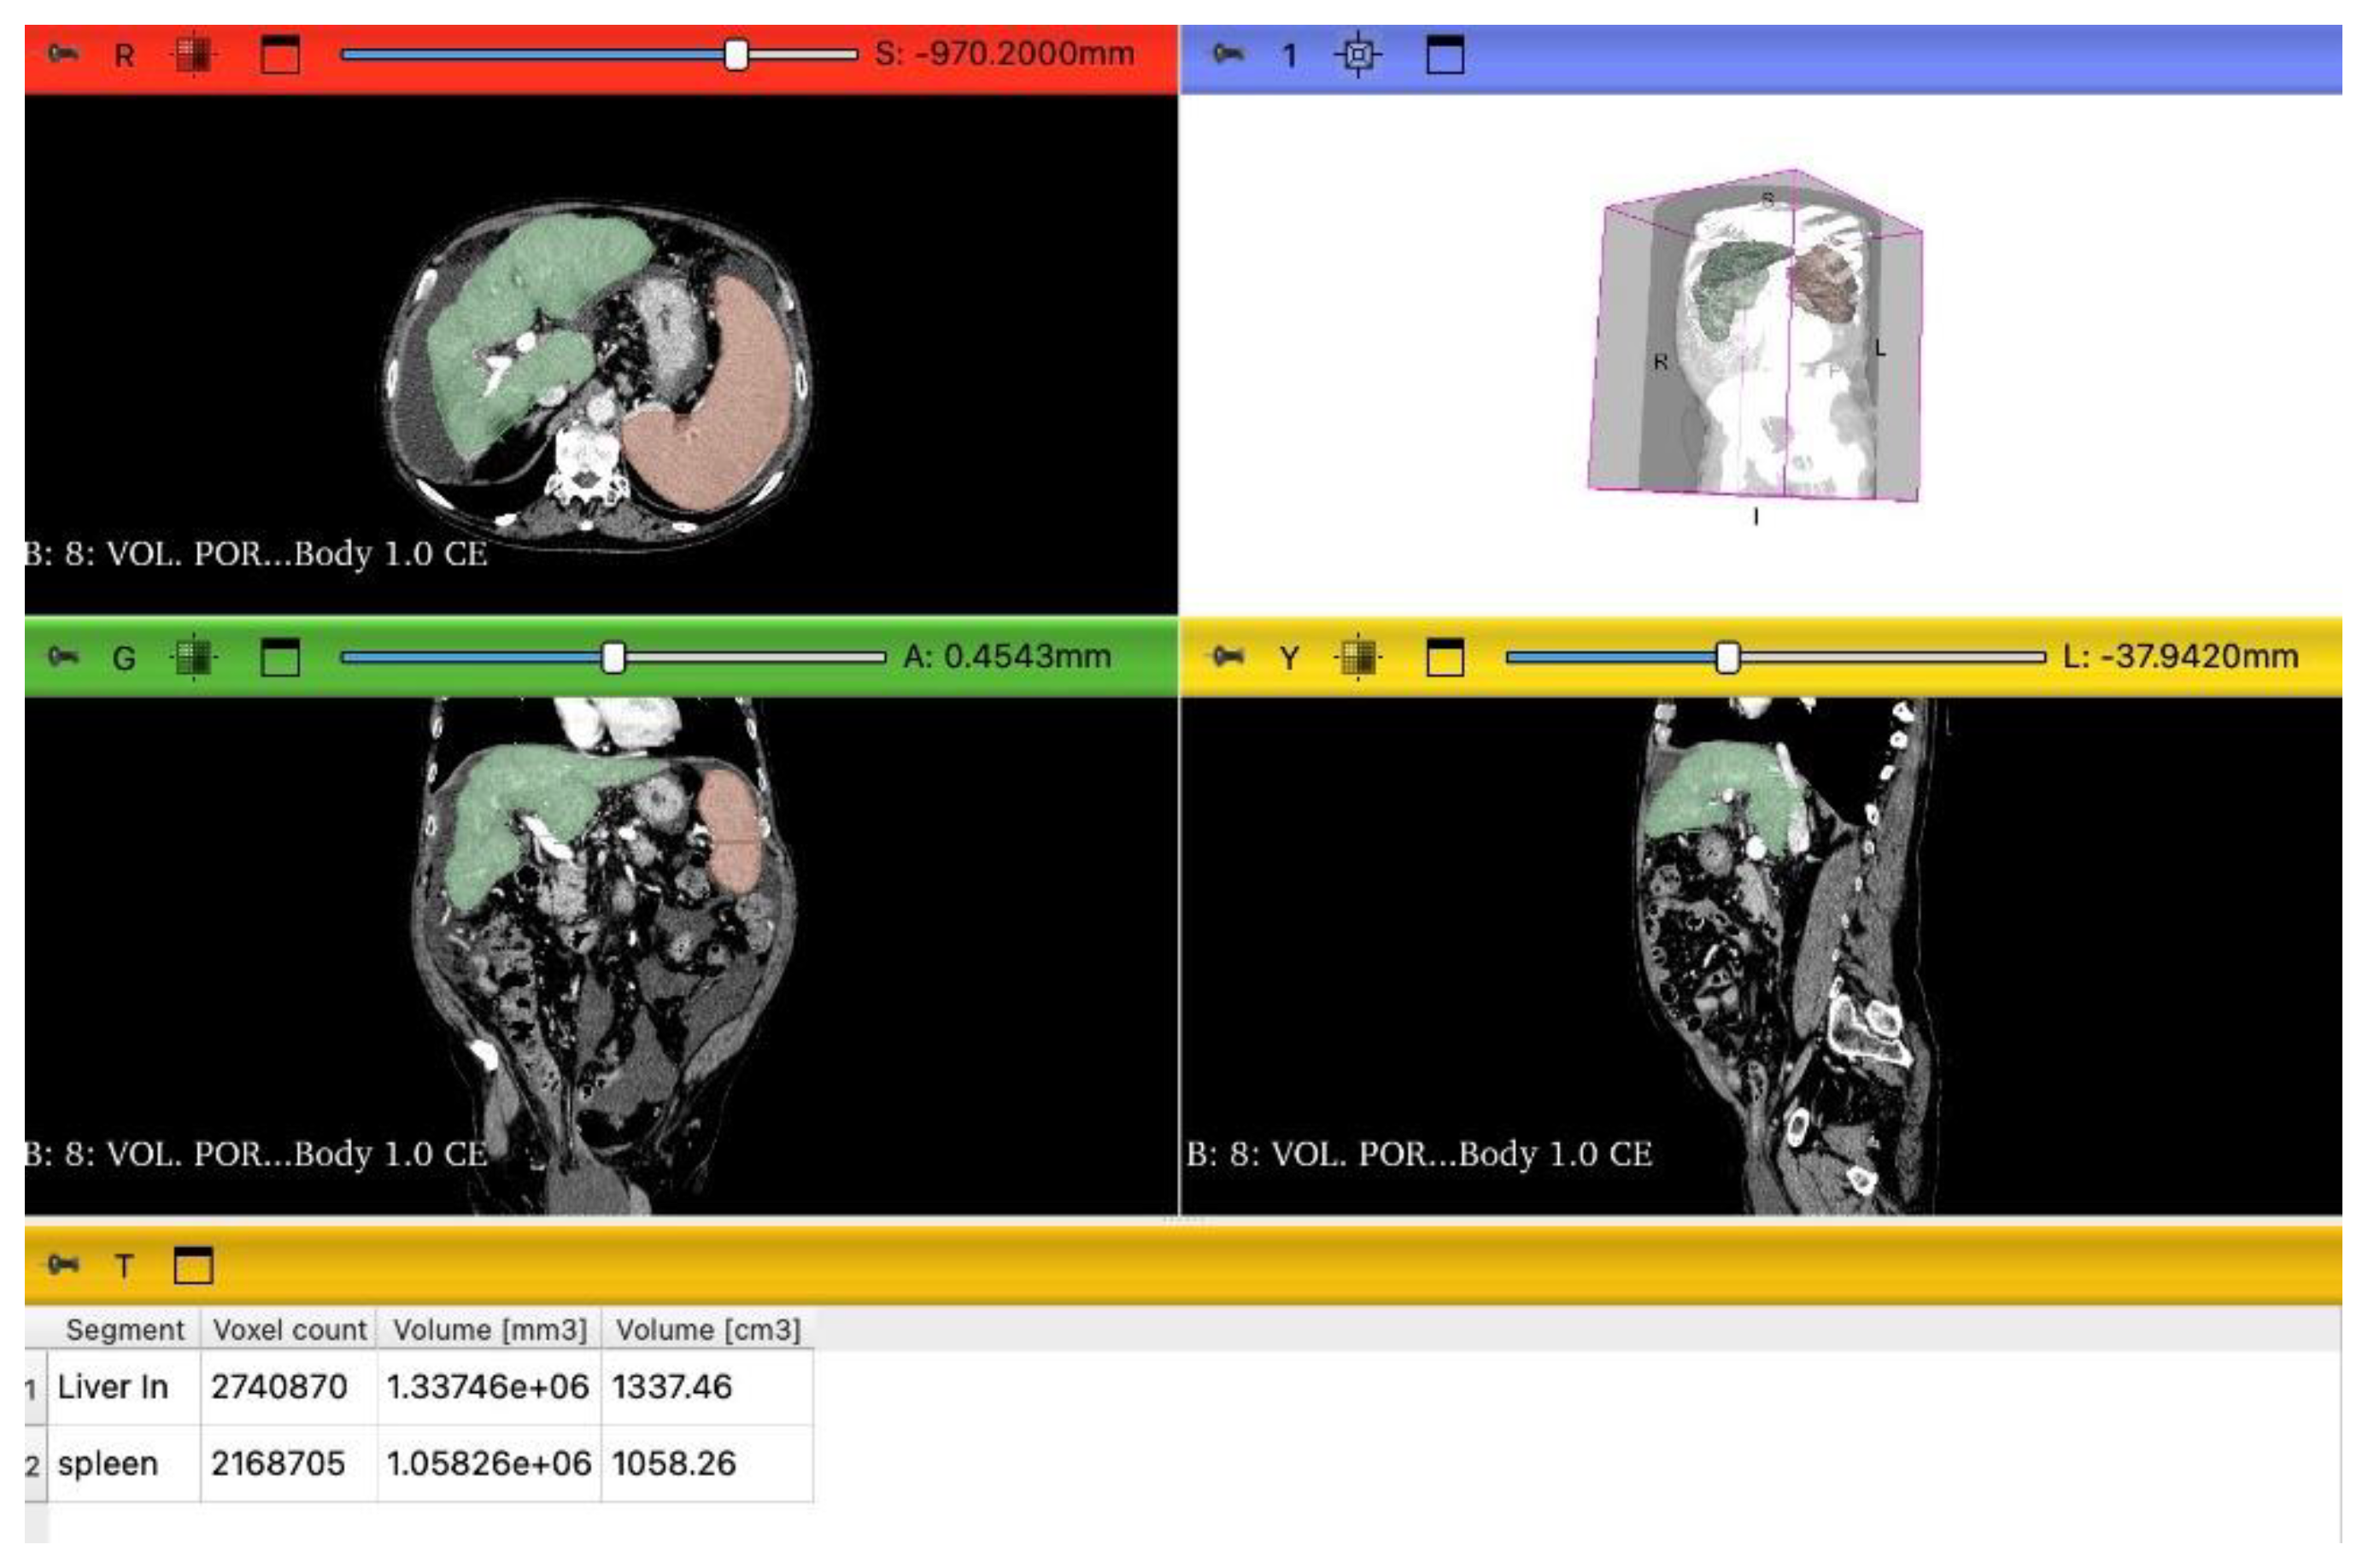
Figure 2.
Representation of the conditional tree model.
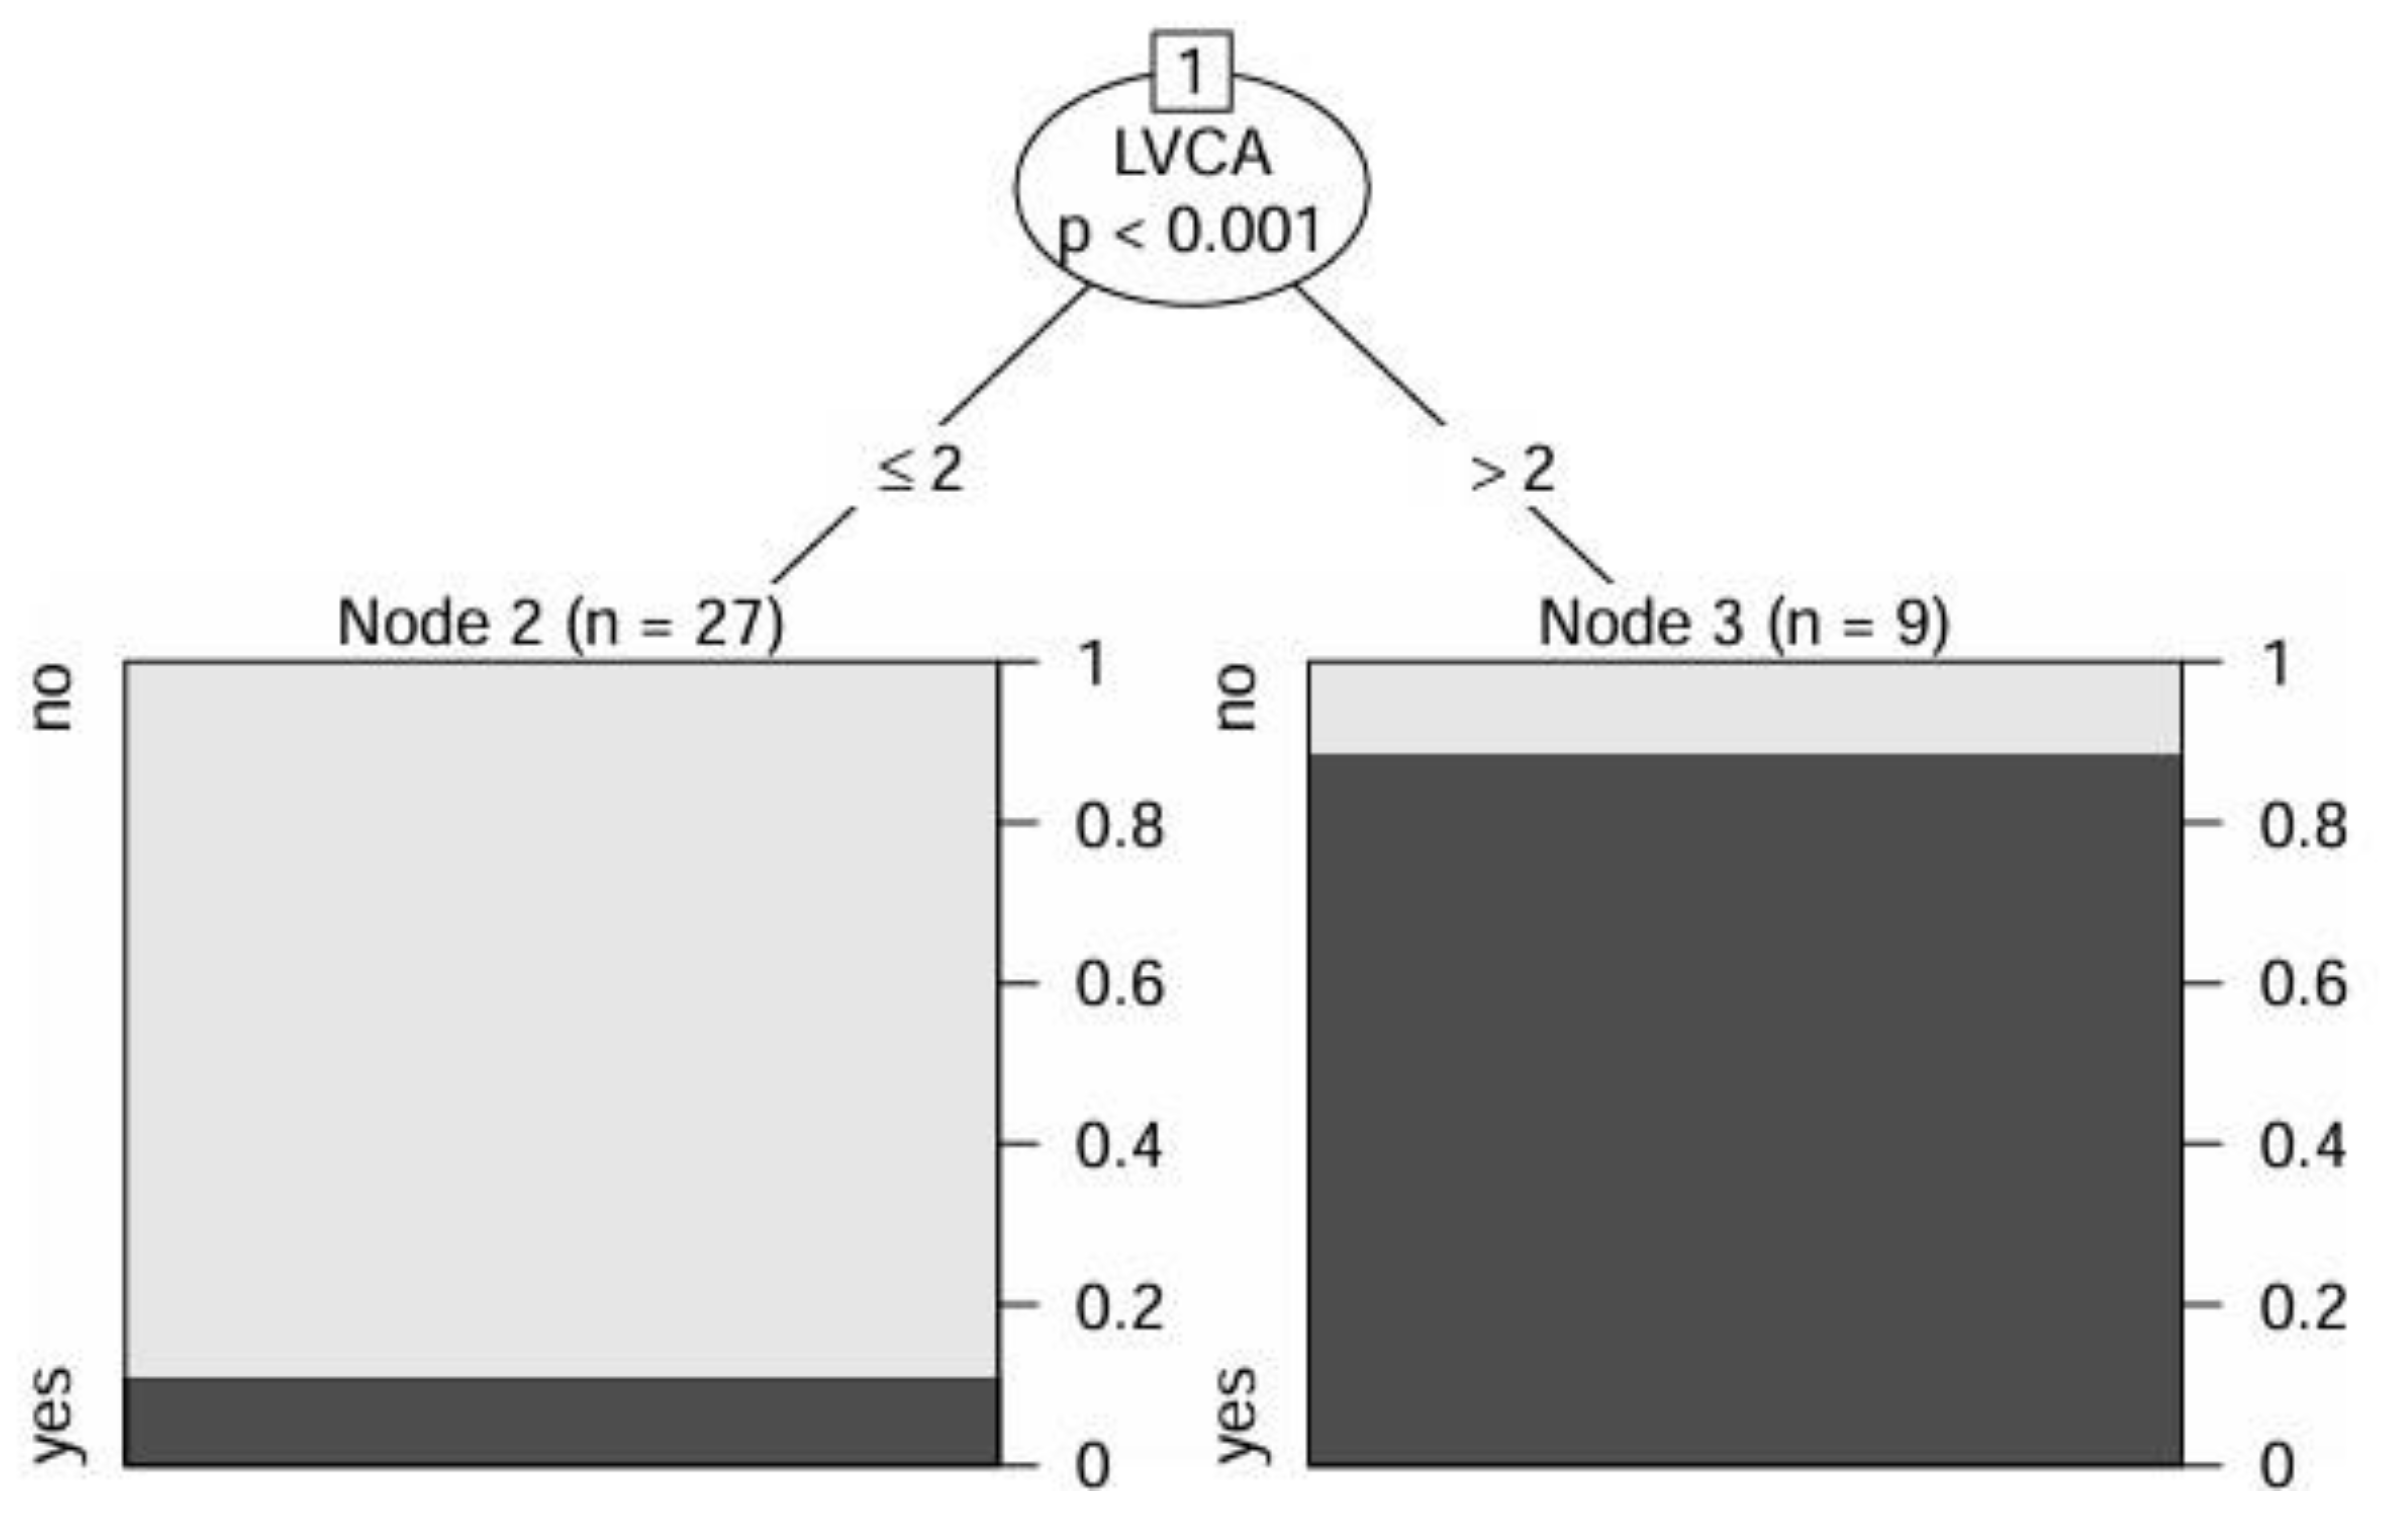
Figure 3.
Representation of ROC analysis regarding LSVR, LVCA, and LSVR+LVCA.
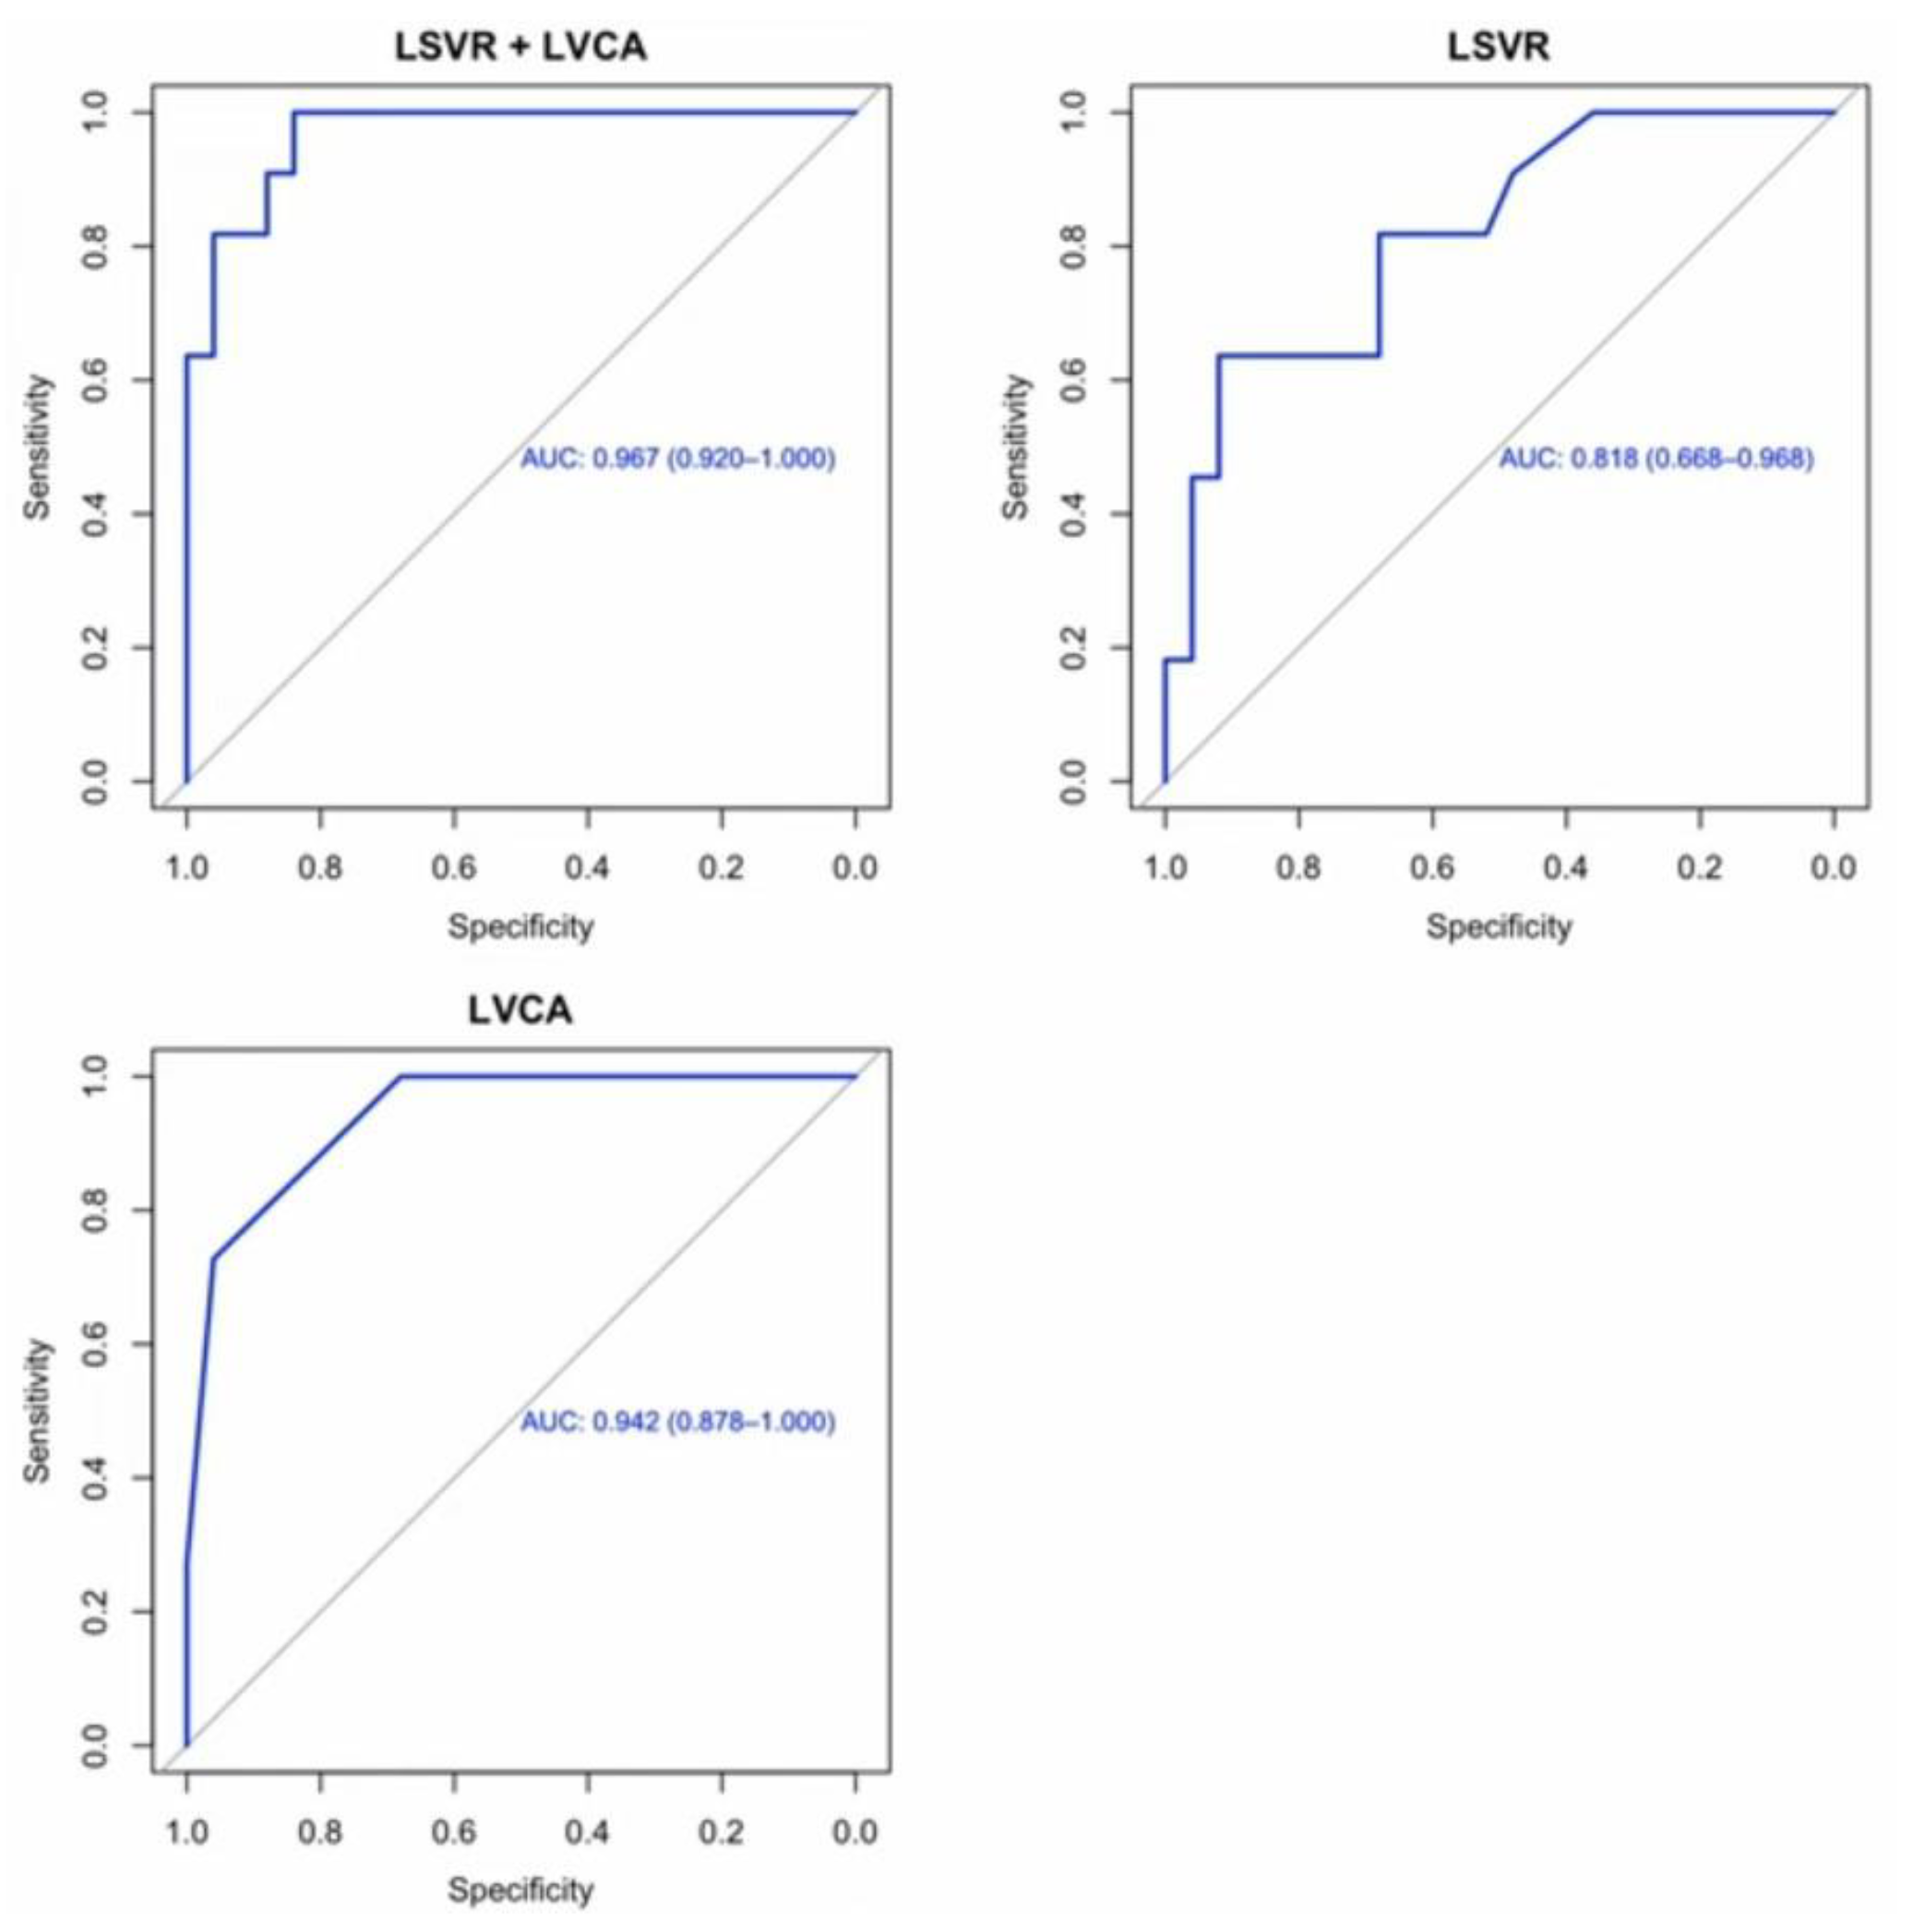

Table 1.
Baseline characteristics of the patients studied.
| LC+HCC (n=36) |
|
|---|---|
| Demographic data | |
| Age (years), mean±SD | 62±11 |
| Male gender, n (%) | 28 (78) |
| Clinical data, n (%) | |
| Alcoholic | 17 (47) |
| Autoimmune | 1 (3) |
| Cryptogenic | 3 (8) |
| Dysmetabolic | 8 (22) |
| Infective | 8 (22) |
| HBV-related | 4 (11) |
| HCV-related | 4 (11) |
| Mixed | 1 (3) |
| Presence of complications | 33 (92) |
| Number of complications (mean±SD) | 2±1 |
| Ascites | 26 (72) |
| Hepatic encephalopathy | 19 (53) |
| Esophageal and gastric varices | 5 (14) |
| Esophageal varices F1 | 12 (33) |
| Esophageal varices F2 | 7 (19) |
| Esophageal varices F3 | 1 (3) |
| Gastric varices | 4 (11) |
| Hepato-renal syndrome | 5 (14) |
| Portal hypertensive gastropathy | 17 (47) |
| Portal vein ectasia | 4 (11) |
| Portal vein thrombosis | 3 (8) |
| Splenomegaly | 22 (61) |
| Monofocal HCC | 10 (28) |
| Multifocal HCC | 1 (3) |
| Size of the nodules (cm), mean±SD | 4±2 |
| Laboratory parameters and scores, mean±SD | |
| Albumin (g/dL) | 4±0.5 |
| ALP (UI/L) | 114±54 |
| AST (UI/L) | 48±44 |
| ALT (UI/L) | 38±61 |
| GGT (UI/L) | 88±86 |
| AFP (ng/mL) | 232±1356 |
| Platelets (103/μL) | 125±66 |
| PT (s) | 14±3 |
| aPTT (s) | 36±10 |
| INR | 1.3±0.4 |
| Fibrinogen (mg/dL) | 269±95 |
| Creatinine (mg/dL) | 1±0.3 |
| Potassium (mmol/L) | 4±0.5 |
| Sodium (mmol/L) | 138±4 |
| Total bilirubin (mg/dL) | 1.4±0.9 |
| Direct bilirubin (mg/dL) | 0.7±0.5 |
| Neutrophils (109/L) | 3±1.5 |
| Lymphocytes (109/L) | 1±0.5 |
| Leucocytes (109/L) | 5±2 |
| Monocytes (109/L) | 0.4±0.2 |
| Basophils (109/L) | 0.02±0.01 |
| Triglycerides (mg/dL) | 109±64 |
| Glycemia (mg/dL) | 120±42 |
| Total cholesterol (mg/dL) | 132±38 |
| HDL (mg/dL) | 42±17 |
| LDL (mg/dL) | 76±32 |
| Child-Pugh A, n (%) | 12 (33) |
| Child-Pugh B, n (%) | 21 (58) |
| Child-Pugh C, n (%) | 3 (8) |
| MELD score, | 12±4 |
| MELD Na | 11±6 |
| Liver volume (cm3) | 1500±335 |
| Spleen volume (cm3) | 685±437 |
| LSVR | 0.5±0.3 |
| Liver right lobe diameter (cm) | 15±1.5 |
| Spleen diameter (cm) | 14±3 |
| LVCA | 2±1 |
Abbreviations: LC, liver cirrhosis; HCC, hepatocellular carcinoma; HBV, Hepatitis B virus; HCV, Hepatitis C virus; ALP, alkaline phosphatase; AST, aspartate aminotransferase; ALT, alanine aminotransferase; GGT, γ-glutamyl transferase; AFP, alpha-fetoprotein; PT, prothrombin time; aPTT, activated partial thromboplastin time; INR, international normalized ratio; MELD, Model for End-Stage Liver Disease; LSVR, liver segmental volume ratio; LVCA, liver vein to cava attenuation.
Table 2.
Comparisons of patients’ characteristics based on the diagnosis of LC or HCC.
| LC (n=25) |
HCC (n=11) |
p-value | |
|---|---|---|---|
| Demographic data | |||
| Age (years), mean±SD | 63±12 | 61±10 | 0.535 |
| Male gender, n (%) | 18 (72) | 7 (64) | 0.209 |
| Clinical data, n (%) | |||
| Alcoholic | 12 (48) | 5 (45) | 0.888 |
| Autoimmune | 1 (4) | 0 | 0.501 |
| Cryptogenic | 2 (8) | 1 (9) | 0.913 |
| Dysmetabolic | 7 (28) | 1 (9) | 0.209 |
| Infective | 4 (16) | 4 (36) | 0.176 |
| HBV-related | 1 (4) | 3 (26) | 0.041 |
| HCV-related | 3 (12) | 1 (9) | 0.798 |
| Mixed | 1 (4) | 0 | 0.501 |
| Presence of complications | 22 (88) | 11 (100) | 0.230 |
| Number of complications (mean±SD) | 2±1 | 3±1 | 0.068 |
| Ascites | 17 (68) | 9 (81) | 0.394 |
| Hepatic encephalopathy | 13 (52) | 6 (54) | 0.888 |
| Esophageal and gastric varices | 1 (4) | 4 (36) | 0.010 |
| Esophageal varices F1 | 10 (40) | 2 (18) | 0.201 |
| Esophageal varices F2 | 2 (8) | 5 (45) | 0.009 |
| Esophageal varices F3 | 1 (4) | 0 | 0.501 |
| Gastric varices | 1 (4) | 3 (27) | 0.041 |
| Hepato-renal syndrome | 3 (12) | 2 (18) | 0.621 |
| Portal hypertensive gastropathy | 11 (44) | 6 (54) | 0.559 |
| Portal vein ectasia | 8 (32) | 4 (36) | 0.798 |
| Portal vein thrombosis | 1 (4) | 2 (18) | 0.156 |
| Splenomegaly | 16 (64) | 6 (54) | 0.592 |
| Laboratory parameters and scores), mean±SD | |||
| Albumin (g/dL) | 3.8±0.4 | 3.6±0.7 | 0.239 |
| ALP (UI/L) | 111±59 | 121±41 | 0.611 |
| AST (UI/L) | 48±51 | 47±23 | 0.372 |
| ALT (UI/L) | 42±73 | 29±16 | 0.986 |
| GGT (UI/L) | 87±97 | 90±61 | 0.410 |
| AFP (ng/mL) | 4±3 | 750±2452 | 0.013 |
| Platelets (103/μL) | 140±71 | 91±40 | 0.054 |
| PT (s) | 14±3 | 15±3 | 0.249 |
| aPTT (s) | 35±9 | 38±11 | 0.352 |
| INR | 1.3±0.5 | 1.4±0.2 | 0.126 |
| Fibrinogen (mg/dL) | 282±98 | 238±85 | 0.223 |
| Creatinine (mg/dL) | 0.9±0.3 | 1±0.4 | 0.409 |
| Potassium (mmol/L) | 4±0.6 | 4±05 | 0.334 |
| Sodium (mmol/L) | 138±4 | 137±3 | 0.277 |
| Total bilirubin (mg/dL) | 1.4±1 | 1.5±1 | 0.503 |
| Direct bilirubin (mg/dL) | 0.6±0.5 | 0.7±0.4 | 0.488 |
| Neutrophils (109/L) | 4±1.3 | 3±1.8 | 0.106 |
| Lymphocytes (109/L) | 1.3±0.5 | 0.9±0.5 | 0.030 |
| Leucocytes (109/L) | 6±1.6 | 4±1.9 | 0.024 |
| Monocytes (109/L) | 0.4±0.2 | 0.3±0.1 | 0.026 |
| Basophils (109/L) | 0.02±0.01 | 0.01±0.01 | 0.165 |
| Triglycerides (mg/dL) | 121±74 | 83±21 | 0.057 |
| Glycemia (mg/dL) | 113±29 | 134±62 | 0.594 |
| Total cholesterol (mg/dL) | 140±40 | 113±23 | 0.043 |
| HDL (mg/dL) | 44±18 | 38±17 | 0.341 |
| LDL (mg/dL) | 84±32 | 60±26 | 0.035 |
| Child-Pugh A, n (%) | 10 (40) | 2 (18) | 0.435 |
| Child-Pugh B, n (%) | 13 (52) | 8 (72) | |
| Child-Pugh C, n (%) | 2 (8) | 1 (9) | |
| MELD score, | 11±4 | 13±4 | 0.204 |
| MELD Na | 10±6 | 13±5 | 0.133 |
| Liver volume (cm3) | 1461±337 | 1585±328 | 0.314 |
| Spleen volume (cm3) | 507±211 | 1088±552 | <0.001 |
| LSVR | 0.4±0.2 | 0.7±0.3 | <0.001 |
| Liver right lobe diameter (cm) | 15±1.5 | 15±1.5 | 0.694 |
| Spleen diameter (cm) | 12±2 | 17±3 | <0.001 |
| LVCA | 1.3±0.5 | 3±0.8 | <0.001 |
Abbreviations: LC, liver cirrhosis; HCC, hepatocellular carcinoma; HBV, Hepatitis B virus; HCV, Hepatitis C virus; ALP, alkaline phosphatase; AST, aspartate aminotransferase; ALT, alanine aminotransferase; GGT, γ-glutamyl transferase; AFP, alpha-fetoprotein; PT, prothrombin time; aPTT, activated partial thromboplastin time; INR, international normalized ratio; MELD, Model for End-Stage Liver Disease; LSVR, liver segmental volume ratio; LVCA, liver vein to cava attenuation.
Disclaimer/Publisher’s Note: The statements, opinions and data contained in all publications are solely those of the individual author(s) and contributor(s) and not of MDPI and/or the editor(s). MDPI and/or the editor(s) disclaim responsibility for any injury to people or property resulting from any ideas, methods, instructions or products referred to in the content. |
© 2025 by the authors. Licensee MDPI, Basel, Switzerland. This article is an open access article distributed under the terms and conditions of the Creative Commons Attribution (CC BY) license (http://creativecommons.org/licenses/by/4.0/).
Copyright: This open access article is published under a Creative Commons CC BY 4.0 license, which permit the free download, distribution, and reuse, provided that the author and preprint are cited in any reuse.


